Levelland, TX Map & Demographics
Levelland Map
Levelland Overview
$26,931
PER CAPITA INCOME
$61,135
AVG FAMILY INCOME
$50,707
AVG HOUSEHOLD INCOME
39.4%
WAGE / INCOME GAP [ % ]
60.6¢/ $1
WAGE / INCOME GAP [ $ ]
$10,513
FAMILY INCOME DEFICIT
0.44
INEQUALITY / GINI INDEX
12,607
TOTAL POPULATION
6,262
MALE POPULATION
6,345
FEMALE POPULATION
98.69
MALES / 100 FEMALES
101.33
FEMALES / 100 MALES
33.0
MEDIAN AGE
3.1
AVG FAMILY SIZE
2.6
AVG HOUSEHOLD SIZE
6,098
LABOR FORCE [ PEOPLE ]
63.1%
PERCENT IN LABOR FORCE
5.9%
UNEMPLOYMENT RATE
Levelland Zip Codes
Levelland Area Codes
Income in Levelland
Income Overview in Levelland
Per Capita Income in Levelland is $26,931, while median incomes of families and households are $61,135 and $50,707 respectively.
| Characteristic | Number | Measure |
| Per Capita Income | 12,607 | $26,931 |
| Median Family Income | 3,220 | $61,135 |
| Mean Family Income | 3,220 | $79,023 |
| Median Household Income | 4,687 | $50,707 |
| Mean Household Income | 4,687 | $67,706 |
| Income Deficit | 3,220 | $10,513 |
| Wage / Income Gap (%) | 12,607 | 39.36% |
| Wage / Income Gap ($) | 12,607 | 60.64¢ per $1 |
| Gini / Inequality Index | 12,607 | 0.44 |
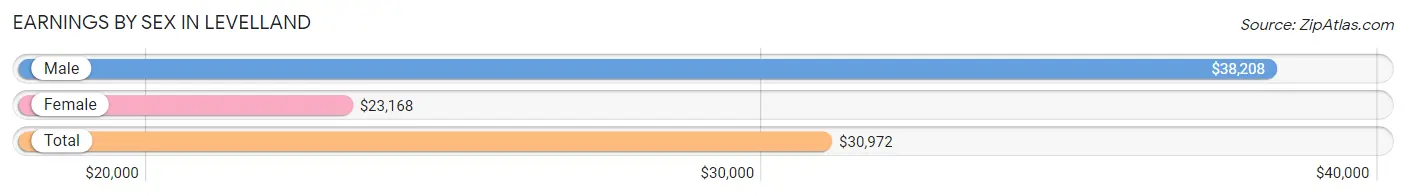
Earnings by Sex in Levelland
Average Earnings in Levelland are $30,972, $38,208 for men and $23,168 for women, a difference of 39.4%.
| Sex | Number | Average Earnings |
| Male | 3,478 (52.5%) | $38,208 |
| Female | 3,150 (47.5%) | $23,168 |
| Total | 6,628 (100.0%) | $30,972 |
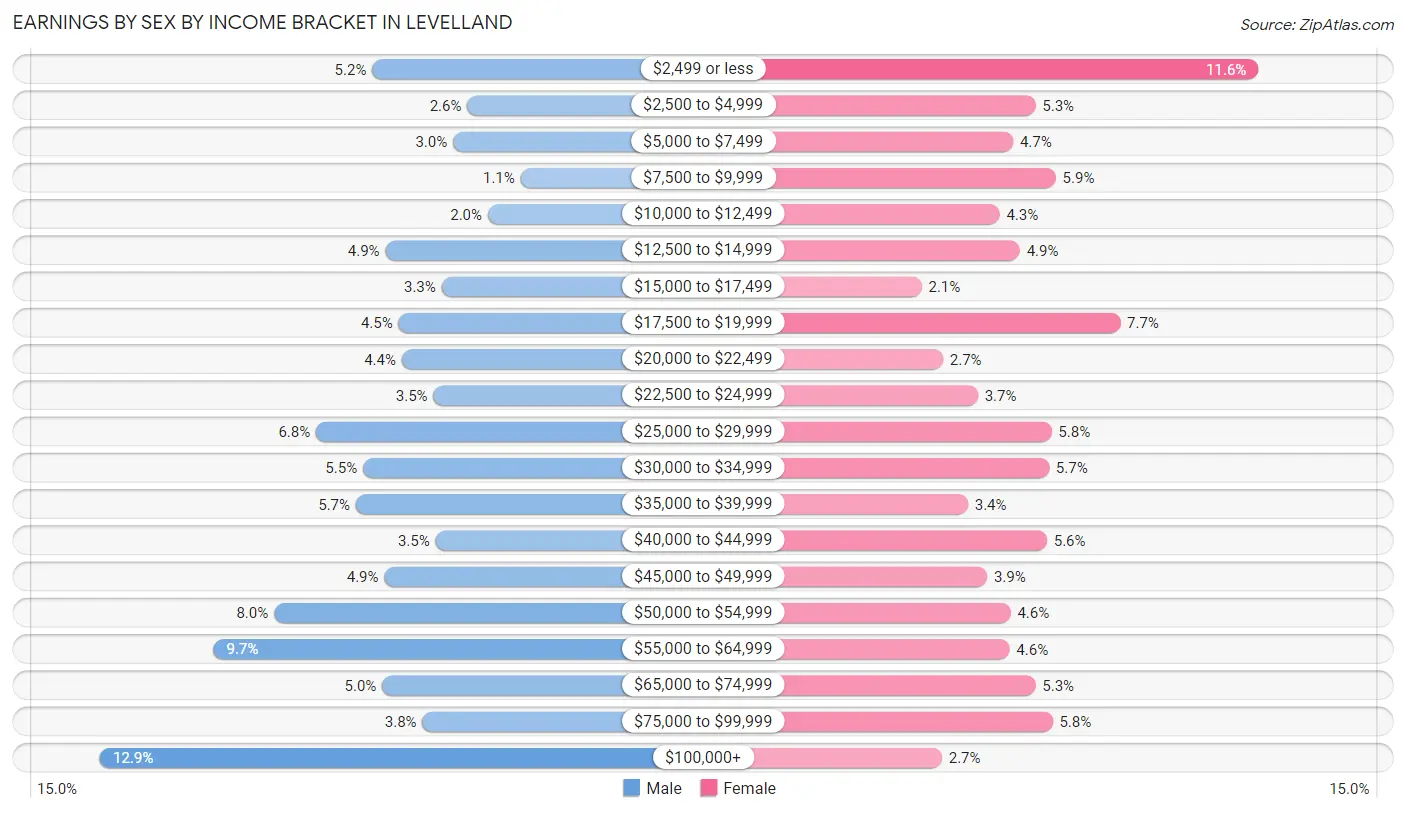
Earnings by Sex by Income Bracket in Levelland
The most common earnings brackets in Levelland are $100,000+ for men (448 | 12.9%) and $2,499 or less for women (364 | 11.6%).
| Income | Male | Female |
| $2,499 or less | 182 (5.2%) | 364 (11.6%) |
| $2,500 to $4,999 | 89 (2.6%) | 167 (5.3%) |
| $5,000 to $7,499 | 103 (3.0%) | 147 (4.7%) |
| $7,500 to $9,999 | 37 (1.1%) | 185 (5.9%) |
| $10,000 to $12,499 | 69 (2.0%) | 135 (4.3%) |
| $12,500 to $14,999 | 169 (4.9%) | 153 (4.9%) |
| $15,000 to $17,499 | 114 (3.3%) | 66 (2.1%) |
| $17,500 to $19,999 | 156 (4.5%) | 242 (7.7%) |
| $20,000 to $22,499 | 153 (4.4%) | 85 (2.7%) |
| $22,500 to $24,999 | 122 (3.5%) | 116 (3.7%) |
| $25,000 to $29,999 | 237 (6.8%) | 181 (5.8%) |
| $30,000 to $34,999 | 191 (5.5%) | 179 (5.7%) |
| $35,000 to $39,999 | 198 (5.7%) | 107 (3.4%) |
| $40,000 to $44,999 | 120 (3.5%) | 177 (5.6%) |
| $45,000 to $49,999 | 170 (4.9%) | 124 (3.9%) |
| $50,000 to $54,999 | 278 (8.0%) | 145 (4.6%) |
| $55,000 to $64,999 | 337 (9.7%) | 144 (4.6%) |
| $65,000 to $74,999 | 172 (5.0%) | 167 (5.3%) |
| $75,000 to $99,999 | 133 (3.8%) | 182 (5.8%) |
| $100,000+ | 448 (12.9%) | 84 (2.7%) |
| Total | 3,478 (100.0%) | 3,150 (100.0%) |
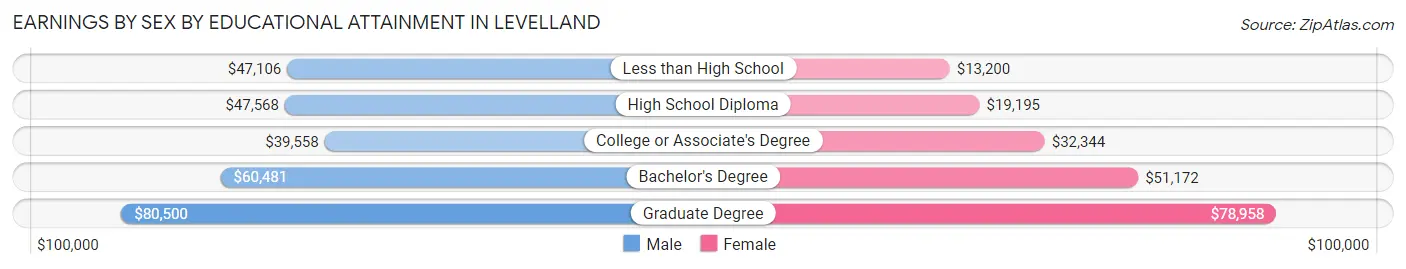
Earnings by Sex by Educational Attainment in Levelland
Average earnings in Levelland are $48,220 for men and $29,676 for women, a difference of 38.5%. Men with an educational attainment of graduate degree enjoy the highest average annual earnings of $80,500, while those with college or associate's degree education earn the least with $39,558. Women with an educational attainment of graduate degree earn the most with the average annual earnings of $78,958, while those with less than high school education have the smallest earnings of $13,200.
| Educational Attainment | Male Income | Female Income |
| Less than High School | $47,106 | $13,200 |
| High School Diploma | $47,568 | $19,195 |
| College or Associate's Degree | $39,558 | $32,344 |
| Bachelor's Degree | $60,481 | $51,172 |
| Graduate Degree | $80,500 | $78,958 |
| Total | $48,220 | $29,676 |
Family Income in Levelland
Family Income Brackets in Levelland
According to the Levelland family income data, there are 683 families falling into the $100,000 to $149,999 income range, which is the most common income bracket and makes up 21.2% of all families. Conversely, the less than $10,000 income bracket is the least frequent group with only 84 families (2.6%) belonging to this category.
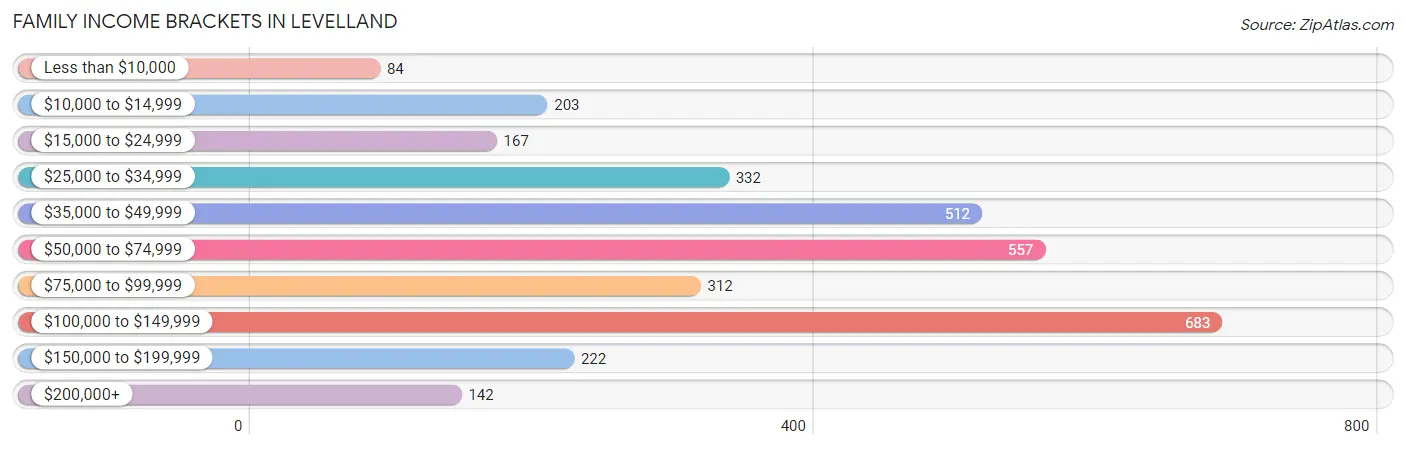
| Income Bracket | # Families | % Families |
| Less than $10,000 | 84 | 2.6% |
| $10,000 to $14,999 | 203 | 6.3% |
| $15,000 to $24,999 | 167 | 5.2% |
| $25,000 to $34,999 | 332 | 10.3% |
| $35,000 to $49,999 | 512 | 15.9% |
| $50,000 to $74,999 | 557 | 17.3% |
| $75,000 to $99,999 | 312 | 9.7% |
| $100,000 to $149,999 | 683 | 21.2% |
| $150,000 to $199,999 | 222 | 6.9% |
| $200,000+ | 142 | 4.4% |
Family Income by Famaliy Size in Levelland
4-person families (706 | 21.9%) account for the highest median family income in Levelland with $70,872 per family, while 2-person families (1,433 | 44.5%) have the highest median income of $26,886 per family member.
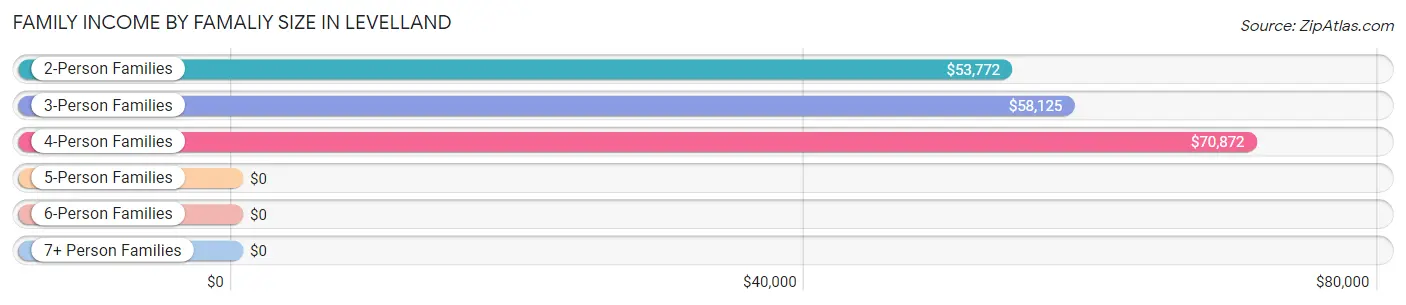
| Income Bracket | # Families | Median Income |
| 2-Person Families | 1,433 (44.5%) | $53,772 |
| 3-Person Families | 659 (20.5%) | $58,125 |
| 4-Person Families | 706 (21.9%) | $70,872 |
| 5-Person Families | 364 (11.3%) | $0 |
| 6-Person Families | 39 (1.2%) | $0 |
| 7+ Person Families | 19 (0.6%) | $0 |
| Total | 3,220 (100.0%) | $61,135 |
Family Income by Number of Earners in Levelland
The median family income in Levelland is $61,135, with families comprising 3+ earners (357) having the highest median family income of $120,130, while families with no earners (431) have the lowest median family income of $19,957, accounting for 11.1% and 13.4% of families, respectively.
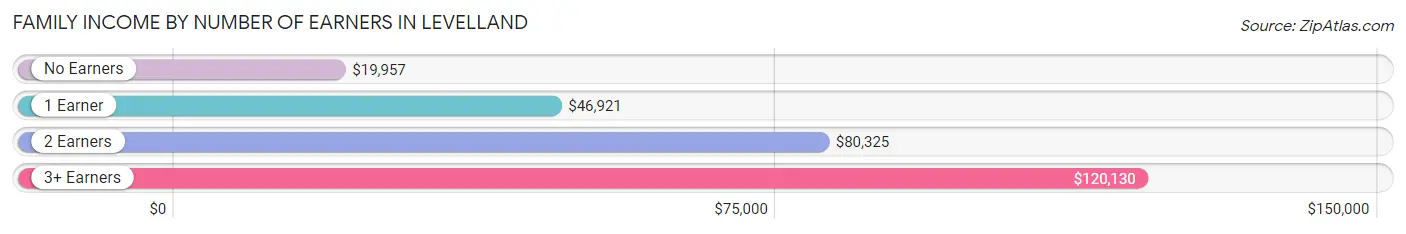
| Number of Earners | # Families | Median Income |
| No Earners | 431 (13.4%) | $19,957 |
| 1 Earner | 1,069 (33.2%) | $46,921 |
| 2 Earners | 1,363 (42.3%) | $80,325 |
| 3+ Earners | 357 (11.1%) | $120,130 |
| Total | 3,220 (100.0%) | $61,135 |
Household Income in Levelland
Household Income Brackets in Levelland
With 792 households falling in the category, the $50,000 to $74,999 income range is the most frequent in Levelland, accounting for 16.9% of all households. In contrast, only 145 households (3.1%) fall into the $200,000+ income bracket, making it the least populous group.
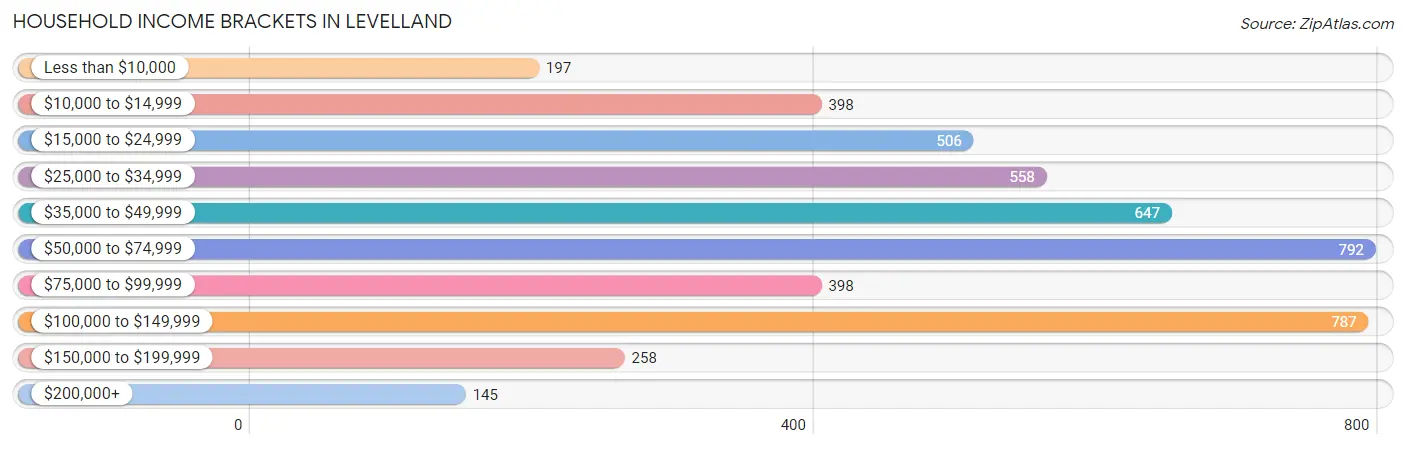
| Income Bracket | # Households | % Households |
| Less than $10,000 | 197 | 4.2% |
| $10,000 to $14,999 | 398 | 8.5% |
| $15,000 to $24,999 | 506 | 10.8% |
| $25,000 to $34,999 | 558 | 11.9% |
| $35,000 to $49,999 | 647 | 13.8% |
| $50,000 to $74,999 | 792 | 16.9% |
| $75,000 to $99,999 | 398 | 8.5% |
| $100,000 to $149,999 | 787 | 16.8% |
| $150,000 to $199,999 | 258 | 5.5% |
| $200,000+ | 145 | 3.1% |
Household Income by Householder Age in Levelland
The median household income in Levelland is $50,707, with the highest median household income of $67,350 found in the 45 to 64 years age bracket for the primary householder. A total of 1,463 households (31.2%) fall into this category. Meanwhile, the 15 to 24 years age bracket for the primary householder has the lowest median household income of $0, with 293 households (6.2%) in this group.
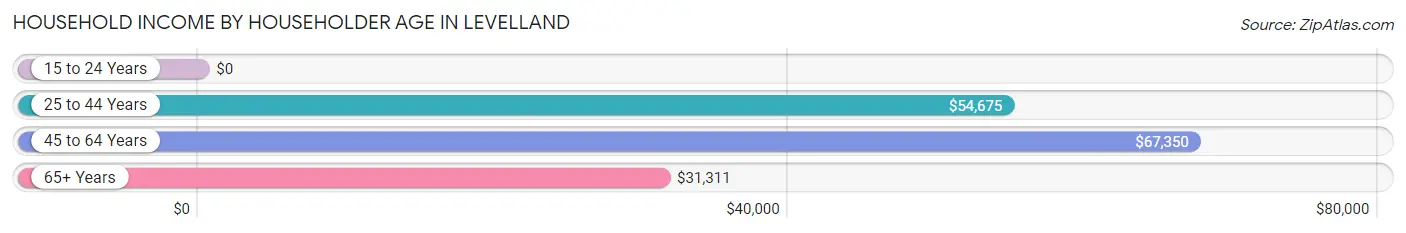
| Income Bracket | # Households | Median Income |
| 15 to 24 Years | 293 (6.2%) | $0 |
| 25 to 44 Years | 1,784 (38.1%) | $54,675 |
| 45 to 64 Years | 1,463 (31.2%) | $67,350 |
| 65+ Years | 1,147 (24.5%) | $31,311 |
| Total | 4,687 (100.0%) | $50,707 |
Poverty in Levelland
Income Below Poverty by Sex and Age in Levelland
With 13.9% poverty level for males and 21.0% for females among the residents of Levelland, 5 year old males and 18 to 24 year old females are the most vulnerable to poverty, with 57 males (74.0%) and 231 females (36.1%) in their respective age groups living below the poverty level.
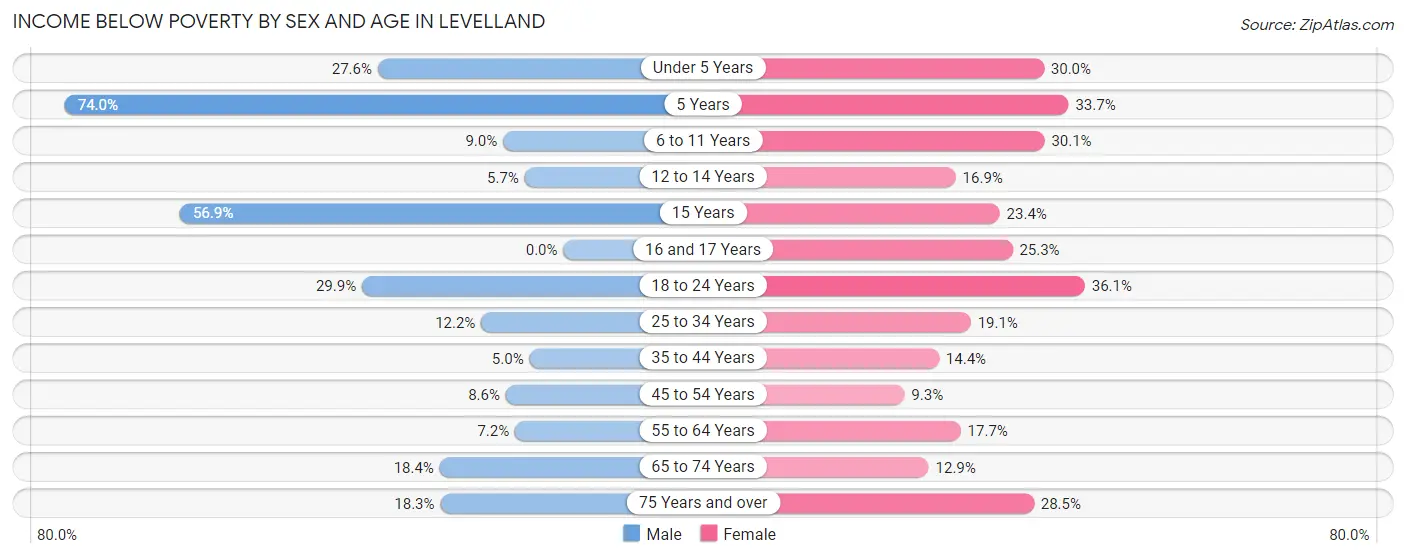
| Age Bracket | Male | Female |
| Under 5 Years | 127 (27.6%) | 114 (30.0%) |
| 5 Years | 57 (74.0%) | 34 (33.7%) |
| 6 to 11 Years | 34 (8.9%) | 136 (30.1%) |
| 12 to 14 Years | 30 (5.7%) | 57 (16.9%) |
| 15 Years | 37 (56.9%) | 15 (23.4%) |
| 16 and 17 Years | 0 (0.0%) | 37 (25.3%) |
| 18 to 24 Years | 151 (29.9%) | 231 (36.1%) |
| 25 to 34 Years | 115 (12.2%) | 156 (19.1%) |
| 35 to 44 Years | 38 (5.0%) | 122 (14.4%) |
| 45 to 54 Years | 47 (8.6%) | 61 (9.3%) |
| 55 to 64 Years | 48 (7.2%) | 131 (17.6%) |
| 65 to 74 Years | 83 (18.4%) | 58 (12.9%) |
| 75 Years and over | 42 (18.3%) | 124 (28.5%) |
| Total | 809 (13.9%) | 1,276 (21.0%) |
Income Above Poverty by Sex and Age in Levelland
According to the poverty statistics in Levelland, males aged 16 and 17 years and females aged 45 to 54 years are the age groups that are most secure financially, with 100.0% of males and 90.7% of females in these age groups living above the poverty line.
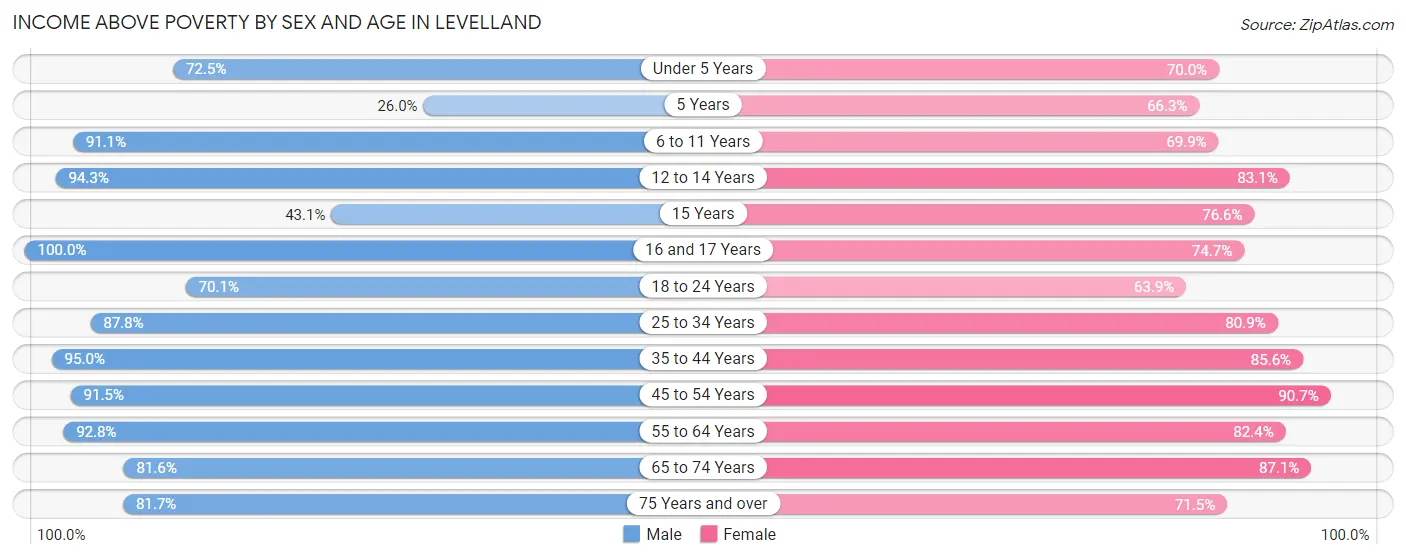
| Age Bracket | Male | Female |
| Under 5 Years | 334 (72.5%) | 266 (70.0%) |
| 5 Years | 20 (26.0%) | 67 (66.3%) |
| 6 to 11 Years | 346 (91.0%) | 316 (69.9%) |
| 12 to 14 Years | 493 (94.3%) | 280 (83.1%) |
| 15 Years | 28 (43.1%) | 49 (76.6%) |
| 16 and 17 Years | 223 (100.0%) | 109 (74.7%) |
| 18 to 24 Years | 354 (70.1%) | 409 (63.9%) |
| 25 to 34 Years | 828 (87.8%) | 659 (80.9%) |
| 35 to 44 Years | 717 (95.0%) | 724 (85.6%) |
| 45 to 54 Years | 503 (91.4%) | 595 (90.7%) |
| 55 to 64 Years | 621 (92.8%) | 611 (82.4%) |
| 65 to 74 Years | 369 (81.6%) | 392 (87.1%) |
| 75 Years and over | 188 (81.7%) | 311 (71.5%) |
| Total | 5,024 (86.1%) | 4,788 (79.0%) |
Income Below Poverty Among Married-Couple Families in Levelland
The poverty statistics for married-couple families in Levelland show that 5.4% or 123 of the total 2,261 families live below the poverty line. Families with no children have the highest poverty rate of 7.0%, comprising of 81 families. On the other hand, families with 3 or 4 children have the lowest poverty rate of 0.0%, which includes 0 families.
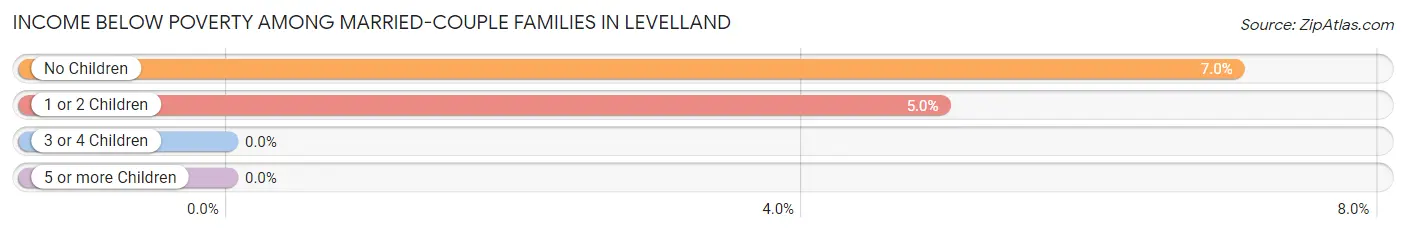
| Children | Above Poverty | Below Poverty |
| No Children | 1,074 (93.0%) | 81 (7.0%) |
| 1 or 2 Children | 804 (95.0%) | 42 (5.0%) |
| 3 or 4 Children | 260 (100.0%) | 0 (0.0%) |
| 5 or more Children | 0 (0.0%) | 0 (0.0%) |
| Total | 2,138 (94.6%) | 123 (5.4%) |
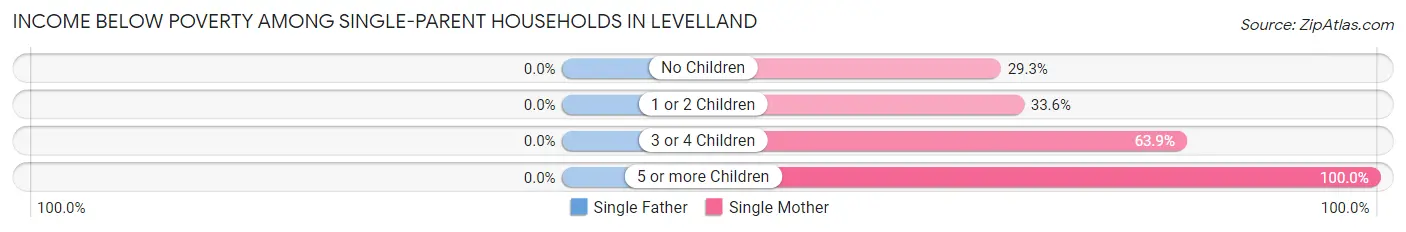
Income Below Poverty Among Single-Parent Households in Levelland
| Children | Single Father | Single Mother |
| No Children | 0 (0.0%) | 74 (29.2%) |
| 1 or 2 Children | 0 (0.0%) | 158 (33.6%) |
| 3 or 4 Children | 0 (0.0%) | 69 (63.9%) |
| 5 or more Children | 0 (0.0%) | 15 (100.0%) |
| Total | 0 (0.0%) | 316 (37.3%) |
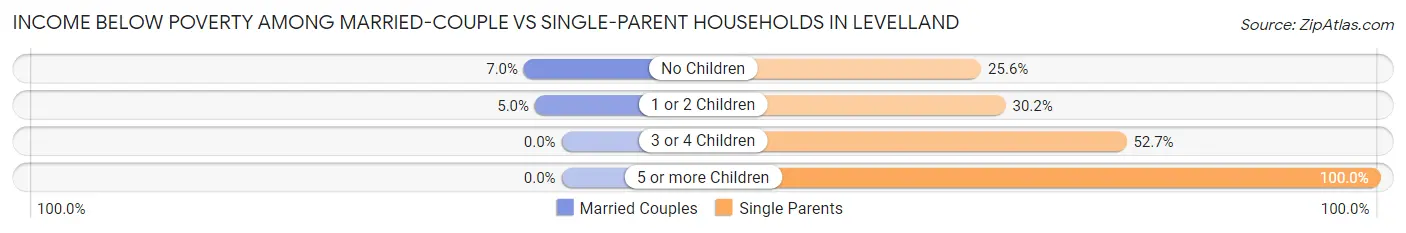
Income Below Poverty Among Married-Couple vs Single-Parent Households in Levelland
The poverty data for Levelland shows that 123 of the married-couple family households (5.4%) and 316 of the single-parent households (33.0%) are living below the poverty level. Within the married-couple family households, those with no children have the highest poverty rate, with 81 households (7.0%) falling below the poverty line. Among the single-parent households, those with 5 or more children have the highest poverty rate, with 15 household (100.0%) living below poverty.
| Children | Married-Couple Families | Single-Parent Households |
| No Children | 81 (7.0%) | 74 (25.6%) |
| 1 or 2 Children | 42 (5.0%) | 158 (30.1%) |
| 3 or 4 Children | 0 (0.0%) | 69 (52.7%) |
| 5 or more Children | 0 (0.0%) | 15 (100.0%) |
| Total | 123 (5.4%) | 316 (33.0%) |
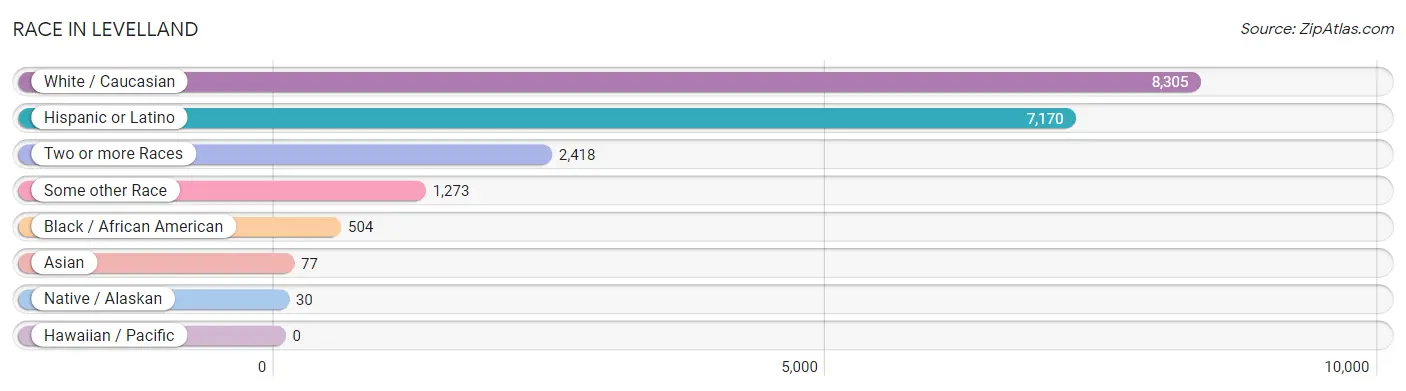
Race in Levelland
The most populous races in Levelland are White / Caucasian (8,305 | 65.9%), Hispanic or Latino (7,170 | 56.9%), and Two or more Races (2,418 | 19.2%).
| Race | # Population | % Population |
| Asian | 77 | 0.6% |
| Black / African American | 504 | 4.0% |
| Hawaiian / Pacific | 0 | 0.0% |
| Hispanic or Latino | 7,170 | 56.9% |
| Native / Alaskan | 30 | 0.2% |
| White / Caucasian | 8,305 | 65.9% |
| Two or more Races | 2,418 | 19.2% |
| Some other Race | 1,273 | 10.1% |
| Total | 12,607 | 100.0% |
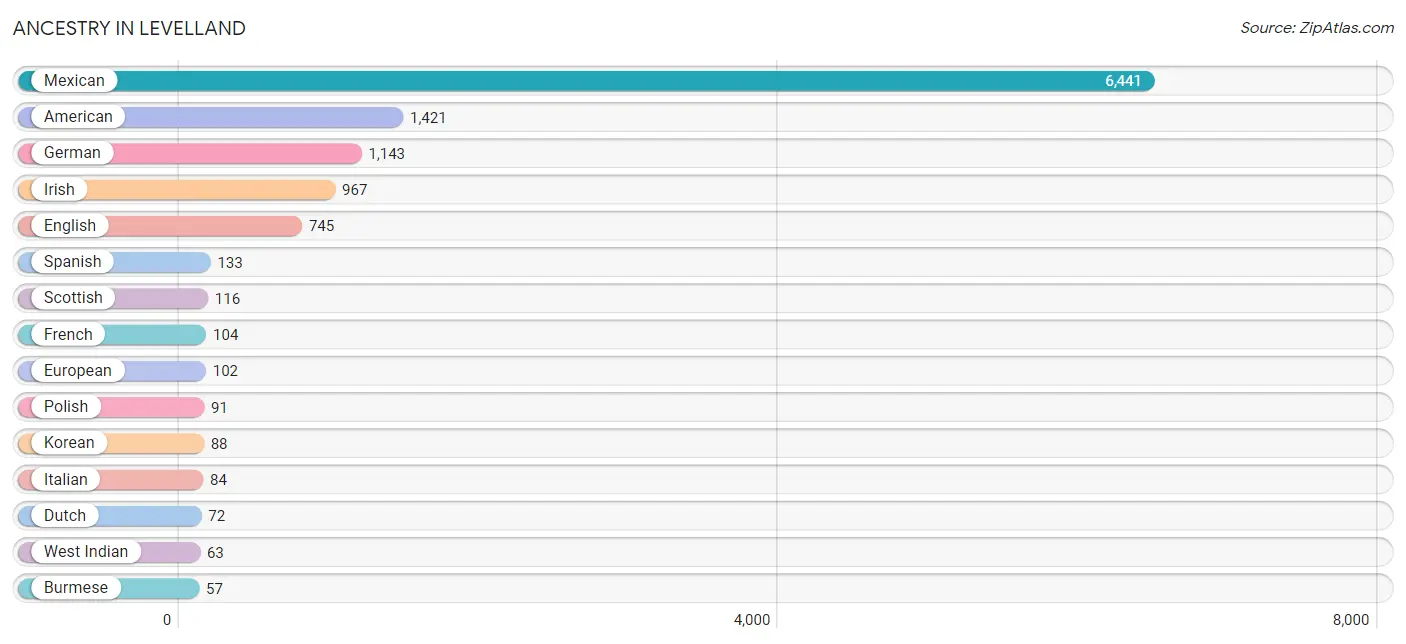
Ancestry in Levelland
The most populous ancestries reported in Levelland are Mexican (6,441 | 51.1%), American (1,421 | 11.3%), German (1,143 | 9.1%), Irish (967 | 7.7%), and English (745 | 5.9%), together accounting for 85.0% of all Levelland residents.
| Ancestry | # Population | % Population |
| African | 16 | 0.1% |
| American | 1,421 | 11.3% |
| Apache | 22 | 0.2% |
| Bhutanese | 7 | 0.1% |
| Blackfeet | 5 | 0.0% |
| British | 29 | 0.2% |
| Burmese | 57 | 0.4% |
| Central American | 5 | 0.0% |
| Cherokee | 6 | 0.1% |
| Czechoslovakian | 6 | 0.1% |
| Danish | 8 | 0.1% |
| Dutch | 72 | 0.6% |
| Dutch West Indian | 25 | 0.2% |
| English | 745 | 5.9% |
| European | 102 | 0.8% |
| French | 104 | 0.8% |
| German | 1,143 | 9.1% |
| Honduran | 5 | 0.0% |
| Iranian | 8 | 0.1% |
| Irish | 967 | 7.7% |
| Italian | 84 | 0.7% |
| Korean | 88 | 0.7% |
| Mexican | 6,441 | 51.1% |
| Navajo | 4 | 0.0% |
| Nigerian | 11 | 0.1% |
| Northern European | 10 | 0.1% |
| Polish | 91 | 0.7% |
| Puerto Rican | 9 | 0.1% |
| Romanian | 11 | 0.1% |
| Russian | 34 | 0.3% |
| Scandinavian | 21 | 0.2% |
| Scotch-Irish | 18 | 0.1% |
| Scottish | 116 | 0.9% |
| Spaniard | 31 | 0.3% |
| Spanish | 133 | 1.1% |
| Spanish American | 9 | 0.1% |
| Subsaharan African | 27 | 0.2% |
| Swedish | 18 | 0.1% |
| Swiss | 9 | 0.1% |
| Thai | 10 | 0.1% |
| Welsh | 41 | 0.3% |
| West Indian | 63 | 0.5% | View All 42 Rows |
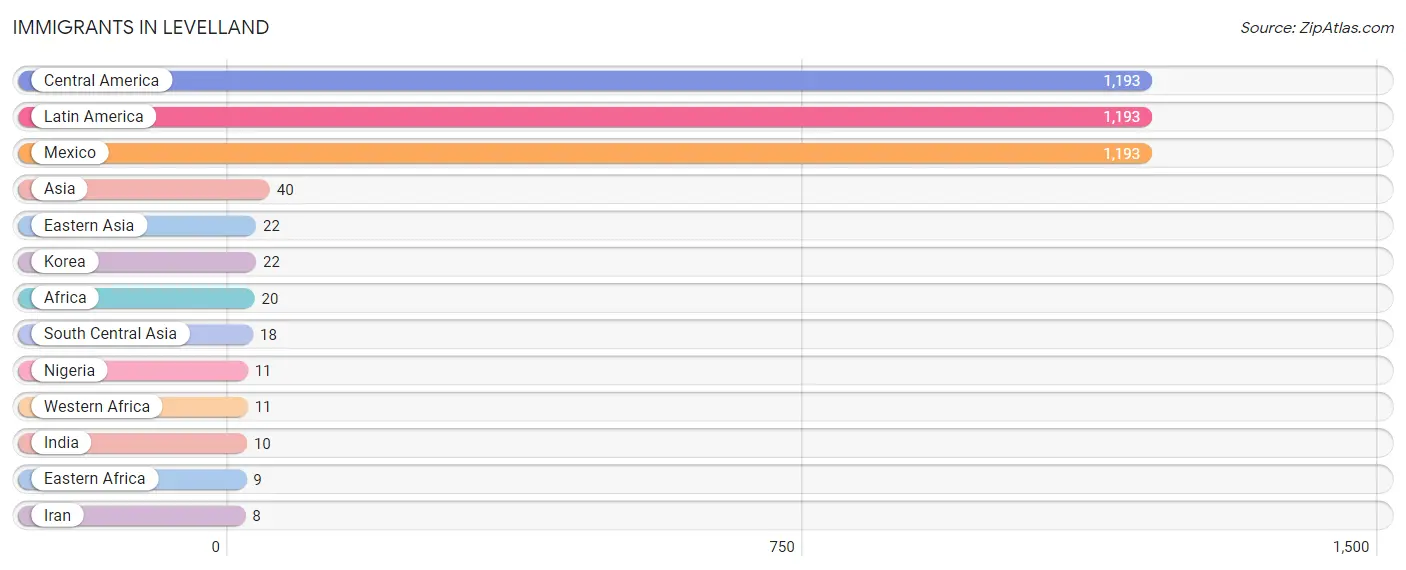
Immigrants in Levelland
The most numerous immigrant groups reported in Levelland came from Central America (1,193 | 9.5%), Latin America (1,193 | 9.5%), Mexico (1,193 | 9.5%), Asia (40 | 0.3%), and Eastern Asia (22 | 0.2%), together accounting for 28.9% of all Levelland residents.
| Immigration Origin | # Population | % Population |
| Africa | 20 | 0.2% |
| Asia | 40 | 0.3% |
| Central America | 1,193 | 9.5% |
| Eastern Africa | 9 | 0.1% |
| Eastern Asia | 22 | 0.2% |
| India | 10 | 0.1% |
| Iran | 8 | 0.1% |
| Korea | 22 | 0.2% |
| Latin America | 1,193 | 9.5% |
| Mexico | 1,193 | 9.5% |
| Nigeria | 11 | 0.1% |
| South Central Asia | 18 | 0.1% |
| Western Africa | 11 | 0.1% | View All 13 Rows |
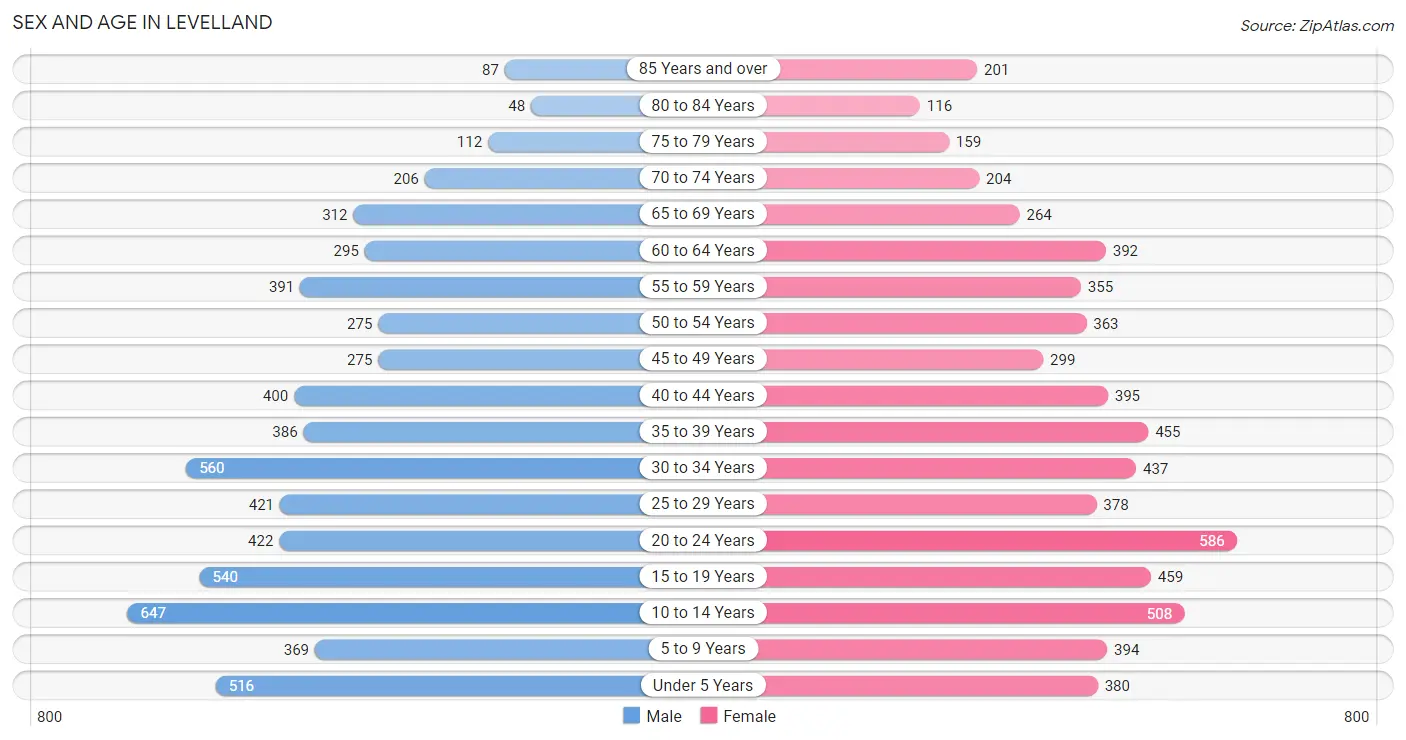
Sex and Age in Levelland
Sex and Age in Levelland
The most populous age groups in Levelland are 10 to 14 Years (647 | 10.3%) for men and 20 to 24 Years (586 | 9.2%) for women.
| Age Bracket | Male | Female |
| Under 5 Years | 516 (8.2%) | 380 (6.0%) |
| 5 to 9 Years | 369 (5.9%) | 394 (6.2%) |
| 10 to 14 Years | 647 (10.3%) | 508 (8.0%) |
| 15 to 19 Years | 540 (8.6%) | 459 (7.2%) |
| 20 to 24 Years | 422 (6.7%) | 586 (9.2%) |
| 25 to 29 Years | 421 (6.7%) | 378 (6.0%) |
| 30 to 34 Years | 560 (8.9%) | 437 (6.9%) |
| 35 to 39 Years | 386 (6.2%) | 455 (7.2%) |
| 40 to 44 Years | 400 (6.4%) | 395 (6.2%) |
| 45 to 49 Years | 275 (4.4%) | 299 (4.7%) |
| 50 to 54 Years | 275 (4.4%) | 363 (5.7%) |
| 55 to 59 Years | 391 (6.2%) | 355 (5.6%) |
| 60 to 64 Years | 295 (4.7%) | 392 (6.2%) |
| 65 to 69 Years | 312 (5.0%) | 264 (4.2%) |
| 70 to 74 Years | 206 (3.3%) | 204 (3.2%) |
| 75 to 79 Years | 112 (1.8%) | 159 (2.5%) |
| 80 to 84 Years | 48 (0.8%) | 116 (1.8%) |
| 85 Years and over | 87 (1.4%) | 201 (3.2%) |
| Total | 6,262 (100.0%) | 6,345 (100.0%) |
Families and Households in Levelland
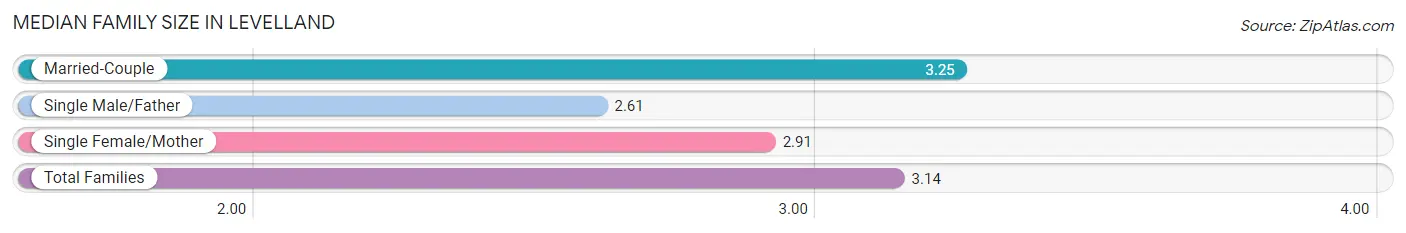
Median Family Size in Levelland
The median family size in Levelland is 3.14 persons per family, with married-couple families (2,261 | 70.2%) accounting for the largest median family size of 3.25 persons per family. On the other hand, single male/father families (112 | 3.5%) represent the smallest median family size with 2.61 persons per family.
| Family Type | # Families | Family Size |
| Married-Couple | 2,261 (70.2%) | 3.25 |
| Single Male/Father | 112 (3.5%) | 2.61 |
| Single Female/Mother | 847 (26.3%) | 2.91 |
| Total Families | 3,220 (100.0%) | 3.14 |
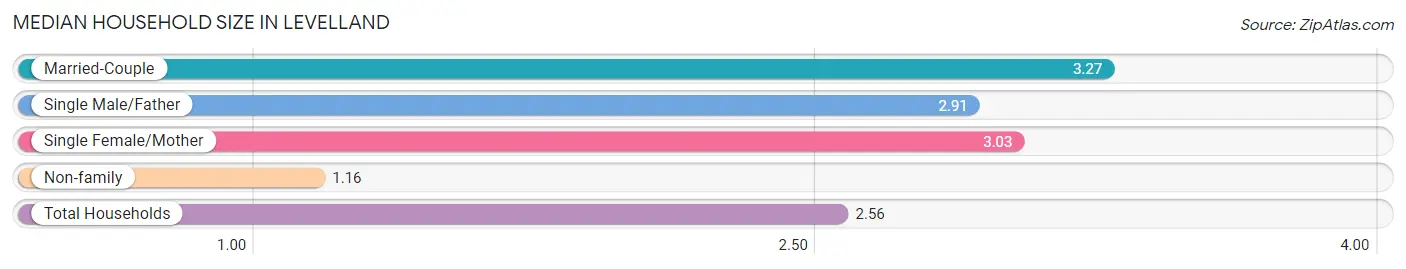
Median Household Size in Levelland
The median household size in Levelland is 2.56 persons per household, with married-couple households (2,261 | 48.2%) accounting for the largest median household size of 3.27 persons per household. non-family households (1,467 | 31.3%) represent the smallest median household size with 1.16 persons per household.
| Household Type | # Households | Household Size |
| Married-Couple | 2,261 (48.2%) | 3.27 |
| Single Male/Father | 112 (2.4%) | 2.91 |
| Single Female/Mother | 847 (18.1%) | 3.03 |
| Non-family | 1,467 (31.3%) | 1.16 |
| Total Households | 4,687 (100.0%) | 2.56 |
Household Size by Marriage Status in Levelland
Out of a total of 4,687 households in Levelland, 3,220 (68.7%) are family households, while 1,467 (31.3%) are nonfamily households. The most numerous type of family households are 2-person households, comprising 1,337, and the most common type of nonfamily households are 1-person households, comprising 1,290.
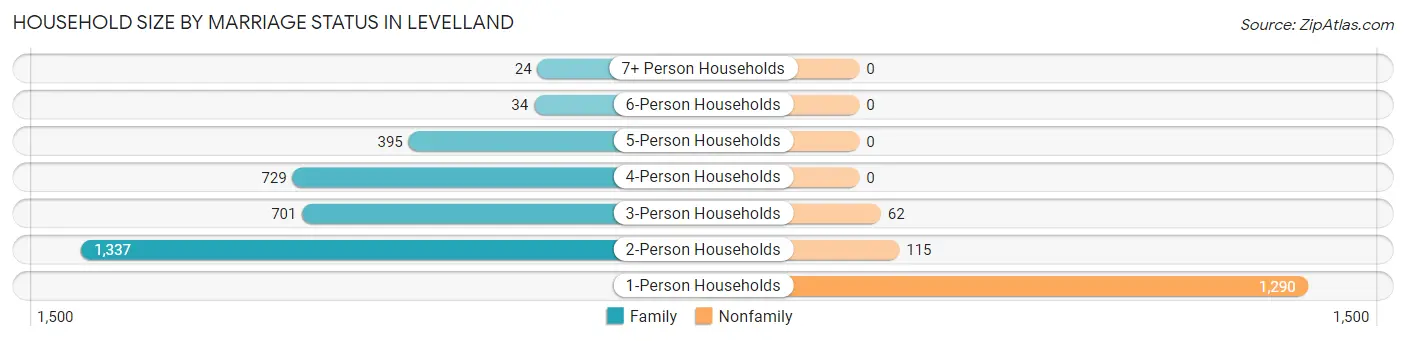
| Household Size | Family Households | Nonfamily Households |
| 1-Person Households | - | 1,290 (27.5%) |
| 2-Person Households | 1,337 (28.5%) | 115 (2.5%) |
| 3-Person Households | 701 (15.0%) | 62 (1.3%) |
| 4-Person Households | 729 (15.5%) | 0 (0.0%) |
| 5-Person Households | 395 (8.4%) | 0 (0.0%) |
| 6-Person Households | 34 (0.7%) | 0 (0.0%) |
| 7+ Person Households | 24 (0.5%) | 0 (0.0%) |
| Total | 3,220 (68.7%) | 1,467 (31.3%) |
Female Fertility in Levelland
Fertility by Age in Levelland
Average fertility rate in Levelland is 90.0 births per 1,000 women. Women in the age bracket of 20 to 34 years have the highest fertility rate with 164.0 births per 1,000 women. Women in the age bracket of 20 to 34 years acount for 81.9% of all women with births.
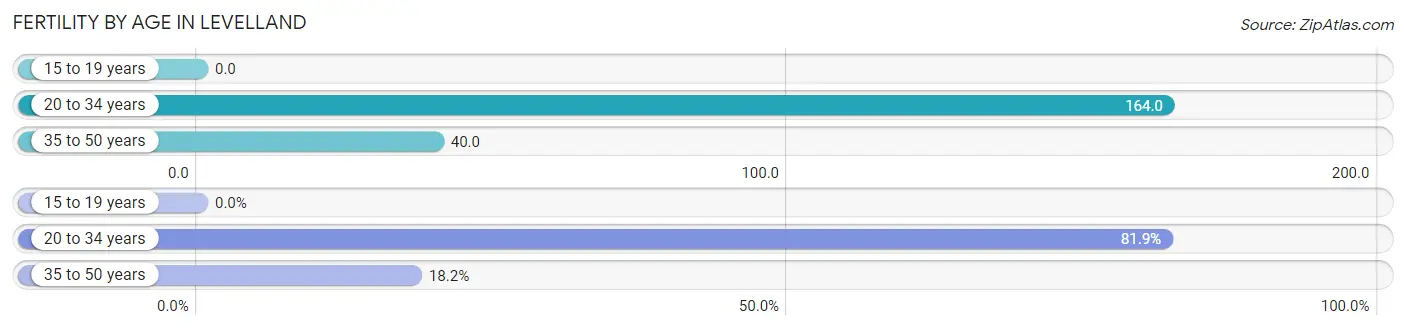
| Age Bracket | Women with Births | Births / 1,000 Women |
| 15 to 19 years | 0 (0.0%) | 0.0 |
| 20 to 34 years | 230 (81.9%) | 164.0 |
| 35 to 50 years | 51 (18.1%) | 40.0 |
| Total | 281 (100.0%) | 90.0 |
Fertility by Age by Marriage Status in Levelland
68.7% of women with births (281) in Levelland are married. The highest percentage of unmarried women with births falls into 35 to 50 years age bracket with 84.3% of them unmarried at the time of birth, while the lowest percentage of unmarried women with births belong to 20 to 34 years age bracket with 19.6% of them unmarried.
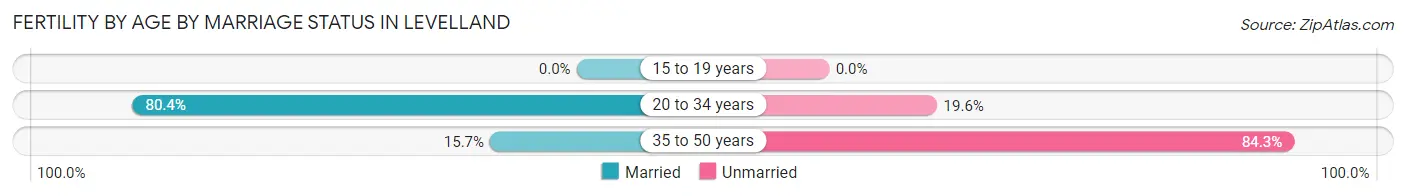
| Age Bracket | Married | Unmarried |
| 15 to 19 years | 0 (0.0%) | 0 (0.0%) |
| 20 to 34 years | 185 (80.4%) | 45 (19.6%) |
| 35 to 50 years | 8 (15.7%) | 43 (84.3%) |
| Total | 193 (68.7%) | 88 (31.3%) |
Fertility by Education in Levelland
Average fertility rate in Levelland is 90.0 births per 1,000 women. Women with the education attainment of bachelor's degree have the highest fertility rate of 229.0 births per 1,000 women, while women with the education attainment of less than high school have the lowest fertility at 56.0 births per 1,000 women. Women with the education attainment of college or associate's degree represent 35.2% of all women with births.
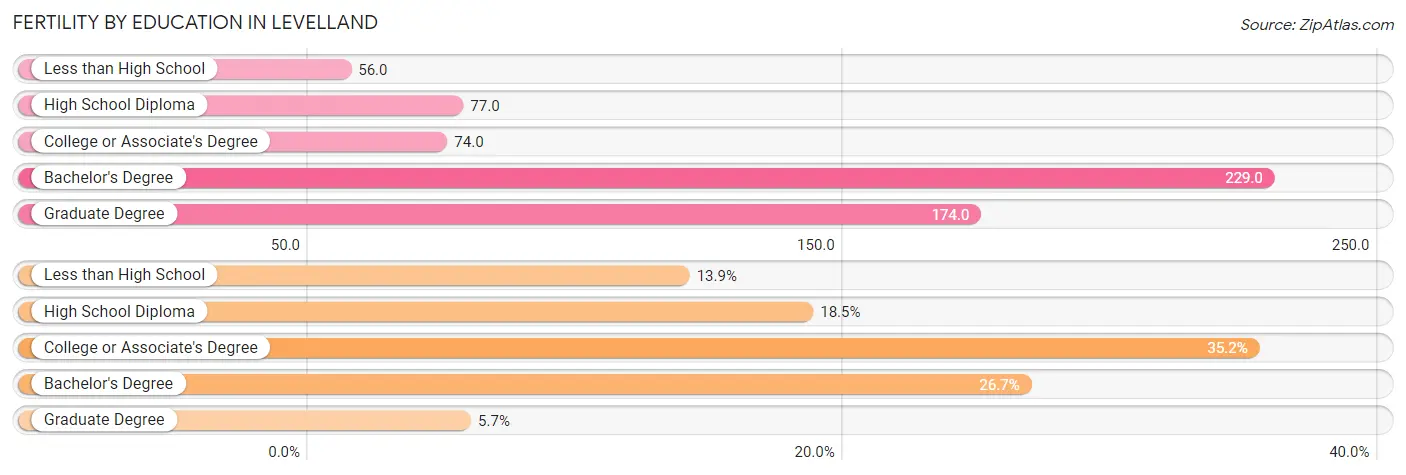
| Educational Attainment | Women with Births | Births / 1,000 Women |
| Less than High School | 39 (13.9%) | 56.0 |
| High School Diploma | 52 (18.5%) | 77.0 |
| College or Associate's Degree | 99 (35.2%) | 74.0 |
| Bachelor's Degree | 75 (26.7%) | 229.0 |
| Graduate Degree | 16 (5.7%) | 174.0 |
| Total | 281 (100.0%) | 90.0 |
Fertility by Education by Marriage Status in Levelland
31.3% of women with births in Levelland are unmarried. Women with the educational attainment of less than high school are most likely to be married with 100.0% of them married at childbirth, while women with the educational attainment of bachelor's degree are least likely to be married with 52.0% of them unmarried at childbirth.
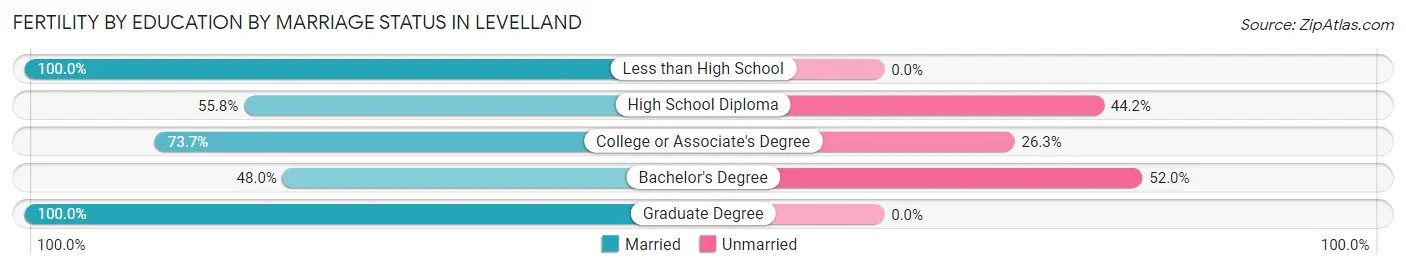
| Educational Attainment | Married | Unmarried |
| Less than High School | 39 (100.0%) | 0 (0.0%) |
| High School Diploma | 29 (55.8%) | 23 (44.2%) |
| College or Associate's Degree | 73 (73.7%) | 26 (26.3%) |
| Bachelor's Degree | 36 (48.0%) | 39 (52.0%) |
| Graduate Degree | 16 (100.0%) | 0 (0.0%) |
| Total | 193 (68.7%) | 88 (31.3%) |
Employment Characteristics in Levelland
Employment by Class of Employer in Levelland
Among the 5,672 employed individuals in Levelland, private company employees (3,970 | 70.0%), not-for-profit organizations (541 | 9.5%), and local government employees (415 | 7.3%) make up the most common classes of employment.
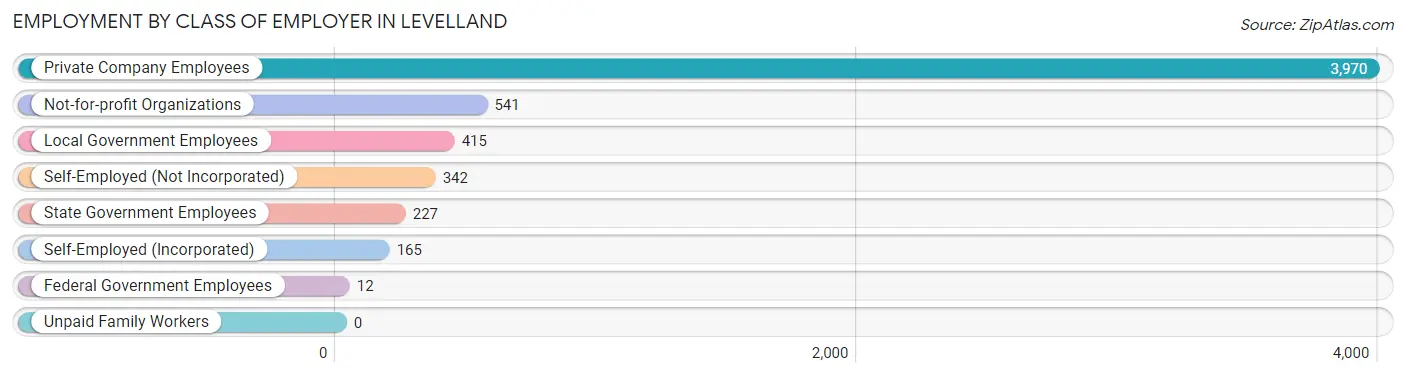
| Employer Class | # Employees | % Employees |
| Private Company Employees | 3,970 | 70.0% |
| Self-Employed (Incorporated) | 165 | 2.9% |
| Self-Employed (Not Incorporated) | 342 | 6.0% |
| Not-for-profit Organizations | 541 | 9.5% |
| Local Government Employees | 415 | 7.3% |
| State Government Employees | 227 | 4.0% |
| Federal Government Employees | 12 | 0.2% |
| Unpaid Family Workers | 0 | 0.0% |
| Total | 5,672 | 100.0% |
Employment Status by Age in Levelland
According to the labor force statistics for Levelland, out of the total population over 16 years of age (9,664), 63.1% or 6,098 individuals are in the labor force, with 5.9% or 360 of them unemployed. The age group with the highest labor force participation rate is 30 to 34 years, with 89.6% or 893 individuals in the labor force. Within the labor force, the 16 to 19 years age range has the highest percentage of unemployed individuals, with 28.2% or 103 of them being unemployed.
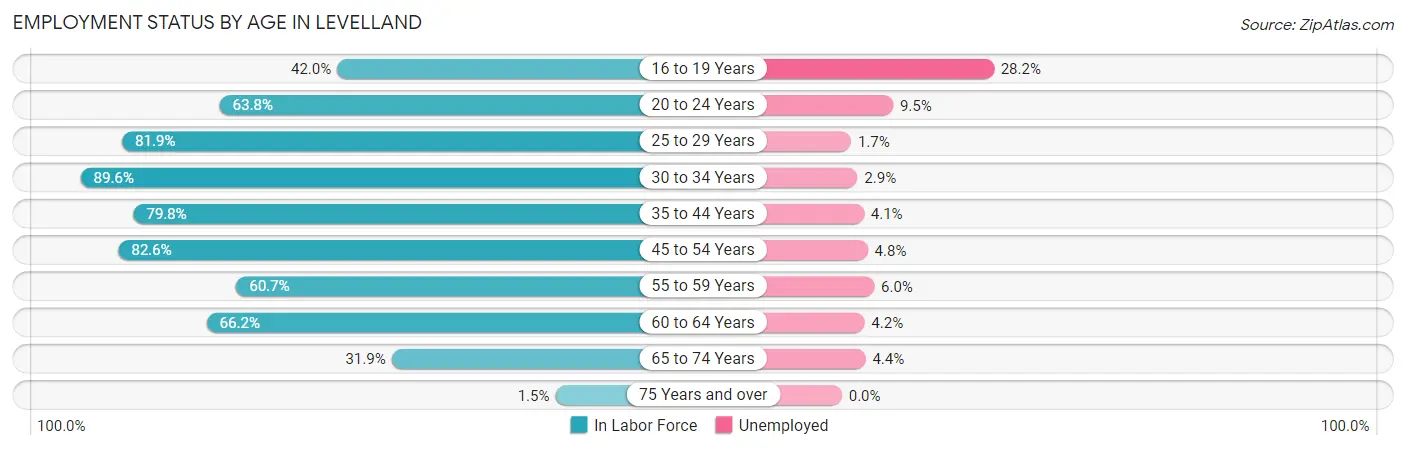
| Age Bracket | In Labor Force | Unemployed |
| 16 to 19 Years | 365 (42.0%) | 103 (28.2%) |
| 20 to 24 Years | 643 (63.8%) | 61 (9.5%) |
| 25 to 29 Years | 654 (81.9%) | 11 (1.7%) |
| 30 to 34 Years | 893 (89.6%) | 26 (2.9%) |
| 35 to 44 Years | 1,306 (79.8%) | 54 (4.1%) |
| 45 to 54 Years | 1,001 (82.6%) | 48 (4.8%) |
| 55 to 59 Years | 453 (60.7%) | 27 (6.0%) |
| 60 to 64 Years | 455 (66.2%) | 19 (4.2%) |
| 65 to 74 Years | 315 (31.9%) | 14 (4.4%) |
| 75 Years and over | 11 (1.5%) | 0 (0.0%) |
| Total | 6,098 (63.1%) | 360 (5.9%) |
Employment Status by Educational Attainment in Levelland
According to labor force statistics for Levelland, 78.4% of individuals (4,764) out of the total population between 25 and 64 years of age (6,077) are in the labor force, with 3.9% or 186 of them being unemployed. The group with the highest labor force participation rate are those with the educational attainment of bachelor's degree or higher, with 94.6% or 846 individuals in the labor force. Within the labor force, individuals with college / associate degree education have the highest percentage of unemployment, with 5.2% or 94 of them being unemployed.
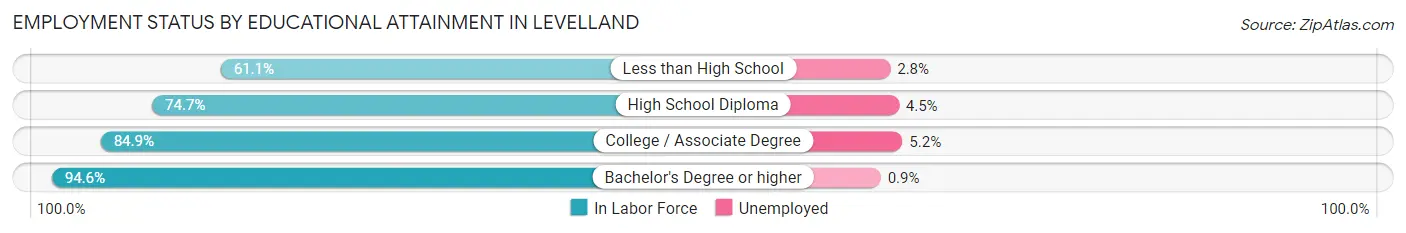
| Educational Attainment | In Labor Force | Unemployed |
| Less than High School | 783 (61.1%) | 36 (2.8%) |
| High School Diploma | 1,318 (74.7%) | 79 (4.5%) |
| College / Associate Degree | 1,813 (84.9%) | 111 (5.2%) |
| Bachelor's Degree or higher | 846 (94.6%) | 8 (0.9%) |
| Total | 4,764 (78.4%) | 237 (3.9%) |
Employment Occupations by Sex in Levelland
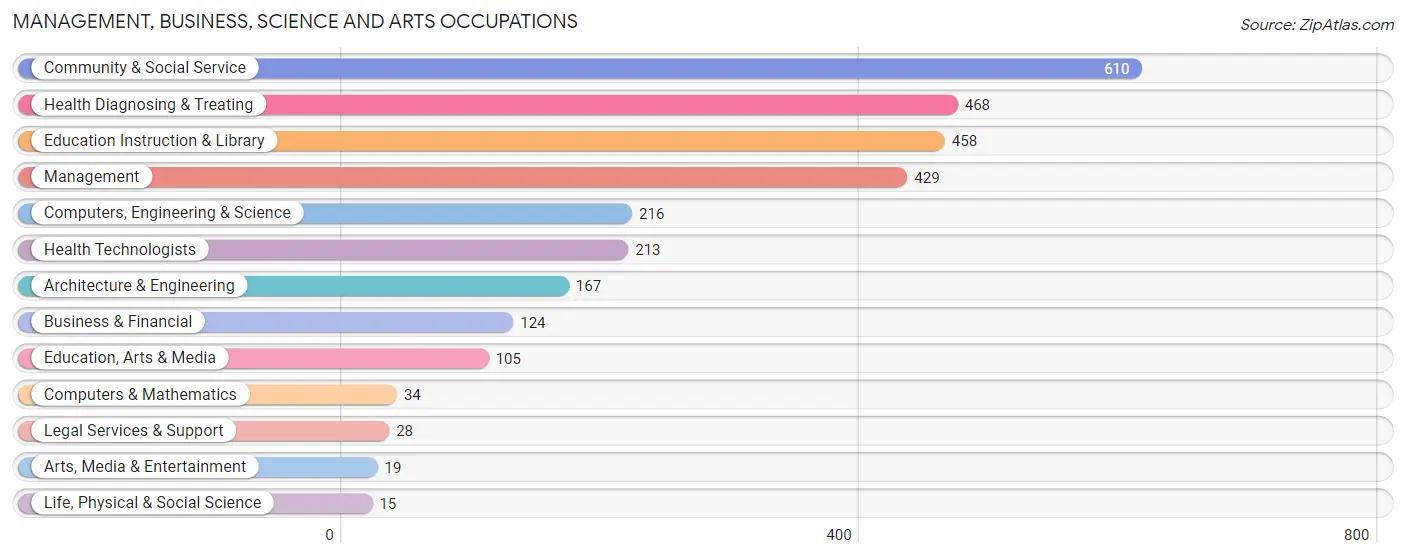
Management, Business, Science and Arts Occupations
The most common Management, Business, Science and Arts occupations in Levelland are Community & Social Service (610 | 10.6%), Health Diagnosing & Treating (468 | 8.2%), Education Instruction & Library (458 | 8.0%), Management (429 | 7.5%), and Computers, Engineering & Science (216 | 3.8%).
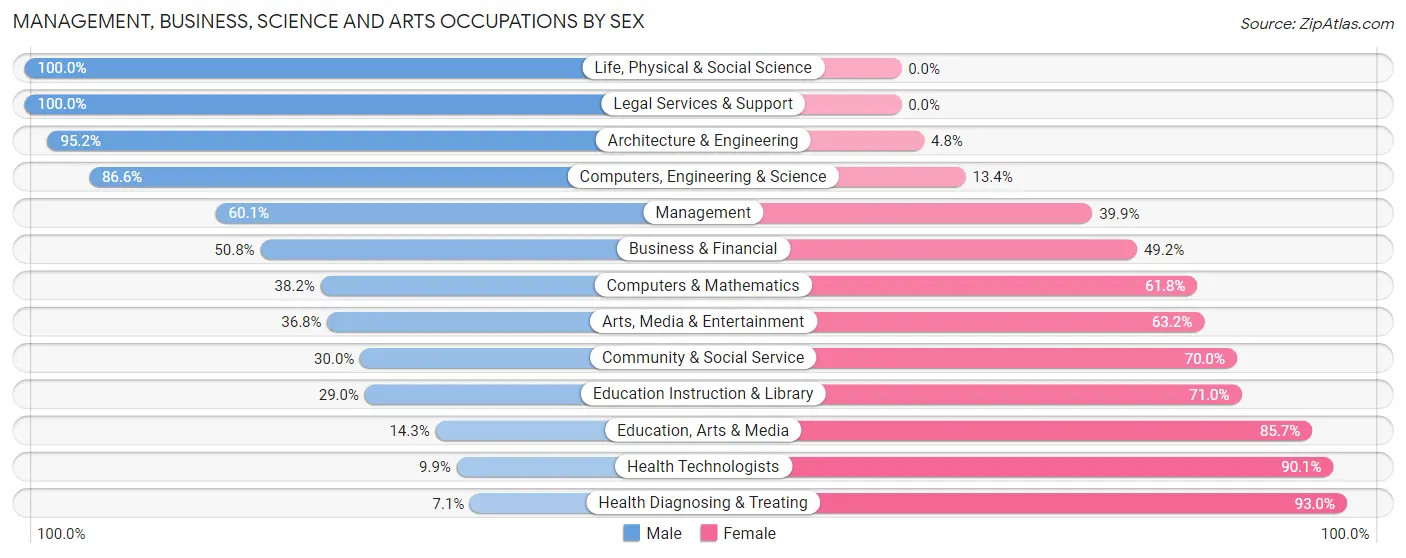
Management, Business, Science and Arts Occupations by Sex
Within the Management, Business, Science and Arts occupations in Levelland, the most male-oriented occupations are Life, Physical & Social Science (100.0%), Legal Services & Support (100.0%), and Architecture & Engineering (95.2%), while the most female-oriented occupations are Health Diagnosing & Treating (92.9%), Health Technologists (90.1%), and Education, Arts & Media (85.7%).
| Occupation | Male | Female |
| Management | 258 (60.1%) | 171 (39.9%) |
| Business & Financial | 63 (50.8%) | 61 (49.2%) |
| Computers, Engineering & Science | 187 (86.6%) | 29 (13.4%) |
| Computers & Mathematics | 13 (38.2%) | 21 (61.8%) |
| Architecture & Engineering | 159 (95.2%) | 8 (4.8%) |
| Life, Physical & Social Science | 15 (100.0%) | 0 (0.0%) |
| Community & Social Service | 183 (30.0%) | 427 (70.0%) |
| Education, Arts & Media | 15 (14.3%) | 90 (85.7%) |
| Legal Services & Support | 28 (100.0%) | 0 (0.0%) |
| Education Instruction & Library | 133 (29.0%) | 325 (71.0%) |
| Arts, Media & Entertainment | 7 (36.8%) | 12 (63.2%) |
| Health Diagnosing & Treating | 33 (7.0%) | 435 (92.9%) |
| Health Technologists | 21 (9.9%) | 192 (90.1%) |
| Total (Category) | 724 (39.2%) | 1,123 (60.8%) |
| Total (Overall) | 2,977 (51.9%) | 2,757 (48.1%) |
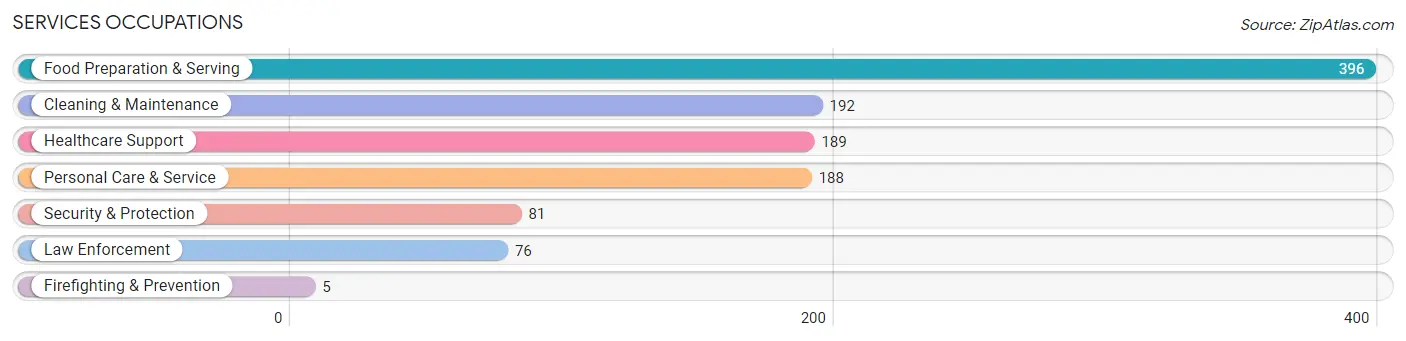
Services Occupations
The most common Services occupations in Levelland are Food Preparation & Serving (396 | 6.9%), Cleaning & Maintenance (192 | 3.4%), Healthcare Support (189 | 3.3%), Personal Care & Service (188 | 3.3%), and Security & Protection (81 | 1.4%).
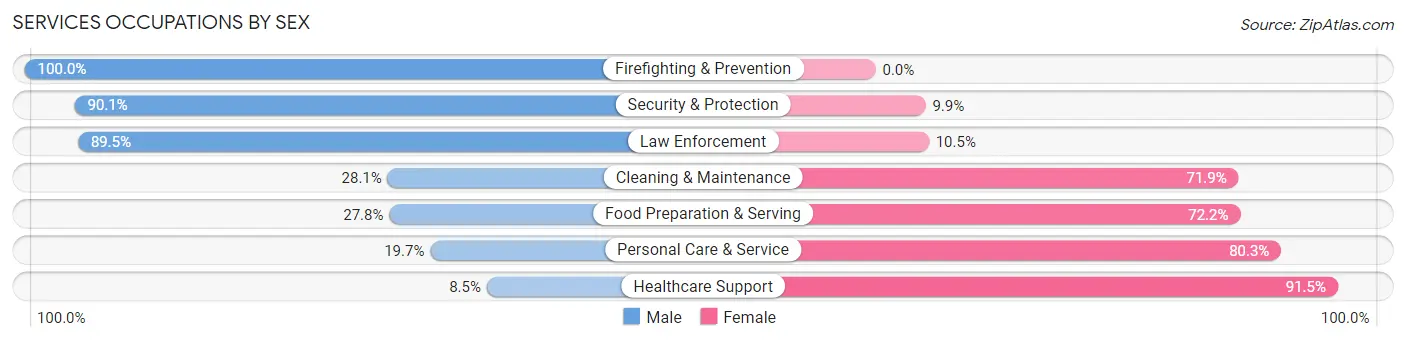
Services Occupations by Sex
Within the Services occupations in Levelland, the most male-oriented occupations are Firefighting & Prevention (100.0%), Security & Protection (90.1%), and Law Enforcement (89.5%), while the most female-oriented occupations are Healthcare Support (91.5%), Personal Care & Service (80.3%), and Food Preparation & Serving (72.2%).
| Occupation | Male | Female |
| Healthcare Support | 16 (8.5%) | 173 (91.5%) |
| Security & Protection | 73 (90.1%) | 8 (9.9%) |
| Firefighting & Prevention | 5 (100.0%) | 0 (0.0%) |
| Law Enforcement | 68 (89.5%) | 8 (10.5%) |
| Food Preparation & Serving | 110 (27.8%) | 286 (72.2%) |
| Cleaning & Maintenance | 54 (28.1%) | 138 (71.9%) |
| Personal Care & Service | 37 (19.7%) | 151 (80.3%) |
| Total (Category) | 290 (27.7%) | 756 (72.3%) |
| Total (Overall) | 2,977 (51.9%) | 2,757 (48.1%) |
Sales and Office Occupations
The most common Sales and Office occupations in Levelland are Sales & Related (536 | 9.3%), and Office & Administration (499 | 8.7%).
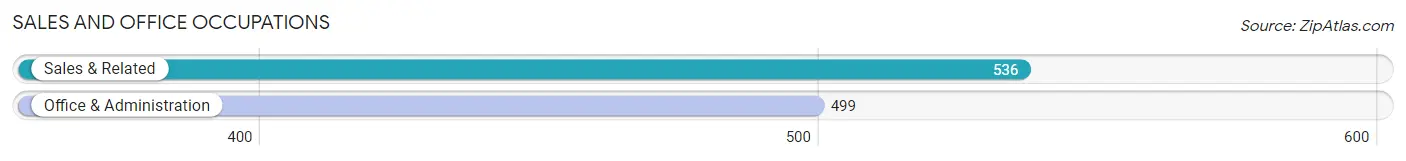
Sales and Office Occupations by Sex
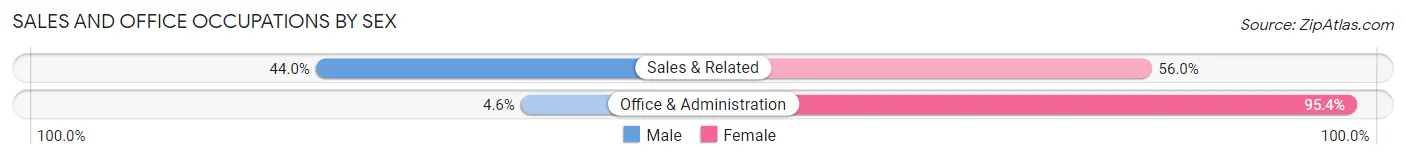
| Occupation | Male | Female |
| Sales & Related | 236 (44.0%) | 300 (56.0%) |
| Office & Administration | 23 (4.6%) | 476 (95.4%) |
| Total (Category) | 259 (25.0%) | 776 (75.0%) |
| Total (Overall) | 2,977 (51.9%) | 2,757 (48.1%) |
Natural Resources, Construction and Maintenance Occupations
The most common Natural Resources, Construction and Maintenance occupations in Levelland are Construction & Extraction (498 | 8.7%), Installation, Maintenance & Repair (249 | 4.3%), and Farming, Fishing & Forestry (112 | 1.9%).
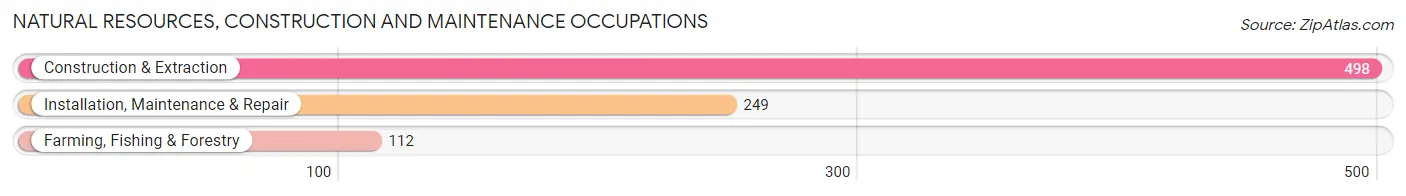
Natural Resources, Construction and Maintenance Occupations by Sex
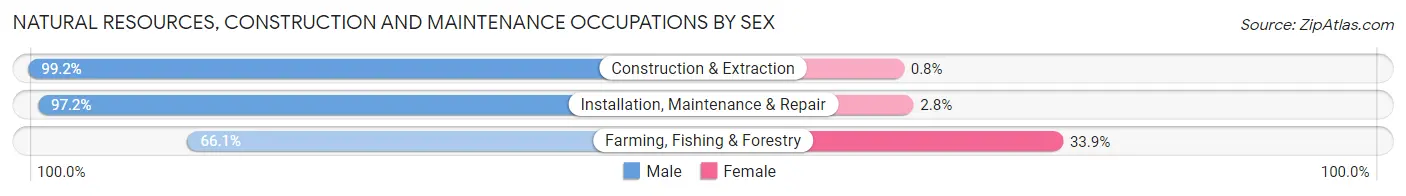
| Occupation | Male | Female |
| Farming, Fishing & Forestry | 74 (66.1%) | 38 (33.9%) |
| Construction & Extraction | 494 (99.2%) | 4 (0.8%) |
| Installation, Maintenance & Repair | 242 (97.2%) | 7 (2.8%) |
| Total (Category) | 810 (94.3%) | 49 (5.7%) |
| Total (Overall) | 2,977 (51.9%) | 2,757 (48.1%) |
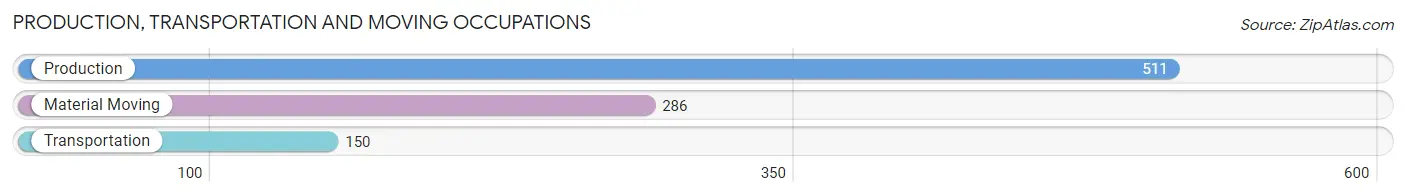
Production, Transportation and Moving Occupations
The most common Production, Transportation and Moving occupations in Levelland are Production (511 | 8.9%), Material Moving (286 | 5.0%), and Transportation (150 | 2.6%).
Production, Transportation and Moving Occupations by Sex
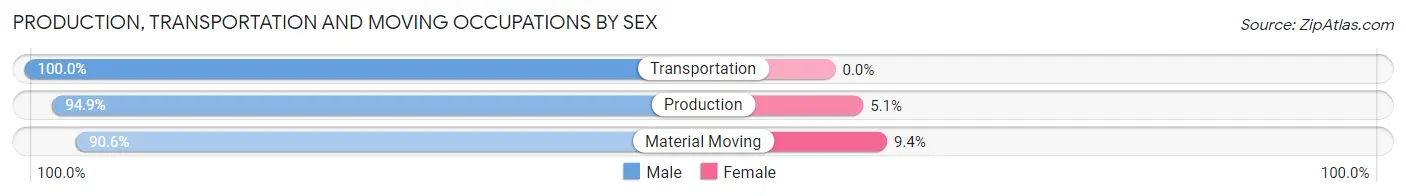
| Occupation | Male | Female |
| Production | 485 (94.9%) | 26 (5.1%) |
| Transportation | 150 (100.0%) | 0 (0.0%) |
| Material Moving | 259 (90.6%) | 27 (9.4%) |
| Total (Category) | 894 (94.4%) | 53 (5.6%) |
| Total (Overall) | 2,977 (51.9%) | 2,757 (48.1%) |
Employment Industries by Sex in Levelland
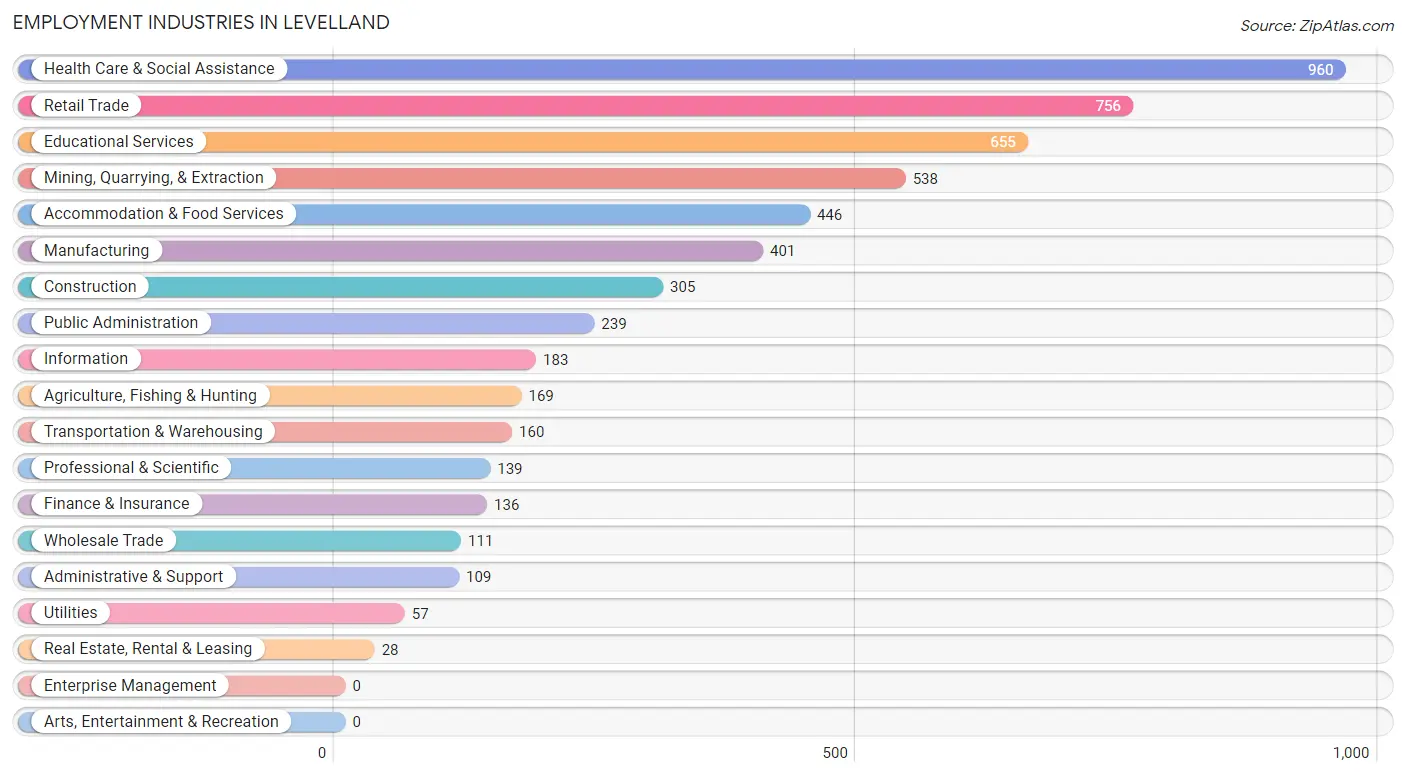
Employment Industries in Levelland
The major employment industries in Levelland include Health Care & Social Assistance (960 | 16.7%), Retail Trade (756 | 13.2%), Educational Services (655 | 11.4%), Mining, Quarrying, & Extraction (538 | 9.4%), and Accommodation & Food Services (446 | 7.8%).
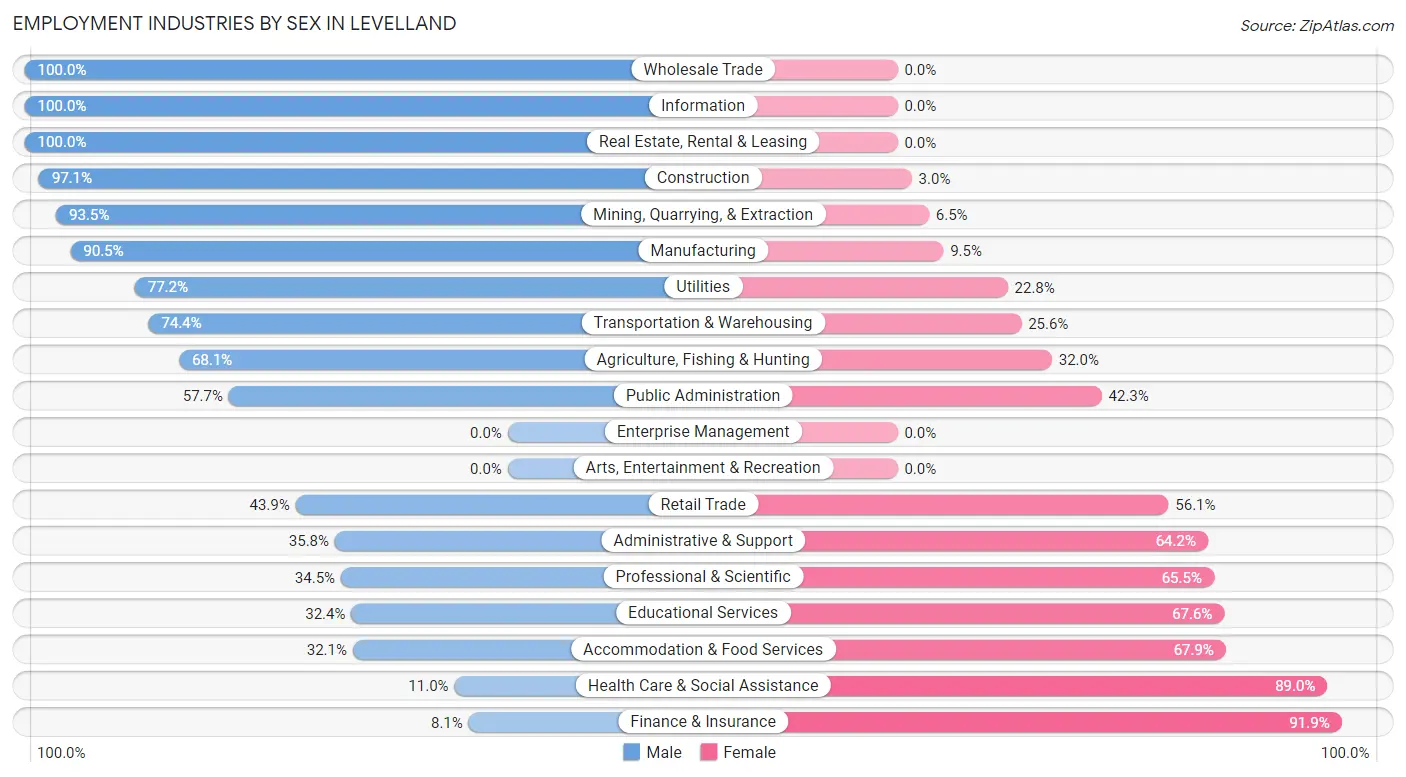
Employment Industries by Sex in Levelland
The Levelland industries that see more men than women are Wholesale Trade (100.0%), Information (100.0%), and Real Estate, Rental & Leasing (100.0%), whereas the industries that tend to have a higher number of women are Finance & Insurance (91.9%), Health Care & Social Assistance (89.0%), and Accommodation & Food Services (67.9%).
| Industry | Male | Female |
| Agriculture, Fishing & Hunting | 115 (68.0%) | 54 (32.0%) |
| Mining, Quarrying, & Extraction | 503 (93.5%) | 35 (6.5%) |
| Construction | 296 (97.1%) | 9 (2.9%) |
| Manufacturing | 363 (90.5%) | 38 (9.5%) |
| Wholesale Trade | 111 (100.0%) | 0 (0.0%) |
| Retail Trade | 332 (43.9%) | 424 (56.1%) |
| Transportation & Warehousing | 119 (74.4%) | 41 (25.6%) |
| Utilities | 44 (77.2%) | 13 (22.8%) |
| Information | 183 (100.0%) | 0 (0.0%) |
| Finance & Insurance | 11 (8.1%) | 125 (91.9%) |
| Real Estate, Rental & Leasing | 28 (100.0%) | 0 (0.0%) |
| Professional & Scientific | 48 (34.5%) | 91 (65.5%) |
| Enterprise Management | 0 (0.0%) | 0 (0.0%) |
| Administrative & Support | 39 (35.8%) | 70 (64.2%) |
| Educational Services | 212 (32.4%) | 443 (67.6%) |
| Health Care & Social Assistance | 106 (11.0%) | 854 (89.0%) |
| Arts, Entertainment & Recreation | 0 (0.0%) | 0 (0.0%) |
| Accommodation & Food Services | 143 (32.1%) | 303 (67.9%) |
| Public Administration | 138 (57.7%) | 101 (42.3%) |
| Total | 2,977 (51.9%) | 2,757 (48.1%) |
Education in Levelland
School Enrollment in Levelland
The most common levels of schooling among the 3,573 students in Levelland are middle school (884 | 24.7%), college / undergraduate (860 | 24.1%), and elementary school (708 | 19.8%).
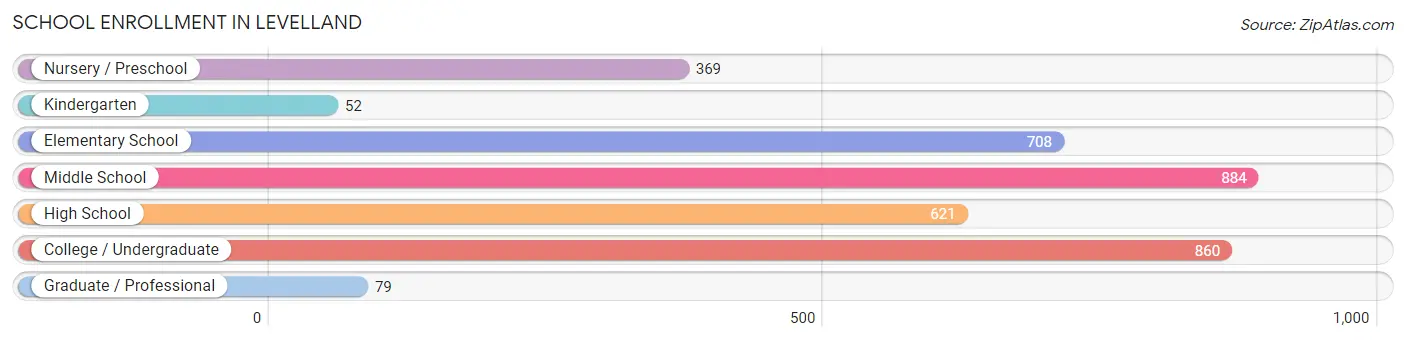
| School Level | # Students | % Students |
| Nursery / Preschool | 369 | 10.3% |
| Kindergarten | 52 | 1.5% |
| Elementary School | 708 | 19.8% |
| Middle School | 884 | 24.7% |
| High School | 621 | 17.4% |
| College / Undergraduate | 860 | 24.1% |
| Graduate / Professional | 79 | 2.2% |
| Total | 3,573 | 100.0% |
School Enrollment by Age by Funding Source in Levelland
Out of a total of 3,573 students who are enrolled in schools in Levelland, 214 (6.0%) attend a private institution, while the remaining 3,359 (94.0%) are enrolled in public schools. The age group of 3 to 4 year olds has the highest likelihood of being enrolled in private schools, with 90 (42.4% in the age bracket) enrolled. Conversely, the age group of 5 to 9 year old has the lowest likelihood of being enrolled in a private school, with 743 (100.0% in the age bracket) attending a public institution.
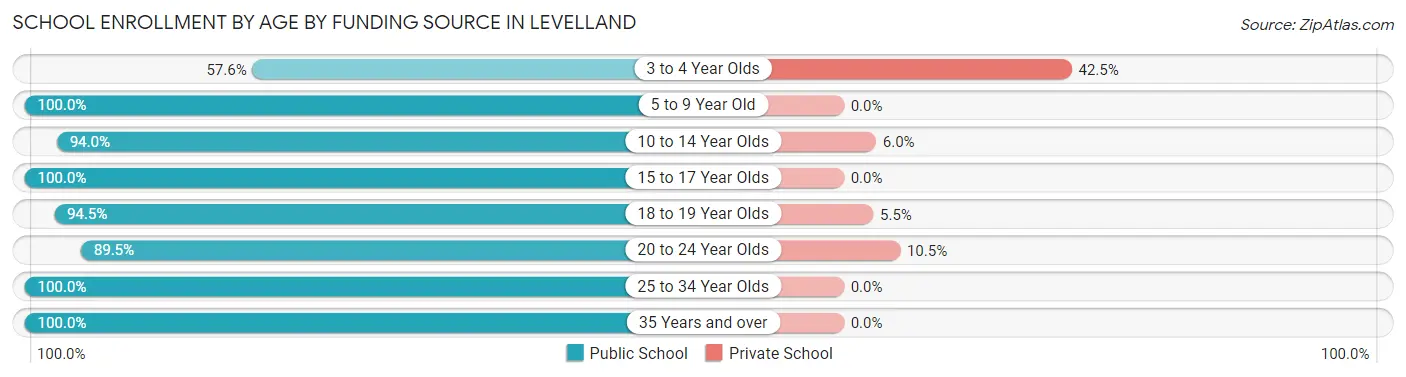
| Age Bracket | Public School | Private School |
| 3 to 4 Year Olds | 122 (57.6%) | 90 (42.4%) |
| 5 to 9 Year Old | 743 (100.0%) | 0 (0.0%) |
| 10 to 14 Year Olds | 1,068 (94.0%) | 68 (6.0%) |
| 15 to 17 Year Olds | 432 (100.0%) | 0 (0.0%) |
| 18 to 19 Year Olds | 431 (94.5%) | 25 (5.5%) |
| 20 to 24 Year Olds | 273 (89.5%) | 32 (10.5%) |
| 25 to 34 Year Olds | 199 (100.0%) | 0 (0.0%) |
| 35 Years and over | 90 (100.0%) | 0 (0.0%) |
| Total | 3,359 (94.0%) | 214 (6.0%) |
Educational Attainment by Field of Study in Levelland
Business (299 | 24.3%), education (272 | 22.1%), science & technology (126 | 10.2%), bio, nature & agricultural (106 | 8.6%), and liberal arts & history (93 | 7.5%) are the most common fields of study among 1,231 individuals in Levelland who have obtained a bachelor's degree or higher.
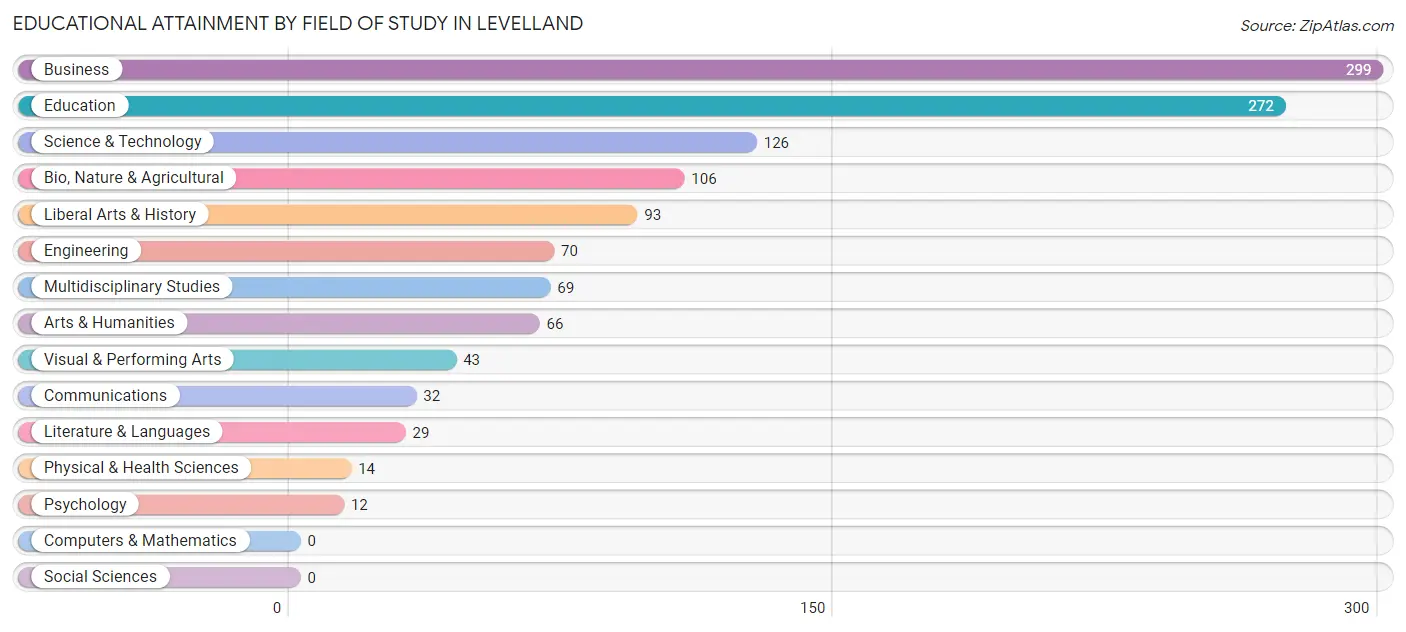
| Field of Study | # Graduates | % Graduates |
| Computers & Mathematics | 0 | 0.0% |
| Bio, Nature & Agricultural | 106 | 8.6% |
| Physical & Health Sciences | 14 | 1.1% |
| Psychology | 12 | 1.0% |
| Social Sciences | 0 | 0.0% |
| Engineering | 70 | 5.7% |
| Multidisciplinary Studies | 69 | 5.6% |
| Science & Technology | 126 | 10.2% |
| Business | 299 | 24.3% |
| Education | 272 | 22.1% |
| Literature & Languages | 29 | 2.4% |
| Liberal Arts & History | 93 | 7.5% |
| Visual & Performing Arts | 43 | 3.5% |
| Communications | 32 | 2.6% |
| Arts & Humanities | 66 | 5.4% |
| Total | 1,231 | 100.0% |
Transportation & Commute in Levelland
Vehicle Availability by Sex in Levelland
The most prevalent vehicle ownership categories in Levelland are males with 2 vehicles (1,116, accounting for 38.5%) and females with 2 vehicles (1,210, making up 42.2%).
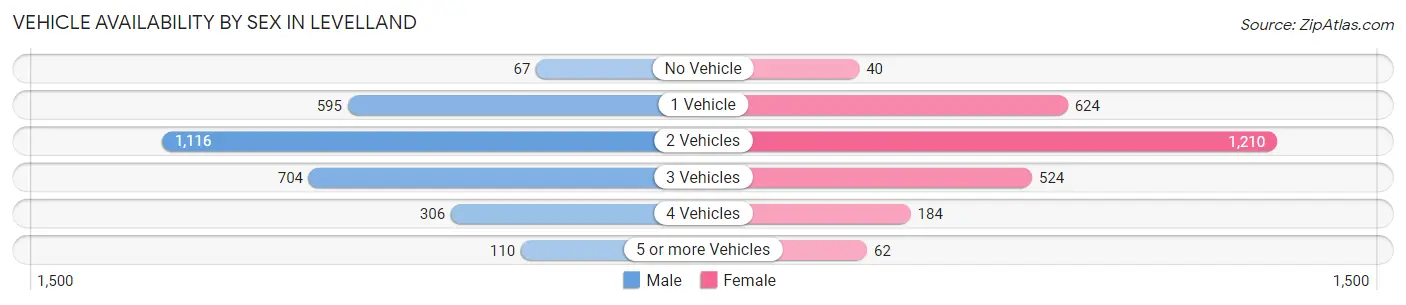
| Vehicles Available | Male | Female |
| No Vehicle | 67 (2.3%) | 40 (1.5%) |
| 1 Vehicle | 595 (20.5%) | 624 (23.6%) |
| 2 Vehicles | 1,116 (38.5%) | 1,210 (45.8%) |
| 3 Vehicles | 704 (24.3%) | 524 (19.8%) |
| 4 Vehicles | 306 (10.6%) | 184 (7.0%) |
| 5 or more Vehicles | 110 (3.8%) | 62 (2.3%) |
| Total | 2,898 (100.0%) | 2,644 (100.0%) |
Commute Time in Levelland
The most frequently occuring commute durations in Levelland are 5 to 9 minutes (1,812 commuters, 32.6%), 10 to 14 minutes (804 commuters, 14.5%), and 30 to 34 minutes (682 commuters, 12.3%).
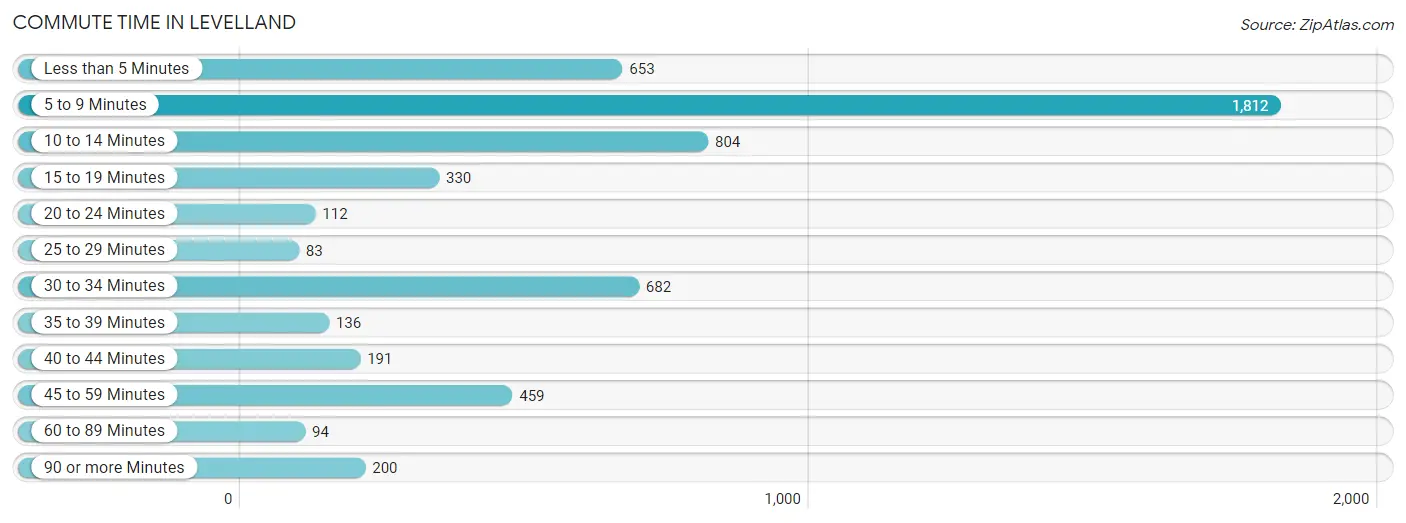
| Commute Time | # Commuters | % Commuters |
| Less than 5 Minutes | 653 | 11.7% |
| 5 to 9 Minutes | 1,812 | 32.6% |
| 10 to 14 Minutes | 804 | 14.5% |
| 15 to 19 Minutes | 330 | 5.9% |
| 20 to 24 Minutes | 112 | 2.0% |
| 25 to 29 Minutes | 83 | 1.5% |
| 30 to 34 Minutes | 682 | 12.3% |
| 35 to 39 Minutes | 136 | 2.5% |
| 40 to 44 Minutes | 191 | 3.4% |
| 45 to 59 Minutes | 459 | 8.3% |
| 60 to 89 Minutes | 94 | 1.7% |
| 90 or more Minutes | 200 | 3.6% |
Commute Time by Sex in Levelland
The most common commute times in Levelland are 5 to 9 minutes (751 commuters, 25.5%) for males and 5 to 9 minutes (1,061 commuters, 40.6%) for females.
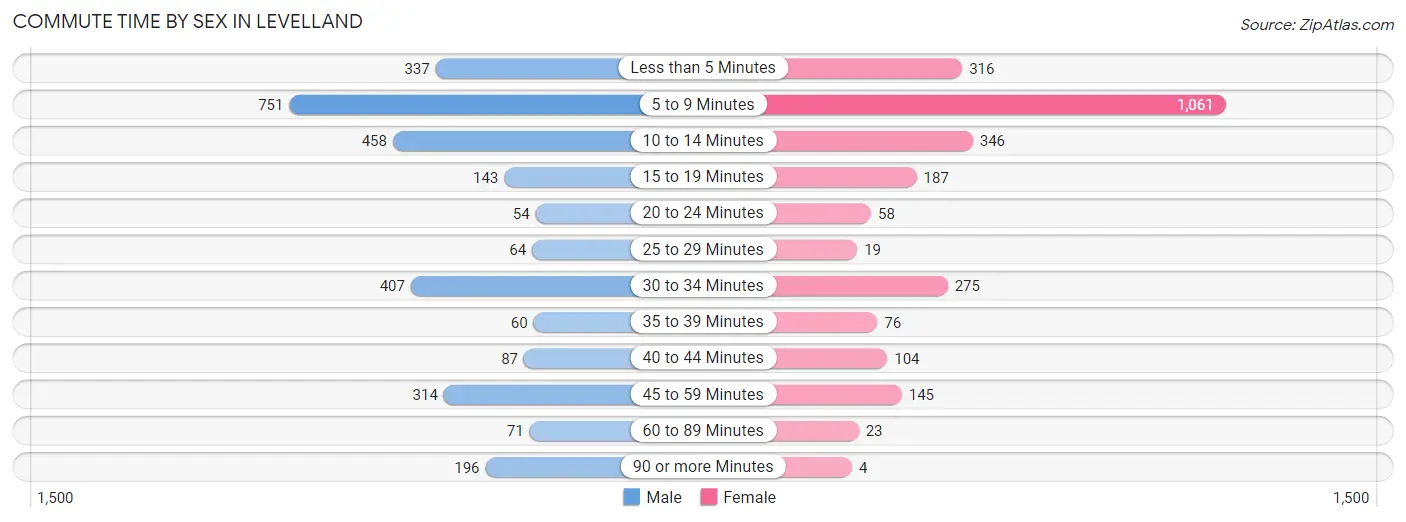
| Commute Time | Male | Female |
| Less than 5 Minutes | 337 (11.5%) | 316 (12.1%) |
| 5 to 9 Minutes | 751 (25.5%) | 1,061 (40.6%) |
| 10 to 14 Minutes | 458 (15.6%) | 346 (13.2%) |
| 15 to 19 Minutes | 143 (4.9%) | 187 (7.1%) |
| 20 to 24 Minutes | 54 (1.8%) | 58 (2.2%) |
| 25 to 29 Minutes | 64 (2.2%) | 19 (0.7%) |
| 30 to 34 Minutes | 407 (13.8%) | 275 (10.5%) |
| 35 to 39 Minutes | 60 (2.0%) | 76 (2.9%) |
| 40 to 44 Minutes | 87 (3.0%) | 104 (4.0%) |
| 45 to 59 Minutes | 314 (10.7%) | 145 (5.6%) |
| 60 to 89 Minutes | 71 (2.4%) | 23 (0.9%) |
| 90 or more Minutes | 196 (6.7%) | 4 (0.2%) |
Time of Departure to Work by Sex in Levelland
The most frequent times of departure to work in Levelland are 7:30 AM to 7:59 AM (429, 14.6%) for males and 7:30 AM to 7:59 AM (736, 28.2%) for females.
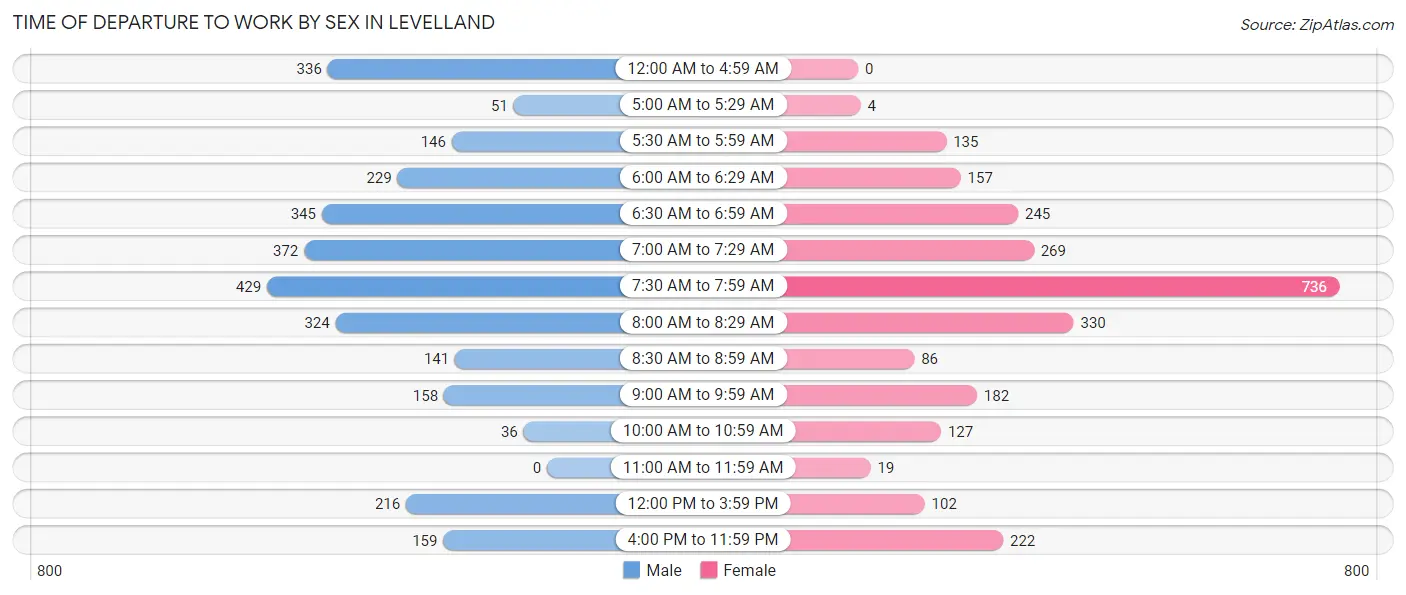
| Time of Departure | Male | Female |
| 12:00 AM to 4:59 AM | 336 (11.4%) | 0 (0.0%) |
| 5:00 AM to 5:29 AM | 51 (1.7%) | 4 (0.2%) |
| 5:30 AM to 5:59 AM | 146 (5.0%) | 135 (5.2%) |
| 6:00 AM to 6:29 AM | 229 (7.8%) | 157 (6.0%) |
| 6:30 AM to 6:59 AM | 345 (11.7%) | 245 (9.4%) |
| 7:00 AM to 7:29 AM | 372 (12.6%) | 269 (10.3%) |
| 7:30 AM to 7:59 AM | 429 (14.6%) | 736 (28.2%) |
| 8:00 AM to 8:29 AM | 324 (11.0%) | 330 (12.6%) |
| 8:30 AM to 8:59 AM | 141 (4.8%) | 86 (3.3%) |
| 9:00 AM to 9:59 AM | 158 (5.4%) | 182 (7.0%) |
| 10:00 AM to 10:59 AM | 36 (1.2%) | 127 (4.9%) |
| 11:00 AM to 11:59 AM | 0 (0.0%) | 19 (0.7%) |
| 12:00 PM to 3:59 PM | 216 (7.3%) | 102 (3.9%) |
| 4:00 PM to 11:59 PM | 159 (5.4%) | 222 (8.5%) |
| Total | 2,942 (100.0%) | 2,614 (100.0%) |
Housing Occupancy in Levelland
Occupancy by Ownership in Levelland
Of the total 4,687 dwellings in Levelland, owner-occupied units account for 3,255 (69.5%), while renter-occupied units make up 1,432 (30.5%).
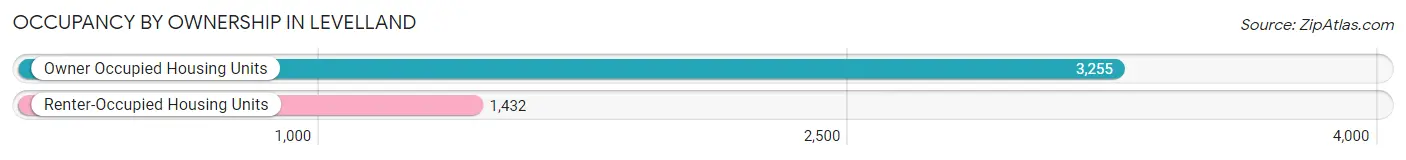
| Occupancy | # Housing Units | % Housing Units |
| Owner Occupied Housing Units | 3,255 | 69.5% |
| Renter-Occupied Housing Units | 1,432 | 30.5% |
| Total Occupied Housing Units | 4,687 | 100.0% |
Occupancy by Household Size in Levelland
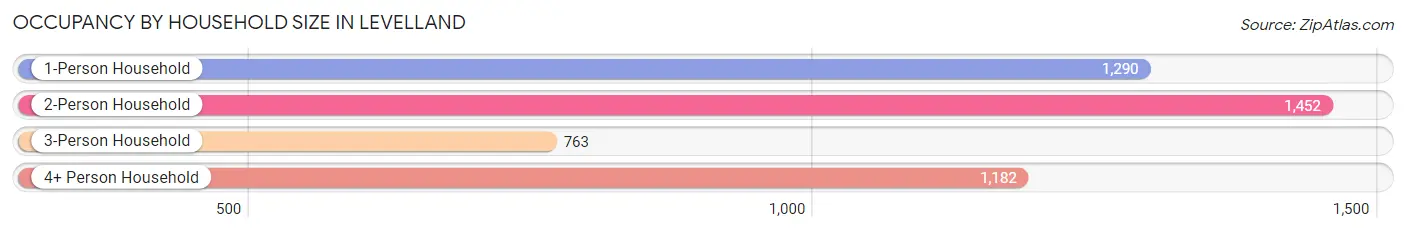
| Household Size | # Housing Units | % Housing Units |
| 1-Person Household | 1,290 | 27.5% |
| 2-Person Household | 1,452 | 31.0% |
| 3-Person Household | 763 | 16.3% |
| 4+ Person Household | 1,182 | 25.2% |
| Total Housing Units | 4,687 | 100.0% |
Occupancy by Ownership by Household Size in Levelland
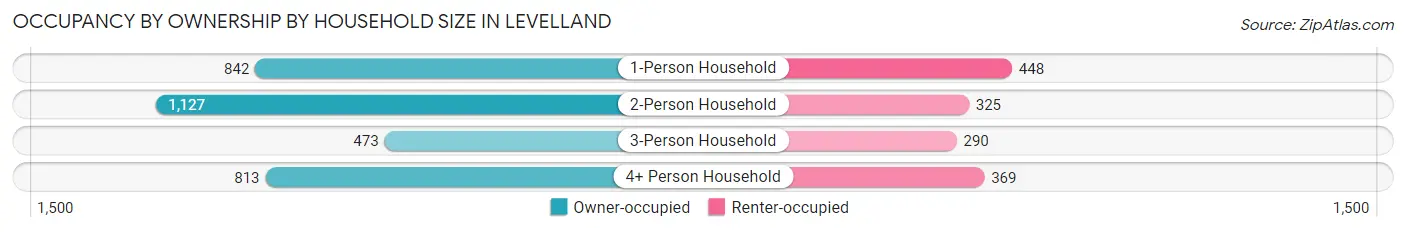
| Household Size | Owner-occupied | Renter-occupied |
| 1-Person Household | 842 (65.3%) | 448 (34.7%) |
| 2-Person Household | 1,127 (77.6%) | 325 (22.4%) |
| 3-Person Household | 473 (62.0%) | 290 (38.0%) |
| 4+ Person Household | 813 (68.8%) | 369 (31.2%) |
| Total Housing Units | 3,255 (69.5%) | 1,432 (30.5%) |
Occupancy by Educational Attainment in Levelland
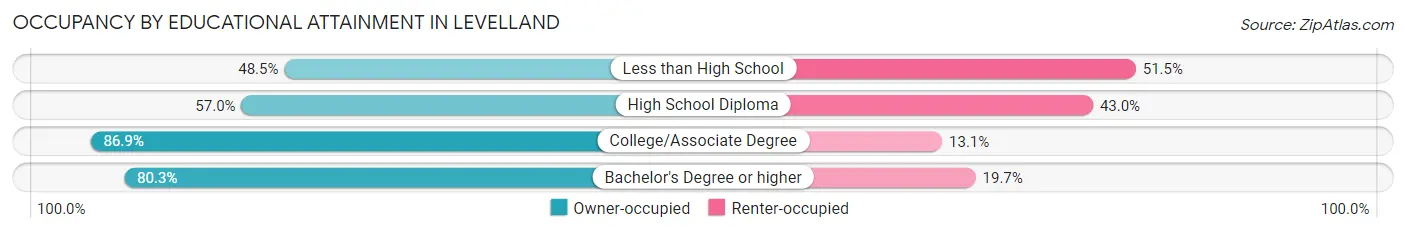
| Household Size | Owner-occupied | Renter-occupied |
| Less than High School | 477 (48.5%) | 506 (51.5%) |
| High School Diploma | 743 (57.0%) | 560 (43.0%) |
| College/Associate Degree | 1,404 (86.9%) | 211 (13.1%) |
| Bachelor's Degree or higher | 631 (80.3%) | 155 (19.7%) |
Occupancy by Age of Householder in Levelland
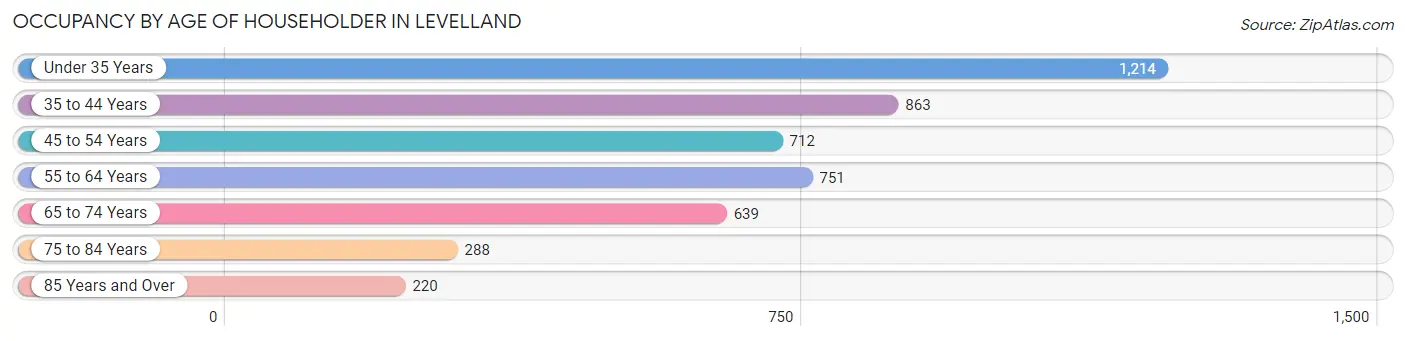
| Age Bracket | # Households | % Households |
| Under 35 Years | 1,214 | 25.9% |
| 35 to 44 Years | 863 | 18.4% |
| 45 to 54 Years | 712 | 15.2% |
| 55 to 64 Years | 751 | 16.0% |
| 65 to 74 Years | 639 | 13.6% |
| 75 to 84 Years | 288 | 6.1% |
| 85 Years and Over | 220 | 4.7% |
| Total | 4,687 | 100.0% |
Housing Finances in Levelland
Median Income by Occupancy in Levelland
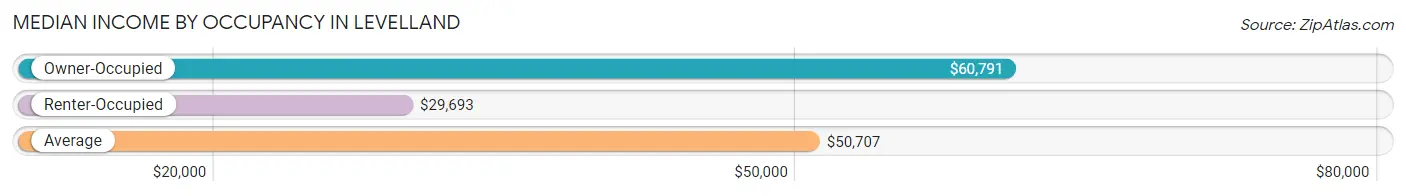
| Occupancy Type | # Households | Median Income |
| Owner-Occupied | 3,255 (69.5%) | $60,791 |
| Renter-Occupied | 1,432 (30.5%) | $29,693 |
| Average | 4,687 (100.0%) | $50,707 |
Occupancy by Householder Income Bracket in Levelland
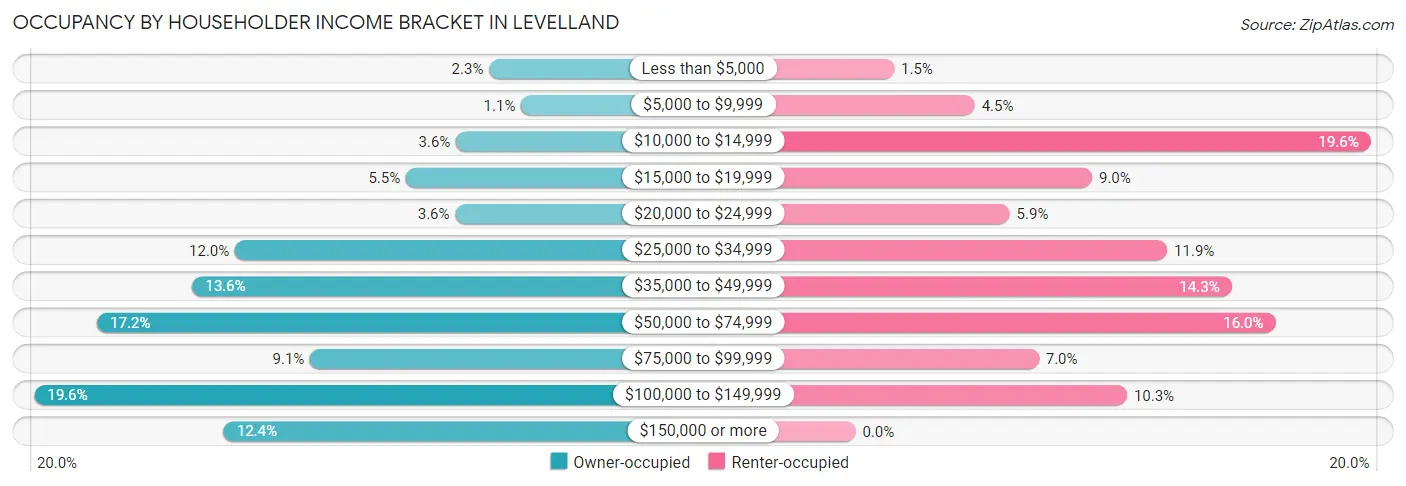
| Income Bracket | Owner-occupied | Renter-occupied |
| Less than $5,000 | 75 (2.3%) | 21 (1.5%) |
| $5,000 to $9,999 | 35 (1.1%) | 65 (4.5%) |
| $10,000 to $14,999 | 116 (3.6%) | 281 (19.6%) |
| $15,000 to $19,999 | 178 (5.5%) | 129 (9.0%) |
| $20,000 to $24,999 | 117 (3.6%) | 84 (5.9%) |
| $25,000 to $34,999 | 390 (12.0%) | 170 (11.9%) |
| $35,000 to $49,999 | 443 (13.6%) | 205 (14.3%) |
| $50,000 to $74,999 | 561 (17.2%) | 229 (16.0%) |
| $75,000 to $99,999 | 297 (9.1%) | 100 (7.0%) |
| $100,000 to $149,999 | 639 (19.6%) | 148 (10.3%) |
| $150,000 or more | 404 (12.4%) | 0 (0.0%) |
| Total | 3,255 (100.0%) | 1,432 (100.0%) |
Monthly Housing Cost Tiers in Levelland
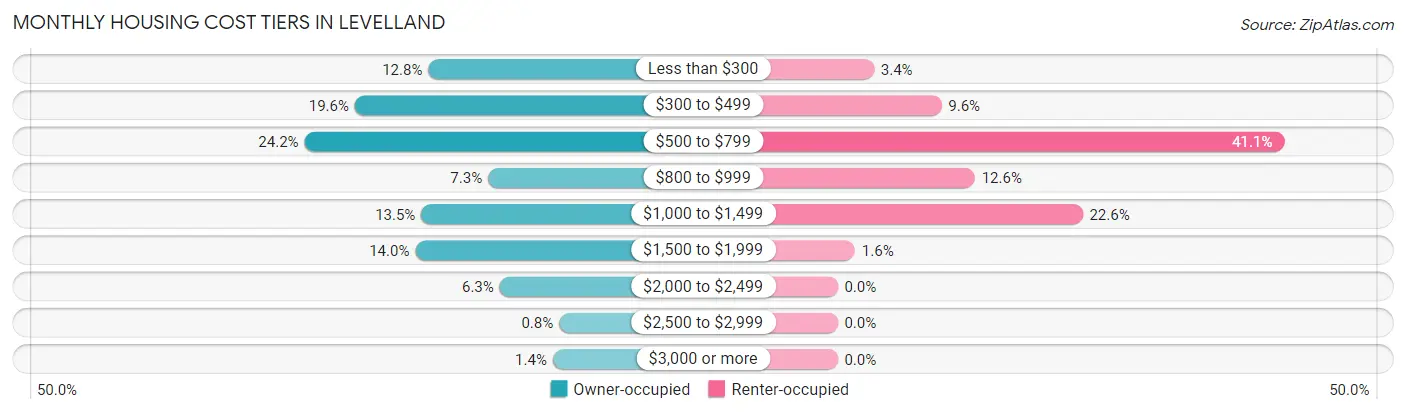
| Monthly Cost | Owner-occupied | Renter-occupied |
| Less than $300 | 418 (12.8%) | 48 (3.4%) |
| $300 to $499 | 638 (19.6%) | 137 (9.6%) |
| $500 to $799 | 789 (24.2%) | 589 (41.1%) |
| $800 to $999 | 239 (7.3%) | 181 (12.6%) |
| $1,000 to $1,499 | 439 (13.5%) | 323 (22.6%) |
| $1,500 to $1,999 | 457 (14.0%) | 23 (1.6%) |
| $2,000 to $2,499 | 204 (6.3%) | 0 (0.0%) |
| $2,500 to $2,999 | 26 (0.8%) | 0 (0.0%) |
| $3,000 or more | 45 (1.4%) | 0 (0.0%) |
| Total | 3,255 (100.0%) | 1,432 (100.0%) |
Physical Housing Characteristics in Levelland
Housing Structures in Levelland
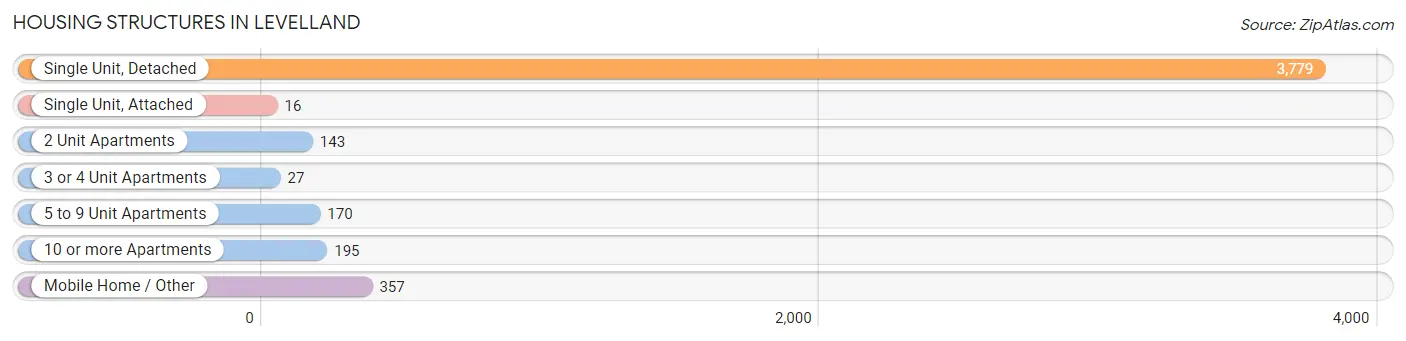
| Structure Type | # Housing Units | % Housing Units |
| Single Unit, Detached | 3,779 | 80.6% |
| Single Unit, Attached | 16 | 0.3% |
| 2 Unit Apartments | 143 | 3.0% |
| 3 or 4 Unit Apartments | 27 | 0.6% |
| 5 to 9 Unit Apartments | 170 | 3.6% |
| 10 or more Apartments | 195 | 4.2% |
| Mobile Home / Other | 357 | 7.6% |
| Total | 4,687 | 100.0% |
Housing Structures by Occupancy in Levelland
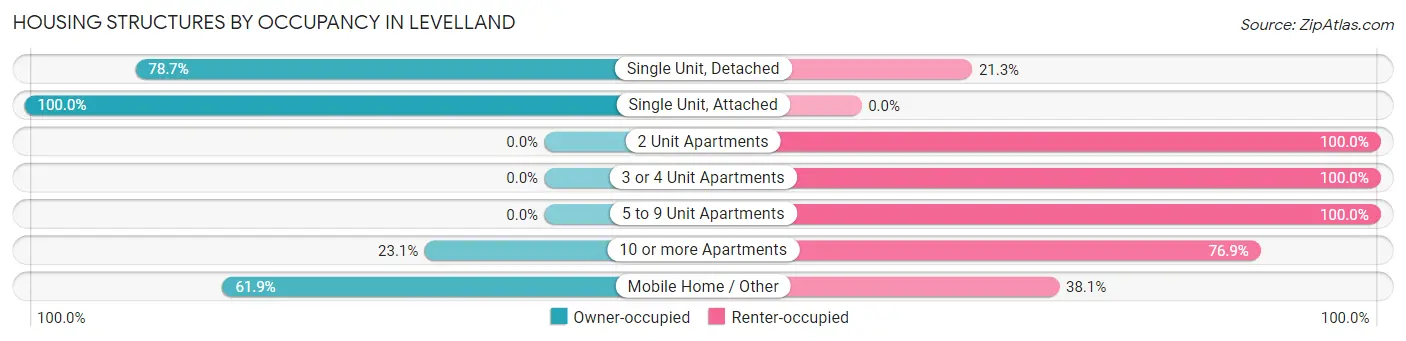
| Structure Type | Owner-occupied | Renter-occupied |
| Single Unit, Detached | 2,973 (78.7%) | 806 (21.3%) |
| Single Unit, Attached | 16 (100.0%) | 0 (0.0%) |
| 2 Unit Apartments | 0 (0.0%) | 143 (100.0%) |
| 3 or 4 Unit Apartments | 0 (0.0%) | 27 (100.0%) |
| 5 to 9 Unit Apartments | 0 (0.0%) | 170 (100.0%) |
| 10 or more Apartments | 45 (23.1%) | 150 (76.9%) |
| Mobile Home / Other | 221 (61.9%) | 136 (38.1%) |
| Total | 3,255 (69.5%) | 1,432 (30.5%) |
Housing Structures by Number of Rooms in Levelland
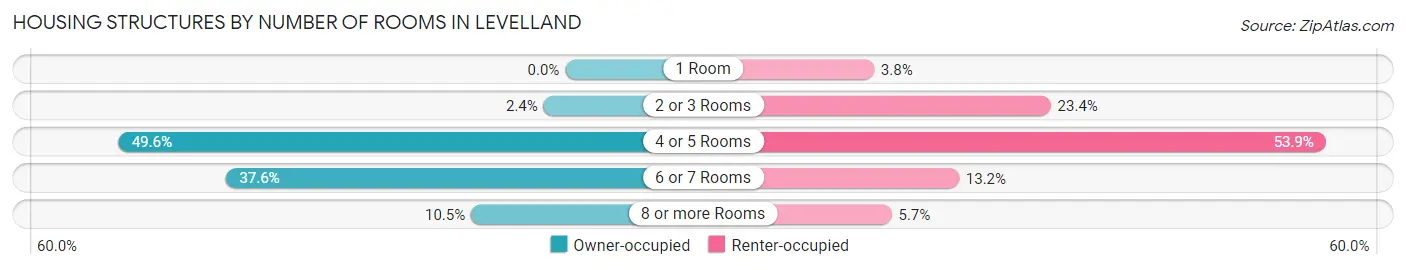
| Number of Rooms | Owner-occupied | Renter-occupied |
| 1 Room | 0 (0.0%) | 54 (3.8%) |
| 2 or 3 Rooms | 78 (2.4%) | 335 (23.4%) |
| 4 or 5 Rooms | 1,613 (49.5%) | 772 (53.9%) |
| 6 or 7 Rooms | 1,224 (37.6%) | 189 (13.2%) |
| 8 or more Rooms | 340 (10.4%) | 82 (5.7%) |
| Total | 3,255 (100.0%) | 1,432 (100.0%) |
Housing Structure by Heating Type in Levelland
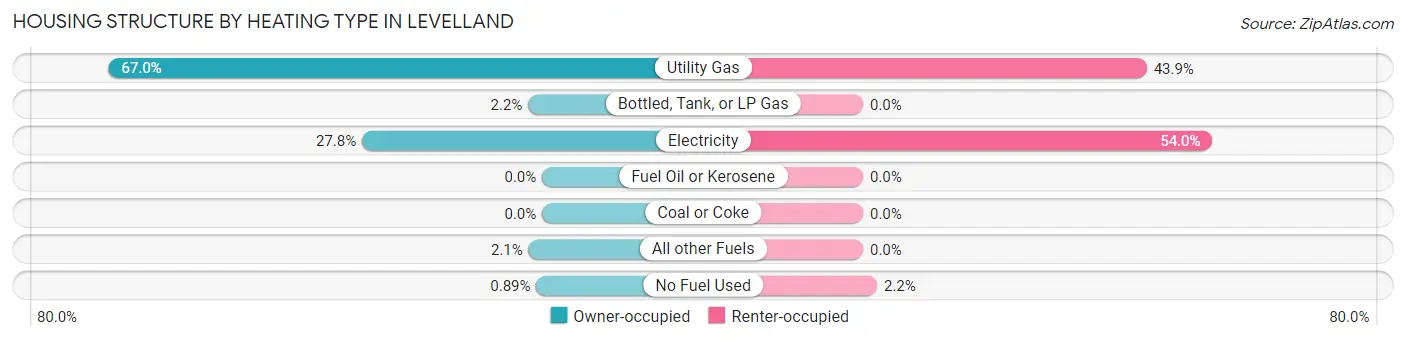
| Heating Type | Owner-occupied | Renter-occupied |
| Utility Gas | 2,182 (67.0%) | 628 (43.9%) |
| Bottled, Tank, or LP Gas | 70 (2.1%) | 0 (0.0%) |
| Electricity | 906 (27.8%) | 773 (54.0%) |
| Fuel Oil or Kerosene | 0 (0.0%) | 0 (0.0%) |
| Coal or Coke | 0 (0.0%) | 0 (0.0%) |
| All other Fuels | 68 (2.1%) | 0 (0.0%) |
| No Fuel Used | 29 (0.9%) | 31 (2.2%) |
| Total | 3,255 (100.0%) | 1,432 (100.0%) |
Household Vehicle Usage in Levelland
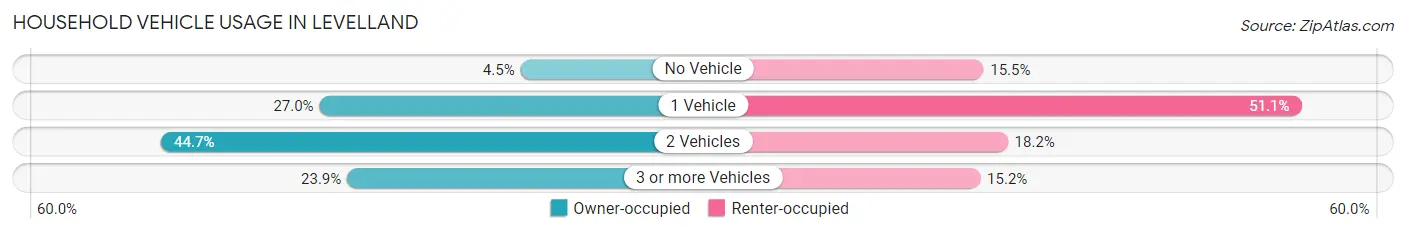
| Vehicles per Household | Owner-occupied | Renter-occupied |
| No Vehicle | 145 (4.4%) | 222 (15.5%) |
| 1 Vehicle | 878 (27.0%) | 732 (51.1%) |
| 2 Vehicles | 1,455 (44.7%) | 261 (18.2%) |
| 3 or more Vehicles | 777 (23.9%) | 217 (15.1%) |
| Total | 3,255 (100.0%) | 1,432 (100.0%) |
Real Estate & Mortgages in Levelland
Real Estate and Mortgage Overview in Levelland
| Characteristic | Without Mortgage | With Mortgage |
| Housing Units | 1,938 | 1,317 |
| Median Property Value | $85,100 | $171,200 |
| Median Household Income | $41,156 | $387 |
| Monthly Housing Costs | $460 | $45 |
| Real Estate Taxes | $1,379 | $25 |
Property Value by Mortgage Status in Levelland
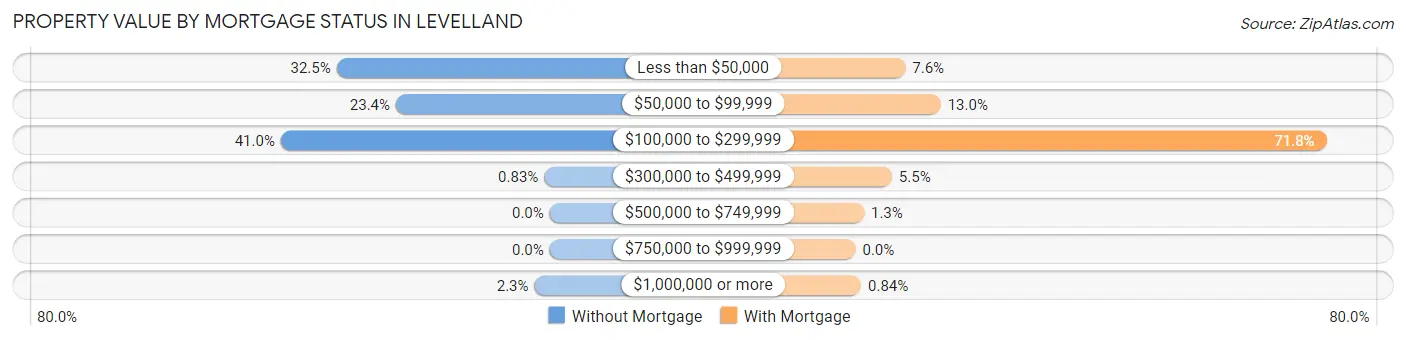
| Property Value | Without Mortgage | With Mortgage |
| Less than $50,000 | 629 (32.5%) | 100 (7.6%) |
| $50,000 to $99,999 | 454 (23.4%) | 171 (13.0%) |
| $100,000 to $299,999 | 794 (41.0%) | 945 (71.8%) |
| $300,000 to $499,999 | 16 (0.8%) | 73 (5.5%) |
| $500,000 to $749,999 | 0 (0.0%) | 17 (1.3%) |
| $750,000 to $999,999 | 0 (0.0%) | 0 (0.0%) |
| $1,000,000 or more | 45 (2.3%) | 11 (0.8%) |
| Total | 1,938 (100.0%) | 1,317 (100.0%) |
Household Income by Mortgage Status in Levelland
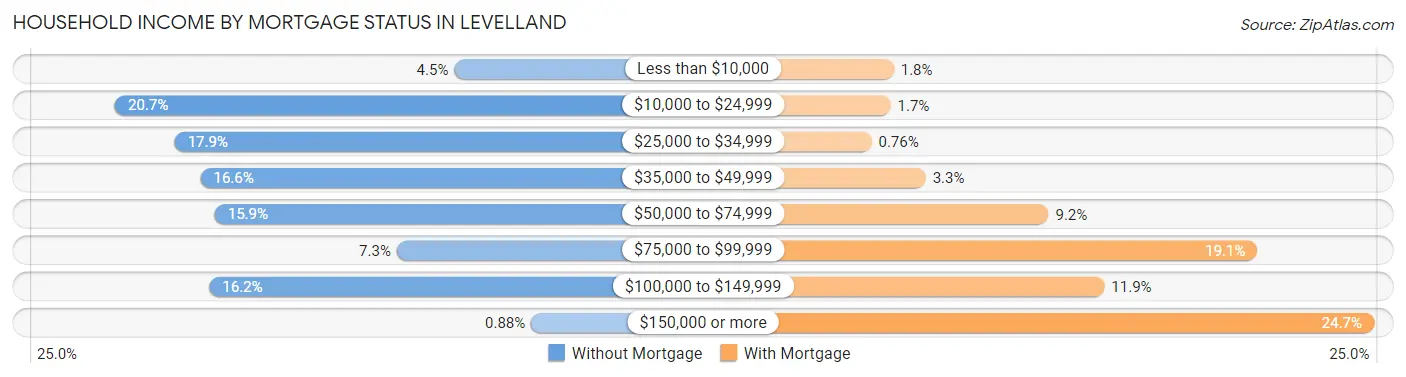
| Household Income | Without Mortgage | With Mortgage |
| Less than $10,000 | 88 (4.5%) | 24 (1.8%) |
| $10,000 to $24,999 | 401 (20.7%) | 22 (1.7%) |
| $25,000 to $34,999 | 346 (17.8%) | 10 (0.8%) |
| $35,000 to $49,999 | 322 (16.6%) | 44 (3.3%) |
| $50,000 to $74,999 | 309 (15.9%) | 121 (9.2%) |
| $75,000 to $99,999 | 141 (7.3%) | 252 (19.1%) |
| $100,000 to $149,999 | 314 (16.2%) | 156 (11.8%) |
| $150,000 or more | 17 (0.9%) | 325 (24.7%) |
| Total | 1,938 (100.0%) | 1,317 (100.0%) |
Property Value to Household Income Ratio in Levelland
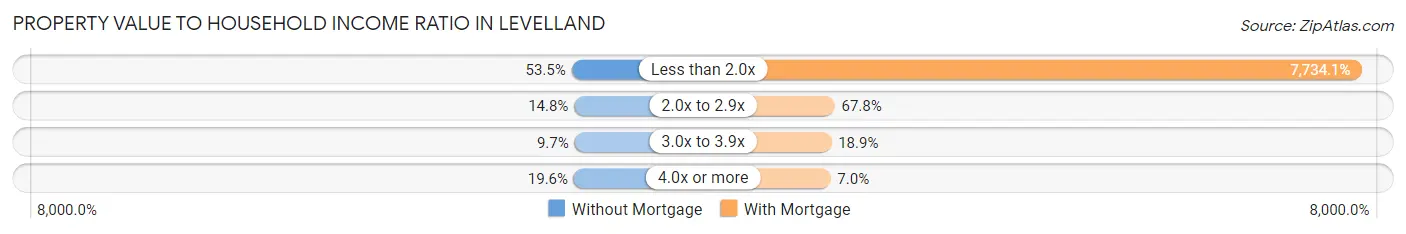
| Value-to-Income Ratio | Without Mortgage | With Mortgage |
| Less than 2.0x | 1,036 (53.5%) | 101,858 (7,734.1%) |
| 2.0x to 2.9x | 286 (14.8%) | 893 (67.8%) |
| 3.0x to 3.9x | 187 (9.7%) | 249 (18.9%) |
| 4.0x or more | 380 (19.6%) | 92 (7.0%) |
| Total | 1,938 (100.0%) | 1,317 (100.0%) |
Real Estate Taxes by Mortgage Status in Levelland
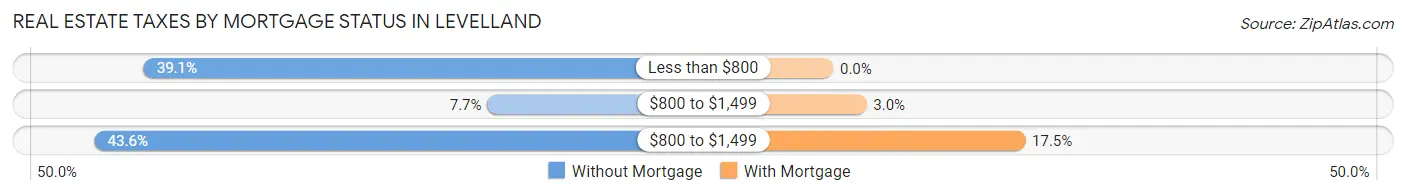
| Property Taxes | Without Mortgage | With Mortgage |
| Less than $800 | 758 (39.1%) | 0 (0.0%) |
| $800 to $1,499 | 150 (7.7%) | 40 (3.0%) |
| $800 to $1,499 | 845 (43.6%) | 231 (17.5%) |
| Total | 1,938 (100.0%) | 1,317 (100.0%) |
Health & Disability in Levelland
Health Insurance Coverage by Age in Levelland
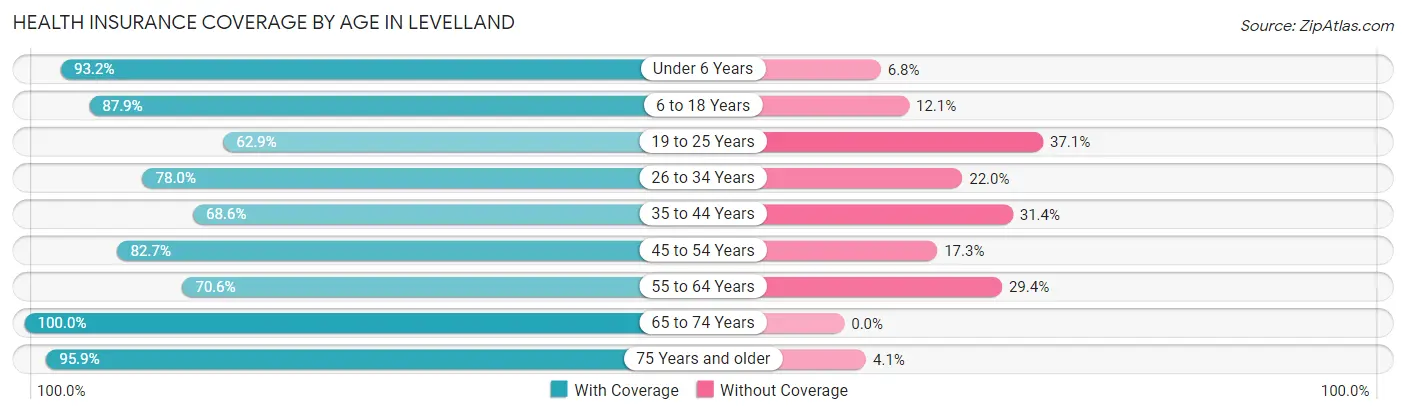
| Age Bracket | With Coverage | Without Coverage |
| Under 6 Years | 1,001 (93.2%) | 73 (6.8%) |
| 6 to 18 Years | 2,176 (87.9%) | 299 (12.1%) |
| 19 to 25 Years | 983 (62.9%) | 579 (37.1%) |
| 26 to 34 Years | 1,166 (78.0%) | 329 (22.0%) |
| 35 to 44 Years | 1,098 (68.6%) | 503 (31.4%) |
| 45 to 54 Years | 997 (82.7%) | 209 (17.3%) |
| 55 to 64 Years | 996 (70.6%) | 415 (29.4%) |
| 65 to 74 Years | 902 (100.0%) | 0 (0.0%) |
| 75 Years and older | 638 (95.9%) | 27 (4.1%) |
| Total | 9,957 (80.4%) | 2,434 (19.6%) |
Health Insurance Coverage by Citizenship Status in Levelland
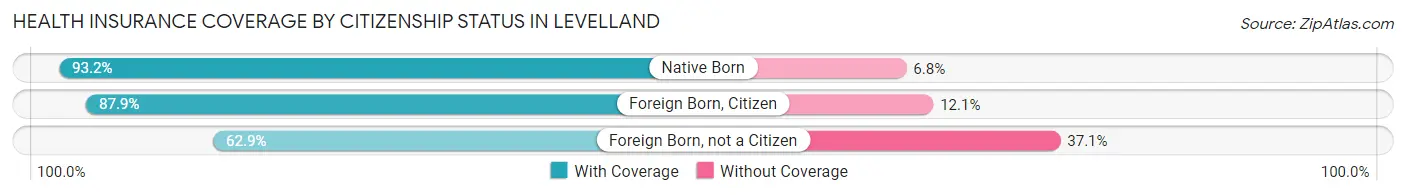
| Citizenship Status | With Coverage | Without Coverage |
| Native Born | 1,001 (93.2%) | 73 (6.8%) |
| Foreign Born, Citizen | 2,176 (87.9%) | 299 (12.1%) |
| Foreign Born, not a Citizen | 983 (62.9%) | 579 (37.1%) |
Health Insurance Coverage by Household Income in Levelland
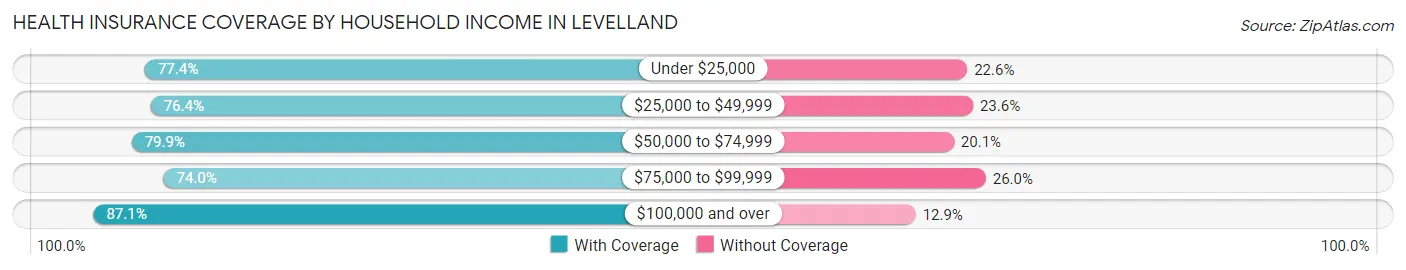
| Household Income | With Coverage | Without Coverage |
| Under $25,000 | 1,579 (77.4%) | 460 (22.6%) |
| $25,000 to $49,999 | 2,093 (76.4%) | 648 (23.6%) |
| $50,000 to $74,999 | 1,924 (79.9%) | 483 (20.1%) |
| $75,000 to $99,999 | 832 (74.0%) | 293 (26.0%) |
| $100,000 and over | 3,211 (87.1%) | 476 (12.9%) |
Public vs Private Health Insurance Coverage by Age in Levelland
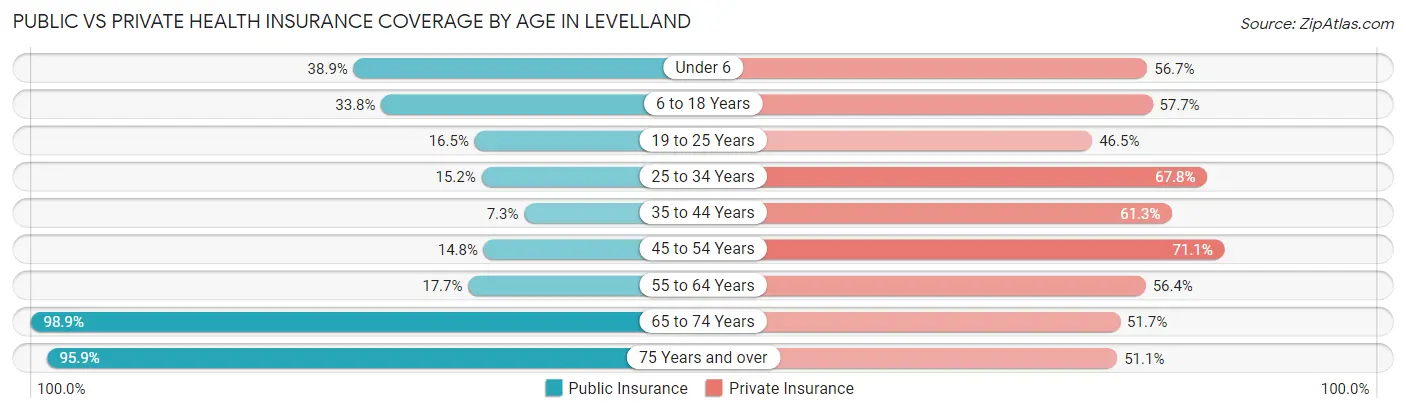
| Age Bracket | Public Insurance | Private Insurance |
| Under 6 | 418 (38.9%) | 609 (56.7%) |
| 6 to 18 Years | 836 (33.8%) | 1,427 (57.7%) |
| 19 to 25 Years | 257 (16.5%) | 726 (46.5%) |
| 25 to 34 Years | 227 (15.2%) | 1,014 (67.8%) |
| 35 to 44 Years | 116 (7.2%) | 982 (61.3%) |
| 45 to 54 Years | 178 (14.8%) | 857 (71.1%) |
| 55 to 64 Years | 249 (17.6%) | 796 (56.4%) |
| 65 to 74 Years | 892 (98.9%) | 466 (51.7%) |
| 75 Years and over | 638 (95.9%) | 340 (51.1%) |
| Total | 3,811 (30.8%) | 7,217 (58.2%) |
Disability Status by Sex by Age in Levelland
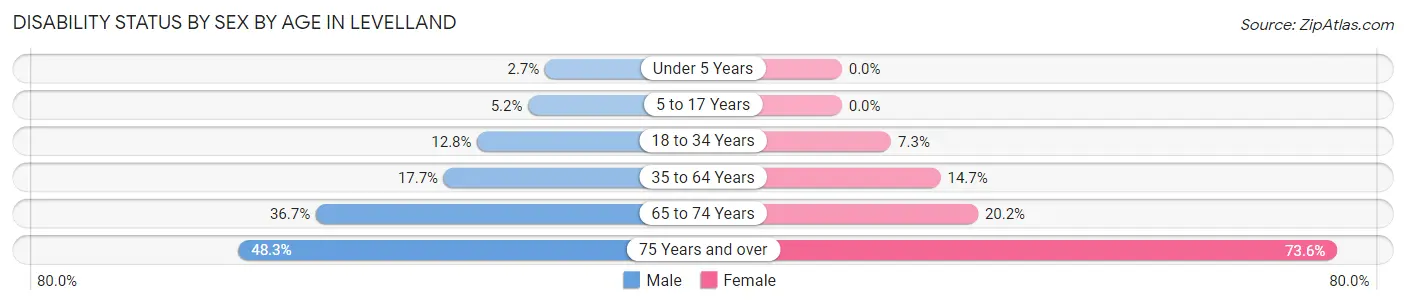
| Age Bracket | Male | Female |
| Under 5 Years | 14 (2.7%) | 0 (0.0%) |
| 5 to 17 Years | 68 (5.2%) | 0 (0.0%) |
| 18 to 34 Years | 210 (12.8%) | 121 (7.3%) |
| 35 to 64 Years | 350 (17.7%) | 329 (14.7%) |
| 65 to 74 Years | 166 (36.7%) | 91 (20.2%) |
| 75 Years and over | 111 (48.3%) | 320 (73.6%) |
Disability Class by Sex by Age in Levelland
Disability Class: Hearing Difficulty
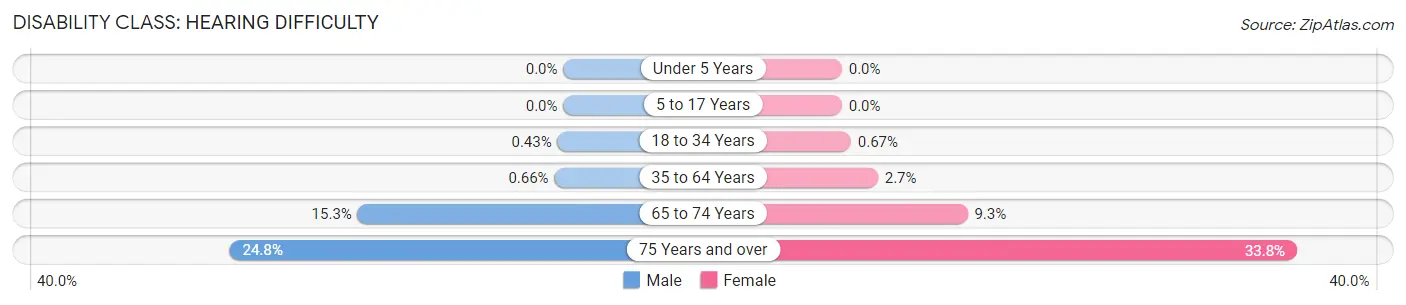
| Age Bracket | Male | Female |
| Under 5 Years | 0 (0.0%) | 0 (0.0%) |
| 5 to 17 Years | 0 (0.0%) | 0 (0.0%) |
| 18 to 34 Years | 7 (0.4%) | 11 (0.7%) |
| 35 to 64 Years | 13 (0.7%) | 60 (2.7%) |
| 65 to 74 Years | 69 (15.3%) | 42 (9.3%) |
| 75 Years and over | 57 (24.8%) | 147 (33.8%) |
Disability Class: Vision Difficulty
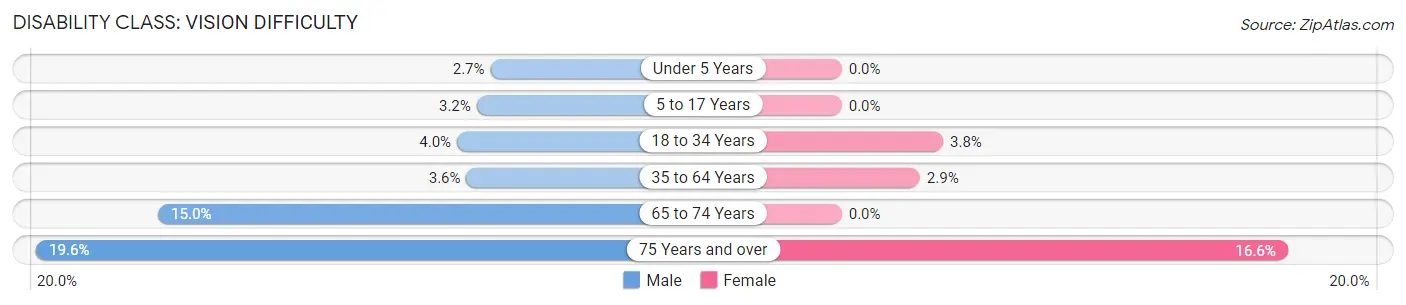
| Age Bracket | Male | Female |
| Under 5 Years | 14 (2.7%) | 0 (0.0%) |
| 5 to 17 Years | 42 (3.2%) | 0 (0.0%) |
| 18 to 34 Years | 65 (4.0%) | 62 (3.8%) |
| 35 to 64 Years | 71 (3.6%) | 65 (2.9%) |
| 65 to 74 Years | 68 (15.0%) | 0 (0.0%) |
| 75 Years and over | 45 (19.6%) | 72 (16.6%) |
Disability Class: Cognitive Difficulty
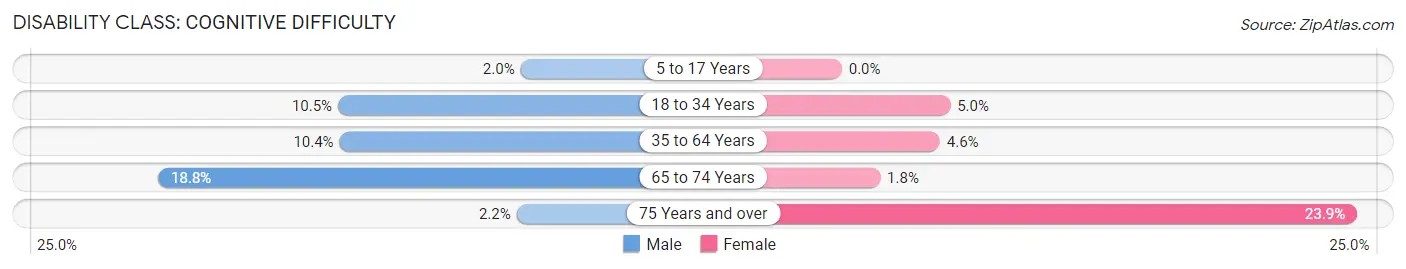
| Age Bracket | Male | Female |
| 5 to 17 Years | 26 (2.0%) | 0 (0.0%) |
| 18 to 34 Years | 172 (10.5%) | 83 (5.0%) |
| 35 to 64 Years | 205 (10.4%) | 102 (4.5%) |
| 65 to 74 Years | 85 (18.8%) | 8 (1.8%) |
| 75 Years and over | 5 (2.2%) | 104 (23.9%) |
Disability Class: Ambulatory Difficulty
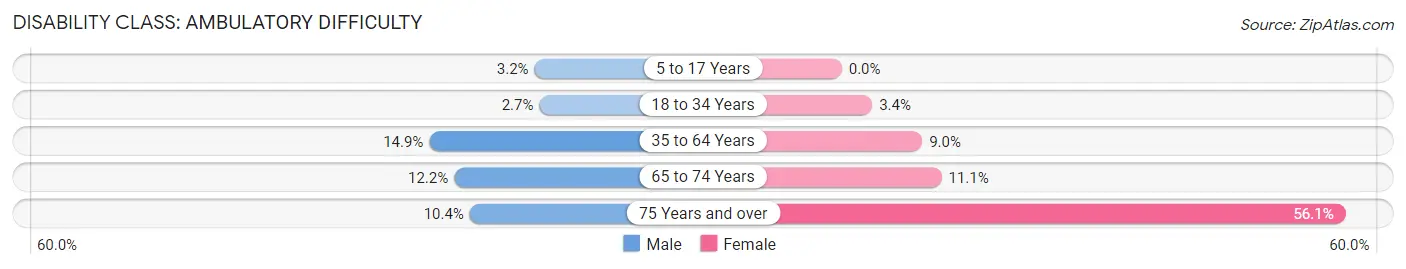
| Age Bracket | Male | Female |
| 5 to 17 Years | 42 (3.2%) | 0 (0.0%) |
| 18 to 34 Years | 44 (2.7%) | 56 (3.4%) |
| 35 to 64 Years | 295 (14.9%) | 201 (9.0%) |
| 65 to 74 Years | 55 (12.2%) | 50 (11.1%) |
| 75 Years and over | 24 (10.4%) | 244 (56.1%) |
Disability Class: Self-Care Difficulty
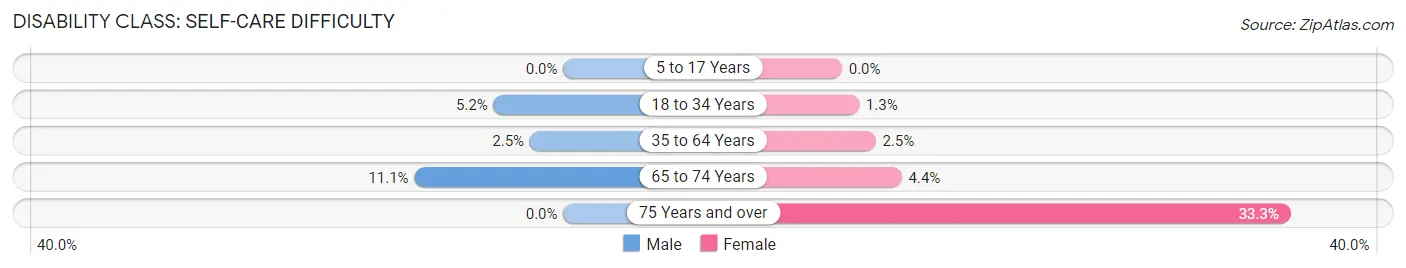
| Age Bracket | Male | Female |
| 5 to 17 Years | 0 (0.0%) | 0 (0.0%) |
| 18 to 34 Years | 85 (5.2%) | 21 (1.3%) |
| 35 to 64 Years | 49 (2.5%) | 56 (2.5%) |
| 65 to 74 Years | 50 (11.1%) | 20 (4.4%) |
| 75 Years and over | 0 (0.0%) | 145 (33.3%) |
Technology Access in Levelland
Computing Device Access in Levelland
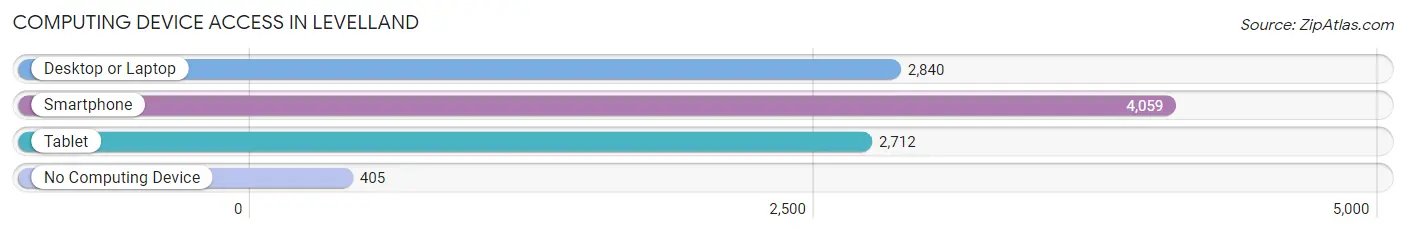
| Device Type | # Households | % Households |
| Desktop or Laptop | 2,840 | 60.6% |
| Smartphone | 4,059 | 86.6% |
| Tablet | 2,712 | 57.9% |
| No Computing Device | 405 | 8.6% |
| Total | 4,687 | 100.0% |
Internet Access in Levelland
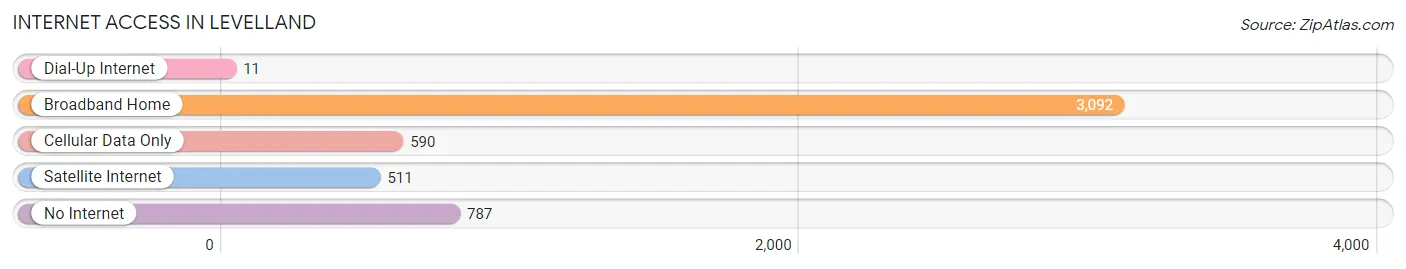
| Internet Type | # Households | % Households |
| Dial-Up Internet | 11 | 0.2% |
| Broadband Home | 3,092 | 66.0% |
| Cellular Data Only | 590 | 12.6% |
| Satellite Internet | 511 | 10.9% |
| No Internet | 787 | 16.8% |
| Total | 4,687 | 100.0% |
Levelland Summary
Levelland, Texas is a city located in Hockley County, Texas, United States. It is the county seat of Hockley County and is located in the South Plains region of the state. The population of Levelland was 13,542 at the 2010 census.
History
Levelland was founded in 1906 by the Hockley Land and Cattle Company. The town was named after Thomas Levelland, a local rancher and businessman. The town was incorporated in 1911 and the first mayor was elected in 1912.
Levelland was a small farming and ranching community until the discovery of oil in the area in the 1920s. This led to a boom in the local economy and population. The population of Levelland grew from 1,000 in 1920 to over 10,000 by 1930.
The economy of Levelland was further diversified in the 1940s with the establishment of a cotton gin and a cottonseed oil mill. The city also became a center for the production of cotton and grain.
Geography
Levelland is located in the South Plains region of Texas, about 30 miles east of Lubbock. The city is situated on the Llano Estacado, a large plateau that stretches across the Texas Panhandle and into New Mexico. The city is located at the intersection of U.S. Highway 84 and State Highway 114.
The climate in Levelland is semi-arid, with hot summers and mild winters. The average annual temperature is 64°F (18°C). The average annual precipitation is 19.5 inches (49.5 cm).
Economy
The economy of Levelland is largely based on agriculture and oil production. The city is home to several large cotton gins and cottonseed oil mills. The city is also home to several large grain elevators.
Levelland is also home to several manufacturing companies, including a large wind turbine manufacturing plant. The city is also home to several retail stores, restaurants, and other businesses.
Demographics
As of the 2010 census, the population of Levelland was 13,542. The racial makeup of the city was 75.3% White, 0.9% African American, 0.7% Native American, 0.4% Asian, 0.1% Pacific Islander, 19.7% from other races, and 3.1% from two or more races. Hispanic or Latino of any race were 37.2% of the population.
The median income for a household in Levelland was $35,945, and the median income for a family was $41,945. The per capita income for the city was $17,845. About 17.2% of families and 20.7% of the population were below the poverty line, including 28.2% of those under age 18 and 11.2% of those age 65 or over.
Levelland is served by the Levelland Independent School District. The city is also home to South Plains College, a two-year community college.
Common Questions
What is Per Capita Income in Levelland?
Per Capita income in Levelland is $26,931.
What is the Median Family Income in Levelland?
Median Family Income in Levelland is $61,135.
What is the Median Household income in Levelland?
Median Household Income in Levelland is $50,707.
What is Income or Wage Gap in Levelland?
Income or Wage Gap in Levelland is 39.4%.
Women in Levelland earn 60.6 cents for every dollar earned by a man.
What is Family Income Deficit in Levelland?
Family Income Deficit in Levelland is $10,513.
Families that are below poverty line in Levelland earn $10,513 less on average than the poverty threshold level.
What is Inequality or Gini Index in Levelland?
Inequality or Gini Index in Levelland is 0.44.
What is the Total Population of Levelland?
Total Population of Levelland is 12,607.
What is the Total Male Population of Levelland?
Total Male Population of Levelland is 6,262.
What is the Total Female Population of Levelland?
Total Female Population of Levelland is 6,345.
What is the Ratio of Males per 100 Females in Levelland?
There are 98.69 Males per 100 Females in Levelland.
What is the Ratio of Females per 100 Males in Levelland?
There are 101.33 Females per 100 Males in Levelland.
What is the Median Population Age in Levelland?
Median Population Age in Levelland is 33.0 Years.
What is the Average Family Size in Levelland
Average Family Size in Levelland is 3.1 People.
What is the Average Household Size in Levelland
Average Household Size in Levelland is 2.6 People.
How Large is the Labor Force in Levelland?
There are 6,098 People in the Labor Forcein in Levelland.
What is the Percentage of People in the Labor Force in Levelland?
63.1% of People are in the Labor Force in Levelland.
What is the Unemployment Rate in Levelland?
Unemployment Rate in Levelland is 5.9%.