La Ward, TX Map & Demographics
La Ward Map
La Ward Overview
$25,917
PER CAPITA INCOME
$78,333
AVG FAMILY INCOME
$68,750
AVG HOUSEHOLD INCOME
0.33
INEQUALITY / GINI INDEX
239
TOTAL POPULATION
126
MALE POPULATION
113
FEMALE POPULATION
111.50
MALES / 100 FEMALES
89.68
FEMALES / 100 MALES
24.6
MEDIAN AGE
3.8
AVG FAMILY SIZE
3.7
AVG HOUSEHOLD SIZE
124
LABOR FORCE [ PEOPLE ]
70.1%
PERCENT IN LABOR FORCE
17.7%
UNEMPLOYMENT RATE
La Ward Zip Codes
La Ward Area Codes
Income in La Ward
Income Overview in La Ward
Per Capita Income in La Ward is $25,917, while median incomes of families and households are $78,333 and $68,750 respectively.
| Characteristic | Number | Measure |
| Per Capita Income | 239 | $25,917 |
| Median Family Income | 62 | $78,333 |
| Mean Family Income | 62 | $94,453 |
| Median Household Income | 64 | $68,750 |
| Mean Household Income | 64 | $92,961 |
| Income Deficit | 62 | $0 |
| Wage / Income Gap (%) | 239 | 0.00% |
| Wage / Income Gap ($) | 239 | 100.00¢ per $1 |
| Gini / Inequality Index | 239 | 0.33 |
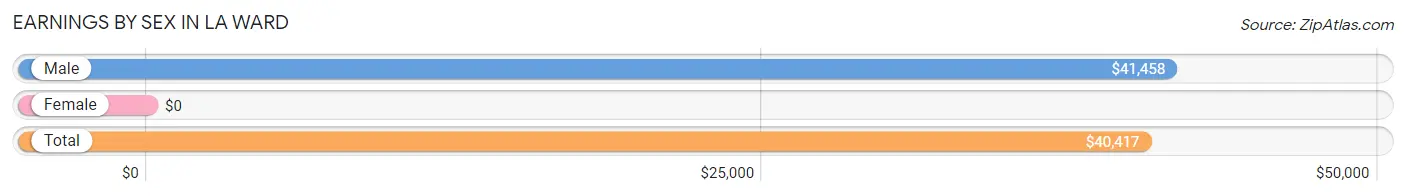
Earnings by Sex in La Ward
| Sex | Number | Average Earnings |
| Male | 85 (72.0%) | $41,458 |
| Female | 33 (28.0%) | $0 |
| Total | 118 (100.0%) | $40,417 |
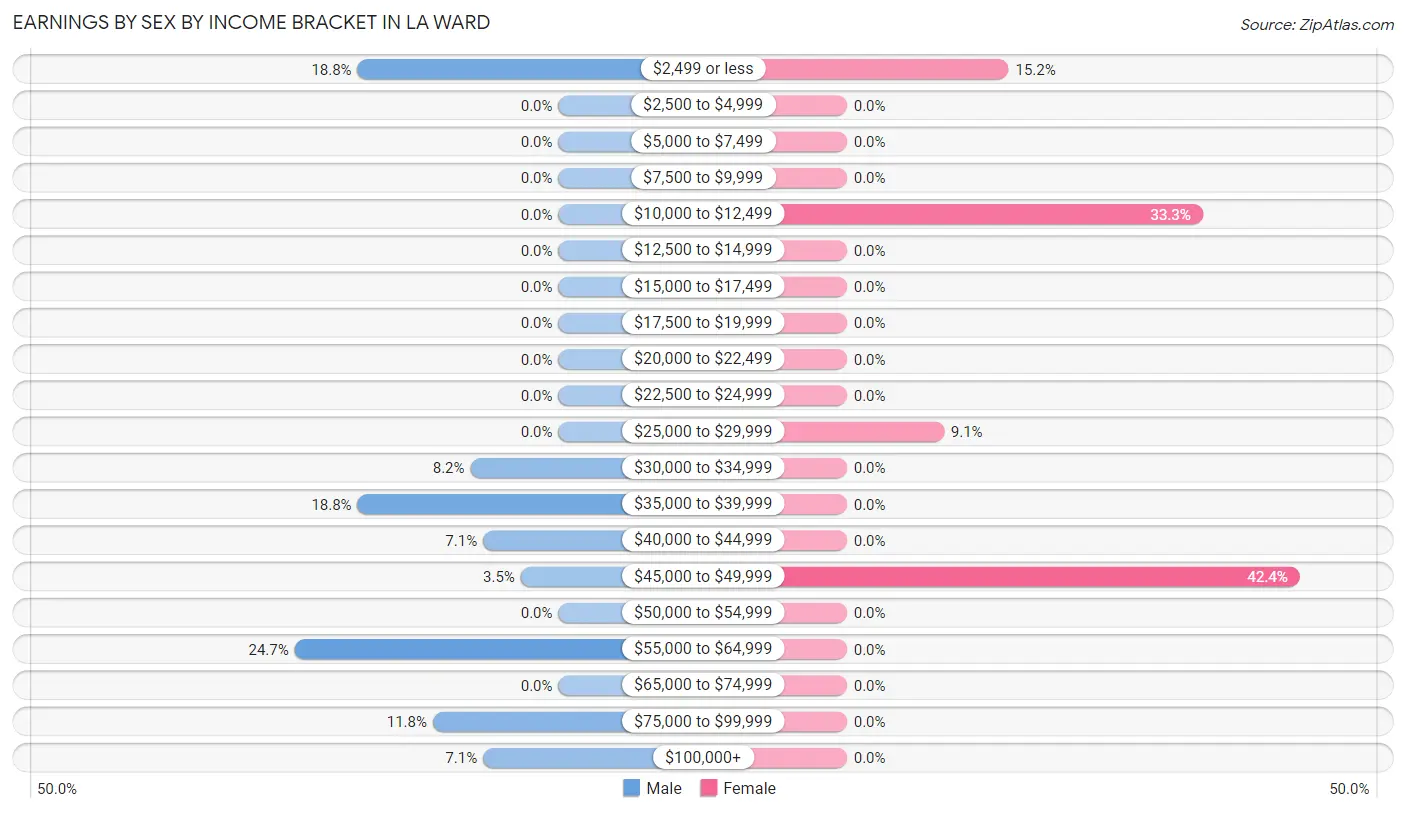
Earnings by Sex by Income Bracket in La Ward
The most common earnings brackets in La Ward are $55,000 to $64,999 for men (21 | 24.7%) and $45,000 to $49,999 for women (14 | 42.4%).
| Income | Male | Female |
| $2,499 or less | 16 (18.8%) | 5 (15.1%) |
| $2,500 to $4,999 | 0 (0.0%) | 0 (0.0%) |
| $5,000 to $7,499 | 0 (0.0%) | 0 (0.0%) |
| $7,500 to $9,999 | 0 (0.0%) | 0 (0.0%) |
| $10,000 to $12,499 | 0 (0.0%) | 11 (33.3%) |
| $12,500 to $14,999 | 0 (0.0%) | 0 (0.0%) |
| $15,000 to $17,499 | 0 (0.0%) | 0 (0.0%) |
| $17,500 to $19,999 | 0 (0.0%) | 0 (0.0%) |
| $20,000 to $22,499 | 0 (0.0%) | 0 (0.0%) |
| $22,500 to $24,999 | 0 (0.0%) | 0 (0.0%) |
| $25,000 to $29,999 | 0 (0.0%) | 3 (9.1%) |
| $30,000 to $34,999 | 7 (8.2%) | 0 (0.0%) |
| $35,000 to $39,999 | 16 (18.8%) | 0 (0.0%) |
| $40,000 to $44,999 | 6 (7.1%) | 0 (0.0%) |
| $45,000 to $49,999 | 3 (3.5%) | 14 (42.4%) |
| $50,000 to $54,999 | 0 (0.0%) | 0 (0.0%) |
| $55,000 to $64,999 | 21 (24.7%) | 0 (0.0%) |
| $65,000 to $74,999 | 0 (0.0%) | 0 (0.0%) |
| $75,000 to $99,999 | 10 (11.8%) | 0 (0.0%) |
| $100,000+ | 6 (7.1%) | 0 (0.0%) |
| Total | 85 (100.0%) | 33 (100.0%) |
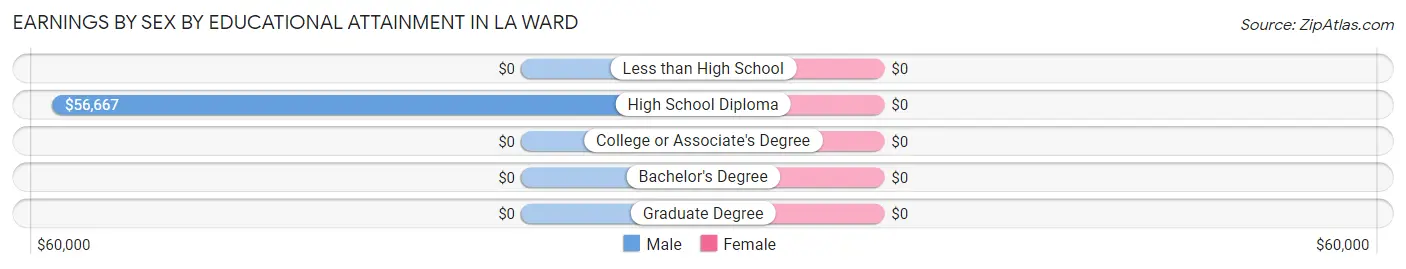
Earnings by Sex by Educational Attainment in La Ward
| Educational Attainment | Male Income | Female Income |
| Less than High School | - | - |
| High School Diploma | $56,667 | $0 |
| College or Associate's Degree | - | - |
| Bachelor's Degree | - | - |
| Graduate Degree | - | - |
| Total | $56,310 | $0 |
Family Income in La Ward
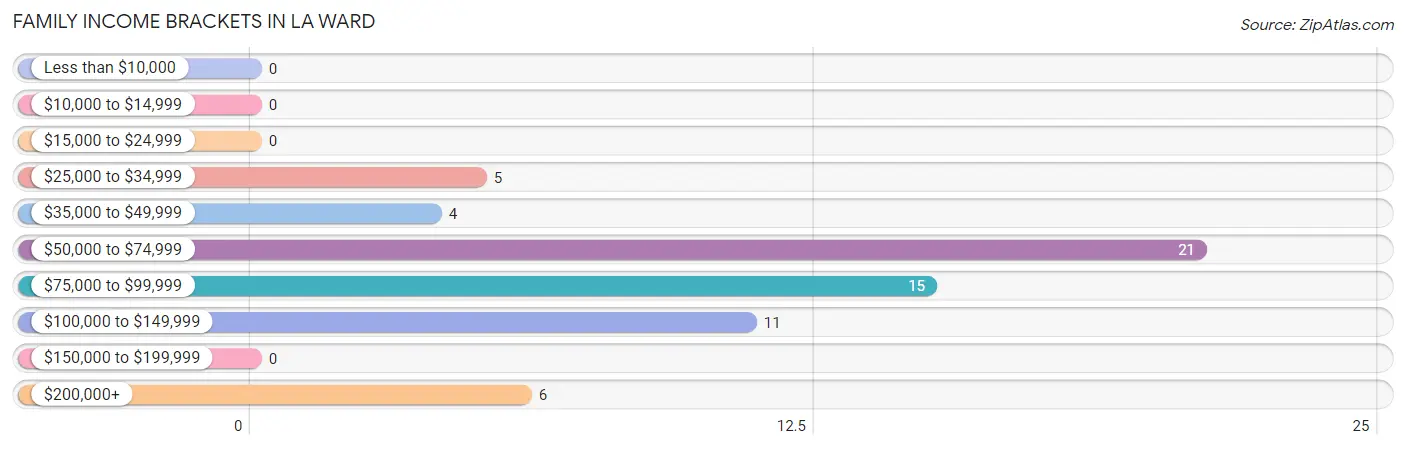
Family Income Brackets in La Ward
According to the La Ward family income data, there are 21 families falling into the $50,000 to $74,999 income range, which is the most common income bracket and makes up 33.9% of all families.
| Income Bracket | # Families | % Families |
| Less than $10,000 | 0 | 0.0% |
| $10,000 to $14,999 | 0 | 0.0% |
| $15,000 to $24,999 | 0 | 0.0% |
| $25,000 to $34,999 | 5 | 8.1% |
| $35,000 to $49,999 | 4 | 6.5% |
| $50,000 to $74,999 | 21 | 33.9% |
| $75,000 to $99,999 | 15 | 24.2% |
| $100,000 to $149,999 | 11 | 17.7% |
| $150,000 to $199,999 | 0 | 0.0% |
| $200,000+ | 6 | 9.7% |
Family Income by Famaliy Size in La Ward
| Income Bracket | # Families | Median Income |
| 2-Person Families | 22 (35.5%) | $0 |
| 3-Person Families | 16 (25.8%) | $0 |
| 4-Person Families | 2 (3.2%) | $0 |
| 5-Person Families | 11 (17.7%) | $0 |
| 6-Person Families | 0 (0.0%) | $0 |
| 7+ Person Families | 11 (17.7%) | $0 |
| Total | 62 (100.0%) | $78,333 |
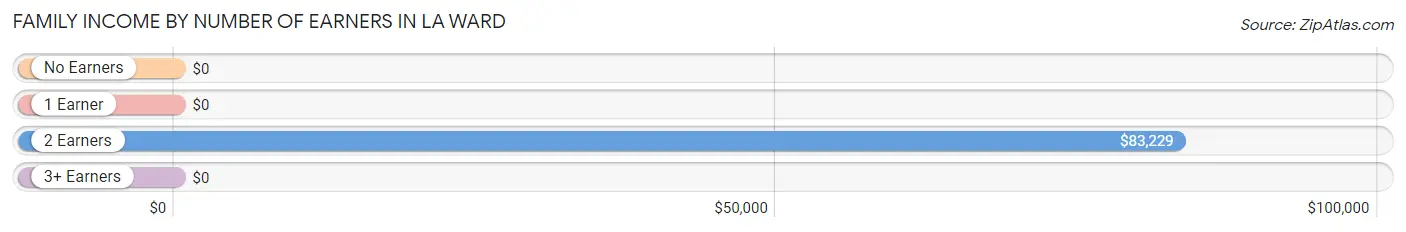
Family Income by Number of Earners in La Ward
| Number of Earners | # Families | Median Income |
| No Earners | 0 (0.0%) | $0 |
| 1 Earner | 20 (32.3%) | $0 |
| 2 Earners | 39 (62.9%) | $83,229 |
| 3+ Earners | 3 (4.8%) | $0 |
| Total | 62 (100.0%) | $78,333 |
Household Income in La Ward
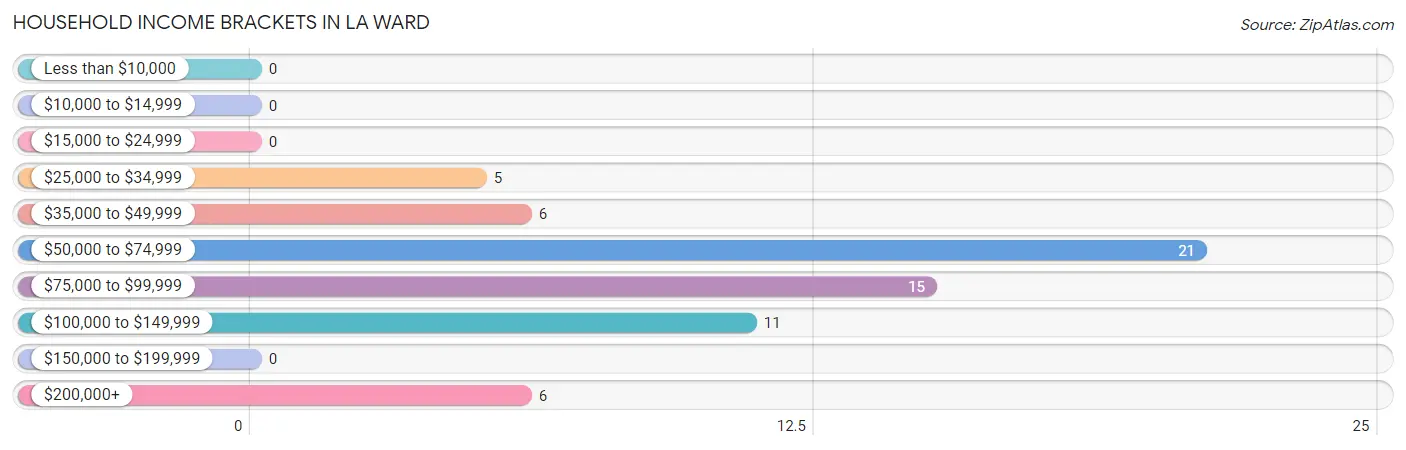
Household Income Brackets in La Ward
With 21 households falling in the category, the $50,000 to $74,999 income range is the most frequent in La Ward, accounting for 32.8% of all households.
| Income Bracket | # Households | % Households |
| Less than $10,000 | 0 | 0.0% |
| $10,000 to $14,999 | 0 | 0.0% |
| $15,000 to $24,999 | 0 | 0.0% |
| $25,000 to $34,999 | 5 | 7.8% |
| $35,000 to $49,999 | 6 | 9.4% |
| $50,000 to $74,999 | 21 | 32.8% |
| $75,000 to $99,999 | 15 | 23.4% |
| $100,000 to $149,999 | 11 | 17.2% |
| $150,000 to $199,999 | 0 | 0.0% |
| $200,000+ | 6 | 9.4% |
Household Income by Householder Age in La Ward
The median household income in La Ward is $68,750, with the highest median household income of $56,250 found in the 25 to 44 years age bracket for the primary householder. A total of 14 households (21.9%) fall into this category. Meanwhile, the 15 to 24 years age bracket for the primary householder has the lowest median household income of $0, with 12 households (18.8%) in this group.
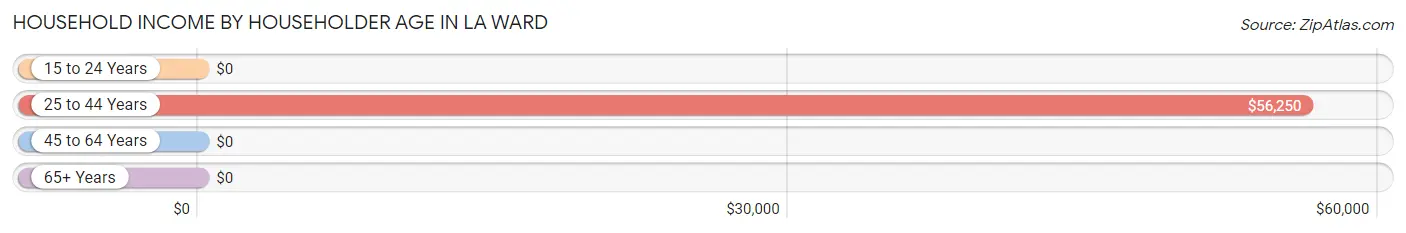
| Income Bracket | # Households | Median Income |
| 15 to 24 Years | 12 (18.8%) | $0 |
| 25 to 44 Years | 14 (21.9%) | $56,250 |
| 45 to 64 Years | 38 (59.4%) | $0 |
| 65+ Years | 0 (0.0%) | $0 |
| Total | 64 (100.0%) | $68,750 |
Poverty in La Ward
Income Below Poverty by Sex and Age in La Ward
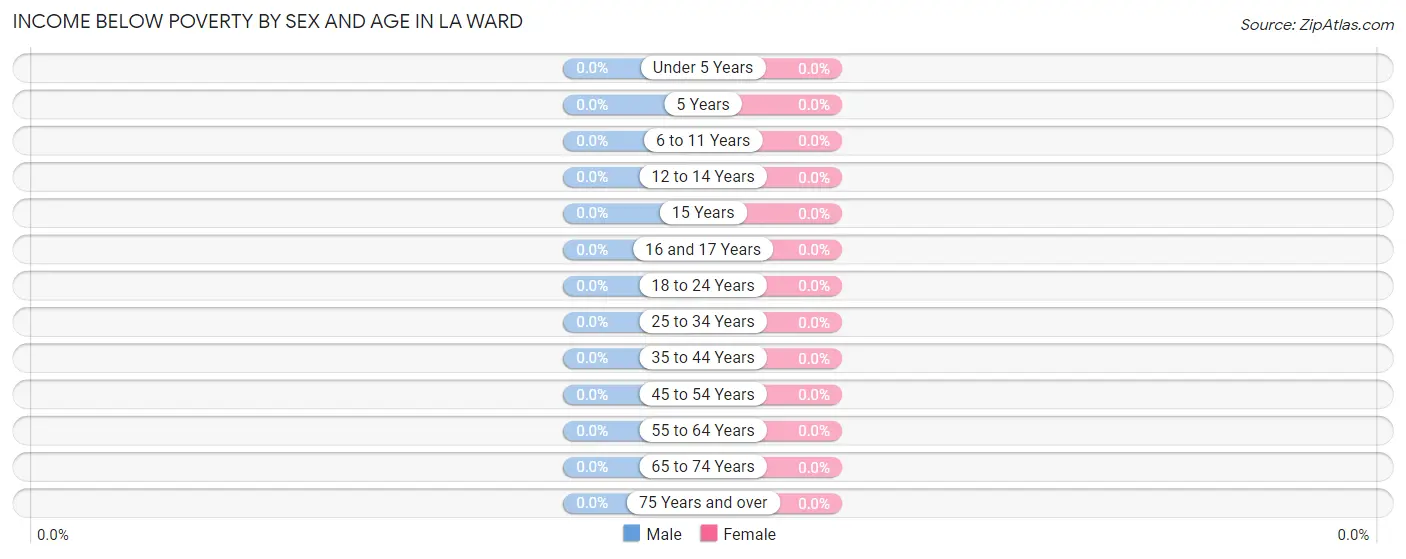
| Age Bracket | Male | Female |
| Under 5 Years | 0 (0.0%) | 0 (0.0%) |
| 5 Years | 0 (0.0%) | 0 (0.0%) |
| 6 to 11 Years | 0 (0.0%) | 0 (0.0%) |
| 12 to 14 Years | 0 (0.0%) | 0 (0.0%) |
| 15 Years | 0 (0.0%) | 0 (0.0%) |
| 16 and 17 Years | 0 (0.0%) | 0 (0.0%) |
| 18 to 24 Years | 0 (0.0%) | 0 (0.0%) |
| 25 to 34 Years | 0 (0.0%) | 0 (0.0%) |
| 35 to 44 Years | 0 (0.0%) | 0 (0.0%) |
| 45 to 54 Years | 0 (0.0%) | 0 (0.0%) |
| 55 to 64 Years | 0 (0.0%) | 0 (0.0%) |
| 65 to 74 Years | 0 (0.0%) | 0 (0.0%) |
| 75 Years and over | 0 (0.0%) | 0 (0.0%) |
| Total | 0 (0.0%) | 0 (0.0%) |
Income Above Poverty by Sex and Age in La Ward
According to the poverty statistics in La Ward, males aged under 5 years and females aged under 5 years are the age groups that are most secure financially, with 100.0% of males and 100.0% of females in these age groups living above the poverty line.
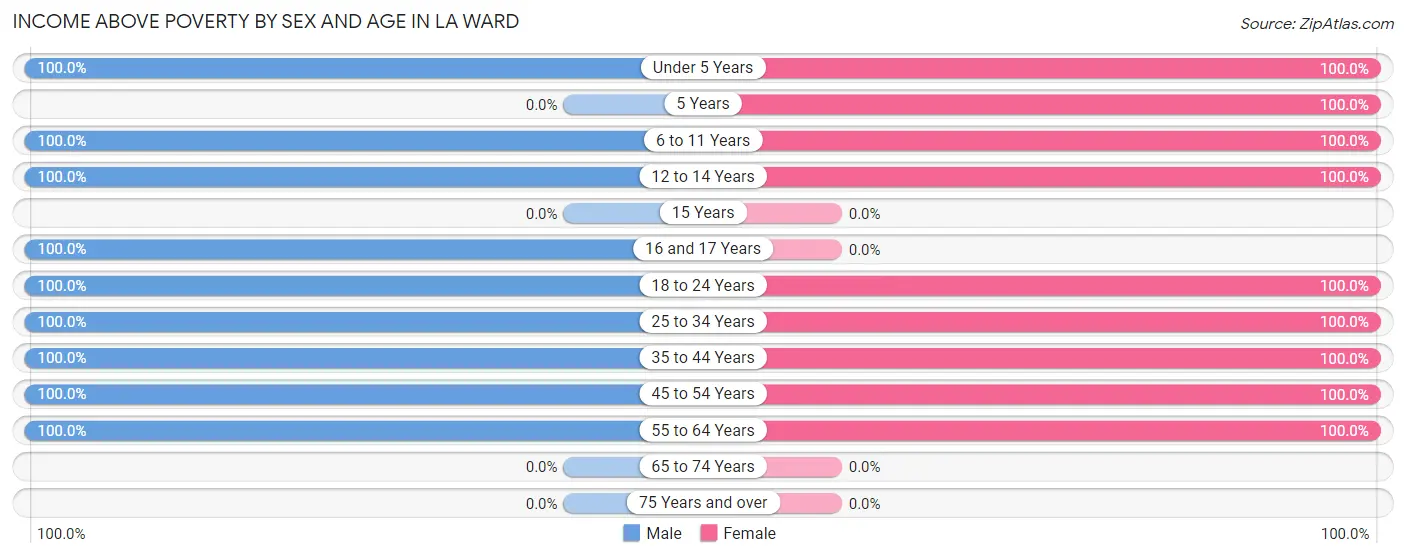
| Age Bracket | Male | Female |
| Under 5 Years | 14 (100.0%) | 6 (100.0%) |
| 5 Years | 0 (0.0%) | 12 (100.0%) |
| 6 to 11 Years | 4 (100.0%) | 16 (100.0%) |
| 12 to 14 Years | 8 (100.0%) | 2 (100.0%) |
| 15 Years | 0 (0.0%) | 0 (0.0%) |
| 16 and 17 Years | 3 (100.0%) | 0 (0.0%) |
| 18 to 24 Years | 33 (100.0%) | 28 (100.0%) |
| 25 to 34 Years | 18 (100.0%) | 5 (100.0%) |
| 35 to 44 Years | 3 (100.0%) | 6 (100.0%) |
| 45 to 54 Years | 25 (100.0%) | 32 (100.0%) |
| 55 to 64 Years | 18 (100.0%) | 6 (100.0%) |
| 65 to 74 Years | 0 (0.0%) | 0 (0.0%) |
| 75 Years and over | 0 (0.0%) | 0 (0.0%) |
| Total | 126 (100.0%) | 113 (100.0%) |
Income Below Poverty Among Married-Couple Families in La Ward
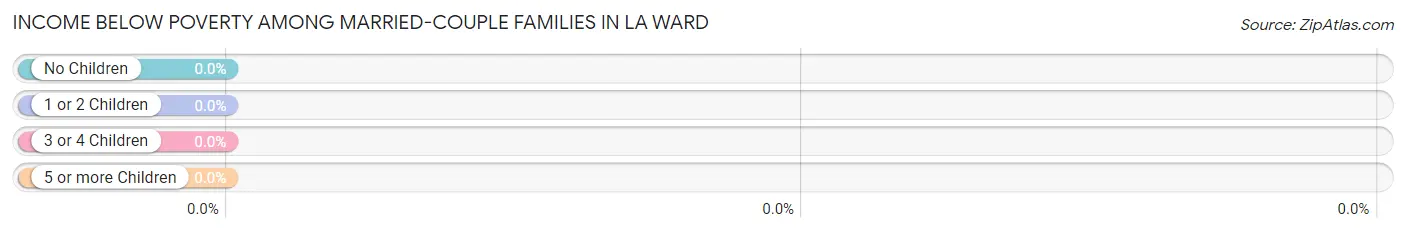
| Children | Above Poverty | Below Poverty |
| No Children | 38 (100.0%) | 0 (0.0%) |
| 1 or 2 Children | 3 (100.0%) | 0 (0.0%) |
| 3 or 4 Children | 19 (100.0%) | 0 (0.0%) |
| 5 or more Children | 0 (0.0%) | 0 (0.0%) |
| Total | 60 (100.0%) | 0 (0.0%) |
Income Below Poverty Among Single-Parent Households in La Ward
| Children | Single Father | Single Mother |
| No Children | 0 (0.0%) | 0 (0.0%) |
| 1 or 2 Children | 0 (0.0%) | 0 (0.0%) |
| 3 or 4 Children | 0 (0.0%) | 0 (0.0%) |
| 5 or more Children | 0 (0.0%) | 0 (0.0%) |
| Total | 0 (0.0%) | 0 (0.0%) |
Income Below Poverty Among Married-Couple vs Single-Parent Households in La Ward
| Children | Married-Couple Families | Single-Parent Households |
| No Children | 0 (0.0%) | 0 (0.0%) |
| 1 or 2 Children | 0 (0.0%) | 0 (0.0%) |
| 3 or 4 Children | 0 (0.0%) | 0 (0.0%) |
| 5 or more Children | 0 (0.0%) | 0 (0.0%) |
| Total | 0 (0.0%) | 0 (0.0%) |
Race in La Ward
The most populous races in La Ward are White / Caucasian (208 | 87.0%), Hispanic or Latino (91 | 38.1%), and Some other Race (18 | 7.5%).
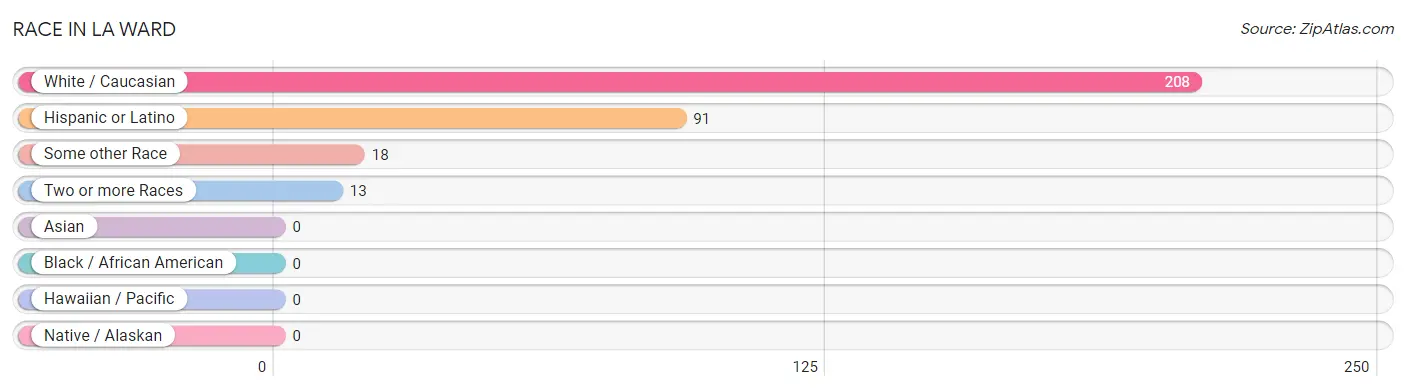
| Race | # Population | % Population |
| Asian | 0 | 0.0% |
| Black / African American | 0 | 0.0% |
| Hawaiian / Pacific | 0 | 0.0% |
| Hispanic or Latino | 91 | 38.1% |
| Native / Alaskan | 0 | 0.0% |
| White / Caucasian | 208 | 87.0% |
| Two or more Races | 13 | 5.4% |
| Some other Race | 18 | 7.5% |
| Total | 239 | 100.0% |
Ancestry in La Ward
The most populous ancestries reported in La Ward are Mexican (91 | 38.1%), Scotch-Irish (44 | 18.4%), German (17 | 7.1%), Scottish (12 | 5.0%), and Irish (11 | 4.6%), together accounting for 73.2% of all La Ward residents.
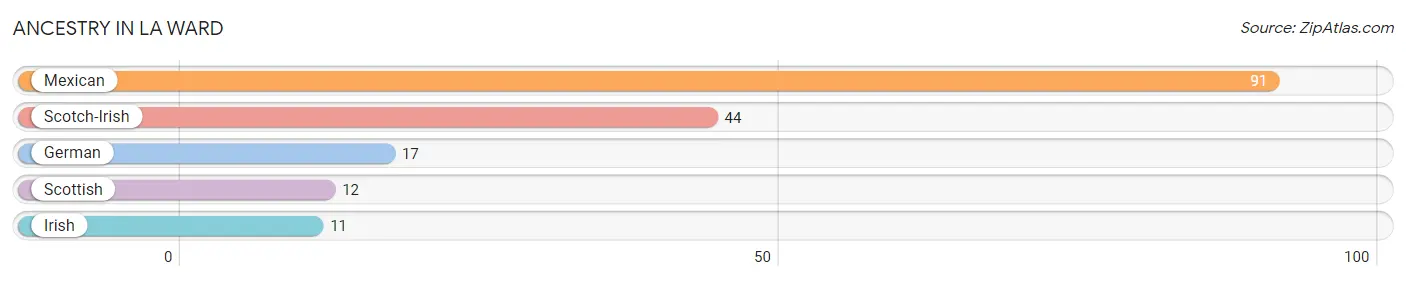
| Ancestry | # Population | % Population |
| German | 17 | 7.1% |
| Irish | 11 | 4.6% |
| Mexican | 91 | 38.1% |
| Scotch-Irish | 44 | 18.4% |
| Scottish | 12 | 5.0% | View All 5 Rows |
Immigrants in La Ward
The most numerous immigrant groups reported in La Ward came from Central America (31 | 13.0%), Latin America (31 | 13.0%), and Mexico (31 | 13.0%), together accounting for 38.9% of all La Ward residents.
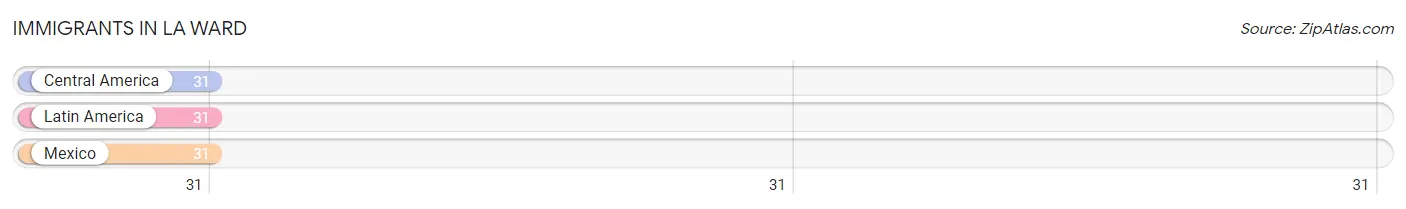
| Immigration Origin | # Population | % Population |
| Central America | 31 | 13.0% |
| Latin America | 31 | 13.0% |
| Mexico | 31 | 13.0% | View All 3 Rows |
Sex and Age in La Ward
Sex and Age in La Ward
The most populous age groups in La Ward are 20 to 24 Years (29 | 23.0%) for men and 5 to 9 Years (28 | 24.8%) for women.
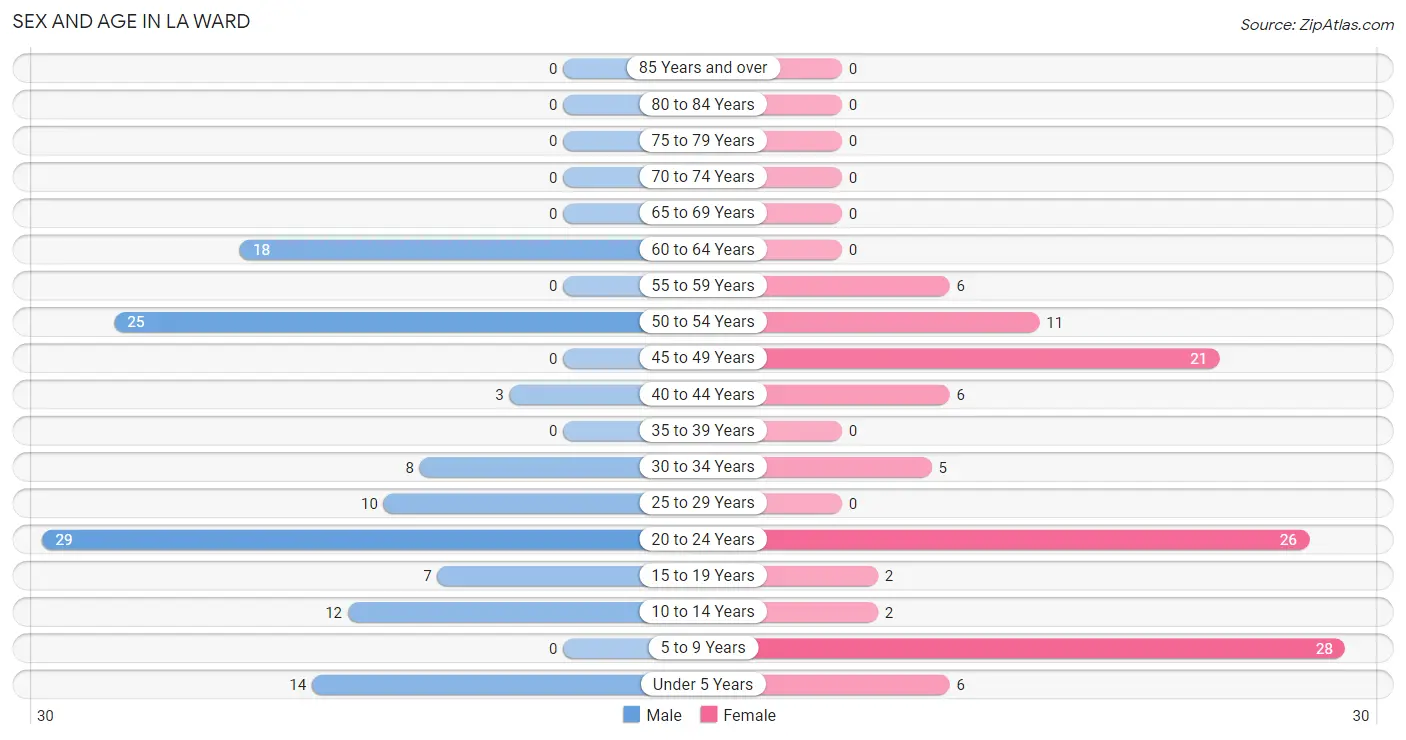
| Age Bracket | Male | Female |
| Under 5 Years | 14 (11.1%) | 6 (5.3%) |
| 5 to 9 Years | 0 (0.0%) | 28 (24.8%) |
| 10 to 14 Years | 12 (9.5%) | 2 (1.8%) |
| 15 to 19 Years | 7 (5.6%) | 2 (1.8%) |
| 20 to 24 Years | 29 (23.0%) | 26 (23.0%) |
| 25 to 29 Years | 10 (7.9%) | 0 (0.0%) |
| 30 to 34 Years | 8 (6.4%) | 5 (4.4%) |
| 35 to 39 Years | 0 (0.0%) | 0 (0.0%) |
| 40 to 44 Years | 3 (2.4%) | 6 (5.3%) |
| 45 to 49 Years | 0 (0.0%) | 21 (18.6%) |
| 50 to 54 Years | 25 (19.8%) | 11 (9.7%) |
| 55 to 59 Years | 0 (0.0%) | 6 (5.3%) |
| 60 to 64 Years | 18 (14.3%) | 0 (0.0%) |
| 65 to 69 Years | 0 (0.0%) | 0 (0.0%) |
| 70 to 74 Years | 0 (0.0%) | 0 (0.0%) |
| 75 to 79 Years | 0 (0.0%) | 0 (0.0%) |
| 80 to 84 Years | 0 (0.0%) | 0 (0.0%) |
| 85 Years and over | 0 (0.0%) | 0 (0.0%) |
| Total | 126 (100.0%) | 113 (100.0%) |
Families and Households in La Ward
Median Family Size in La Ward
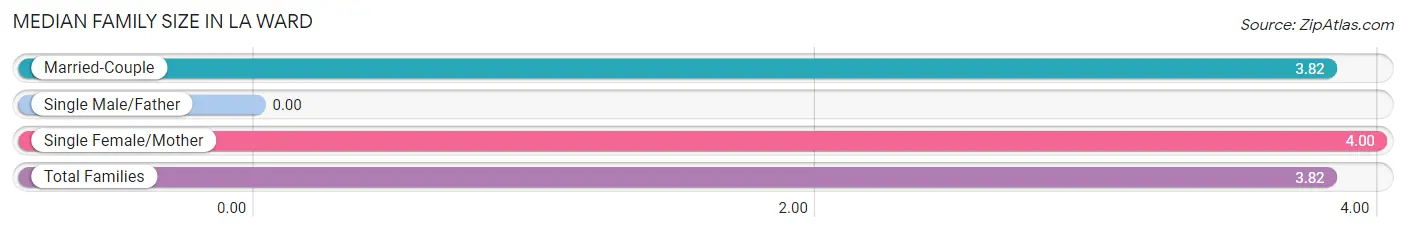
| Family Type | # Families | Family Size |
| Married-Couple | 60 (96.8%) | 3.82 |
| Single Male/Father | 0 (0.0%) | - |
| Single Female/Mother | 2 (3.2%) | 4.00 |
| Total Families | 62 (100.0%) | 3.82 |
Median Household Size in La Ward
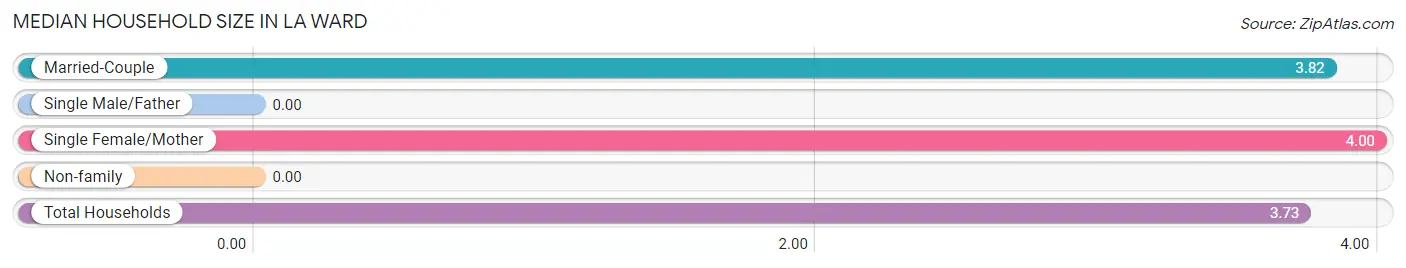
| Household Type | # Households | Household Size |
| Married-Couple | 60 (93.8%) | 3.82 |
| Single Male/Father | 0 (0.0%) | - |
| Single Female/Mother | 2 (3.1%) | 4.00 |
| Non-family | 2 (3.1%) | - |
| Total Households | 64 (100.0%) | 3.73 |
Household Size by Marriage Status in La Ward
Out of a total of 64 households in La Ward, 62 (96.9%) are family households, while 2 (3.1%) are nonfamily households. The most numerous type of family households are 2-person households, comprising 22, and the most common type of nonfamily households are 1-person households, comprising 2.
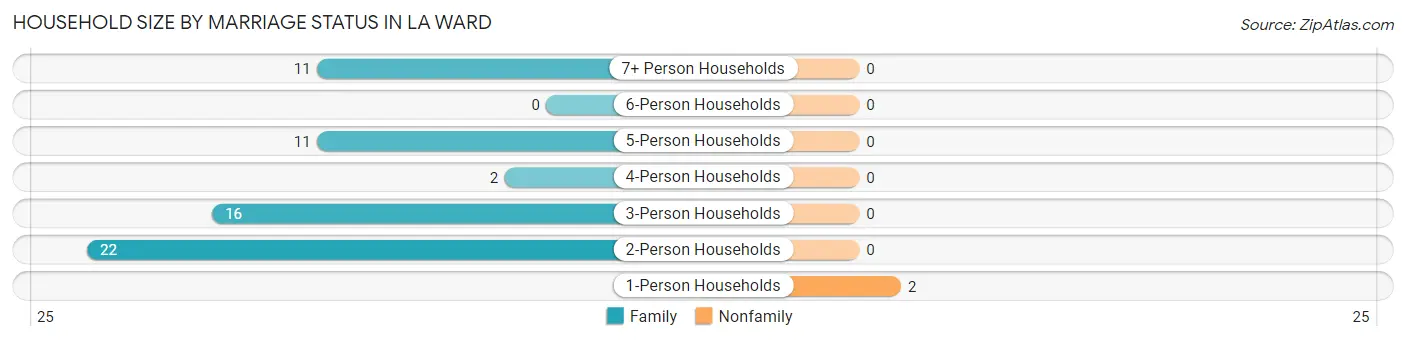
| Household Size | Family Households | Nonfamily Households |
| 1-Person Households | - | 2 (3.1%) |
| 2-Person Households | 22 (34.4%) | 0 (0.0%) |
| 3-Person Households | 16 (25.0%) | 0 (0.0%) |
| 4-Person Households | 2 (3.1%) | 0 (0.0%) |
| 5-Person Households | 11 (17.2%) | 0 (0.0%) |
| 6-Person Households | 0 (0.0%) | 0 (0.0%) |
| 7+ Person Households | 11 (17.2%) | 0 (0.0%) |
| Total | 62 (96.9%) | 2 (3.1%) |
Female Fertility in La Ward
Fertility by Age in La Ward
Average fertility rate in La Ward is 33.0 births per 1,000 women. Women in the age bracket of 35 to 50 years have the highest fertility rate with 74.0 births per 1,000 women. Women in the age bracket of 35 to 50 years acount for 100.0% of all women with births.
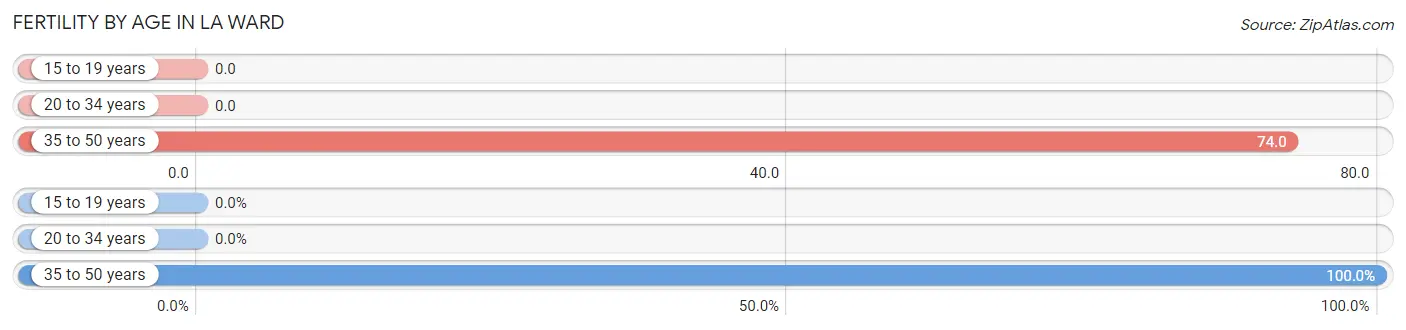
| Age Bracket | Women with Births | Births / 1,000 Women |
| 15 to 19 years | 0 (0.0%) | 0.0 |
| 20 to 34 years | 0 (0.0%) | 0.0 |
| 35 to 50 years | 2 (100.0%) | 74.0 |
| Total | 2 (100.0%) | 33.0 |
Fertility by Age by Marriage Status in La Ward
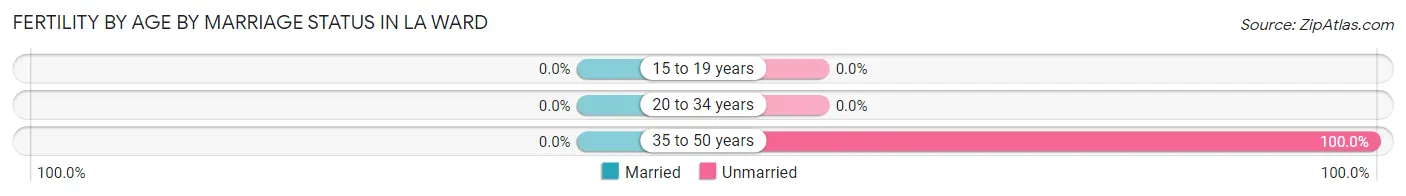
| Age Bracket | Married | Unmarried |
| 15 to 19 years | 0 (0.0%) | 0 (0.0%) |
| 20 to 34 years | 0 (0.0%) | 0 (0.0%) |
| 35 to 50 years | 0 (0.0%) | 2 (100.0%) |
| Total | 0 (0.0%) | 2 (100.0%) |
Fertility by Education in La Ward
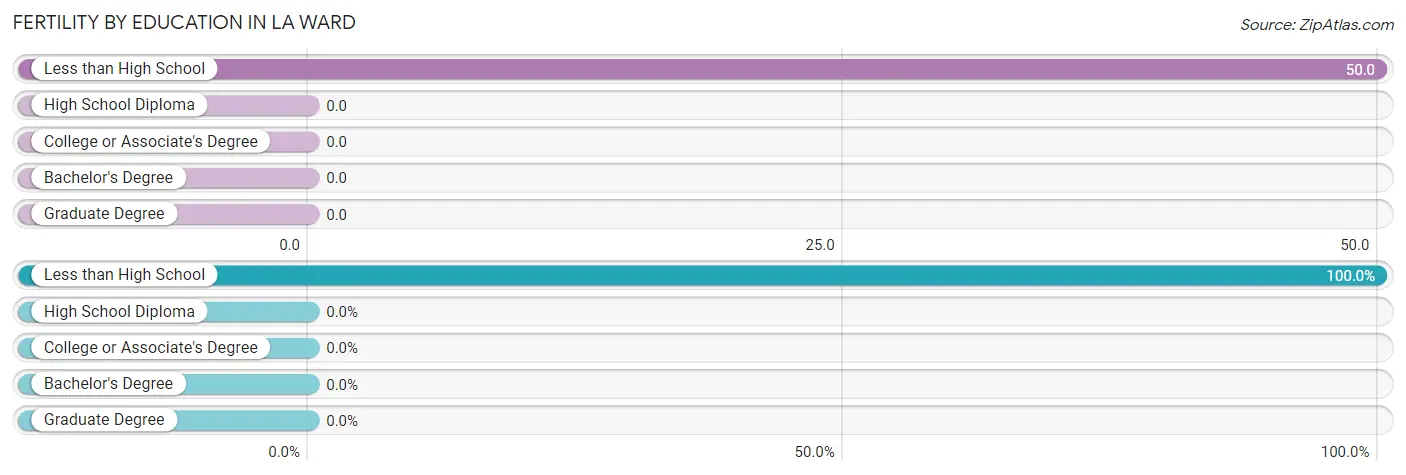
| Educational Attainment | Women with Births | Births / 1,000 Women |
| Less than High School | 2 (100.0%) | 50.0 |
| High School Diploma | 0 (0.0%) | 0.0 |
| College or Associate's Degree | 0 (0.0%) | 0.0 |
| Bachelor's Degree | 0 (0.0%) | 0.0 |
| Graduate Degree | 0 (0.0%) | 0.0 |
| Total | 2 (100.0%) | 33.0 |
Fertility by Education by Marriage Status in La Ward
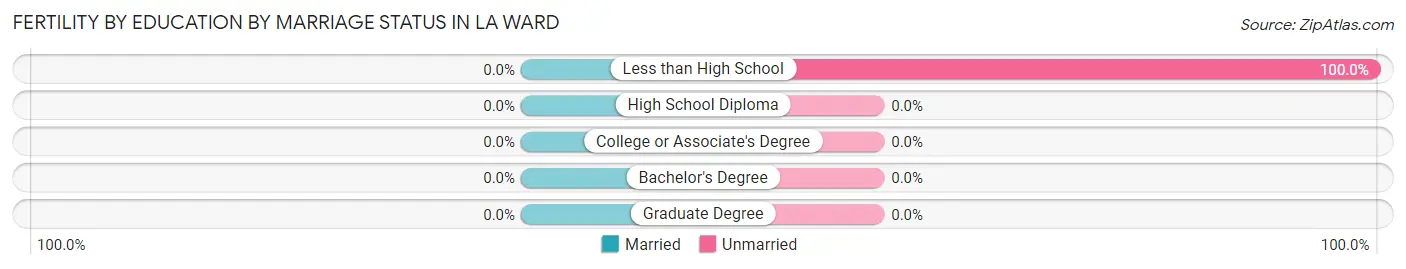
| Educational Attainment | Married | Unmarried |
| Less than High School | 0 (0.0%) | 2 (100.0%) |
| High School Diploma | 0 (0.0%) | 0 (0.0%) |
| College or Associate's Degree | 0 (0.0%) | 0 (0.0%) |
| Bachelor's Degree | 0 (0.0%) | 0 (0.0%) |
| Graduate Degree | 0 (0.0%) | 0 (0.0%) |
| Total | 0 (0.0%) | 2 (100.0%) |
Employment Characteristics in La Ward
Employment by Class of Employer in La Ward
Among the 102 employed individuals in La Ward, private company employees (77 | 75.5%), self-employed (not incorporated) (22 | 21.6%), and state government employees (3 | 2.9%) make up the most common classes of employment.
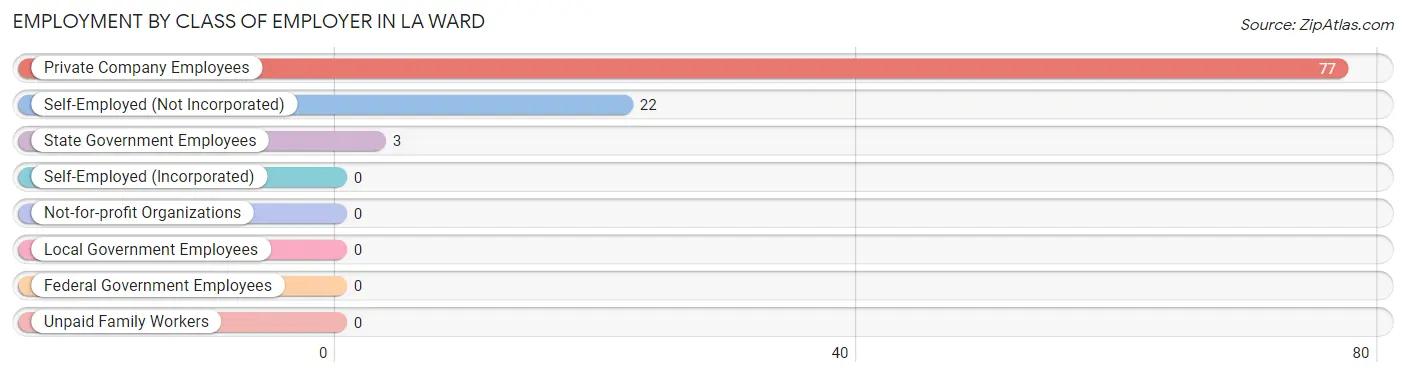
| Employer Class | # Employees | % Employees |
| Private Company Employees | 77 | 75.5% |
| Self-Employed (Incorporated) | 0 | 0.0% |
| Self-Employed (Not Incorporated) | 22 | 21.6% |
| Not-for-profit Organizations | 0 | 0.0% |
| Local Government Employees | 0 | 0.0% |
| State Government Employees | 3 | 2.9% |
| Federal Government Employees | 0 | 0.0% |
| Unpaid Family Workers | 0 | 0.0% |
| Total | 102 | 100.0% |
Employment Status by Age in La Ward
According to the labor force statistics for La Ward, out of the total population over 16 years of age (177), 70.1% or 124 individuals are in the labor force, with 17.7% or 22 of them unemployed. The age group with the highest labor force participation rate is 25 to 29 years, with 100.0% or 10 individuals in the labor force. Within the labor force, the 45 to 54 years age range has the highest percentage of unemployed individuals, with 45.8% or 11 of them being unemployed.
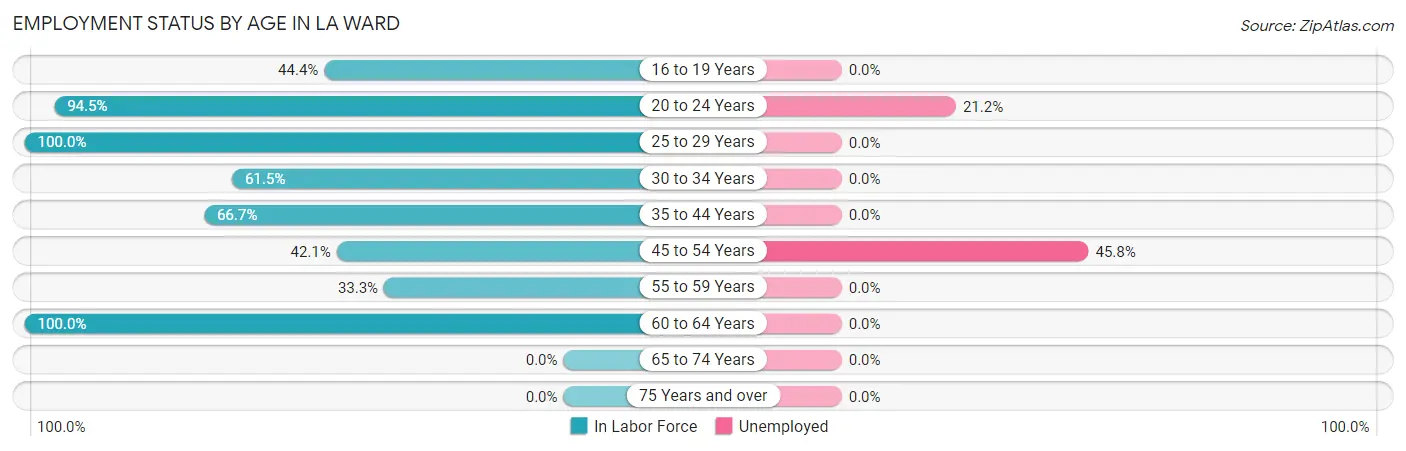
| Age Bracket | In Labor Force | Unemployed |
| 16 to 19 Years | 4 (44.4%) | 0 (0.0%) |
| 20 to 24 Years | 52 (94.5%) | 11 (21.2%) |
| 25 to 29 Years | 10 (100.0%) | 0 (0.0%) |
| 30 to 34 Years | 8 (61.5%) | 0 (0.0%) |
| 35 to 44 Years | 6 (66.7%) | 0 (0.0%) |
| 45 to 54 Years | 24 (42.1%) | 11 (45.8%) |
| 55 to 59 Years | 2 (33.3%) | 0 (0.0%) |
| 60 to 64 Years | 18 (100.0%) | 0 (0.0%) |
| 65 to 74 Years | 0 (0.0%) | 0 (0.0%) |
| 75 Years and over | 0 (0.0%) | 0 (0.0%) |
| Total | 124 (70.1%) | 22 (17.7%) |
Employment Status by Educational Attainment in La Ward
According to labor force statistics for La Ward, 60.2% of individuals (68) out of the total population between 25 and 64 years of age (113) are in the labor force, with 16.2% or 11 of them being unemployed. The group with the highest labor force participation rate are those with the educational attainment of college / associate degree, with 100.0% or 14 individuals in the labor force. Within the labor force, individuals with less than high school education have the highest percentage of unemployment, with 64.7% or 11 of them being unemployed.
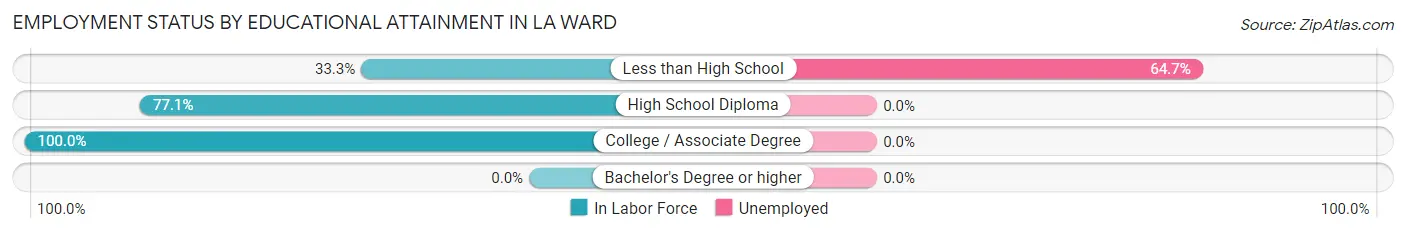
| Educational Attainment | In Labor Force | Unemployed |
| Less than High School | 17 (33.3%) | 33 (64.7%) |
| High School Diploma | 37 (77.1%) | 0 (0.0%) |
| College / Associate Degree | 14 (100.0%) | 0 (0.0%) |
| Bachelor's Degree or higher | 0 (0.0%) | 0 (0.0%) |
| Total | 68 (60.2%) | 18 (16.2%) |
Employment Occupations by Sex in La Ward
Management, Business, Science and Arts Occupations
The most common Management, Business, Science and Arts occupations in La Ward are Management (16 | 15.7%), Health Diagnosing & Treating (12 | 11.8%), Health Technologists (12 | 11.8%), and Business & Financial (3 | 2.9%).
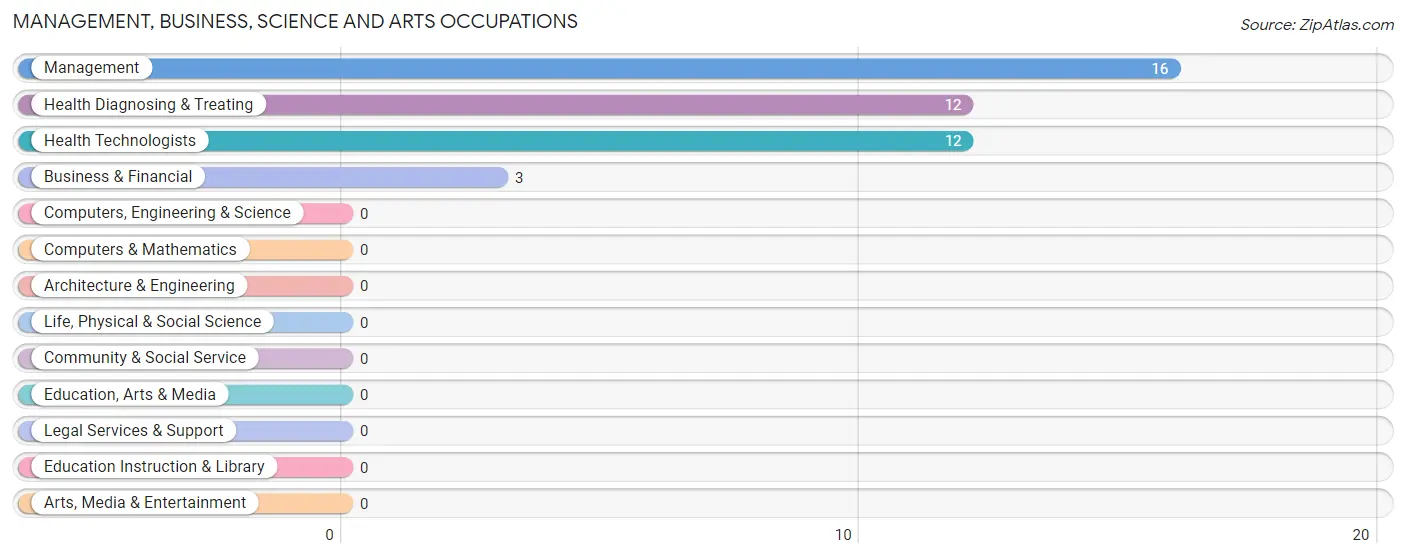
Management, Business, Science and Arts Occupations by Sex
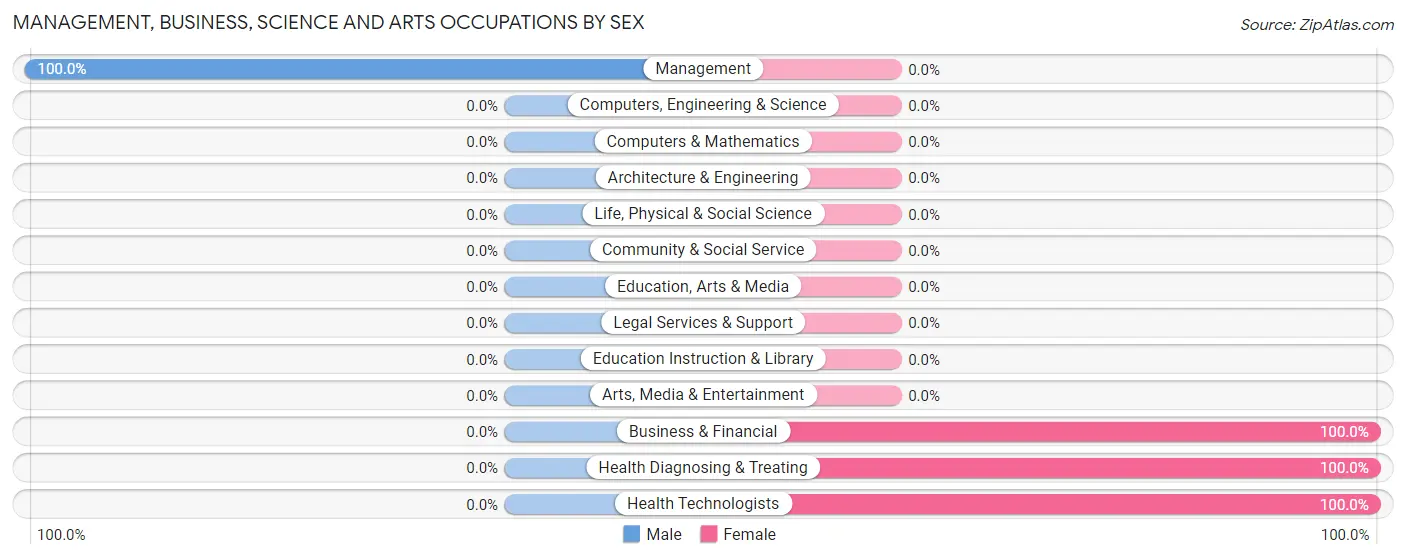
| Occupation | Male | Female |
| Management | 16 (100.0%) | 0 (0.0%) |
| Business & Financial | 0 (0.0%) | 3 (100.0%) |
| Computers, Engineering & Science | 0 (0.0%) | 0 (0.0%) |
| Computers & Mathematics | 0 (0.0%) | 0 (0.0%) |
| Architecture & Engineering | 0 (0.0%) | 0 (0.0%) |
| Life, Physical & Social Science | 0 (0.0%) | 0 (0.0%) |
| Community & Social Service | 0 (0.0%) | 0 (0.0%) |
| Education, Arts & Media | 0 (0.0%) | 0 (0.0%) |
| Legal Services & Support | 0 (0.0%) | 0 (0.0%) |
| Education Instruction & Library | 0 (0.0%) | 0 (0.0%) |
| Arts, Media & Entertainment | 0 (0.0%) | 0 (0.0%) |
| Health Diagnosing & Treating | 0 (0.0%) | 12 (100.0%) |
| Health Technologists | 0 (0.0%) | 12 (100.0%) |
| Total (Category) | 16 (51.6%) | 15 (48.4%) |
| Total (Overall) | 85 (83.3%) | 17 (16.7%) |
Services Occupations
The most common Services occupations in La Ward are Personal Care & Service (12 | 11.8%), and Food Preparation & Serving (4 | 3.9%).
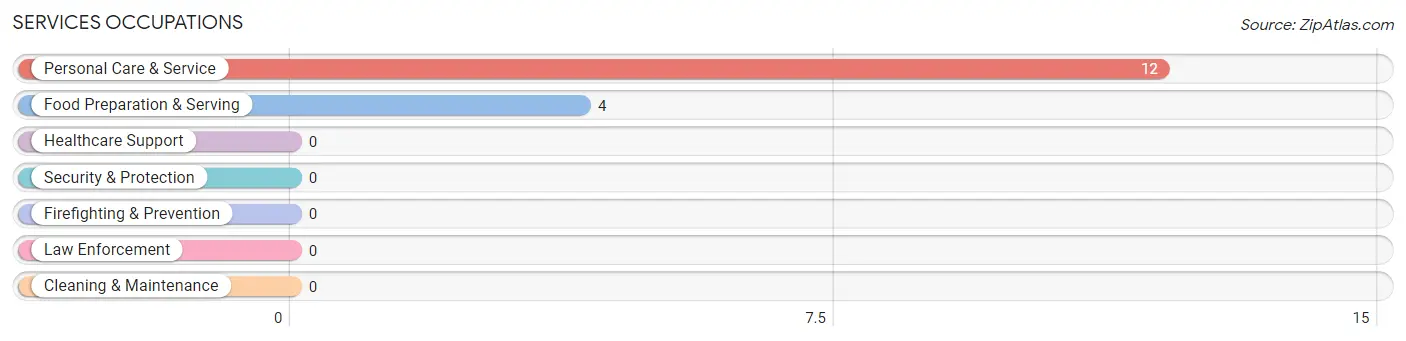
Services Occupations by Sex
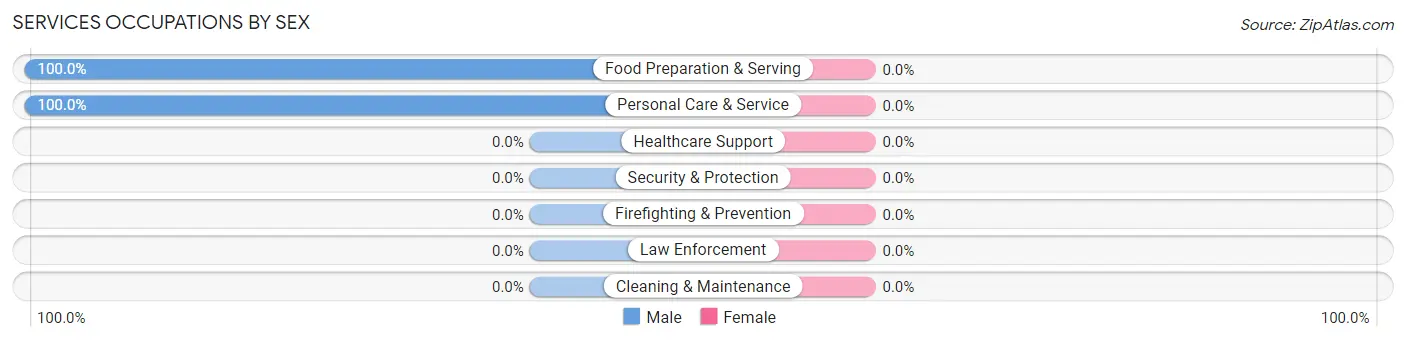
| Occupation | Male | Female |
| Healthcare Support | 0 (0.0%) | 0 (0.0%) |
| Security & Protection | 0 (0.0%) | 0 (0.0%) |
| Firefighting & Prevention | 0 (0.0%) | 0 (0.0%) |
| Law Enforcement | 0 (0.0%) | 0 (0.0%) |
| Food Preparation & Serving | 4 (100.0%) | 0 (0.0%) |
| Cleaning & Maintenance | 0 (0.0%) | 0 (0.0%) |
| Personal Care & Service | 12 (100.0%) | 0 (0.0%) |
| Total (Category) | 16 (100.0%) | 0 (0.0%) |
| Total (Overall) | 85 (83.3%) | 17 (16.7%) |
Sales and Office Occupations
Sales and Office Occupations by Sex
| Occupation | Male | Female |
| Sales & Related | 0 (0.0%) | 0 (0.0%) |
| Office & Administration | 0 (0.0%) | 0 (0.0%) |
| Total (Category) | 0 (0.0%) | 0 (0.0%) |
| Total (Overall) | 85 (83.3%) | 17 (16.7%) |
Natural Resources, Construction and Maintenance Occupations
The most common Natural Resources, Construction and Maintenance occupations in La Ward are Construction & Extraction (12 | 11.8%), and Farming, Fishing & Forestry (3 | 2.9%).
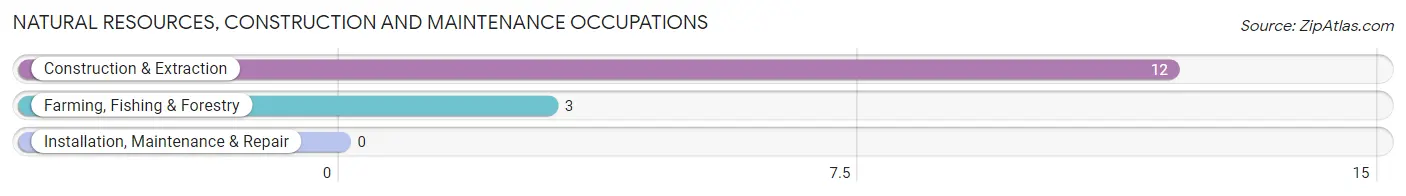
Natural Resources, Construction and Maintenance Occupations by Sex
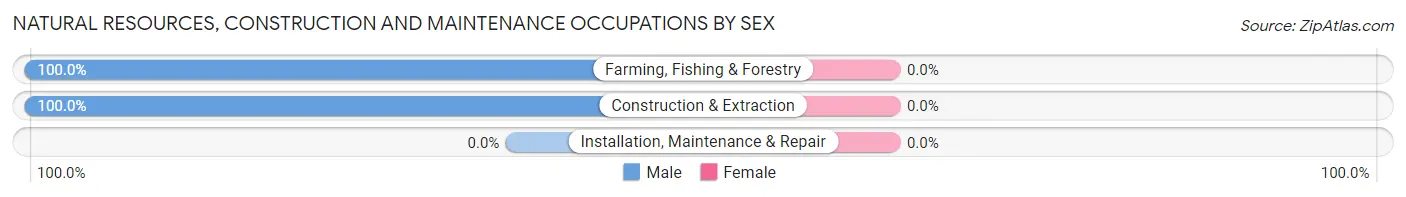
| Occupation | Male | Female |
| Farming, Fishing & Forestry | 3 (100.0%) | 0 (0.0%) |
| Construction & Extraction | 12 (100.0%) | 0 (0.0%) |
| Installation, Maintenance & Repair | 0 (0.0%) | 0 (0.0%) |
| Total (Category) | 15 (100.0%) | 0 (0.0%) |
| Total (Overall) | 85 (83.3%) | 17 (16.7%) |
Production, Transportation and Moving Occupations
The most common Production, Transportation and Moving occupations in La Ward are , and Production (40 | 39.2%).
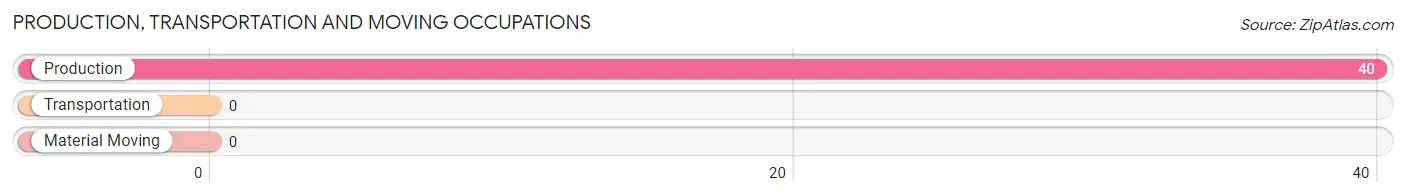
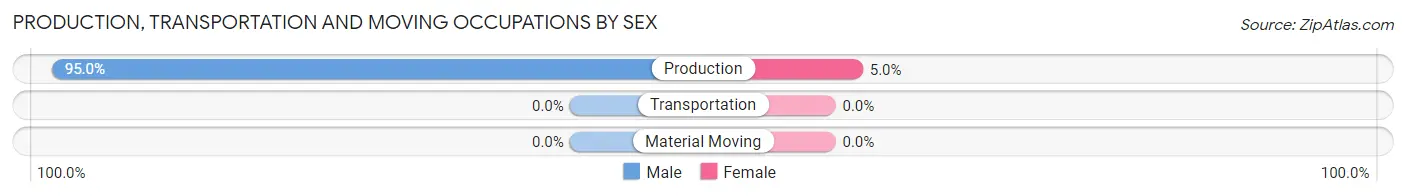
Production, Transportation and Moving Occupations by Sex
| Occupation | Male | Female |
| Production | 38 (95.0%) | 2 (5.0%) |
| Transportation | 0 (0.0%) | 0 (0.0%) |
| Material Moving | 0 (0.0%) | 0 (0.0%) |
| Total (Category) | 38 (95.0%) | 2 (5.0%) |
| Total (Overall) | 85 (83.3%) | 17 (16.7%) |
Employment Industries by Sex in La Ward
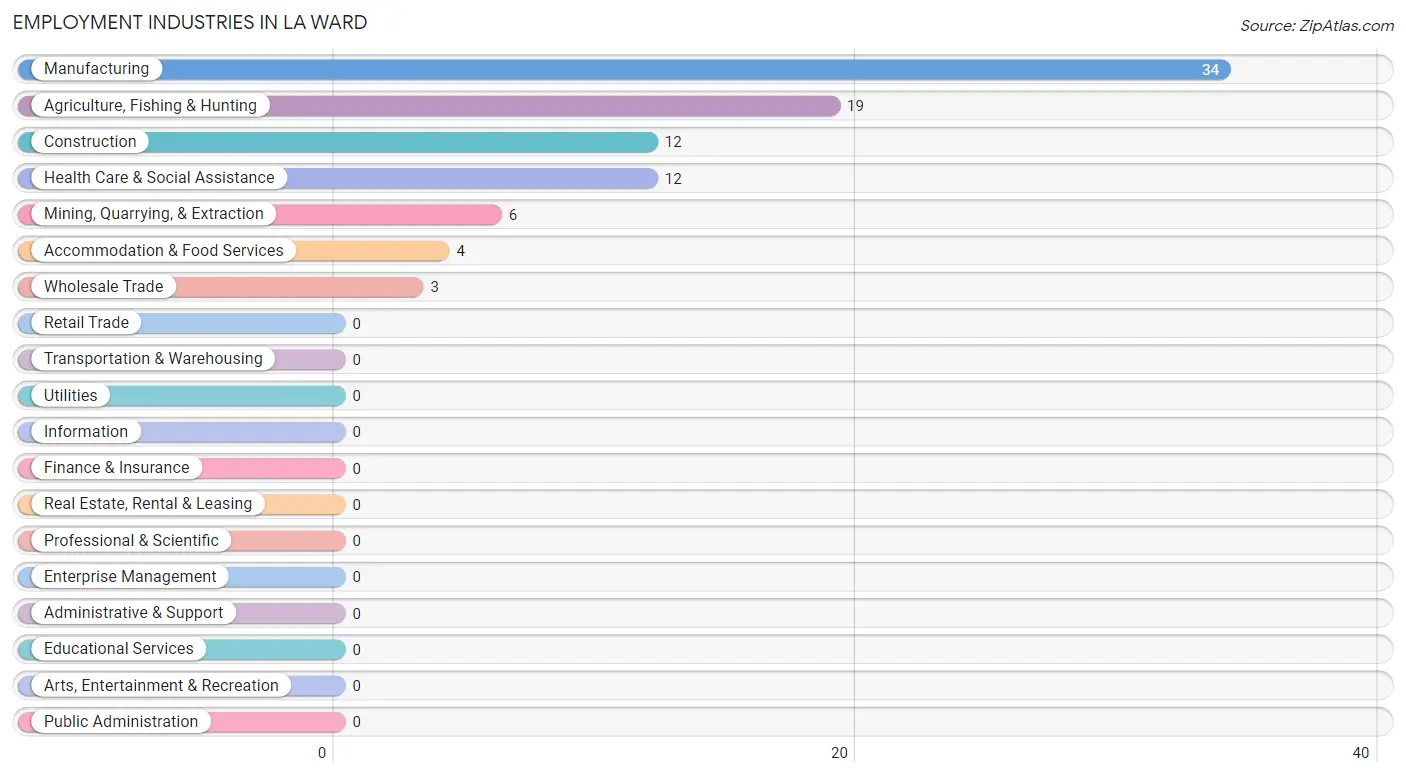
Employment Industries in La Ward
The major employment industries in La Ward include Manufacturing (34 | 33.3%), Agriculture, Fishing & Hunting (19 | 18.6%), Construction (12 | 11.8%), Health Care & Social Assistance (12 | 11.8%), and Mining, Quarrying, & Extraction (6 | 5.9%).
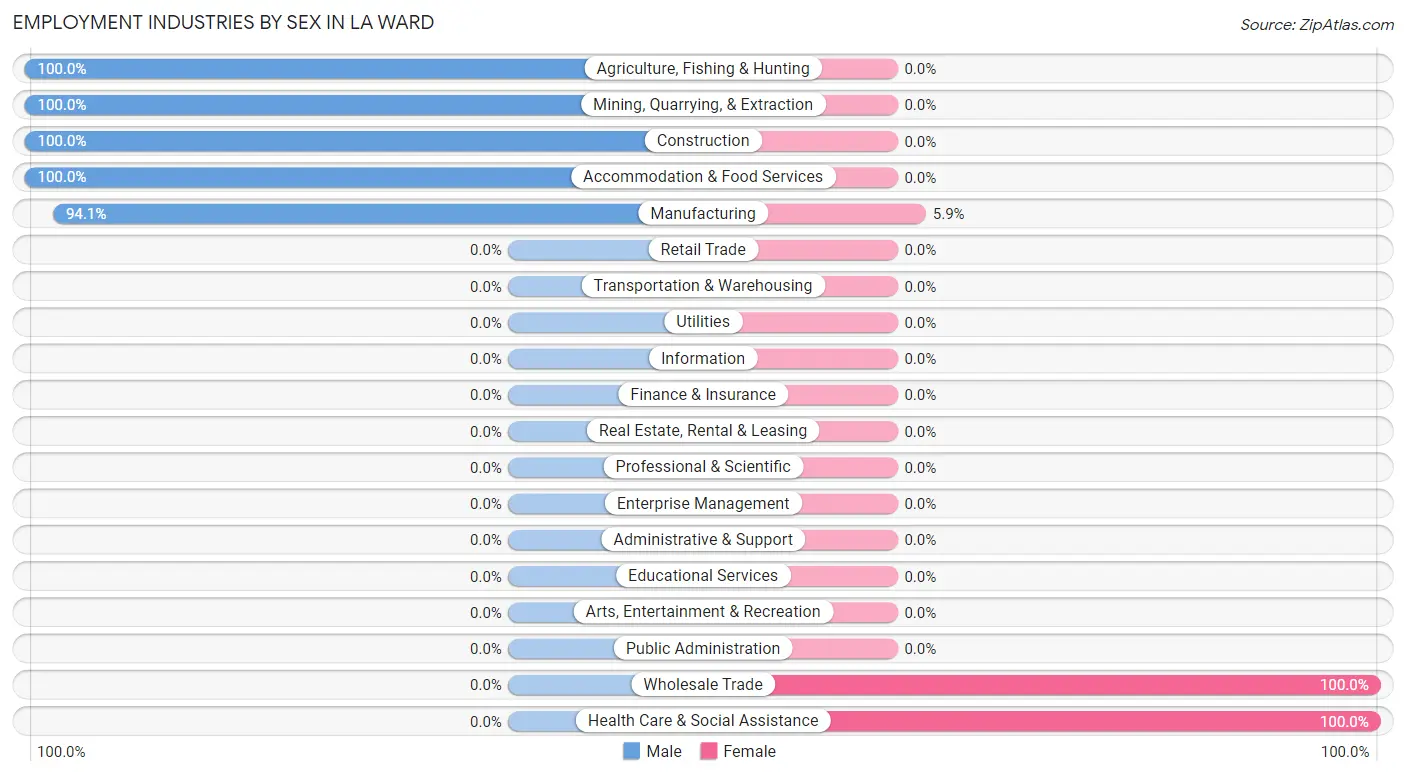
Employment Industries by Sex in La Ward
The La Ward industries that see more men than women are Agriculture, Fishing & Hunting (100.0%), Mining, Quarrying, & Extraction (100.0%), and Construction (100.0%), whereas the industries that tend to have a higher number of women are Wholesale Trade (100.0%), Health Care & Social Assistance (100.0%), and Manufacturing (5.9%).
| Industry | Male | Female |
| Agriculture, Fishing & Hunting | 19 (100.0%) | 0 (0.0%) |
| Mining, Quarrying, & Extraction | 6 (100.0%) | 0 (0.0%) |
| Construction | 12 (100.0%) | 0 (0.0%) |
| Manufacturing | 32 (94.1%) | 2 (5.9%) |
| Wholesale Trade | 0 (0.0%) | 3 (100.0%) |
| Retail Trade | 0 (0.0%) | 0 (0.0%) |
| Transportation & Warehousing | 0 (0.0%) | 0 (0.0%) |
| Utilities | 0 (0.0%) | 0 (0.0%) |
| Information | 0 (0.0%) | 0 (0.0%) |
| Finance & Insurance | 0 (0.0%) | 0 (0.0%) |
| Real Estate, Rental & Leasing | 0 (0.0%) | 0 (0.0%) |
| Professional & Scientific | 0 (0.0%) | 0 (0.0%) |
| Enterprise Management | 0 (0.0%) | 0 (0.0%) |
| Administrative & Support | 0 (0.0%) | 0 (0.0%) |
| Educational Services | 0 (0.0%) | 0 (0.0%) |
| Health Care & Social Assistance | 0 (0.0%) | 12 (100.0%) |
| Arts, Entertainment & Recreation | 0 (0.0%) | 0 (0.0%) |
| Accommodation & Food Services | 4 (100.0%) | 0 (0.0%) |
| Public Administration | 0 (0.0%) | 0 (0.0%) |
| Total | 85 (83.3%) | 17 (16.7%) |
Education in La Ward
School Enrollment in La Ward
The most common levels of schooling among the 45 students in La Ward are elementary school (20 | 44.4%), kindergarten (12 | 26.7%), and high school (9 | 20.0%).
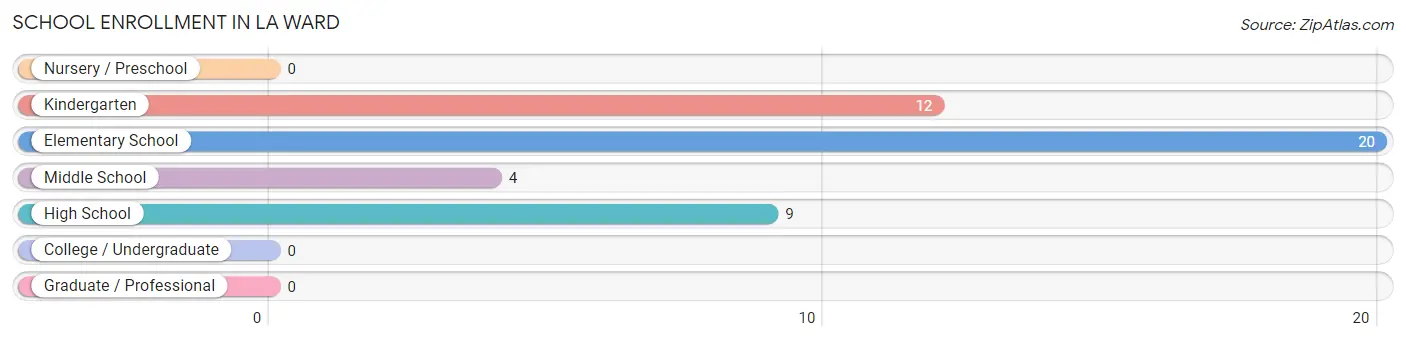
| School Level | # Students | % Students |
| Nursery / Preschool | 0 | 0.0% |
| Kindergarten | 12 | 26.7% |
| Elementary School | 20 | 44.4% |
| Middle School | 4 | 8.9% |
| High School | 9 | 20.0% |
| College / Undergraduate | 0 | 0.0% |
| Graduate / Professional | 0 | 0.0% |
| Total | 45 | 100.0% |
School Enrollment by Age by Funding Source in La Ward
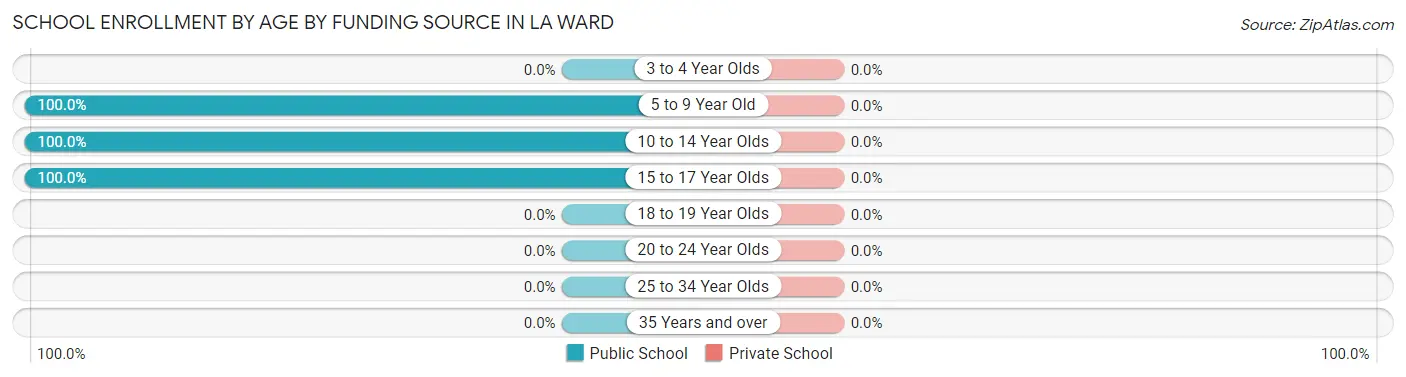
| Age Bracket | Public School | Private School |
| 3 to 4 Year Olds | 0 (0.0%) | 0 (0.0%) |
| 5 to 9 Year Old | 28 (100.0%) | 0 (0.0%) |
| 10 to 14 Year Olds | 14 (100.0%) | 0 (0.0%) |
| 15 to 17 Year Olds | 3 (100.0%) | 0 (0.0%) |
| 18 to 19 Year Olds | 0 (0.0%) | 0 (0.0%) |
| 20 to 24 Year Olds | 0 (0.0%) | 0 (0.0%) |
| 25 to 34 Year Olds | 0 (0.0%) | 0 (0.0%) |
| 35 Years and over | 0 (0.0%) | 0 (0.0%) |
| Total | 45 (100.0%) | 0 (0.0%) |
Educational Attainment by Field of Study in La Ward
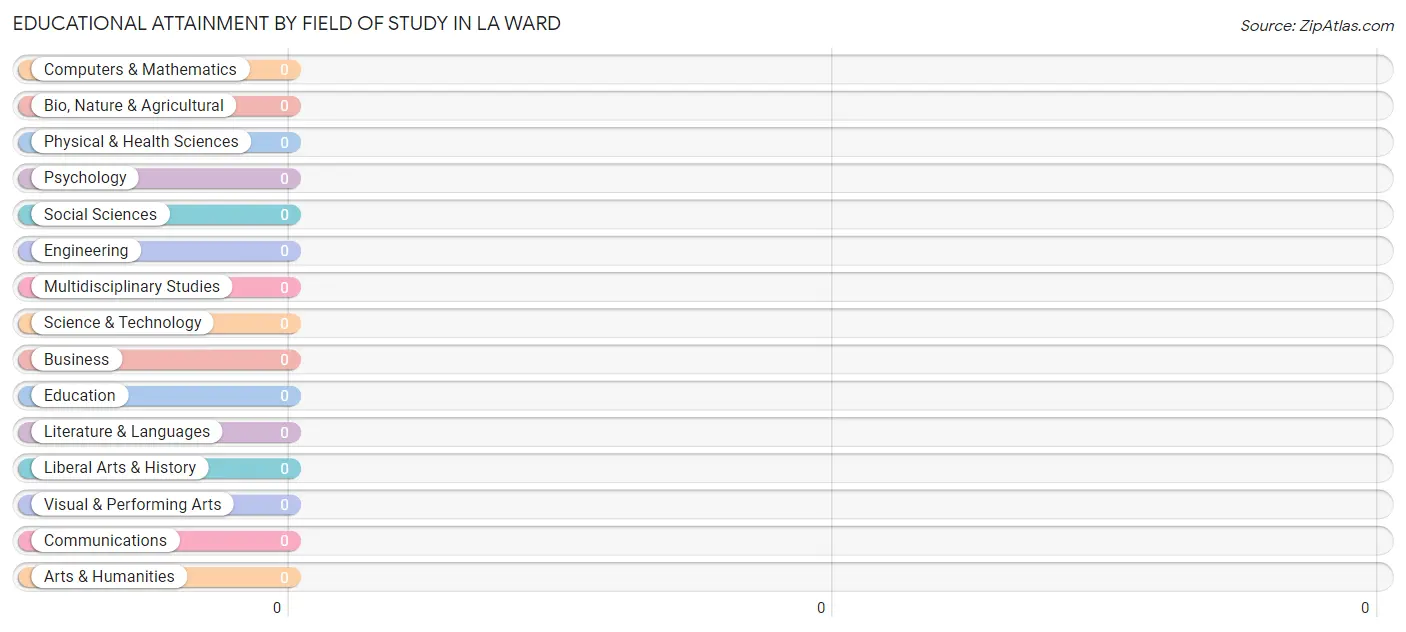
| Field of Study | # Graduates | % Graduates |
| Computers & Mathematics | 0 | 0.0% |
| Bio, Nature & Agricultural | 0 | 0.0% |
| Physical & Health Sciences | 0 | 0.0% |
| Psychology | 0 | 0.0% |
| Social Sciences | 0 | 0.0% |
| Engineering | 0 | 0.0% |
| Multidisciplinary Studies | 0 | 0.0% |
| Science & Technology | 0 | 0.0% |
| Business | 0 | 0.0% |
| Education | 0 | 0.0% |
| Literature & Languages | 0 | 0.0% |
| Liberal Arts & History | 0 | 0.0% |
| Visual & Performing Arts | 0 | 0.0% |
| Communications | 0 | 0.0% |
| Arts & Humanities | 0 | 0.0% |
| Total | 0 | 0.0% |
Transportation & Commute in La Ward
Vehicle Availability by Sex in La Ward
The most prevalent vehicle ownership categories in La Ward are males with 2 vehicles (47, accounting for 55.3%) and females with 2 vehicles (0, making up 276.5%).
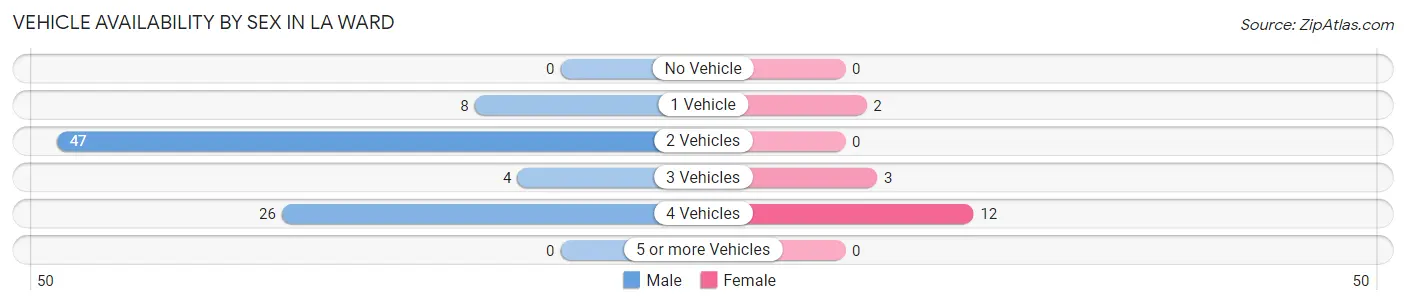
| Vehicles Available | Male | Female |
| No Vehicle | 0 (0.0%) | 0 (0.0%) |
| 1 Vehicle | 8 (9.4%) | 2 (11.8%) |
| 2 Vehicles | 47 (55.3%) | 0 (0.0%) |
| 3 Vehicles | 4 (4.7%) | 3 (17.6%) |
| 4 Vehicles | 26 (30.6%) | 12 (70.6%) |
| 5 or more Vehicles | 0 (0.0%) | 0 (0.0%) |
| Total | 85 (100.0%) | 17 (100.0%) |
Commute Time in La Ward
The most frequently occuring commute durations in La Ward are 10 to 14 minutes (25 commuters, 24.5%), 90 or more minutes (18 commuters, 17.6%), and 5 to 9 minutes (16 commuters, 15.7%).
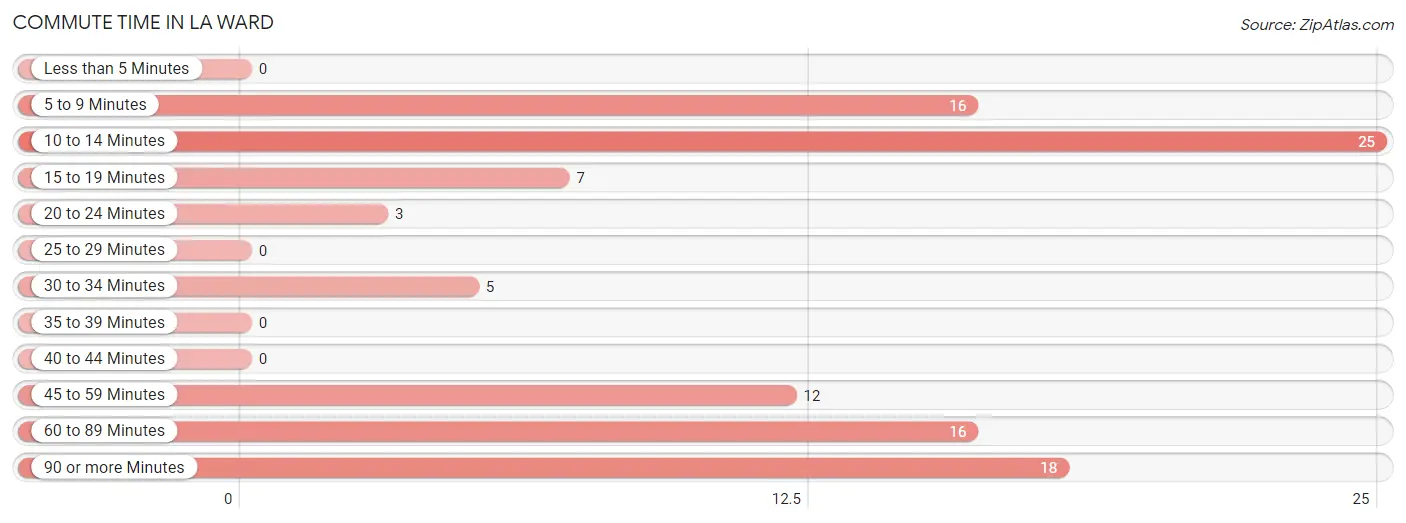
| Commute Time | # Commuters | % Commuters |
| Less than 5 Minutes | 0 | 0.0% |
| 5 to 9 Minutes | 16 | 15.7% |
| 10 to 14 Minutes | 25 | 24.5% |
| 15 to 19 Minutes | 7 | 6.9% |
| 20 to 24 Minutes | 3 | 2.9% |
| 25 to 29 Minutes | 0 | 0.0% |
| 30 to 34 Minutes | 5 | 4.9% |
| 35 to 39 Minutes | 0 | 0.0% |
| 40 to 44 Minutes | 0 | 0.0% |
| 45 to 59 Minutes | 12 | 11.8% |
| 60 to 89 Minutes | 16 | 15.7% |
| 90 or more Minutes | 18 | 17.6% |
Commute Time by Sex in La Ward
The most common commute times in La Ward are 10 to 14 minutes (25 commuters, 29.4%) for males and 45 to 59 minutes (12 commuters, 70.6%) for females.
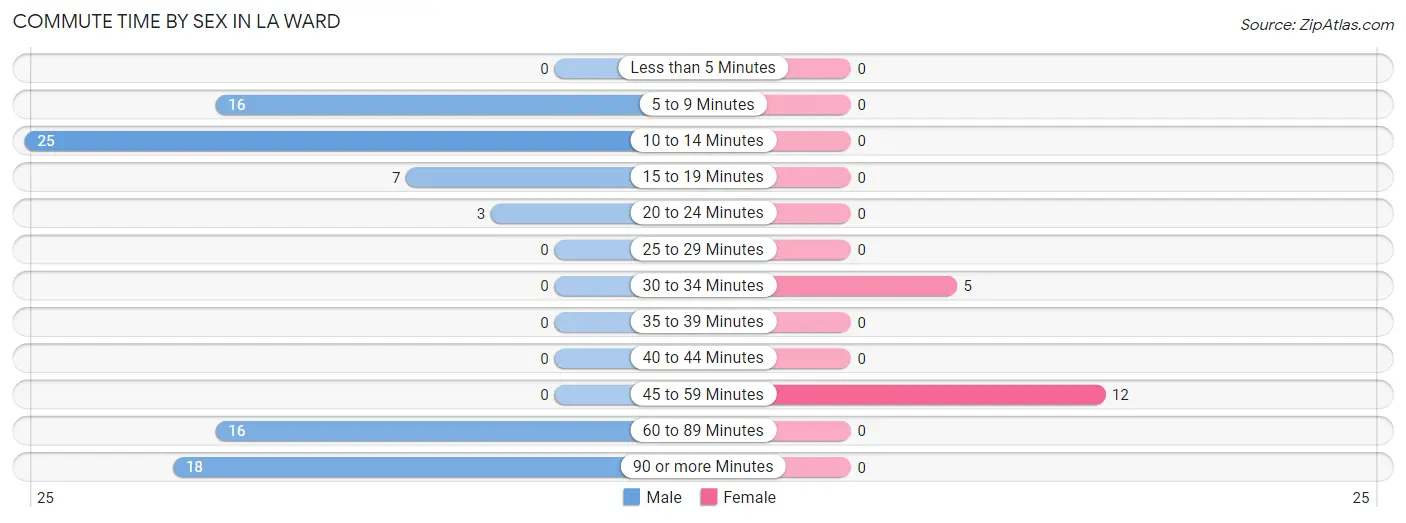
| Commute Time | Male | Female |
| Less than 5 Minutes | 0 (0.0%) | 0 (0.0%) |
| 5 to 9 Minutes | 16 (18.8%) | 0 (0.0%) |
| 10 to 14 Minutes | 25 (29.4%) | 0 (0.0%) |
| 15 to 19 Minutes | 7 (8.2%) | 0 (0.0%) |
| 20 to 24 Minutes | 3 (3.5%) | 0 (0.0%) |
| 25 to 29 Minutes | 0 (0.0%) | 0 (0.0%) |
| 30 to 34 Minutes | 0 (0.0%) | 5 (29.4%) |
| 35 to 39 Minutes | 0 (0.0%) | 0 (0.0%) |
| 40 to 44 Minutes | 0 (0.0%) | 0 (0.0%) |
| 45 to 59 Minutes | 0 (0.0%) | 12 (70.6%) |
| 60 to 89 Minutes | 16 (18.8%) | 0 (0.0%) |
| 90 or more Minutes | 18 (21.2%) | 0 (0.0%) |
Time of Departure to Work by Sex in La Ward
The most frequent times of departure to work in La Ward are 5:00 AM to 5:29 AM (21, 24.7%) for males and 4:00 PM to 11:59 PM (12, 70.6%) for females.
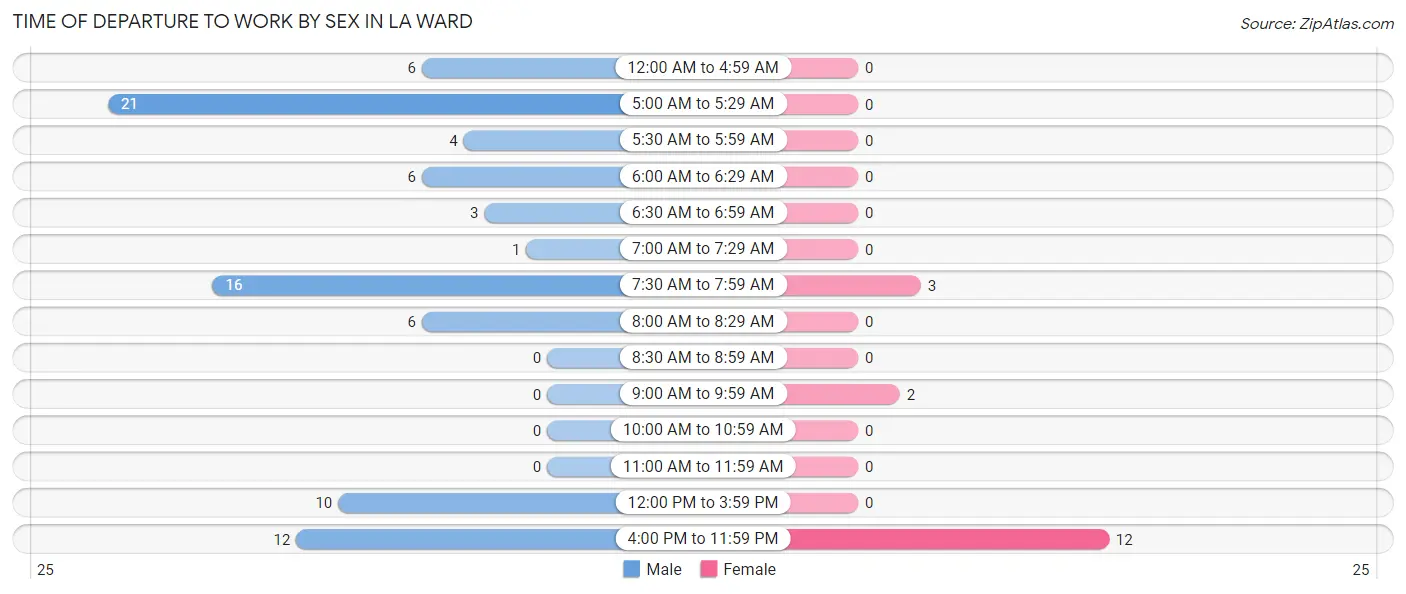
| Time of Departure | Male | Female |
| 12:00 AM to 4:59 AM | 6 (7.1%) | 0 (0.0%) |
| 5:00 AM to 5:29 AM | 21 (24.7%) | 0 (0.0%) |
| 5:30 AM to 5:59 AM | 4 (4.7%) | 0 (0.0%) |
| 6:00 AM to 6:29 AM | 6 (7.1%) | 0 (0.0%) |
| 6:30 AM to 6:59 AM | 3 (3.5%) | 0 (0.0%) |
| 7:00 AM to 7:29 AM | 1 (1.2%) | 0 (0.0%) |
| 7:30 AM to 7:59 AM | 16 (18.8%) | 3 (17.6%) |
| 8:00 AM to 8:29 AM | 6 (7.1%) | 0 (0.0%) |
| 8:30 AM to 8:59 AM | 0 (0.0%) | 0 (0.0%) |
| 9:00 AM to 9:59 AM | 0 (0.0%) | 2 (11.8%) |
| 10:00 AM to 10:59 AM | 0 (0.0%) | 0 (0.0%) |
| 11:00 AM to 11:59 AM | 0 (0.0%) | 0 (0.0%) |
| 12:00 PM to 3:59 PM | 10 (11.8%) | 0 (0.0%) |
| 4:00 PM to 11:59 PM | 12 (14.1%) | 12 (70.6%) |
| Total | 85 (100.0%) | 17 (100.0%) |
Housing Occupancy in La Ward
Occupancy by Ownership in La Ward
Of the total 64 dwellings in La Ward, owner-occupied units account for 37 (57.8%), while renter-occupied units make up 27 (42.2%).
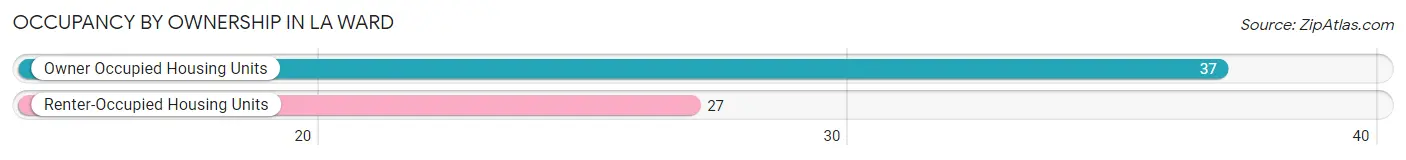
| Occupancy | # Housing Units | % Housing Units |
| Owner Occupied Housing Units | 37 | 57.8% |
| Renter-Occupied Housing Units | 27 | 42.2% |
| Total Occupied Housing Units | 64 | 100.0% |
Occupancy by Household Size in La Ward
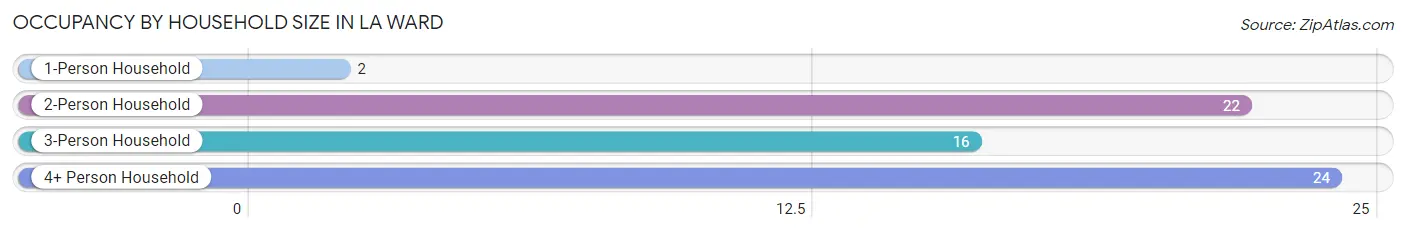
| Household Size | # Housing Units | % Housing Units |
| 1-Person Household | 2 | 3.1% |
| 2-Person Household | 22 | 34.4% |
| 3-Person Household | 16 | 25.0% |
| 4+ Person Household | 24 | 37.5% |
| Total Housing Units | 64 | 100.0% |
Occupancy by Ownership by Household Size in La Ward
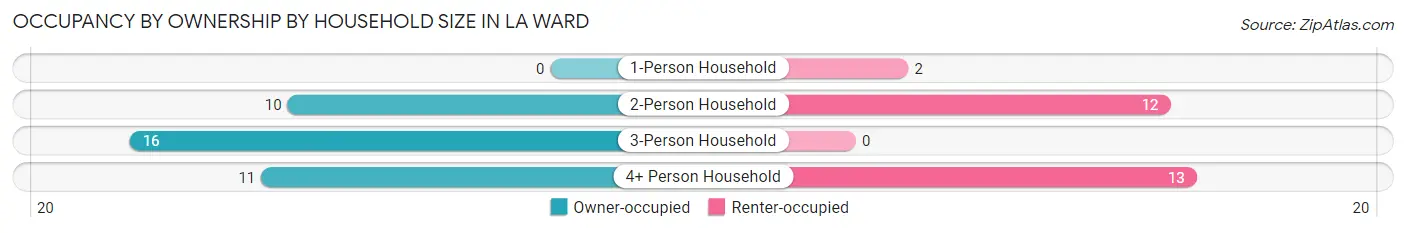
| Household Size | Owner-occupied | Renter-occupied |
| 1-Person Household | 0 (0.0%) | 2 (100.0%) |
| 2-Person Household | 10 (45.5%) | 12 (54.5%) |
| 3-Person Household | 16 (100.0%) | 0 (0.0%) |
| 4+ Person Household | 11 (45.8%) | 13 (54.2%) |
| Total Housing Units | 37 (57.8%) | 27 (42.2%) |
Occupancy by Educational Attainment in La Ward
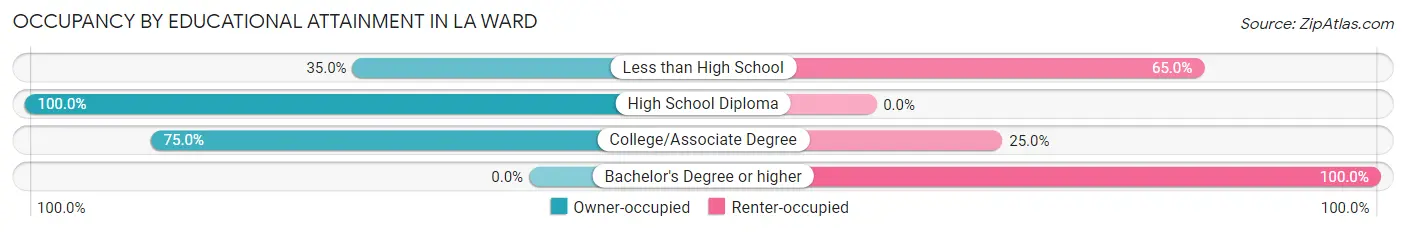
| Household Size | Owner-occupied | Renter-occupied |
| Less than High School | 7 (35.0%) | 13 (65.0%) |
| High School Diploma | 24 (100.0%) | 0 (0.0%) |
| College/Associate Degree | 6 (75.0%) | 2 (25.0%) |
| Bachelor's Degree or higher | 0 (0.0%) | 12 (100.0%) |
Occupancy by Age of Householder in La Ward
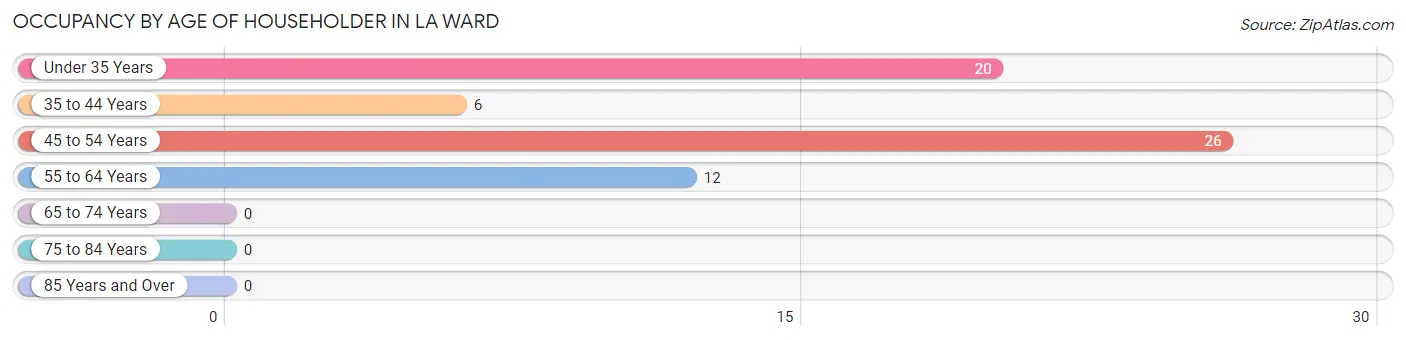
| Age Bracket | # Households | % Households |
| Under 35 Years | 20 | 31.2% |
| 35 to 44 Years | 6 | 9.4% |
| 45 to 54 Years | 26 | 40.6% |
| 55 to 64 Years | 12 | 18.8% |
| 65 to 74 Years | 0 | 0.0% |
| 75 to 84 Years | 0 | 0.0% |
| 85 Years and Over | 0 | 0.0% |
| Total | 64 | 100.0% |
Housing Finances in La Ward
Median Income by Occupancy in La Ward
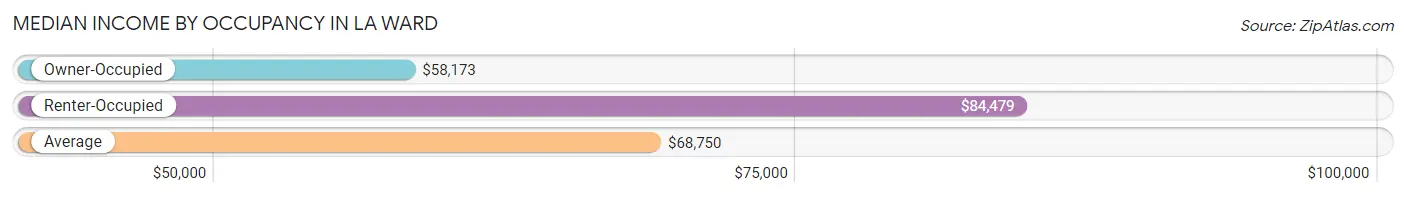
| Occupancy Type | # Households | Median Income |
| Owner-Occupied | 37 (57.8%) | $58,173 |
| Renter-Occupied | 27 (42.2%) | $84,479 |
| Average | 64 (100.0%) | $68,750 |
Occupancy by Householder Income Bracket in La Ward
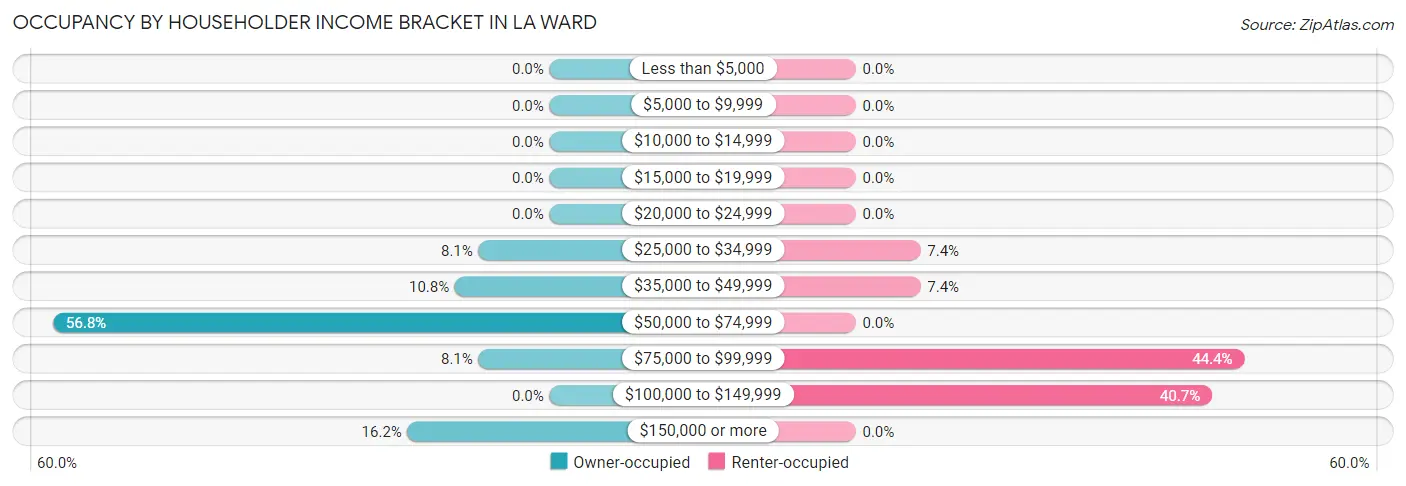
| Income Bracket | Owner-occupied | Renter-occupied |
| Less than $5,000 | 0 (0.0%) | 0 (0.0%) |
| $5,000 to $9,999 | 0 (0.0%) | 0 (0.0%) |
| $10,000 to $14,999 | 0 (0.0%) | 0 (0.0%) |
| $15,000 to $19,999 | 0 (0.0%) | 0 (0.0%) |
| $20,000 to $24,999 | 0 (0.0%) | 0 (0.0%) |
| $25,000 to $34,999 | 3 (8.1%) | 2 (7.4%) |
| $35,000 to $49,999 | 4 (10.8%) | 2 (7.4%) |
| $50,000 to $74,999 | 21 (56.8%) | 0 (0.0%) |
| $75,000 to $99,999 | 3 (8.1%) | 12 (44.4%) |
| $100,000 to $149,999 | 0 (0.0%) | 11 (40.7%) |
| $150,000 or more | 6 (16.2%) | 0 (0.0%) |
| Total | 37 (100.0%) | 27 (100.0%) |
Monthly Housing Cost Tiers in La Ward
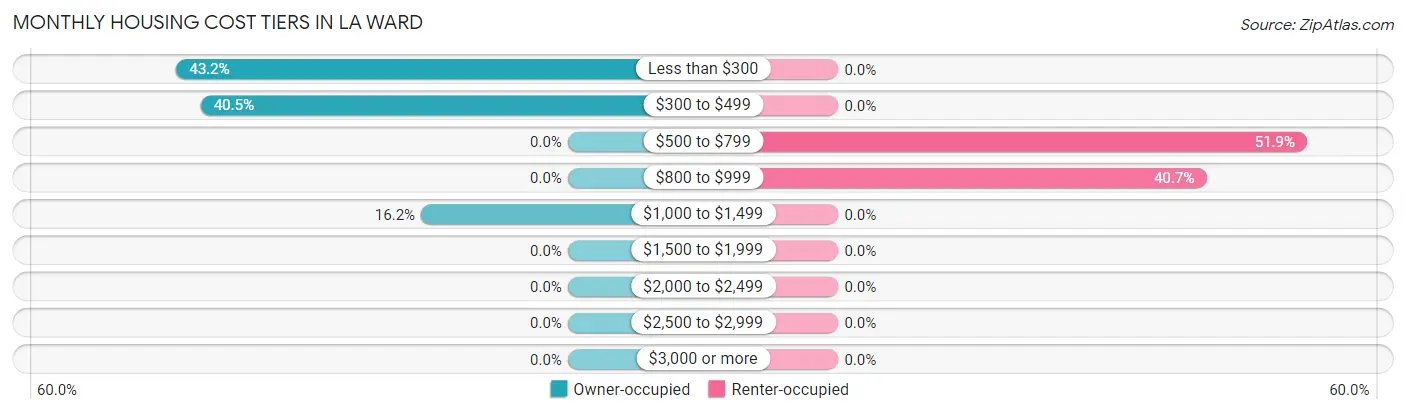
| Monthly Cost | Owner-occupied | Renter-occupied |
| Less than $300 | 16 (43.2%) | 0 (0.0%) |
| $300 to $499 | 15 (40.5%) | 0 (0.0%) |
| $500 to $799 | 0 (0.0%) | 14 (51.8%) |
| $800 to $999 | 0 (0.0%) | 11 (40.7%) |
| $1,000 to $1,499 | 6 (16.2%) | 0 (0.0%) |
| $1,500 to $1,999 | 0 (0.0%) | 0 (0.0%) |
| $2,000 to $2,499 | 0 (0.0%) | 0 (0.0%) |
| $2,500 to $2,999 | 0 (0.0%) | 0 (0.0%) |
| $3,000 or more | 0 (0.0%) | 0 (0.0%) |
| Total | 37 (100.0%) | 27 (100.0%) |
Physical Housing Characteristics in La Ward
Housing Structures in La Ward
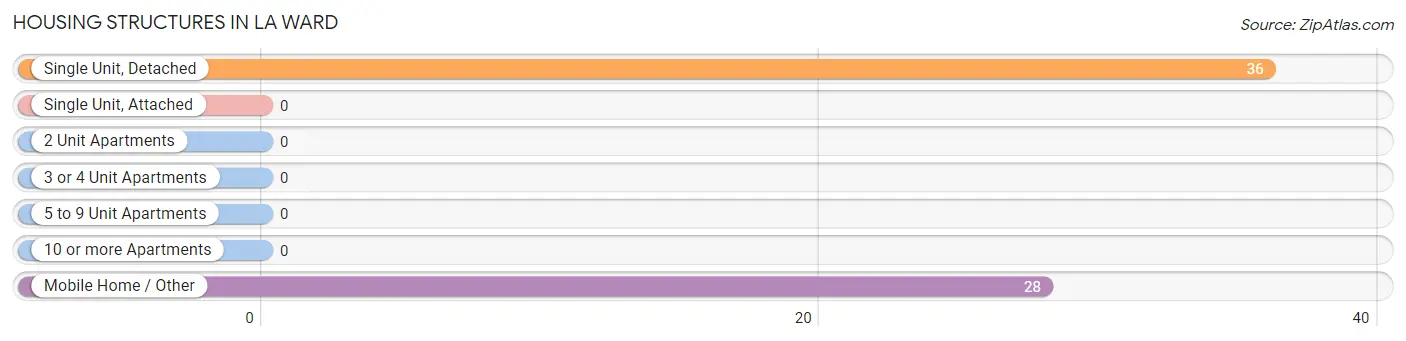
| Structure Type | # Housing Units | % Housing Units |
| Single Unit, Detached | 36 | 56.2% |
| Single Unit, Attached | 0 | 0.0% |
| 2 Unit Apartments | 0 | 0.0% |
| 3 or 4 Unit Apartments | 0 | 0.0% |
| 5 to 9 Unit Apartments | 0 | 0.0% |
| 10 or more Apartments | 0 | 0.0% |
| Mobile Home / Other | 28 | 43.8% |
| Total | 64 | 100.0% |
Housing Structures by Occupancy in La Ward
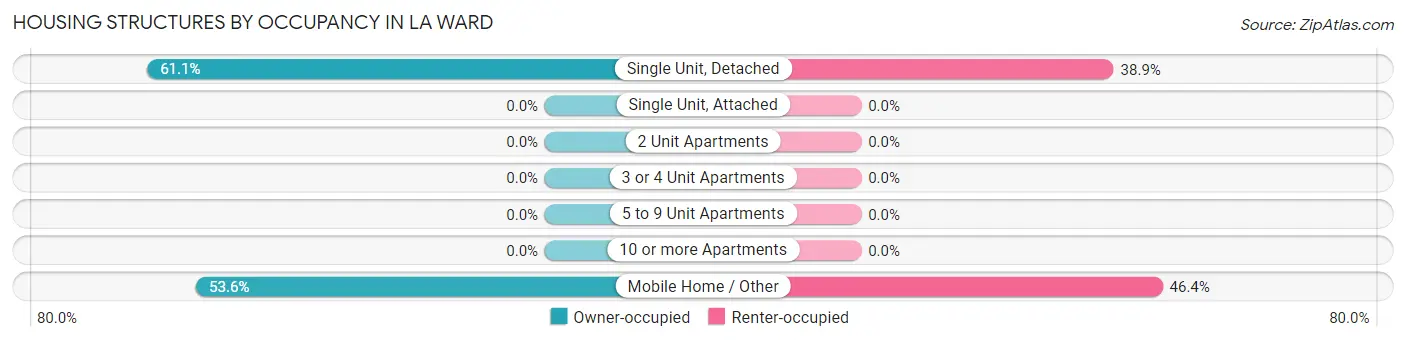
| Structure Type | Owner-occupied | Renter-occupied |
| Single Unit, Detached | 22 (61.1%) | 14 (38.9%) |
| Single Unit, Attached | 0 (0.0%) | 0 (0.0%) |
| 2 Unit Apartments | 0 (0.0%) | 0 (0.0%) |
| 3 or 4 Unit Apartments | 0 (0.0%) | 0 (0.0%) |
| 5 to 9 Unit Apartments | 0 (0.0%) | 0 (0.0%) |
| 10 or more Apartments | 0 (0.0%) | 0 (0.0%) |
| Mobile Home / Other | 15 (53.6%) | 13 (46.4%) |
| Total | 37 (57.8%) | 27 (42.2%) |
Housing Structures by Number of Rooms in La Ward
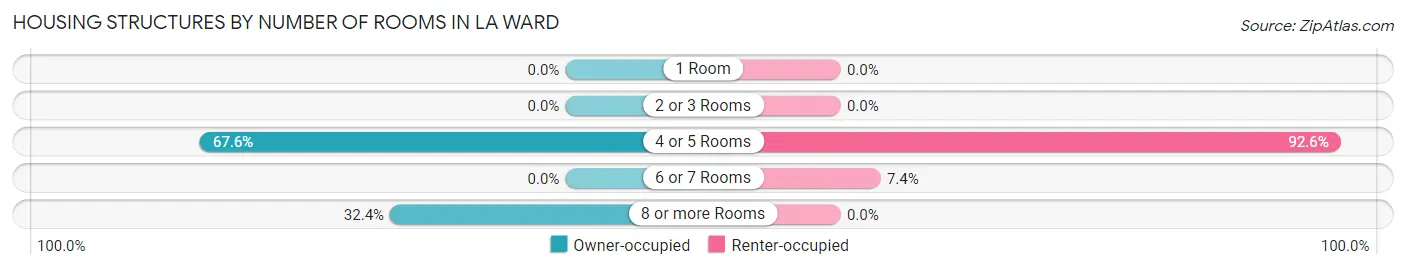
| Number of Rooms | Owner-occupied | Renter-occupied |
| 1 Room | 0 (0.0%) | 0 (0.0%) |
| 2 or 3 Rooms | 0 (0.0%) | 0 (0.0%) |
| 4 or 5 Rooms | 25 (67.6%) | 25 (92.6%) |
| 6 or 7 Rooms | 0 (0.0%) | 2 (7.4%) |
| 8 or more Rooms | 12 (32.4%) | 0 (0.0%) |
| Total | 37 (100.0%) | 27 (100.0%) |
Housing Structure by Heating Type in La Ward
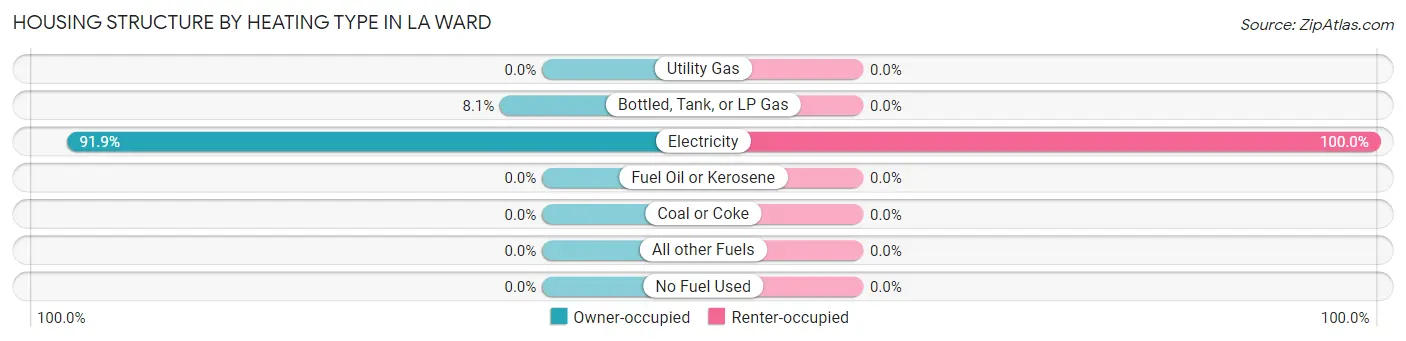
| Heating Type | Owner-occupied | Renter-occupied |
| Utility Gas | 0 (0.0%) | 0 (0.0%) |
| Bottled, Tank, or LP Gas | 3 (8.1%) | 0 (0.0%) |
| Electricity | 34 (91.9%) | 27 (100.0%) |
| Fuel Oil or Kerosene | 0 (0.0%) | 0 (0.0%) |
| Coal or Coke | 0 (0.0%) | 0 (0.0%) |
| All other Fuels | 0 (0.0%) | 0 (0.0%) |
| No Fuel Used | 0 (0.0%) | 0 (0.0%) |
| Total | 37 (100.0%) | 27 (100.0%) |
Household Vehicle Usage in La Ward
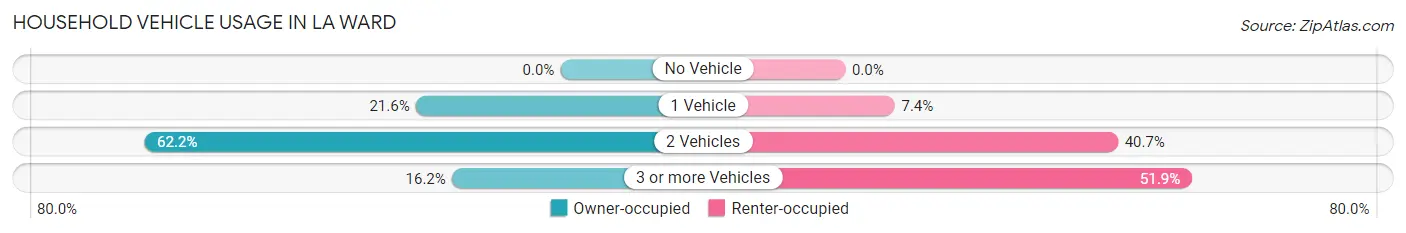
| Vehicles per Household | Owner-occupied | Renter-occupied |
| No Vehicle | 0 (0.0%) | 0 (0.0%) |
| 1 Vehicle | 8 (21.6%) | 2 (7.4%) |
| 2 Vehicles | 23 (62.2%) | 11 (40.7%) |
| 3 or more Vehicles | 6 (16.2%) | 14 (51.8%) |
| Total | 37 (100.0%) | 27 (100.0%) |
Real Estate & Mortgages in La Ward
Real Estate and Mortgage Overview in La Ward
| Characteristic | Without Mortgage | With Mortgage |
| Housing Units | 31 | 6 |
| Median Property Value | $35,800 | $0 |
| Median Household Income | $57,596 | $6 |
| Monthly Housing Costs | $298 | $0 |
| Real Estate Taxes | $423 | $0 |
Property Value by Mortgage Status in La Ward
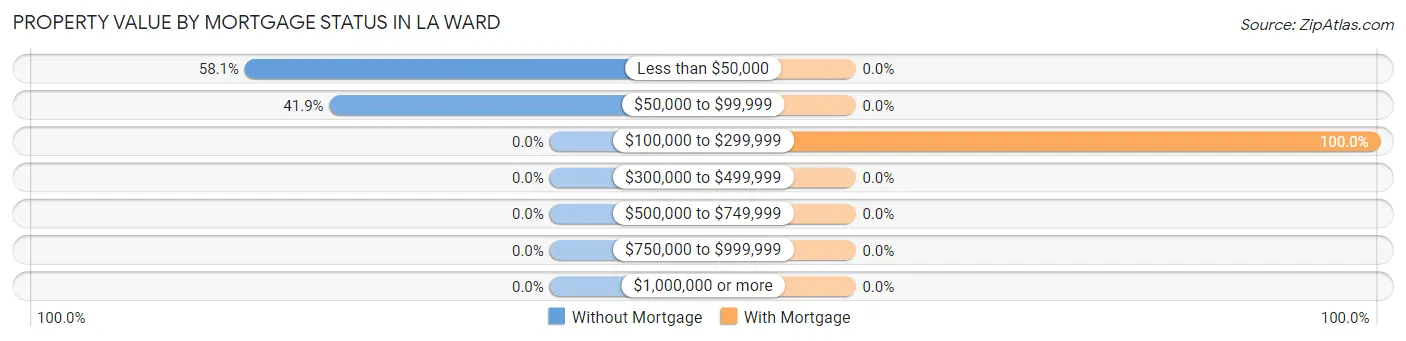
| Property Value | Without Mortgage | With Mortgage |
| Less than $50,000 | 18 (58.1%) | 0 (0.0%) |
| $50,000 to $99,999 | 13 (41.9%) | 0 (0.0%) |
| $100,000 to $299,999 | 0 (0.0%) | 6 (100.0%) |
| $300,000 to $499,999 | 0 (0.0%) | 0 (0.0%) |
| $500,000 to $749,999 | 0 (0.0%) | 0 (0.0%) |
| $750,000 to $999,999 | 0 (0.0%) | 0 (0.0%) |
| $1,000,000 or more | 0 (0.0%) | 0 (0.0%) |
| Total | 31 (100.0%) | 6 (100.0%) |
Household Income by Mortgage Status in La Ward
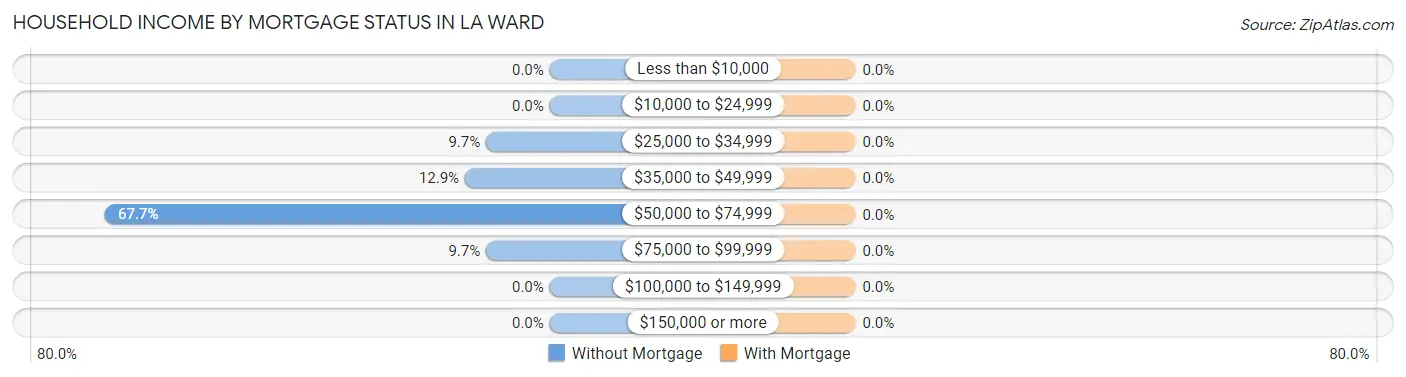
| Household Income | Without Mortgage | With Mortgage |
| Less than $10,000 | 0 (0.0%) | 0 (0.0%) |
| $10,000 to $24,999 | 0 (0.0%) | 0 (0.0%) |
| $25,000 to $34,999 | 3 (9.7%) | 0 (0.0%) |
| $35,000 to $49,999 | 4 (12.9%) | 0 (0.0%) |
| $50,000 to $74,999 | 21 (67.7%) | 0 (0.0%) |
| $75,000 to $99,999 | 3 (9.7%) | 0 (0.0%) |
| $100,000 to $149,999 | 0 (0.0%) | 0 (0.0%) |
| $150,000 or more | 0 (0.0%) | 0 (0.0%) |
| Total | 31 (100.0%) | 6 (100.0%) |
Property Value to Household Income Ratio in La Ward
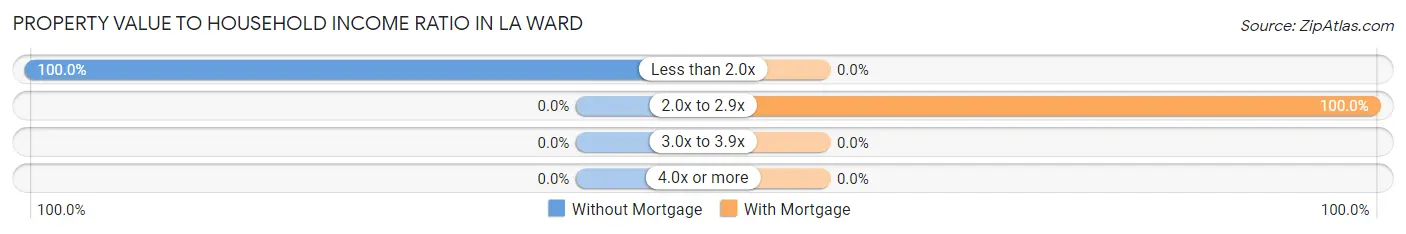
| Value-to-Income Ratio | Without Mortgage | With Mortgage |
| Less than 2.0x | 31 (100.0%) | 0 (0.0%) |
| 2.0x to 2.9x | 0 (0.0%) | 6 (100.0%) |
| 3.0x to 3.9x | 0 (0.0%) | 0 (0.0%) |
| 4.0x or more | 0 (0.0%) | 0 (0.0%) |
| Total | 31 (100.0%) | 6 (100.0%) |
Real Estate Taxes by Mortgage Status in La Ward
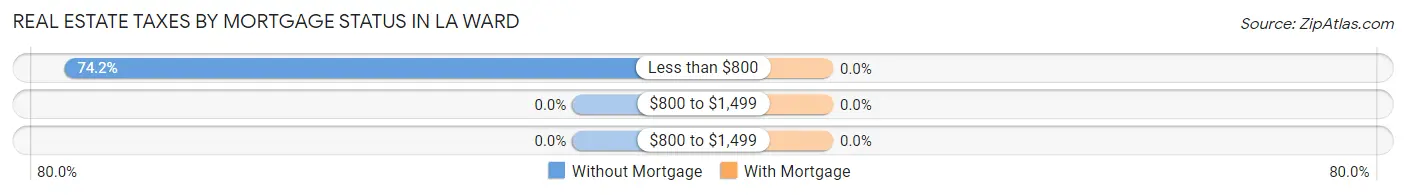
| Property Taxes | Without Mortgage | With Mortgage |
| Less than $800 | 23 (74.2%) | 0 (0.0%) |
| $800 to $1,499 | 0 (0.0%) | 0 (0.0%) |
| $800 to $1,499 | 0 (0.0%) | 0 (0.0%) |
| Total | 31 (100.0%) | 6 (100.0%) |
Health & Disability in La Ward
Health Insurance Coverage by Age in La Ward
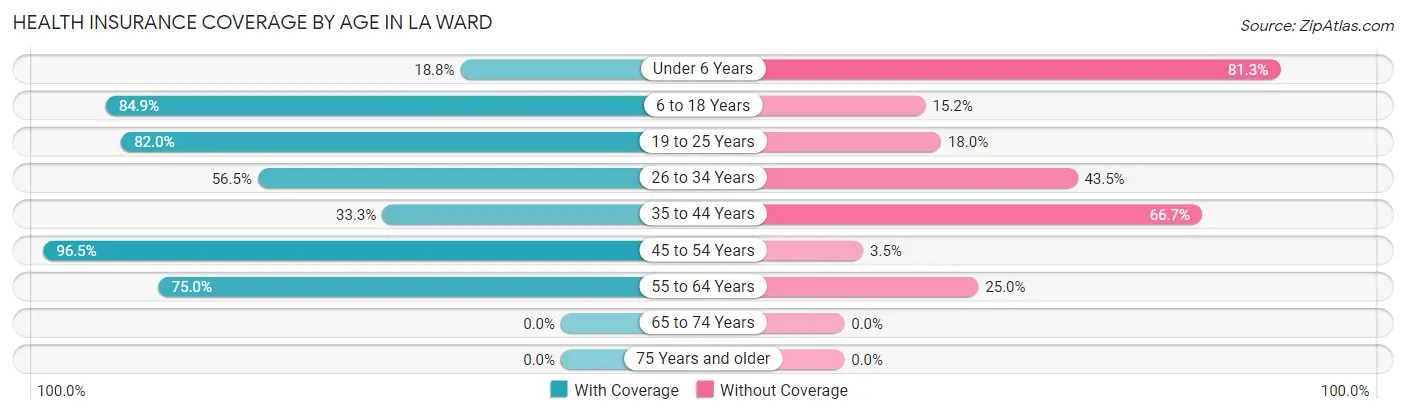
| Age Bracket | With Coverage | Without Coverage |
| Under 6 Years | 6 (18.8%) | 26 (81.2%) |
| 6 to 18 Years | 28 (84.9%) | 5 (15.1%) |
| 19 to 25 Years | 50 (82.0%) | 11 (18.0%) |
| 26 to 34 Years | 13 (56.5%) | 10 (43.5%) |
| 35 to 44 Years | 3 (33.3%) | 6 (66.7%) |
| 45 to 54 Years | 55 (96.5%) | 2 (3.5%) |
| 55 to 64 Years | 18 (75.0%) | 6 (25.0%) |
| 65 to 74 Years | 0 (0.0%) | 0 (0.0%) |
| 75 Years and older | 0 (0.0%) | 0 (0.0%) |
| Total | 173 (72.4%) | 66 (27.6%) |
Health Insurance Coverage by Citizenship Status in La Ward
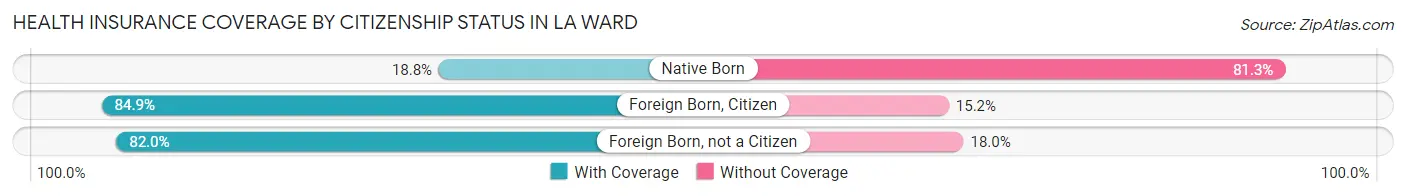
| Citizenship Status | With Coverage | Without Coverage |
| Native Born | 6 (18.8%) | 26 (81.2%) |
| Foreign Born, Citizen | 28 (84.9%) | 5 (15.1%) |
| Foreign Born, not a Citizen | 50 (82.0%) | 11 (18.0%) |
Health Insurance Coverage by Household Income in La Ward
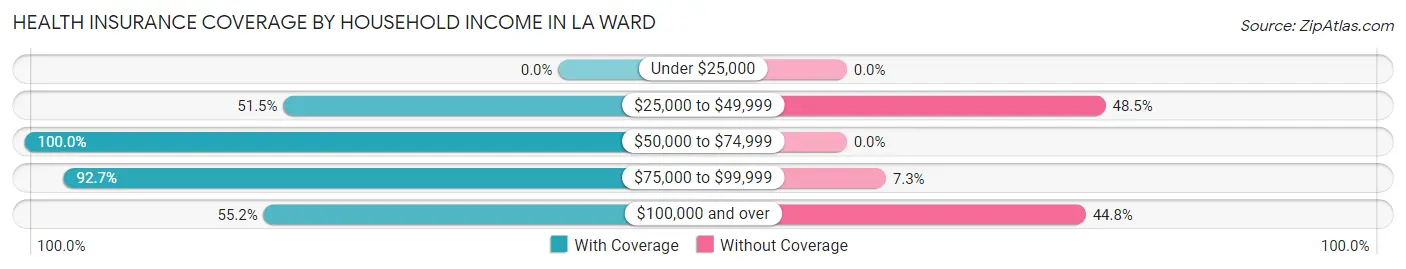
| Household Income | With Coverage | Without Coverage |
| Under $25,000 | 0 (0.0%) | 0 (0.0%) |
| $25,000 to $49,999 | 17 (51.5%) | 16 (48.5%) |
| $50,000 to $74,999 | 60 (100.0%) | 0 (0.0%) |
| $75,000 to $99,999 | 38 (92.7%) | 3 (7.3%) |
| $100,000 and over | 58 (55.2%) | 47 (44.8%) |
Public vs Private Health Insurance Coverage by Age in La Ward
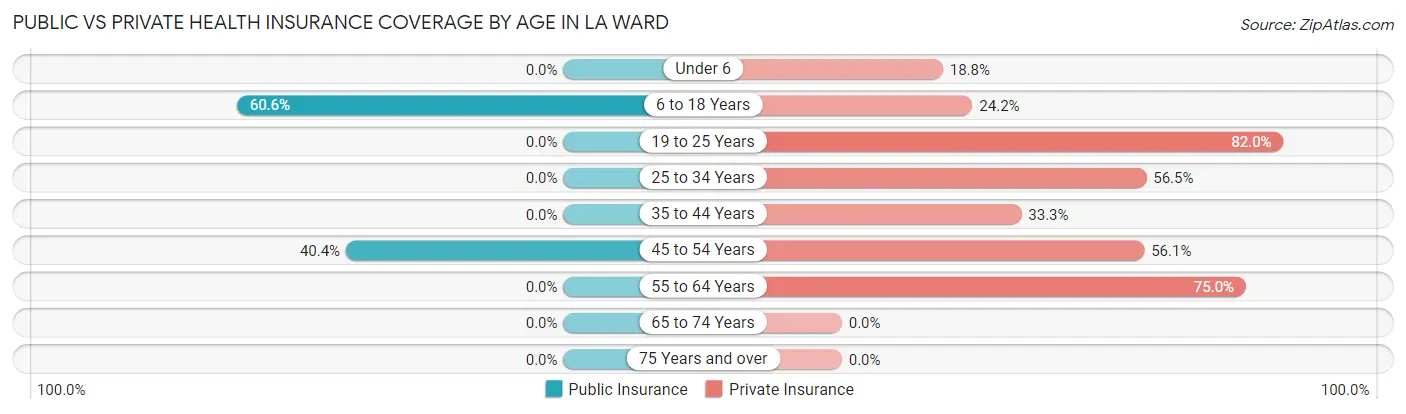
| Age Bracket | Public Insurance | Private Insurance |
| Under 6 | 0 (0.0%) | 6 (18.8%) |
| 6 to 18 Years | 20 (60.6%) | 8 (24.2%) |
| 19 to 25 Years | 0 (0.0%) | 50 (82.0%) |
| 25 to 34 Years | 0 (0.0%) | 13 (56.5%) |
| 35 to 44 Years | 0 (0.0%) | 3 (33.3%) |
| 45 to 54 Years | 23 (40.4%) | 32 (56.1%) |
| 55 to 64 Years | 0 (0.0%) | 18 (75.0%) |
| 65 to 74 Years | 0 (0.0%) | 0 (0.0%) |
| 75 Years and over | 0 (0.0%) | 0 (0.0%) |
| Total | 43 (18.0%) | 130 (54.4%) |
Disability Status by Sex by Age in La Ward
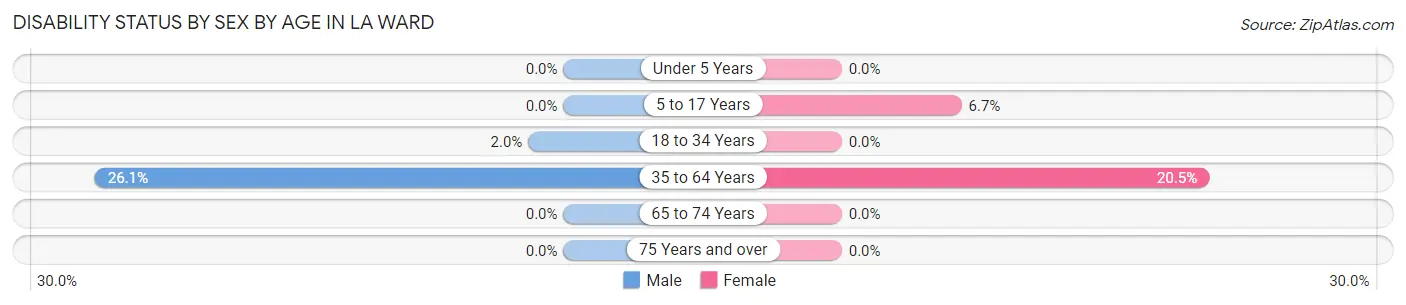
| Age Bracket | Male | Female |
| Under 5 Years | 0 (0.0%) | 0 (0.0%) |
| 5 to 17 Years | 0 (0.0%) | 2 (6.7%) |
| 18 to 34 Years | 1 (2.0%) | 0 (0.0%) |
| 35 to 64 Years | 12 (26.1%) | 9 (20.4%) |
| 65 to 74 Years | 0 (0.0%) | 0 (0.0%) |
| 75 Years and over | 0 (0.0%) | 0 (0.0%) |
Disability Class by Sex by Age in La Ward
Disability Class: Hearing Difficulty
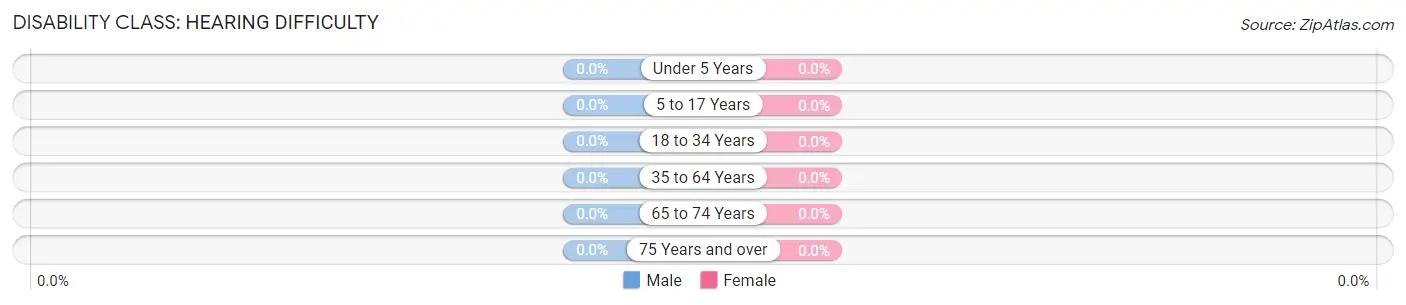
| Age Bracket | Male | Female |
| Under 5 Years | 0 (0.0%) | 0 (0.0%) |
| 5 to 17 Years | 0 (0.0%) | 0 (0.0%) |
| 18 to 34 Years | 0 (0.0%) | 0 (0.0%) |
| 35 to 64 Years | 0 (0.0%) | 0 (0.0%) |
| 65 to 74 Years | 0 (0.0%) | 0 (0.0%) |
| 75 Years and over | 0 (0.0%) | 0 (0.0%) |
Disability Class: Vision Difficulty
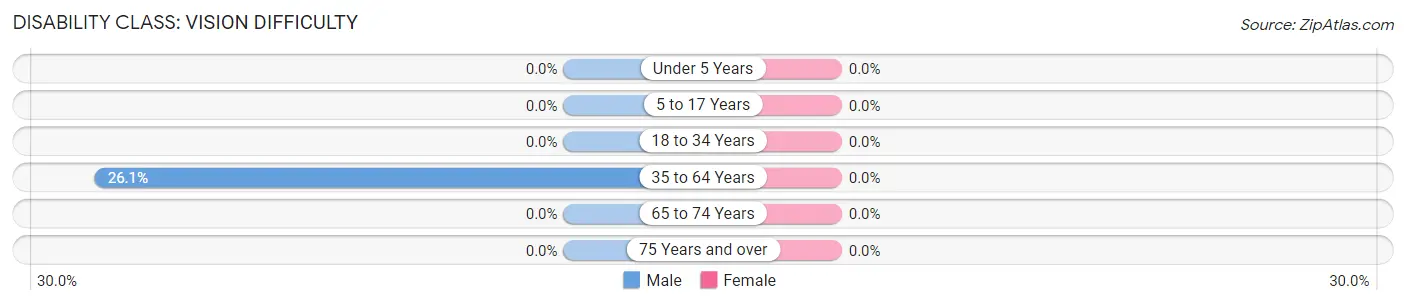
| Age Bracket | Male | Female |
| Under 5 Years | 0 (0.0%) | 0 (0.0%) |
| 5 to 17 Years | 0 (0.0%) | 0 (0.0%) |
| 18 to 34 Years | 0 (0.0%) | 0 (0.0%) |
| 35 to 64 Years | 12 (26.1%) | 0 (0.0%) |
| 65 to 74 Years | 0 (0.0%) | 0 (0.0%) |
| 75 Years and over | 0 (0.0%) | 0 (0.0%) |
Disability Class: Cognitive Difficulty
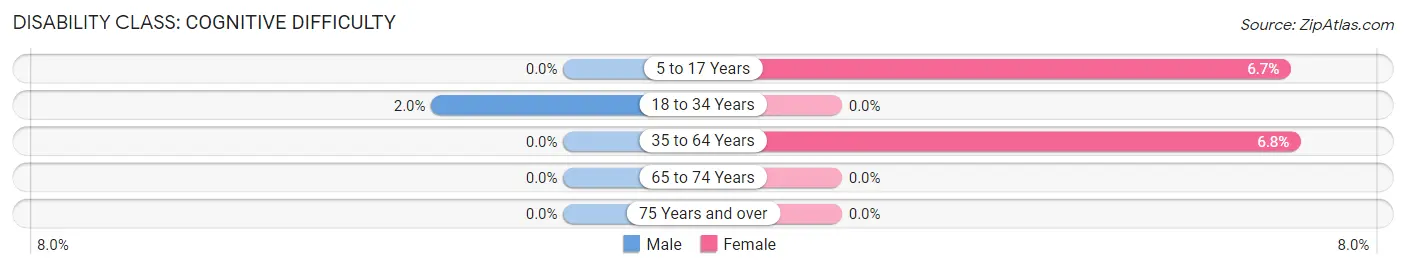
| Age Bracket | Male | Female |
| 5 to 17 Years | 0 (0.0%) | 2 (6.7%) |
| 18 to 34 Years | 1 (2.0%) | 0 (0.0%) |
| 35 to 64 Years | 0 (0.0%) | 3 (6.8%) |
| 65 to 74 Years | 0 (0.0%) | 0 (0.0%) |
| 75 Years and over | 0 (0.0%) | 0 (0.0%) |
Disability Class: Ambulatory Difficulty
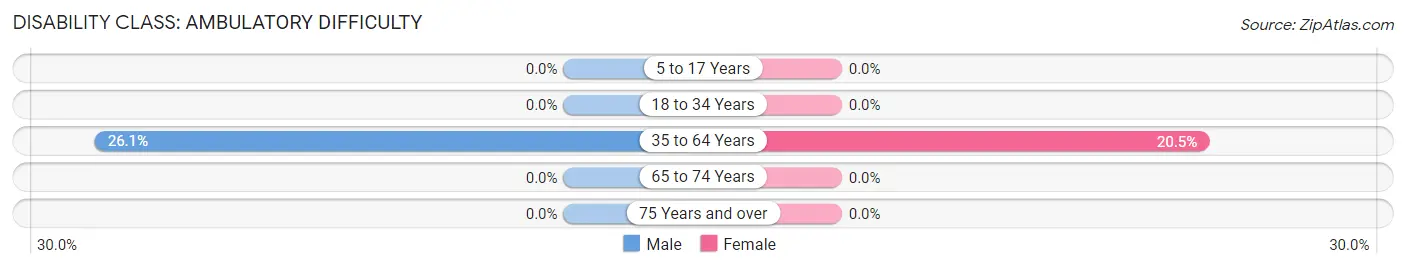
| Age Bracket | Male | Female |
| 5 to 17 Years | 0 (0.0%) | 0 (0.0%) |
| 18 to 34 Years | 0 (0.0%) | 0 (0.0%) |
| 35 to 64 Years | 12 (26.1%) | 9 (20.4%) |
| 65 to 74 Years | 0 (0.0%) | 0 (0.0%) |
| 75 Years and over | 0 (0.0%) | 0 (0.0%) |
Disability Class: Self-Care Difficulty
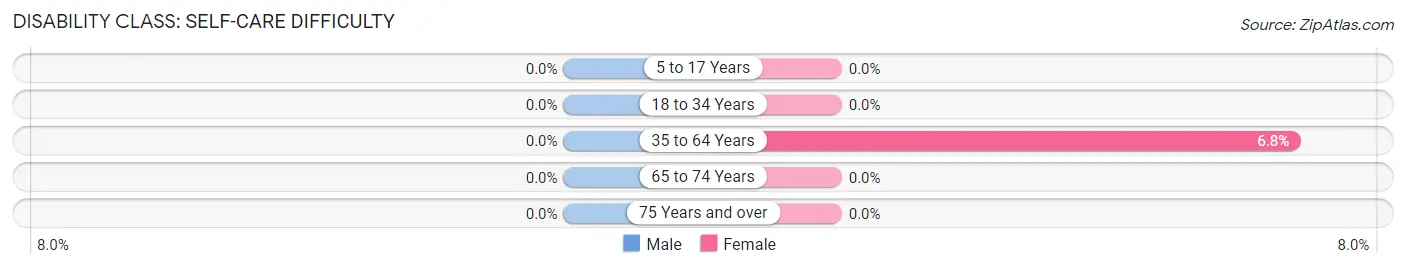
| Age Bracket | Male | Female |
| 5 to 17 Years | 0 (0.0%) | 0 (0.0%) |
| 18 to 34 Years | 0 (0.0%) | 0 (0.0%) |
| 35 to 64 Years | 0 (0.0%) | 3 (6.8%) |
| 65 to 74 Years | 0 (0.0%) | 0 (0.0%) |
| 75 Years and over | 0 (0.0%) | 0 (0.0%) |
Technology Access in La Ward
Computing Device Access in La Ward
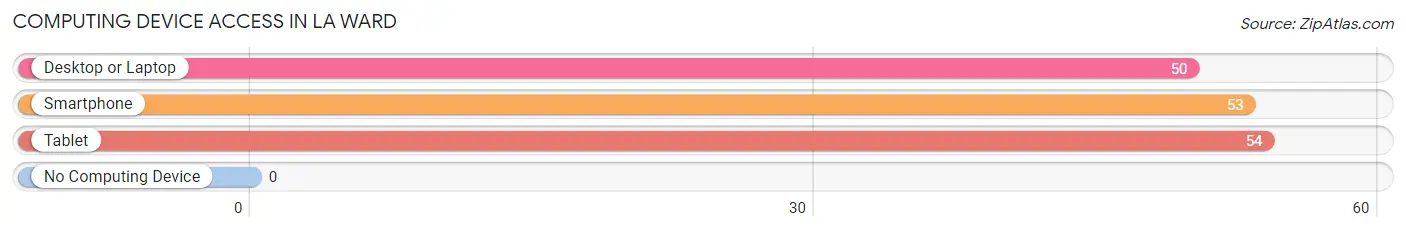
| Device Type | # Households | % Households |
| Desktop or Laptop | 50 | 78.1% |
| Smartphone | 53 | 82.8% |
| Tablet | 54 | 84.4% |
| No Computing Device | 0 | 0.0% |
| Total | 64 | 100.0% |
Internet Access in La Ward
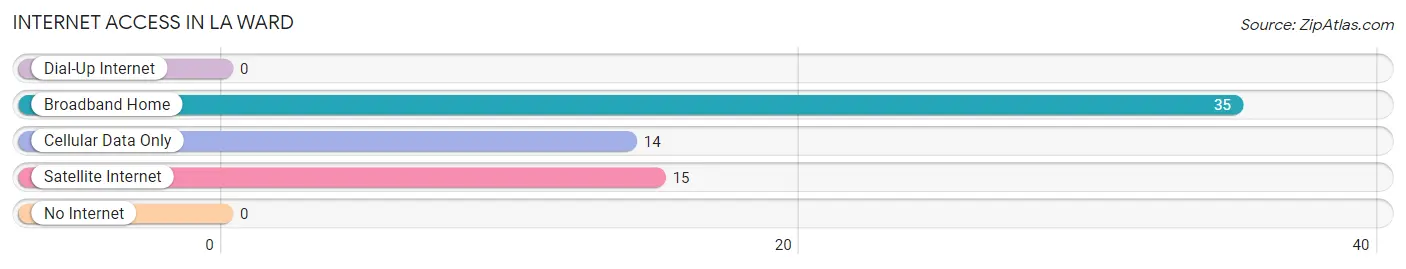
| Internet Type | # Households | % Households |
| Dial-Up Internet | 0 | 0.0% |
| Broadband Home | 35 | 54.7% |
| Cellular Data Only | 14 | 21.9% |
| Satellite Internet | 15 | 23.4% |
| No Internet | 0 | 0.0% |
| Total | 64 | 100.0% |
La Ward Summary
La Ward is a small town located in Jackson County, Texas. It is situated on the banks of the Lavaca River, about 25 miles east of Victoria. The population of La Ward was estimated to be 545 in 2019.
History
La Ward was founded in 1883 by a group of German immigrants led by John La Ward. The town was named after him. The original settlers were mostly farmers and ranchers, and the town quickly grew to become a thriving agricultural center. The first post office was established in 1884, and the first school was built in 1885.
In the early 1900s, La Ward began to experience a period of growth and prosperity. The town was home to several businesses, including a cotton gin, a blacksmith shop, a general store, and a hotel. The town also had a bank, a newspaper, and a telephone exchange.
In the 1920s, La Ward experienced a decline in population due to the Great Depression. However, the town was able to survive and eventually began to experience a period of growth and prosperity again in the 1950s. The town was home to several businesses, including a grocery store, a hardware store, and a feed store.
Geography
La Ward is located in Jackson County, Texas. It is situated on the banks of the Lavaca River, about 25 miles east of Victoria. The town is surrounded by rolling hills and is located in an area of Texas known as the “Blackland Prairie”. The climate in La Ward is hot and humid in the summer and mild in the winter.
Economy
The economy of La Ward is largely based on agriculture. The town is home to several farms and ranches, and the surrounding area is known for its production of cotton, corn, and hay. The town is also home to several businesses, including a grocery store, a hardware store, and a feed store.
Demographics
As of the 2019 census, the population of La Ward was estimated to be 545. The racial makeup of the town was 94.2% White, 0.7% African American, 0.4% Native American, 0.2% Asian, 0.2% Pacific Islander, and 4.3% from other races. The median household income in La Ward was $37,500, and the median age was 44.
Conclusion
La Ward is a small town located in Jackson County, Texas. It is situated on the banks of the Lavaca River, about 25 miles east of Victoria. The town was founded in 1883 by a group of German immigrants led by John La Ward, and it has since experienced periods of growth and decline. The economy of La Ward is largely based on agriculture, and the town is home to several businesses. As of the 2019 census, the population of La Ward was estimated to be 545.
Common Questions
What is Per Capita Income in La Ward?
Per Capita income in La Ward is $25,917.
What is the Median Family Income in La Ward?
Median Family Income in La Ward is $78,333.
What is the Median Household income in La Ward?
Median Household Income in La Ward is $68,750.
What is Inequality or Gini Index in La Ward?
Inequality or Gini Index in La Ward is 0.33.
What is the Total Population of La Ward?
Total Population of La Ward is 239.
What is the Total Male Population of La Ward?
Total Male Population of La Ward is 126.
What is the Total Female Population of La Ward?
Total Female Population of La Ward is 113.
What is the Ratio of Males per 100 Females in La Ward?
There are 111.50 Males per 100 Females in La Ward.
What is the Ratio of Females per 100 Males in La Ward?
There are 89.68 Females per 100 Males in La Ward.
What is the Median Population Age in La Ward?
Median Population Age in La Ward is 24.6 Years.
What is the Average Family Size in La Ward
Average Family Size in La Ward is 3.8 People.
What is the Average Household Size in La Ward
Average Household Size in La Ward is 3.7 People.
How Large is the Labor Force in La Ward?
There are 124 People in the Labor Forcein in La Ward.
What is the Percentage of People in the Labor Force in La Ward?
70.1% of People are in the Labor Force in La Ward.
What is the Unemployment Rate in La Ward?
Unemployment Rate in La Ward is 17.7%.