Marshall, TX Map & Demographics
Marshall Map
Marshall Overview
$26,916
PER CAPITA INCOME
$62,614
AVG FAMILY INCOME
$49,162
AVG HOUSEHOLD INCOME
28.8%
WAGE / INCOME GAP [ % ]
71.2¢/ $1
WAGE / INCOME GAP [ $ ]
0.53
INEQUALITY / GINI INDEX
23,509
TOTAL POPULATION
10,899
MALE POPULATION
12,610
FEMALE POPULATION
86.43
MALES / 100 FEMALES
115.70
FEMALES / 100 MALES
34.1
MEDIAN AGE
3.3
AVG FAMILY SIZE
2.6
AVG HOUSEHOLD SIZE
10,928
LABOR FORCE [ PEOPLE ]
59.1%
PERCENT IN LABOR FORCE
8.9%
UNEMPLOYMENT RATE
Marshall Area Codes
Income in Marshall
Income Overview in Marshall
Per Capita Income in Marshall is $26,916, while median incomes of families and households are $62,614 and $49,162 respectively.
| Characteristic | Number | Measure |
| Per Capita Income | 23,509 | $26,916 |
| Median Family Income | 5,430 | $62,614 |
| Mean Family Income | 5,430 | $83,569 |
| Median Household Income | 8,270 | $49,162 |
| Mean Household Income | 8,270 | $70,697 |
| Income Deficit | 5,430 | $0 |
| Wage / Income Gap (%) | 23,509 | 28.76% |
| Wage / Income Gap ($) | 23,509 | 71.24¢ per $1 |
| Gini / Inequality Index | 23,509 | 0.53 |
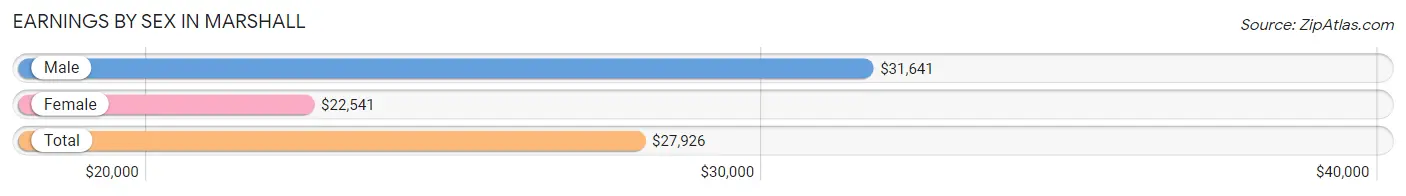
Earnings by Sex in Marshall
Average Earnings in Marshall are $27,926, $31,641 for men and $22,541 for women, a difference of 28.8%.
| Sex | Number | Average Earnings |
| Male | 5,710 (50.1%) | $31,641 |
| Female | 5,683 (49.9%) | $22,541 |
| Total | 11,393 (100.0%) | $27,926 |
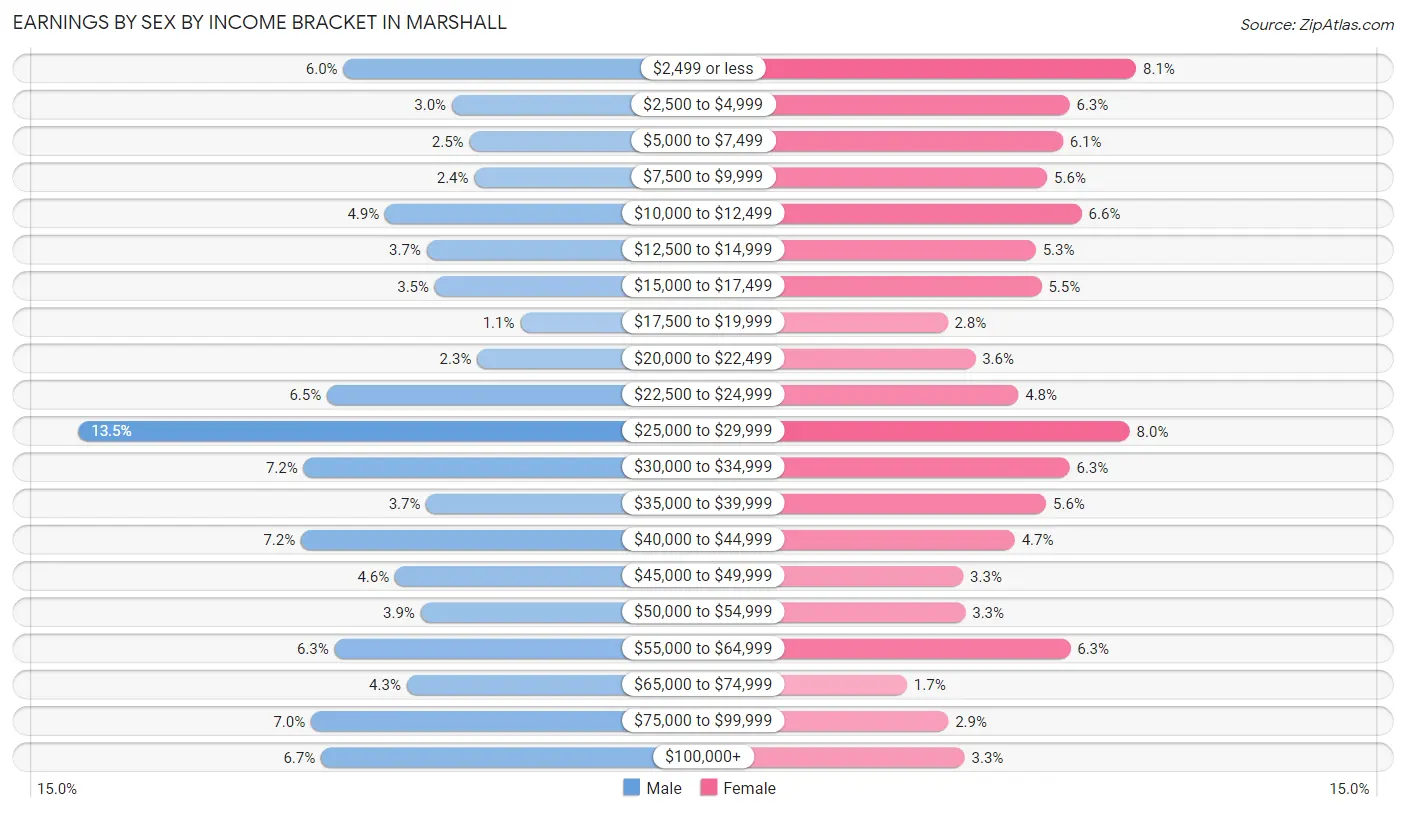
Earnings by Sex by Income Bracket in Marshall
The most common earnings brackets in Marshall are $25,000 to $29,999 for men (770 | 13.5%) and $2,499 or less for women (462 | 8.1%).
| Income | Male | Female |
| $2,499 or less | 345 (6.0%) | 462 (8.1%) |
| $2,500 to $4,999 | 171 (3.0%) | 356 (6.3%) |
| $5,000 to $7,499 | 143 (2.5%) | 345 (6.1%) |
| $7,500 to $9,999 | 135 (2.4%) | 320 (5.6%) |
| $10,000 to $12,499 | 278 (4.9%) | 375 (6.6%) |
| $12,500 to $14,999 | 211 (3.7%) | 302 (5.3%) |
| $15,000 to $17,499 | 198 (3.5%) | 311 (5.5%) |
| $17,500 to $19,999 | 61 (1.1%) | 161 (2.8%) |
| $20,000 to $22,499 | 130 (2.3%) | 205 (3.6%) |
| $22,500 to $24,999 | 371 (6.5%) | 274 (4.8%) |
| $25,000 to $29,999 | 770 (13.5%) | 452 (8.0%) |
| $30,000 to $34,999 | 409 (7.2%) | 356 (6.3%) |
| $35,000 to $39,999 | 212 (3.7%) | 318 (5.6%) |
| $40,000 to $44,999 | 413 (7.2%) | 268 (4.7%) |
| $45,000 to $49,999 | 262 (4.6%) | 186 (3.3%) |
| $50,000 to $54,999 | 221 (3.9%) | 189 (3.3%) |
| $55,000 to $64,999 | 359 (6.3%) | 357 (6.3%) |
| $65,000 to $74,999 | 243 (4.3%) | 96 (1.7%) |
| $75,000 to $99,999 | 397 (7.0%) | 162 (2.9%) |
| $100,000+ | 381 (6.7%) | 188 (3.3%) |
| Total | 5,710 (100.0%) | 5,683 (100.0%) |
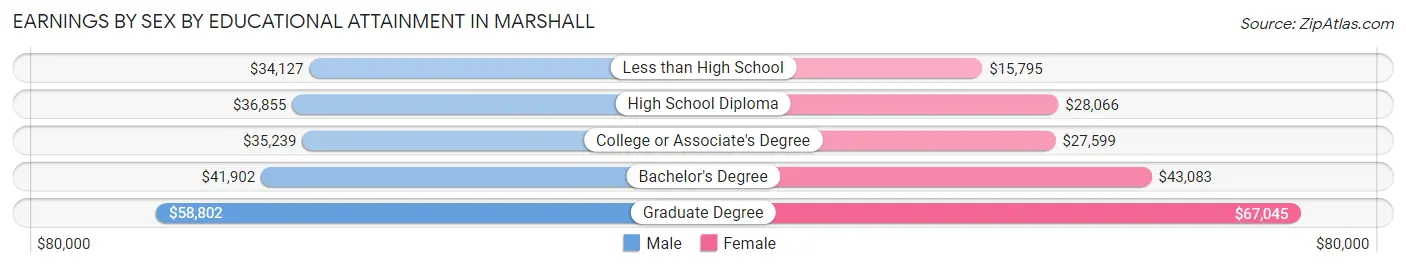
Earnings by Sex by Educational Attainment in Marshall
Average earnings in Marshall are $37,969 for men and $28,689 for women, a difference of 24.4%. Men with an educational attainment of graduate degree enjoy the highest average annual earnings of $58,802, while those with less than high school education earn the least with $34,127. Women with an educational attainment of graduate degree earn the most with the average annual earnings of $67,045, while those with less than high school education have the smallest earnings of $15,795.
| Educational Attainment | Male Income | Female Income |
| Less than High School | $34,127 | $15,795 |
| High School Diploma | $36,855 | $28,066 |
| College or Associate's Degree | $35,239 | $27,599 |
| Bachelor's Degree | $41,902 | $43,083 |
| Graduate Degree | $58,802 | $67,045 |
| Total | $37,969 | $28,689 |
Family Income in Marshall
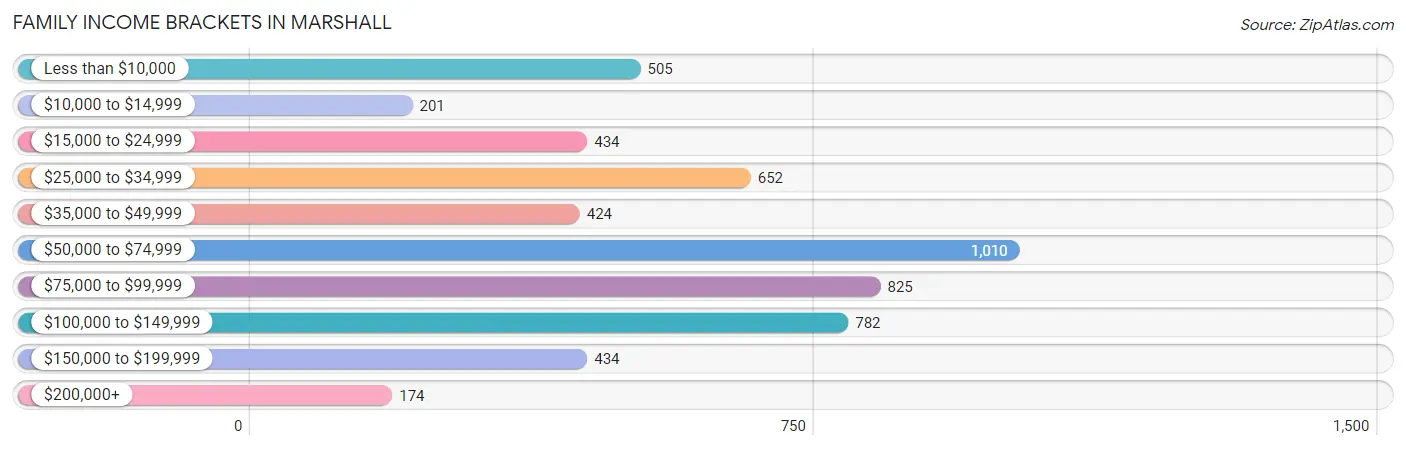
Family Income Brackets in Marshall
According to the Marshall family income data, there are 1,010 families falling into the $50,000 to $74,999 income range, which is the most common income bracket and makes up 18.6% of all families. Conversely, the $200,000+ income bracket is the least frequent group with only 174 families (3.2%) belonging to this category.
| Income Bracket | # Families | % Families |
| Less than $10,000 | 505 | 9.3% |
| $10,000 to $14,999 | 201 | 3.7% |
| $15,000 to $24,999 | 434 | 8.0% |
| $25,000 to $34,999 | 652 | 12.0% |
| $35,000 to $49,999 | 424 | 7.8% |
| $50,000 to $74,999 | 1,010 | 18.6% |
| $75,000 to $99,999 | 825 | 15.2% |
| $100,000 to $149,999 | 782 | 14.4% |
| $150,000 to $199,999 | 434 | 8.0% |
| $200,000+ | 174 | 3.2% |
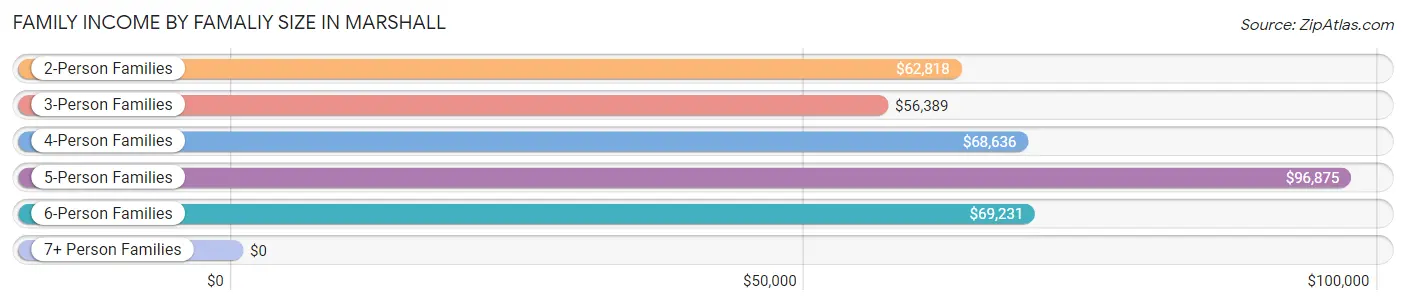
Family Income by Famaliy Size in Marshall
5-person families (482 | 8.9%) account for the highest median family income in Marshall with $96,875 per family, while 2-person families (2,474 | 45.6%) have the highest median income of $31,409 per family member.
| Income Bracket | # Families | Median Income |
| 2-Person Families | 2,474 (45.6%) | $62,818 |
| 3-Person Families | 830 (15.3%) | $56,389 |
| 4-Person Families | 1,466 (27.0%) | $68,636 |
| 5-Person Families | 482 (8.9%) | $96,875 |
| 6-Person Families | 106 (1.9%) | $69,231 |
| 7+ Person Families | 72 (1.3%) | $0 |
| Total | 5,430 (100.0%) | $62,614 |
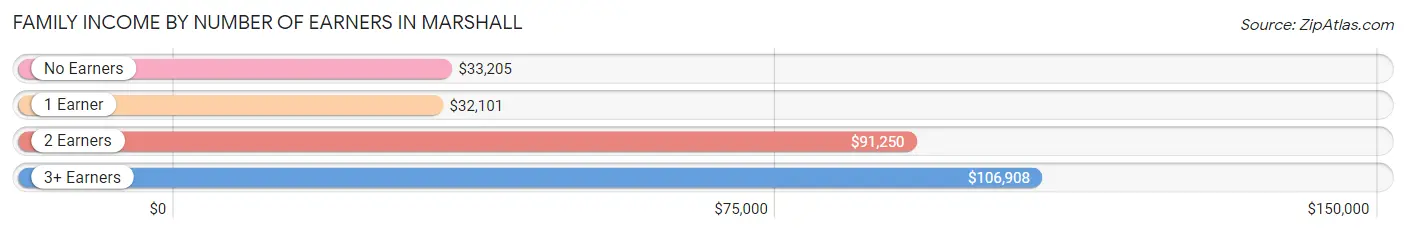
Family Income by Number of Earners in Marshall
The median family income in Marshall is $62,614, with families comprising 3+ earners (483) having the highest median family income of $106,908, while families with 1 earner (2,186) have the lowest median family income of $32,101, accounting for 8.9% and 40.3% of families, respectively.
| Number of Earners | # Families | Median Income |
| No Earners | 943 (17.4%) | $33,205 |
| 1 Earner | 2,186 (40.3%) | $32,101 |
| 2 Earners | 1,818 (33.5%) | $91,250 |
| 3+ Earners | 483 (8.9%) | $106,908 |
| Total | 5,430 (100.0%) | $62,614 |
Household Income in Marshall
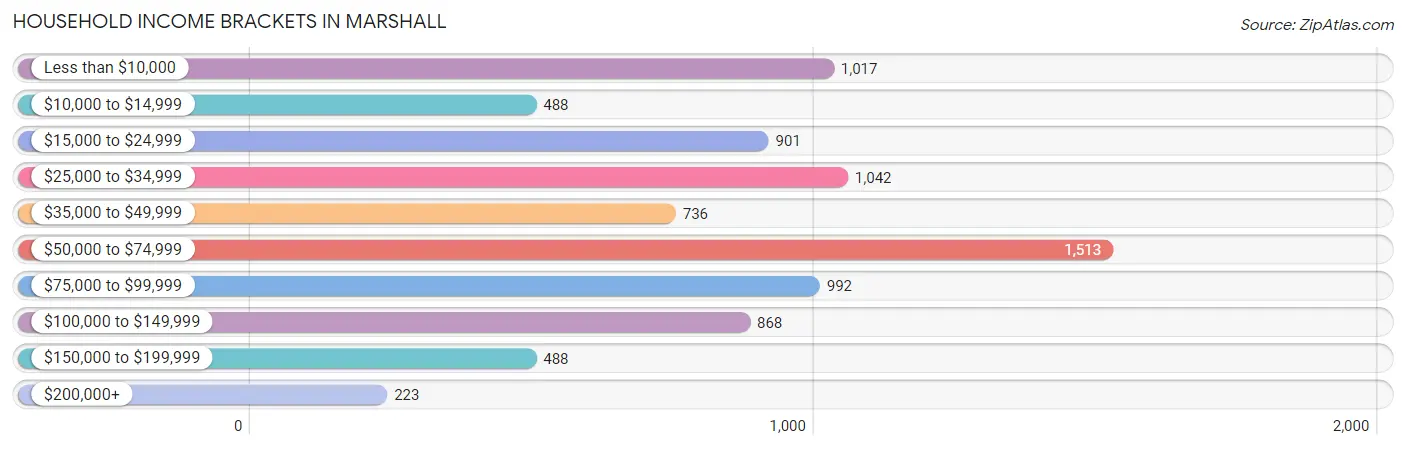
Household Income Brackets in Marshall
With 1,513 households falling in the category, the $50,000 to $74,999 income range is the most frequent in Marshall, accounting for 18.3% of all households. In contrast, only 223 households (2.7%) fall into the $200,000+ income bracket, making it the least populous group.
| Income Bracket | # Households | % Households |
| Less than $10,000 | 1,017 | 12.3% |
| $10,000 to $14,999 | 488 | 5.9% |
| $15,000 to $24,999 | 901 | 10.9% |
| $25,000 to $34,999 | 1,042 | 12.6% |
| $35,000 to $49,999 | 736 | 8.9% |
| $50,000 to $74,999 | 1,513 | 18.3% |
| $75,000 to $99,999 | 992 | 12.0% |
| $100,000 to $149,999 | 868 | 10.5% |
| $150,000 to $199,999 | 488 | 5.9% |
| $200,000+ | 223 | 2.7% |
Household Income by Householder Age in Marshall
The median household income in Marshall is $49,162, with the highest median household income of $62,986 found in the 45 to 64 years age bracket for the primary householder. A total of 2,588 households (31.3%) fall into this category. Meanwhile, the 15 to 24 years age bracket for the primary householder has the lowest median household income of $0, with 323 households (3.9%) in this group.
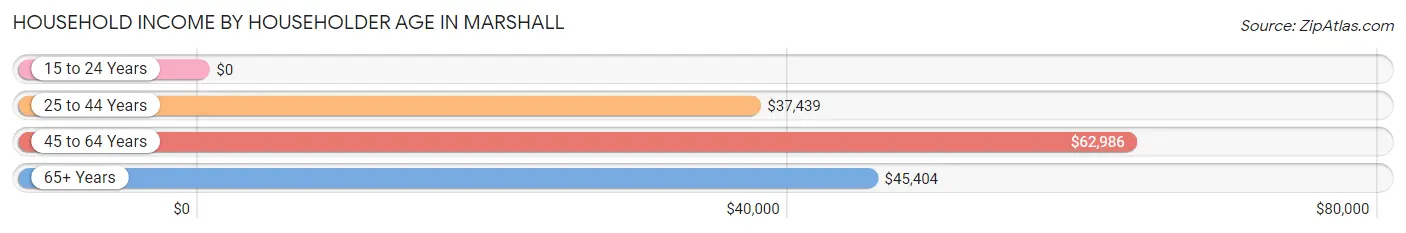
| Income Bracket | # Households | Median Income |
| 15 to 24 Years | 323 (3.9%) | $0 |
| 25 to 44 Years | 2,982 (36.1%) | $37,439 |
| 45 to 64 Years | 2,588 (31.3%) | $62,986 |
| 65+ Years | 2,377 (28.7%) | $45,404 |
| Total | 8,270 (100.0%) | $49,162 |
Poverty in Marshall
Income Below Poverty by Sex and Age in Marshall
With 19.3% poverty level for males and 25.9% for females among the residents of Marshall, under 5 year old males and 16 and 17 year old females are the most vulnerable to poverty, with 307 males (56.6%) and 304 females (65.9%) in their respective age groups living below the poverty level.
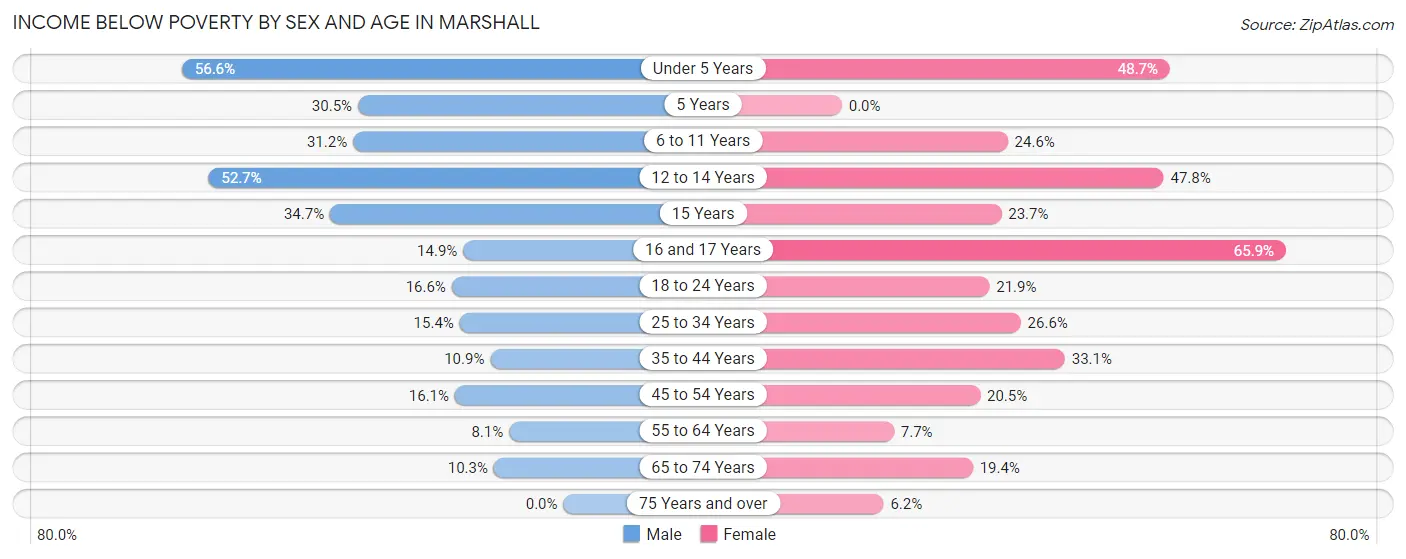
| Age Bracket | Male | Female |
| Under 5 Years | 307 (56.6%) | 415 (48.7%) |
| 5 Years | 36 (30.5%) | 0 (0.0%) |
| 6 to 11 Years | 289 (31.2%) | 248 (24.6%) |
| 12 to 14 Years | 282 (52.7%) | 194 (47.8%) |
| 15 Years | 105 (34.6%) | 9 (23.7%) |
| 16 and 17 Years | 32 (14.9%) | 304 (65.9%) |
| 18 to 24 Years | 189 (16.6%) | 191 (21.9%) |
| 25 to 34 Years | 253 (15.4%) | 495 (26.6%) |
| 35 to 44 Years | 155 (10.9%) | 534 (33.1%) |
| 45 to 54 Years | 155 (16.1%) | 209 (20.5%) |
| 55 to 64 Years | 95 (8.1%) | 106 (7.7%) |
| 65 to 74 Years | 102 (10.3%) | 245 (19.4%) |
| 75 Years and over | 0 (0.0%) | 40 (6.2%) |
| Total | 2,000 (19.3%) | 2,990 (25.9%) |
Income Above Poverty by Sex and Age in Marshall
According to the poverty statistics in Marshall, males aged 75 years and over and females aged 5 years are the age groups that are most secure financially, with 100.0% of males and 100.0% of females in these age groups living above the poverty line.
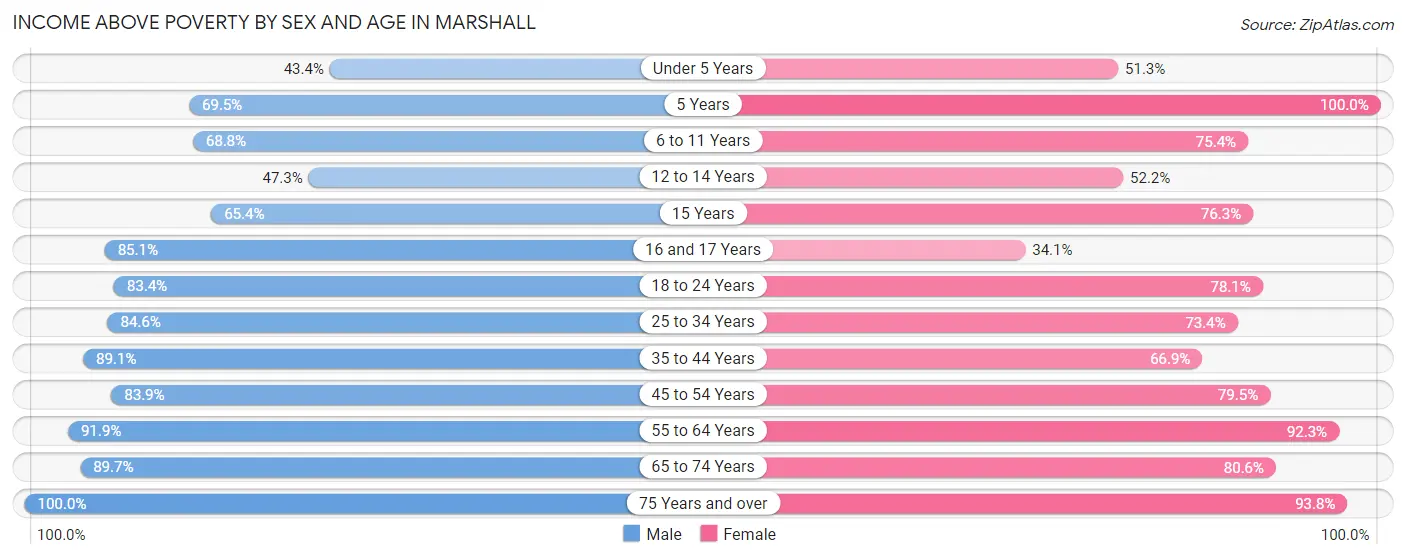
| Age Bracket | Male | Female |
| Under 5 Years | 235 (43.4%) | 437 (51.3%) |
| 5 Years | 82 (69.5%) | 126 (100.0%) |
| 6 to 11 Years | 636 (68.8%) | 759 (75.4%) |
| 12 to 14 Years | 253 (47.3%) | 212 (52.2%) |
| 15 Years | 198 (65.3%) | 29 (76.3%) |
| 16 and 17 Years | 183 (85.1%) | 157 (34.1%) |
| 18 to 24 Years | 951 (83.4%) | 681 (78.1%) |
| 25 to 34 Years | 1,390 (84.6%) | 1,369 (73.4%) |
| 35 to 44 Years | 1,272 (89.1%) | 1,079 (66.9%) |
| 45 to 54 Years | 807 (83.9%) | 809 (79.5%) |
| 55 to 64 Years | 1,084 (91.9%) | 1,266 (92.3%) |
| 65 to 74 Years | 885 (89.7%) | 1,015 (80.6%) |
| 75 Years and over | 365 (100.0%) | 606 (93.8%) |
| Total | 8,341 (80.7%) | 8,545 (74.1%) |
Income Below Poverty Among Married-Couple Families in Marshall
The poverty statistics for married-couple families in Marshall show that 2.7% or 80 of the total 2,950 families live below the poverty line. Families with 3 or 4 children have the highest poverty rate of 12.1%, comprising of 24 families. On the other hand, families with no children have the lowest poverty rate of 1.3%, which includes 24 families.
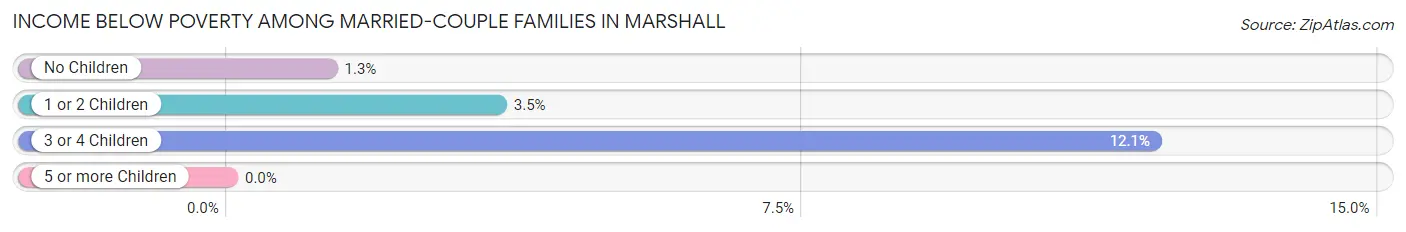
| Children | Above Poverty | Below Poverty |
| No Children | 1,816 (98.7%) | 24 (1.3%) |
| 1 or 2 Children | 879 (96.5%) | 32 (3.5%) |
| 3 or 4 Children | 175 (87.9%) | 24 (12.1%) |
| 5 or more Children | 0 (0.0%) | 0 (0.0%) |
| Total | 2,870 (97.3%) | 80 (2.7%) |
Income Below Poverty Among Single-Parent Households in Marshall
According to the poverty data in Marshall, 32.7% or 99 single-father households and 39.4% or 858 single-mother households are living below the poverty line. Among single-father households, those with 3 or 4 children have the highest poverty rate, with 90 households (88.2%) experiencing poverty. Likewise, among single-mother households, those with 3 or 4 children have the highest poverty rate, with 440 households (71.7%) falling below the poverty line.
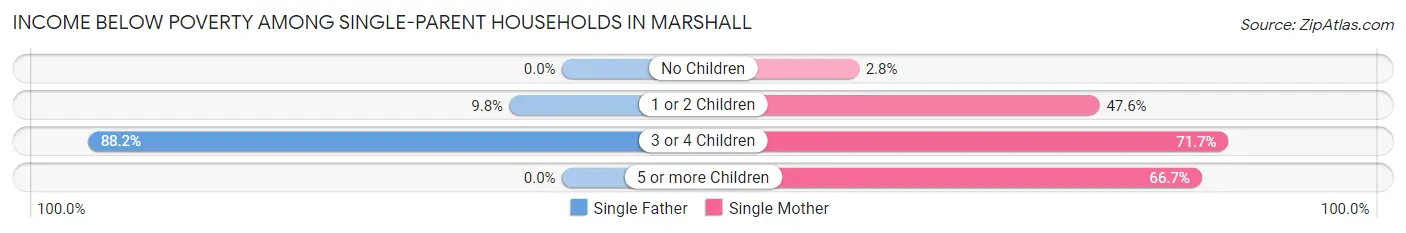
| Children | Single Father | Single Mother |
| No Children | 0 (0.0%) | 21 (2.8%) |
| 1 or 2 Children | 9 (9.8%) | 363 (47.6%) |
| 3 or 4 Children | 90 (88.2%) | 440 (71.7%) |
| 5 or more Children | 0 (0.0%) | 34 (66.7%) |
| Total | 99 (32.7%) | 858 (39.4%) |
Income Below Poverty Among Married-Couple vs Single-Parent Households in Marshall
The poverty data for Marshall shows that 80 of the married-couple family households (2.7%) and 957 of the single-parent households (38.6%) are living below the poverty level. Within the married-couple family households, those with 3 or 4 children have the highest poverty rate, with 24 households (12.1%) falling below the poverty line. Among the single-parent households, those with 3 or 4 children have the highest poverty rate, with 530 household (74.0%) living below poverty.
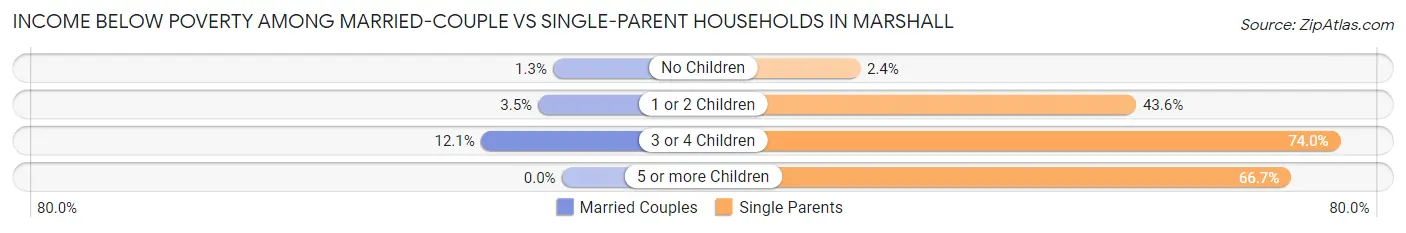
| Children | Married-Couple Families | Single-Parent Households |
| No Children | 24 (1.3%) | 21 (2.4%) |
| 1 or 2 Children | 32 (3.5%) | 372 (43.6%) |
| 3 or 4 Children | 24 (12.1%) | 530 (74.0%) |
| 5 or more Children | 0 (0.0%) | 34 (66.7%) |
| Total | 80 (2.7%) | 957 (38.6%) |
Race in Marshall
The most populous races in Marshall are White / Caucasian (9,994 | 42.5%), Black / African American (9,473 | 40.3%), and Hispanic or Latino (4,834 | 20.6%).
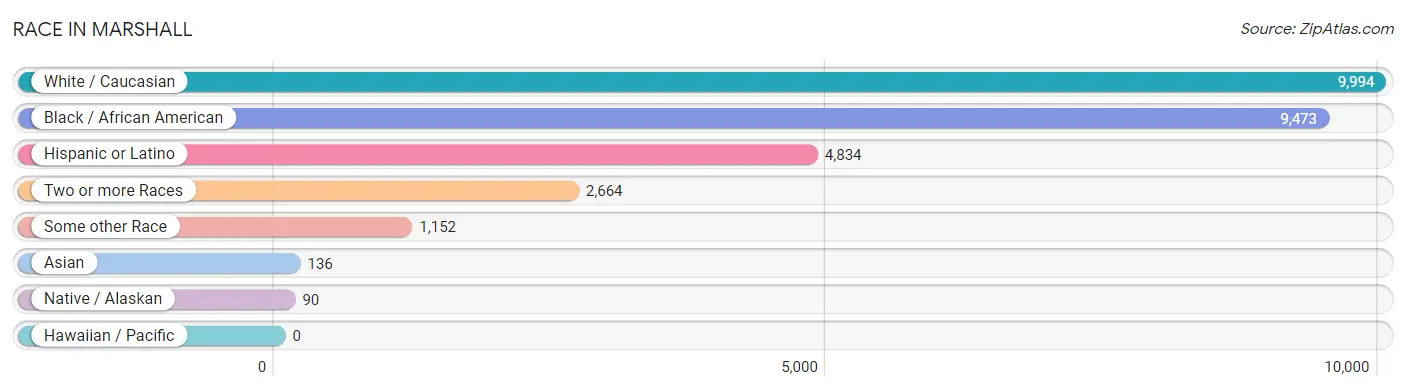
| Race | # Population | % Population |
| Asian | 136 | 0.6% |
| Black / African American | 9,473 | 40.3% |
| Hawaiian / Pacific | 0 | 0.0% |
| Hispanic or Latino | 4,834 | 20.6% |
| Native / Alaskan | 90 | 0.4% |
| White / Caucasian | 9,994 | 42.5% |
| Two or more Races | 2,664 | 11.3% |
| Some other Race | 1,152 | 4.9% |
| Total | 23,509 | 100.0% |
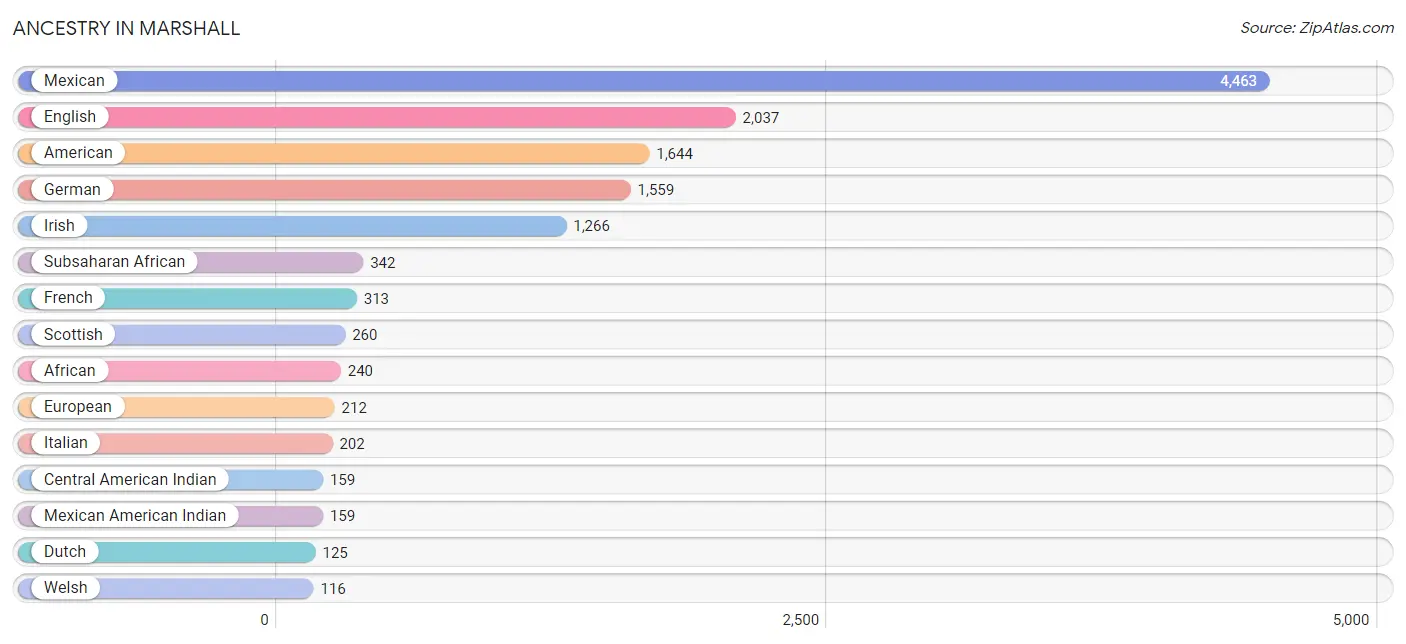
Ancestry in Marshall
The most populous ancestries reported in Marshall are Mexican (4,463 | 19.0%), English (2,037 | 8.7%), American (1,644 | 7.0%), German (1,559 | 6.6%), and Irish (1,266 | 5.4%), together accounting for 46.6% of all Marshall residents.
| Ancestry | # Population | % Population |
| African | 240 | 1.0% |
| American | 1,644 | 7.0% |
| Arab | 39 | 0.2% |
| Armenian | 10 | 0.0% |
| Austrian | 43 | 0.2% |
| Bangladeshi | 10 | 0.0% |
| Bhutanese | 8 | 0.0% |
| Blackfeet | 11 | 0.1% |
| Brazilian | 5 | 0.0% |
| British | 79 | 0.3% |
| Burmese | 24 | 0.1% |
| Canadian | 24 | 0.1% |
| Central American | 61 | 0.3% |
| Central American Indian | 159 | 0.7% |
| Cherokee | 94 | 0.4% |
| Choctaw | 9 | 0.0% |
| Czech | 47 | 0.2% |
| Dutch | 125 | 0.5% |
| English | 2,037 | 8.7% |
| European | 212 | 0.9% |
| Finnish | 23 | 0.1% |
| French | 313 | 1.3% |
| French American Indian | 14 | 0.1% |
| French Canadian | 21 | 0.1% |
| German | 1,559 | 6.6% |
| Greek | 45 | 0.2% |
| Guatemalan | 1 | 0.0% |
| Honduran | 55 | 0.2% |
| Hungarian | 2 | 0.0% |
| Indian (Asian) | 21 | 0.1% |
| Inupiat | 33 | 0.1% |
| Irish | 1,266 | 5.4% |
| Israeli | 75 | 0.3% |
| Italian | 202 | 0.9% |
| Jamaican | 47 | 0.2% |
| Japanese | 47 | 0.2% |
| Kenyan | 11 | 0.1% |
| Korean | 102 | 0.4% |
| Lebanese | 39 | 0.2% |
| Mexican | 4,463 | 19.0% |
| Mexican American Indian | 159 | 0.7% |
| Nigerian | 70 | 0.3% |
| Northern European | 14 | 0.1% |
| Norwegian | 70 | 0.3% |
| Pakistani | 1 | 0.0% |
| Polish | 39 | 0.2% |
| Puerto Rican | 37 | 0.2% |
| Salvadoran | 5 | 0.0% |
| Scandinavian | 94 | 0.4% |
| Scotch-Irish | 76 | 0.3% |
| Scottish | 260 | 1.1% |
| South African | 8 | 0.0% |
| Spanish | 13 | 0.1% |
| Sri Lankan | 14 | 0.1% |
| Subsaharan African | 342 | 1.5% |
| Swedish | 33 | 0.1% |
| Thai | 5 | 0.0% |
| Trinidadian and Tobagonian | 5 | 0.0% |
| Welsh | 116 | 0.5% |
| Yugoslavian | 10 | 0.0% | View All 60 Rows |
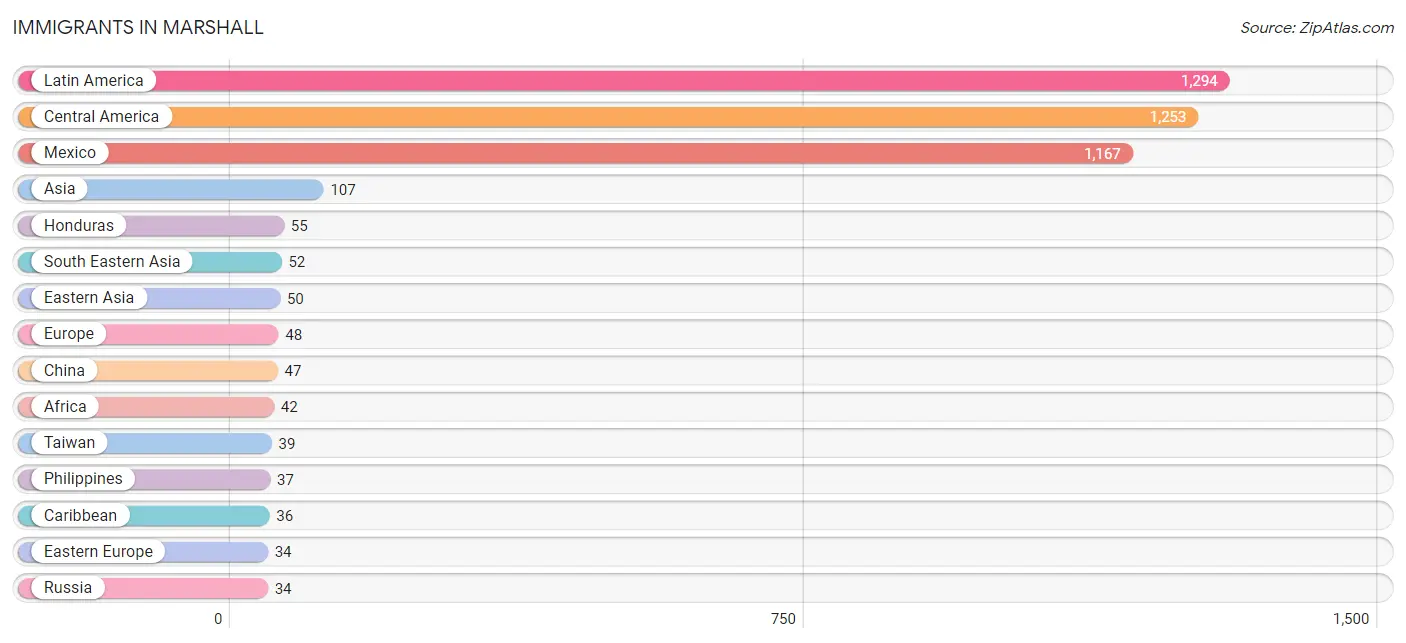
Immigrants in Marshall
The most numerous immigrant groups reported in Marshall came from Latin America (1,294 | 5.5%), Central America (1,253 | 5.3%), Mexico (1,167 | 5.0%), Asia (107 | 0.5%), and Honduras (55 | 0.2%), together accounting for 16.5% of all Marshall residents.
| Immigration Origin | # Population | % Population |
| Africa | 42 | 0.2% |
| Asia | 107 | 0.5% |
| Brazil | 5 | 0.0% |
| Canada | 16 | 0.1% |
| Caribbean | 36 | 0.2% |
| Central America | 1,253 | 5.3% |
| China | 47 | 0.2% |
| Eastern Africa | 11 | 0.1% |
| Eastern Asia | 50 | 0.2% |
| Eastern Europe | 34 | 0.1% |
| El Salvador | 31 | 0.1% |
| Europe | 48 | 0.2% |
| Germany | 3 | 0.0% |
| Honduras | 55 | 0.2% |
| India | 5 | 0.0% |
| Jamaica | 31 | 0.1% |
| Kenya | 11 | 0.1% |
| Korea | 3 | 0.0% |
| Latin America | 1,294 | 5.5% |
| Mexico | 1,167 | 5.0% |
| Netherlands | 11 | 0.1% |
| Nigeria | 31 | 0.1% |
| Philippines | 37 | 0.2% |
| Russia | 34 | 0.1% |
| South America | 5 | 0.0% |
| South Central Asia | 5 | 0.0% |
| South Eastern Asia | 52 | 0.2% |
| Taiwan | 39 | 0.2% |
| Thailand | 1 | 0.0% |
| Trinidad and Tobago | 5 | 0.0% |
| Vietnam | 14 | 0.1% |
| Western Africa | 31 | 0.1% |
| Western Europe | 14 | 0.1% | View All 33 Rows |
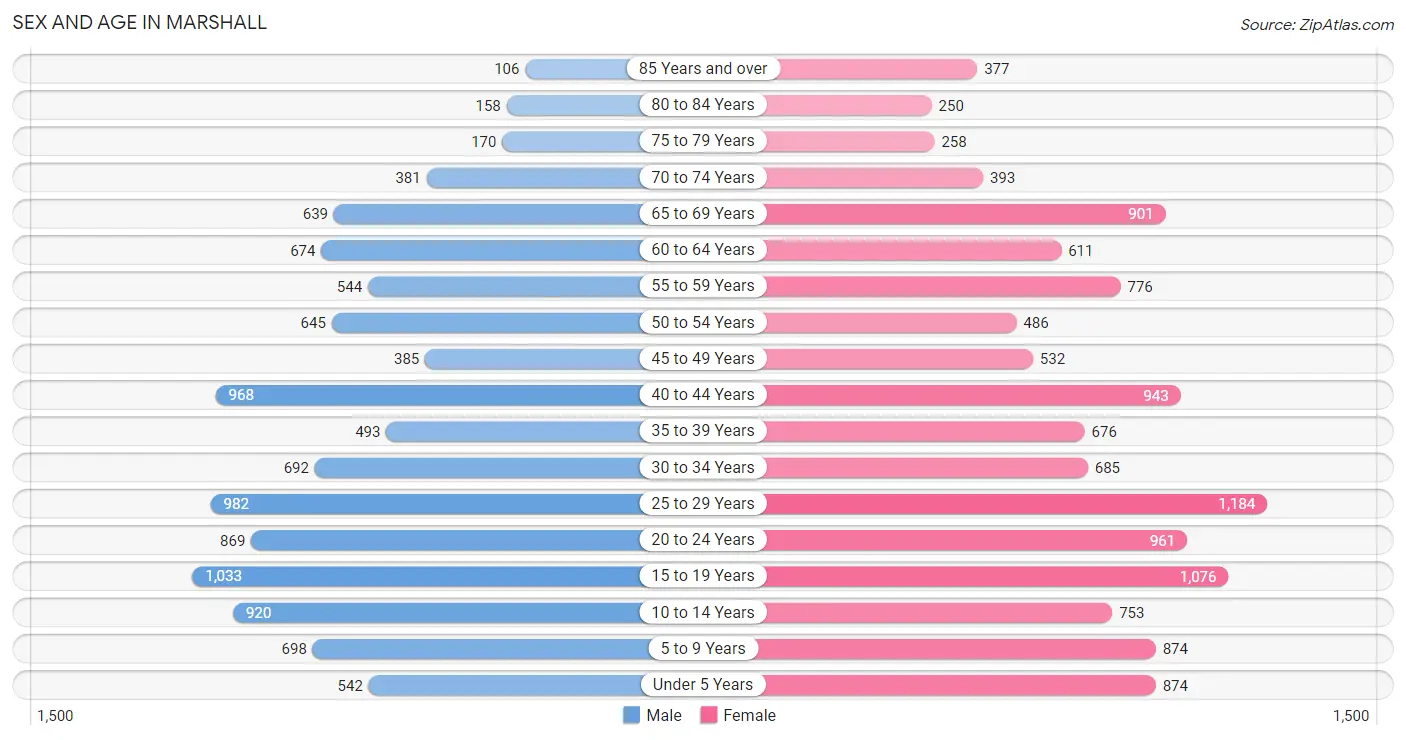
Sex and Age in Marshall
Sex and Age in Marshall
The most populous age groups in Marshall are 15 to 19 Years (1,033 | 9.5%) for men and 25 to 29 Years (1,184 | 9.4%) for women.
| Age Bracket | Male | Female |
| Under 5 Years | 542 (5.0%) | 874 (6.9%) |
| 5 to 9 Years | 698 (6.4%) | 874 (6.9%) |
| 10 to 14 Years | 920 (8.4%) | 753 (6.0%) |
| 15 to 19 Years | 1,033 (9.5%) | 1,076 (8.5%) |
| 20 to 24 Years | 869 (8.0%) | 961 (7.6%) |
| 25 to 29 Years | 982 (9.0%) | 1,184 (9.4%) |
| 30 to 34 Years | 692 (6.4%) | 685 (5.4%) |
| 35 to 39 Years | 493 (4.5%) | 676 (5.4%) |
| 40 to 44 Years | 968 (8.9%) | 943 (7.5%) |
| 45 to 49 Years | 385 (3.5%) | 532 (4.2%) |
| 50 to 54 Years | 645 (5.9%) | 486 (3.8%) |
| 55 to 59 Years | 544 (5.0%) | 776 (6.1%) |
| 60 to 64 Years | 674 (6.2%) | 611 (4.9%) |
| 65 to 69 Years | 639 (5.9%) | 901 (7.1%) |
| 70 to 74 Years | 381 (3.5%) | 393 (3.1%) |
| 75 to 79 Years | 170 (1.6%) | 258 (2.1%) |
| 80 to 84 Years | 158 (1.5%) | 250 (2.0%) |
| 85 Years and over | 106 (1.0%) | 377 (3.0%) |
| Total | 10,899 (100.0%) | 12,610 (100.0%) |
Families and Households in Marshall
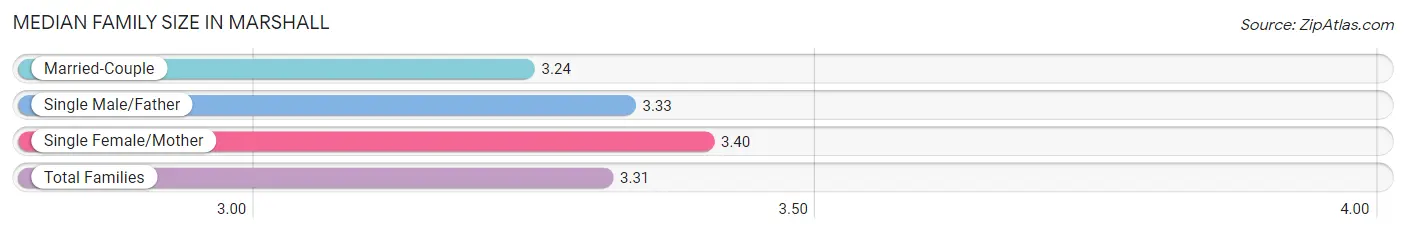
Median Family Size in Marshall
The median family size in Marshall is 3.31 persons per family, with single female/mother families (2,177 | 40.1%) accounting for the largest median family size of 3.4 persons per family. On the other hand, married-couple families (2,950 | 54.3%) represent the smallest median family size with 3.24 persons per family.
| Family Type | # Families | Family Size |
| Married-Couple | 2,950 (54.3%) | 3.24 |
| Single Male/Father | 303 (5.6%) | 3.33 |
| Single Female/Mother | 2,177 (40.1%) | 3.40 |
| Total Families | 5,430 (100.0%) | 3.31 |
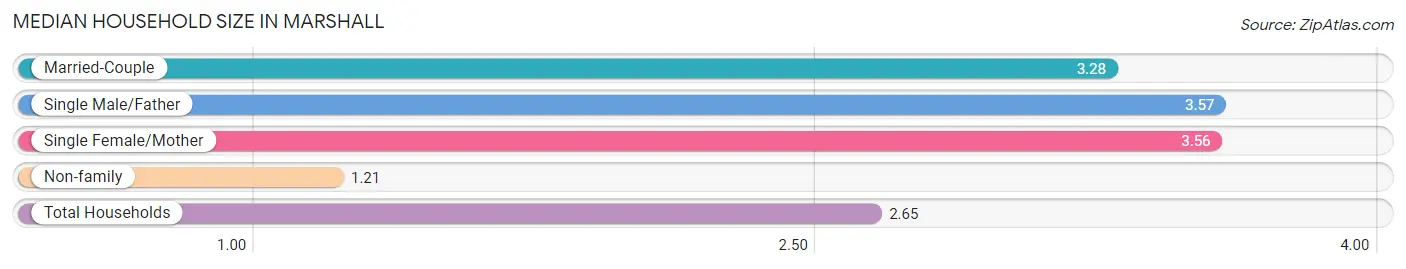
Median Household Size in Marshall
The median household size in Marshall is 2.65 persons per household, with single male/father households (303 | 3.7%) accounting for the largest median household size of 3.57 persons per household. non-family households (2,840 | 34.3%) represent the smallest median household size with 1.21 persons per household.
| Household Type | # Households | Household Size |
| Married-Couple | 2,950 (35.7%) | 3.28 |
| Single Male/Father | 303 (3.7%) | 3.57 |
| Single Female/Mother | 2,177 (26.3%) | 3.56 |
| Non-family | 2,840 (34.3%) | 1.21 |
| Total Households | 8,270 (100.0%) | 2.65 |
Household Size by Marriage Status in Marshall
Out of a total of 8,270 households in Marshall, 5,430 (65.7%) are family households, while 2,840 (34.3%) are nonfamily households. The most numerous type of family households are 2-person households, comprising 2,247, and the most common type of nonfamily households are 1-person households, comprising 2,501.
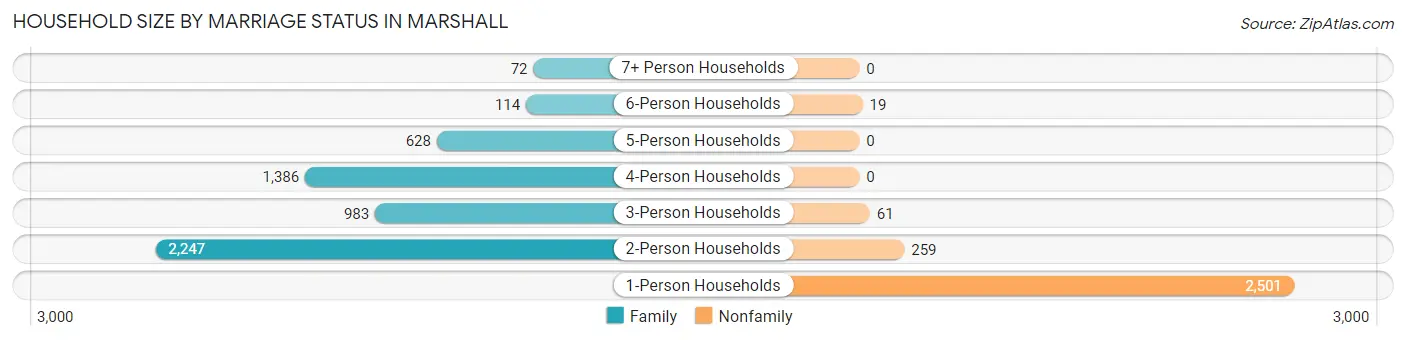
| Household Size | Family Households | Nonfamily Households |
| 1-Person Households | - | 2,501 (30.2%) |
| 2-Person Households | 2,247 (27.2%) | 259 (3.1%) |
| 3-Person Households | 983 (11.9%) | 61 (0.7%) |
| 4-Person Households | 1,386 (16.8%) | 0 (0.0%) |
| 5-Person Households | 628 (7.6%) | 0 (0.0%) |
| 6-Person Households | 114 (1.4%) | 19 (0.2%) |
| 7+ Person Households | 72 (0.9%) | 0 (0.0%) |
| Total | 5,430 (65.7%) | 2,840 (34.3%) |
Female Fertility in Marshall
Fertility by Age in Marshall
Average fertility rate in Marshall is 50.0 births per 1,000 women. Women in the age bracket of 15 to 19 years have the highest fertility rate with 135.0 births per 1,000 women. Women in the age bracket of 15 to 19 years acount for 47.5% of all women with births.
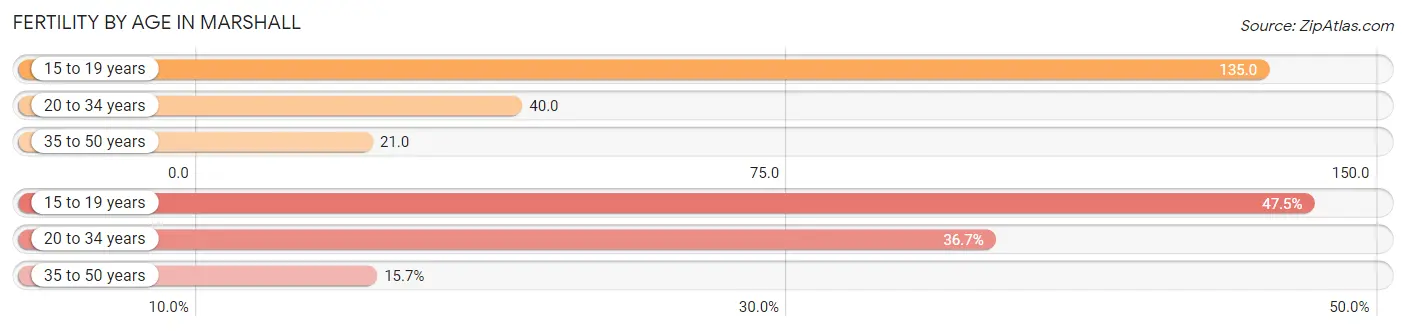
| Age Bracket | Women with Births | Births / 1,000 Women |
| 15 to 19 years | 145 (47.5%) | 135.0 |
| 20 to 34 years | 112 (36.7%) | 40.0 |
| 35 to 50 years | 48 (15.7%) | 21.0 |
| Total | 305 (100.0%) | 50.0 |
Fertility by Age by Marriage Status in Marshall
15.7% of women with births (305) in Marshall are married. The highest percentage of unmarried women with births falls into 15 to 19 years age bracket with 100.0% of them unmarried at the time of birth, while the lowest percentage of unmarried women with births belong to 20 to 34 years age bracket with 57.1% of them unmarried.
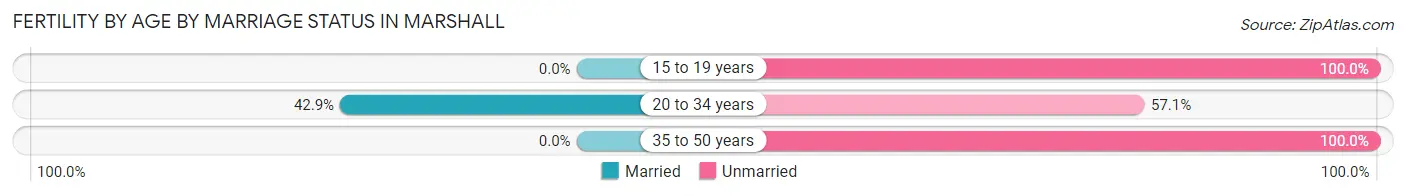
| Age Bracket | Married | Unmarried |
| 15 to 19 years | 0 (0.0%) | 145 (100.0%) |
| 20 to 34 years | 48 (42.9%) | 64 (57.1%) |
| 35 to 50 years | 0 (0.0%) | 48 (100.0%) |
| Total | 48 (15.7%) | 257 (84.3%) |
Fertility by Education in Marshall
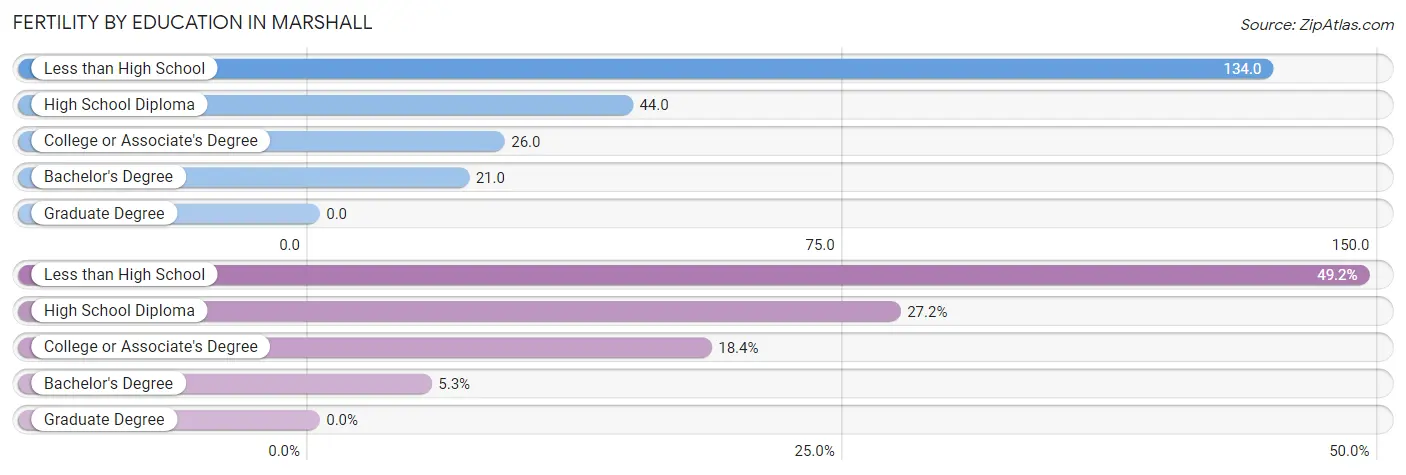
| Educational Attainment | Women with Births | Births / 1,000 Women |
| Less than High School | 150 (49.2%) | 134.0 |
| High School Diploma | 83 (27.2%) | 44.0 |
| College or Associate's Degree | 56 (18.4%) | 26.0 |
| Bachelor's Degree | 16 (5.2%) | 21.0 |
| Graduate Degree | 0 (0.0%) | 0.0 |
| Total | 305 (100.0%) | 50.0 |
Fertility by Education by Marriage Status in Marshall
84.3% of women with births in Marshall are unmarried. Women with the educational attainment of bachelor's degree are most likely to be married with 56.2% of them married at childbirth, while women with the educational attainment of less than high school are least likely to be married with 96.7% of them unmarried at childbirth.
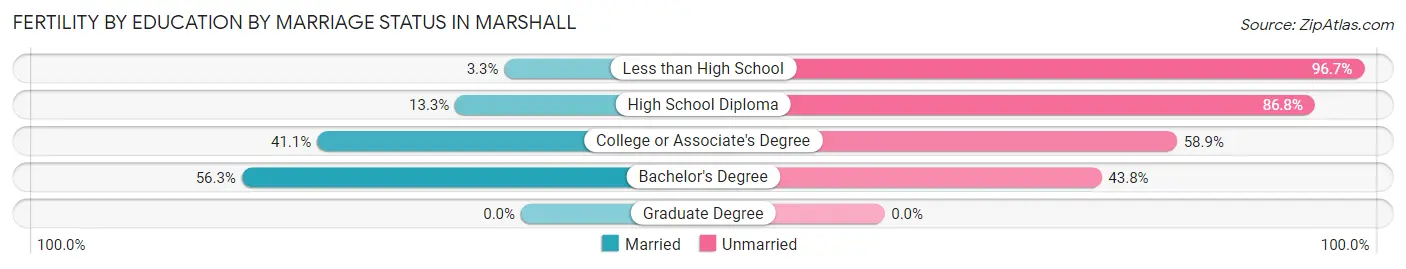
| Educational Attainment | Married | Unmarried |
| Less than High School | 5 (3.3%) | 145 (96.7%) |
| High School Diploma | 11 (13.3%) | 72 (86.8%) |
| College or Associate's Degree | 23 (41.1%) | 33 (58.9%) |
| Bachelor's Degree | 9 (56.2%) | 7 (43.8%) |
| Graduate Degree | 0 (0.0%) | 0 (0.0%) |
| Total | 48 (15.7%) | 257 (84.3%) |
Employment Characteristics in Marshall
Employment by Class of Employer in Marshall
Among the 9,932 employed individuals in Marshall, private company employees (6,777 | 68.2%), not-for-profit organizations (1,183 | 11.9%), and local government employees (781 | 7.9%) make up the most common classes of employment.
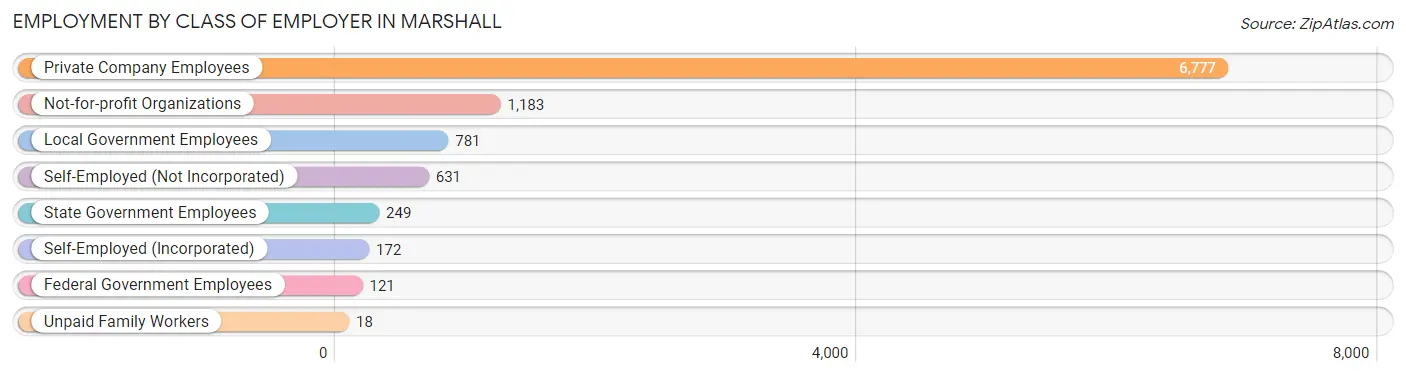
| Employer Class | # Employees | % Employees |
| Private Company Employees | 6,777 | 68.2% |
| Self-Employed (Incorporated) | 172 | 1.7% |
| Self-Employed (Not Incorporated) | 631 | 6.4% |
| Not-for-profit Organizations | 1,183 | 11.9% |
| Local Government Employees | 781 | 7.9% |
| State Government Employees | 249 | 2.5% |
| Federal Government Employees | 121 | 1.2% |
| Unpaid Family Workers | 18 | 0.2% |
| Total | 9,932 | 100.0% |
Employment Status by Age in Marshall
According to the labor force statistics for Marshall, out of the total population over 16 years of age (18,490), 59.1% or 10,928 individuals are in the labor force, with 8.9% or 973 of them unemployed. The age group with the highest labor force participation rate is 35 to 44 years, with 83.4% or 2,569 individuals in the labor force. Within the labor force, the 25 to 29 years age range has the highest percentage of unemployed individuals, with 12.1% or 192 of them being unemployed.
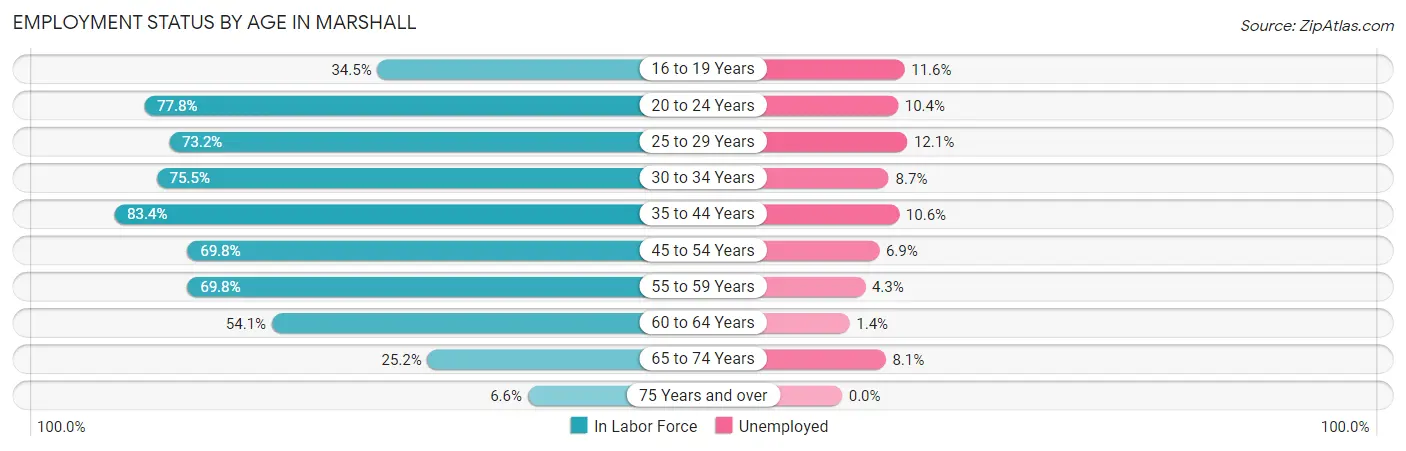
| Age Bracket | In Labor Force | Unemployed |
| 16 to 19 Years | 604 (34.5%) | 70 (11.6%) |
| 20 to 24 Years | 1,424 (77.8%) | 148 (10.4%) |
| 25 to 29 Years | 1,586 (73.2%) | 192 (12.1%) |
| 30 to 34 Years | 1,040 (75.5%) | 90 (8.7%) |
| 35 to 44 Years | 2,569 (83.4%) | 272 (10.6%) |
| 45 to 54 Years | 1,430 (69.8%) | 99 (6.9%) |
| 55 to 59 Years | 921 (69.8%) | 40 (4.3%) |
| 60 to 64 Years | 695 (54.1%) | 10 (1.4%) |
| 65 to 74 Years | 583 (25.2%) | 47 (8.1%) |
| 75 Years and over | 87 (6.6%) | 0 (0.0%) |
| Total | 10,928 (59.1%) | 973 (8.9%) |
Employment Status by Educational Attainment in Marshall
According to labor force statistics for Marshall, 73.1% of individuals (8,243) out of the total population between 25 and 64 years of age (11,276) are in the labor force, with 8.5% or 701 of them being unemployed. The group with the highest labor force participation rate are those with the educational attainment of bachelor's degree or higher, with 85.7% or 1,909 individuals in the labor force. Within the labor force, individuals with college / associate degree education have the highest percentage of unemployment, with 16.0% or 441 of them being unemployed.
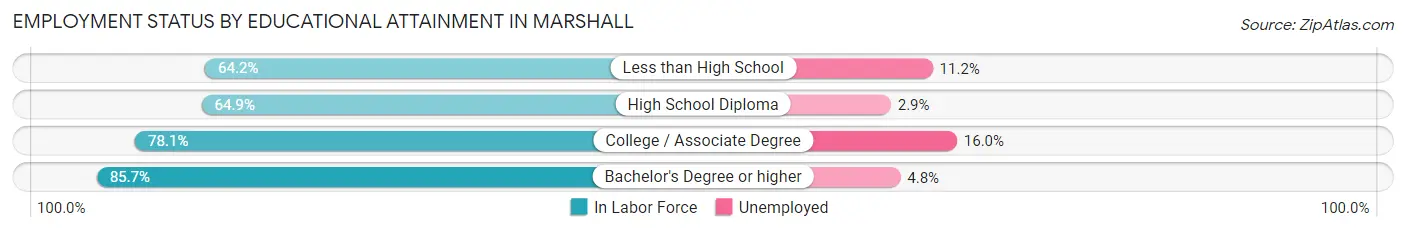
| Educational Attainment | In Labor Force | Unemployed |
| Less than High School | 792 (64.2%) | 138 (11.2%) |
| High School Diploma | 2,782 (64.9%) | 124 (2.9%) |
| College / Associate Degree | 2,755 (78.1%) | 564 (16.0%) |
| Bachelor's Degree or higher | 1,909 (85.7%) | 107 (4.8%) |
| Total | 8,243 (73.1%) | 958 (8.5%) |
Employment Occupations by Sex in Marshall
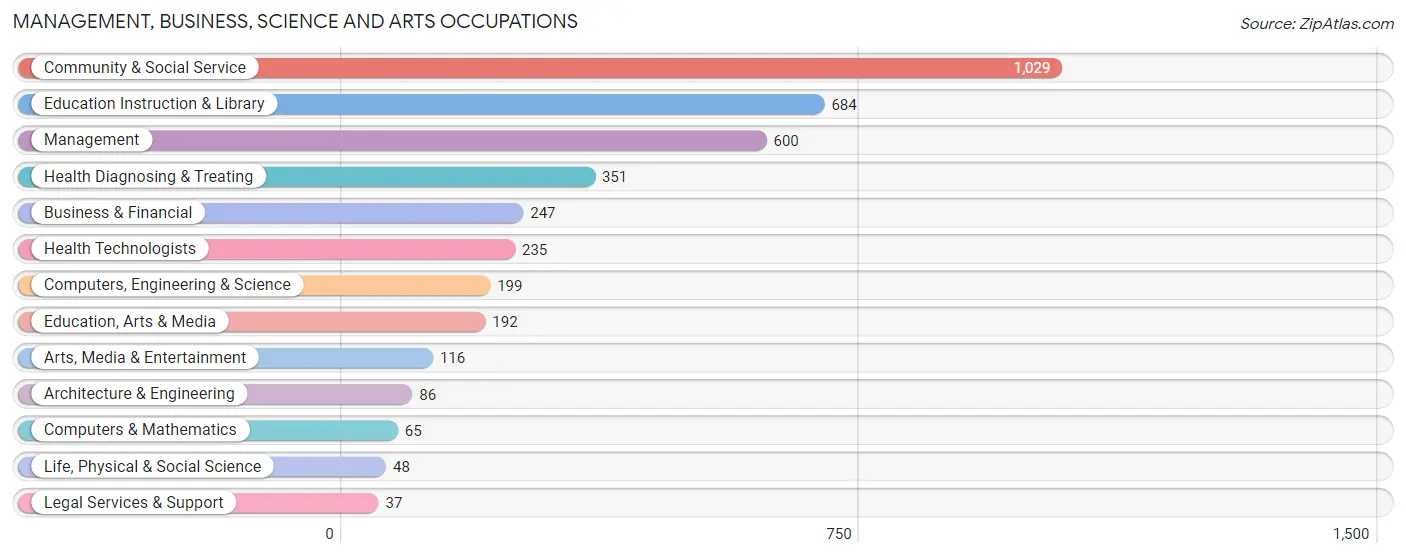
Management, Business, Science and Arts Occupations
The most common Management, Business, Science and Arts occupations in Marshall are Community & Social Service (1,029 | 10.3%), Education Instruction & Library (684 | 6.9%), Management (600 | 6.0%), Health Diagnosing & Treating (351 | 3.5%), and Business & Financial (247 | 2.5%).
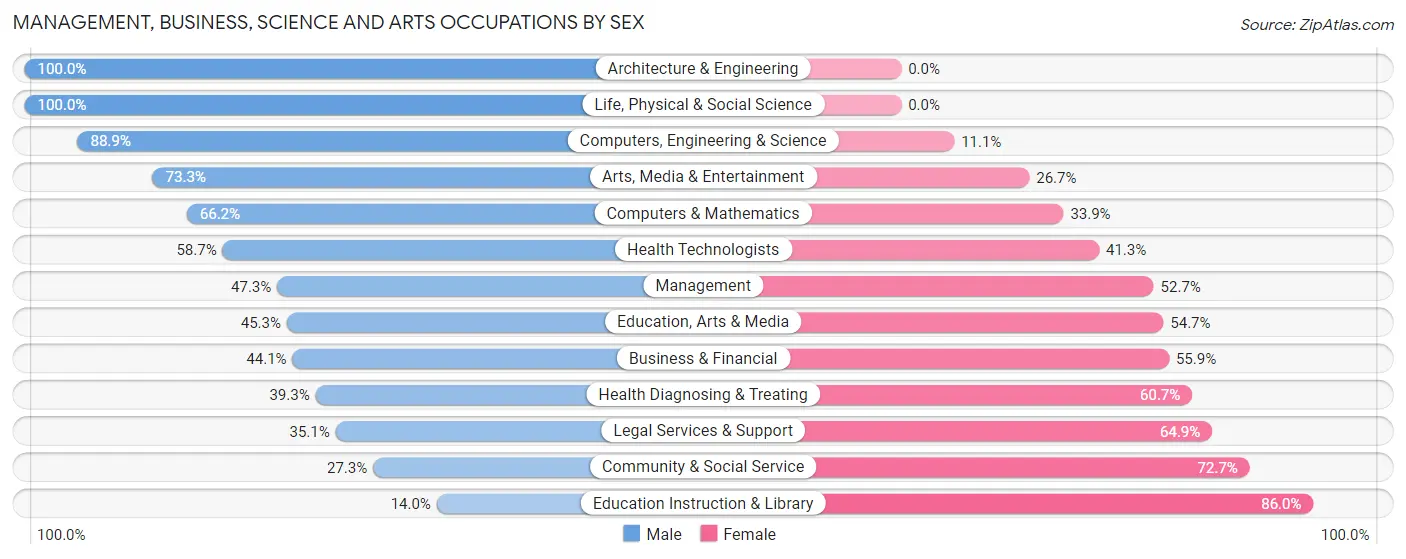
Management, Business, Science and Arts Occupations by Sex
Within the Management, Business, Science and Arts occupations in Marshall, the most male-oriented occupations are Architecture & Engineering (100.0%), Life, Physical & Social Science (100.0%), and Computers, Engineering & Science (88.9%), while the most female-oriented occupations are Education Instruction & Library (86.0%), Community & Social Service (72.7%), and Legal Services & Support (64.9%).
| Occupation | Male | Female |
| Management | 284 (47.3%) | 316 (52.7%) |
| Business & Financial | 109 (44.1%) | 138 (55.9%) |
| Computers, Engineering & Science | 177 (88.9%) | 22 (11.1%) |
| Computers & Mathematics | 43 (66.1%) | 22 (33.9%) |
| Architecture & Engineering | 86 (100.0%) | 0 (0.0%) |
| Life, Physical & Social Science | 48 (100.0%) | 0 (0.0%) |
| Community & Social Service | 281 (27.3%) | 748 (72.7%) |
| Education, Arts & Media | 87 (45.3%) | 105 (54.7%) |
| Legal Services & Support | 13 (35.1%) | 24 (64.9%) |
| Education Instruction & Library | 96 (14.0%) | 588 (86.0%) |
| Arts, Media & Entertainment | 85 (73.3%) | 31 (26.7%) |
| Health Diagnosing & Treating | 138 (39.3%) | 213 (60.7%) |
| Health Technologists | 138 (58.7%) | 97 (41.3%) |
| Total (Category) | 989 (40.8%) | 1,437 (59.2%) |
| Total (Overall) | 5,006 (50.3%) | 4,945 (49.7%) |
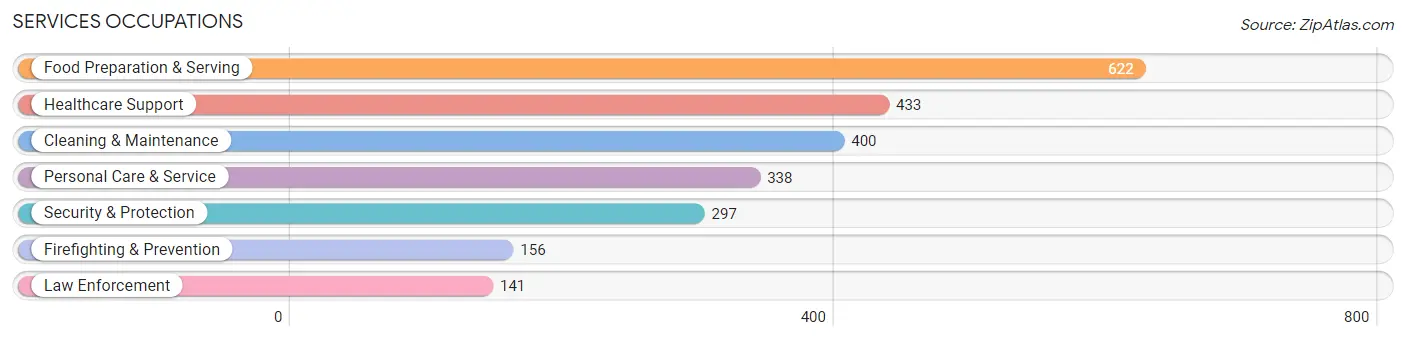
Services Occupations
The most common Services occupations in Marshall are Food Preparation & Serving (622 | 6.2%), Healthcare Support (433 | 4.3%), Cleaning & Maintenance (400 | 4.0%), Personal Care & Service (338 | 3.4%), and Security & Protection (297 | 3.0%).
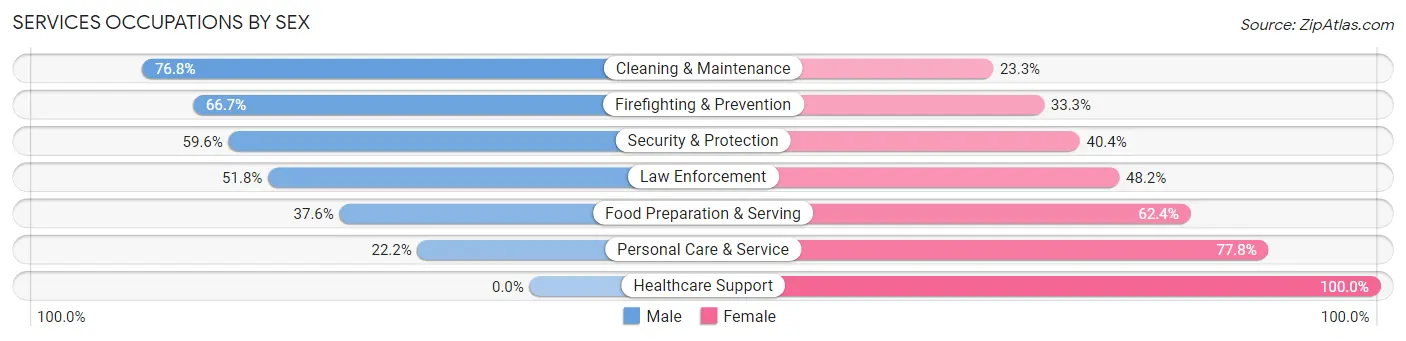
Services Occupations by Sex
Within the Services occupations in Marshall, the most male-oriented occupations are Cleaning & Maintenance (76.7%), Firefighting & Prevention (66.7%), and Security & Protection (59.6%), while the most female-oriented occupations are Healthcare Support (100.0%), Personal Care & Service (77.8%), and Food Preparation & Serving (62.4%).
| Occupation | Male | Female |
| Healthcare Support | 0 (0.0%) | 433 (100.0%) |
| Security & Protection | 177 (59.6%) | 120 (40.4%) |
| Firefighting & Prevention | 104 (66.7%) | 52 (33.3%) |
| Law Enforcement | 73 (51.8%) | 68 (48.2%) |
| Food Preparation & Serving | 234 (37.6%) | 388 (62.4%) |
| Cleaning & Maintenance | 307 (76.7%) | 93 (23.3%) |
| Personal Care & Service | 75 (22.2%) | 263 (77.8%) |
| Total (Category) | 793 (37.9%) | 1,297 (62.1%) |
| Total (Overall) | 5,006 (50.3%) | 4,945 (49.7%) |
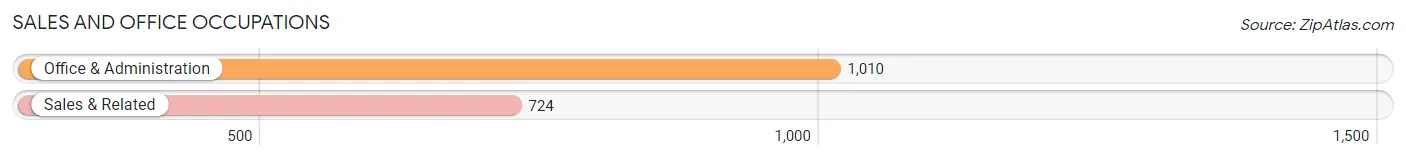
Sales and Office Occupations
The most common Sales and Office occupations in Marshall are Office & Administration (1,010 | 10.2%), and Sales & Related (724 | 7.3%).
Sales and Office Occupations by Sex
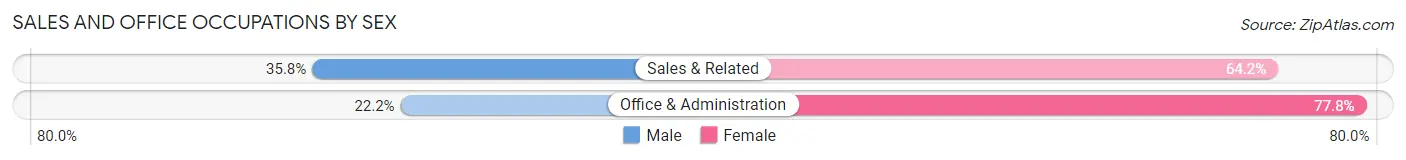
| Occupation | Male | Female |
| Sales & Related | 259 (35.8%) | 465 (64.2%) |
| Office & Administration | 224 (22.2%) | 786 (77.8%) |
| Total (Category) | 483 (27.9%) | 1,251 (72.2%) |
| Total (Overall) | 5,006 (50.3%) | 4,945 (49.7%) |
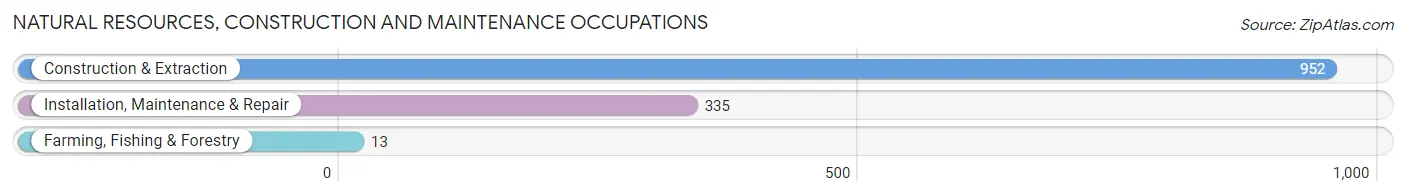
Natural Resources, Construction and Maintenance Occupations
The most common Natural Resources, Construction and Maintenance occupations in Marshall are Construction & Extraction (952 | 9.6%), Installation, Maintenance & Repair (335 | 3.4%), and Farming, Fishing & Forestry (13 | 0.1%).
Natural Resources, Construction and Maintenance Occupations by Sex
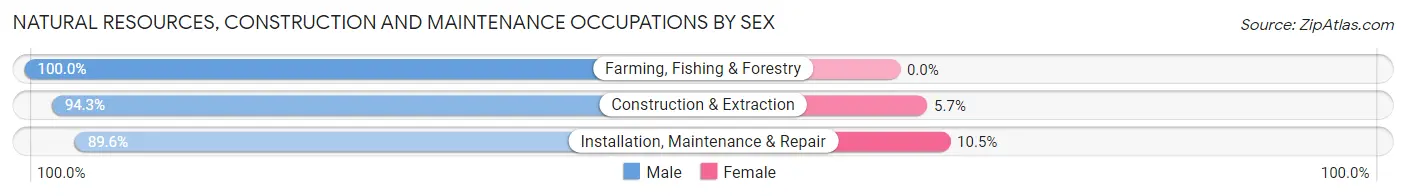
| Occupation | Male | Female |
| Farming, Fishing & Forestry | 13 (100.0%) | 0 (0.0%) |
| Construction & Extraction | 898 (94.3%) | 54 (5.7%) |
| Installation, Maintenance & Repair | 300 (89.5%) | 35 (10.4%) |
| Total (Category) | 1,211 (93.1%) | 89 (6.9%) |
| Total (Overall) | 5,006 (50.3%) | 4,945 (49.7%) |
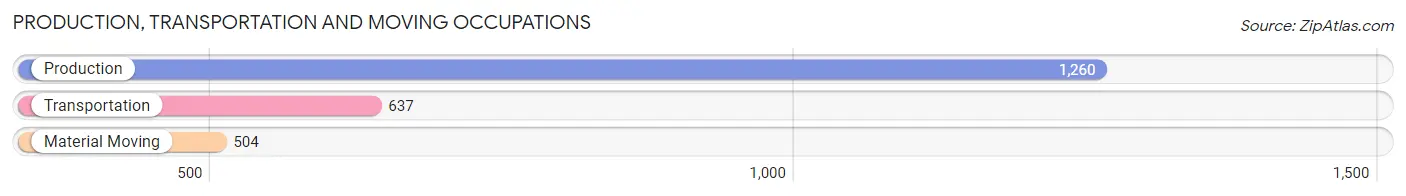
Production, Transportation and Moving Occupations
The most common Production, Transportation and Moving occupations in Marshall are Production (1,260 | 12.7%), Transportation (637 | 6.4%), and Material Moving (504 | 5.1%).
Production, Transportation and Moving Occupations by Sex
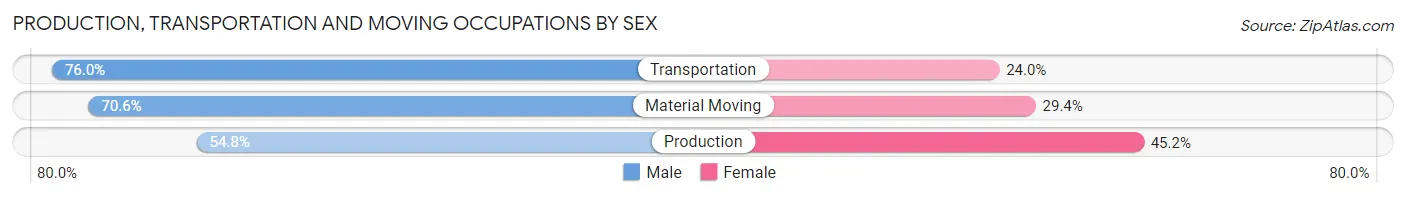
| Occupation | Male | Female |
| Production | 690 (54.8%) | 570 (45.2%) |
| Transportation | 484 (76.0%) | 153 (24.0%) |
| Material Moving | 356 (70.6%) | 148 (29.4%) |
| Total (Category) | 1,530 (63.7%) | 871 (36.3%) |
| Total (Overall) | 5,006 (50.3%) | 4,945 (49.7%) |
Employment Industries by Sex in Marshall
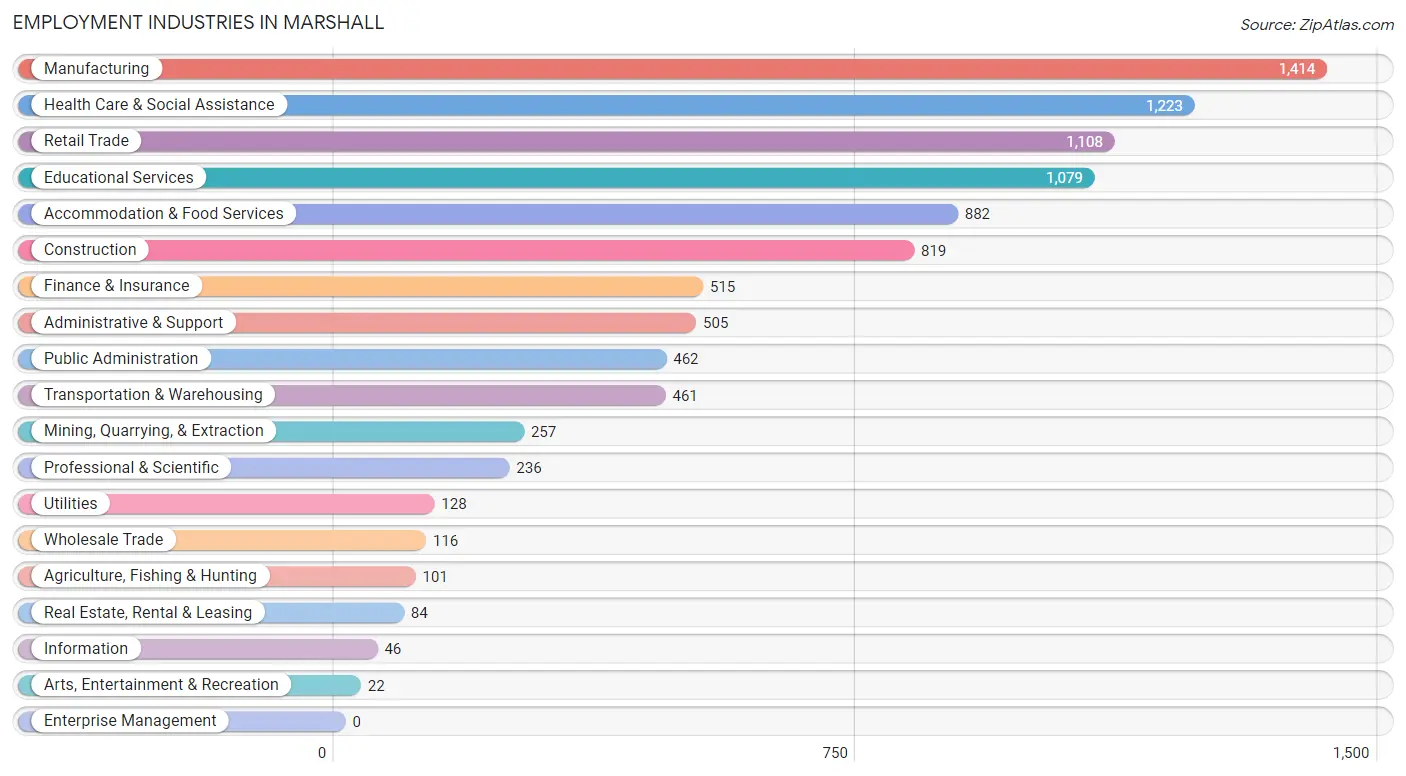
Employment Industries in Marshall
The major employment industries in Marshall include Manufacturing (1,414 | 14.2%), Health Care & Social Assistance (1,223 | 12.3%), Retail Trade (1,108 | 11.1%), Educational Services (1,079 | 10.8%), and Accommodation & Food Services (882 | 8.9%).
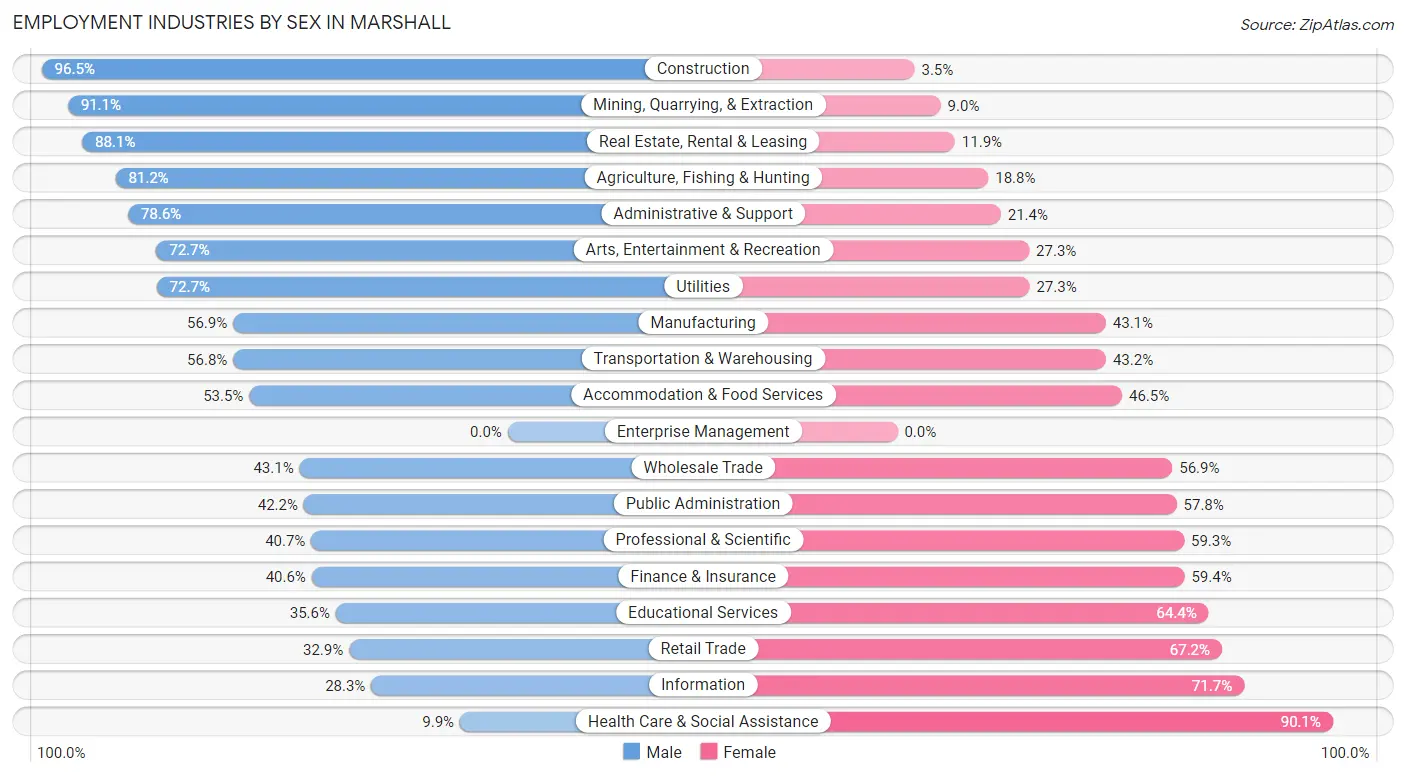
Employment Industries by Sex in Marshall
The Marshall industries that see more men than women are Construction (96.5%), Mining, Quarrying, & Extraction (91.0%), and Real Estate, Rental & Leasing (88.1%), whereas the industries that tend to have a higher number of women are Health Care & Social Assistance (90.1%), Information (71.7%), and Retail Trade (67.1%).
| Industry | Male | Female |
| Agriculture, Fishing & Hunting | 82 (81.2%) | 19 (18.8%) |
| Mining, Quarrying, & Extraction | 234 (91.0%) | 23 (8.9%) |
| Construction | 790 (96.5%) | 29 (3.5%) |
| Manufacturing | 804 (56.9%) | 610 (43.1%) |
| Wholesale Trade | 50 (43.1%) | 66 (56.9%) |
| Retail Trade | 364 (32.9%) | 744 (67.1%) |
| Transportation & Warehousing | 262 (56.8%) | 199 (43.2%) |
| Utilities | 93 (72.7%) | 35 (27.3%) |
| Information | 13 (28.3%) | 33 (71.7%) |
| Finance & Insurance | 209 (40.6%) | 306 (59.4%) |
| Real Estate, Rental & Leasing | 74 (88.1%) | 10 (11.9%) |
| Professional & Scientific | 96 (40.7%) | 140 (59.3%) |
| Enterprise Management | 0 (0.0%) | 0 (0.0%) |
| Administrative & Support | 397 (78.6%) | 108 (21.4%) |
| Educational Services | 384 (35.6%) | 695 (64.4%) |
| Health Care & Social Assistance | 121 (9.9%) | 1,102 (90.1%) |
| Arts, Entertainment & Recreation | 16 (72.7%) | 6 (27.3%) |
| Accommodation & Food Services | 472 (53.5%) | 410 (46.5%) |
| Public Administration | 195 (42.2%) | 267 (57.8%) |
| Total | 5,006 (50.3%) | 4,945 (49.7%) |
Education in Marshall
School Enrollment in Marshall
The most common levels of schooling among the 6,489 students in Marshall are college / undergraduate (1,671 | 25.8%), high school (1,403 | 21.6%), and middle school (1,355 | 20.9%).
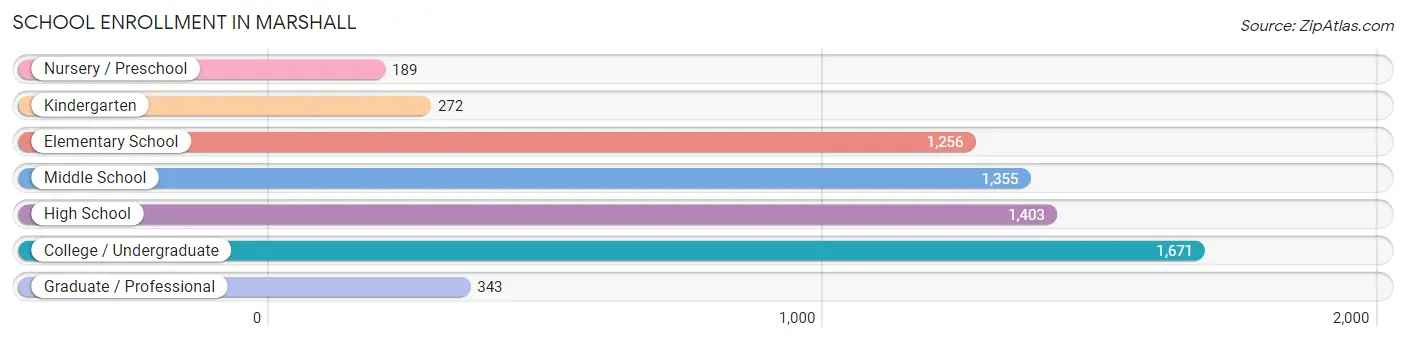
| School Level | # Students | % Students |
| Nursery / Preschool | 189 | 2.9% |
| Kindergarten | 272 | 4.2% |
| Elementary School | 1,256 | 19.4% |
| Middle School | 1,355 | 20.9% |
| High School | 1,403 | 21.6% |
| College / Undergraduate | 1,671 | 25.8% |
| Graduate / Professional | 343 | 5.3% |
| Total | 6,489 | 100.0% |
School Enrollment by Age by Funding Source in Marshall
Out of a total of 6,489 students who are enrolled in schools in Marshall, 1,376 (21.2%) attend a private institution, while the remaining 5,113 (78.8%) are enrolled in public schools. The age group of 20 to 24 year olds has the highest likelihood of being enrolled in private schools, with 558 (59.5% in the age bracket) enrolled. Conversely, the age group of 15 to 17 year olds has the lowest likelihood of being enrolled in a private school, with 886 (97.5% in the age bracket) attending a public institution.
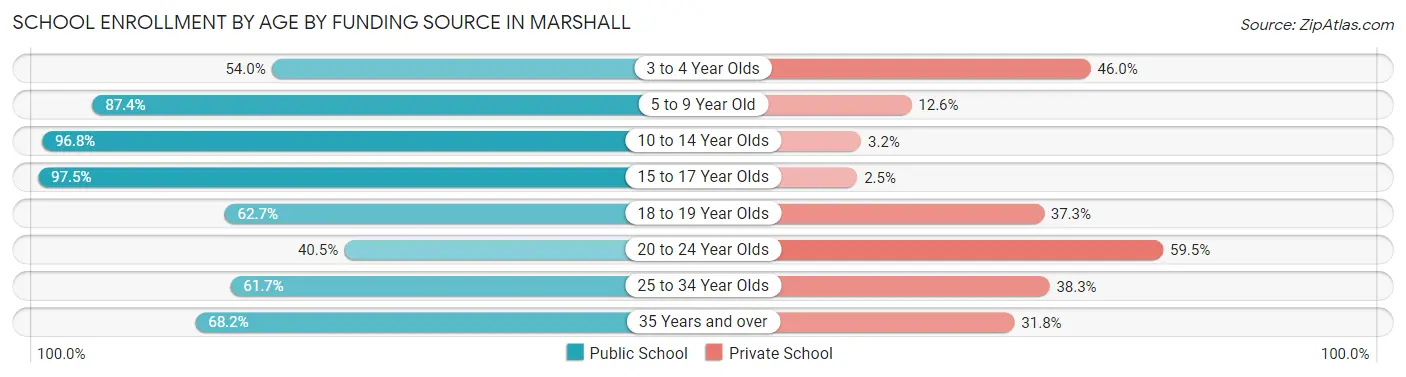
| Age Bracket | Public School | Private School |
| 3 to 4 Year Olds | 74 (54.0%) | 63 (46.0%) |
| 5 to 9 Year Old | 1,324 (87.4%) | 191 (12.6%) |
| 10 to 14 Year Olds | 1,584 (96.8%) | 53 (3.2%) |
| 15 to 17 Year Olds | 886 (97.5%) | 23 (2.5%) |
| 18 to 19 Year Olds | 515 (62.7%) | 306 (37.3%) |
| 20 to 24 Year Olds | 380 (40.5%) | 558 (59.5%) |
| 25 to 34 Year Olds | 140 (61.7%) | 87 (38.3%) |
| 35 Years and over | 208 (68.2%) | 97 (31.8%) |
| Total | 5,113 (78.8%) | 1,376 (21.2%) |
Educational Attainment by Field of Study in Marshall
Education (777 | 22.9%), business (683 | 20.2%), bio, nature & agricultural (311 | 9.2%), computers & mathematics (292 | 8.6%), and science & technology (216 | 6.4%) are the most common fields of study among 3,389 individuals in Marshall who have obtained a bachelor's degree or higher.
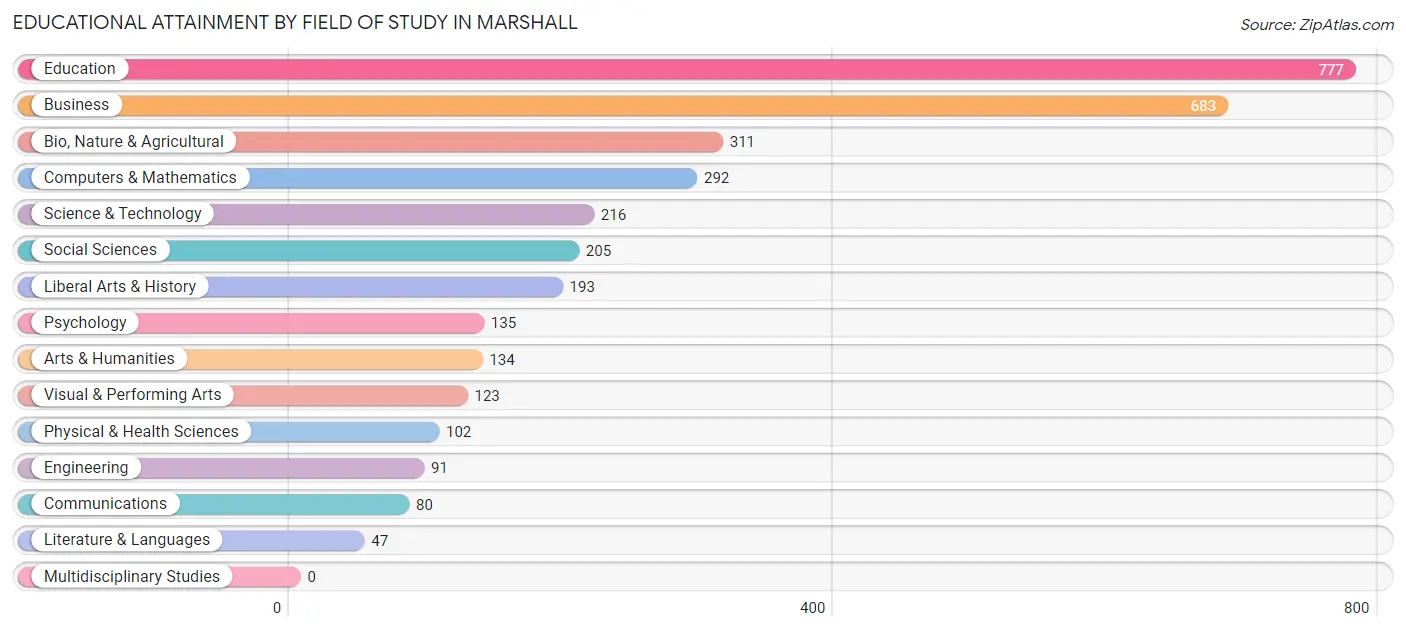
| Field of Study | # Graduates | % Graduates |
| Computers & Mathematics | 292 | 8.6% |
| Bio, Nature & Agricultural | 311 | 9.2% |
| Physical & Health Sciences | 102 | 3.0% |
| Psychology | 135 | 4.0% |
| Social Sciences | 205 | 6.0% |
| Engineering | 91 | 2.7% |
| Multidisciplinary Studies | 0 | 0.0% |
| Science & Technology | 216 | 6.4% |
| Business | 683 | 20.2% |
| Education | 777 | 22.9% |
| Literature & Languages | 47 | 1.4% |
| Liberal Arts & History | 193 | 5.7% |
| Visual & Performing Arts | 123 | 3.6% |
| Communications | 80 | 2.4% |
| Arts & Humanities | 134 | 4.0% |
| Total | 3,389 | 100.0% |
Transportation & Commute in Marshall
Vehicle Availability by Sex in Marshall
The most prevalent vehicle ownership categories in Marshall are males with 2 vehicles (1,870, accounting for 38.0%) and females with 2 vehicles (1,507, making up 40.5%).
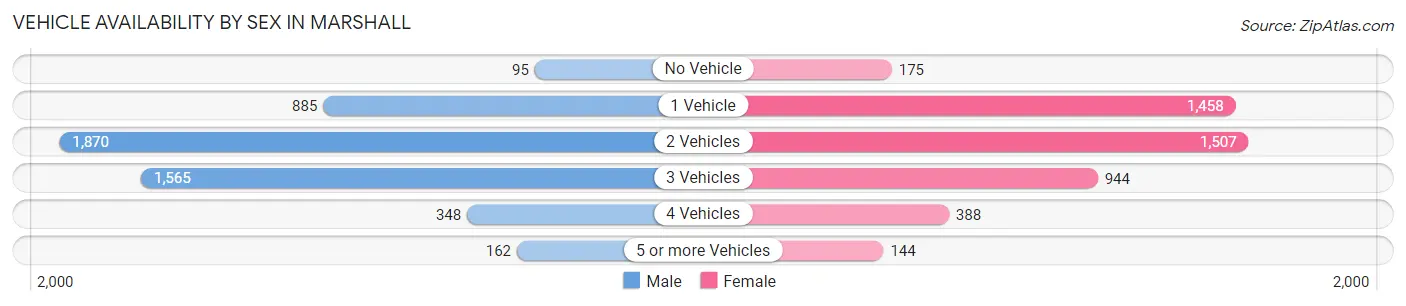
| Vehicles Available | Male | Female |
| No Vehicle | 95 (1.9%) | 175 (3.8%) |
| 1 Vehicle | 885 (18.0%) | 1,458 (31.6%) |
| 2 Vehicles | 1,870 (38.0%) | 1,507 (32.7%) |
| 3 Vehicles | 1,565 (31.8%) | 944 (20.4%) |
| 4 Vehicles | 348 (7.1%) | 388 (8.4%) |
| 5 or more Vehicles | 162 (3.3%) | 144 (3.1%) |
| Total | 4,925 (100.0%) | 4,616 (100.0%) |
Commute Time in Marshall
The most frequently occuring commute durations in Marshall are 5 to 9 minutes (2,753 commuters, 29.7%), 10 to 14 minutes (1,892 commuters, 20.4%), and 20 to 24 minutes (1,195 commuters, 12.9%).
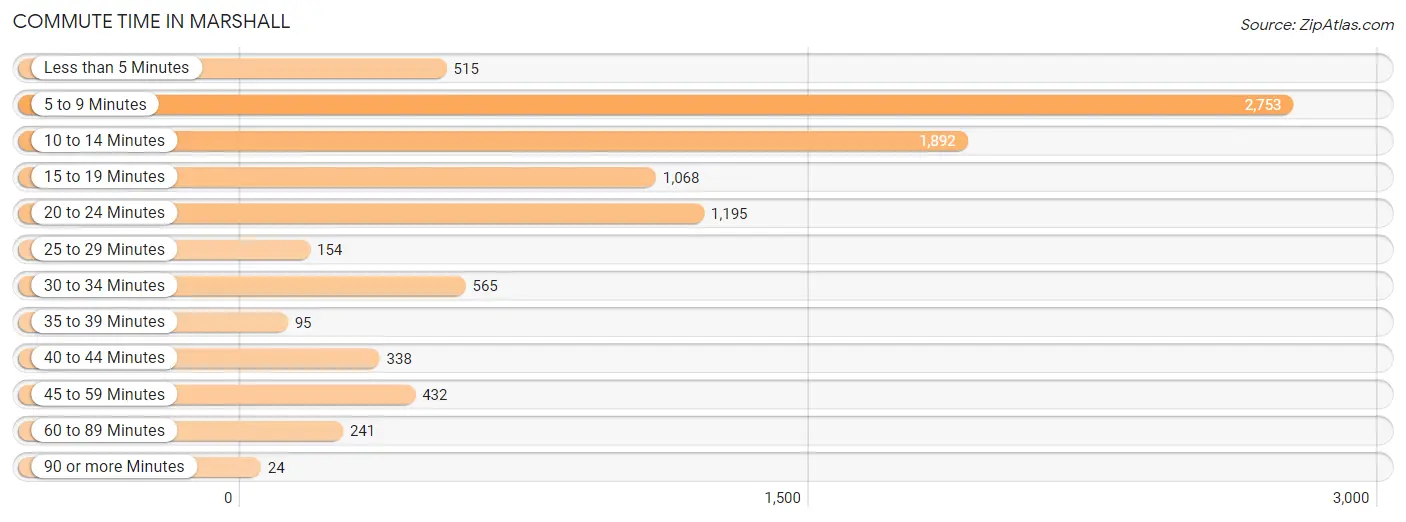
| Commute Time | # Commuters | % Commuters |
| Less than 5 Minutes | 515 | 5.6% |
| 5 to 9 Minutes | 2,753 | 29.7% |
| 10 to 14 Minutes | 1,892 | 20.4% |
| 15 to 19 Minutes | 1,068 | 11.5% |
| 20 to 24 Minutes | 1,195 | 12.9% |
| 25 to 29 Minutes | 154 | 1.7% |
| 30 to 34 Minutes | 565 | 6.1% |
| 35 to 39 Minutes | 95 | 1.0% |
| 40 to 44 Minutes | 338 | 3.6% |
| 45 to 59 Minutes | 432 | 4.7% |
| 60 to 89 Minutes | 241 | 2.6% |
| 90 or more Minutes | 24 | 0.3% |
Commute Time by Sex in Marshall
The most common commute times in Marshall are 5 to 9 minutes (1,391 commuters, 29.6%) for males and 5 to 9 minutes (1,362 commuters, 29.8%) for females.
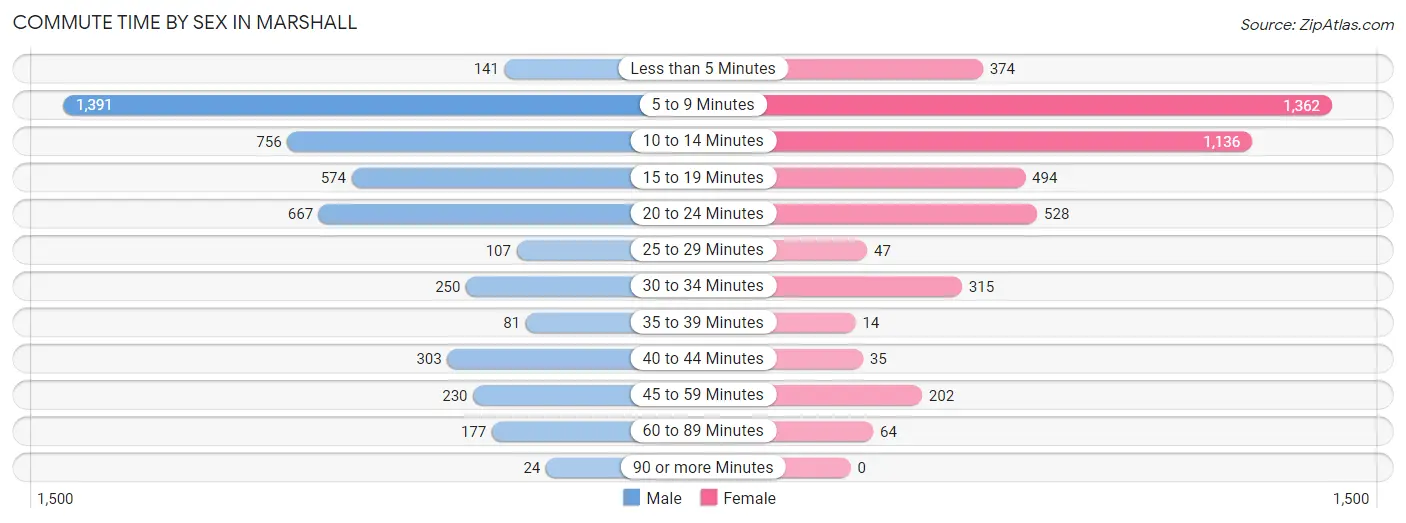
| Commute Time | Male | Female |
| Less than 5 Minutes | 141 (3.0%) | 374 (8.2%) |
| 5 to 9 Minutes | 1,391 (29.6%) | 1,362 (29.8%) |
| 10 to 14 Minutes | 756 (16.1%) | 1,136 (24.8%) |
| 15 to 19 Minutes | 574 (12.2%) | 494 (10.8%) |
| 20 to 24 Minutes | 667 (14.2%) | 528 (11.6%) |
| 25 to 29 Minutes | 107 (2.3%) | 47 (1.0%) |
| 30 to 34 Minutes | 250 (5.3%) | 315 (6.9%) |
| 35 to 39 Minutes | 81 (1.7%) | 14 (0.3%) |
| 40 to 44 Minutes | 303 (6.5%) | 35 (0.8%) |
| 45 to 59 Minutes | 230 (4.9%) | 202 (4.4%) |
| 60 to 89 Minutes | 177 (3.8%) | 64 (1.4%) |
| 90 or more Minutes | 24 (0.5%) | 0 (0.0%) |
Time of Departure to Work by Sex in Marshall
The most frequent times of departure to work in Marshall are 6:00 AM to 6:29 AM (683, 14.5%) for males and 7:30 AM to 7:59 AM (625, 13.7%) for females.
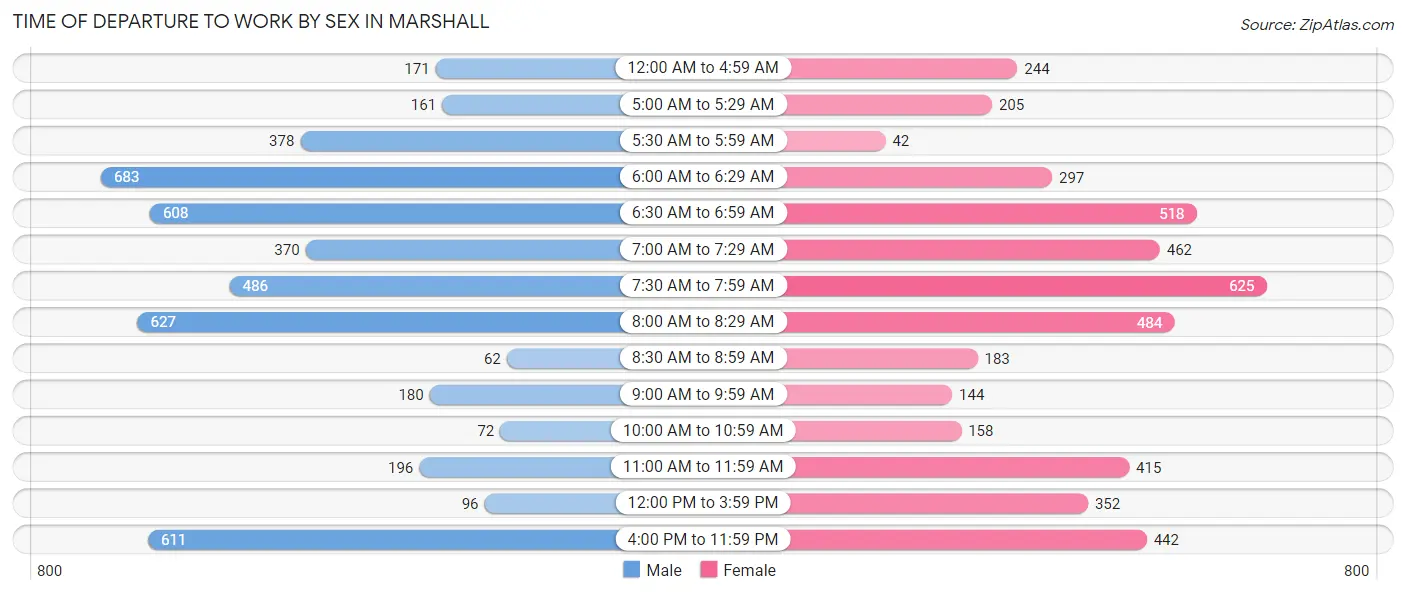
| Time of Departure | Male | Female |
| 12:00 AM to 4:59 AM | 171 (3.6%) | 244 (5.3%) |
| 5:00 AM to 5:29 AM | 161 (3.4%) | 205 (4.5%) |
| 5:30 AM to 5:59 AM | 378 (8.0%) | 42 (0.9%) |
| 6:00 AM to 6:29 AM | 683 (14.5%) | 297 (6.5%) |
| 6:30 AM to 6:59 AM | 608 (12.9%) | 518 (11.3%) |
| 7:00 AM to 7:29 AM | 370 (7.9%) | 462 (10.1%) |
| 7:30 AM to 7:59 AM | 486 (10.3%) | 625 (13.7%) |
| 8:00 AM to 8:29 AM | 627 (13.3%) | 484 (10.6%) |
| 8:30 AM to 8:59 AM | 62 (1.3%) | 183 (4.0%) |
| 9:00 AM to 9:59 AM | 180 (3.8%) | 144 (3.2%) |
| 10:00 AM to 10:59 AM | 72 (1.5%) | 158 (3.5%) |
| 11:00 AM to 11:59 AM | 196 (4.2%) | 415 (9.1%) |
| 12:00 PM to 3:59 PM | 96 (2.0%) | 352 (7.7%) |
| 4:00 PM to 11:59 PM | 611 (13.0%) | 442 (9.7%) |
| Total | 4,701 (100.0%) | 4,571 (100.0%) |
Housing Occupancy in Marshall
Occupancy by Ownership in Marshall
Of the total 8,270 dwellings in Marshall, owner-occupied units account for 4,779 (57.8%), while renter-occupied units make up 3,491 (42.2%).
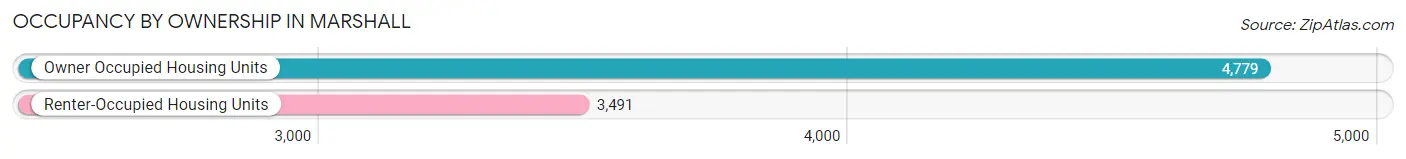
| Occupancy | # Housing Units | % Housing Units |
| Owner Occupied Housing Units | 4,779 | 57.8% |
| Renter-Occupied Housing Units | 3,491 | 42.2% |
| Total Occupied Housing Units | 8,270 | 100.0% |
Occupancy by Household Size in Marshall
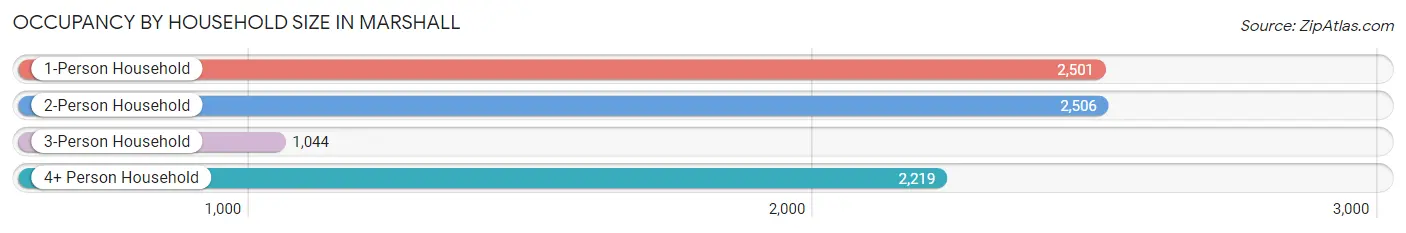
| Household Size | # Housing Units | % Housing Units |
| 1-Person Household | 2,501 | 30.2% |
| 2-Person Household | 2,506 | 30.3% |
| 3-Person Household | 1,044 | 12.6% |
| 4+ Person Household | 2,219 | 26.8% |
| Total Housing Units | 8,270 | 100.0% |
Occupancy by Ownership by Household Size in Marshall
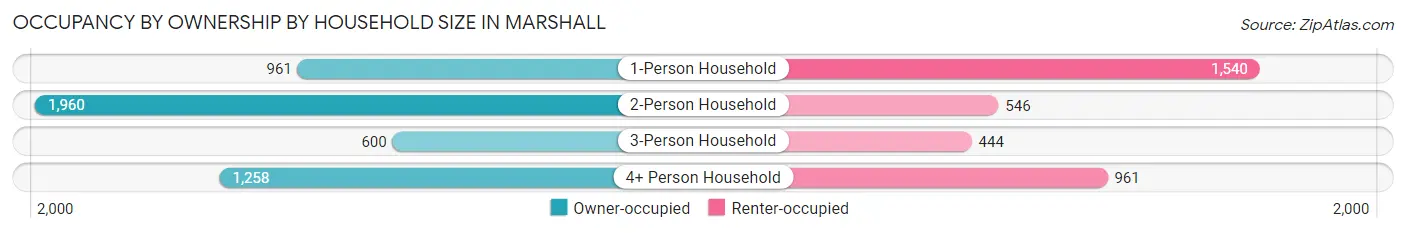
| Household Size | Owner-occupied | Renter-occupied |
| 1-Person Household | 961 (38.4%) | 1,540 (61.6%) |
| 2-Person Household | 1,960 (78.2%) | 546 (21.8%) |
| 3-Person Household | 600 (57.5%) | 444 (42.5%) |
| 4+ Person Household | 1,258 (56.7%) | 961 (43.3%) |
| Total Housing Units | 4,779 (57.8%) | 3,491 (42.2%) |
Occupancy by Educational Attainment in Marshall
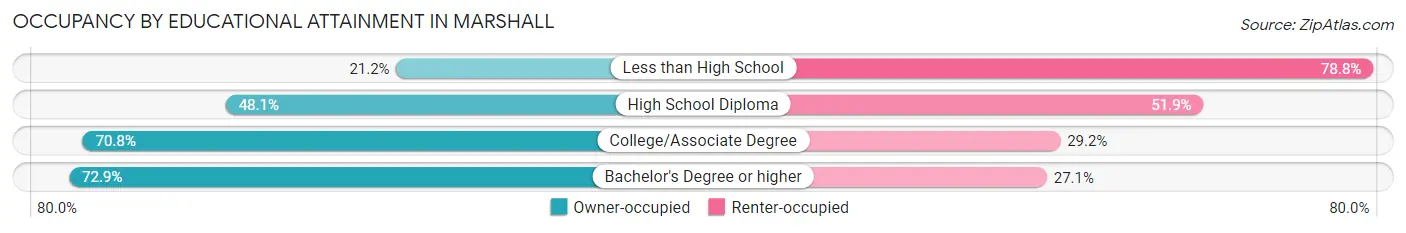
| Household Size | Owner-occupied | Renter-occupied |
| Less than High School | 212 (21.2%) | 789 (78.8%) |
| High School Diploma | 1,306 (48.1%) | 1,409 (51.9%) |
| College/Associate Degree | 2,013 (70.8%) | 830 (29.2%) |
| Bachelor's Degree or higher | 1,248 (72.9%) | 463 (27.1%) |
Occupancy by Age of Householder in Marshall
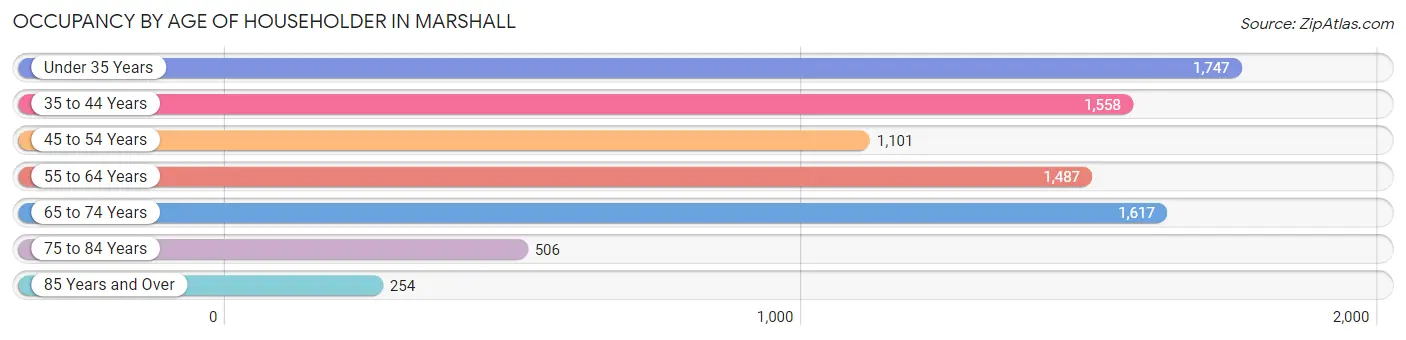
| Age Bracket | # Households | % Households |
| Under 35 Years | 1,747 | 21.1% |
| 35 to 44 Years | 1,558 | 18.8% |
| 45 to 54 Years | 1,101 | 13.3% |
| 55 to 64 Years | 1,487 | 18.0% |
| 65 to 74 Years | 1,617 | 19.6% |
| 75 to 84 Years | 506 | 6.1% |
| 85 Years and Over | 254 | 3.1% |
| Total | 8,270 | 100.0% |
Housing Finances in Marshall
Median Income by Occupancy in Marshall
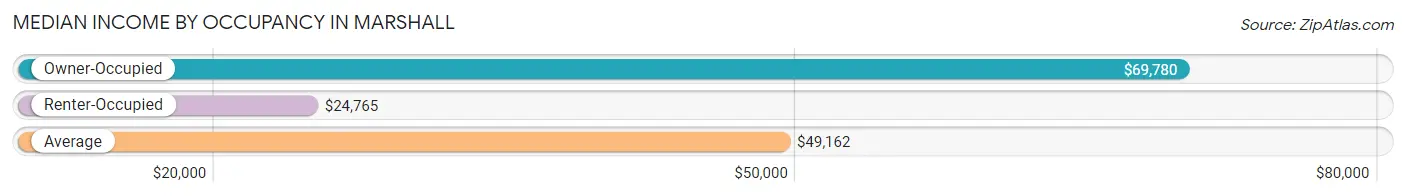
| Occupancy Type | # Households | Median Income |
| Owner-Occupied | 4,779 (57.8%) | $69,780 |
| Renter-Occupied | 3,491 (42.2%) | $24,765 |
| Average | 8,270 (100.0%) | $49,162 |
Occupancy by Householder Income Bracket in Marshall
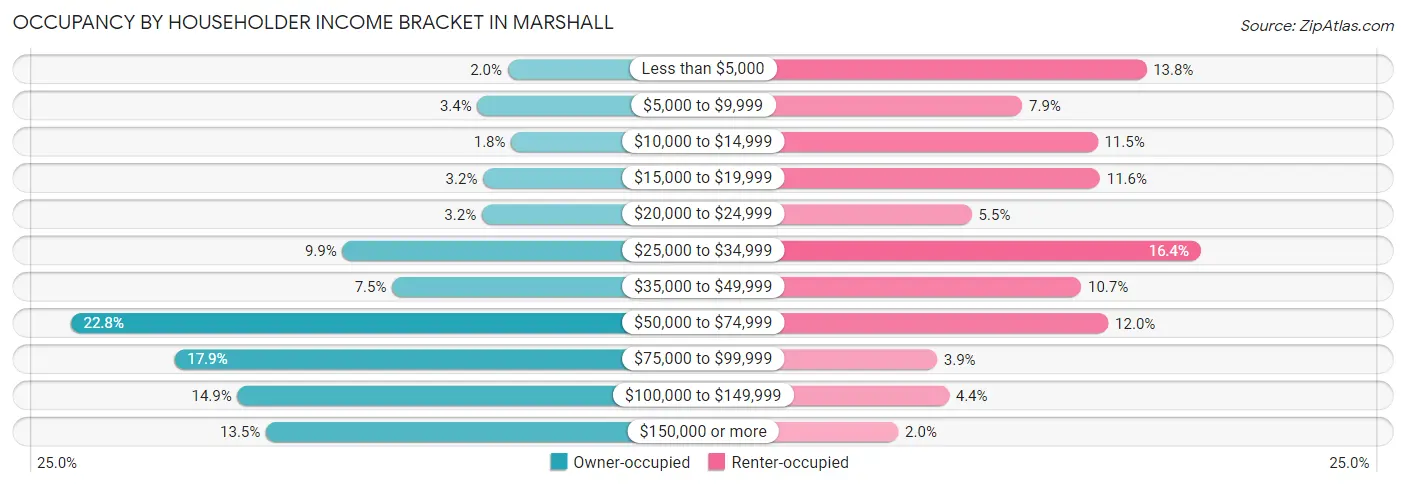
| Income Bracket | Owner-occupied | Renter-occupied |
| Less than $5,000 | 95 (2.0%) | 483 (13.8%) |
| $5,000 to $9,999 | 164 (3.4%) | 277 (7.9%) |
| $10,000 to $14,999 | 87 (1.8%) | 402 (11.5%) |
| $15,000 to $19,999 | 151 (3.2%) | 406 (11.6%) |
| $20,000 to $24,999 | 154 (3.2%) | 193 (5.5%) |
| $25,000 to $34,999 | 471 (9.9%) | 574 (16.4%) |
| $35,000 to $49,999 | 358 (7.5%) | 375 (10.7%) |
| $50,000 to $74,999 | 1,090 (22.8%) | 420 (12.0%) |
| $75,000 to $99,999 | 854 (17.9%) | 135 (3.9%) |
| $100,000 to $149,999 | 710 (14.9%) | 155 (4.4%) |
| $150,000 or more | 645 (13.5%) | 71 (2.0%) |
| Total | 4,779 (100.0%) | 3,491 (100.0%) |
Monthly Housing Cost Tiers in Marshall
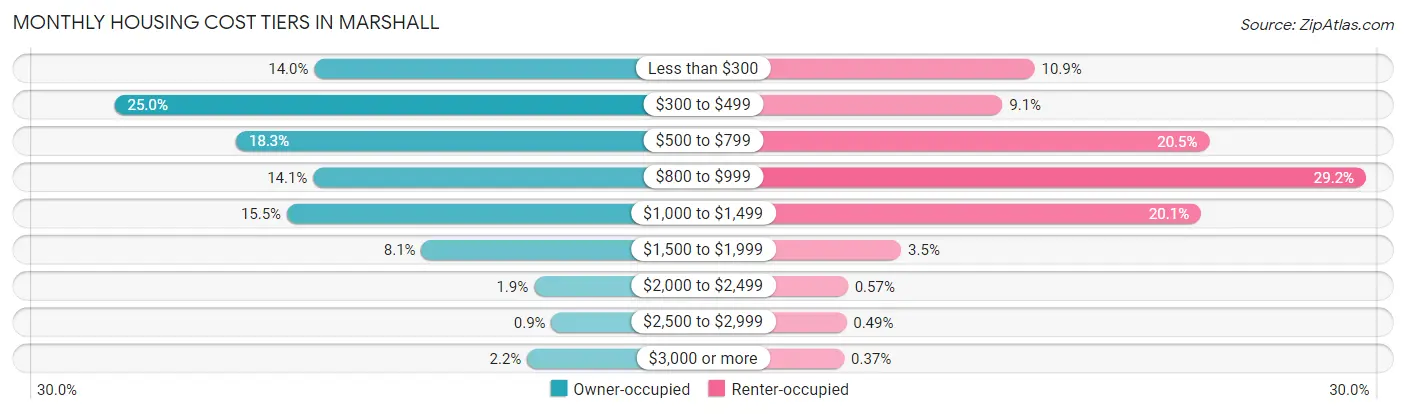
| Monthly Cost | Owner-occupied | Renter-occupied |
| Less than $300 | 669 (14.0%) | 380 (10.9%) |
| $300 to $499 | 1,196 (25.0%) | 318 (9.1%) |
| $500 to $799 | 876 (18.3%) | 717 (20.5%) |
| $800 to $999 | 672 (14.1%) | 1,019 (29.2%) |
| $1,000 to $1,499 | 741 (15.5%) | 701 (20.1%) |
| $1,500 to $1,999 | 386 (8.1%) | 123 (3.5%) |
| $2,000 to $2,499 | 89 (1.9%) | 20 (0.6%) |
| $2,500 to $2,999 | 43 (0.9%) | 17 (0.5%) |
| $3,000 or more | 107 (2.2%) | 13 (0.4%) |
| Total | 4,779 (100.0%) | 3,491 (100.0%) |
Physical Housing Characteristics in Marshall
Housing Structures in Marshall
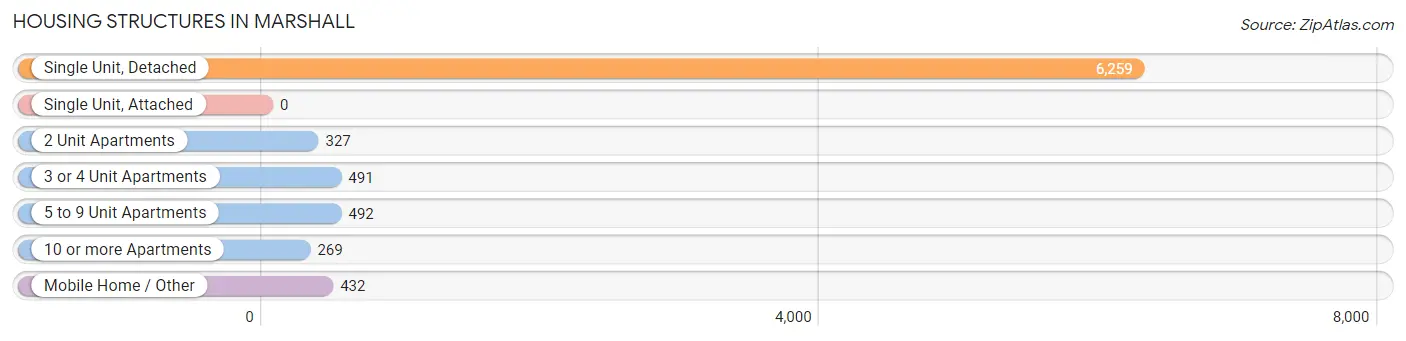
| Structure Type | # Housing Units | % Housing Units |
| Single Unit, Detached | 6,259 | 75.7% |
| Single Unit, Attached | 0 | 0.0% |
| 2 Unit Apartments | 327 | 4.0% |
| 3 or 4 Unit Apartments | 491 | 5.9% |
| 5 to 9 Unit Apartments | 492 | 5.9% |
| 10 or more Apartments | 269 | 3.3% |
| Mobile Home / Other | 432 | 5.2% |
| Total | 8,270 | 100.0% |
Housing Structures by Occupancy in Marshall
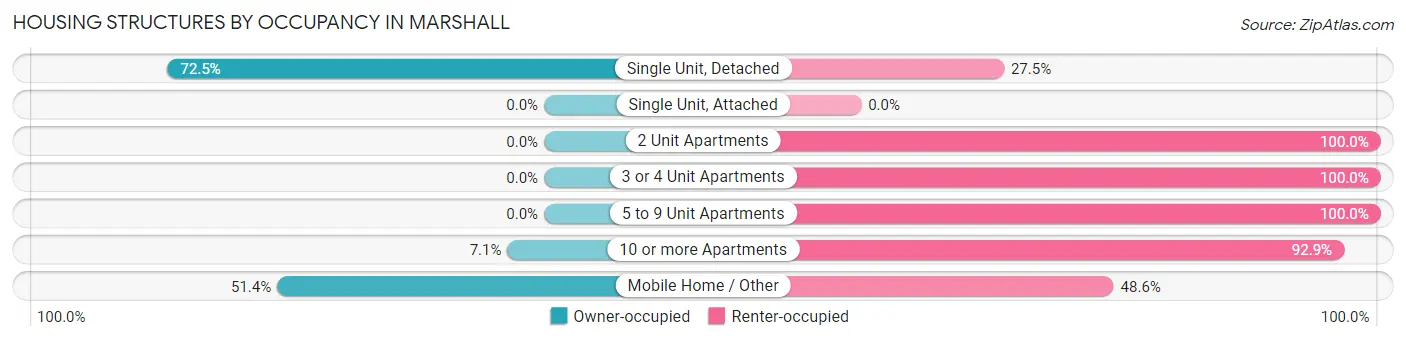
| Structure Type | Owner-occupied | Renter-occupied |
| Single Unit, Detached | 4,538 (72.5%) | 1,721 (27.5%) |
| Single Unit, Attached | 0 (0.0%) | 0 (0.0%) |
| 2 Unit Apartments | 0 (0.0%) | 327 (100.0%) |
| 3 or 4 Unit Apartments | 0 (0.0%) | 491 (100.0%) |
| 5 to 9 Unit Apartments | 0 (0.0%) | 492 (100.0%) |
| 10 or more Apartments | 19 (7.1%) | 250 (92.9%) |
| Mobile Home / Other | 222 (51.4%) | 210 (48.6%) |
| Total | 4,779 (57.8%) | 3,491 (42.2%) |
Housing Structures by Number of Rooms in Marshall
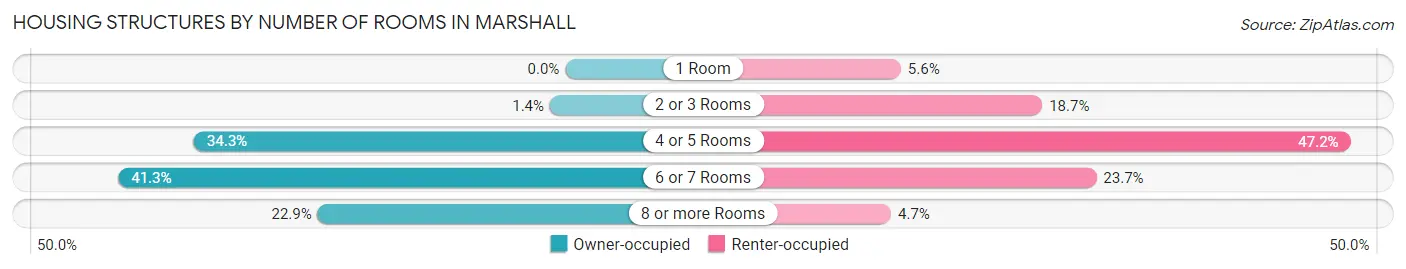
| Number of Rooms | Owner-occupied | Renter-occupied |
| 1 Room | 0 (0.0%) | 197 (5.6%) |
| 2 or 3 Rooms | 68 (1.4%) | 653 (18.7%) |
| 4 or 5 Rooms | 1,641 (34.3%) | 1,648 (47.2%) |
| 6 or 7 Rooms | 1,975 (41.3%) | 828 (23.7%) |
| 8 or more Rooms | 1,095 (22.9%) | 165 (4.7%) |
| Total | 4,779 (100.0%) | 3,491 (100.0%) |
Housing Structure by Heating Type in Marshall
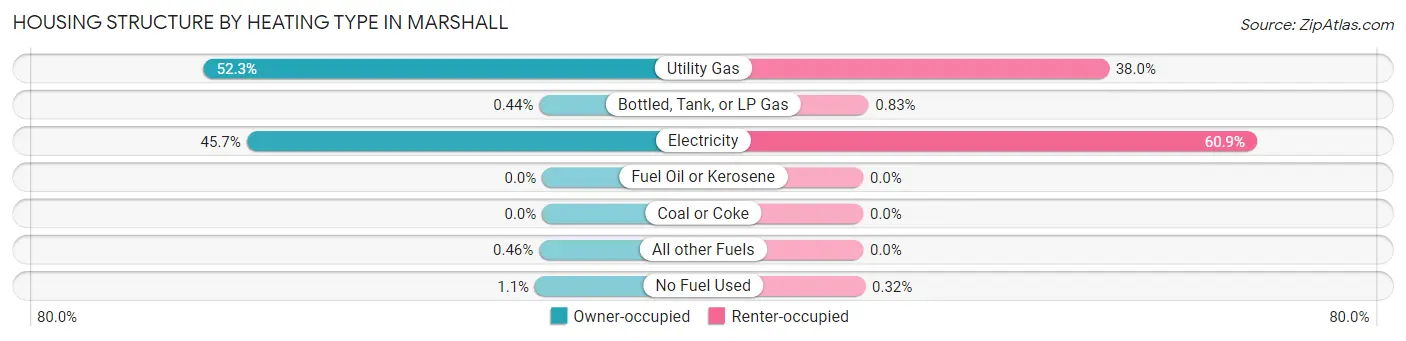
| Heating Type | Owner-occupied | Renter-occupied |
| Utility Gas | 2,500 (52.3%) | 1,326 (38.0%) |
| Bottled, Tank, or LP Gas | 21 (0.4%) | 29 (0.8%) |
| Electricity | 2,183 (45.7%) | 2,125 (60.9%) |
| Fuel Oil or Kerosene | 0 (0.0%) | 0 (0.0%) |
| Coal or Coke | 0 (0.0%) | 0 (0.0%) |
| All other Fuels | 22 (0.5%) | 0 (0.0%) |
| No Fuel Used | 53 (1.1%) | 11 (0.3%) |
| Total | 4,779 (100.0%) | 3,491 (100.0%) |
Household Vehicle Usage in Marshall
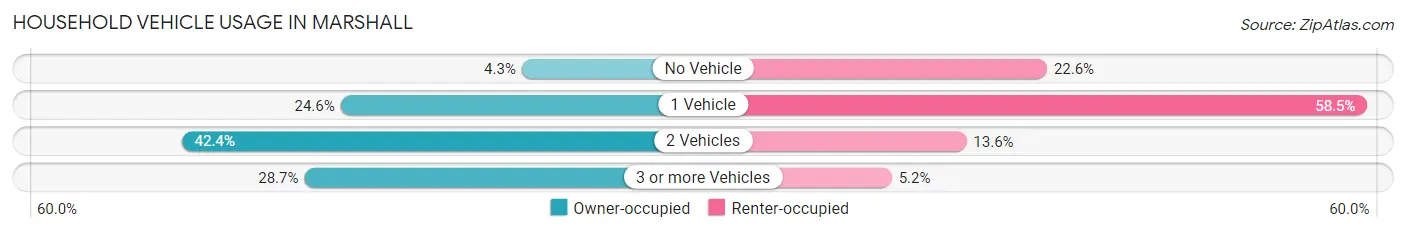
| Vehicles per Household | Owner-occupied | Renter-occupied |
| No Vehicle | 206 (4.3%) | 790 (22.6%) |
| 1 Vehicle | 1,176 (24.6%) | 2,043 (58.5%) |
| 2 Vehicles | 2,027 (42.4%) | 475 (13.6%) |
| 3 or more Vehicles | 1,370 (28.7%) | 183 (5.2%) |
| Total | 4,779 (100.0%) | 3,491 (100.0%) |
Real Estate & Mortgages in Marshall
Real Estate and Mortgage Overview in Marshall
| Characteristic | Without Mortgage | With Mortgage |
| Housing Units | 2,901 | 1,878 |
| Median Property Value | $88,900 | $172,800 |
| Median Household Income | $59,362 | $332 |
| Monthly Housing Costs | $420 | $94 |
| Real Estate Taxes | $844 | $104 |
Property Value by Mortgage Status in Marshall
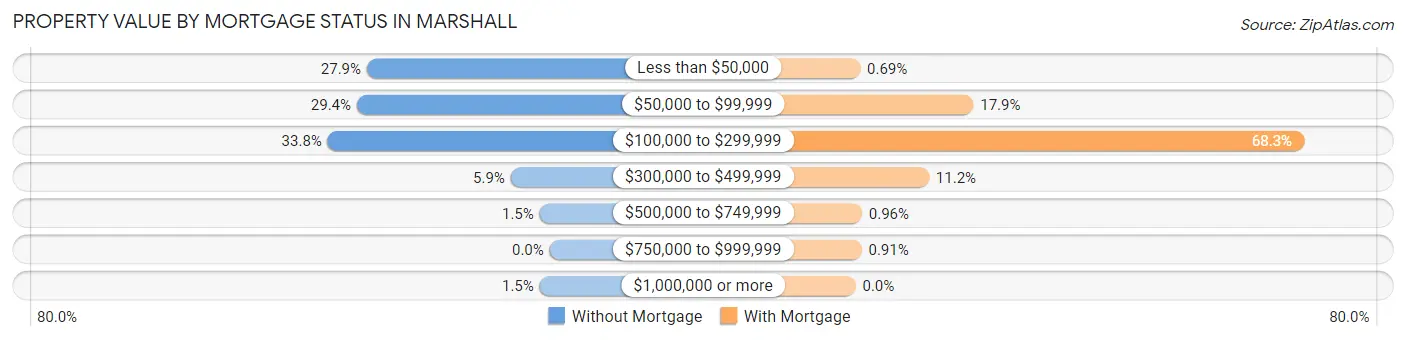
| Property Value | Without Mortgage | With Mortgage |
| Less than $50,000 | 808 (27.9%) | 13 (0.7%) |
| $50,000 to $99,999 | 852 (29.4%) | 337 (17.9%) |
| $100,000 to $299,999 | 981 (33.8%) | 1,283 (68.3%) |
| $300,000 to $499,999 | 172 (5.9%) | 210 (11.2%) |
| $500,000 to $749,999 | 44 (1.5%) | 18 (1.0%) |
| $750,000 to $999,999 | 0 (0.0%) | 17 (0.9%) |
| $1,000,000 or more | 44 (1.5%) | 0 (0.0%) |
| Total | 2,901 (100.0%) | 1,878 (100.0%) |
Household Income by Mortgage Status in Marshall
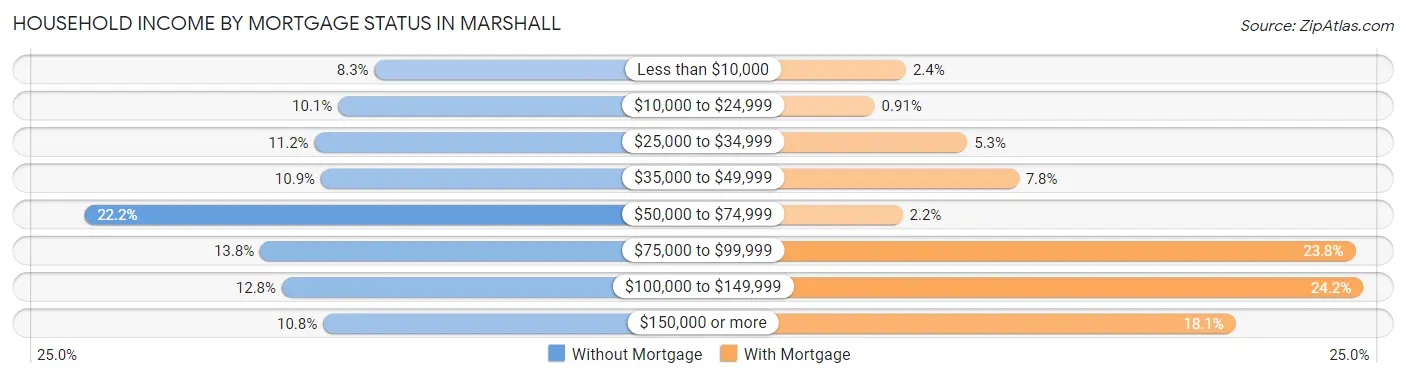
| Household Income | Without Mortgage | With Mortgage |
| Less than $10,000 | 242 (8.3%) | 45 (2.4%) |
| $10,000 to $24,999 | 292 (10.1%) | 17 (0.9%) |
| $25,000 to $34,999 | 325 (11.2%) | 100 (5.3%) |
| $35,000 to $49,999 | 316 (10.9%) | 146 (7.8%) |
| $50,000 to $74,999 | 643 (22.2%) | 42 (2.2%) |
| $75,000 to $99,999 | 400 (13.8%) | 447 (23.8%) |
| $100,000 to $149,999 | 370 (12.8%) | 454 (24.2%) |
| $150,000 or more | 313 (10.8%) | 340 (18.1%) |
| Total | 2,901 (100.0%) | 1,878 (100.0%) |
Property Value to Household Income Ratio in Marshall
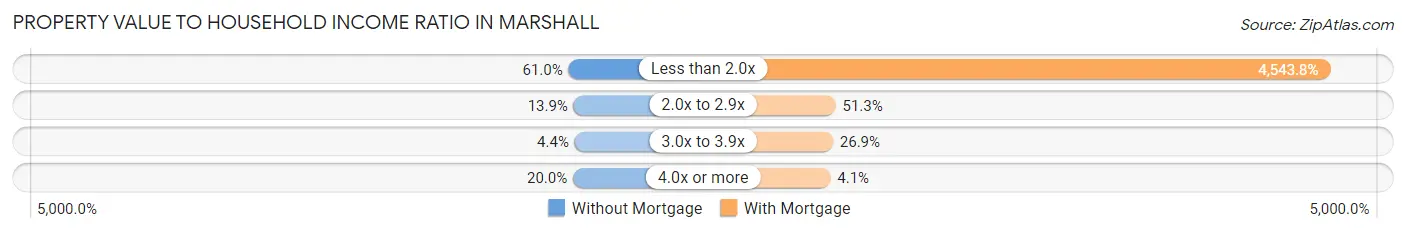
| Value-to-Income Ratio | Without Mortgage | With Mortgage |
| Less than 2.0x | 1,770 (61.0%) | 85,333 (4,543.8%) |
| 2.0x to 2.9x | 403 (13.9%) | 964 (51.3%) |
| 3.0x to 3.9x | 128 (4.4%) | 506 (26.9%) |
| 4.0x or more | 579 (20.0%) | 77 (4.1%) |
| Total | 2,901 (100.0%) | 1,878 (100.0%) |
Real Estate Taxes by Mortgage Status in Marshall
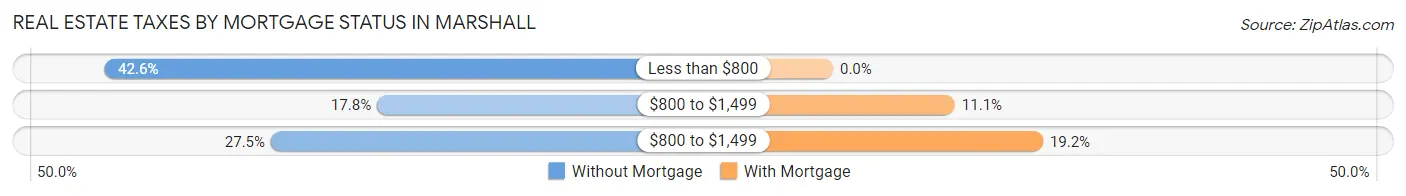
| Property Taxes | Without Mortgage | With Mortgage |
| Less than $800 | 1,237 (42.6%) | 0 (0.0%) |
| $800 to $1,499 | 517 (17.8%) | 209 (11.1%) |
| $800 to $1,499 | 798 (27.5%) | 360 (19.2%) |
| Total | 2,901 (100.0%) | 1,878 (100.0%) |
Health & Disability in Marshall
Health Insurance Coverage by Age in Marshall
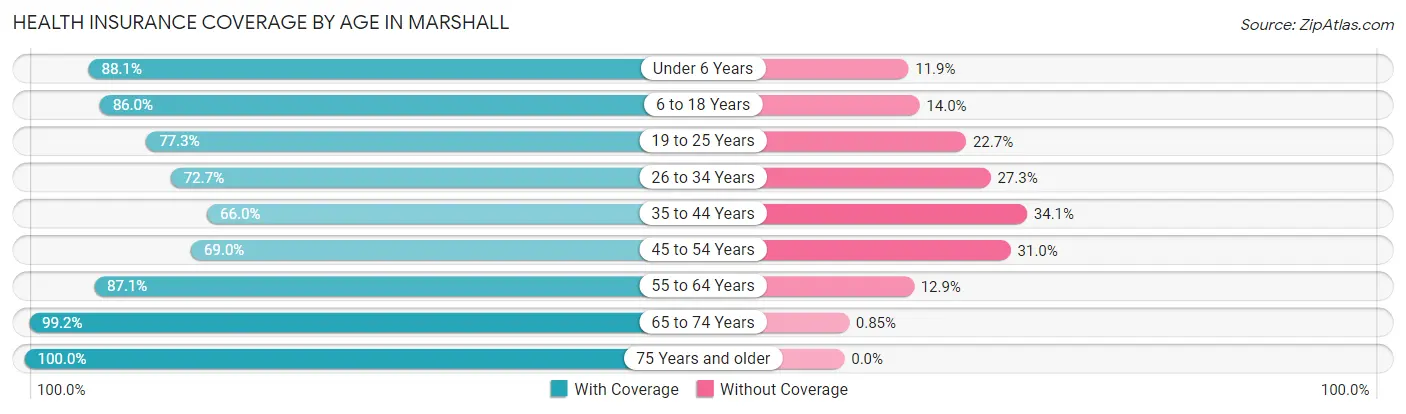
| Age Bracket | With Coverage | Without Coverage |
| Under 6 Years | 1,462 (88.1%) | 198 (11.9%) |
| 6 to 18 Years | 3,929 (86.0%) | 640 (14.0%) |
| 19 to 25 Years | 2,082 (77.3%) | 611 (22.7%) |
| 26 to 34 Years | 2,242 (72.7%) | 840 (27.3%) |
| 35 to 44 Years | 2,005 (65.9%) | 1,035 (34.1%) |
| 45 to 54 Years | 1,354 (69.0%) | 609 (31.0%) |
| 55 to 64 Years | 2,221 (87.1%) | 330 (12.9%) |
| 65 to 74 Years | 2,228 (99.2%) | 19 (0.9%) |
| 75 Years and older | 1,011 (100.0%) | 0 (0.0%) |
| Total | 18,534 (81.2%) | 4,282 (18.8%) |
Health Insurance Coverage by Citizenship Status in Marshall
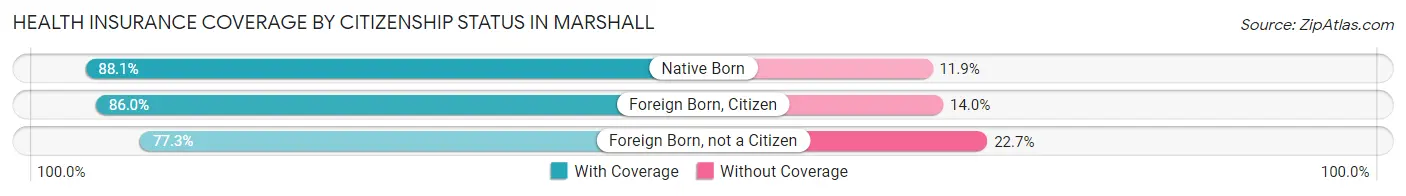
| Citizenship Status | With Coverage | Without Coverage |
| Native Born | 1,462 (88.1%) | 198 (11.9%) |
| Foreign Born, Citizen | 3,929 (86.0%) | 640 (14.0%) |
| Foreign Born, not a Citizen | 2,082 (77.3%) | 611 (22.7%) |
Health Insurance Coverage by Household Income in Marshall
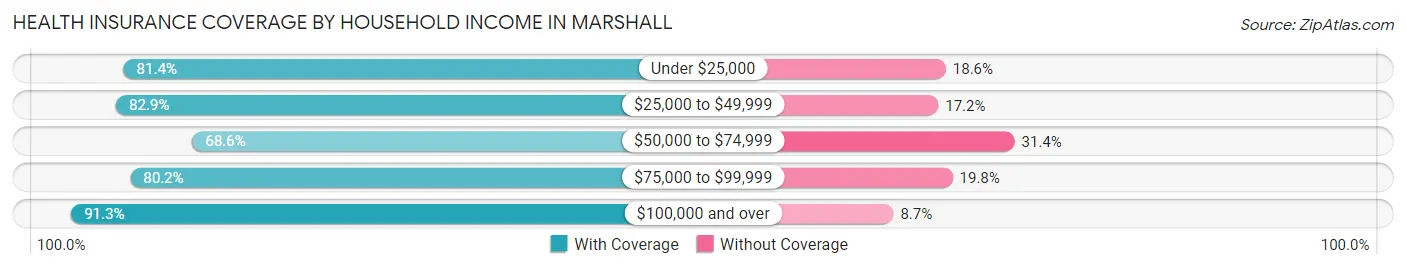
| Household Income | With Coverage | Without Coverage |
| Under $25,000 | 3,643 (81.4%) | 830 (18.6%) |
| $25,000 to $49,999 | 3,434 (82.9%) | 711 (17.2%) |
| $50,000 to $74,999 | 3,035 (68.6%) | 1,391 (31.4%) |
| $75,000 to $99,999 | 2,718 (80.2%) | 672 (19.8%) |
| $100,000 and over | 5,024 (91.3%) | 481 (8.7%) |
Public vs Private Health Insurance Coverage by Age in Marshall
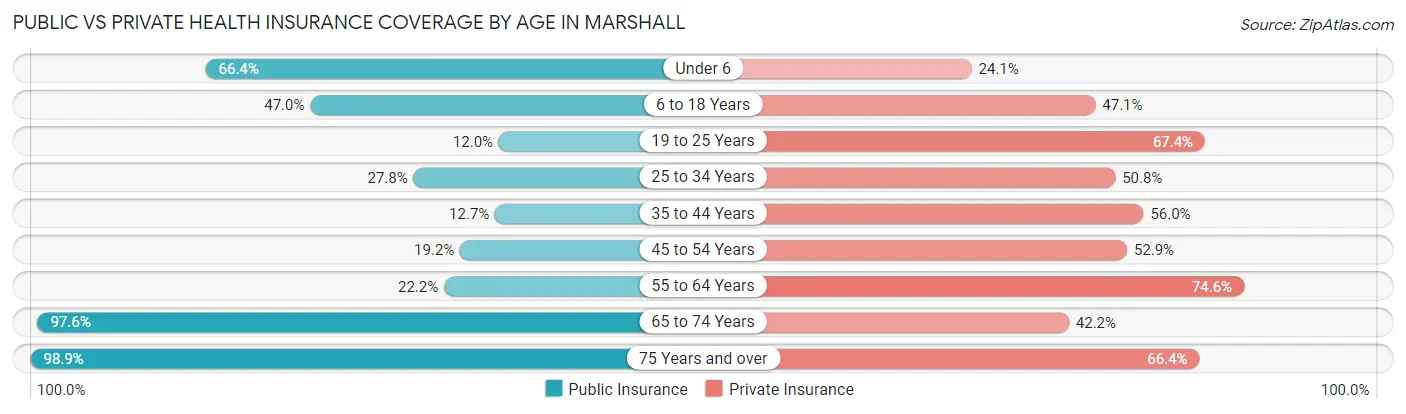
| Age Bracket | Public Insurance | Private Insurance |
| Under 6 | 1,102 (66.4%) | 400 (24.1%) |
| 6 to 18 Years | 2,146 (47.0%) | 2,150 (47.1%) |
| 19 to 25 Years | 322 (12.0%) | 1,815 (67.4%) |
| 25 to 34 Years | 857 (27.8%) | 1,564 (50.7%) |
| 35 to 44 Years | 385 (12.7%) | 1,702 (56.0%) |
| 45 to 54 Years | 376 (19.2%) | 1,039 (52.9%) |
| 55 to 64 Years | 565 (22.2%) | 1,904 (74.6%) |
| 65 to 74 Years | 2,193 (97.6%) | 947 (42.1%) |
| 75 Years and over | 1,000 (98.9%) | 671 (66.4%) |
| Total | 8,946 (39.2%) | 12,192 (53.4%) |
Disability Status by Sex by Age in Marshall
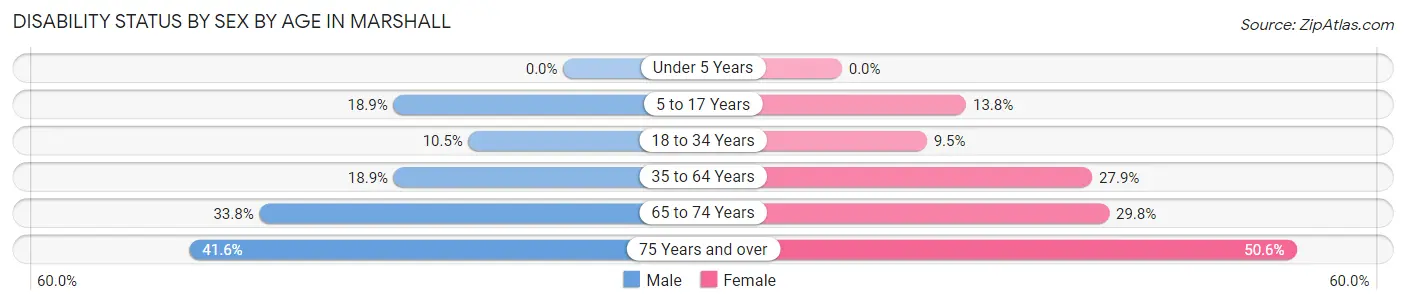
| Age Bracket | Male | Female |
| Under 5 Years | 0 (0.0%) | 0 (0.0%) |
| 5 to 17 Years | 400 (18.9%) | 291 (13.8%) |
| 18 to 34 Years | 315 (10.5%) | 320 (9.5%) |
| 35 to 64 Years | 670 (18.9%) | 1,116 (27.9%) |
| 65 to 74 Years | 334 (33.8%) | 375 (29.8%) |
| 75 Years and over | 152 (41.6%) | 327 (50.6%) |
Disability Class by Sex by Age in Marshall
Disability Class: Hearing Difficulty
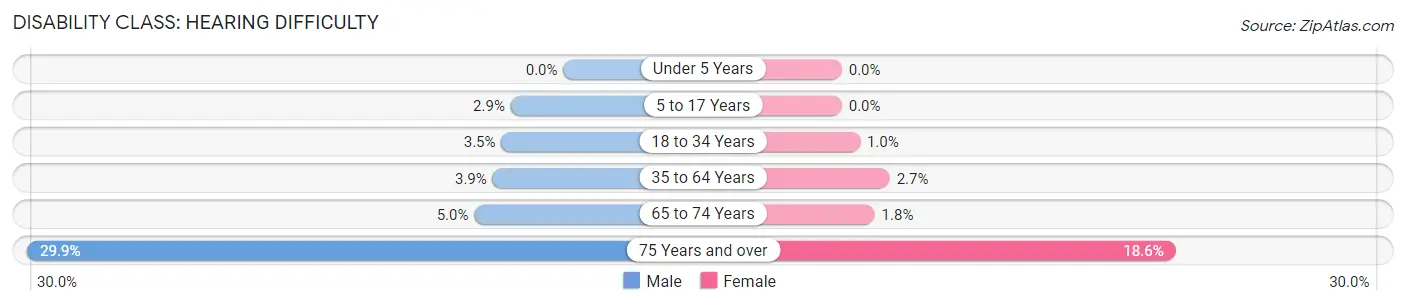
| Age Bracket | Male | Female |
| Under 5 Years | 0 (0.0%) | 0 (0.0%) |
| 5 to 17 Years | 62 (2.9%) | 0 (0.0%) |
| 18 to 34 Years | 103 (3.5%) | 34 (1.0%) |
| 35 to 64 Years | 140 (3.9%) | 107 (2.7%) |
| 65 to 74 Years | 49 (5.0%) | 23 (1.8%) |
| 75 Years and over | 109 (29.9%) | 120 (18.6%) |
Disability Class: Vision Difficulty
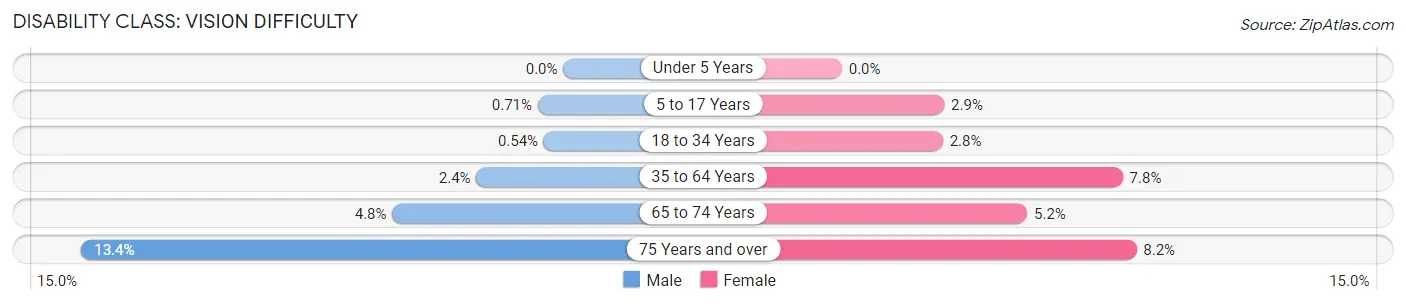
| Age Bracket | Male | Female |
| Under 5 Years | 0 (0.0%) | 0 (0.0%) |
| 5 to 17 Years | 15 (0.7%) | 60 (2.9%) |
| 18 to 34 Years | 16 (0.5%) | 95 (2.8%) |
| 35 to 64 Years | 86 (2.4%) | 313 (7.8%) |
| 65 to 74 Years | 47 (4.8%) | 65 (5.2%) |
| 75 Years and over | 49 (13.4%) | 53 (8.2%) |
Disability Class: Cognitive Difficulty
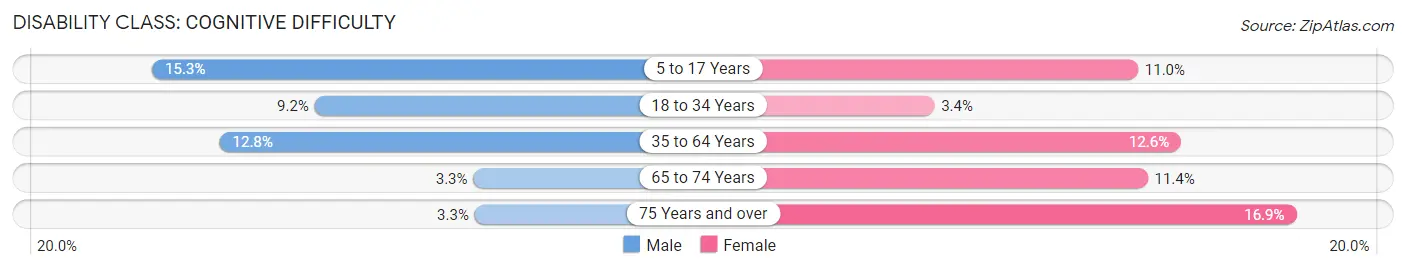
| Age Bracket | Male | Female |
| 5 to 17 Years | 323 (15.3%) | 231 (11.0%) |
| 18 to 34 Years | 276 (9.2%) | 116 (3.4%) |
| 35 to 64 Years | 453 (12.8%) | 504 (12.6%) |
| 65 to 74 Years | 33 (3.3%) | 143 (11.4%) |
| 75 Years and over | 12 (3.3%) | 109 (16.9%) |
Disability Class: Ambulatory Difficulty
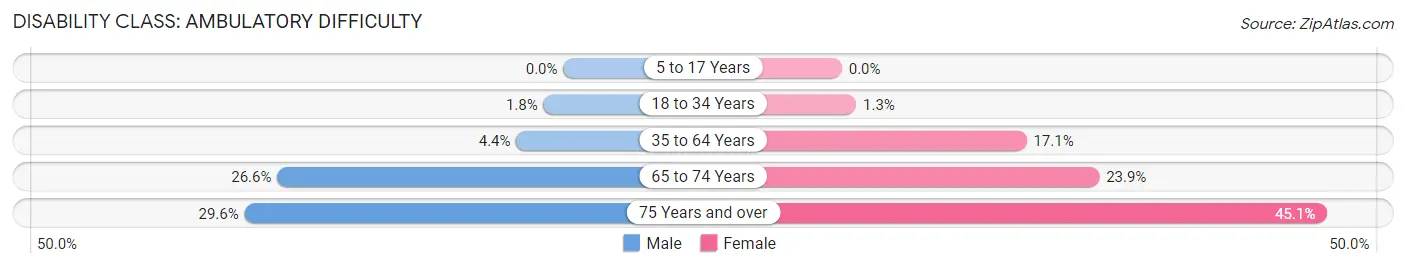
| Age Bracket | Male | Female |
| 5 to 17 Years | 0 (0.0%) | 0 (0.0%) |
| 18 to 34 Years | 55 (1.8%) | 45 (1.3%) |
| 35 to 64 Years | 155 (4.4%) | 686 (17.1%) |
| 65 to 74 Years | 262 (26.6%) | 301 (23.9%) |
| 75 Years and over | 108 (29.6%) | 291 (45.1%) |
Disability Class: Self-Care Difficulty
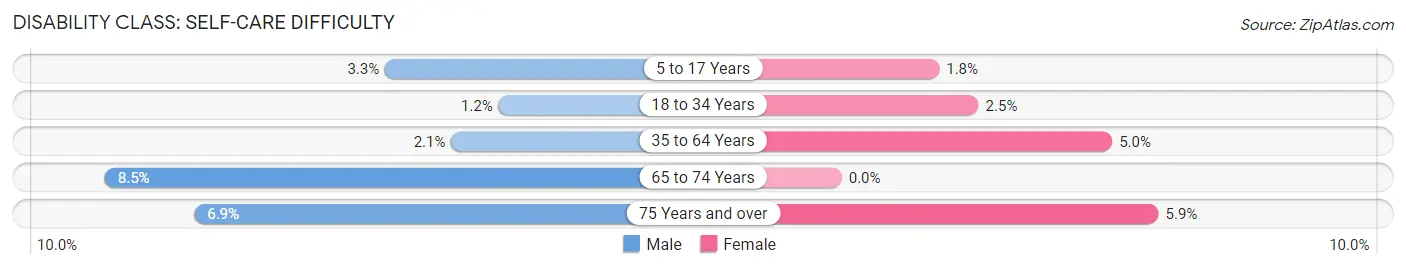
| Age Bracket | Male | Female |
| 5 to 17 Years | 70 (3.3%) | 38 (1.8%) |
| 18 to 34 Years | 36 (1.2%) | 86 (2.5%) |
| 35 to 64 Years | 74 (2.1%) | 201 (5.0%) |
| 65 to 74 Years | 84 (8.5%) | 0 (0.0%) |
| 75 Years and over | 25 (6.9%) | 38 (5.9%) |
Technology Access in Marshall
Computing Device Access in Marshall
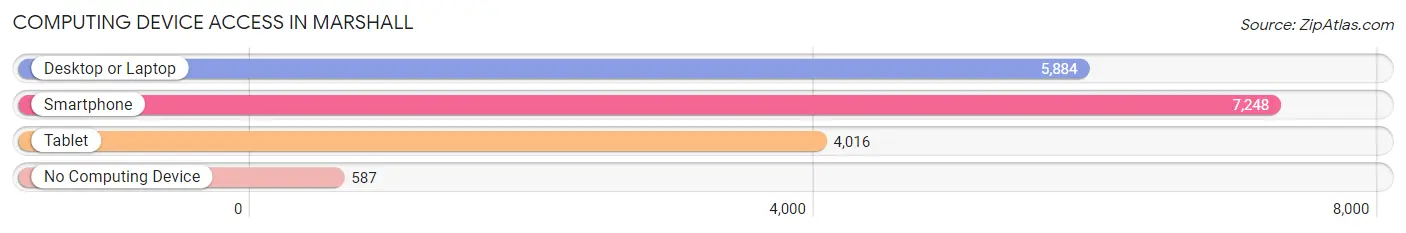
| Device Type | # Households | % Households |
| Desktop or Laptop | 5,884 | 71.2% |
| Smartphone | 7,248 | 87.6% |
| Tablet | 4,016 | 48.6% |
| No Computing Device | 587 | 7.1% |
| Total | 8,270 | 100.0% |
Internet Access in Marshall
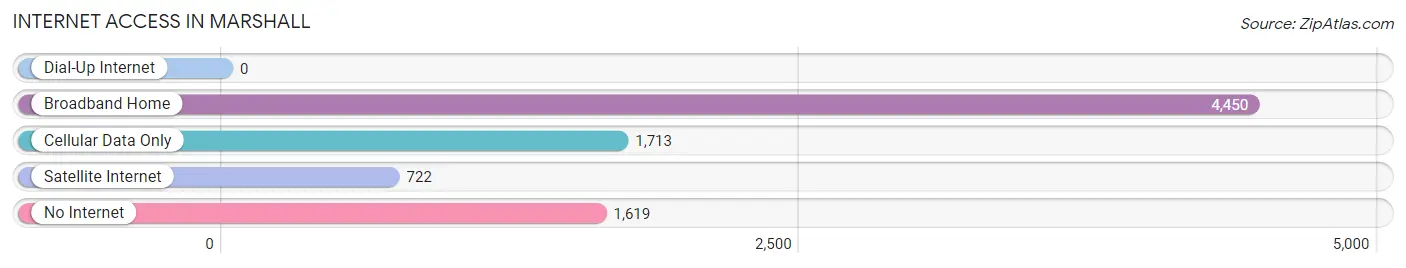
| Internet Type | # Households | % Households |
| Dial-Up Internet | 0 | 0.0% |
| Broadband Home | 4,450 | 53.8% |
| Cellular Data Only | 1,713 | 20.7% |
| Satellite Internet | 722 | 8.7% |
| No Internet | 1,619 | 19.6% |
| Total | 8,270 | 100.0% |
Marshall Summary
Marshall, Texas is a city located in Harrison County in the northeastern part of the state. It is the county seat and the largest city in the county. The city is situated along the Big Cypress Bayou and the Sulphur River, and is located about 30 miles east of the Texas-Louisiana border. As of the 2010 census, the population of Marshall was 23,523.
History
Marshall was founded in 1841 by settlers from the Peters Colony. The city was named after Chief Justice of the Supreme Court, John Marshall. The city was incorporated in 1843 and quickly became an important center for trade and commerce in the region. The city was a major stop on the Texas and Pacific Railway, which was completed in 1873. This allowed Marshall to become a major hub for the cotton industry, and the city quickly grew in size and population.
In the late 19th century, Marshall was a major center for the African-American community in Texas. The city was home to several prominent African-American churches, businesses, and organizations. In 1871, the city was the site of the first African-American college in Texas, Bishop College.
In the early 20th century, Marshall was a major center for the oil industry. The city was the site of the first major oil discovery in Texas in 1930. This discovery led to a major oil boom in the region, and Marshall quickly became a major center for the oil industry.
Geography
Marshall is located in the northeastern part of Texas, in Harrison County. The city is situated along the Big Cypress Bayou and the Sulphur River. The city is located about 30 miles east of the Texas-Louisiana border. The city has a total area of 16.2 square miles, of which 16.1 square miles is land and 0.1 square miles is water.
Economy
Marshall’s economy is largely based on the oil and gas industry. The city is home to several major oil and gas companies, including ExxonMobil, Chevron, and ConocoPhillips. The city is also home to several manufacturing companies, including a large Tyson Foods plant.
The city is also home to several educational institutions, including East Texas Baptist University, Wiley College, and Marshall High School. The city is also home to several hospitals, including Good Shepherd Medical Center and Marshall Medical Center.
Demographics
As of the 2010 census, the population of Marshall was 23,523. The racial makeup of the city was 57.2% White, 37.2% African American, 0.7% Native American, 0.7% Asian, 0.1% Pacific Islander, 2.2% from other races, and 2.0% from two or more races. Hispanic or Latino of any race were 5.3% of the population.
The median income for a household in the city was $31,945, and the median income for a family was $41,945. The per capita income for the city was $17,945. About 19.2% of the population was below the poverty line.
Common Questions
What is Per Capita Income in Marshall?
Per Capita income in Marshall is $26,916.
What is the Median Family Income in Marshall?
Median Family Income in Marshall is $62,614.
What is the Median Household income in Marshall?
Median Household Income in Marshall is $49,162.
What is Income or Wage Gap in Marshall?
Income or Wage Gap in Marshall is 28.8%.
Women in Marshall earn 71.2 cents for every dollar earned by a man.
What is Inequality or Gini Index in Marshall?
Inequality or Gini Index in Marshall is 0.53.
What is the Total Population of Marshall?
Total Population of Marshall is 23,509.
What is the Total Male Population of Marshall?
Total Male Population of Marshall is 10,899.
What is the Total Female Population of Marshall?
Total Female Population of Marshall is 12,610.
What is the Ratio of Males per 100 Females in Marshall?
There are 86.43 Males per 100 Females in Marshall.
What is the Ratio of Females per 100 Males in Marshall?
There are 115.70 Females per 100 Males in Marshall.
What is the Median Population Age in Marshall?
Median Population Age in Marshall is 34.1 Years.
What is the Average Family Size in Marshall
Average Family Size in Marshall is 3.3 People.
What is the Average Household Size in Marshall
Average Household Size in Marshall is 2.6 People.
How Large is the Labor Force in Marshall?
There are 10,928 People in the Labor Forcein in Marshall.
What is the Percentage of People in the Labor Force in Marshall?
59.1% of People are in the Labor Force in Marshall.
What is the Unemployment Rate in Marshall?
Unemployment Rate in Marshall is 8.9%.