Gun Barrel City, TX Map & Demographics
Gun Barrel City Map
Gun Barrel City Overview
$37,976
PER CAPITA INCOME
$74,203
AVG FAMILY INCOME
$63,938
AVG HOUSEHOLD INCOME
37.8%
WAGE / INCOME GAP [ % ]
62.2¢/ $1
WAGE / INCOME GAP [ $ ]
0.47
INEQUALITY / GINI INDEX
6,247
TOTAL POPULATION
3,172
MALE POPULATION
3,075
FEMALE POPULATION
103.15
MALES / 100 FEMALES
96.94
FEMALES / 100 MALES
49.1
MEDIAN AGE
3.0
AVG FAMILY SIZE
2.3
AVG HOUSEHOLD SIZE
2,629
LABOR FORCE [ PEOPLE ]
50.2%
PERCENT IN LABOR FORCE
8.9%
UNEMPLOYMENT RATE
Income in Gun Barrel City
Income Overview in Gun Barrel City
Per Capita Income in Gun Barrel City is $37,976, while median incomes of families and households are $74,203 and $63,938 respectively.
| Characteristic | Number | Measure |
| Per Capita Income | 6,247 | $37,976 |
| Median Family Income | 1,547 | $74,203 |
| Mean Family Income | 1,547 | $105,490 |
| Median Household Income | 2,666 | $63,938 |
| Mean Household Income | 2,666 | $88,646 |
| Income Deficit | 1,547 | $0 |
| Wage / Income Gap (%) | 6,247 | 37.79% |
| Wage / Income Gap ($) | 6,247 | 62.21¢ per $1 |
| Gini / Inequality Index | 6,247 | 0.47 |
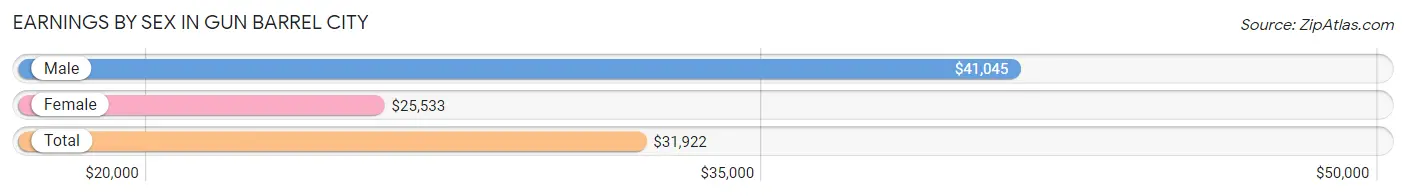
Earnings by Sex in Gun Barrel City
Average Earnings in Gun Barrel City are $31,922, $41,045 for men and $25,533 for women, a difference of 37.8%.
| Sex | Number | Average Earnings |
| Male | 1,408 (51.1%) | $41,045 |
| Female | 1,347 (48.9%) | $25,533 |
| Total | 2,755 (100.0%) | $31,922 |
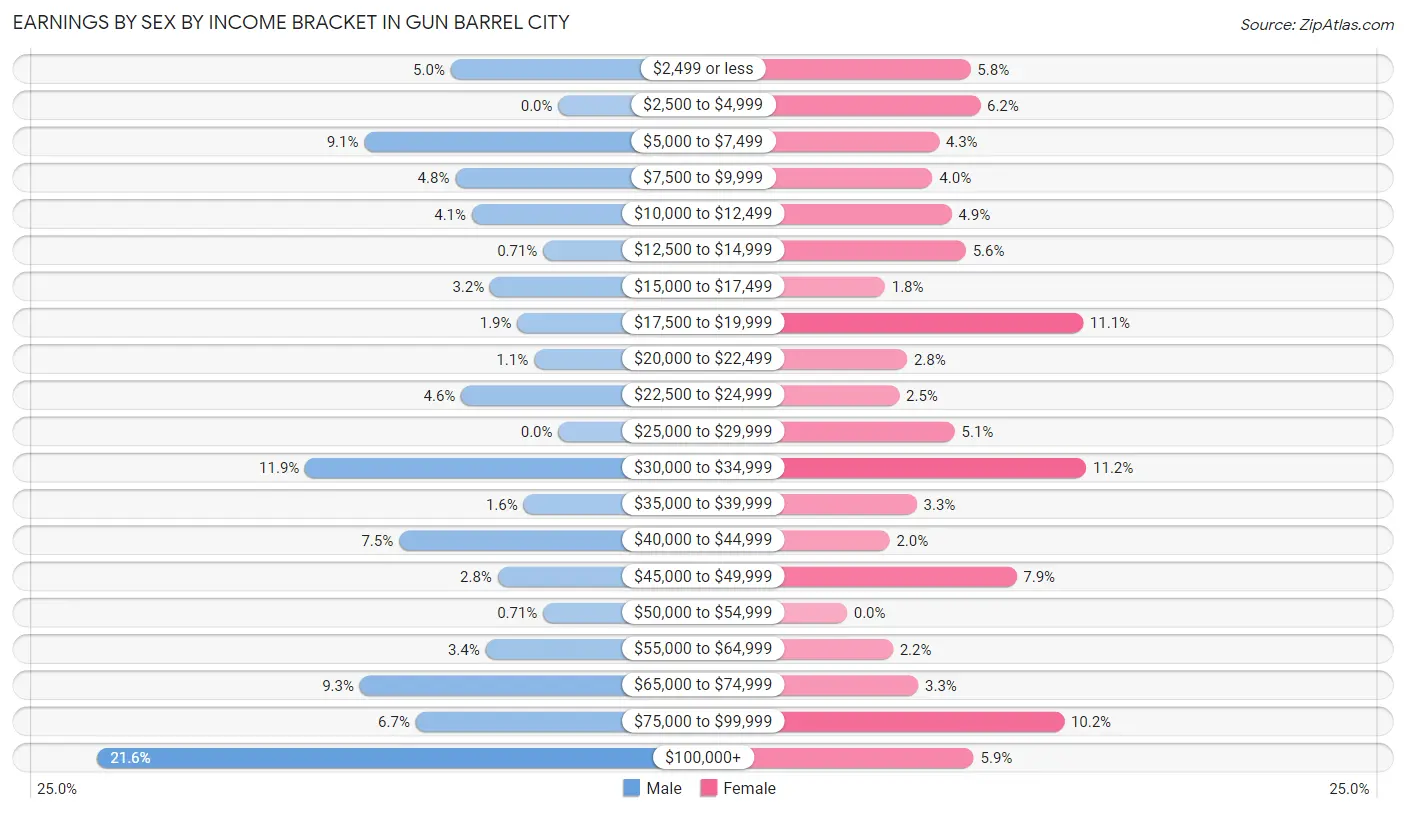
Earnings by Sex by Income Bracket in Gun Barrel City
The most common earnings brackets in Gun Barrel City are $100,000+ for men (304 | 21.6%) and $30,000 to $34,999 for women (151 | 11.2%).
| Income | Male | Female |
| $2,499 or less | 71 (5.0%) | 78 (5.8%) |
| $2,500 to $4,999 | 0 (0.0%) | 84 (6.2%) |
| $5,000 to $7,499 | 128 (9.1%) | 58 (4.3%) |
| $7,500 to $9,999 | 68 (4.8%) | 54 (4.0%) |
| $10,000 to $12,499 | 57 (4.1%) | 66 (4.9%) |
| $12,500 to $14,999 | 10 (0.7%) | 75 (5.6%) |
| $15,000 to $17,499 | 45 (3.2%) | 24 (1.8%) |
| $17,500 to $19,999 | 27 (1.9%) | 149 (11.1%) |
| $20,000 to $22,499 | 16 (1.1%) | 38 (2.8%) |
| $22,500 to $24,999 | 64 (4.5%) | 33 (2.5%) |
| $25,000 to $29,999 | 0 (0.0%) | 68 (5.1%) |
| $30,000 to $34,999 | 167 (11.9%) | 151 (11.2%) |
| $35,000 to $39,999 | 23 (1.6%) | 44 (3.3%) |
| $40,000 to $44,999 | 105 (7.5%) | 27 (2.0%) |
| $45,000 to $49,999 | 40 (2.8%) | 107 (7.9%) |
| $50,000 to $54,999 | 10 (0.7%) | 0 (0.0%) |
| $55,000 to $64,999 | 48 (3.4%) | 29 (2.1%) |
| $65,000 to $74,999 | 131 (9.3%) | 45 (3.3%) |
| $75,000 to $99,999 | 94 (6.7%) | 137 (10.2%) |
| $100,000+ | 304 (21.6%) | 80 (5.9%) |
| Total | 1,408 (100.0%) | 1,347 (100.0%) |
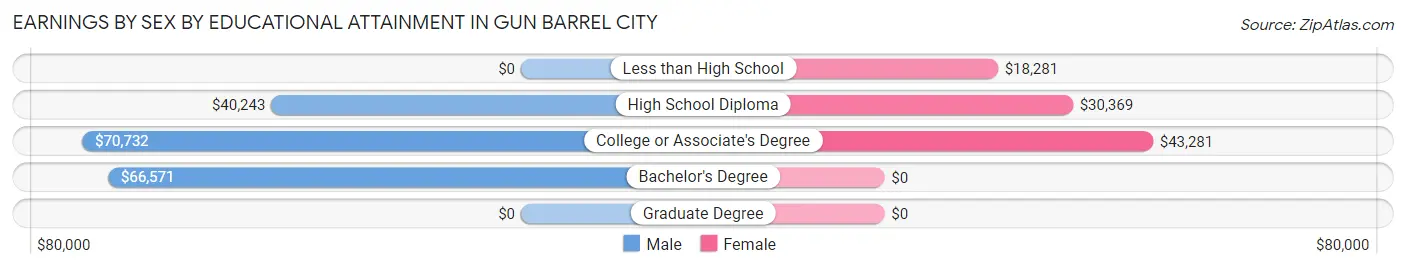
Earnings by Sex by Educational Attainment in Gun Barrel City
Average earnings in Gun Barrel City are $46,438 for men and $30,417 for women, a difference of 34.5%. Men with an educational attainment of college or associate's degree enjoy the highest average annual earnings of $70,732, while those with high school diploma education earn the least with $40,243. Women with an educational attainment of college or associate's degree earn the most with the average annual earnings of $43,281, while those with less than high school education have the smallest earnings of $18,281.
| Educational Attainment | Male Income | Female Income |
| Less than High School | - | - |
| High School Diploma | $40,243 | $30,369 |
| College or Associate's Degree | $70,732 | $43,281 |
| Bachelor's Degree | $66,571 | $0 |
| Graduate Degree | - | - |
| Total | $46,438 | $30,417 |
Family Income in Gun Barrel City
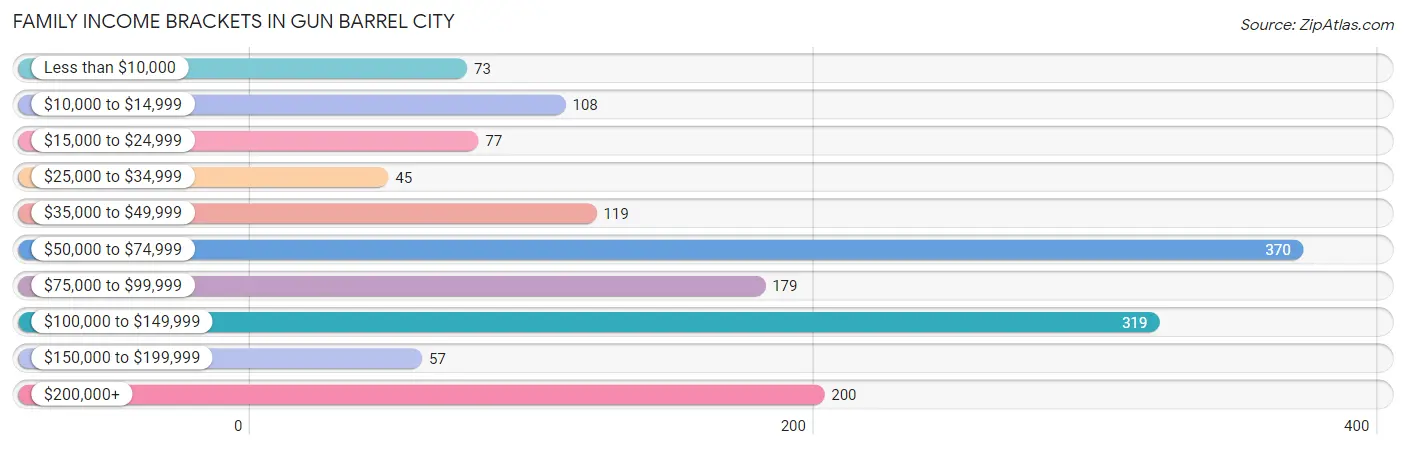
Family Income Brackets in Gun Barrel City
According to the Gun Barrel City family income data, there are 370 families falling into the $50,000 to $74,999 income range, which is the most common income bracket and makes up 23.9% of all families. Conversely, the $25,000 to $34,999 income bracket is the least frequent group with only 45 families (2.9%) belonging to this category.
| Income Bracket | # Families | % Families |
| Less than $10,000 | 73 | 4.7% |
| $10,000 to $14,999 | 108 | 7.0% |
| $15,000 to $24,999 | 77 | 5.0% |
| $25,000 to $34,999 | 45 | 2.9% |
| $35,000 to $49,999 | 119 | 7.7% |
| $50,000 to $74,999 | 370 | 23.9% |
| $75,000 to $99,999 | 179 | 11.6% |
| $100,000 to $149,999 | 319 | 20.6% |
| $150,000 to $199,999 | 57 | 3.7% |
| $200,000+ | 200 | 12.9% |
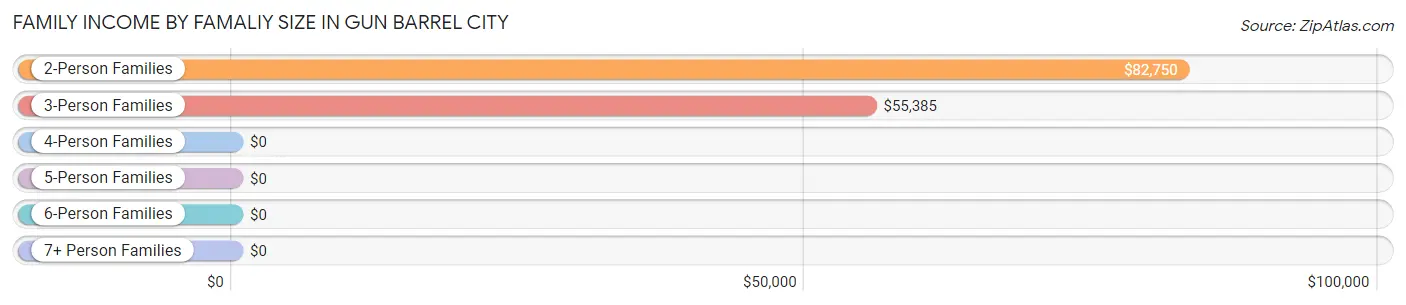
Family Income by Famaliy Size in Gun Barrel City
2-person families (900 | 58.2%) account for the highest median family income in Gun Barrel City with $82,750 per family, while 2-person families (900 | 58.2%) have the highest median income of $41,375 per family member.
| Income Bracket | # Families | Median Income |
| 2-Person Families | 900 (58.2%) | $82,750 |
| 3-Person Families | 190 (12.3%) | $55,385 |
| 4-Person Families | 207 (13.4%) | $0 |
| 5-Person Families | 218 (14.1%) | $0 |
| 6-Person Families | 0 (0.0%) | $0 |
| 7+ Person Families | 32 (2.1%) | $0 |
| Total | 1,547 (100.0%) | $74,203 |
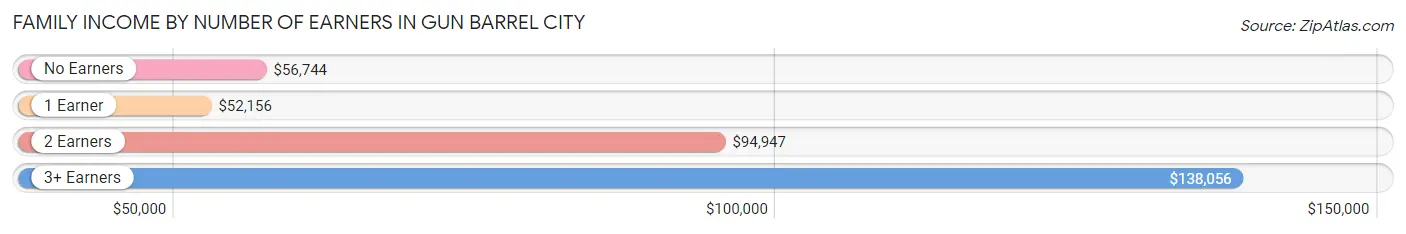
Family Income by Number of Earners in Gun Barrel City
The median family income in Gun Barrel City is $74,203, with families comprising 3+ earners (104) having the highest median family income of $138,056, while families with 1 earner (447) have the lowest median family income of $52,156, accounting for 6.7% and 28.9% of families, respectively.
| Number of Earners | # Families | Median Income |
| No Earners | 410 (26.5%) | $56,744 |
| 1 Earner | 447 (28.9%) | $52,156 |
| 2 Earners | 586 (37.9%) | $94,947 |
| 3+ Earners | 104 (6.7%) | $138,056 |
| Total | 1,547 (100.0%) | $74,203 |
Household Income in Gun Barrel City
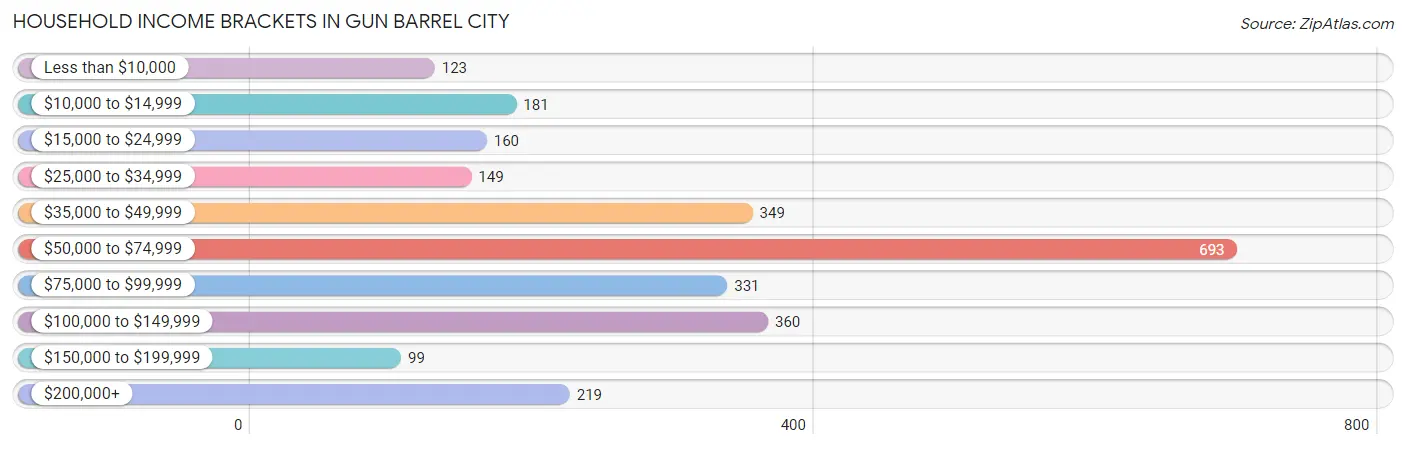
Household Income Brackets in Gun Barrel City
With 693 households falling in the category, the $50,000 to $74,999 income range is the most frequent in Gun Barrel City, accounting for 26.0% of all households. In contrast, only 99 households (3.7%) fall into the $150,000 to $199,999 income bracket, making it the least populous group.
| Income Bracket | # Households | % Households |
| Less than $10,000 | 123 | 4.6% |
| $10,000 to $14,999 | 181 | 6.8% |
| $15,000 to $24,999 | 160 | 6.0% |
| $25,000 to $34,999 | 149 | 5.6% |
| $35,000 to $49,999 | 349 | 13.1% |
| $50,000 to $74,999 | 693 | 26.0% |
| $75,000 to $99,999 | 331 | 12.4% |
| $100,000 to $149,999 | 360 | 13.5% |
| $150,000 to $199,999 | 99 | 3.7% |
| $200,000+ | 219 | 8.2% |
Household Income by Householder Age in Gun Barrel City
The median household income in Gun Barrel City is $63,938, with the highest median household income of $78,606 found in the 45 to 64 years age bracket for the primary householder. A total of 928 households (34.8%) fall into this category. Meanwhile, the 15 to 24 years age bracket for the primary householder has the lowest median household income of $0, with 64 households (2.4%) in this group.
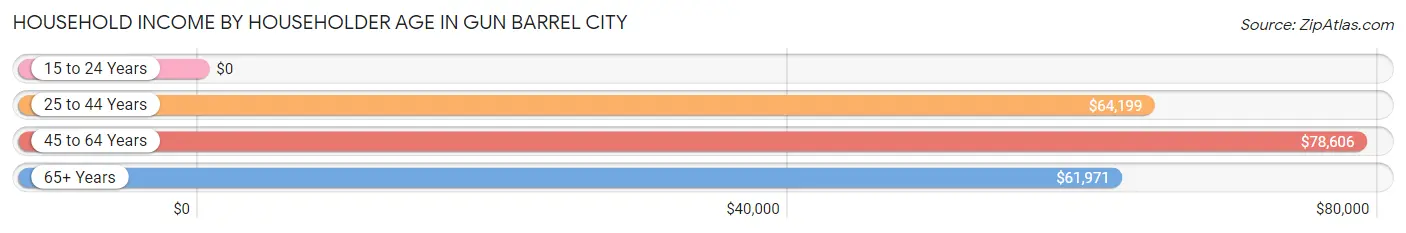
| Income Bracket | # Households | Median Income |
| 15 to 24 Years | 64 (2.4%) | $0 |
| 25 to 44 Years | 597 (22.4%) | $64,199 |
| 45 to 64 Years | 928 (34.8%) | $78,606 |
| 65+ Years | 1,077 (40.4%) | $61,971 |
| Total | 2,666 (100.0%) | $63,938 |
Poverty in Gun Barrel City
Income Below Poverty by Sex and Age in Gun Barrel City
With 14.3% poverty level for males and 19.7% for females among the residents of Gun Barrel City, 5 year old males and under 5 year old females are the most vulnerable to poverty, with 37 males (100.0%) and 83 females (65.9%) in their respective age groups living below the poverty level.
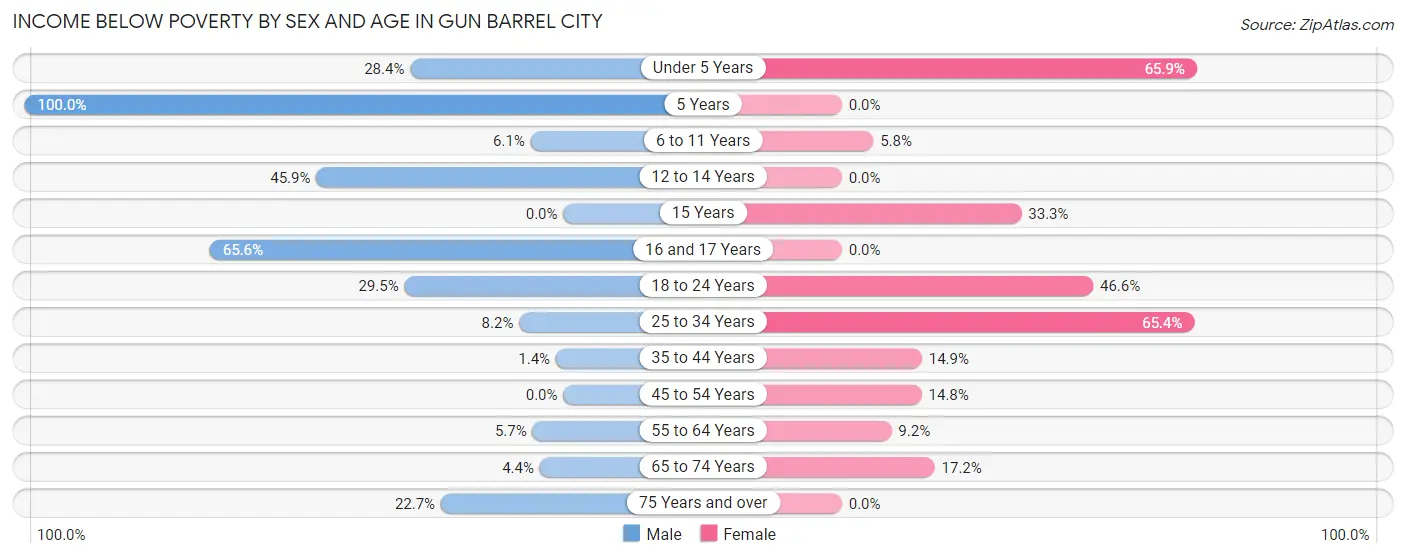
| Age Bracket | Male | Female |
| Under 5 Years | 52 (28.4%) | 83 (65.9%) |
| 5 Years | 37 (100.0%) | 0 (0.0%) |
| 6 to 11 Years | 8 (6.1%) | 8 (5.8%) |
| 12 to 14 Years | 61 (45.9%) | 0 (0.0%) |
| 15 Years | 0 (0.0%) | 7 (33.3%) |
| 16 and 17 Years | 42 (65.6%) | 0 (0.0%) |
| 18 to 24 Years | 69 (29.5%) | 111 (46.6%) |
| 25 to 34 Years | 34 (8.2%) | 140 (65.4%) |
| 35 to 44 Years | 5 (1.4%) | 56 (14.8%) |
| 45 to 54 Years | 0 (0.0%) | 57 (14.8%) |
| 55 to 64 Years | 29 (5.7%) | 57 (9.2%) |
| 65 to 74 Years | 16 (4.4%) | 87 (17.2%) |
| 75 Years and over | 102 (22.7%) | 0 (0.0%) |
| Total | 455 (14.3%) | 606 (19.7%) |
Income Above Poverty by Sex and Age in Gun Barrel City
According to the poverty statistics in Gun Barrel City, males aged 15 years and females aged 5 years are the age groups that are most secure financially, with 100.0% of males and 100.0% of females in these age groups living above the poverty line.
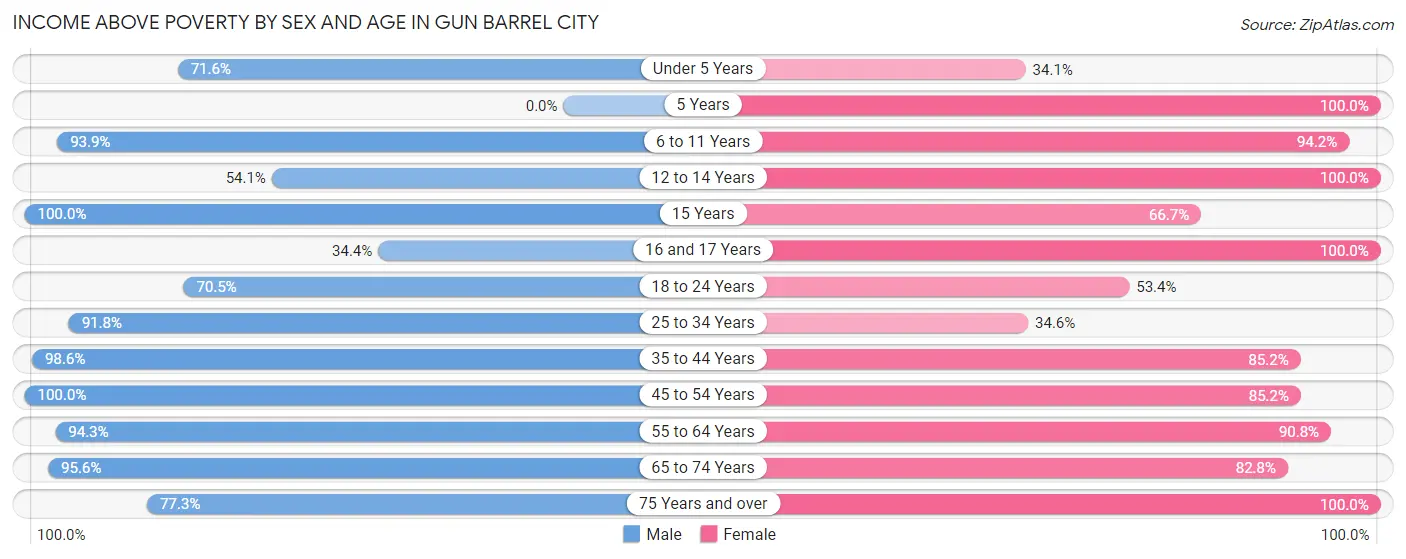
| Age Bracket | Male | Female |
| Under 5 Years | 131 (71.6%) | 43 (34.1%) |
| 5 Years | 0 (0.0%) | 17 (100.0%) |
| 6 to 11 Years | 124 (93.9%) | 129 (94.2%) |
| 12 to 14 Years | 72 (54.1%) | 166 (100.0%) |
| 15 Years | 58 (100.0%) | 14 (66.7%) |
| 16 and 17 Years | 22 (34.4%) | 51 (100.0%) |
| 18 to 24 Years | 165 (70.5%) | 127 (53.4%) |
| 25 to 34 Years | 381 (91.8%) | 74 (34.6%) |
| 35 to 44 Years | 357 (98.6%) | 321 (85.2%) |
| 45 to 54 Years | 231 (100.0%) | 328 (85.2%) |
| 55 to 64 Years | 479 (94.3%) | 562 (90.8%) |
| 65 to 74 Years | 350 (95.6%) | 418 (82.8%) |
| 75 Years and over | 347 (77.3%) | 219 (100.0%) |
| Total | 2,717 (85.7%) | 2,469 (80.3%) |
Income Below Poverty Among Married-Couple Families in Gun Barrel City
The poverty statistics for married-couple families in Gun Barrel City show that 5.8% or 76 of the total 1,307 families live below the poverty line. Families with 1 or 2 children have the highest poverty rate of 15.3%, comprising of 34 families. On the other hand, families with 3 or 4 children have the lowest poverty rate of 0.0%, which includes 0 families.
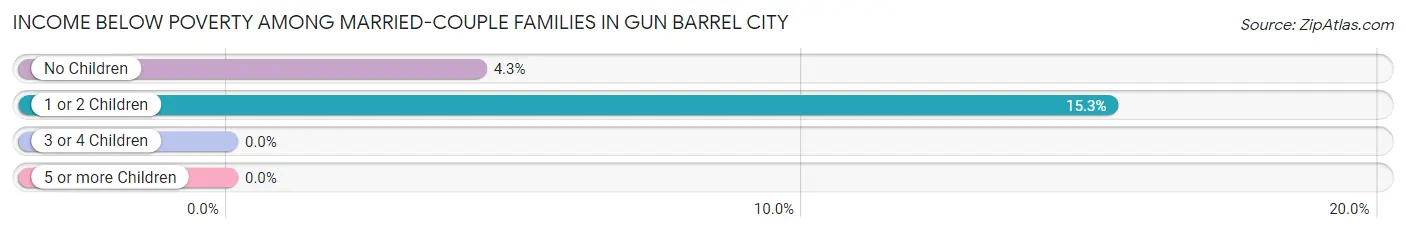
| Children | Above Poverty | Below Poverty |
| No Children | 927 (95.7%) | 42 (4.3%) |
| 1 or 2 Children | 188 (84.7%) | 34 (15.3%) |
| 3 or 4 Children | 116 (100.0%) | 0 (0.0%) |
| 5 or more Children | 0 (0.0%) | 0 (0.0%) |
| Total | 1,231 (94.2%) | 76 (5.8%) |
Income Below Poverty Among Single-Parent Households in Gun Barrel City
According to the poverty data in Gun Barrel City, 50.0% or 25 single-father households and 57.4% or 109 single-mother households are living below the poverty line. Among single-father households, those with 1 or 2 children have the highest poverty rate, with 25 households (50.0%) experiencing poverty. Likewise, among single-mother households, those with 3 or 4 children have the highest poverty rate, with 33 households (100.0%) falling below the poverty line.
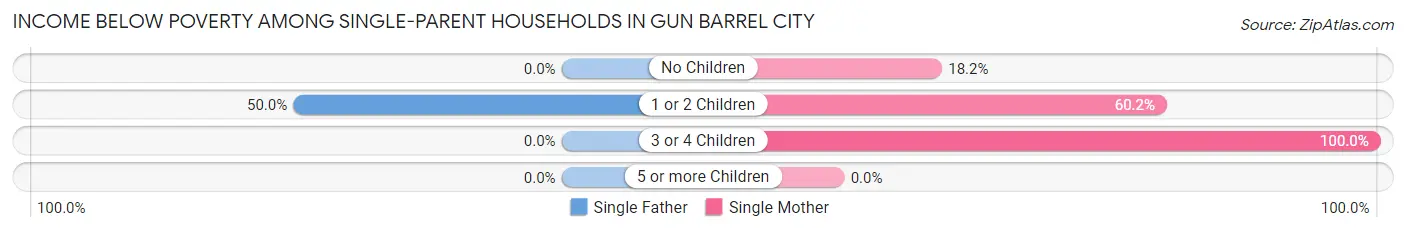
| Children | Single Father | Single Mother |
| No Children | 0 (0.0%) | 8 (18.2%) |
| 1 or 2 Children | 25 (50.0%) | 68 (60.2%) |
| 3 or 4 Children | 0 (0.0%) | 33 (100.0%) |
| 5 or more Children | 0 (0.0%) | 0 (0.0%) |
| Total | 25 (50.0%) | 109 (57.4%) |
Income Below Poverty Among Married-Couple vs Single-Parent Households in Gun Barrel City
The poverty data for Gun Barrel City shows that 76 of the married-couple family households (5.8%) and 134 of the single-parent households (55.8%) are living below the poverty level. Within the married-couple family households, those with 1 or 2 children have the highest poverty rate, with 34 households (15.3%) falling below the poverty line. Among the single-parent households, those with 3 or 4 children have the highest poverty rate, with 33 household (100.0%) living below poverty.
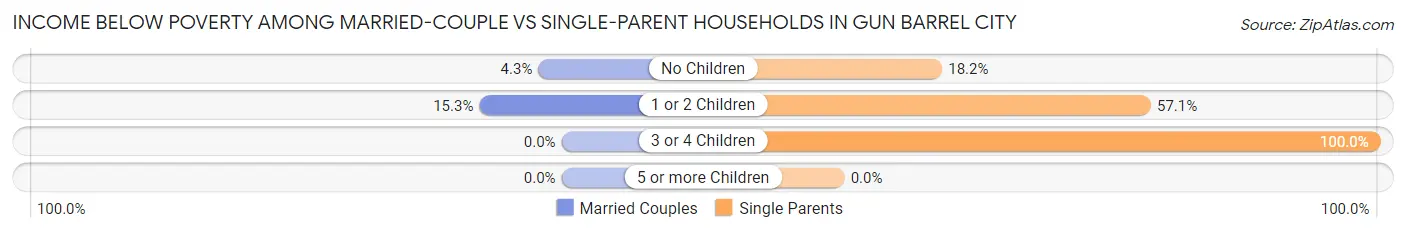
| Children | Married-Couple Families | Single-Parent Households |
| No Children | 42 (4.3%) | 8 (18.2%) |
| 1 or 2 Children | 34 (15.3%) | 93 (57.1%) |
| 3 or 4 Children | 0 (0.0%) | 33 (100.0%) |
| 5 or more Children | 0 (0.0%) | 0 (0.0%) |
| Total | 76 (5.8%) | 134 (55.8%) |
Race in Gun Barrel City
The most populous races in Gun Barrel City are White / Caucasian (6,079 | 97.3%), Hispanic or Latino (295 | 4.7%), and Two or more Races (88 | 1.4%).
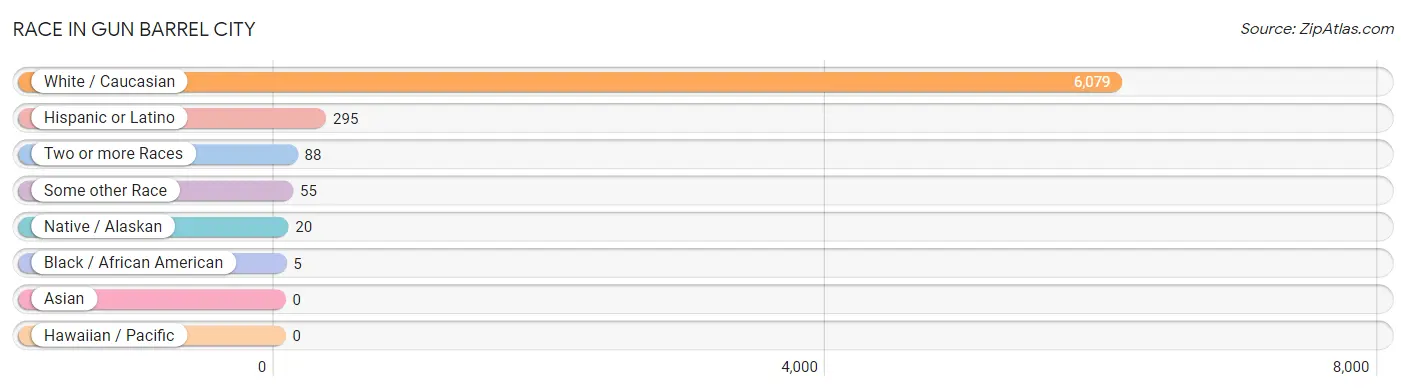
| Race | # Population | % Population |
| Asian | 0 | 0.0% |
| Black / African American | 5 | 0.1% |
| Hawaiian / Pacific | 0 | 0.0% |
| Hispanic or Latino | 295 | 4.7% |
| Native / Alaskan | 20 | 0.3% |
| White / Caucasian | 6,079 | 97.3% |
| Two or more Races | 88 | 1.4% |
| Some other Race | 55 | 0.9% |
| Total | 6,247 | 100.0% |
Ancestry in Gun Barrel City
The most populous ancestries reported in Gun Barrel City are Irish (894 | 14.3%), German (872 | 14.0%), American (822 | 13.2%), English (819 | 13.1%), and Scotch-Irish (320 | 5.1%), together accounting for 59.7% of all Gun Barrel City residents.
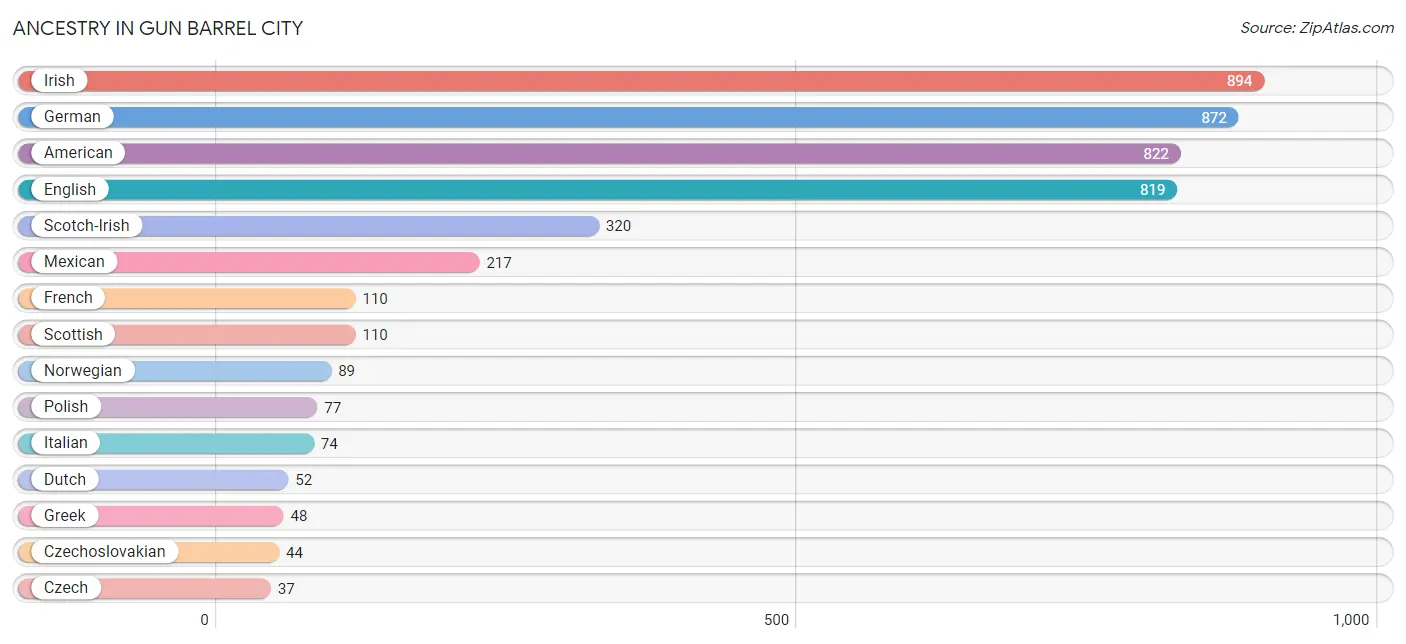
| Ancestry | # Population | % Population |
| American | 822 | 13.2% |
| Austrian | 10 | 0.2% |
| Canadian | 19 | 0.3% |
| Cherokee | 29 | 0.5% |
| Creek | 4 | 0.1% |
| Czech | 37 | 0.6% |
| Czechoslovakian | 44 | 0.7% |
| Dutch | 52 | 0.8% |
| Dutch West Indian | 17 | 0.3% |
| Eastern European | 14 | 0.2% |
| English | 819 | 13.1% |
| French | 110 | 1.8% |
| German | 872 | 14.0% |
| Greek | 48 | 0.8% |
| Irish | 894 | 14.3% |
| Italian | 74 | 1.2% |
| Korean | 1 | 0.0% |
| Mexican | 217 | 3.5% |
| Norwegian | 89 | 1.4% |
| Polish | 77 | 1.2% |
| Puerto Rican | 16 | 0.3% |
| Romanian | 30 | 0.5% |
| Scandinavian | 28 | 0.4% |
| Scotch-Irish | 320 | 5.1% |
| Scottish | 110 | 1.8% |
| Swedish | 34 | 0.5% |
| Swiss | 17 | 0.3% |
| Welsh | 17 | 0.3% | View All 28 Rows |
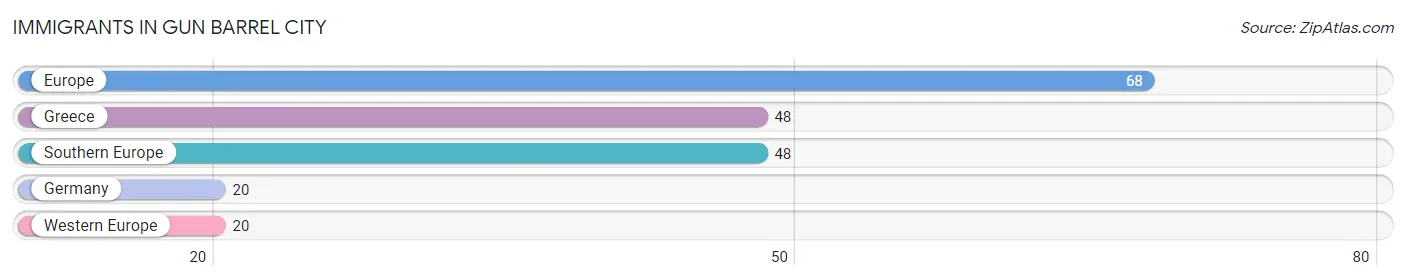
Immigrants in Gun Barrel City
The most numerous immigrant groups reported in Gun Barrel City came from Europe (68 | 1.1%), Greece (48 | 0.8%), Southern Europe (48 | 0.8%), Germany (20 | 0.3%), and Western Europe (20 | 0.3%), together accounting for 3.3% of all Gun Barrel City residents.
| Immigration Origin | # Population | % Population |
| Europe | 68 | 1.1% |
| Germany | 20 | 0.3% |
| Greece | 48 | 0.8% |
| Southern Europe | 48 | 0.8% |
| Western Europe | 20 | 0.3% | View All 5 Rows |
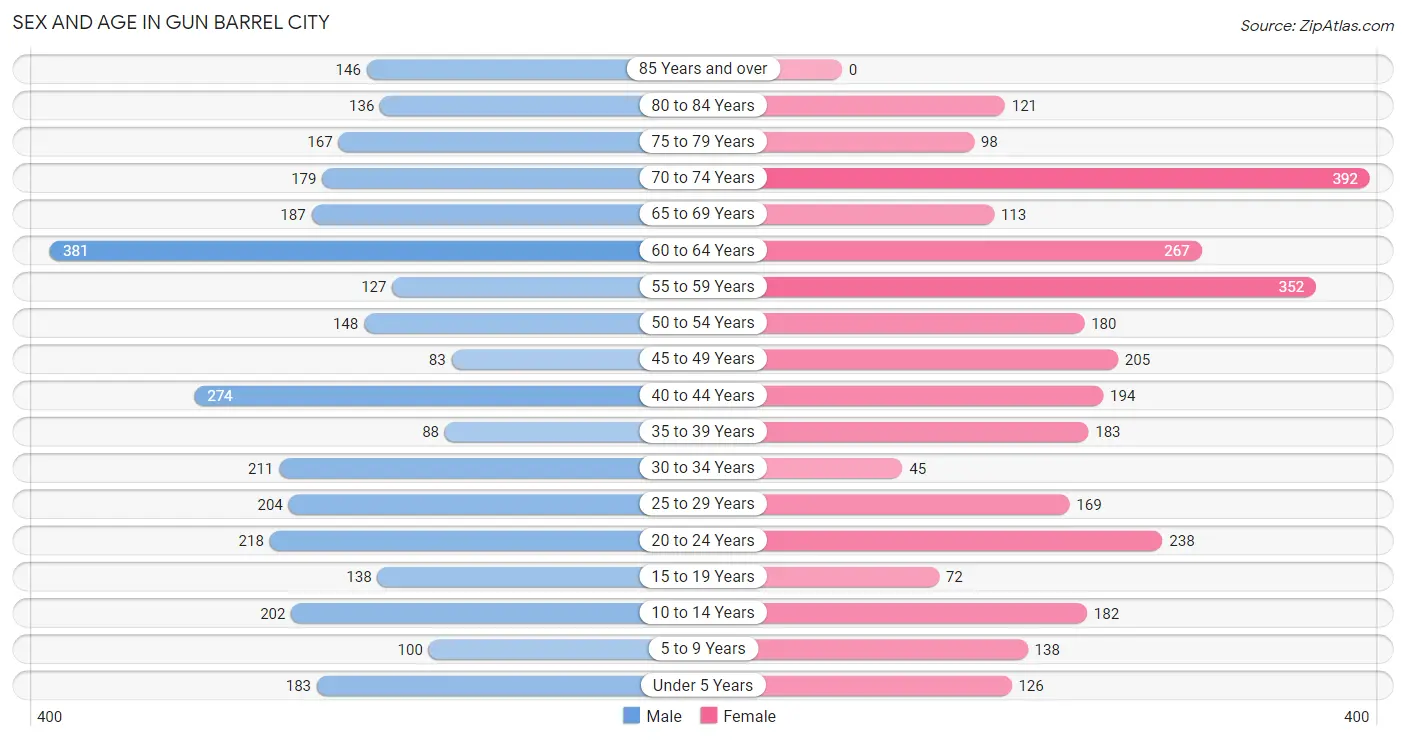
Sex and Age in Gun Barrel City
Sex and Age in Gun Barrel City
The most populous age groups in Gun Barrel City are 60 to 64 Years (381 | 12.0%) for men and 70 to 74 Years (392 | 12.8%) for women.
| Age Bracket | Male | Female |
| Under 5 Years | 183 (5.8%) | 126 (4.1%) |
| 5 to 9 Years | 100 (3.2%) | 138 (4.5%) |
| 10 to 14 Years | 202 (6.4%) | 182 (5.9%) |
| 15 to 19 Years | 138 (4.3%) | 72 (2.3%) |
| 20 to 24 Years | 218 (6.9%) | 238 (7.7%) |
| 25 to 29 Years | 204 (6.4%) | 169 (5.5%) |
| 30 to 34 Years | 211 (6.7%) | 45 (1.5%) |
| 35 to 39 Years | 88 (2.8%) | 183 (5.9%) |
| 40 to 44 Years | 274 (8.6%) | 194 (6.3%) |
| 45 to 49 Years | 83 (2.6%) | 205 (6.7%) |
| 50 to 54 Years | 148 (4.7%) | 180 (5.9%) |
| 55 to 59 Years | 127 (4.0%) | 352 (11.5%) |
| 60 to 64 Years | 381 (12.0%) | 267 (8.7%) |
| 65 to 69 Years | 187 (5.9%) | 113 (3.7%) |
| 70 to 74 Years | 179 (5.6%) | 392 (12.8%) |
| 75 to 79 Years | 167 (5.3%) | 98 (3.2%) |
| 80 to 84 Years | 136 (4.3%) | 121 (3.9%) |
| 85 Years and over | 146 (4.6%) | 0 (0.0%) |
| Total | 3,172 (100.0%) | 3,075 (100.0%) |
Families and Households in Gun Barrel City
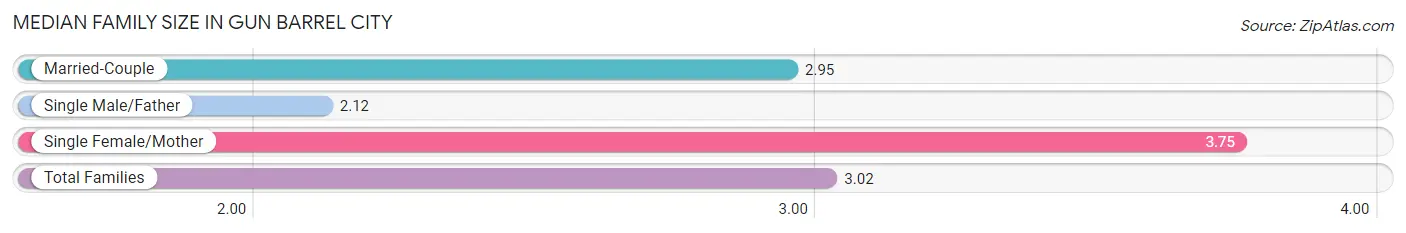
Median Family Size in Gun Barrel City
The median family size in Gun Barrel City is 3.02 persons per family, with single female/mother families (190 | 12.3%) accounting for the largest median family size of 3.75 persons per family. On the other hand, single male/father families (50 | 3.2%) represent the smallest median family size with 2.12 persons per family.
| Family Type | # Families | Family Size |
| Married-Couple | 1,307 (84.5%) | 2.95 |
| Single Male/Father | 50 (3.2%) | 2.12 |
| Single Female/Mother | 190 (12.3%) | 3.75 |
| Total Families | 1,547 (100.0%) | 3.02 |
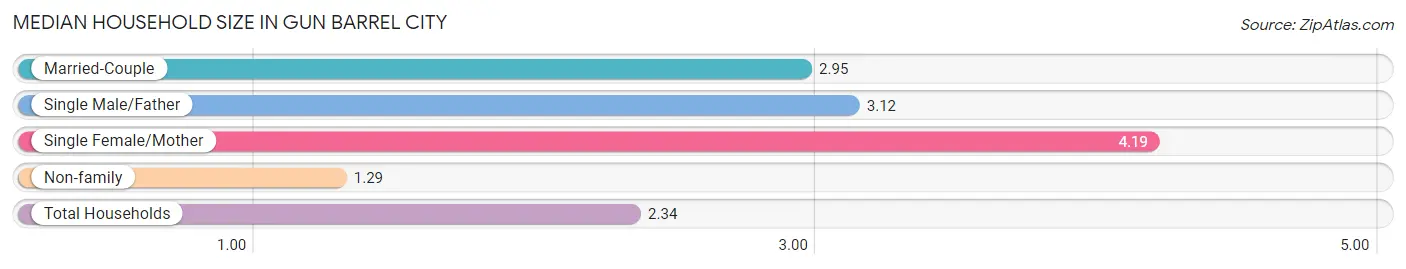
Median Household Size in Gun Barrel City
The median household size in Gun Barrel City is 2.34 persons per household, with single female/mother households (190 | 7.1%) accounting for the largest median household size of 4.19 persons per household. non-family households (1,119 | 42.0%) represent the smallest median household size with 1.29 persons per household.
| Household Type | # Households | Household Size |
| Married-Couple | 1,307 (49.0%) | 2.95 |
| Single Male/Father | 50 (1.9%) | 3.12 |
| Single Female/Mother | 190 (7.1%) | 4.19 |
| Non-family | 1,119 (42.0%) | 1.29 |
| Total Households | 2,666 (100.0%) | 2.34 |
Household Size by Marriage Status in Gun Barrel City
Out of a total of 2,666 households in Gun Barrel City, 1,547 (58.0%) are family households, while 1,119 (42.0%) are nonfamily households. The most numerous type of family households are 2-person households, comprising 798, and the most common type of nonfamily households are 1-person households, comprising 782.
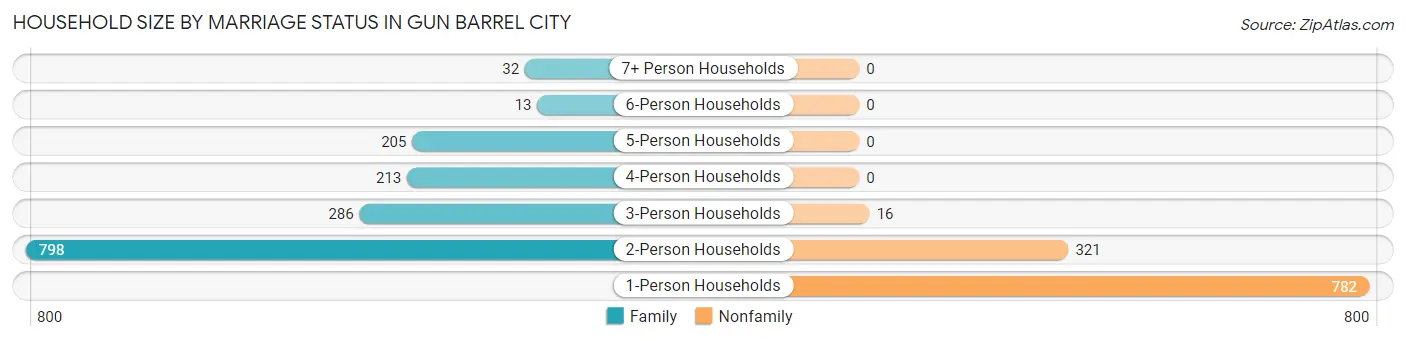
| Household Size | Family Households | Nonfamily Households |
| 1-Person Households | - | 782 (29.3%) |
| 2-Person Households | 798 (29.9%) | 321 (12.0%) |
| 3-Person Households | 286 (10.7%) | 16 (0.6%) |
| 4-Person Households | 213 (8.0%) | 0 (0.0%) |
| 5-Person Households | 205 (7.7%) | 0 (0.0%) |
| 6-Person Households | 13 (0.5%) | 0 (0.0%) |
| 7+ Person Households | 32 (1.2%) | 0 (0.0%) |
| Total | 1,547 (58.0%) | 1,119 (42.0%) |
Female Fertility in Gun Barrel City
Fertility by Age in Gun Barrel City
Average fertility rate in Gun Barrel City is 30.0 births per 1,000 women. Women in the age bracket of 20 to 34 years have the highest fertility rate with 33.0 births per 1,000 women. Women in the age bracket of 35 to 50 years acount for 55.9% of all women with births.
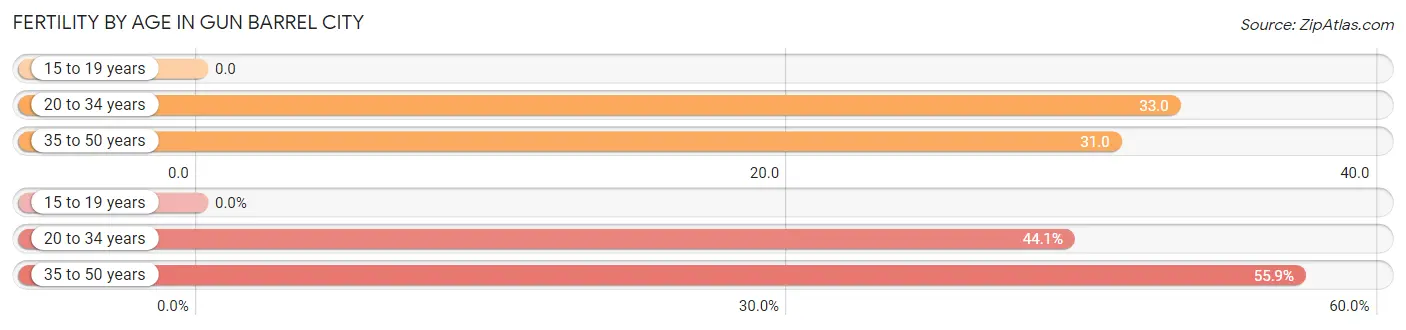
| Age Bracket | Women with Births | Births / 1,000 Women |
| 15 to 19 years | 0 (0.0%) | 0.0 |
| 20 to 34 years | 15 (44.1%) | 33.0 |
| 35 to 50 years | 19 (55.9%) | 31.0 |
| Total | 34 (100.0%) | 30.0 |
Fertility by Age by Marriage Status in Gun Barrel City
44.1% of women with births (34) in Gun Barrel City are married. The highest percentage of unmarried women with births falls into 35 to 50 years age bracket with 100.0% of them unmarried at the time of birth, while the lowest percentage of unmarried women with births belong to 20 to 34 years age bracket with 0.0% of them unmarried.
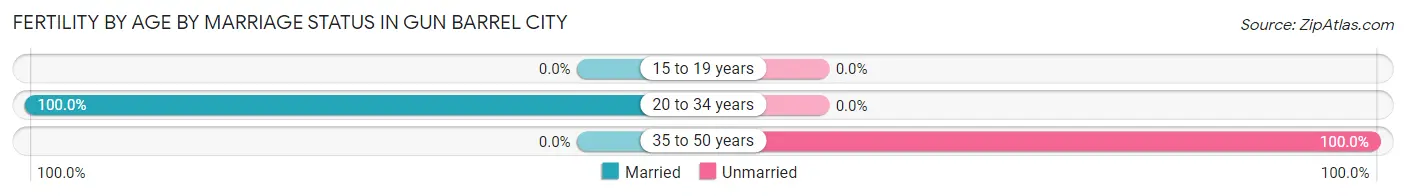
| Age Bracket | Married | Unmarried |
| 15 to 19 years | 0 (0.0%) | 0 (0.0%) |
| 20 to 34 years | 15 (100.0%) | 0 (0.0%) |
| 35 to 50 years | 0 (0.0%) | 19 (100.0%) |
| Total | 15 (44.1%) | 19 (55.9%) |
Fertility by Education in Gun Barrel City
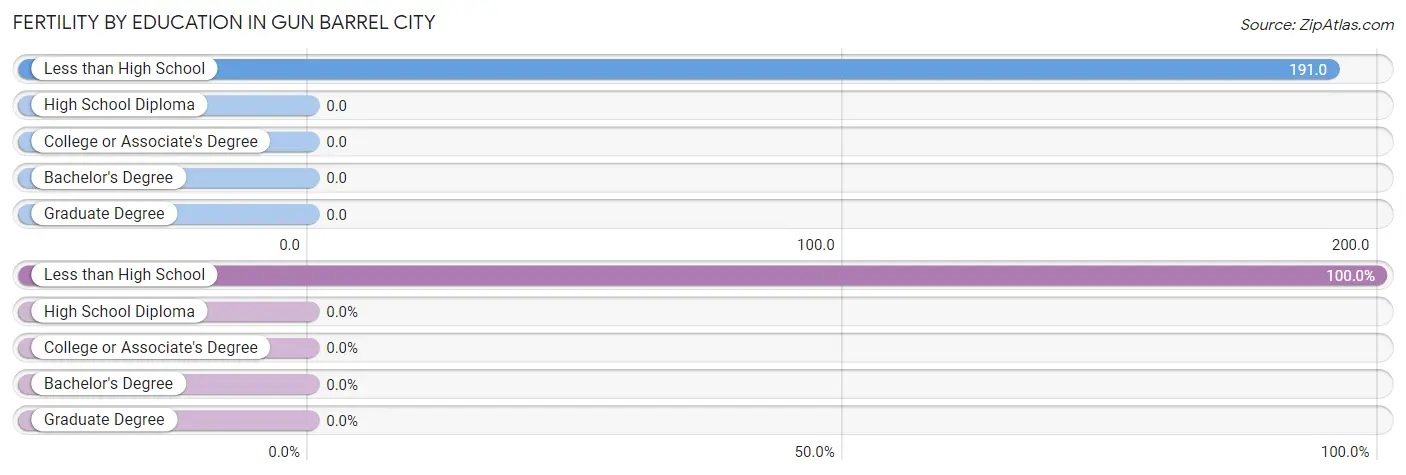
| Educational Attainment | Women with Births | Births / 1,000 Women |
| Less than High School | 34 (100.0%) | 191.0 |
| High School Diploma | 0 (0.0%) | 0.0 |
| College or Associate's Degree | 0 (0.0%) | 0.0 |
| Bachelor's Degree | 0 (0.0%) | 0.0 |
| Graduate Degree | 0 (0.0%) | 0.0 |
| Total | 34 (100.0%) | 30.0 |
Fertility by Education by Marriage Status in Gun Barrel City
55.9% of women with births in Gun Barrel City are unmarried. Women with the educational attainment of less than high school are most likely to be married with 44.1% of them married at childbirth, while women with the educational attainment of less than high school are least likely to be married with 55.9% of them unmarried at childbirth.
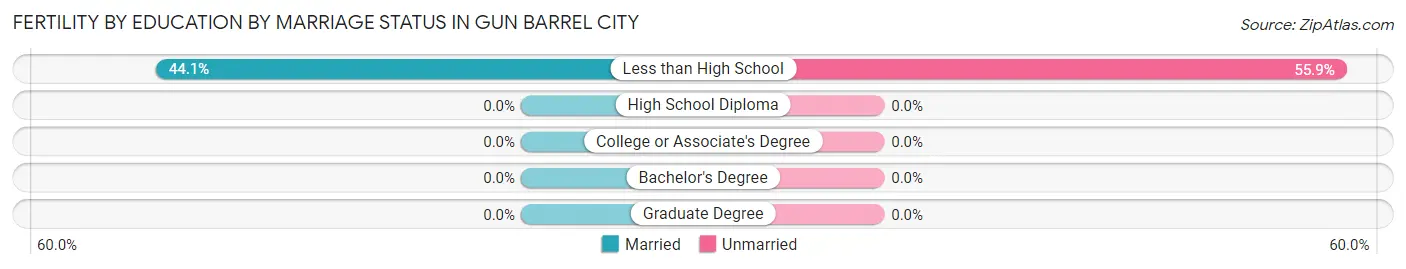
| Educational Attainment | Married | Unmarried |
| Less than High School | 15 (44.1%) | 19 (55.9%) |
| High School Diploma | 0 (0.0%) | 0 (0.0%) |
| College or Associate's Degree | 0 (0.0%) | 0 (0.0%) |
| Bachelor's Degree | 0 (0.0%) | 0 (0.0%) |
| Graduate Degree | 0 (0.0%) | 0 (0.0%) |
| Total | 15 (44.1%) | 19 (55.9%) |
Employment Characteristics in Gun Barrel City
Employment by Class of Employer in Gun Barrel City
Among the 2,369 employed individuals in Gun Barrel City, private company employees (1,624 | 68.5%), local government employees (264 | 11.1%), and not-for-profit organizations (218 | 9.2%) make up the most common classes of employment.
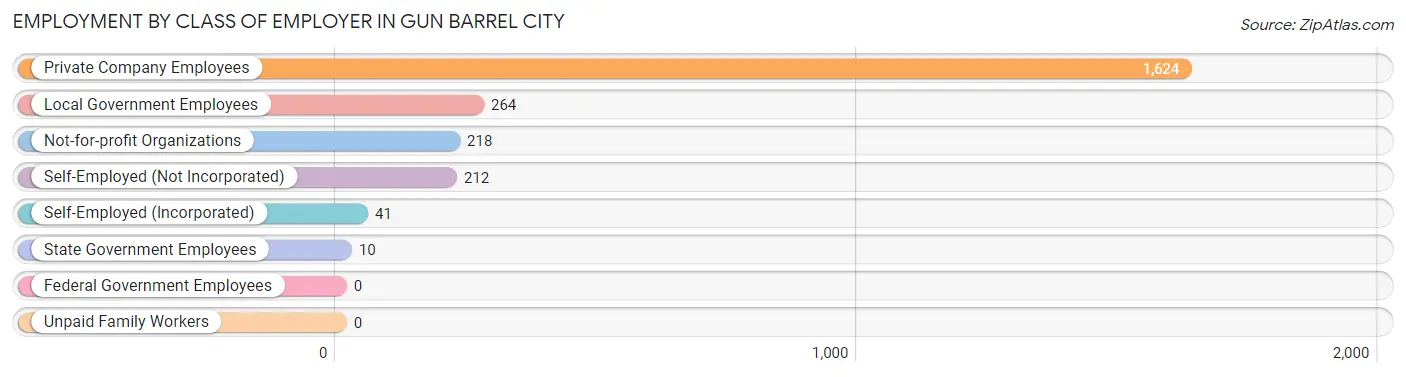
| Employer Class | # Employees | % Employees |
| Private Company Employees | 1,624 | 68.5% |
| Self-Employed (Incorporated) | 41 | 1.7% |
| Self-Employed (Not Incorporated) | 212 | 8.9% |
| Not-for-profit Organizations | 218 | 9.2% |
| Local Government Employees | 264 | 11.1% |
| State Government Employees | 10 | 0.4% |
| Federal Government Employees | 0 | 0.0% |
| Unpaid Family Workers | 0 | 0.0% |
| Total | 2,369 | 100.0% |
Employment Status by Age in Gun Barrel City
According to the labor force statistics for Gun Barrel City, out of the total population over 16 years of age (5,237), 50.2% or 2,629 individuals are in the labor force, with 8.9% or 234 of them unemployed. The age group with the highest labor force participation rate is 25 to 29 years, with 92.8% or 346 individuals in the labor force. Within the labor force, the 25 to 29 years age range has the highest percentage of unemployed individuals, with 35.0% or 121 of them being unemployed.
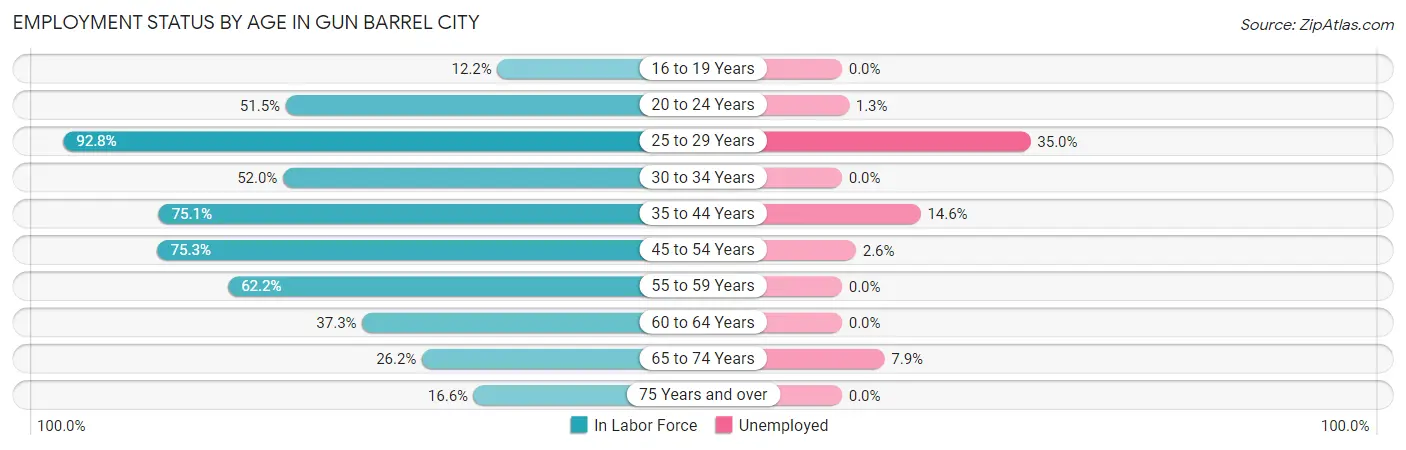
| Age Bracket | In Labor Force | Unemployed |
| 16 to 19 Years | 16 (12.2%) | 0 (0.0%) |
| 20 to 24 Years | 235 (51.5%) | 3 (1.3%) |
| 25 to 29 Years | 346 (92.8%) | 121 (35.0%) |
| 30 to 34 Years | 133 (52.0%) | 0 (0.0%) |
| 35 to 44 Years | 555 (75.1%) | 81 (14.6%) |
| 45 to 54 Years | 464 (75.3%) | 12 (2.6%) |
| 55 to 59 Years | 298 (62.2%) | 0 (0.0%) |
| 60 to 64 Years | 242 (37.3%) | 0 (0.0%) |
| 65 to 74 Years | 228 (26.2%) | 18 (7.9%) |
| 75 Years and over | 111 (16.6%) | 0 (0.0%) |
| Total | 2,629 (50.2%) | 234 (8.9%) |
Employment Status by Educational Attainment in Gun Barrel City
According to labor force statistics for Gun Barrel City, 65.5% of individuals (2,038) out of the total population between 25 and 64 years of age (3,111) are in the labor force, with 10.5% or 214 of them being unemployed. The group with the highest labor force participation rate are those with the educational attainment of bachelor's degree or higher, with 84.2% or 436 individuals in the labor force. Within the labor force, individuals with high school diploma education have the highest percentage of unemployment, with 15.5% or 125 of them being unemployed.
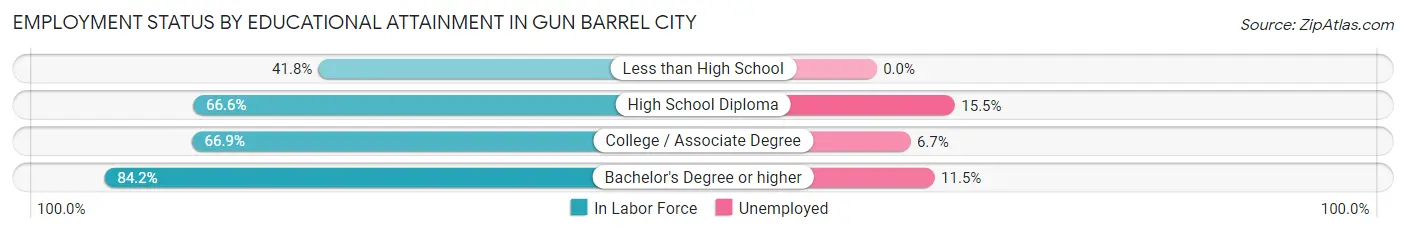
| Educational Attainment | In Labor Force | Unemployed |
| Less than High School | 214 (41.8%) | 0 (0.0%) |
| High School Diploma | 809 (66.6%) | 188 (15.5%) |
| College / Associate Degree | 580 (66.9%) | 58 (6.7%) |
| Bachelor's Degree or higher | 436 (84.2%) | 60 (11.5%) |
| Total | 2,038 (65.5%) | 327 (10.5%) |
Employment Occupations by Sex in Gun Barrel City
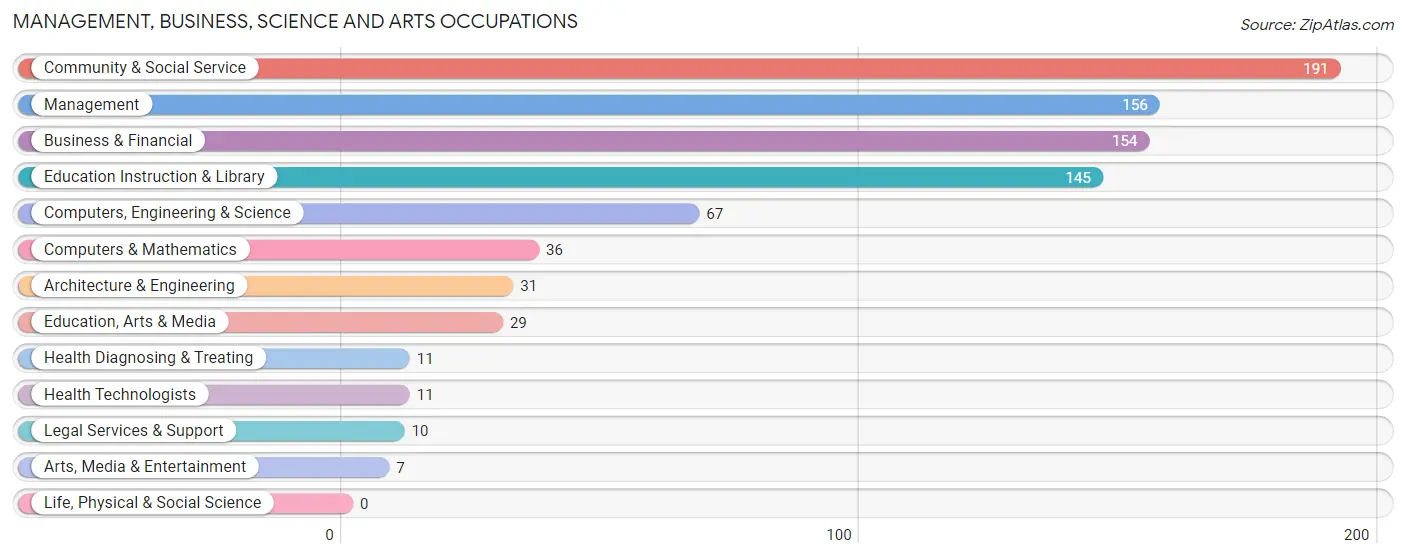
Management, Business, Science and Arts Occupations
The most common Management, Business, Science and Arts occupations in Gun Barrel City are Community & Social Service (191 | 8.0%), Management (156 | 6.5%), Business & Financial (154 | 6.4%), Education Instruction & Library (145 | 6.1%), and Computers, Engineering & Science (67 | 2.8%).
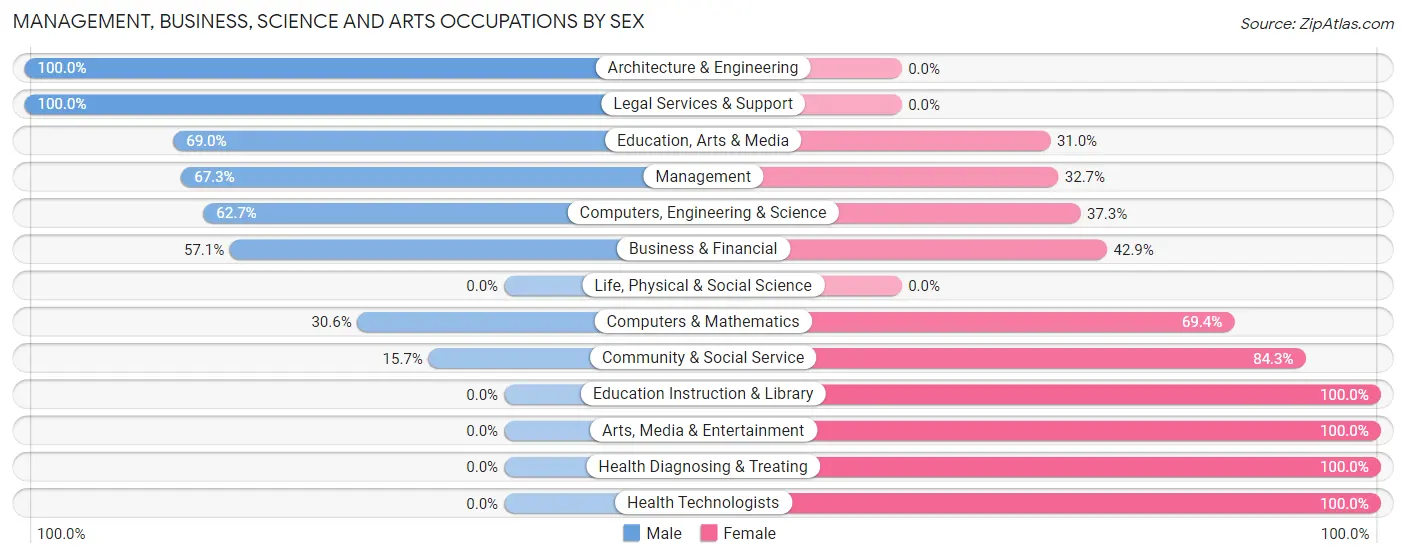
Management, Business, Science and Arts Occupations by Sex
Within the Management, Business, Science and Arts occupations in Gun Barrel City, the most male-oriented occupations are Architecture & Engineering (100.0%), Legal Services & Support (100.0%), and Education, Arts & Media (69.0%), while the most female-oriented occupations are Education Instruction & Library (100.0%), Arts, Media & Entertainment (100.0%), and Health Diagnosing & Treating (100.0%).
| Occupation | Male | Female |
| Management | 105 (67.3%) | 51 (32.7%) |
| Business & Financial | 88 (57.1%) | 66 (42.9%) |
| Computers, Engineering & Science | 42 (62.7%) | 25 (37.3%) |
| Computers & Mathematics | 11 (30.6%) | 25 (69.4%) |
| Architecture & Engineering | 31 (100.0%) | 0 (0.0%) |
| Life, Physical & Social Science | 0 (0.0%) | 0 (0.0%) |
| Community & Social Service | 30 (15.7%) | 161 (84.3%) |
| Education, Arts & Media | 20 (69.0%) | 9 (31.0%) |
| Legal Services & Support | 10 (100.0%) | 0 (0.0%) |
| Education Instruction & Library | 0 (0.0%) | 145 (100.0%) |
| Arts, Media & Entertainment | 0 (0.0%) | 7 (100.0%) |
| Health Diagnosing & Treating | 0 (0.0%) | 11 (100.0%) |
| Health Technologists | 0 (0.0%) | 11 (100.0%) |
| Total (Category) | 265 (45.8%) | 314 (54.2%) |
| Total (Overall) | 1,307 (54.6%) | 1,086 (45.4%) |
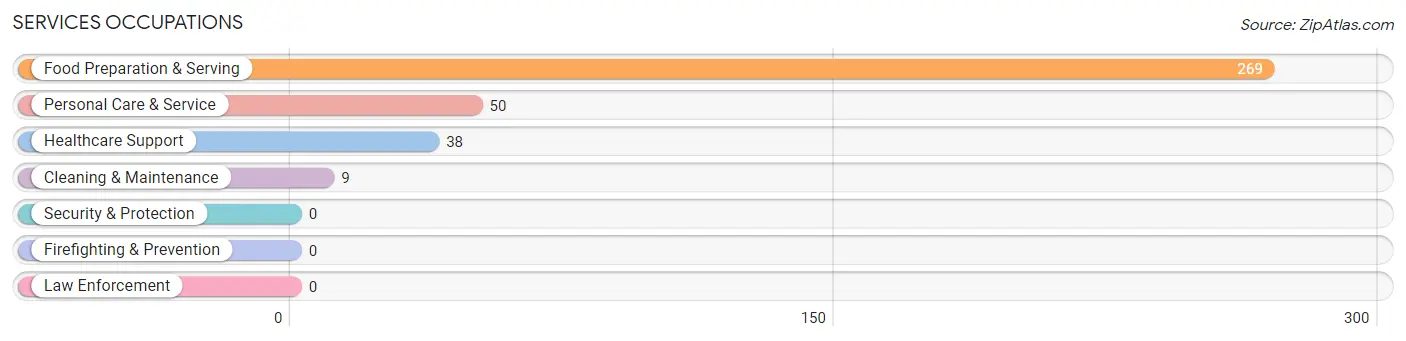
Services Occupations
The most common Services occupations in Gun Barrel City are Food Preparation & Serving (269 | 11.2%), Personal Care & Service (50 | 2.1%), Healthcare Support (38 | 1.6%), and Cleaning & Maintenance (9 | 0.4%).
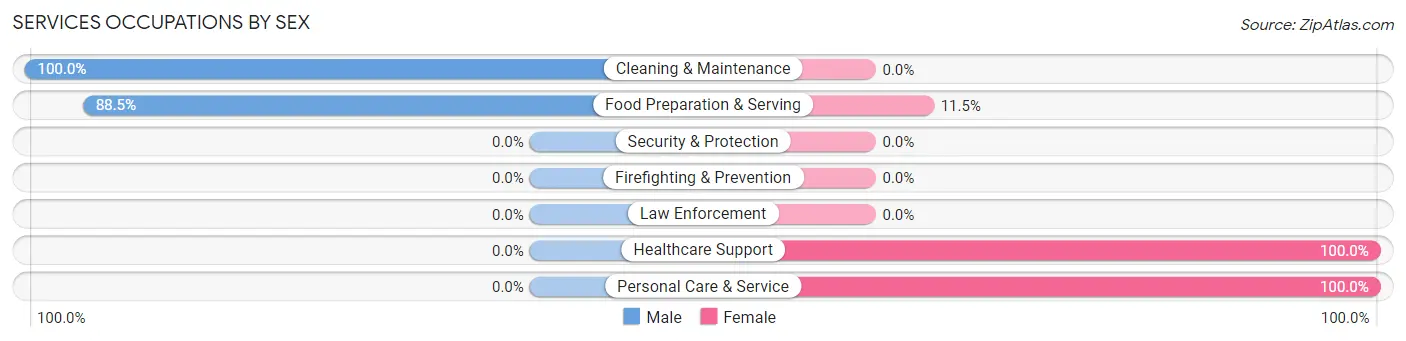
Services Occupations by Sex
Within the Services occupations in Gun Barrel City, the most male-oriented occupations are Cleaning & Maintenance (100.0%), and Food Preparation & Serving (88.5%), while the most female-oriented occupations are Healthcare Support (100.0%), Personal Care & Service (100.0%), and Food Preparation & Serving (11.5%).
| Occupation | Male | Female |
| Healthcare Support | 0 (0.0%) | 38 (100.0%) |
| Security & Protection | 0 (0.0%) | 0 (0.0%) |
| Firefighting & Prevention | 0 (0.0%) | 0 (0.0%) |
| Law Enforcement | 0 (0.0%) | 0 (0.0%) |
| Food Preparation & Serving | 238 (88.5%) | 31 (11.5%) |
| Cleaning & Maintenance | 9 (100.0%) | 0 (0.0%) |
| Personal Care & Service | 0 (0.0%) | 50 (100.0%) |
| Total (Category) | 247 (67.5%) | 119 (32.5%) |
| Total (Overall) | 1,307 (54.6%) | 1,086 (45.4%) |
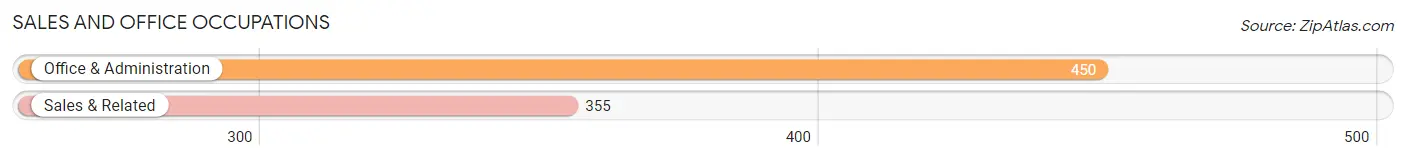
Sales and Office Occupations
The most common Sales and Office occupations in Gun Barrel City are Office & Administration (450 | 18.8%), and Sales & Related (355 | 14.8%).
Sales and Office Occupations by Sex
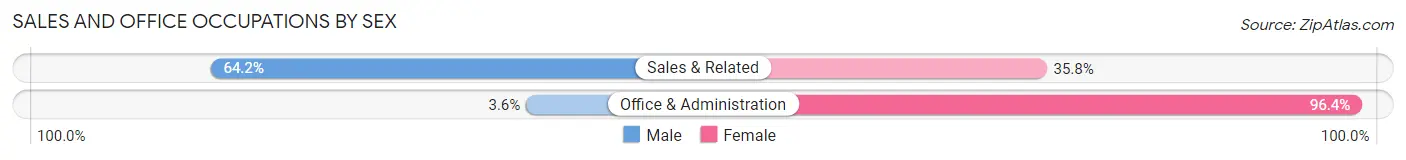
| Occupation | Male | Female |
| Sales & Related | 228 (64.2%) | 127 (35.8%) |
| Office & Administration | 16 (3.6%) | 434 (96.4%) |
| Total (Category) | 244 (30.3%) | 561 (69.7%) |
| Total (Overall) | 1,307 (54.6%) | 1,086 (45.4%) |
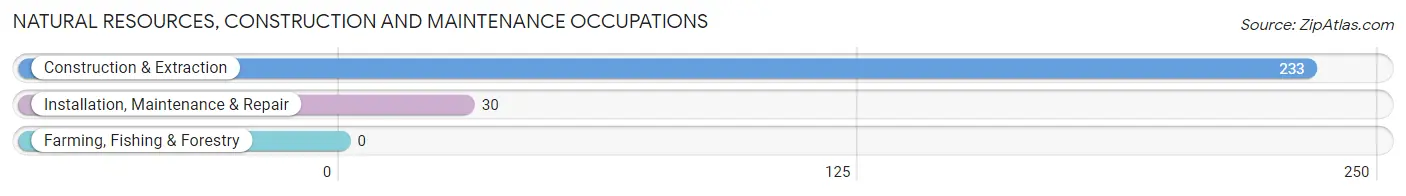
Natural Resources, Construction and Maintenance Occupations
The most common Natural Resources, Construction and Maintenance occupations in Gun Barrel City are Construction & Extraction (233 | 9.7%), and Installation, Maintenance & Repair (30 | 1.3%).
Natural Resources, Construction and Maintenance Occupations by Sex
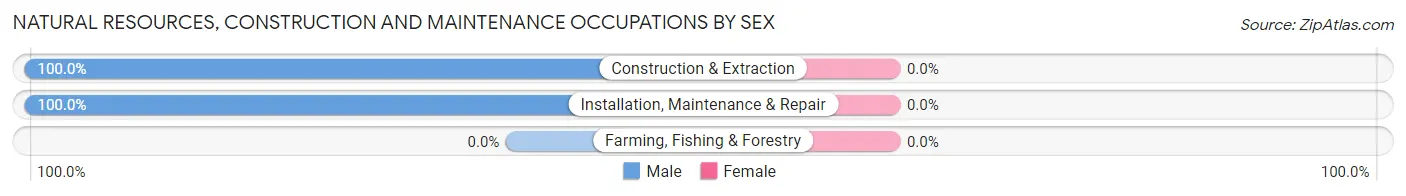
| Occupation | Male | Female |
| Farming, Fishing & Forestry | 0 (0.0%) | 0 (0.0%) |
| Construction & Extraction | 233 (100.0%) | 0 (0.0%) |
| Installation, Maintenance & Repair | 30 (100.0%) | 0 (0.0%) |
| Total (Category) | 263 (100.0%) | 0 (0.0%) |
| Total (Overall) | 1,307 (54.6%) | 1,086 (45.4%) |
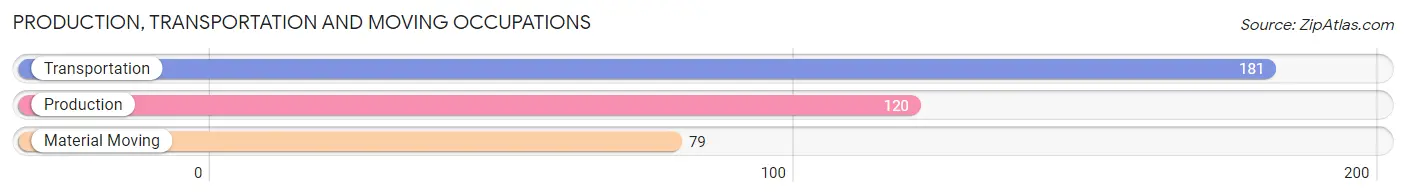
Production, Transportation and Moving Occupations
The most common Production, Transportation and Moving occupations in Gun Barrel City are Transportation (181 | 7.6%), Production (120 | 5.0%), and Material Moving (79 | 3.3%).
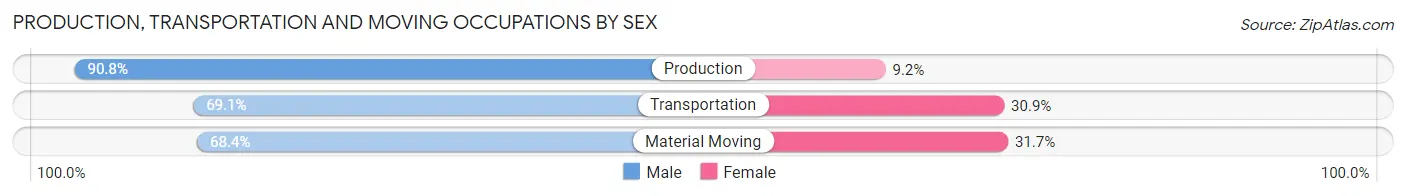
Production, Transportation and Moving Occupations by Sex
| Occupation | Male | Female |
| Production | 109 (90.8%) | 11 (9.2%) |
| Transportation | 125 (69.1%) | 56 (30.9%) |
| Material Moving | 54 (68.3%) | 25 (31.7%) |
| Total (Category) | 288 (75.8%) | 92 (24.2%) |
| Total (Overall) | 1,307 (54.6%) | 1,086 (45.4%) |
Employment Industries by Sex in Gun Barrel City
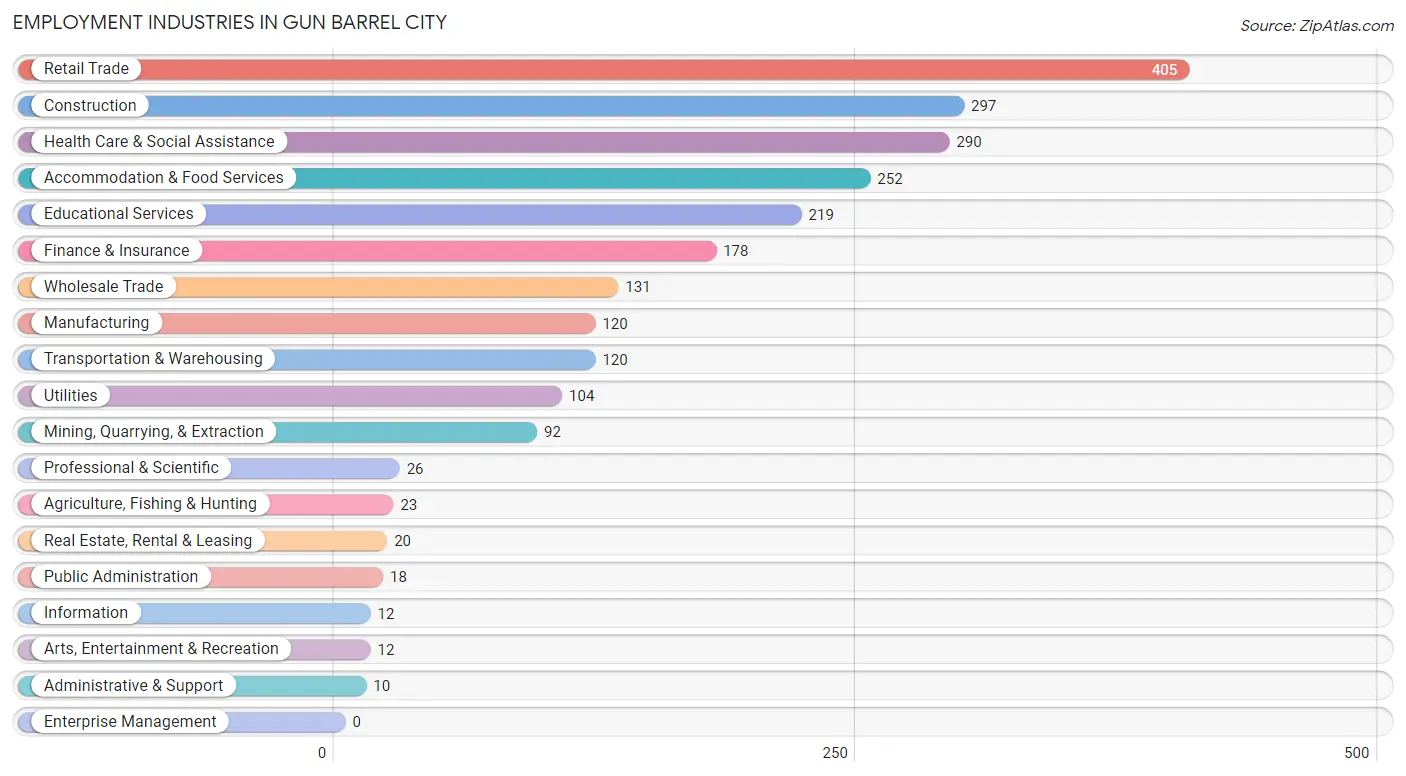
Employment Industries in Gun Barrel City
The major employment industries in Gun Barrel City include Retail Trade (405 | 16.9%), Construction (297 | 12.4%), Health Care & Social Assistance (290 | 12.1%), Accommodation & Food Services (252 | 10.5%), and Educational Services (219 | 9.1%).
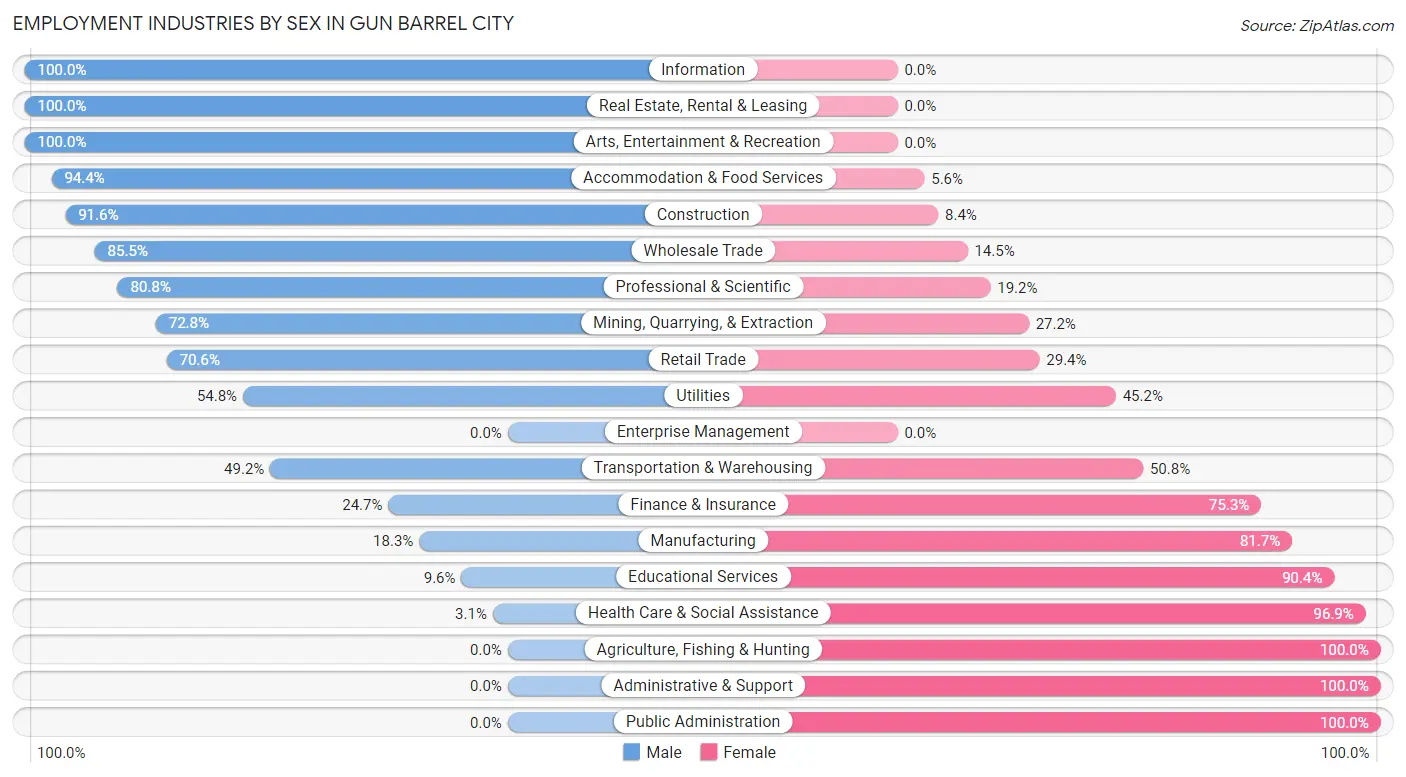
Employment Industries by Sex in Gun Barrel City
The Gun Barrel City industries that see more men than women are Information (100.0%), Real Estate, Rental & Leasing (100.0%), and Arts, Entertainment & Recreation (100.0%), whereas the industries that tend to have a higher number of women are Agriculture, Fishing & Hunting (100.0%), Administrative & Support (100.0%), and Public Administration (100.0%).
| Industry | Male | Female |
| Agriculture, Fishing & Hunting | 0 (0.0%) | 23 (100.0%) |
| Mining, Quarrying, & Extraction | 67 (72.8%) | 25 (27.2%) |
| Construction | 272 (91.6%) | 25 (8.4%) |
| Manufacturing | 22 (18.3%) | 98 (81.7%) |
| Wholesale Trade | 112 (85.5%) | 19 (14.5%) |
| Retail Trade | 286 (70.6%) | 119 (29.4%) |
| Transportation & Warehousing | 59 (49.2%) | 61 (50.8%) |
| Utilities | 57 (54.8%) | 47 (45.2%) |
| Information | 12 (100.0%) | 0 (0.0%) |
| Finance & Insurance | 44 (24.7%) | 134 (75.3%) |
| Real Estate, Rental & Leasing | 20 (100.0%) | 0 (0.0%) |
| Professional & Scientific | 21 (80.8%) | 5 (19.2%) |
| Enterprise Management | 0 (0.0%) | 0 (0.0%) |
| Administrative & Support | 0 (0.0%) | 10 (100.0%) |
| Educational Services | 21 (9.6%) | 198 (90.4%) |
| Health Care & Social Assistance | 9 (3.1%) | 281 (96.9%) |
| Arts, Entertainment & Recreation | 12 (100.0%) | 0 (0.0%) |
| Accommodation & Food Services | 238 (94.4%) | 14 (5.6%) |
| Public Administration | 0 (0.0%) | 18 (100.0%) |
| Total | 1,307 (54.6%) | 1,086 (45.4%) |
Education in Gun Barrel City
School Enrollment in Gun Barrel City
The most common levels of schooling among the 1,179 students in Gun Barrel City are middle school (365 | 31.0%), elementary school (226 | 19.2%), and high school (207 | 17.6%).
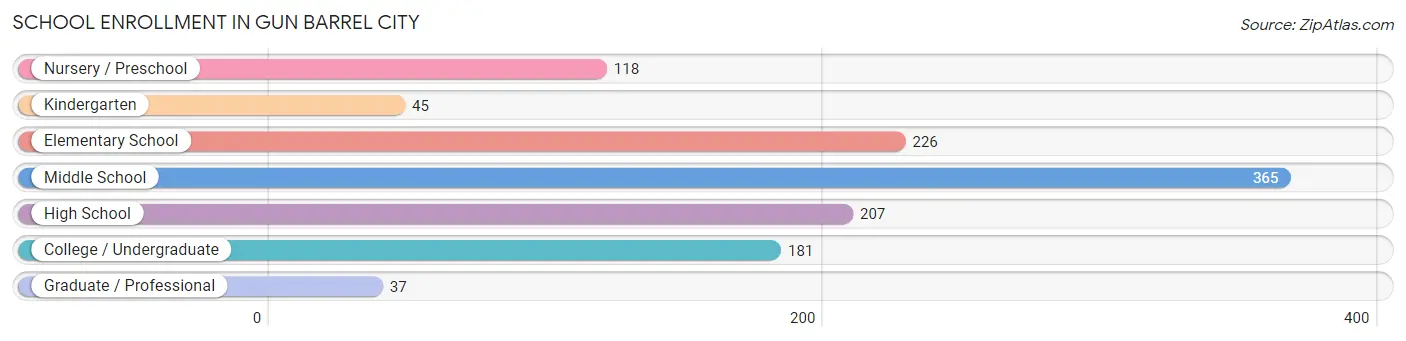
| School Level | # Students | % Students |
| Nursery / Preschool | 118 | 10.0% |
| Kindergarten | 45 | 3.8% |
| Elementary School | 226 | 19.2% |
| Middle School | 365 | 31.0% |
| High School | 207 | 17.6% |
| College / Undergraduate | 181 | 15.3% |
| Graduate / Professional | 37 | 3.1% |
| Total | 1,179 | 100.0% |
School Enrollment by Age by Funding Source in Gun Barrel City
Out of a total of 1,179 students who are enrolled in schools in Gun Barrel City, 113 (9.6%) attend a private institution, while the remaining 1,066 (90.4%) are enrolled in public schools. The age group of 3 to 4 year olds has the highest likelihood of being enrolled in private schools, with 70 (59.3% in the age bracket) enrolled. Conversely, the age group of 18 to 19 year olds has the lowest likelihood of being enrolled in a private school, with 6 (100.0% in the age bracket) attending a public institution.
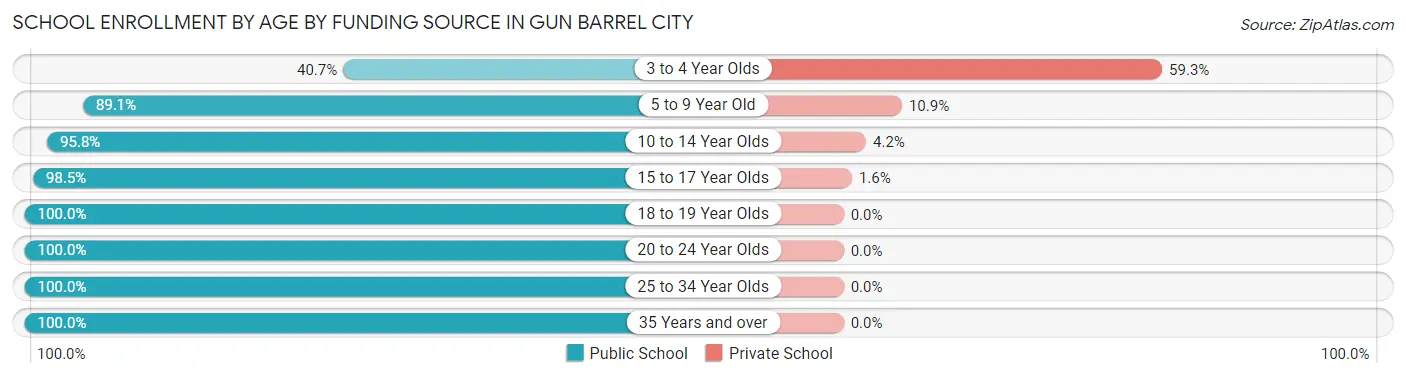
| Age Bracket | Public School | Private School |
| 3 to 4 Year Olds | 48 (40.7%) | 70 (59.3%) |
| 5 to 9 Year Old | 197 (89.1%) | 24 (10.9%) |
| 10 to 14 Year Olds | 368 (95.8%) | 16 (4.2%) |
| 15 to 17 Year Olds | 191 (98.5%) | 3 (1.5%) |
| 18 to 19 Year Olds | 6 (100.0%) | 0 (0.0%) |
| 20 to 24 Year Olds | 119 (100.0%) | 0 (0.0%) |
| 25 to 34 Year Olds | 16 (100.0%) | 0 (0.0%) |
| 35 Years and over | 121 (100.0%) | 0 (0.0%) |
| Total | 1,066 (90.4%) | 113 (9.6%) |
Educational Attainment by Field of Study in Gun Barrel City
Education (170 | 19.3%), business (142 | 16.1%), arts & humanities (116 | 13.1%), science & technology (114 | 12.9%), and liberal arts & history (67 | 7.6%) are the most common fields of study among 883 individuals in Gun Barrel City who have obtained a bachelor's degree or higher.
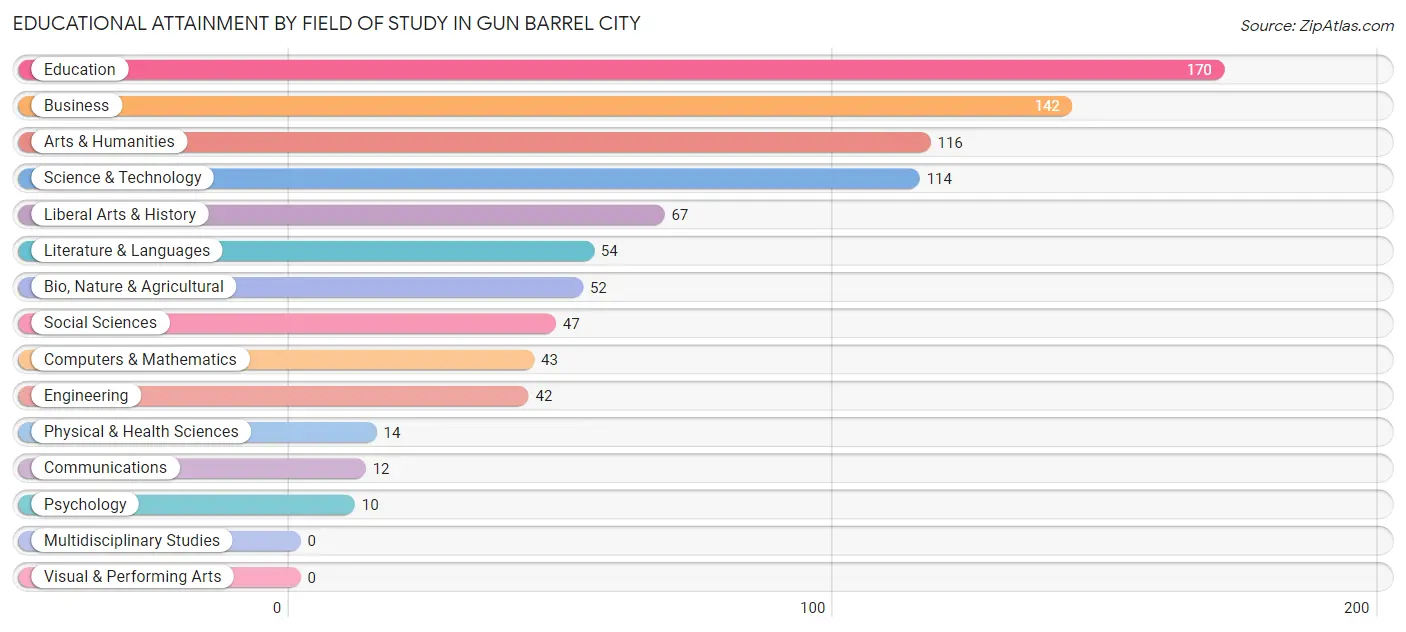
| Field of Study | # Graduates | % Graduates |
| Computers & Mathematics | 43 | 4.9% |
| Bio, Nature & Agricultural | 52 | 5.9% |
| Physical & Health Sciences | 14 | 1.6% |
| Psychology | 10 | 1.1% |
| Social Sciences | 47 | 5.3% |
| Engineering | 42 | 4.8% |
| Multidisciplinary Studies | 0 | 0.0% |
| Science & Technology | 114 | 12.9% |
| Business | 142 | 16.1% |
| Education | 170 | 19.3% |
| Literature & Languages | 54 | 6.1% |
| Liberal Arts & History | 67 | 7.6% |
| Visual & Performing Arts | 0 | 0.0% |
| Communications | 12 | 1.4% |
| Arts & Humanities | 116 | 13.1% |
| Total | 883 | 100.0% |
Transportation & Commute in Gun Barrel City
Vehicle Availability by Sex in Gun Barrel City
The most prevalent vehicle ownership categories in Gun Barrel City are males with 2 vehicles (700, accounting for 54.0%) and females with 2 vehicles (460, making up 65.2%).
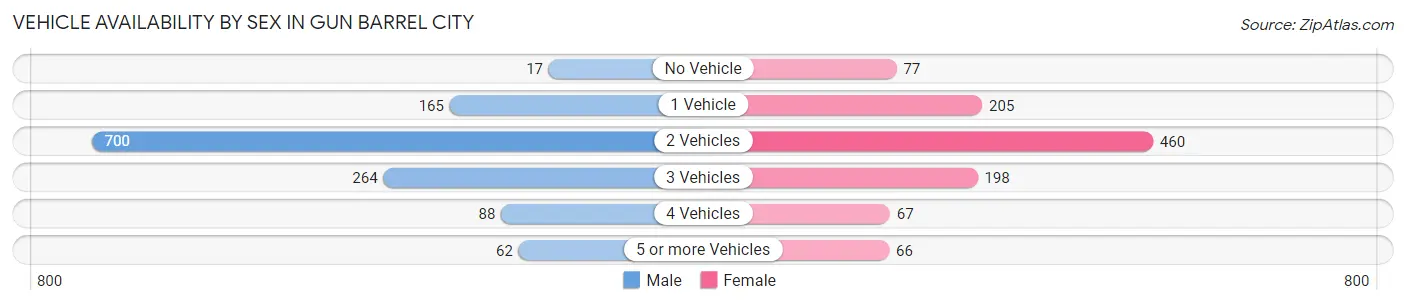
| Vehicles Available | Male | Female |
| No Vehicle | 17 (1.3%) | 77 (7.2%) |
| 1 Vehicle | 165 (12.7%) | 205 (19.1%) |
| 2 Vehicles | 700 (54.0%) | 460 (42.9%) |
| 3 Vehicles | 264 (20.4%) | 198 (18.4%) |
| 4 Vehicles | 88 (6.8%) | 67 (6.2%) |
| 5 or more Vehicles | 62 (4.8%) | 66 (6.1%) |
| Total | 1,296 (100.0%) | 1,073 (100.0%) |
Commute Time in Gun Barrel City
The most frequently occuring commute durations in Gun Barrel City are 60 to 89 minutes (406 commuters, 19.4%), 5 to 9 minutes (399 commuters, 19.1%), and 15 to 19 minutes (291 commuters, 13.9%).
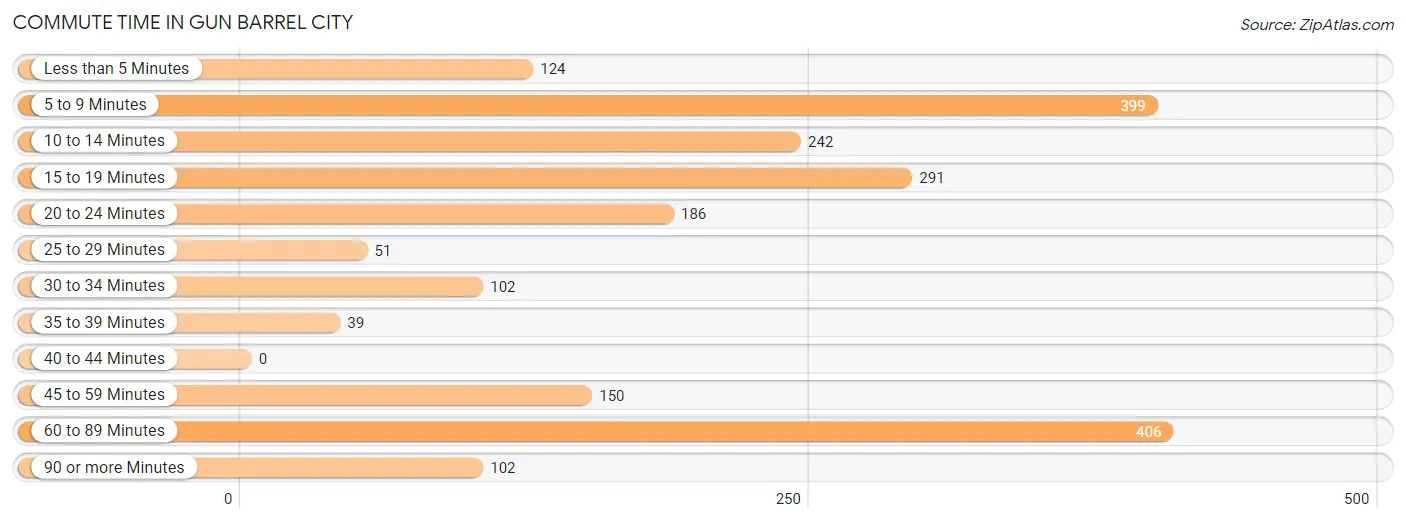
| Commute Time | # Commuters | % Commuters |
| Less than 5 Minutes | 124 | 5.9% |
| 5 to 9 Minutes | 399 | 19.1% |
| 10 to 14 Minutes | 242 | 11.6% |
| 15 to 19 Minutes | 291 | 13.9% |
| 20 to 24 Minutes | 186 | 8.9% |
| 25 to 29 Minutes | 51 | 2.4% |
| 30 to 34 Minutes | 102 | 4.9% |
| 35 to 39 Minutes | 39 | 1.9% |
| 40 to 44 Minutes | 0 | 0.0% |
| 45 to 59 Minutes | 150 | 7.2% |
| 60 to 89 Minutes | 406 | 19.4% |
| 90 or more Minutes | 102 | 4.9% |
Commute Time by Sex in Gun Barrel City
The most common commute times in Gun Barrel City are 5 to 9 minutes (331 commuters, 26.4%) for males and 60 to 89 minutes (217 commuters, 25.8%) for females.
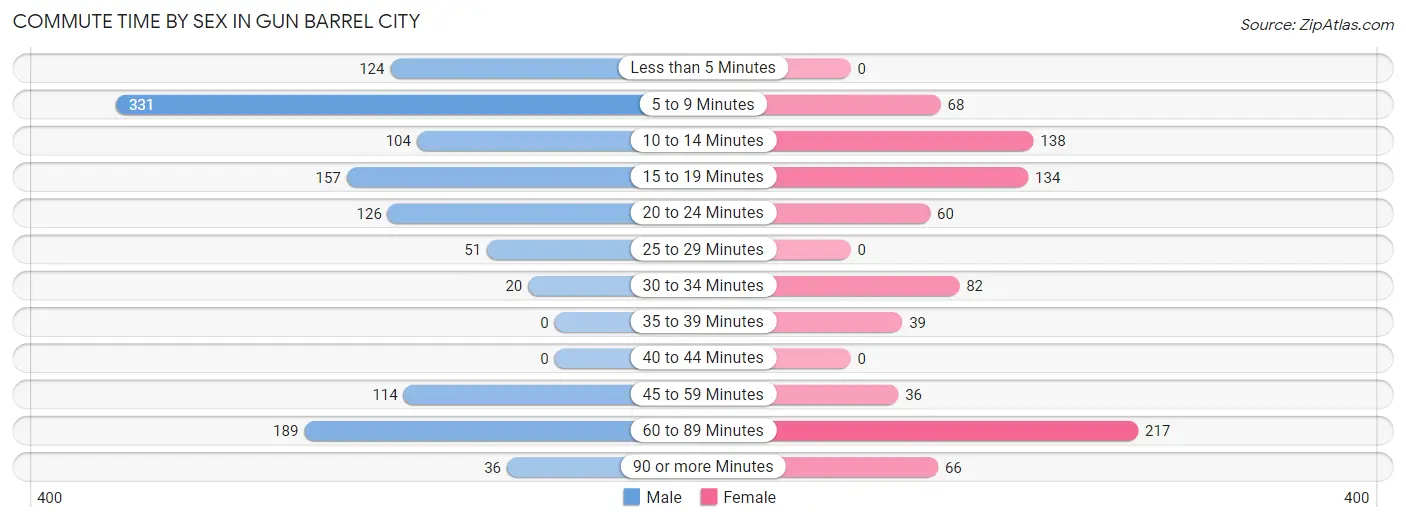
| Commute Time | Male | Female |
| Less than 5 Minutes | 124 (9.9%) | 0 (0.0%) |
| 5 to 9 Minutes | 331 (26.4%) | 68 (8.1%) |
| 10 to 14 Minutes | 104 (8.3%) | 138 (16.4%) |
| 15 to 19 Minutes | 157 (12.5%) | 134 (16.0%) |
| 20 to 24 Minutes | 126 (10.1%) | 60 (7.1%) |
| 25 to 29 Minutes | 51 (4.1%) | 0 (0.0%) |
| 30 to 34 Minutes | 20 (1.6%) | 82 (9.8%) |
| 35 to 39 Minutes | 0 (0.0%) | 39 (4.6%) |
| 40 to 44 Minutes | 0 (0.0%) | 0 (0.0%) |
| 45 to 59 Minutes | 114 (9.1%) | 36 (4.3%) |
| 60 to 89 Minutes | 189 (15.1%) | 217 (25.8%) |
| 90 or more Minutes | 36 (2.9%) | 66 (7.9%) |
Time of Departure to Work by Sex in Gun Barrel City
The most frequent times of departure to work in Gun Barrel City are 12:00 AM to 4:59 AM (195, 15.6%) for males and 7:00 AM to 7:29 AM (210, 25.0%) for females.
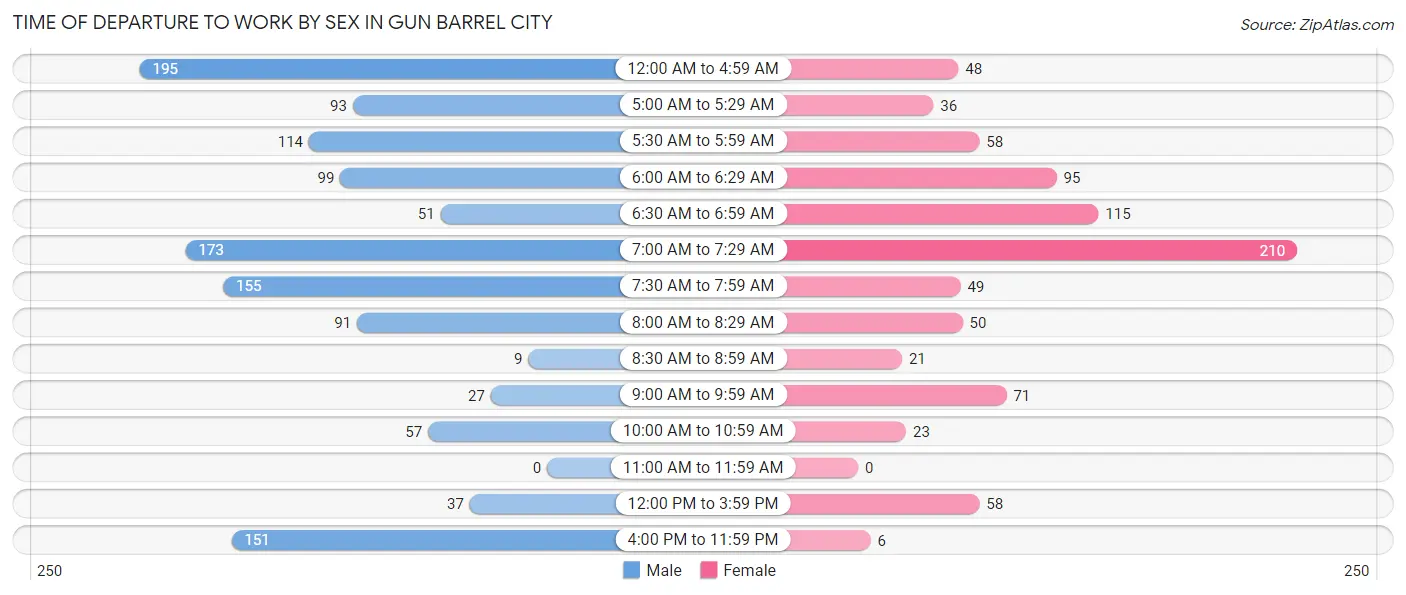
| Time of Departure | Male | Female |
| 12:00 AM to 4:59 AM | 195 (15.6%) | 48 (5.7%) |
| 5:00 AM to 5:29 AM | 93 (7.4%) | 36 (4.3%) |
| 5:30 AM to 5:59 AM | 114 (9.1%) | 58 (6.9%) |
| 6:00 AM to 6:29 AM | 99 (7.9%) | 95 (11.3%) |
| 6:30 AM to 6:59 AM | 51 (4.1%) | 115 (13.7%) |
| 7:00 AM to 7:29 AM | 173 (13.8%) | 210 (25.0%) |
| 7:30 AM to 7:59 AM | 155 (12.4%) | 49 (5.8%) |
| 8:00 AM to 8:29 AM | 91 (7.3%) | 50 (5.9%) |
| 8:30 AM to 8:59 AM | 9 (0.7%) | 21 (2.5%) |
| 9:00 AM to 9:59 AM | 27 (2.2%) | 71 (8.5%) |
| 10:00 AM to 10:59 AM | 57 (4.5%) | 23 (2.7%) |
| 11:00 AM to 11:59 AM | 0 (0.0%) | 0 (0.0%) |
| 12:00 PM to 3:59 PM | 37 (3.0%) | 58 (6.9%) |
| 4:00 PM to 11:59 PM | 151 (12.1%) | 6 (0.7%) |
| Total | 1,252 (100.0%) | 840 (100.0%) |
Housing Occupancy in Gun Barrel City
Occupancy by Ownership in Gun Barrel City
Of the total 2,666 dwellings in Gun Barrel City, owner-occupied units account for 2,344 (87.9%), while renter-occupied units make up 322 (12.1%).
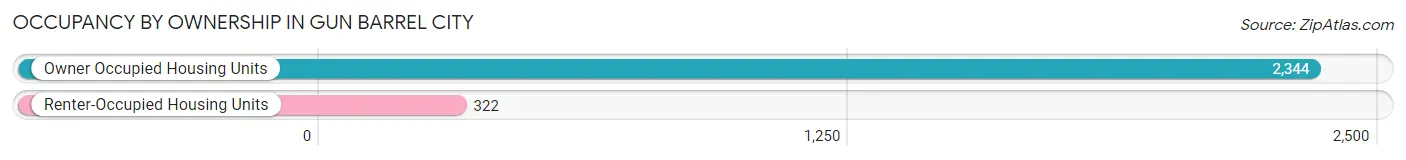
| Occupancy | # Housing Units | % Housing Units |
| Owner Occupied Housing Units | 2,344 | 87.9% |
| Renter-Occupied Housing Units | 322 | 12.1% |
| Total Occupied Housing Units | 2,666 | 100.0% |
Occupancy by Household Size in Gun Barrel City
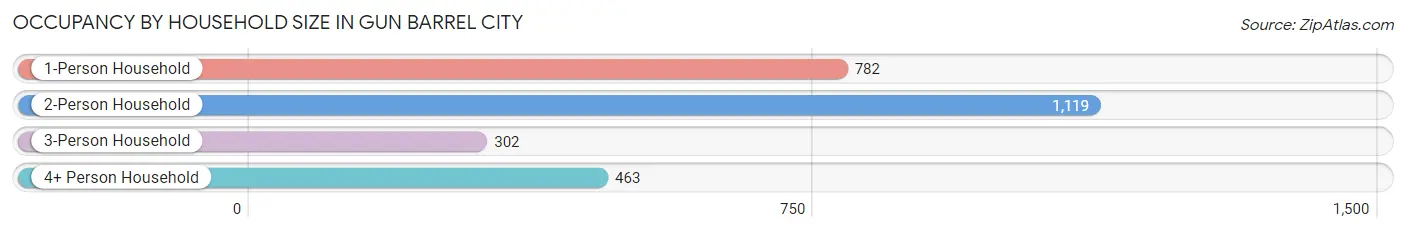
| Household Size | # Housing Units | % Housing Units |
| 1-Person Household | 782 | 29.3% |
| 2-Person Household | 1,119 | 42.0% |
| 3-Person Household | 302 | 11.3% |
| 4+ Person Household | 463 | 17.4% |
| Total Housing Units | 2,666 | 100.0% |
Occupancy by Ownership by Household Size in Gun Barrel City
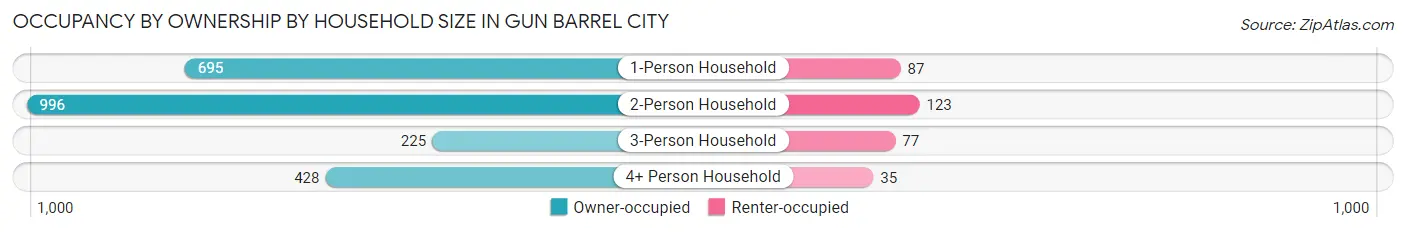
| Household Size | Owner-occupied | Renter-occupied |
| 1-Person Household | 695 (88.9%) | 87 (11.1%) |
| 2-Person Household | 996 (89.0%) | 123 (11.0%) |
| 3-Person Household | 225 (74.5%) | 77 (25.5%) |
| 4+ Person Household | 428 (92.4%) | 35 (7.6%) |
| Total Housing Units | 2,344 (87.9%) | 322 (12.1%) |
Occupancy by Educational Attainment in Gun Barrel City
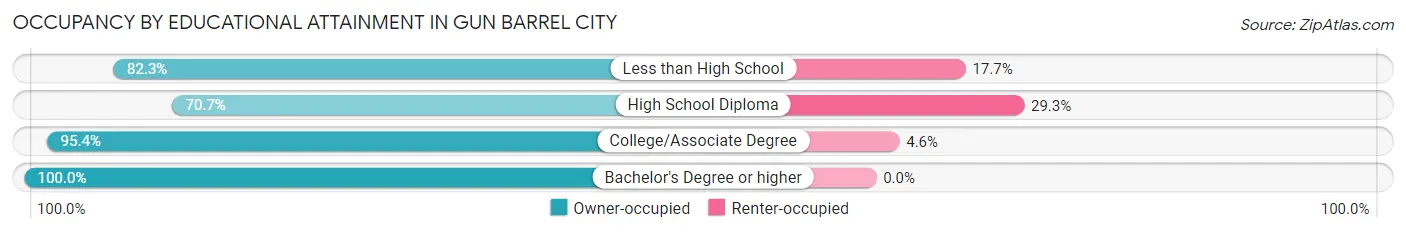
| Household Size | Owner-occupied | Renter-occupied |
| Less than High School | 237 (82.3%) | 51 (17.7%) |
| High School Diploma | 523 (70.7%) | 217 (29.3%) |
| College/Associate Degree | 1,124 (95.4%) | 54 (4.6%) |
| Bachelor's Degree or higher | 460 (100.0%) | 0 (0.0%) |
Occupancy by Age of Householder in Gun Barrel City
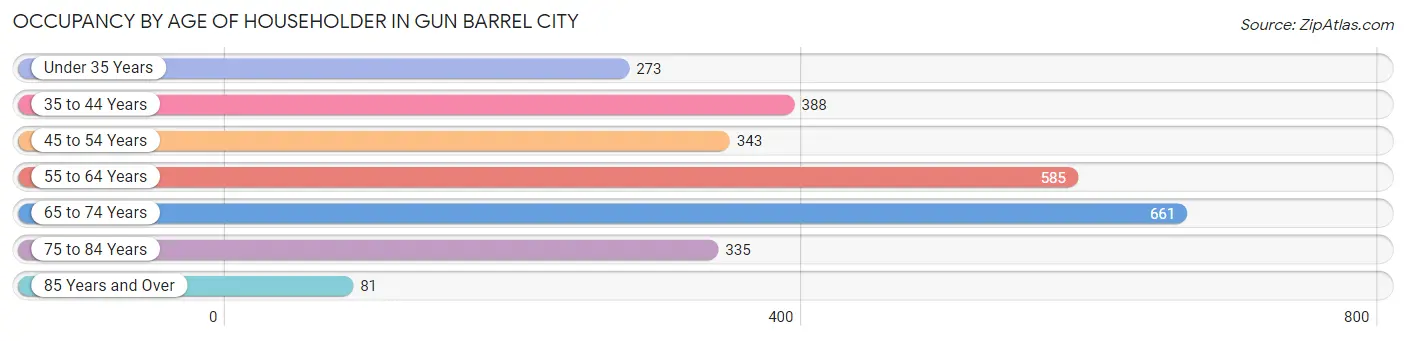
| Age Bracket | # Households | % Households |
| Under 35 Years | 273 | 10.2% |
| 35 to 44 Years | 388 | 14.5% |
| 45 to 54 Years | 343 | 12.9% |
| 55 to 64 Years | 585 | 21.9% |
| 65 to 74 Years | 661 | 24.8% |
| 75 to 84 Years | 335 | 12.6% |
| 85 Years and Over | 81 | 3.0% |
| Total | 2,666 | 100.0% |
Housing Finances in Gun Barrel City
Median Income by Occupancy in Gun Barrel City
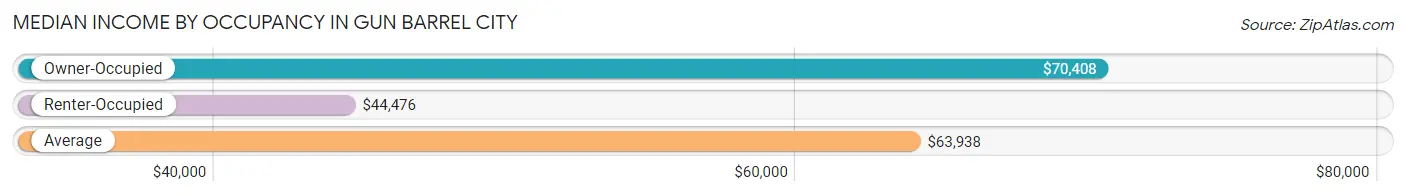
| Occupancy Type | # Households | Median Income |
| Owner-Occupied | 2,344 (87.9%) | $70,408 |
| Renter-Occupied | 322 (12.1%) | $44,476 |
| Average | 2,666 (100.0%) | $63,938 |
Occupancy by Householder Income Bracket in Gun Barrel City
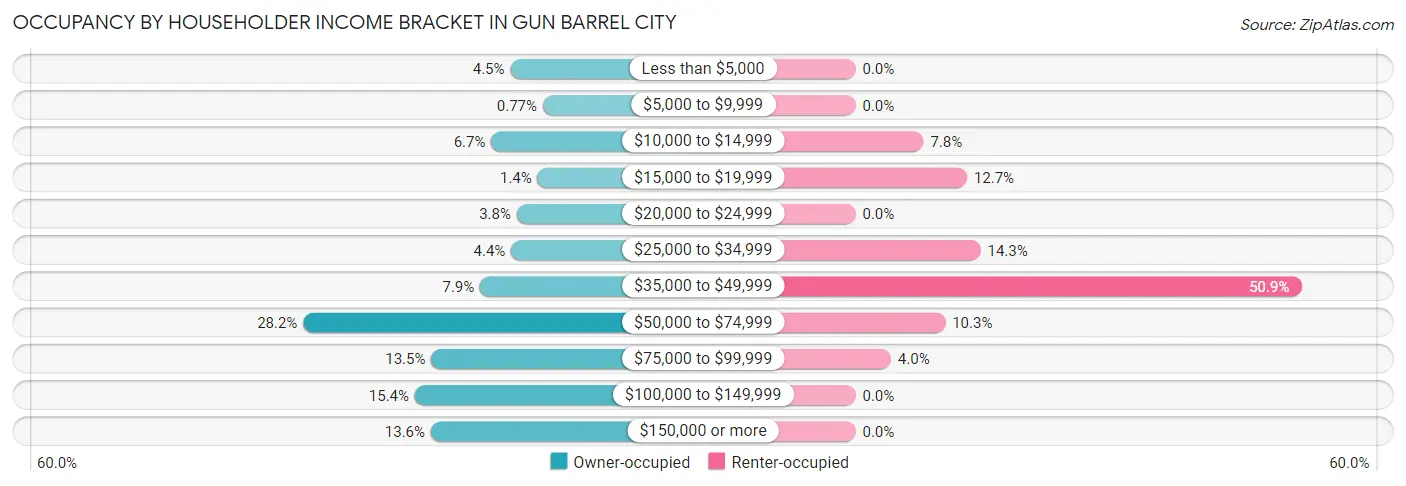
| Income Bracket | Owner-occupied | Renter-occupied |
| Less than $5,000 | 105 (4.5%) | 0 (0.0%) |
| $5,000 to $9,999 | 18 (0.8%) | 0 (0.0%) |
| $10,000 to $14,999 | 156 (6.7%) | 25 (7.8%) |
| $15,000 to $19,999 | 32 (1.4%) | 41 (12.7%) |
| $20,000 to $24,999 | 88 (3.7%) | 0 (0.0%) |
| $25,000 to $34,999 | 103 (4.4%) | 46 (14.3%) |
| $35,000 to $49,999 | 186 (7.9%) | 164 (50.9%) |
| $50,000 to $74,999 | 660 (28.2%) | 33 (10.2%) |
| $75,000 to $99,999 | 317 (13.5%) | 13 (4.0%) |
| $100,000 to $149,999 | 361 (15.4%) | 0 (0.0%) |
| $150,000 or more | 318 (13.6%) | 0 (0.0%) |
| Total | 2,344 (100.0%) | 322 (100.0%) |
Monthly Housing Cost Tiers in Gun Barrel City
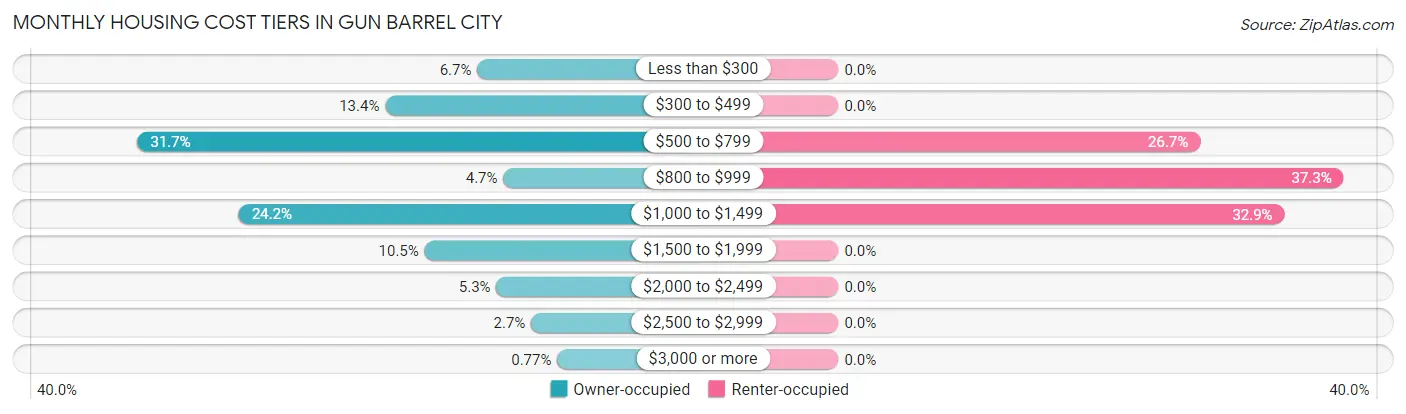
| Monthly Cost | Owner-occupied | Renter-occupied |
| Less than $300 | 156 (6.7%) | 0 (0.0%) |
| $300 to $499 | 315 (13.4%) | 0 (0.0%) |
| $500 to $799 | 743 (31.7%) | 86 (26.7%) |
| $800 to $999 | 111 (4.7%) | 120 (37.3%) |
| $1,000 to $1,499 | 568 (24.2%) | 106 (32.9%) |
| $1,500 to $1,999 | 247 (10.5%) | 0 (0.0%) |
| $2,000 to $2,499 | 123 (5.2%) | 0 (0.0%) |
| $2,500 to $2,999 | 63 (2.7%) | 0 (0.0%) |
| $3,000 or more | 18 (0.8%) | 0 (0.0%) |
| Total | 2,344 (100.0%) | 322 (100.0%) |
Physical Housing Characteristics in Gun Barrel City
Housing Structures in Gun Barrel City
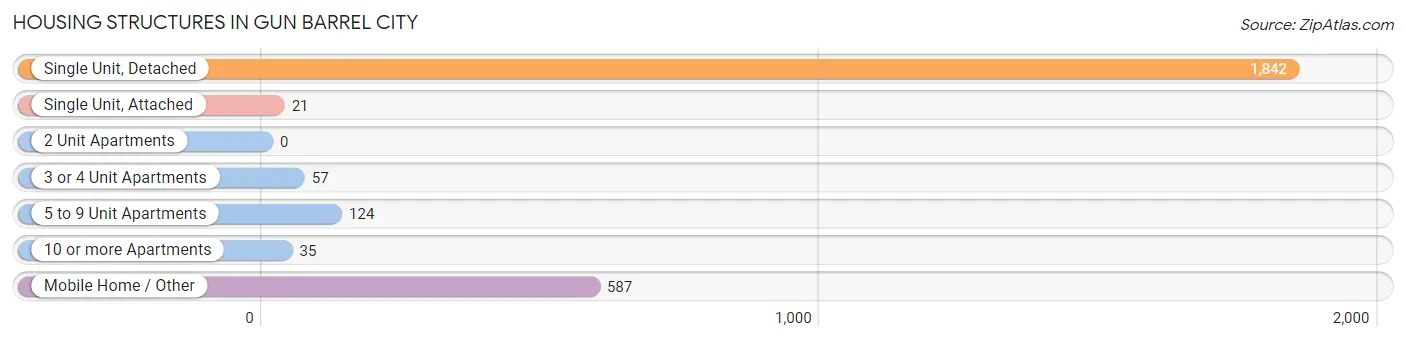
| Structure Type | # Housing Units | % Housing Units |
| Single Unit, Detached | 1,842 | 69.1% |
| Single Unit, Attached | 21 | 0.8% |
| 2 Unit Apartments | 0 | 0.0% |
| 3 or 4 Unit Apartments | 57 | 2.1% |
| 5 to 9 Unit Apartments | 124 | 4.6% |
| 10 or more Apartments | 35 | 1.3% |
| Mobile Home / Other | 587 | 22.0% |
| Total | 2,666 | 100.0% |
Housing Structures by Occupancy in Gun Barrel City
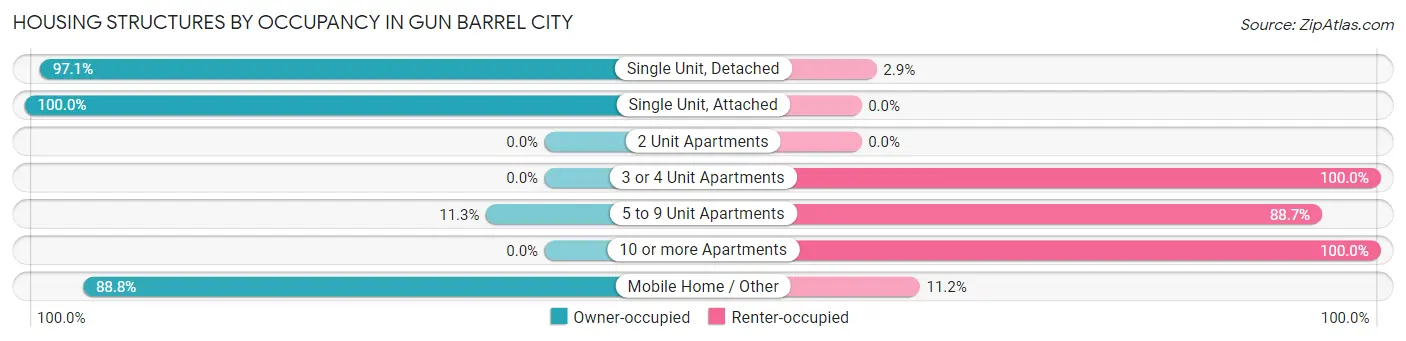
| Structure Type | Owner-occupied | Renter-occupied |
| Single Unit, Detached | 1,788 (97.1%) | 54 (2.9%) |
| Single Unit, Attached | 21 (100.0%) | 0 (0.0%) |
| 2 Unit Apartments | 0 (0.0%) | 0 (0.0%) |
| 3 or 4 Unit Apartments | 0 (0.0%) | 57 (100.0%) |
| 5 to 9 Unit Apartments | 14 (11.3%) | 110 (88.7%) |
| 10 or more Apartments | 0 (0.0%) | 35 (100.0%) |
| Mobile Home / Other | 521 (88.8%) | 66 (11.2%) |
| Total | 2,344 (87.9%) | 322 (12.1%) |
Housing Structures by Number of Rooms in Gun Barrel City
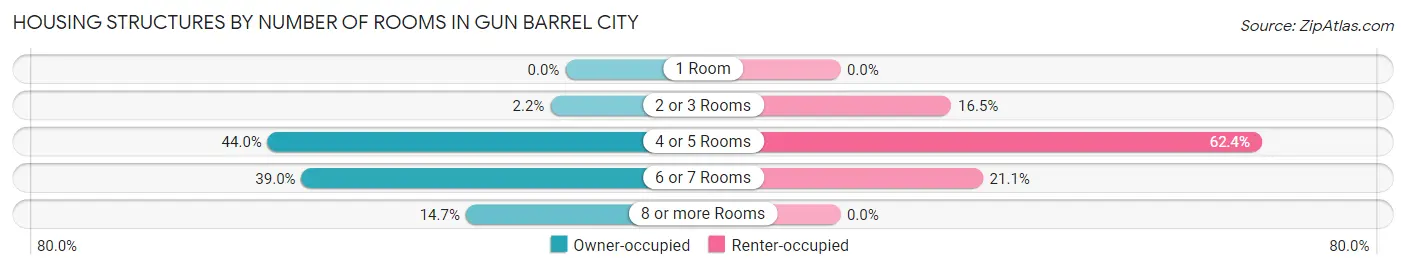
| Number of Rooms | Owner-occupied | Renter-occupied |
| 1 Room | 0 (0.0%) | 0 (0.0%) |
| 2 or 3 Rooms | 52 (2.2%) | 53 (16.5%) |
| 4 or 5 Rooms | 1,032 (44.0%) | 201 (62.4%) |
| 6 or 7 Rooms | 915 (39.0%) | 68 (21.1%) |
| 8 or more Rooms | 345 (14.7%) | 0 (0.0%) |
| Total | 2,344 (100.0%) | 322 (100.0%) |
Housing Structure by Heating Type in Gun Barrel City
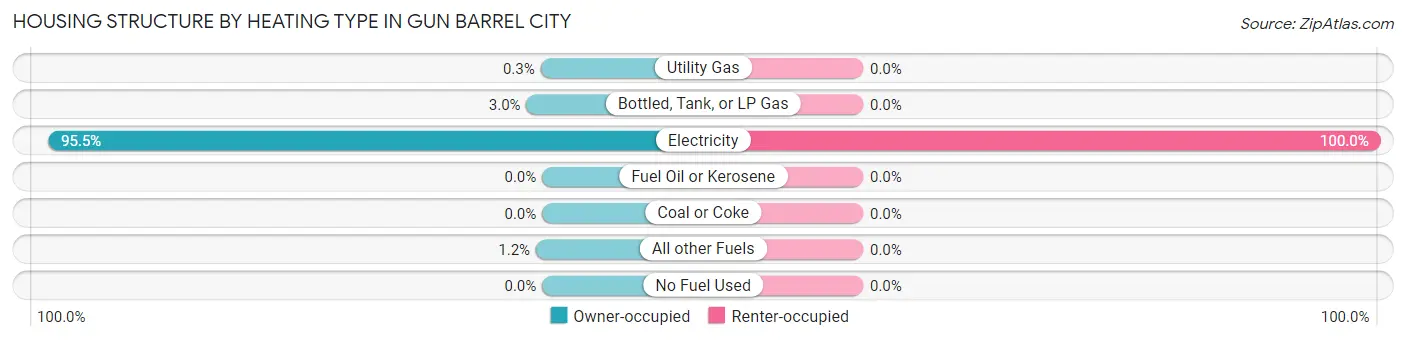
| Heating Type | Owner-occupied | Renter-occupied |
| Utility Gas | 7 (0.3%) | 0 (0.0%) |
| Bottled, Tank, or LP Gas | 71 (3.0%) | 0 (0.0%) |
| Electricity | 2,238 (95.5%) | 322 (100.0%) |
| Fuel Oil or Kerosene | 0 (0.0%) | 0 (0.0%) |
| Coal or Coke | 0 (0.0%) | 0 (0.0%) |
| All other Fuels | 28 (1.2%) | 0 (0.0%) |
| No Fuel Used | 0 (0.0%) | 0 (0.0%) |
| Total | 2,344 (100.0%) | 322 (100.0%) |
Household Vehicle Usage in Gun Barrel City
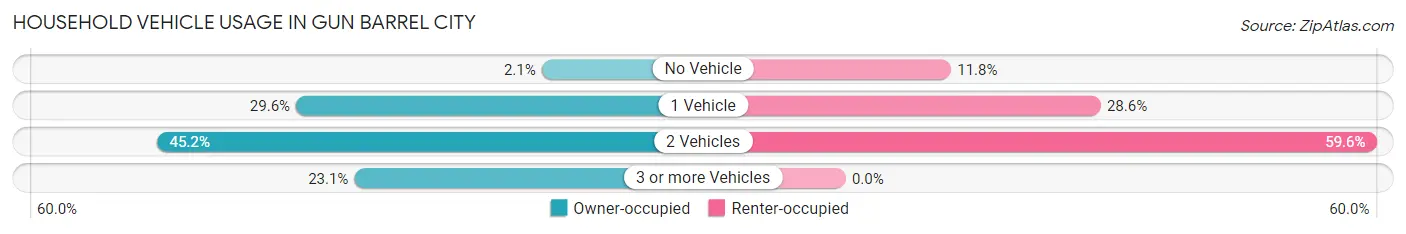
| Vehicles per Household | Owner-occupied | Renter-occupied |
| No Vehicle | 49 (2.1%) | 38 (11.8%) |
| 1 Vehicle | 694 (29.6%) | 92 (28.6%) |
| 2 Vehicles | 1,060 (45.2%) | 192 (59.6%) |
| 3 or more Vehicles | 541 (23.1%) | 0 (0.0%) |
| Total | 2,344 (100.0%) | 322 (100.0%) |
Real Estate & Mortgages in Gun Barrel City
Real Estate and Mortgage Overview in Gun Barrel City
| Characteristic | Without Mortgage | With Mortgage |
| Housing Units | 1,236 | 1,108 |
| Median Property Value | $207,300 | $210,000 |
| Median Household Income | $57,009 | $146 |
| Monthly Housing Costs | $580 | $18 |
| Real Estate Taxes | $1,792 | $19 |
Property Value by Mortgage Status in Gun Barrel City
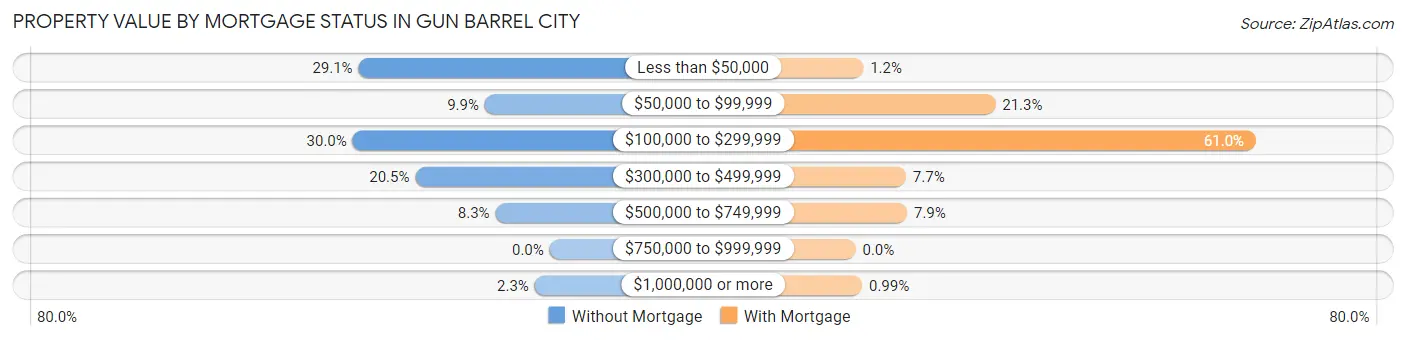
| Property Value | Without Mortgage | With Mortgage |
| Less than $50,000 | 360 (29.1%) | 13 (1.2%) |
| $50,000 to $99,999 | 122 (9.9%) | 236 (21.3%) |
| $100,000 to $299,999 | 371 (30.0%) | 676 (61.0%) |
| $300,000 to $499,999 | 253 (20.5%) | 85 (7.7%) |
| $500,000 to $749,999 | 102 (8.3%) | 87 (7.9%) |
| $750,000 to $999,999 | 0 (0.0%) | 0 (0.0%) |
| $1,000,000 or more | 28 (2.3%) | 11 (1.0%) |
| Total | 1,236 (100.0%) | 1,108 (100.0%) |
Household Income by Mortgage Status in Gun Barrel City
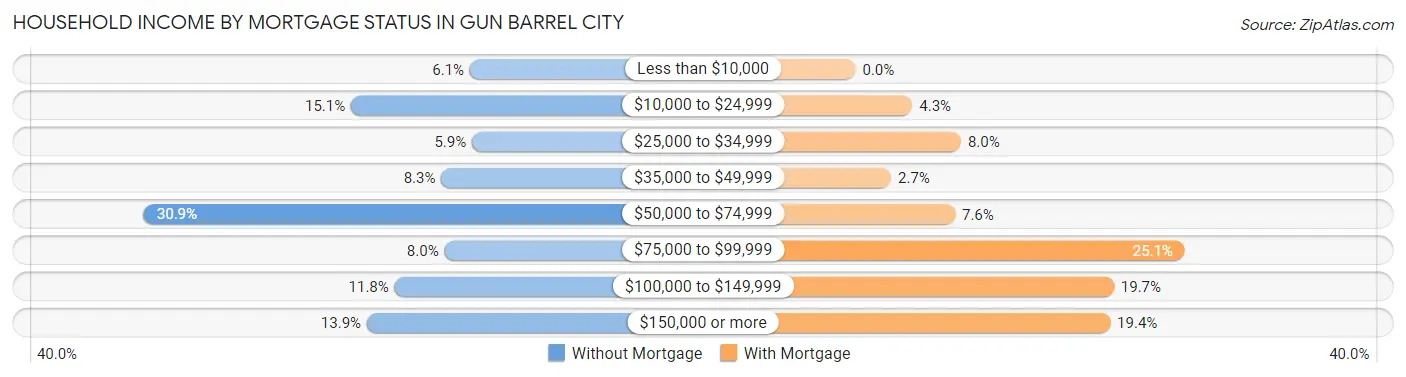
| Household Income | Without Mortgage | With Mortgage |
| Less than $10,000 | 75 (6.1%) | 0 (0.0%) |
| $10,000 to $24,999 | 187 (15.1%) | 48 (4.3%) |
| $25,000 to $34,999 | 73 (5.9%) | 89 (8.0%) |
| $35,000 to $49,999 | 102 (8.3%) | 30 (2.7%) |
| $50,000 to $74,999 | 382 (30.9%) | 84 (7.6%) |
| $75,000 to $99,999 | 99 (8.0%) | 278 (25.1%) |
| $100,000 to $149,999 | 146 (11.8%) | 218 (19.7%) |
| $150,000 or more | 172 (13.9%) | 215 (19.4%) |
| Total | 1,236 (100.0%) | 1,108 (100.0%) |
Property Value to Household Income Ratio in Gun Barrel City
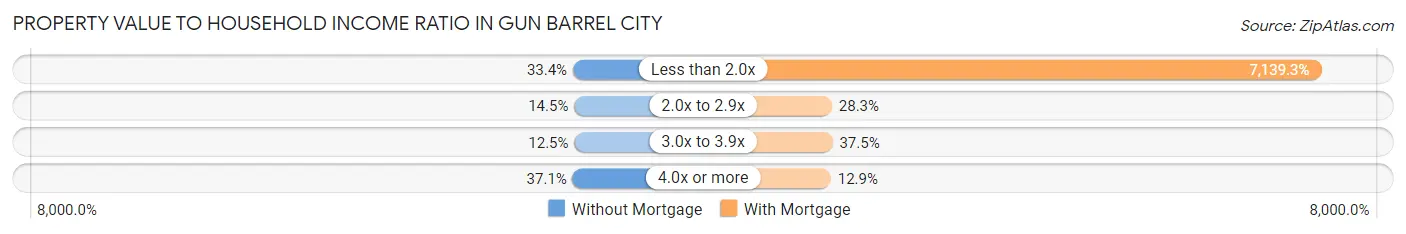
| Value-to-Income Ratio | Without Mortgage | With Mortgage |
| Less than 2.0x | 413 (33.4%) | 79,103 (7,139.3%) |
| 2.0x to 2.9x | 179 (14.5%) | 313 (28.2%) |
| 3.0x to 3.9x | 154 (12.5%) | 415 (37.4%) |
| 4.0x or more | 459 (37.1%) | 143 (12.9%) |
| Total | 1,236 (100.0%) | 1,108 (100.0%) |
Real Estate Taxes by Mortgage Status in Gun Barrel City
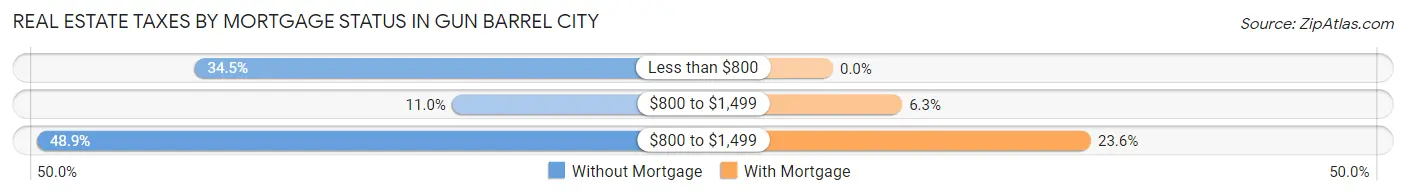
| Property Taxes | Without Mortgage | With Mortgage |
| Less than $800 | 426 (34.5%) | 0 (0.0%) |
| $800 to $1,499 | 136 (11.0%) | 70 (6.3%) |
| $800 to $1,499 | 604 (48.9%) | 261 (23.6%) |
| Total | 1,236 (100.0%) | 1,108 (100.0%) |
Health & Disability in Gun Barrel City
Health Insurance Coverage by Age in Gun Barrel City
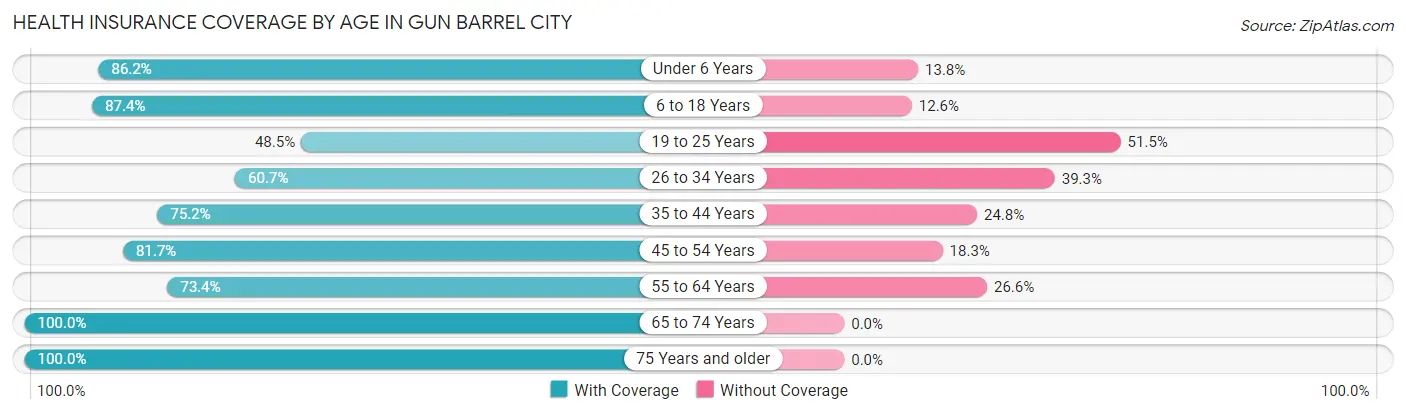
| Age Bracket | With Coverage | Without Coverage |
| Under 6 Years | 313 (86.2%) | 50 (13.8%) |
| 6 to 18 Years | 666 (87.4%) | 96 (12.6%) |
| 19 to 25 Years | 283 (48.5%) | 301 (51.5%) |
| 26 to 34 Years | 314 (60.7%) | 203 (39.3%) |
| 35 to 44 Years | 556 (75.2%) | 183 (24.8%) |
| 45 to 54 Years | 503 (81.7%) | 113 (18.3%) |
| 55 to 64 Years | 827 (73.4%) | 300 (26.6%) |
| 65 to 74 Years | 871 (100.0%) | 0 (0.0%) |
| 75 Years and older | 668 (100.0%) | 0 (0.0%) |
| Total | 5,001 (80.0%) | 1,246 (20.0%) |
Health Insurance Coverage by Citizenship Status in Gun Barrel City
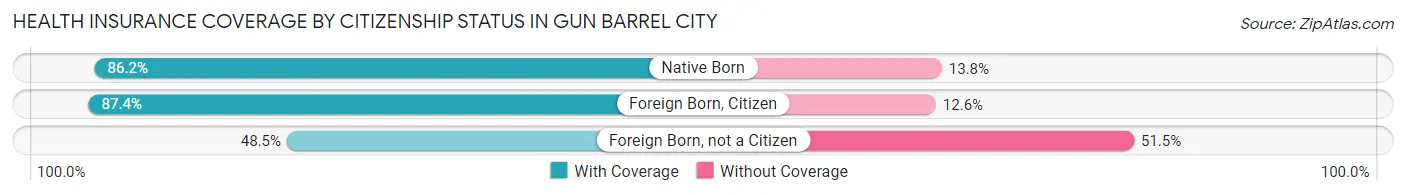
| Citizenship Status | With Coverage | Without Coverage |
| Native Born | 313 (86.2%) | 50 (13.8%) |
| Foreign Born, Citizen | 666 (87.4%) | 96 (12.6%) |
| Foreign Born, not a Citizen | 283 (48.5%) | 301 (51.5%) |
Health Insurance Coverage by Household Income in Gun Barrel City
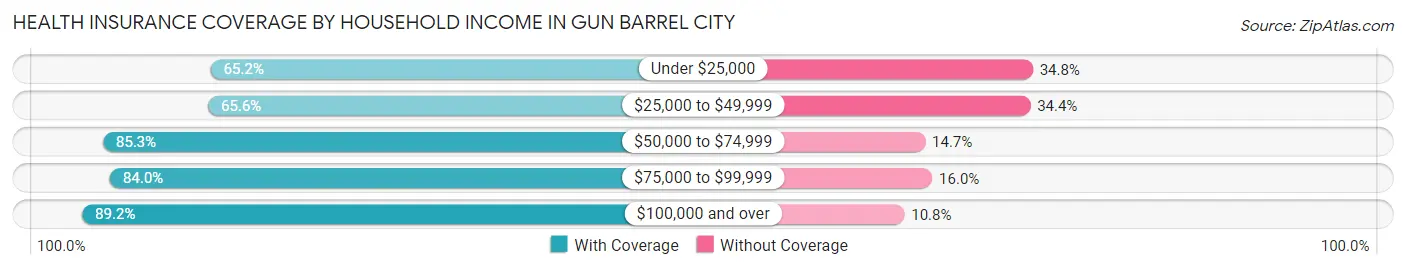
| Household Income | With Coverage | Without Coverage |
| Under $25,000 | 597 (65.2%) | 319 (34.8%) |
| $25,000 to $49,999 | 728 (65.6%) | 381 (34.4%) |
| $50,000 to $74,999 | 1,291 (85.3%) | 222 (14.7%) |
| $75,000 to $99,999 | 515 (84.0%) | 98 (16.0%) |
| $100,000 and over | 1,870 (89.2%) | 226 (10.8%) |
Public vs Private Health Insurance Coverage by Age in Gun Barrel City
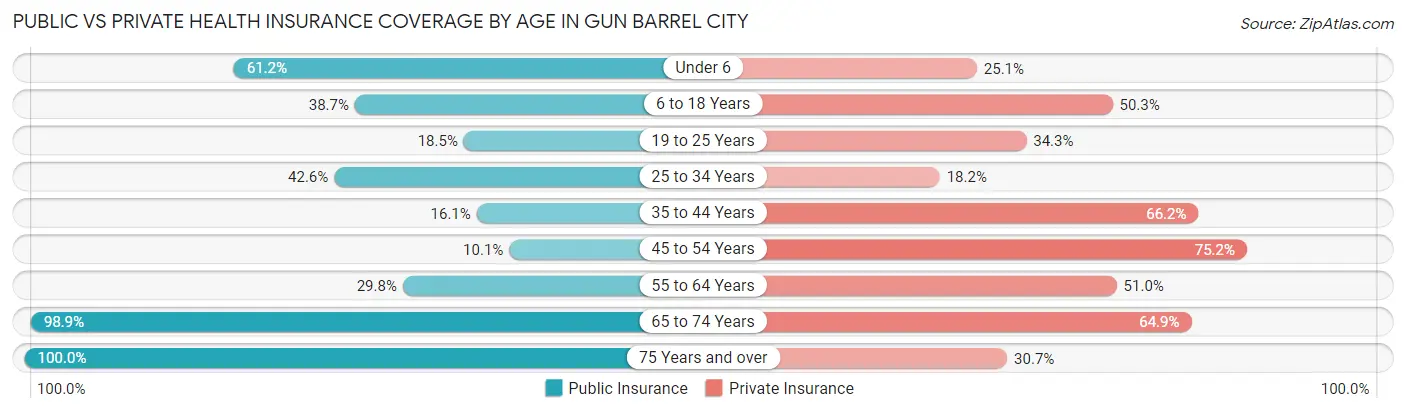
| Age Bracket | Public Insurance | Private Insurance |
| Under 6 | 222 (61.2%) | 91 (25.1%) |
| 6 to 18 Years | 295 (38.7%) | 383 (50.3%) |
| 19 to 25 Years | 108 (18.5%) | 200 (34.3%) |
| 25 to 34 Years | 220 (42.5%) | 94 (18.2%) |
| 35 to 44 Years | 119 (16.1%) | 489 (66.2%) |
| 45 to 54 Years | 62 (10.1%) | 463 (75.2%) |
| 55 to 64 Years | 336 (29.8%) | 575 (51.0%) |
| 65 to 74 Years | 861 (98.9%) | 565 (64.9%) |
| 75 Years and over | 668 (100.0%) | 205 (30.7%) |
| Total | 2,891 (46.3%) | 3,065 (49.1%) |
Disability Status by Sex by Age in Gun Barrel City
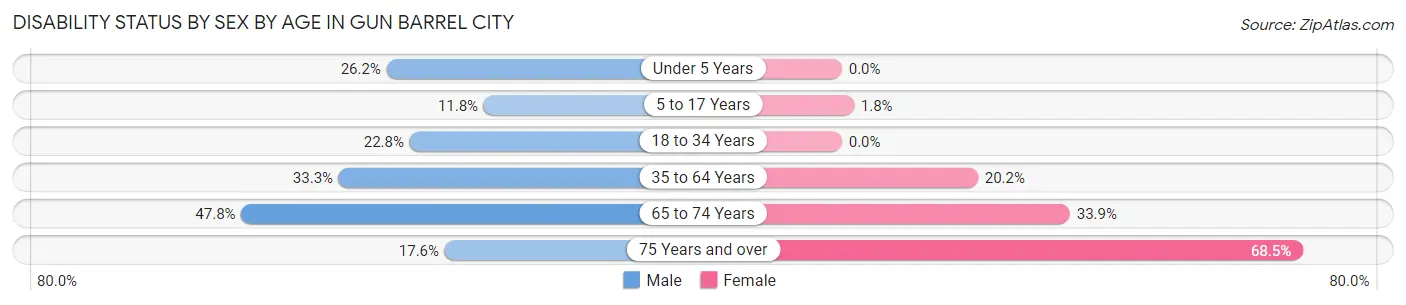
| Age Bracket | Male | Female |
| Under 5 Years | 48 (26.2%) | 0 (0.0%) |
| 5 to 17 Years | 50 (11.8%) | 7 (1.8%) |
| 18 to 34 Years | 148 (22.8%) | 0 (0.0%) |
| 35 to 64 Years | 367 (33.3%) | 279 (20.2%) |
| 65 to 74 Years | 175 (47.8%) | 171 (33.9%) |
| 75 Years and over | 79 (17.6%) | 150 (68.5%) |
Disability Class by Sex by Age in Gun Barrel City
Disability Class: Hearing Difficulty
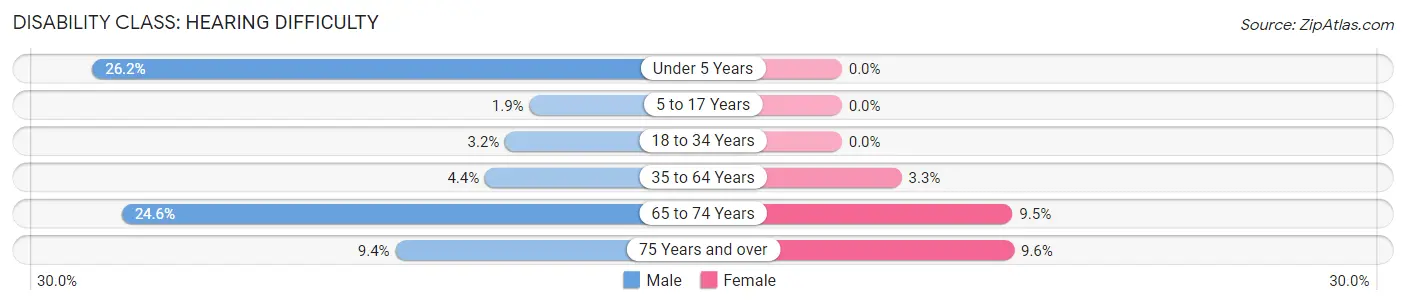
| Age Bracket | Male | Female |
| Under 5 Years | 48 (26.2%) | 0 (0.0%) |
| 5 to 17 Years | 8 (1.9%) | 0 (0.0%) |
| 18 to 34 Years | 21 (3.2%) | 0 (0.0%) |
| 35 to 64 Years | 48 (4.4%) | 46 (3.3%) |
| 65 to 74 Years | 90 (24.6%) | 48 (9.5%) |
| 75 Years and over | 42 (9.3%) | 21 (9.6%) |
Disability Class: Vision Difficulty
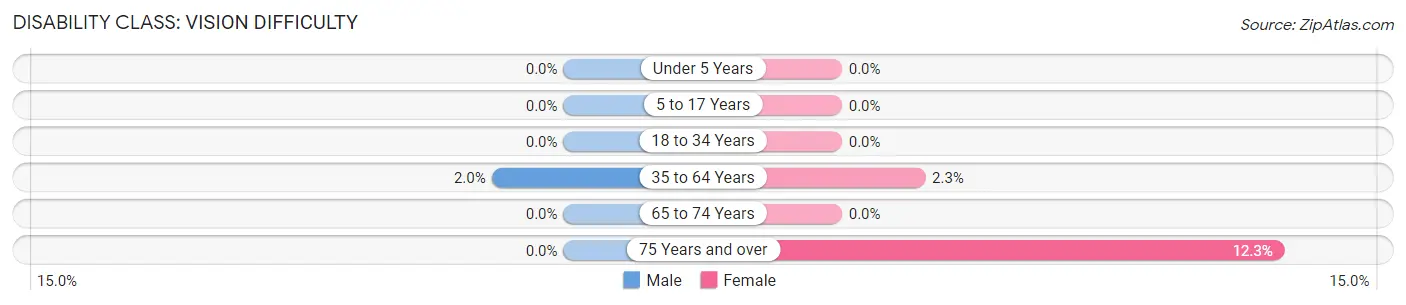
| Age Bracket | Male | Female |
| Under 5 Years | 0 (0.0%) | 0 (0.0%) |
| 5 to 17 Years | 0 (0.0%) | 0 (0.0%) |
| 18 to 34 Years | 0 (0.0%) | 0 (0.0%) |
| 35 to 64 Years | 22 (2.0%) | 32 (2.3%) |
| 65 to 74 Years | 0 (0.0%) | 0 (0.0%) |
| 75 Years and over | 0 (0.0%) | 27 (12.3%) |
Disability Class: Cognitive Difficulty
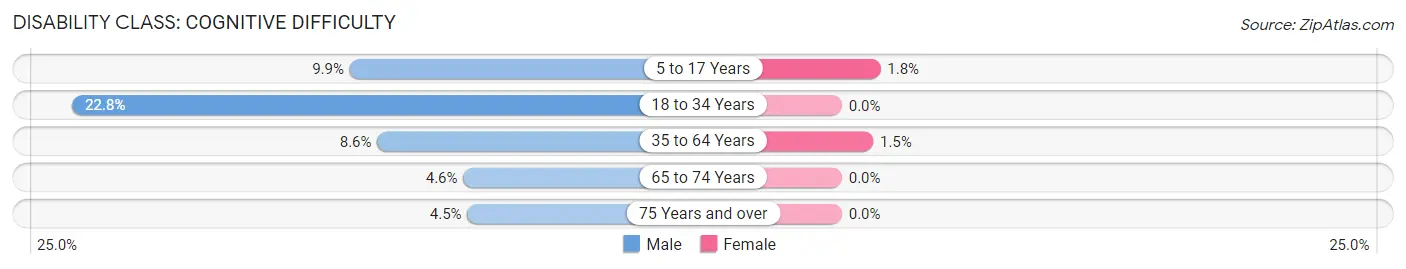
| Age Bracket | Male | Female |
| 5 to 17 Years | 42 (9.9%) | 7 (1.8%) |
| 18 to 34 Years | 148 (22.8%) | 0 (0.0%) |
| 35 to 64 Years | 95 (8.6%) | 20 (1.5%) |
| 65 to 74 Years | 17 (4.6%) | 0 (0.0%) |
| 75 Years and over | 20 (4.4%) | 0 (0.0%) |
Disability Class: Ambulatory Difficulty
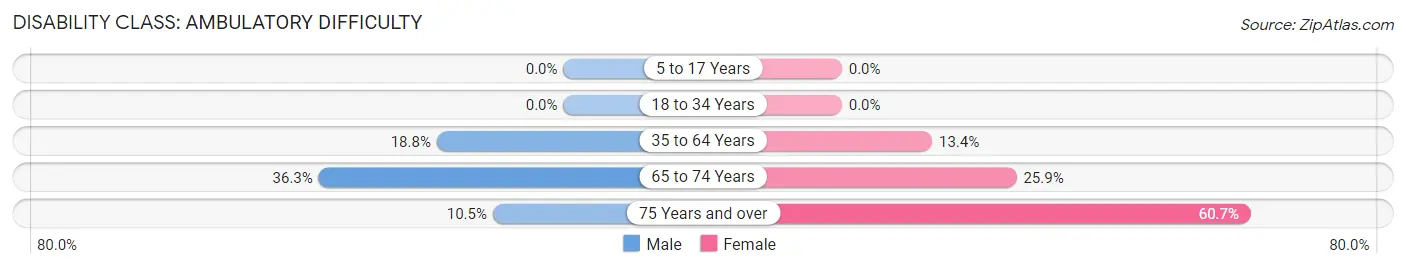
| Age Bracket | Male | Female |
| 5 to 17 Years | 0 (0.0%) | 0 (0.0%) |
| 18 to 34 Years | 0 (0.0%) | 0 (0.0%) |
| 35 to 64 Years | 207 (18.8%) | 185 (13.4%) |
| 65 to 74 Years | 133 (36.3%) | 131 (25.9%) |
| 75 Years and over | 47 (10.5%) | 133 (60.7%) |
Disability Class: Self-Care Difficulty
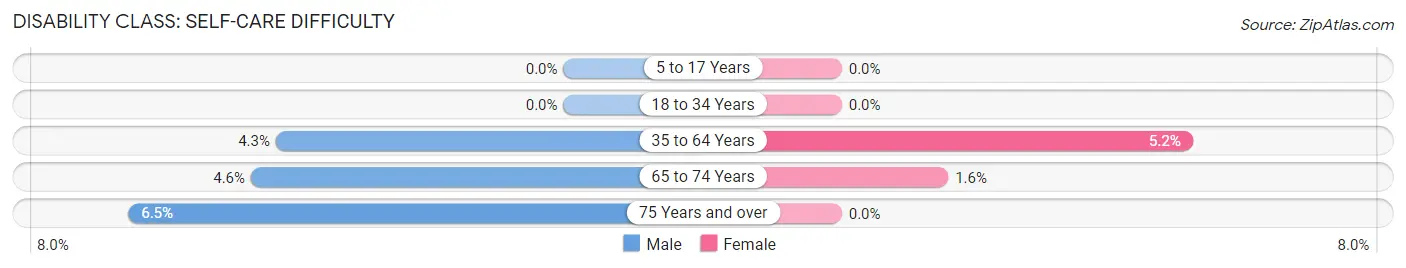
| Age Bracket | Male | Female |
| 5 to 17 Years | 0 (0.0%) | 0 (0.0%) |
| 18 to 34 Years | 0 (0.0%) | 0 (0.0%) |
| 35 to 64 Years | 47 (4.3%) | 72 (5.2%) |
| 65 to 74 Years | 17 (4.6%) | 8 (1.6%) |
| 75 Years and over | 29 (6.5%) | 0 (0.0%) |
Technology Access in Gun Barrel City
Computing Device Access in Gun Barrel City
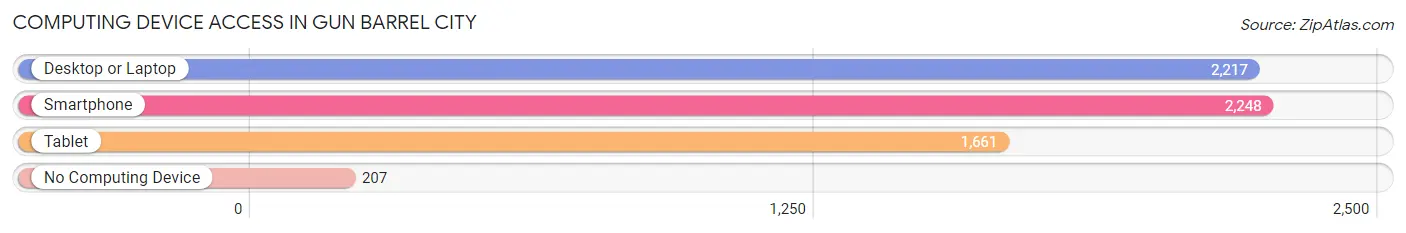
| Device Type | # Households | % Households |
| Desktop or Laptop | 2,217 | 83.2% |
| Smartphone | 2,248 | 84.3% |
| Tablet | 1,661 | 62.3% |
| No Computing Device | 207 | 7.8% |
| Total | 2,666 | 100.0% |
Internet Access in Gun Barrel City
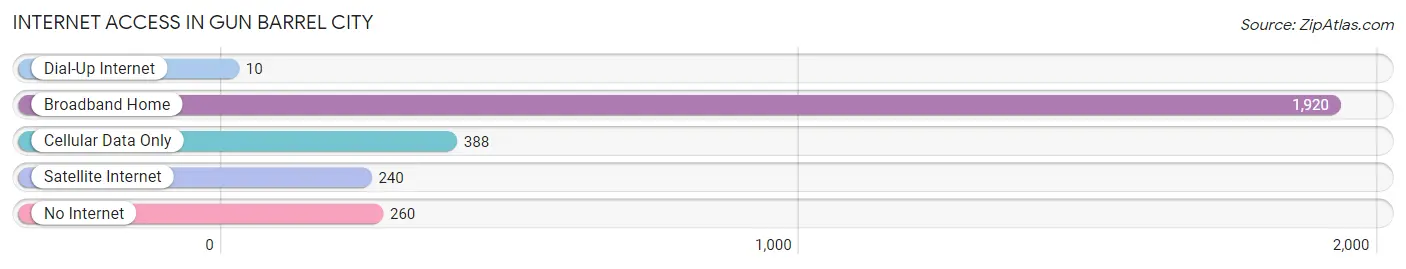
| Internet Type | # Households | % Households |
| Dial-Up Internet | 10 | 0.4% |
| Broadband Home | 1,920 | 72.0% |
| Cellular Data Only | 388 | 14.5% |
| Satellite Internet | 240 | 9.0% |
| No Internet | 260 | 9.8% |
| Total | 2,666 | 100.0% |
Gun Barrel City Summary
History
The city of Gun Barrel City, Texas is located in Henderson County, Texas, and is part of the Dallas-Fort Worth Metroplex. The city was founded in 1970 by two local businessmen, Bill Browning and Bob Crowder. The two men had a vision of creating a city that was a safe and friendly place to live and work. The city was named after the nearby Gun Barrel City Lake, which was named after the gun barrels used by settlers in the area during the 1800s.
The city was incorporated in 1971 and has since grown to a population of over 5,000 people. The city is known for its small-town charm and friendly atmosphere. It is also home to several businesses, including a variety of restaurants, retail stores, and professional services.
Geography
Gun Barrel City is located in Henderson County, Texas, and is part of the Dallas-Fort Worth Metroplex. The city is situated on the eastern shore of Cedar Creek Reservoir, which is a popular recreational area. The city is located approximately 60 miles southeast of Dallas and 40 miles northwest of Tyler.
The city has a total area of 4.2 square miles, all of which is land. The terrain is mostly flat, with some rolling hills in the area. The climate is generally mild, with temperatures ranging from the mid-50s in the winter to the mid-90s in the summer.
Economy
The economy of Gun Barrel City is largely based on the service industry. The city is home to a variety of restaurants, retail stores, and professional services. The city is also home to several manufacturing companies, including a plastics manufacturer and a metal fabrication company.
The city is also home to several oil and gas companies, which are responsible for much of the city’s economic growth. The city is also home to several recreational businesses, including marinas, boat dealerships, and RV parks.
Demographics
As of the 2010 census, the population of Gun Barrel City was 5,672. The racial makeup of the city was 87.3% White, 5.3% African American, 0.7% Native American, 0.5% Asian, 0.1% Pacific Islander, 4.2% from other races, and 2.0% from two or more races. Hispanic or Latino of any race were 10.2% of the population.
The median income for a household in the city was $37,917, and the median income for a family was $45,938. The per capita income for the city was $20,945. About 11.2% of families and 14.2% of the population were below the poverty line, including 19.2% of those under age 18 and 8.2% of those age 65 or over.
Conclusion
Gun Barrel City, Texas is a small city located in Henderson County, Texas, and is part of the Dallas-Fort Worth Metroplex. The city was founded in 1970 and has since grown to a population of over 5,000 people. The city is known for its small-town charm and friendly atmosphere. The economy of the city is largely based on the service industry, with several manufacturing companies, oil and gas companies, and recreational businesses located in the city. The population of the city is mostly White, with a small percentage of African American, Native American, Asian, and Pacific Islander residents. The median income for a household in the city is $37,917, and the per capita income is $20,945.
Common Questions
What is Per Capita Income in Gun Barrel City?
Per Capita income in Gun Barrel City is $37,976.
What is the Median Family Income in Gun Barrel City?
Median Family Income in Gun Barrel City is $74,203.
What is the Median Household income in Gun Barrel City?
Median Household Income in Gun Barrel City is $63,938.
What is Income or Wage Gap in Gun Barrel City?
Income or Wage Gap in Gun Barrel City is 37.8%.
Women in Gun Barrel City earn 62.2 cents for every dollar earned by a man.
What is Inequality or Gini Index in Gun Barrel City?
Inequality or Gini Index in Gun Barrel City is 0.47.
What is the Total Population of Gun Barrel City?
Total Population of Gun Barrel City is 6,247.
What is the Total Male Population of Gun Barrel City?
Total Male Population of Gun Barrel City is 3,172.
What is the Total Female Population of Gun Barrel City?
Total Female Population of Gun Barrel City is 3,075.
What is the Ratio of Males per 100 Females in Gun Barrel City?
There are 103.15 Males per 100 Females in Gun Barrel City.
What is the Ratio of Females per 100 Males in Gun Barrel City?
There are 96.94 Females per 100 Males in Gun Barrel City.
What is the Median Population Age in Gun Barrel City?
Median Population Age in Gun Barrel City is 49.1 Years.
What is the Average Family Size in Gun Barrel City
Average Family Size in Gun Barrel City is 3.0 People.
What is the Average Household Size in Gun Barrel City
Average Household Size in Gun Barrel City is 2.3 People.
How Large is the Labor Force in Gun Barrel City?
There are 2,629 People in the Labor Forcein in Gun Barrel City.
What is the Percentage of People in the Labor Force in Gun Barrel City?
50.2% of People are in the Labor Force in Gun Barrel City.
What is the Unemployment Rate in Gun Barrel City?
Unemployment Rate in Gun Barrel City is 8.9%.