Thorntonville, TX Map & Demographics
Thorntonville Map
Thorntonville Overview
$33,252
PER CAPITA INCOME
$103,015
AVG FAMILY INCOME
$75,625
AVG HOUSEHOLD INCOME
$8,376
FAMILY INCOME DEFICIT
0.50
INEQUALITY / GINI INDEX
622
TOTAL POPULATION
342
MALE POPULATION
280
FEMALE POPULATION
122.14
MALES / 100 FEMALES
81.87
FEMALES / 100 MALES
36.8
MEDIAN AGE
4.1
AVG FAMILY SIZE
3.4
AVG HOUSEHOLD SIZE
276
LABOR FORCE [ PEOPLE ]
63.2%
PERCENT IN LABOR FORCE
1.8%
UNEMPLOYMENT RATE
Thorntonville Area Codes
Income in Thorntonville
Income Overview in Thorntonville
Per Capita Income in Thorntonville is $33,252, while median incomes of families and households are $103,015 and $75,625 respectively.
| Characteristic | Number | Measure |
| Per Capita Income | 622 | $33,252 |
| Median Family Income | 141 | $103,015 |
| Mean Family Income | 141 | $113,886 |
| Median Household Income | 181 | $75,625 |
| Mean Household Income | 181 | $95,640 |
| Income Deficit | 141 | $8,376 |
| Wage / Income Gap (%) | 622 | 0.00% |
| Wage / Income Gap ($) | 622 | 100.00¢ per $1 |
| Gini / Inequality Index | 622 | 0.50 |
Earnings by Sex in Thorntonville
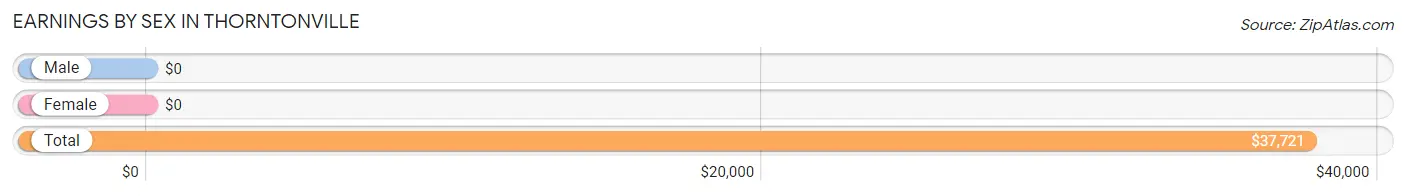
| Sex | Number | Average Earnings |
| Male | 163 (58.0%) | $0 |
| Female | 118 (42.0%) | $0 |
| Total | 281 (100.0%) | $37,721 |
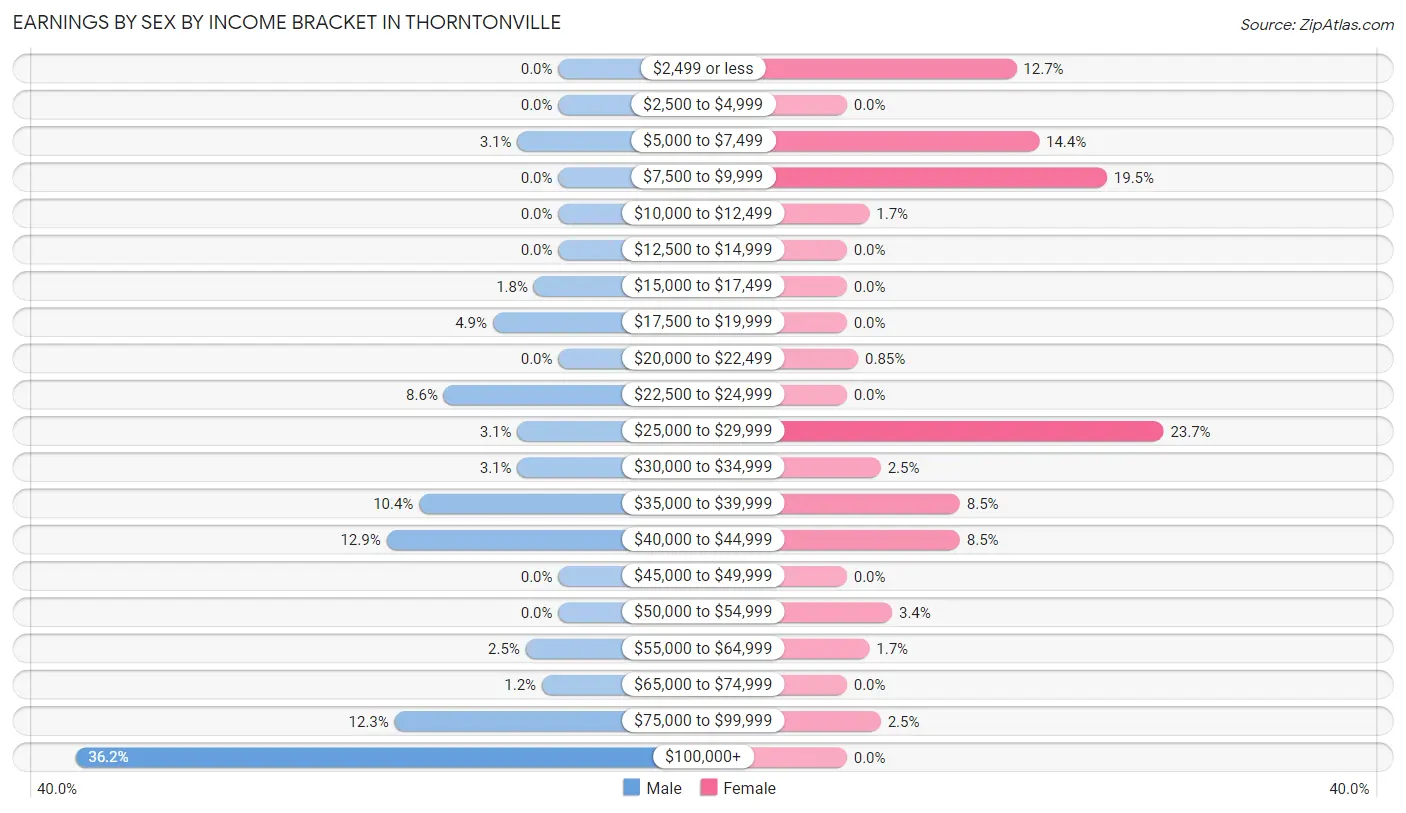
Earnings by Sex by Income Bracket in Thorntonville
The most common earnings brackets in Thorntonville are $100,000+ for men (59 | 36.2%) and $25,000 to $29,999 for women (28 | 23.7%).
| Income | Male | Female |
| $2,499 or less | 0 (0.0%) | 15 (12.7%) |
| $2,500 to $4,999 | 0 (0.0%) | 0 (0.0%) |
| $5,000 to $7,499 | 5 (3.1%) | 17 (14.4%) |
| $7,500 to $9,999 | 0 (0.0%) | 23 (19.5%) |
| $10,000 to $12,499 | 0 (0.0%) | 2 (1.7%) |
| $12,500 to $14,999 | 0 (0.0%) | 0 (0.0%) |
| $15,000 to $17,499 | 3 (1.8%) | 0 (0.0%) |
| $17,500 to $19,999 | 8 (4.9%) | 0 (0.0%) |
| $20,000 to $22,499 | 0 (0.0%) | 1 (0.9%) |
| $22,500 to $24,999 | 14 (8.6%) | 0 (0.0%) |
| $25,000 to $29,999 | 5 (3.1%) | 28 (23.7%) |
| $30,000 to $34,999 | 5 (3.1%) | 3 (2.5%) |
| $35,000 to $39,999 | 17 (10.4%) | 10 (8.5%) |
| $40,000 to $44,999 | 21 (12.9%) | 10 (8.5%) |
| $45,000 to $49,999 | 0 (0.0%) | 0 (0.0%) |
| $50,000 to $54,999 | 0 (0.0%) | 4 (3.4%) |
| $55,000 to $64,999 | 4 (2.5%) | 2 (1.7%) |
| $65,000 to $74,999 | 2 (1.2%) | 0 (0.0%) |
| $75,000 to $99,999 | 20 (12.3%) | 3 (2.5%) |
| $100,000+ | 59 (36.2%) | 0 (0.0%) |
| Total | 163 (100.0%) | 118 (100.0%) |
Earnings by Sex by Educational Attainment in Thorntonville
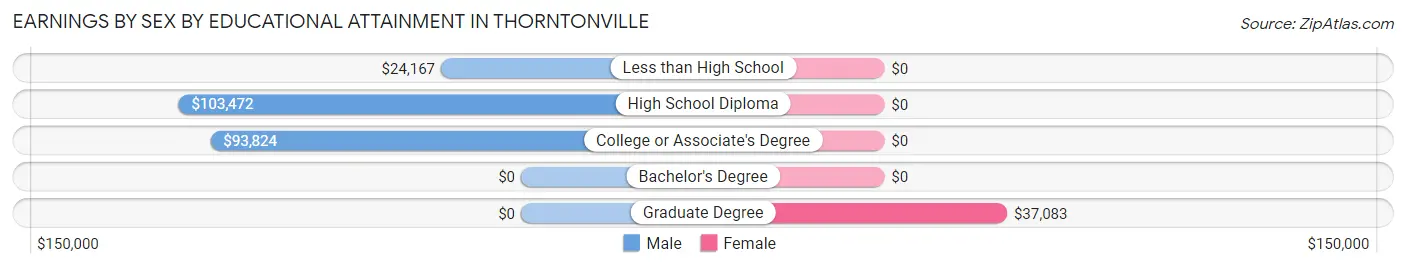
| Educational Attainment | Male Income | Female Income |
| Less than High School | $24,167 | $0 |
| High School Diploma | $103,472 | $0 |
| College or Associate's Degree | $93,824 | $0 |
| Bachelor's Degree | - | - |
| Graduate Degree | - | - |
| Total | $94,044 | $0 |
Family Income in Thorntonville
Family Income Brackets in Thorntonville
According to the Thorntonville family income data, there are 48 families falling into the $100,000 to $149,999 income range, which is the most common income bracket and makes up 34.0% of all families. Conversely, the $25,000 to $34,999 income bracket is the least frequent group with only 4 families (2.8%) belonging to this category.
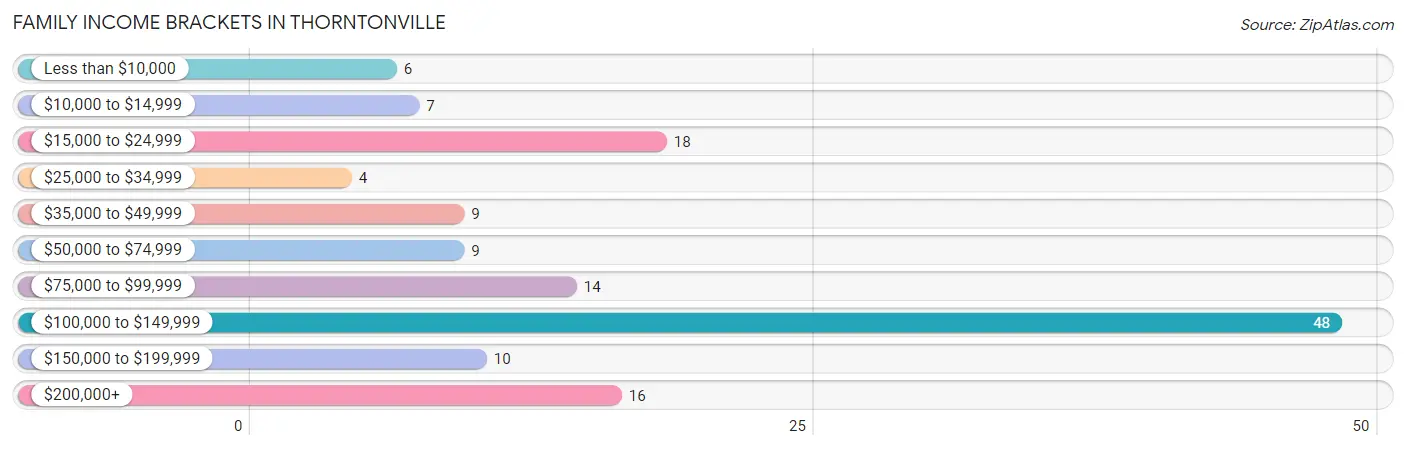
| Income Bracket | # Families | % Families |
| Less than $10,000 | 6 | 4.3% |
| $10,000 to $14,999 | 7 | 5.0% |
| $15,000 to $24,999 | 18 | 12.8% |
| $25,000 to $34,999 | 4 | 2.8% |
| $35,000 to $49,999 | 9 | 6.4% |
| $50,000 to $74,999 | 9 | 6.4% |
| $75,000 to $99,999 | 14 | 9.9% |
| $100,000 to $149,999 | 48 | 34.0% |
| $150,000 to $199,999 | 10 | 7.1% |
| $200,000+ | 16 | 11.3% |
Family Income by Famaliy Size in Thorntonville
5-person families (26 | 18.4%) account for the highest median family income in Thorntonville with $250,001 per family, while 5-person families (26 | 18.4%) have the highest median income of $50,000 per family member.
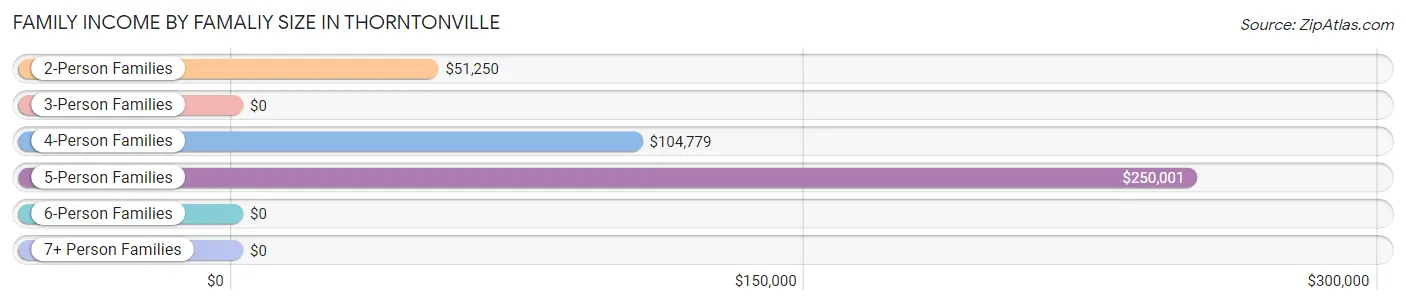
| Income Bracket | # Families | Median Income |
| 2-Person Families | 44 (31.2%) | $51,250 |
| 3-Person Families | 26 (18.4%) | $0 |
| 4-Person Families | 37 (26.2%) | $104,779 |
| 5-Person Families | 26 (18.4%) | $250,001 |
| 6-Person Families | 0 (0.0%) | $0 |
| 7+ Person Families | 8 (5.7%) | $0 |
| Total | 141 (100.0%) | $103,015 |
Family Income by Number of Earners in Thorntonville
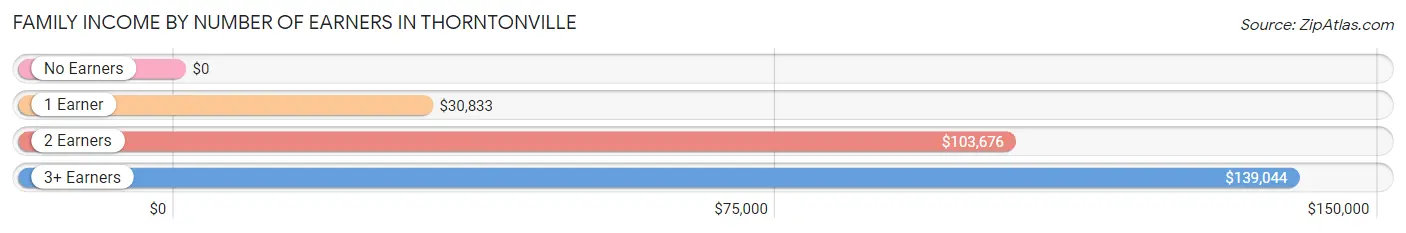
| Number of Earners | # Families | Median Income |
| No Earners | 20 (14.2%) | $0 |
| 1 Earner | 42 (29.8%) | $30,833 |
| 2 Earners | 36 (25.5%) | $103,676 |
| 3+ Earners | 43 (30.5%) | $139,044 |
| Total | 141 (100.0%) | $103,015 |
Household Income in Thorntonville
Household Income Brackets in Thorntonville
With 51 households falling in the category, the $100,000 to $149,999 income range is the most frequent in Thorntonville, accounting for 28.2% of all households. In contrast, only 6 households (3.3%) fall into the $25,000 to $34,999 income bracket, making it the least populous group.
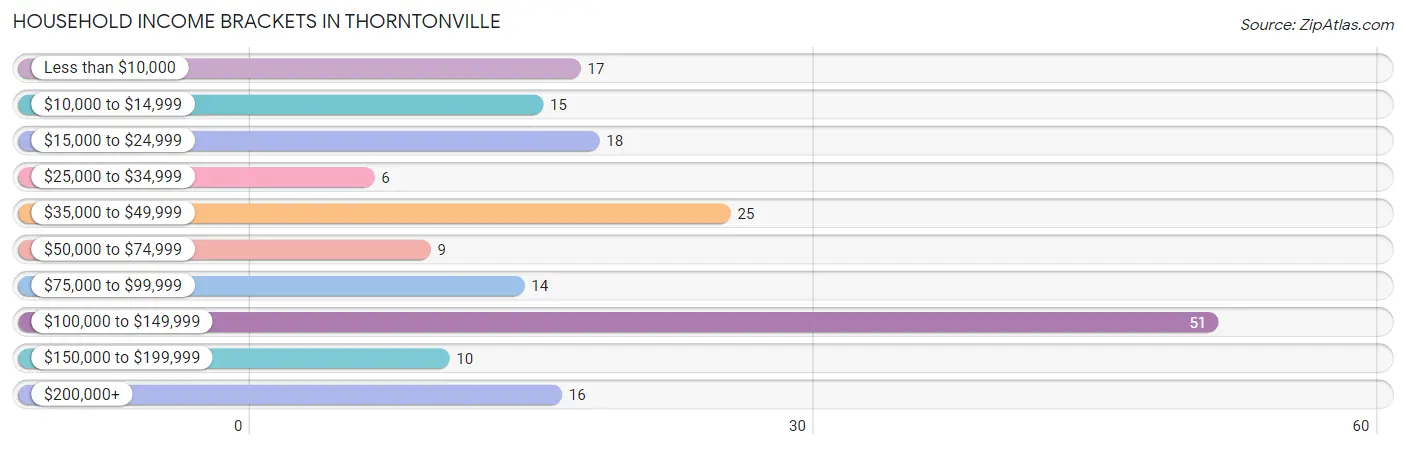
| Income Bracket | # Households | % Households |
| Less than $10,000 | 17 | 9.4% |
| $10,000 to $14,999 | 15 | 8.3% |
| $15,000 to $24,999 | 18 | 9.9% |
| $25,000 to $34,999 | 6 | 3.3% |
| $35,000 to $49,999 | 25 | 13.8% |
| $50,000 to $74,999 | 9 | 5.0% |
| $75,000 to $99,999 | 14 | 7.7% |
| $100,000 to $149,999 | 51 | 28.2% |
| $150,000 to $199,999 | 10 | 5.5% |
| $200,000+ | 16 | 8.8% |
Household Income by Householder Age in Thorntonville
The median household income in Thorntonville is $75,625, with the highest median household income of $104,118 found in the 25 to 44 years age bracket for the primary householder. A total of 70 households (38.7%) fall into this category. Meanwhile, the 15 to 24 years age bracket for the primary householder has the lowest median household income of $0, with 22 households (12.1%) in this group.
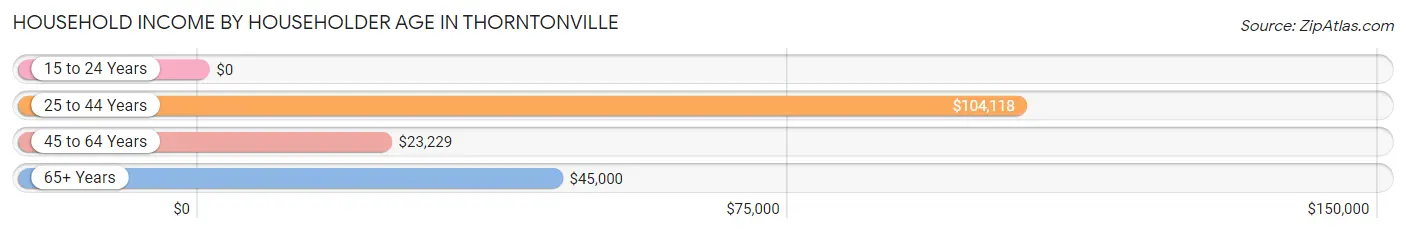
| Income Bracket | # Households | Median Income |
| 15 to 24 Years | 22 (12.1%) | $0 |
| 25 to 44 Years | 70 (38.7%) | $104,118 |
| 45 to 64 Years | 27 (14.9%) | $23,229 |
| 65+ Years | 62 (34.3%) | $45,000 |
| Total | 181 (100.0%) | $75,625 |
Poverty in Thorntonville
Income Below Poverty by Sex and Age in Thorntonville
With 10.8% poverty level for males and 18.6% for females among the residents of Thorntonville, 55 to 64 year old males and under 5 year old females are the most vulnerable to poverty, with 10 males (71.4%) and 10 females (50.0%) in their respective age groups living below the poverty level.
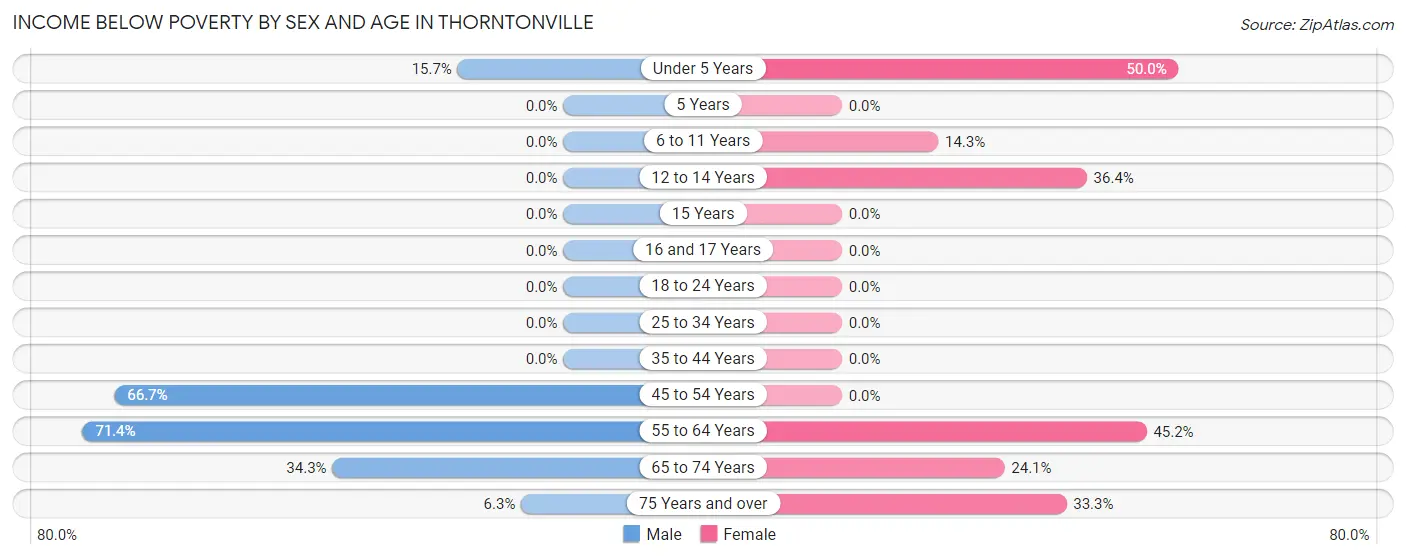
| Age Bracket | Male | Female |
| Under 5 Years | 8 (15.7%) | 10 (50.0%) |
| 5 Years | 0 (0.0%) | 0 (0.0%) |
| 6 to 11 Years | 0 (0.0%) | 5 (14.3%) |
| 12 to 14 Years | 0 (0.0%) | 4 (36.4%) |
| 15 Years | 0 (0.0%) | 0 (0.0%) |
| 16 and 17 Years | 0 (0.0%) | 0 (0.0%) |
| 18 to 24 Years | 0 (0.0%) | 0 (0.0%) |
| 25 to 34 Years | 0 (0.0%) | 0 (0.0%) |
| 35 to 44 Years | 0 (0.0%) | 0 (0.0%) |
| 45 to 54 Years | 6 (66.7%) | 0 (0.0%) |
| 55 to 64 Years | 10 (71.4%) | 19 (45.2%) |
| 65 to 74 Years | 12 (34.3%) | 7 (24.1%) |
| 75 Years and over | 1 (6.2%) | 7 (33.3%) |
| Total | 37 (10.8%) | 52 (18.6%) |
Income Above Poverty by Sex and Age in Thorntonville
According to the poverty statistics in Thorntonville, males aged 6 to 11 years and females aged 15 years are the age groups that are most secure financially, with 100.0% of males and 100.0% of females in these age groups living above the poverty line.
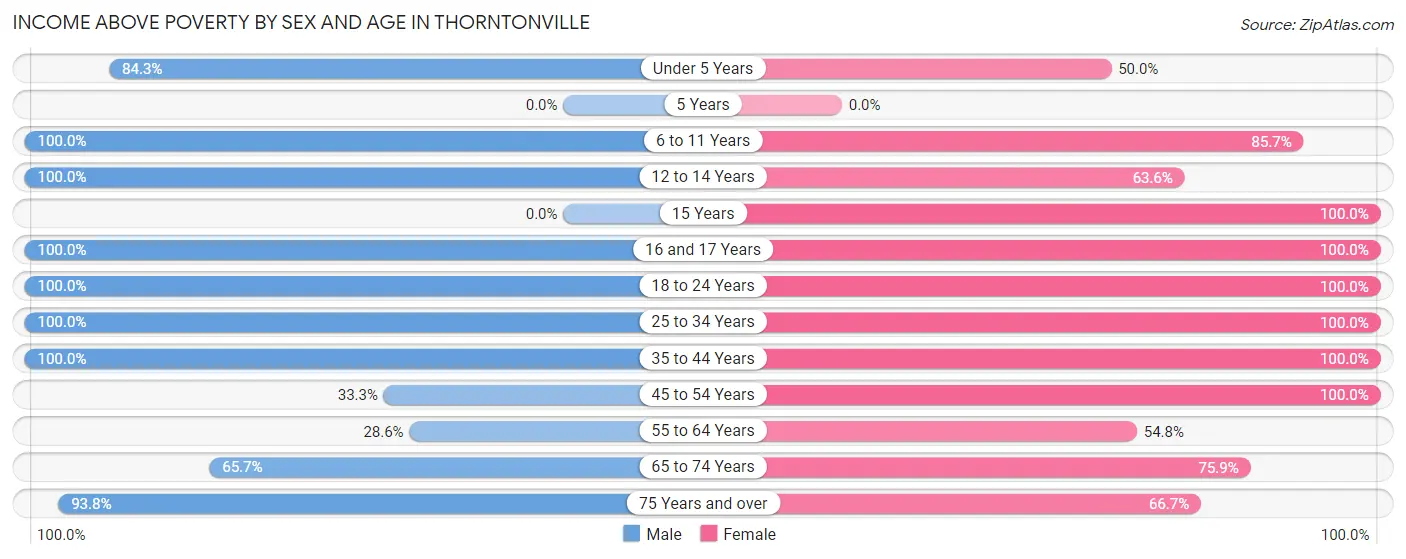
| Age Bracket | Male | Female |
| Under 5 Years | 43 (84.3%) | 10 (50.0%) |
| 5 Years | 0 (0.0%) | 0 (0.0%) |
| 6 to 11 Years | 28 (100.0%) | 30 (85.7%) |
| 12 to 14 Years | 30 (100.0%) | 7 (63.6%) |
| 15 Years | 0 (0.0%) | 10 (100.0%) |
| 16 and 17 Years | 4 (100.0%) | 13 (100.0%) |
| 18 to 24 Years | 35 (100.0%) | 28 (100.0%) |
| 25 to 34 Years | 34 (100.0%) | 4 (100.0%) |
| 35 to 44 Years | 86 (100.0%) | 65 (100.0%) |
| 45 to 54 Years | 3 (33.3%) | 2 (100.0%) |
| 55 to 64 Years | 4 (28.6%) | 23 (54.8%) |
| 65 to 74 Years | 23 (65.7%) | 22 (75.9%) |
| 75 Years and over | 15 (93.8%) | 14 (66.7%) |
| Total | 305 (89.2%) | 228 (81.4%) |
Income Below Poverty Among Married-Couple Families in Thorntonville
The poverty statistics for married-couple families in Thorntonville show that 20.8% or 25 of the total 120 families live below the poverty line. Families with 3 or 4 children have the highest poverty rate of 53.8%, comprising of 7 families. On the other hand, families with no children have the lowest poverty rate of 16.7%, which includes 6 families.
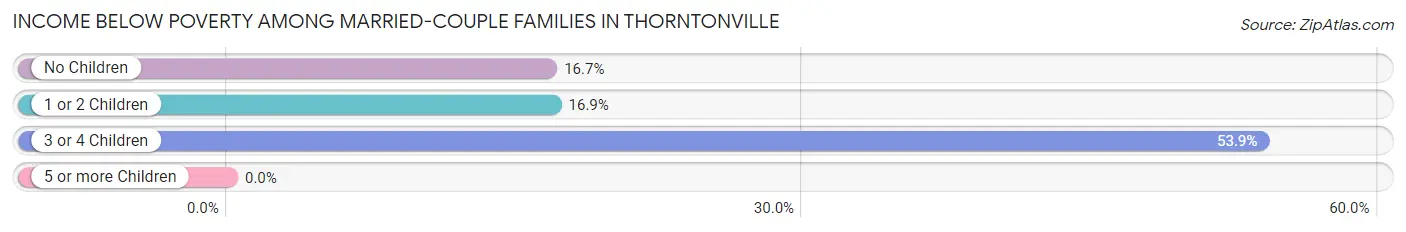
| Children | Above Poverty | Below Poverty |
| No Children | 30 (83.3%) | 6 (16.7%) |
| 1 or 2 Children | 59 (83.1%) | 12 (16.9%) |
| 3 or 4 Children | 6 (46.2%) | 7 (53.8%) |
| 5 or more Children | 0 (0.0%) | 0 (0.0%) |
| Total | 95 (79.2%) | 25 (20.8%) |
Income Below Poverty Among Single-Parent Households in Thorntonville
| Children | Single Father | Single Mother |
| No Children | 0 (0.0%) | 0 (0.0%) |
| 1 or 2 Children | 0 (0.0%) | 0 (0.0%) |
| 3 or 4 Children | 0 (0.0%) | 0 (0.0%) |
| 5 or more Children | 0 (0.0%) | 0 (0.0%) |
| Total | 0 (0.0%) | 0 (0.0%) |
Income Below Poverty Among Married-Couple vs Single-Parent Households in Thorntonville
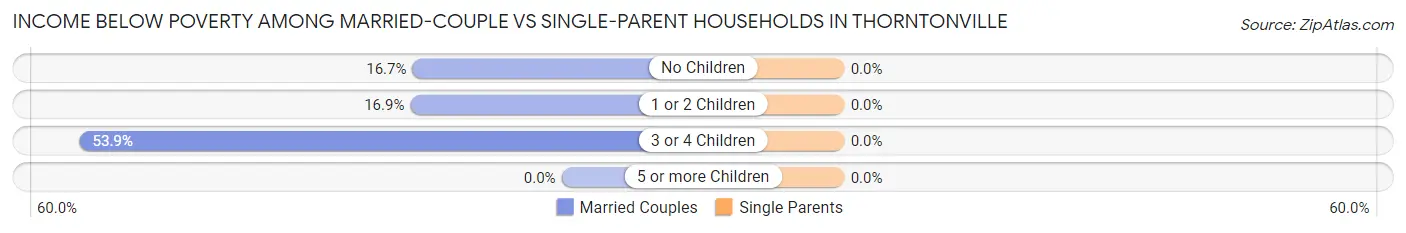
| Children | Married-Couple Families | Single-Parent Households |
| No Children | 6 (16.7%) | 0 (0.0%) |
| 1 or 2 Children | 12 (16.9%) | 0 (0.0%) |
| 3 or 4 Children | 7 (53.8%) | 0 (0.0%) |
| 5 or more Children | 0 (0.0%) | 0 (0.0%) |
| Total | 25 (20.8%) | 0 (0.0%) |
Race in Thorntonville
The most populous races in Thorntonville are White / Caucasian (482 | 77.5%), Hispanic or Latino (277 | 44.5%), and Some other Race (103 | 16.6%).
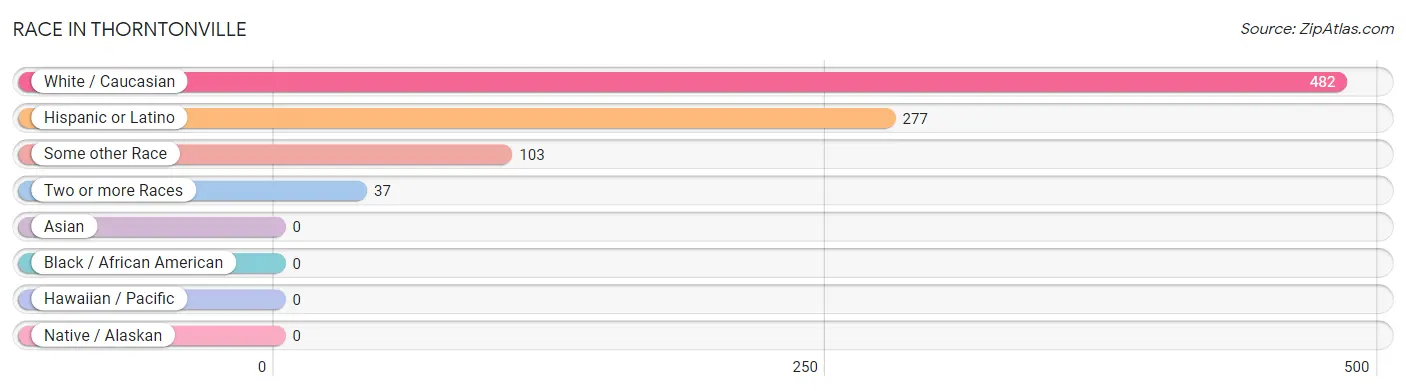
| Race | # Population | % Population |
| Asian | 0 | 0.0% |
| Black / African American | 0 | 0.0% |
| Hawaiian / Pacific | 0 | 0.0% |
| Hispanic or Latino | 277 | 44.5% |
| Native / Alaskan | 0 | 0.0% |
| White / Caucasian | 482 | 77.5% |
| Two or more Races | 37 | 5.9% |
| Some other Race | 103 | 16.6% |
| Total | 622 | 100.0% |
Ancestry in Thorntonville
The most populous ancestries reported in Thorntonville are Mexican (225 | 36.2%), English (31 | 5.0%), American (16 | 2.6%), Cherokee (16 | 2.6%), and Irish (9 | 1.5%), together accounting for 47.7% of all Thorntonville residents.
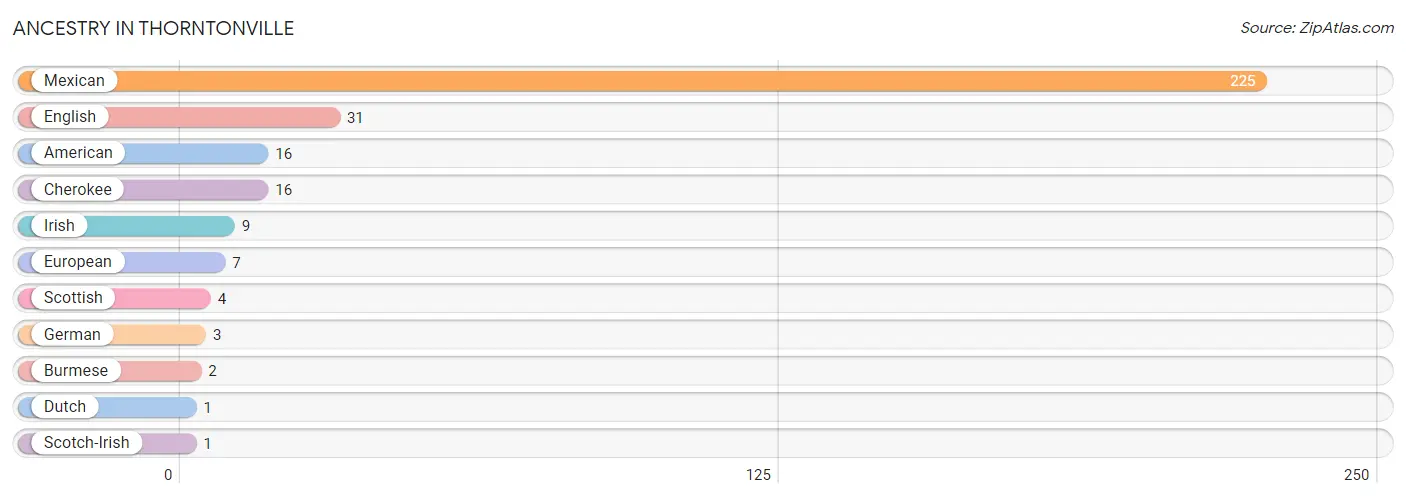
| Ancestry | # Population | % Population |
| American | 16 | 2.6% |
| Burmese | 2 | 0.3% |
| Cherokee | 16 | 2.6% |
| Dutch | 1 | 0.2% |
| English | 31 | 5.0% |
| European | 7 | 1.1% |
| German | 3 | 0.5% |
| Irish | 9 | 1.5% |
| Mexican | 225 | 36.2% |
| Scotch-Irish | 1 | 0.2% |
| Scottish | 4 | 0.6% | View All 11 Rows |
Immigrants in Thorntonville
The most numerous immigrant groups reported in Thorntonville came from Central America (43 | 6.9%), Latin America (43 | 6.9%), and Mexico (43 | 6.9%), together accounting for 20.7% of all Thorntonville residents.
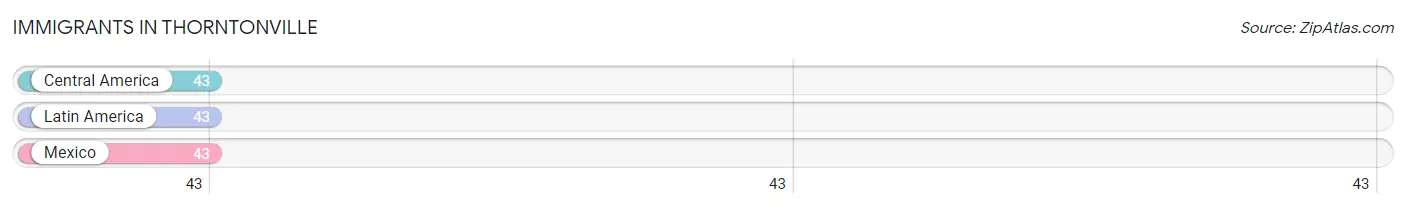
| Immigration Origin | # Population | % Population |
| Central America | 43 | 6.9% |
| Latin America | 43 | 6.9% |
| Mexico | 43 | 6.9% | View All 3 Rows |
Sex and Age in Thorntonville
Sex and Age in Thorntonville
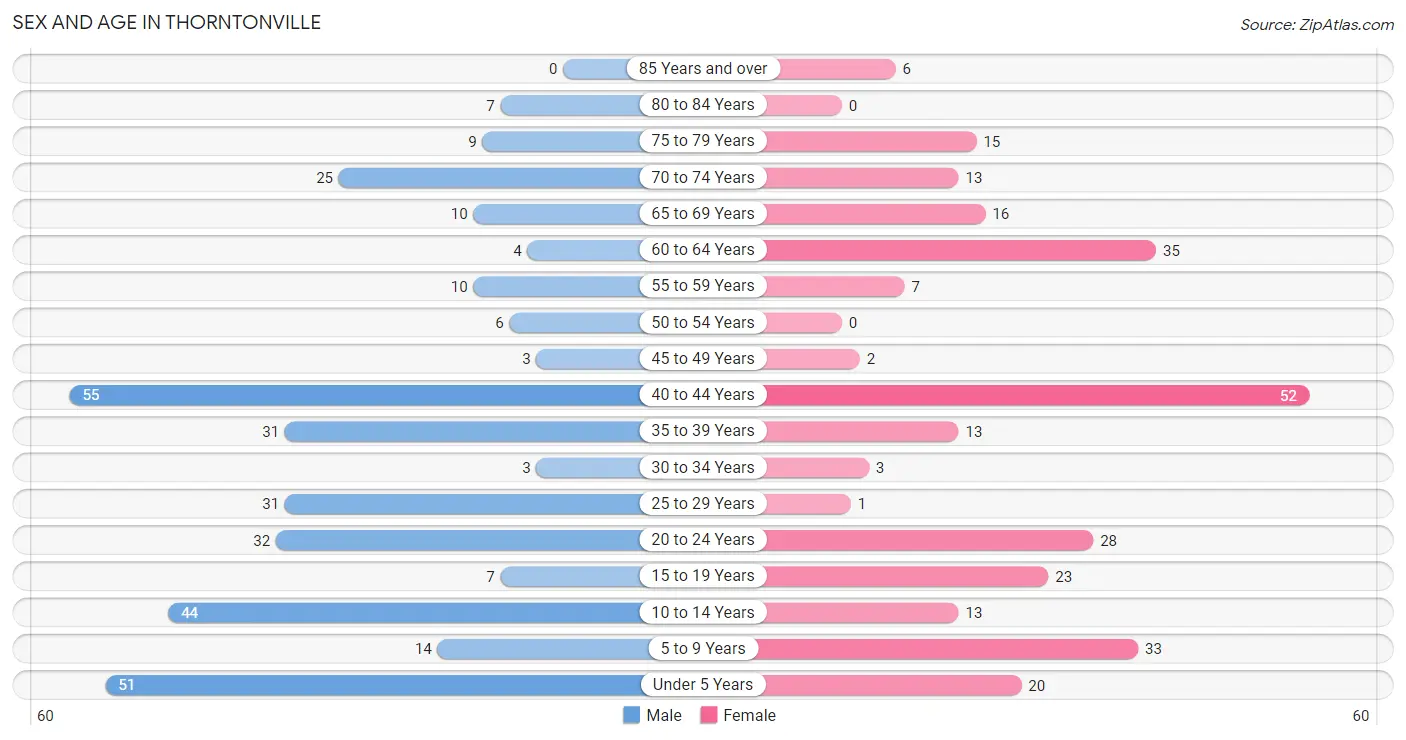
The most populous age groups in Thorntonville are 40 to 44 Years (55 | 16.1%) for men and 40 to 44 Years (52 | 18.6%) for women.
| Age Bracket | Male | Female |
| Under 5 Years | 51 (14.9%) | 20 (7.1%) |
| 5 to 9 Years | 14 (4.1%) | 33 (11.8%) |
| 10 to 14 Years | 44 (12.9%) | 13 (4.6%) |
| 15 to 19 Years | 7 (2.1%) | 23 (8.2%) |
| 20 to 24 Years | 32 (9.4%) | 28 (10.0%) |
| 25 to 29 Years | 31 (9.1%) | 1 (0.4%) |
| 30 to 34 Years | 3 (0.9%) | 3 (1.1%) |
| 35 to 39 Years | 31 (9.1%) | 13 (4.6%) |
| 40 to 44 Years | 55 (16.1%) | 52 (18.6%) |
| 45 to 49 Years | 3 (0.9%) | 2 (0.7%) |
| 50 to 54 Years | 6 (1.8%) | 0 (0.0%) |
| 55 to 59 Years | 10 (2.9%) | 7 (2.5%) |
| 60 to 64 Years | 4 (1.2%) | 35 (12.5%) |
| 65 to 69 Years | 10 (2.9%) | 16 (5.7%) |
| 70 to 74 Years | 25 (7.3%) | 13 (4.6%) |
| 75 to 79 Years | 9 (2.6%) | 15 (5.4%) |
| 80 to 84 Years | 7 (2.1%) | 0 (0.0%) |
| 85 Years and over | 0 (0.0%) | 6 (2.1%) |
| Total | 342 (100.0%) | 280 (100.0%) |
Families and Households in Thorntonville
Median Family Size in Thorntonville
The median family size in Thorntonville is 4.11 persons per family, with single male/father families (12 | 8.5%) accounting for the largest median family size of 5.75 persons per family. On the other hand, single female/mother families (9 | 6.4%) represent the smallest median family size with 2.78 persons per family.
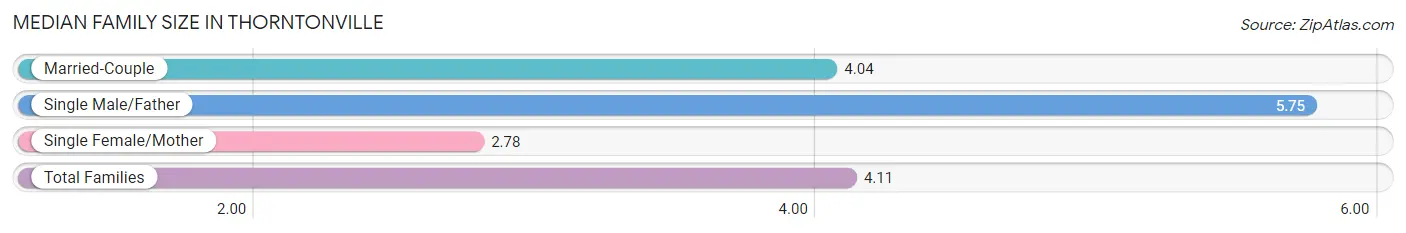
| Family Type | # Families | Family Size |
| Married-Couple | 120 (85.1%) | 4.04 |
| Single Male/Father | 12 (8.5%) | 5.75 |
| Single Female/Mother | 9 (6.4%) | 2.78 |
| Total Families | 141 (100.0%) | 4.11 |
Median Household Size in Thorntonville
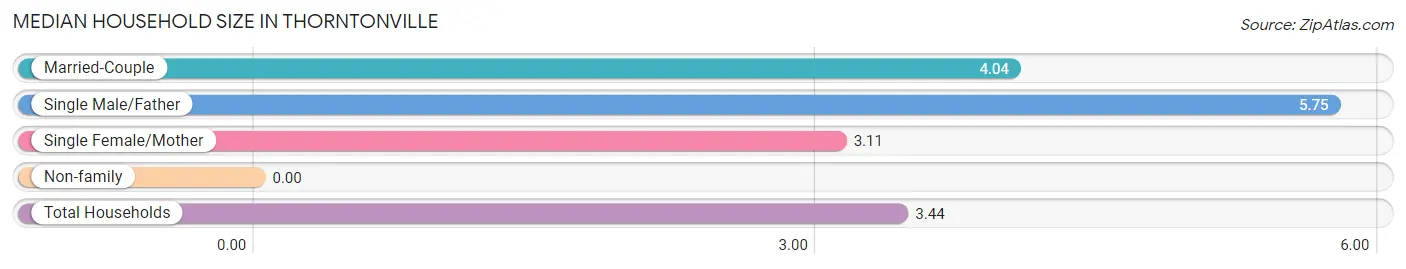
| Household Type | # Households | Household Size |
| Married-Couple | 120 (66.3%) | 4.04 |
| Single Male/Father | 12 (6.6%) | 5.75 |
| Single Female/Mother | 9 (5.0%) | 3.11 |
| Non-family | 40 (22.1%) | - |
| Total Households | 181 (100.0%) | 3.44 |
Household Size by Marriage Status in Thorntonville
Out of a total of 181 households in Thorntonville, 141 (77.9%) are family households, while 40 (22.1%) are nonfamily households. The most numerous type of family households are 2-person households, comprising 44, and the most common type of nonfamily households are 1-person households, comprising 40.
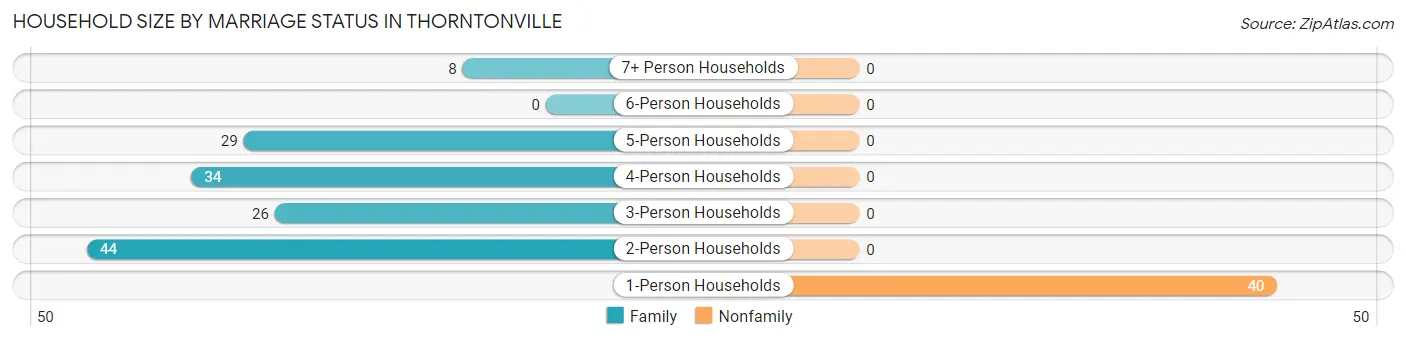
| Household Size | Family Households | Nonfamily Households |
| 1-Person Households | - | 40 (22.1%) |
| 2-Person Households | 44 (24.3%) | 0 (0.0%) |
| 3-Person Households | 26 (14.4%) | 0 (0.0%) |
| 4-Person Households | 34 (18.8%) | 0 (0.0%) |
| 5-Person Households | 29 (16.0%) | 0 (0.0%) |
| 6-Person Households | 0 (0.0%) | 0 (0.0%) |
| 7+ Person Households | 8 (4.4%) | 0 (0.0%) |
| Total | 141 (77.9%) | 40 (22.1%) |
Female Fertility in Thorntonville
Fertility by Age in Thorntonville
Average fertility rate in Thorntonville is 74.0 births per 1,000 women. Women in the age bracket of 35 to 50 years have the highest fertility rate with 134.0 births per 1,000 women. Women in the age bracket of 35 to 50 years acount for 100.0% of all women with births.
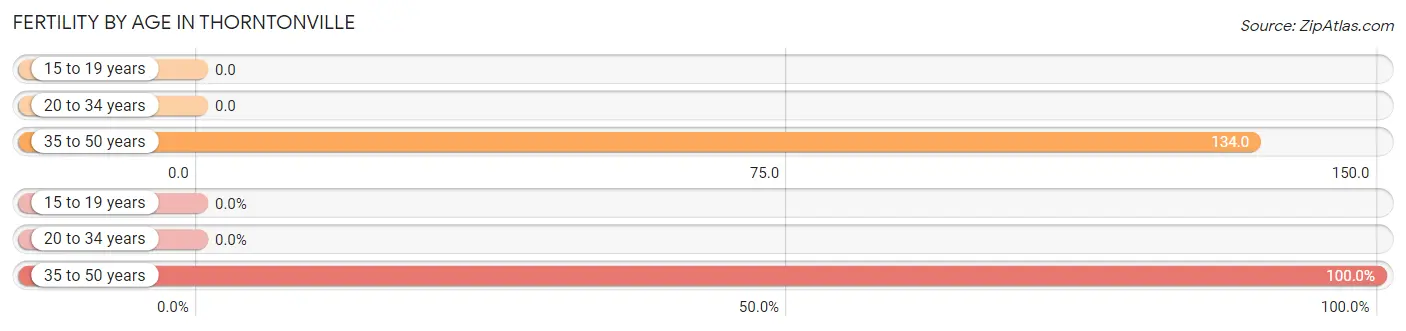
| Age Bracket | Women with Births | Births / 1,000 Women |
| 15 to 19 years | 0 (0.0%) | 0.0 |
| 20 to 34 years | 0 (0.0%) | 0.0 |
| 35 to 50 years | 9 (100.0%) | 134.0 |
| Total | 9 (100.0%) | 74.0 |
Fertility by Age by Marriage Status in Thorntonville
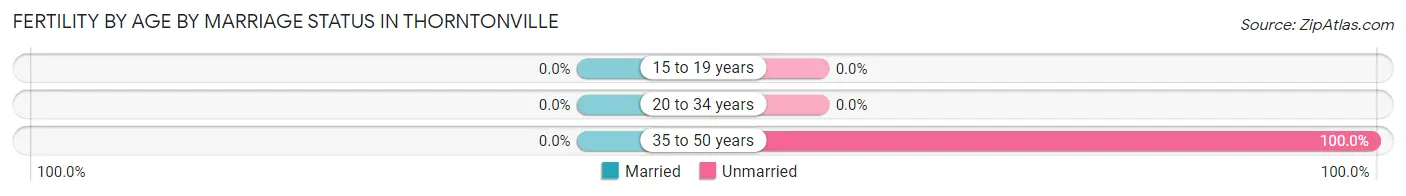
| Age Bracket | Married | Unmarried |
| 15 to 19 years | 0 (0.0%) | 0 (0.0%) |
| 20 to 34 years | 0 (0.0%) | 0 (0.0%) |
| 35 to 50 years | 0 (0.0%) | 9 (100.0%) |
| Total | 0 (0.0%) | 9 (100.0%) |
Fertility by Education in Thorntonville
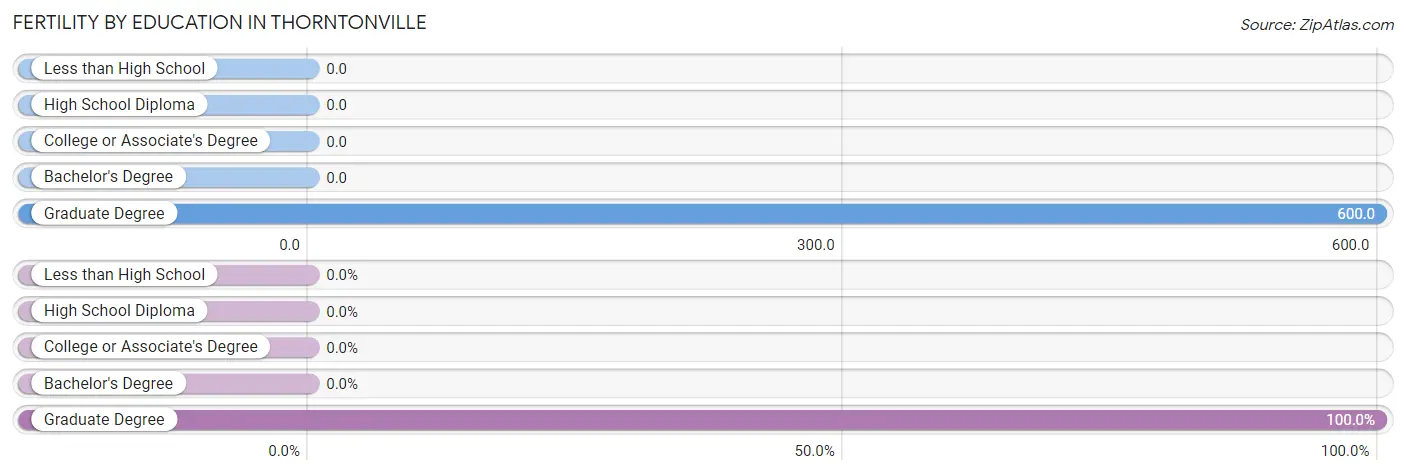
| Educational Attainment | Women with Births | Births / 1,000 Women |
| Less than High School | 0 (0.0%) | 0.0 |
| High School Diploma | 0 (0.0%) | 0.0 |
| College or Associate's Degree | 0 (0.0%) | 0.0 |
| Bachelor's Degree | 0 (0.0%) | 0.0 |
| Graduate Degree | 9 (100.0%) | 600.0 |
| Total | 9 (100.0%) | 74.0 |
Fertility by Education by Marriage Status in Thorntonville
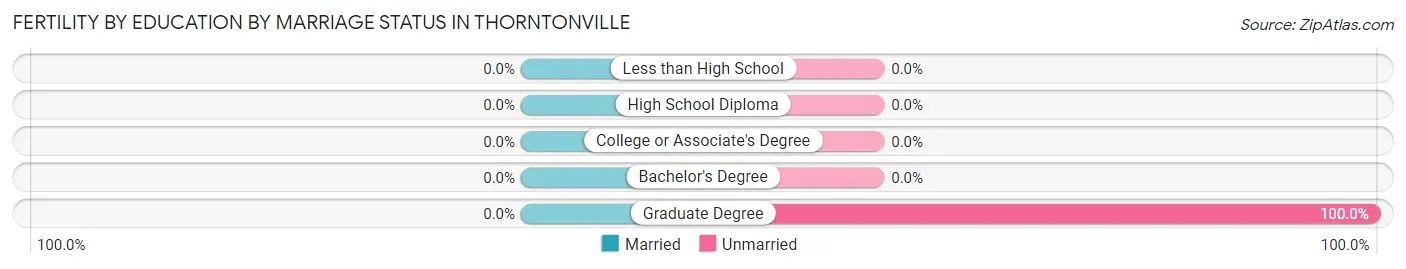
| Educational Attainment | Married | Unmarried |
| Less than High School | 0 (0.0%) | 0 (0.0%) |
| High School Diploma | 0 (0.0%) | 0 (0.0%) |
| College or Associate's Degree | 0 (0.0%) | 0 (0.0%) |
| Bachelor's Degree | 0 (0.0%) | 0 (0.0%) |
| Graduate Degree | 0 (0.0%) | 9 (100.0%) |
| Total | 0 (0.0%) | 9 (100.0%) |
Employment Characteristics in Thorntonville
Employment by Class of Employer in Thorntonville
Among the 271 employed individuals in Thorntonville, private company employees (199 | 73.4%), local government employees (36 | 13.3%), and not-for-profit organizations (18 | 6.6%) make up the most common classes of employment.
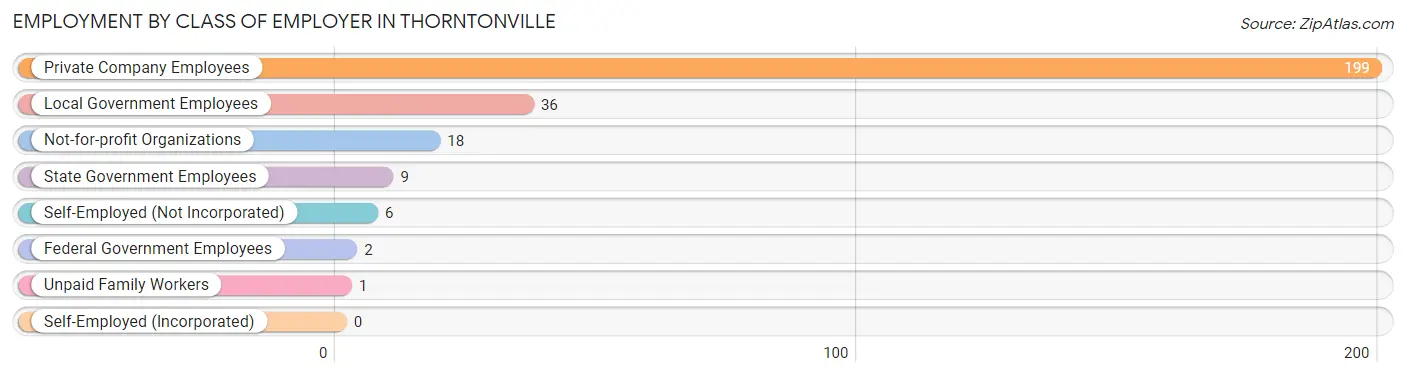
| Employer Class | # Employees | % Employees |
| Private Company Employees | 199 | 73.4% |
| Self-Employed (Incorporated) | 0 | 0.0% |
| Self-Employed (Not Incorporated) | 6 | 2.2% |
| Not-for-profit Organizations | 18 | 6.6% |
| Local Government Employees | 36 | 13.3% |
| State Government Employees | 9 | 3.3% |
| Federal Government Employees | 2 | 0.7% |
| Unpaid Family Workers | 1 | 0.4% |
| Total | 271 | 100.0% |
Employment Status by Age in Thorntonville
According to the labor force statistics for Thorntonville, out of the total population over 16 years of age (437), 63.2% or 276 individuals are in the labor force, with 1.8% or 5 of them unemployed. The age group with the highest labor force participation rate is 30 to 34 years, with 100.0% or 6 individuals in the labor force. Within the labor force, the 35 to 44 years age range has the highest percentage of unemployed individuals, with 3.5% or 5 of them being unemployed.
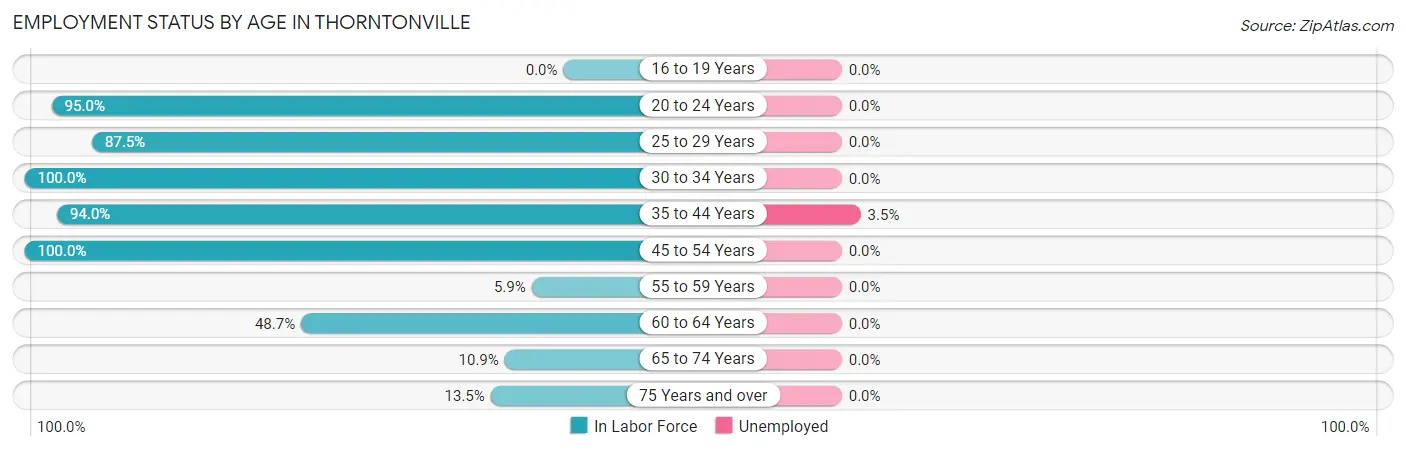
| Age Bracket | In Labor Force | Unemployed |
| 16 to 19 Years | 0 (0.0%) | 0 (0.0%) |
| 20 to 24 Years | 57 (95.0%) | 0 (0.0%) |
| 25 to 29 Years | 28 (87.5%) | 0 (0.0%) |
| 30 to 34 Years | 6 (100.0%) | 0 (0.0%) |
| 35 to 44 Years | 142 (94.0%) | 5 (3.5%) |
| 45 to 54 Years | 11 (100.0%) | 0 (0.0%) |
| 55 to 59 Years | 1 (5.9%) | 0 (0.0%) |
| 60 to 64 Years | 19 (48.7%) | 0 (0.0%) |
| 65 to 74 Years | 7 (10.9%) | 0 (0.0%) |
| 75 Years and over | 5 (13.5%) | 0 (0.0%) |
| Total | 276 (63.2%) | 5 (1.8%) |
Employment Status by Educational Attainment in Thorntonville
According to labor force statistics for Thorntonville, 80.9% of individuals (207) out of the total population between 25 and 64 years of age (256) are in the labor force, with 2.4% or 5 of them being unemployed. The group with the highest labor force participation rate are those with the educational attainment of bachelor's degree or higher, with 89.5% or 17 individuals in the labor force. Within the labor force, individuals with less than high school education have the highest percentage of unemployment, with 29.4% or 5 of them being unemployed.
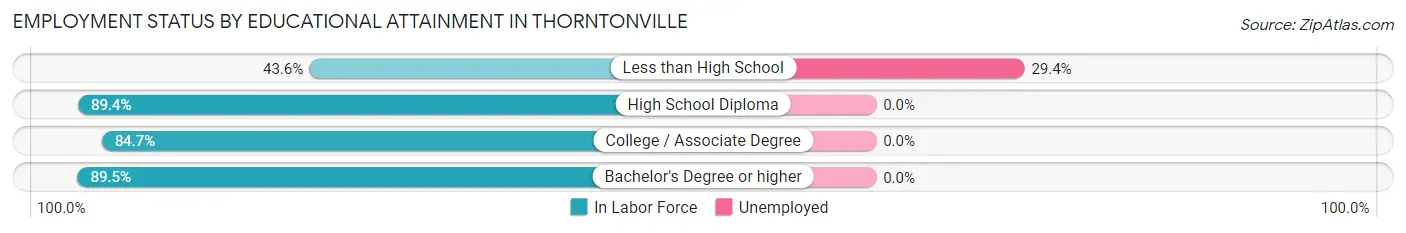
| Educational Attainment | In Labor Force | Unemployed |
| Less than High School | 17 (43.6%) | 11 (29.4%) |
| High School Diploma | 101 (89.4%) | 0 (0.0%) |
| College / Associate Degree | 72 (84.7%) | 0 (0.0%) |
| Bachelor's Degree or higher | 17 (89.5%) | 0 (0.0%) |
| Total | 207 (80.9%) | 6 (2.4%) |
Employment Occupations by Sex in Thorntonville
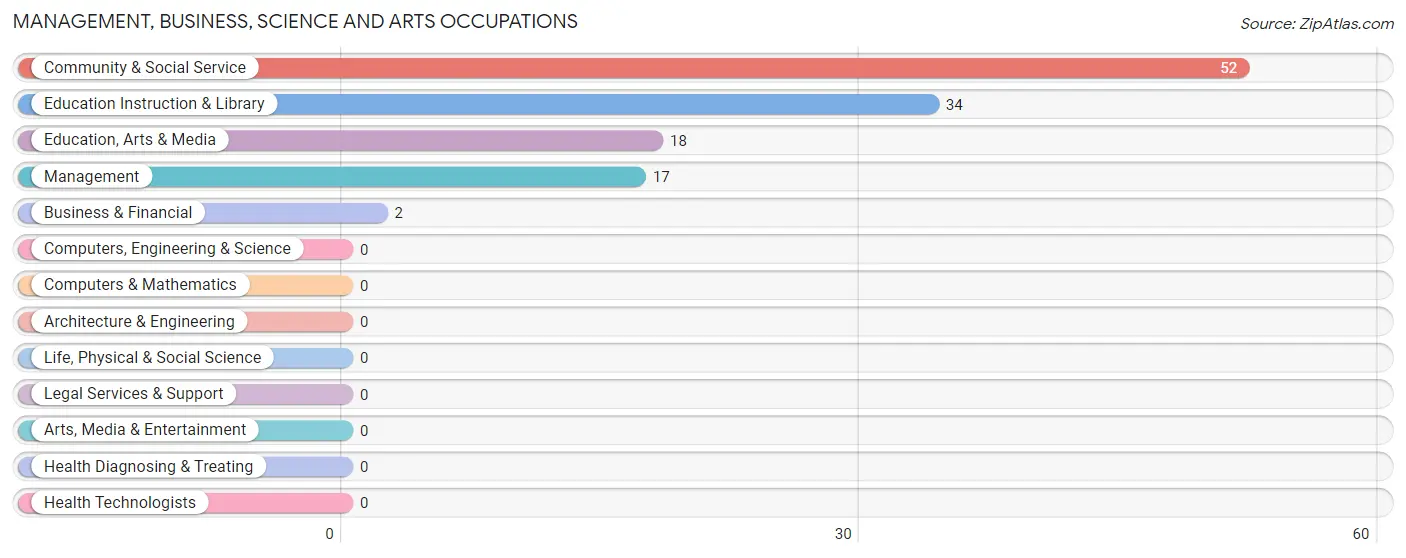
Management, Business, Science and Arts Occupations
The most common Management, Business, Science and Arts occupations in Thorntonville are Community & Social Service (52 | 19.2%), Education Instruction & Library (34 | 12.6%), Education, Arts & Media (18 | 6.6%), Management (17 | 6.3%), and Business & Financial (2 | 0.7%).
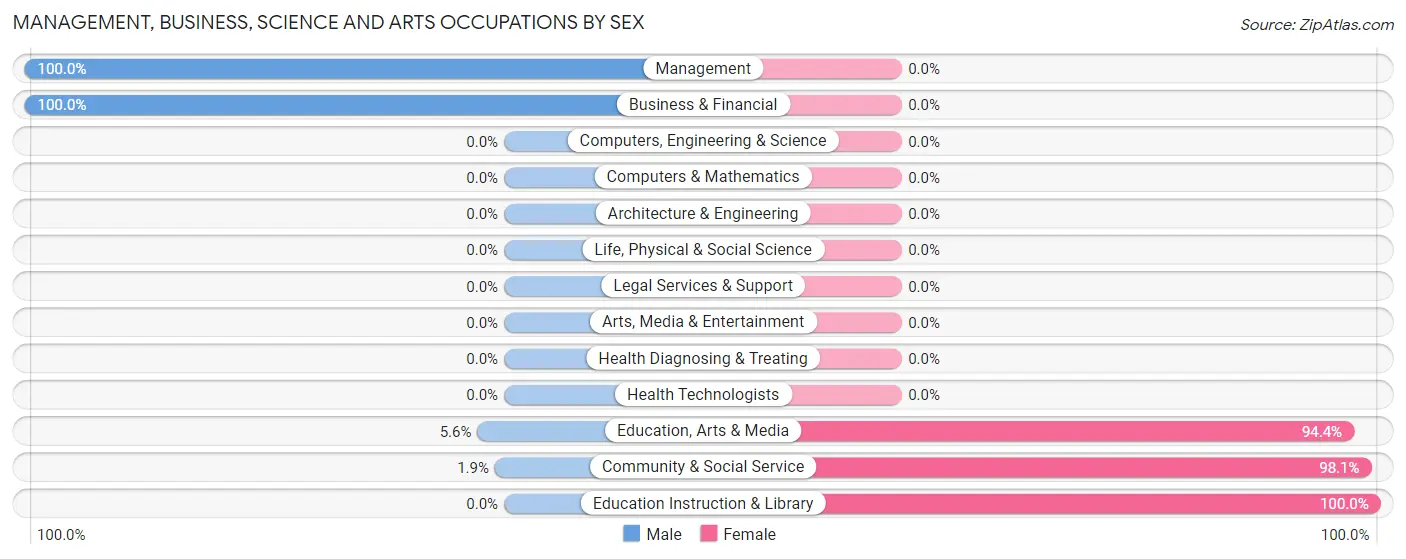
Management, Business, Science and Arts Occupations by Sex
Within the Management, Business, Science and Arts occupations in Thorntonville, the most male-oriented occupations are Management (100.0%), Business & Financial (100.0%), and Education, Arts & Media (5.6%), while the most female-oriented occupations are Education Instruction & Library (100.0%), Community & Social Service (98.1%), and Education, Arts & Media (94.4%).
| Occupation | Male | Female |
| Management | 17 (100.0%) | 0 (0.0%) |
| Business & Financial | 2 (100.0%) | 0 (0.0%) |
| Computers, Engineering & Science | 0 (0.0%) | 0 (0.0%) |
| Computers & Mathematics | 0 (0.0%) | 0 (0.0%) |
| Architecture & Engineering | 0 (0.0%) | 0 (0.0%) |
| Life, Physical & Social Science | 0 (0.0%) | 0 (0.0%) |
| Community & Social Service | 1 (1.9%) | 51 (98.1%) |
| Education, Arts & Media | 1 (5.6%) | 17 (94.4%) |
| Legal Services & Support | 0 (0.0%) | 0 (0.0%) |
| Education Instruction & Library | 0 (0.0%) | 34 (100.0%) |
| Arts, Media & Entertainment | 0 (0.0%) | 0 (0.0%) |
| Health Diagnosing & Treating | 0 (0.0%) | 0 (0.0%) |
| Health Technologists | 0 (0.0%) | 0 (0.0%) |
| Total (Category) | 20 (28.2%) | 51 (71.8%) |
| Total (Overall) | 154 (56.8%) | 117 (43.2%) |
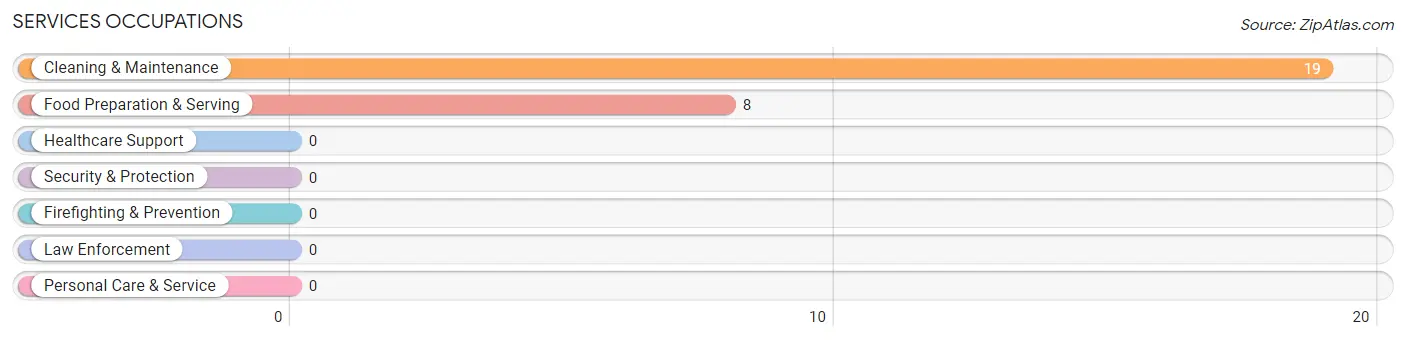
Services Occupations
The most common Services occupations in Thorntonville are Cleaning & Maintenance (19 | 7.0%), and Food Preparation & Serving (8 | 2.9%).
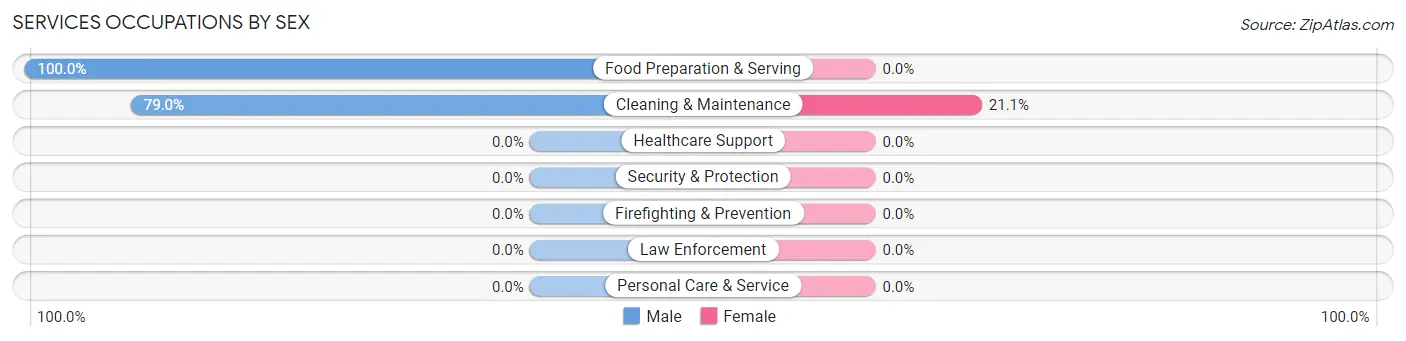
Services Occupations by Sex
| Occupation | Male | Female |
| Healthcare Support | 0 (0.0%) | 0 (0.0%) |
| Security & Protection | 0 (0.0%) | 0 (0.0%) |
| Firefighting & Prevention | 0 (0.0%) | 0 (0.0%) |
| Law Enforcement | 0 (0.0%) | 0 (0.0%) |
| Food Preparation & Serving | 8 (100.0%) | 0 (0.0%) |
| Cleaning & Maintenance | 15 (78.9%) | 4 (21.0%) |
| Personal Care & Service | 0 (0.0%) | 0 (0.0%) |
| Total (Category) | 23 (85.2%) | 4 (14.8%) |
| Total (Overall) | 154 (56.8%) | 117 (43.2%) |
Sales and Office Occupations
The most common Sales and Office occupations in Thorntonville are Office & Administration (56 | 20.7%), and Sales & Related (13 | 4.8%).
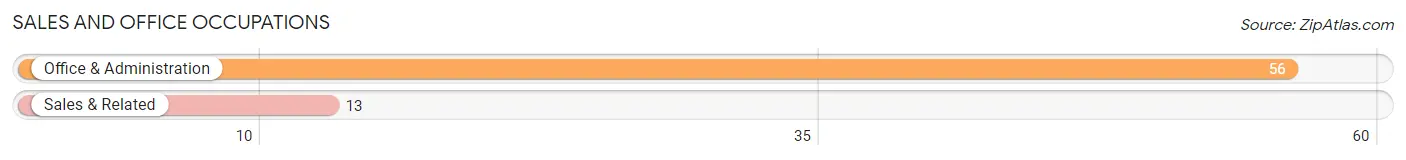
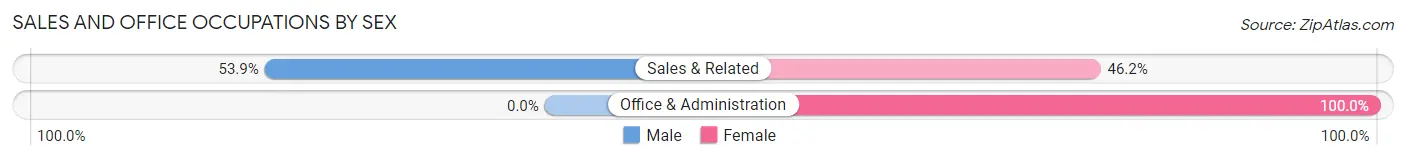
Sales and Office Occupations by Sex
| Occupation | Male | Female |
| Sales & Related | 7 (53.8%) | 6 (46.2%) |
| Office & Administration | 0 (0.0%) | 56 (100.0%) |
| Total (Category) | 7 (10.1%) | 62 (89.9%) |
| Total (Overall) | 154 (56.8%) | 117 (43.2%) |
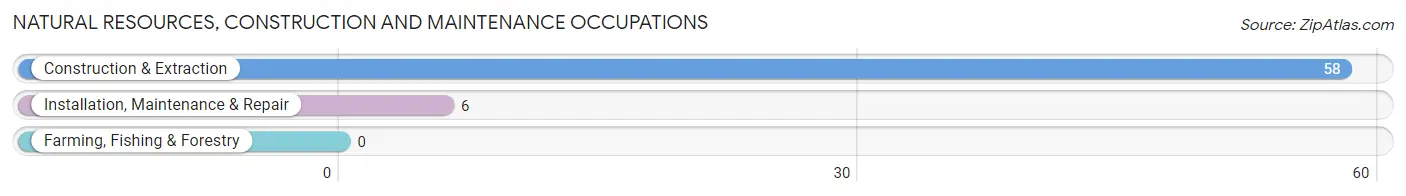
Natural Resources, Construction and Maintenance Occupations
The most common Natural Resources, Construction and Maintenance occupations in Thorntonville are Construction & Extraction (58 | 21.4%), and Installation, Maintenance & Repair (6 | 2.2%).
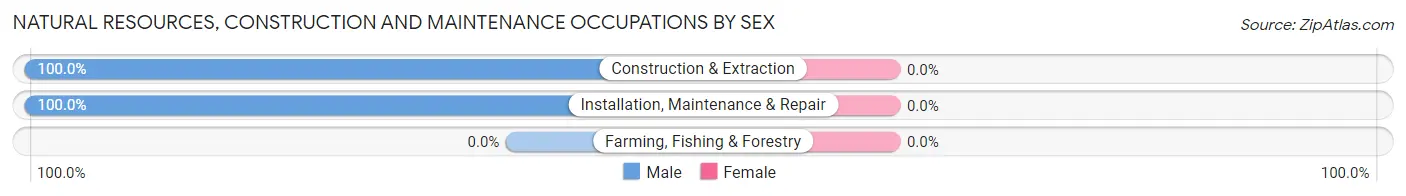
Natural Resources, Construction and Maintenance Occupations by Sex
| Occupation | Male | Female |
| Farming, Fishing & Forestry | 0 (0.0%) | 0 (0.0%) |
| Construction & Extraction | 58 (100.0%) | 0 (0.0%) |
| Installation, Maintenance & Repair | 6 (100.0%) | 0 (0.0%) |
| Total (Category) | 64 (100.0%) | 0 (0.0%) |
| Total (Overall) | 154 (56.8%) | 117 (43.2%) |
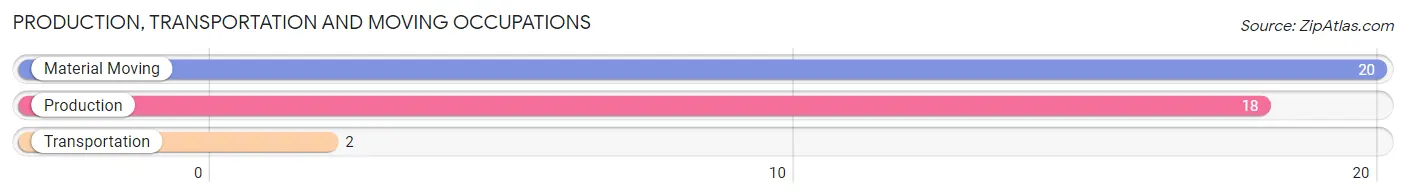
Production, Transportation and Moving Occupations
The most common Production, Transportation and Moving occupations in Thorntonville are Material Moving (20 | 7.4%), Production (18 | 6.6%), and Transportation (2 | 0.7%).
Production, Transportation and Moving Occupations by Sex
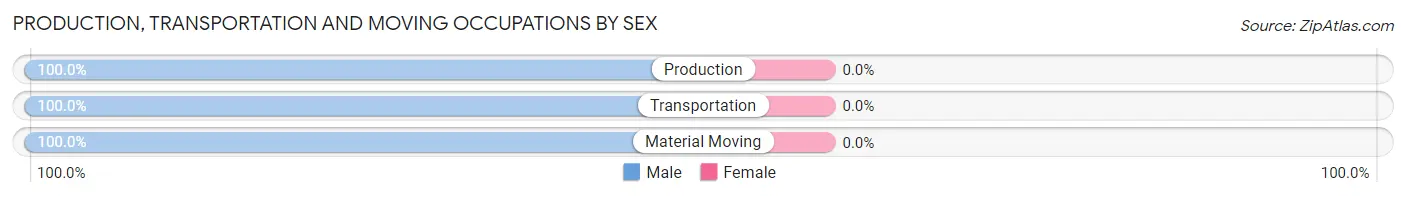
| Occupation | Male | Female |
| Production | 18 (100.0%) | 0 (0.0%) |
| Transportation | 2 (100.0%) | 0 (0.0%) |
| Material Moving | 20 (100.0%) | 0 (0.0%) |
| Total (Category) | 40 (100.0%) | 0 (0.0%) |
| Total (Overall) | 154 (56.8%) | 117 (43.2%) |
Employment Industries by Sex in Thorntonville
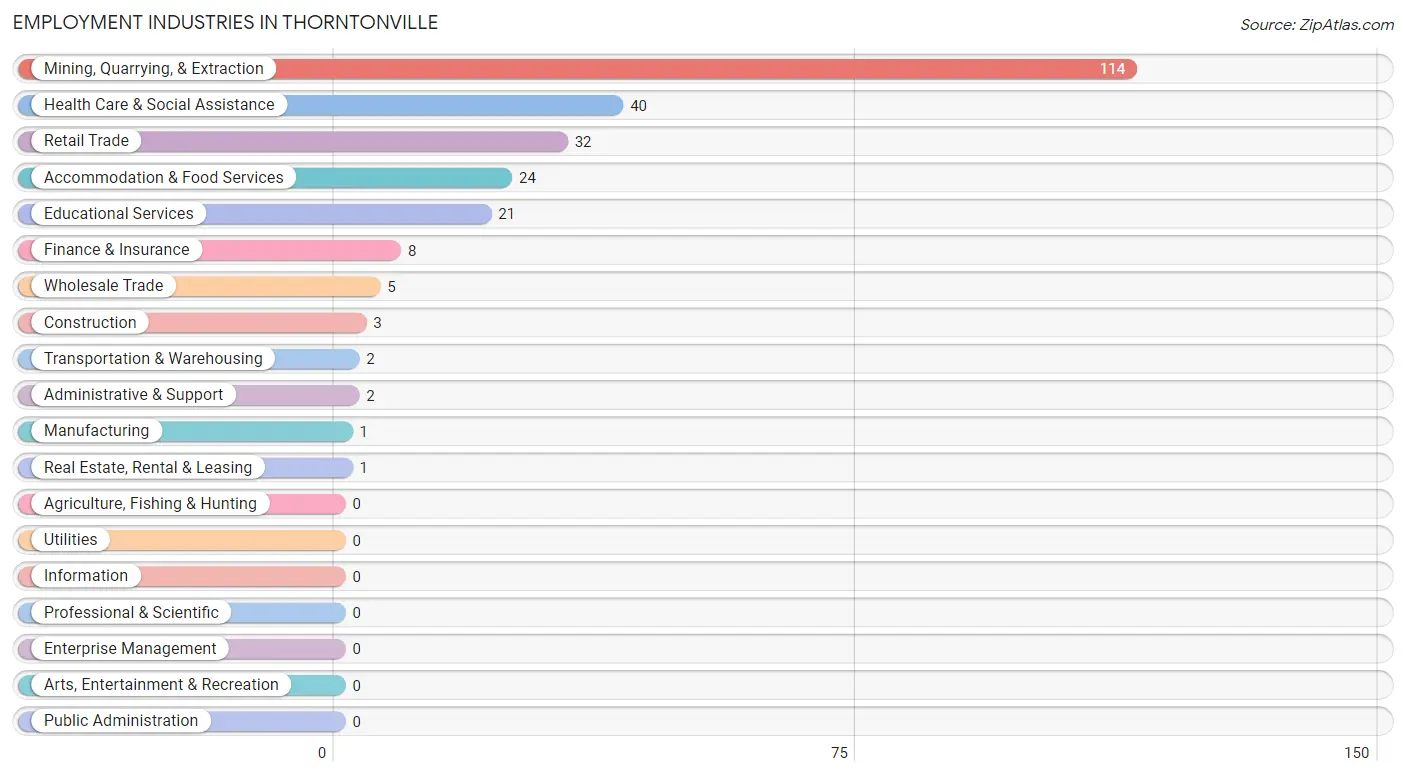
Employment Industries in Thorntonville
The major employment industries in Thorntonville include Mining, Quarrying, & Extraction (114 | 42.1%), Health Care & Social Assistance (40 | 14.8%), Retail Trade (32 | 11.8%), Accommodation & Food Services (24 | 8.9%), and Educational Services (21 | 7.7%).
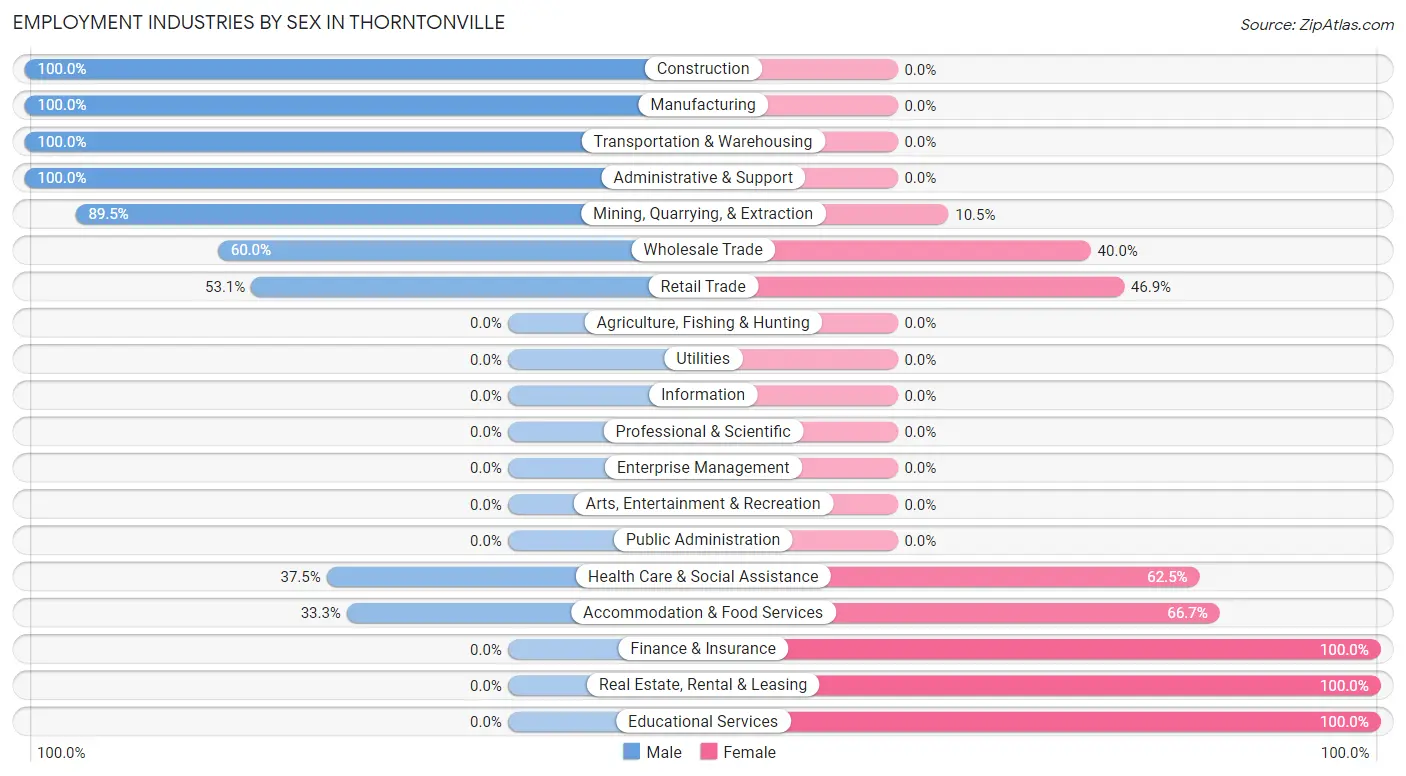
Employment Industries by Sex in Thorntonville
The Thorntonville industries that see more men than women are Construction (100.0%), Manufacturing (100.0%), and Transportation & Warehousing (100.0%), whereas the industries that tend to have a higher number of women are Finance & Insurance (100.0%), Real Estate, Rental & Leasing (100.0%), and Educational Services (100.0%).
| Industry | Male | Female |
| Agriculture, Fishing & Hunting | 0 (0.0%) | 0 (0.0%) |
| Mining, Quarrying, & Extraction | 102 (89.5%) | 12 (10.5%) |
| Construction | 3 (100.0%) | 0 (0.0%) |
| Manufacturing | 1 (100.0%) | 0 (0.0%) |
| Wholesale Trade | 3 (60.0%) | 2 (40.0%) |
| Retail Trade | 17 (53.1%) | 15 (46.9%) |
| Transportation & Warehousing | 2 (100.0%) | 0 (0.0%) |
| Utilities | 0 (0.0%) | 0 (0.0%) |
| Information | 0 (0.0%) | 0 (0.0%) |
| Finance & Insurance | 0 (0.0%) | 8 (100.0%) |
| Real Estate, Rental & Leasing | 0 (0.0%) | 1 (100.0%) |
| Professional & Scientific | 0 (0.0%) | 0 (0.0%) |
| Enterprise Management | 0 (0.0%) | 0 (0.0%) |
| Administrative & Support | 2 (100.0%) | 0 (0.0%) |
| Educational Services | 0 (0.0%) | 21 (100.0%) |
| Health Care & Social Assistance | 15 (37.5%) | 25 (62.5%) |
| Arts, Entertainment & Recreation | 0 (0.0%) | 0 (0.0%) |
| Accommodation & Food Services | 8 (33.3%) | 16 (66.7%) |
| Public Administration | 0 (0.0%) | 0 (0.0%) |
| Total | 154 (56.8%) | 117 (43.2%) |
Education in Thorntonville
School Enrollment in Thorntonville
The most common levels of schooling among the 180 students in Thorntonville are elementary school (63 | 35.0%), middle school (41 | 22.8%), and nursery / preschool (37 | 20.6%).
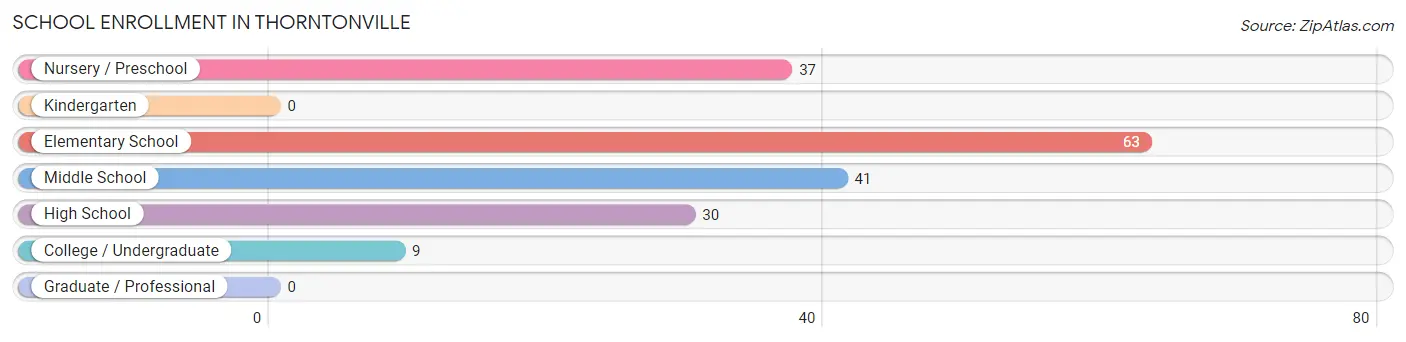
| School Level | # Students | % Students |
| Nursery / Preschool | 37 | 20.6% |
| Kindergarten | 0 | 0.0% |
| Elementary School | 63 | 35.0% |
| Middle School | 41 | 22.8% |
| High School | 30 | 16.7% |
| College / Undergraduate | 9 | 5.0% |
| Graduate / Professional | 0 | 0.0% |
| Total | 180 | 100.0% |
School Enrollment by Age by Funding Source in Thorntonville
Out of a total of 180 students who are enrolled in schools in Thorntonville, 69 (38.3%) attend a private institution, while the remaining 111 (61.7%) are enrolled in public schools. The age group of 3 to 4 year olds has the highest likelihood of being enrolled in private schools, with 31 (83.8% in the age bracket) enrolled. Conversely, the age group of 18 to 19 year olds has the lowest likelihood of being enrolled in a private school, with 3 (100.0% in the age bracket) attending a public institution.
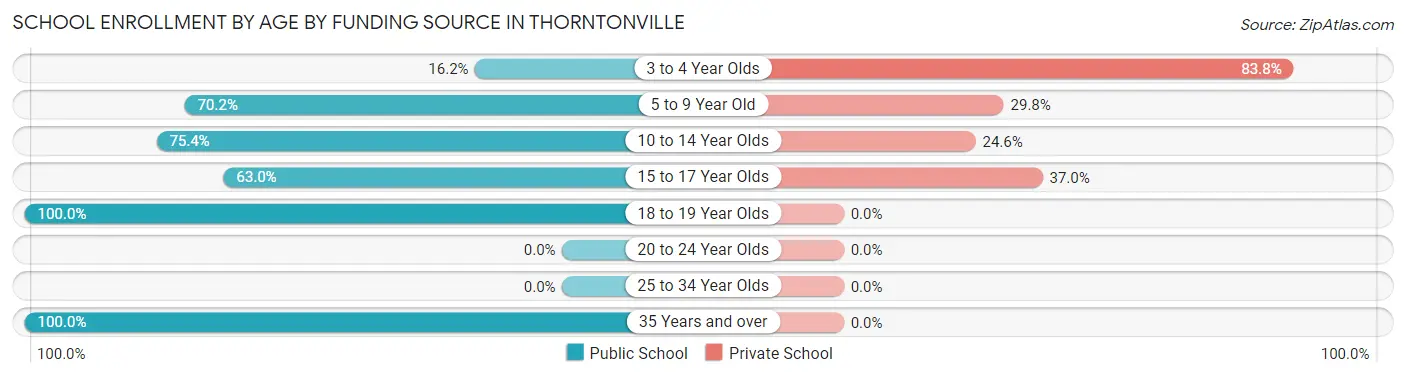
| Age Bracket | Public School | Private School |
| 3 to 4 Year Olds | 6 (16.2%) | 31 (83.8%) |
| 5 to 9 Year Old | 33 (70.2%) | 14 (29.8%) |
| 10 to 14 Year Olds | 43 (75.4%) | 14 (24.6%) |
| 15 to 17 Year Olds | 17 (63.0%) | 10 (37.0%) |
| 18 to 19 Year Olds | 3 (100.0%) | 0 (0.0%) |
| 20 to 24 Year Olds | 0 (0.0%) | 0 (0.0%) |
| 25 to 34 Year Olds | 0 (0.0%) | 0 (0.0%) |
| 35 Years and over | 9 (100.0%) | 0 (0.0%) |
| Total | 111 (61.7%) | 69 (38.3%) |
Educational Attainment by Field of Study in Thorntonville
Business (11 | 35.5%), education (6 | 19.4%), arts & humanities (6 | 19.4%), bio, nature & agricultural (2 | 6.5%), and physical & health sciences (2 | 6.5%) are the most common fields of study among 31 individuals in Thorntonville who have obtained a bachelor's degree or higher.
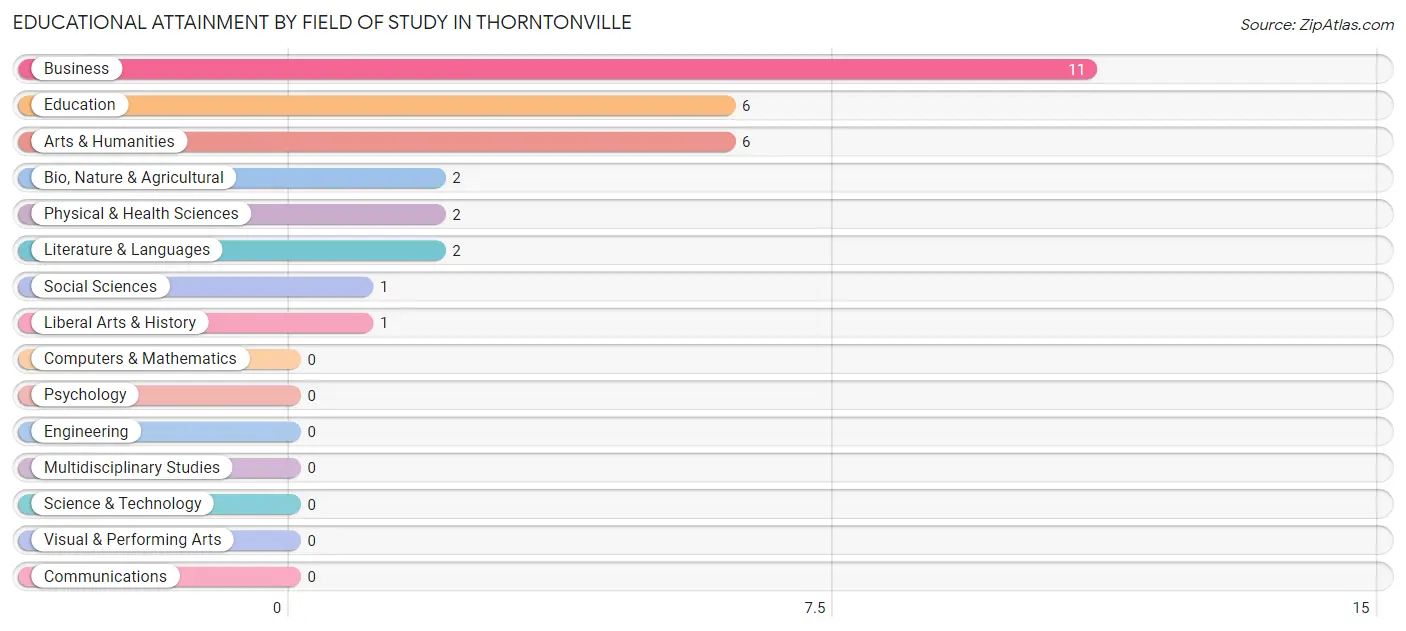
| Field of Study | # Graduates | % Graduates |
| Computers & Mathematics | 0 | 0.0% |
| Bio, Nature & Agricultural | 2 | 6.5% |
| Physical & Health Sciences | 2 | 6.5% |
| Psychology | 0 | 0.0% |
| Social Sciences | 1 | 3.2% |
| Engineering | 0 | 0.0% |
| Multidisciplinary Studies | 0 | 0.0% |
| Science & Technology | 0 | 0.0% |
| Business | 11 | 35.5% |
| Education | 6 | 19.4% |
| Literature & Languages | 2 | 6.5% |
| Liberal Arts & History | 1 | 3.2% |
| Visual & Performing Arts | 0 | 0.0% |
| Communications | 0 | 0.0% |
| Arts & Humanities | 6 | 19.4% |
| Total | 31 | 100.0% |
Transportation & Commute in Thorntonville
Vehicle Availability by Sex in Thorntonville
The most prevalent vehicle ownership categories in Thorntonville are males with 3 vehicles (60, accounting for 39.0%) and females with 3 vehicles (24, making up 51.3%).
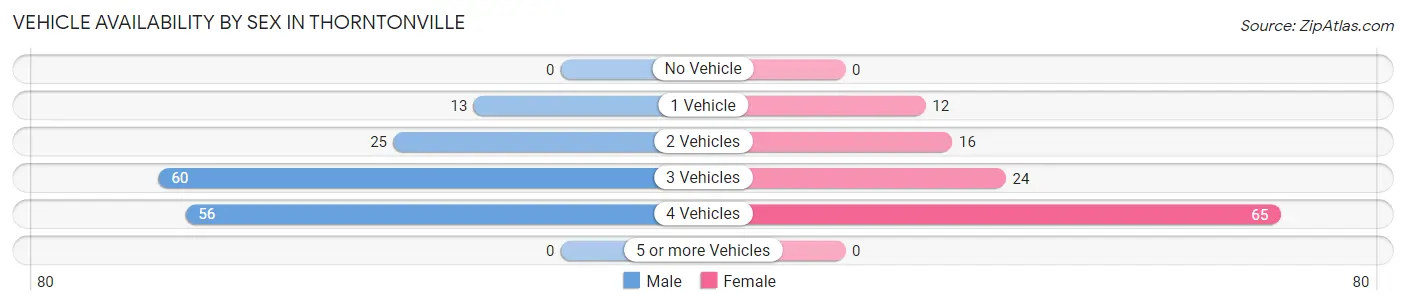
| Vehicles Available | Male | Female |
| No Vehicle | 0 (0.0%) | 0 (0.0%) |
| 1 Vehicle | 13 (8.4%) | 12 (10.3%) |
| 2 Vehicles | 25 (16.2%) | 16 (13.7%) |
| 3 Vehicles | 60 (39.0%) | 24 (20.5%) |
| 4 Vehicles | 56 (36.4%) | 65 (55.6%) |
| 5 or more Vehicles | 0 (0.0%) | 0 (0.0%) |
| Total | 154 (100.0%) | 117 (100.0%) |
Commute Time in Thorntonville
The most frequently occuring commute durations in Thorntonville are 5 to 9 minutes (84 commuters, 31.0%), 10 to 14 minutes (48 commuters, 17.7%), and 30 to 34 minutes (31 commuters, 11.4%).
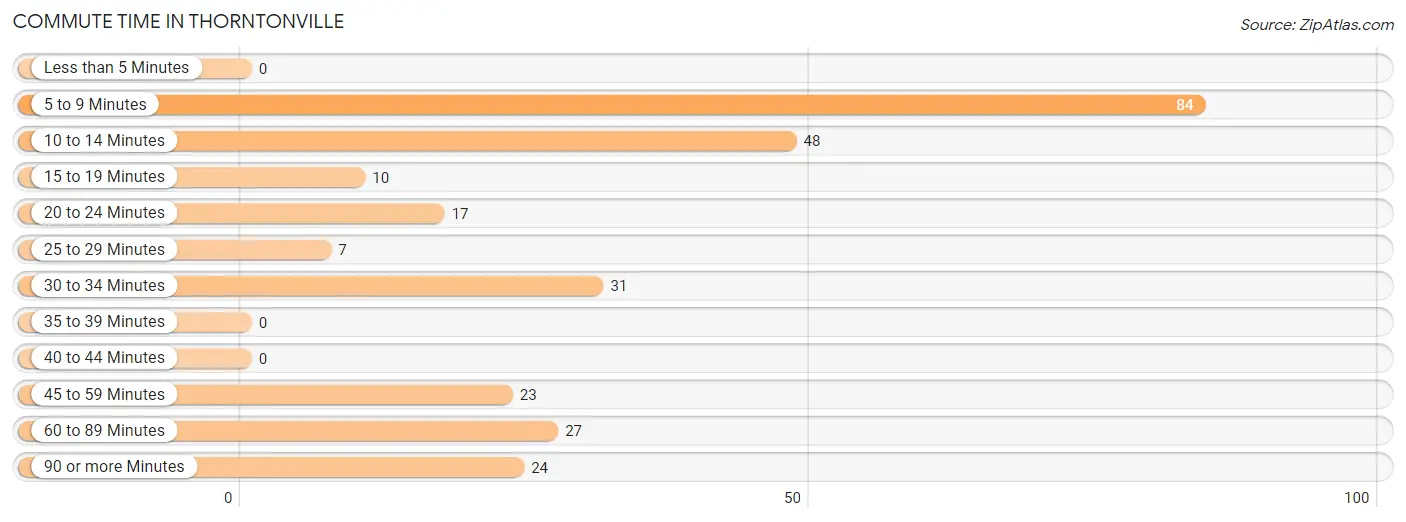
| Commute Time | # Commuters | % Commuters |
| Less than 5 Minutes | 0 | 0.0% |
| 5 to 9 Minutes | 84 | 31.0% |
| 10 to 14 Minutes | 48 | 17.7% |
| 15 to 19 Minutes | 10 | 3.7% |
| 20 to 24 Minutes | 17 | 6.3% |
| 25 to 29 Minutes | 7 | 2.6% |
| 30 to 34 Minutes | 31 | 11.4% |
| 35 to 39 Minutes | 0 | 0.0% |
| 40 to 44 Minutes | 0 | 0.0% |
| 45 to 59 Minutes | 23 | 8.5% |
| 60 to 89 Minutes | 27 | 10.0% |
| 90 or more Minutes | 24 | 8.9% |
Commute Time by Sex in Thorntonville
The most common commute times in Thorntonville are 30 to 34 minutes (31 commuters, 20.1%) for males and 5 to 9 minutes (61 commuters, 52.1%) for females.
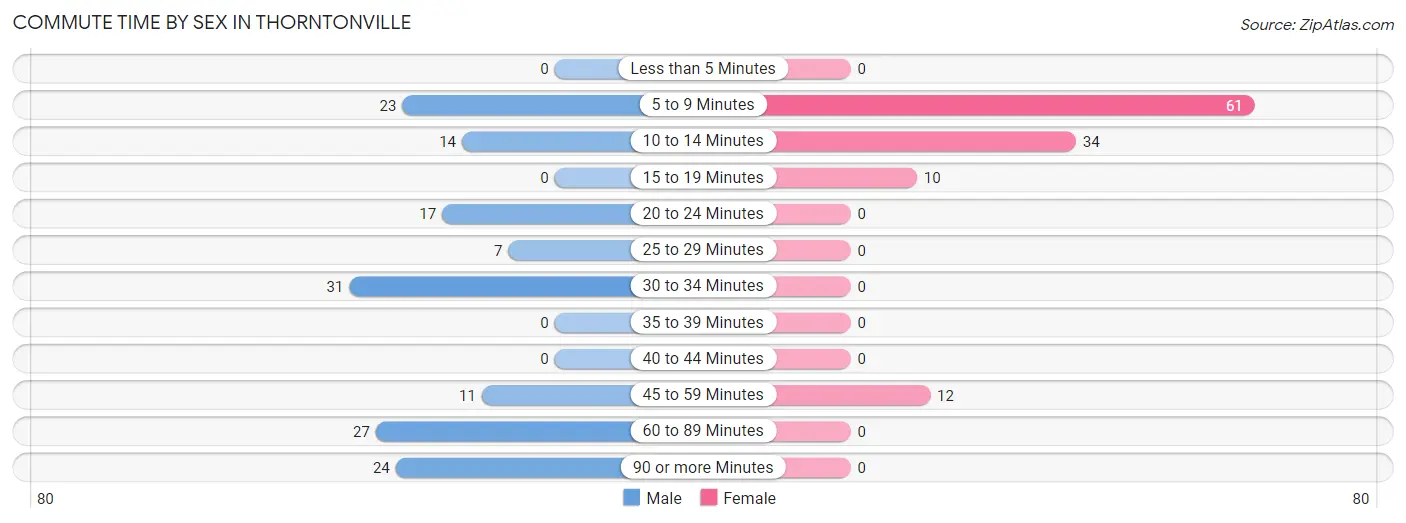
| Commute Time | Male | Female |
| Less than 5 Minutes | 0 (0.0%) | 0 (0.0%) |
| 5 to 9 Minutes | 23 (14.9%) | 61 (52.1%) |
| 10 to 14 Minutes | 14 (9.1%) | 34 (29.1%) |
| 15 to 19 Minutes | 0 (0.0%) | 10 (8.6%) |
| 20 to 24 Minutes | 17 (11.0%) | 0 (0.0%) |
| 25 to 29 Minutes | 7 (4.5%) | 0 (0.0%) |
| 30 to 34 Minutes | 31 (20.1%) | 0 (0.0%) |
| 35 to 39 Minutes | 0 (0.0%) | 0 (0.0%) |
| 40 to 44 Minutes | 0 (0.0%) | 0 (0.0%) |
| 45 to 59 Minutes | 11 (7.1%) | 12 (10.3%) |
| 60 to 89 Minutes | 27 (17.5%) | 0 (0.0%) |
| 90 or more Minutes | 24 (15.6%) | 0 (0.0%) |
Time of Departure to Work by Sex in Thorntonville
The most frequent times of departure to work in Thorntonville are 6:30 AM to 6:59 AM (44, 28.6%) for males and 7:30 AM to 7:59 AM (41, 35.0%) for females.
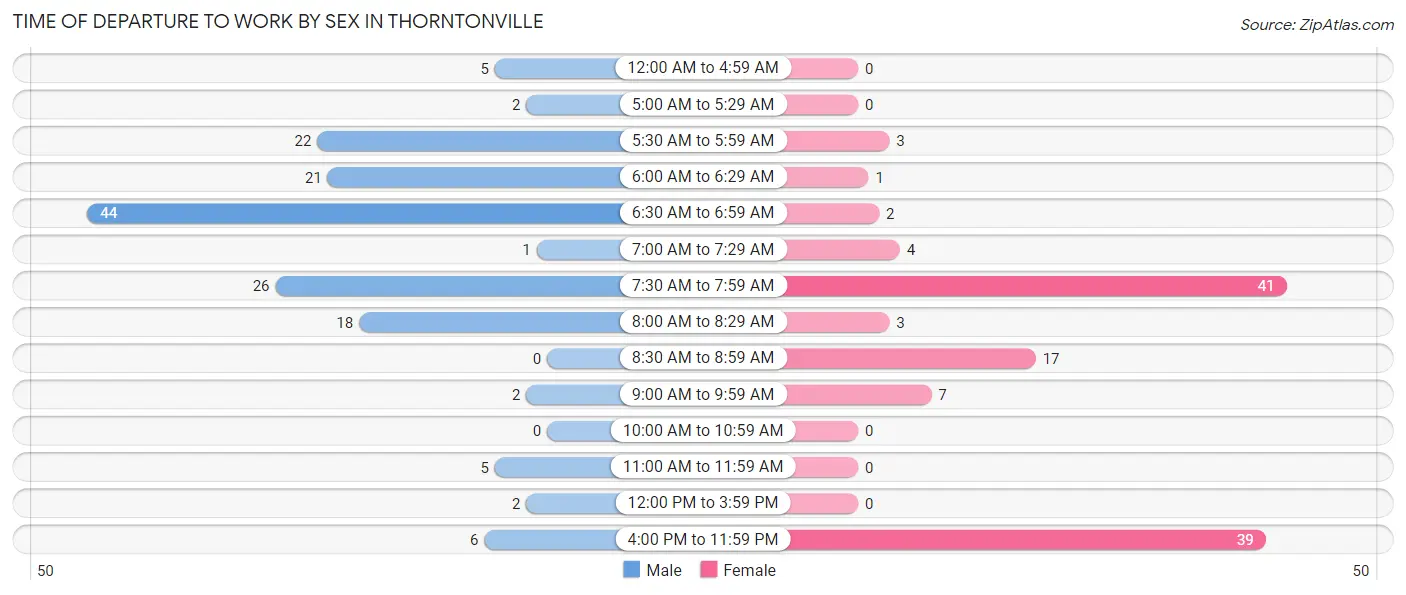
| Time of Departure | Male | Female |
| 12:00 AM to 4:59 AM | 5 (3.3%) | 0 (0.0%) |
| 5:00 AM to 5:29 AM | 2 (1.3%) | 0 (0.0%) |
| 5:30 AM to 5:59 AM | 22 (14.3%) | 3 (2.6%) |
| 6:00 AM to 6:29 AM | 21 (13.6%) | 1 (0.9%) |
| 6:30 AM to 6:59 AM | 44 (28.6%) | 2 (1.7%) |
| 7:00 AM to 7:29 AM | 1 (0.6%) | 4 (3.4%) |
| 7:30 AM to 7:59 AM | 26 (16.9%) | 41 (35.0%) |
| 8:00 AM to 8:29 AM | 18 (11.7%) | 3 (2.6%) |
| 8:30 AM to 8:59 AM | 0 (0.0%) | 17 (14.5%) |
| 9:00 AM to 9:59 AM | 2 (1.3%) | 7 (6.0%) |
| 10:00 AM to 10:59 AM | 0 (0.0%) | 0 (0.0%) |
| 11:00 AM to 11:59 AM | 5 (3.3%) | 0 (0.0%) |
| 12:00 PM to 3:59 PM | 2 (1.3%) | 0 (0.0%) |
| 4:00 PM to 11:59 PM | 6 (3.9%) | 39 (33.3%) |
| Total | 154 (100.0%) | 117 (100.0%) |
Housing Occupancy in Thorntonville
Occupancy by Ownership in Thorntonville
Of the total 181 dwellings in Thorntonville, owner-occupied units account for 163 (90.1%), while renter-occupied units make up 18 (9.9%).
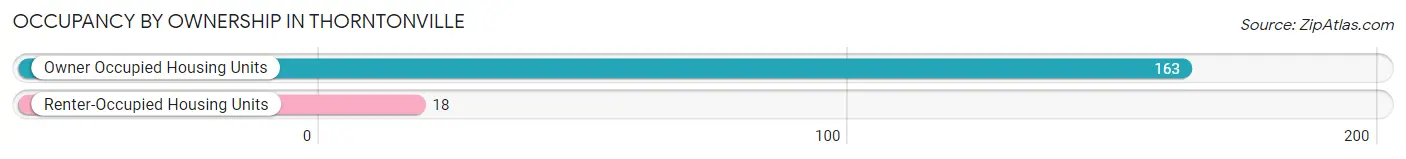
| Occupancy | # Housing Units | % Housing Units |
| Owner Occupied Housing Units | 163 | 90.1% |
| Renter-Occupied Housing Units | 18 | 9.9% |
| Total Occupied Housing Units | 181 | 100.0% |
Occupancy by Household Size in Thorntonville
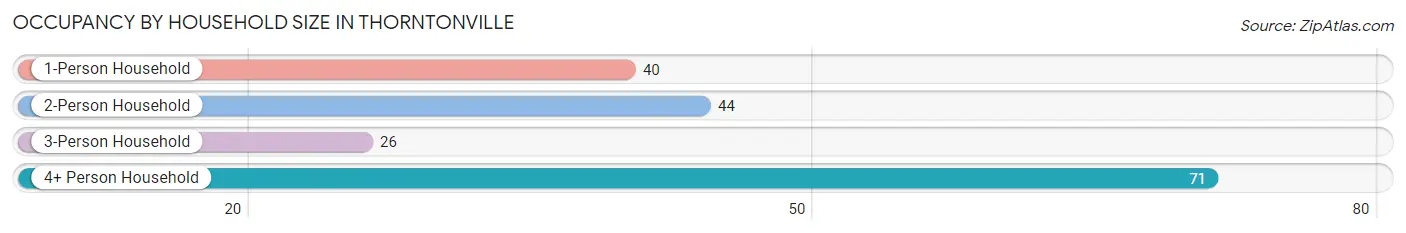
| Household Size | # Housing Units | % Housing Units |
| 1-Person Household | 40 | 22.1% |
| 2-Person Household | 44 | 24.3% |
| 3-Person Household | 26 | 14.4% |
| 4+ Person Household | 71 | 39.2% |
| Total Housing Units | 181 | 100.0% |
Occupancy by Ownership by Household Size in Thorntonville
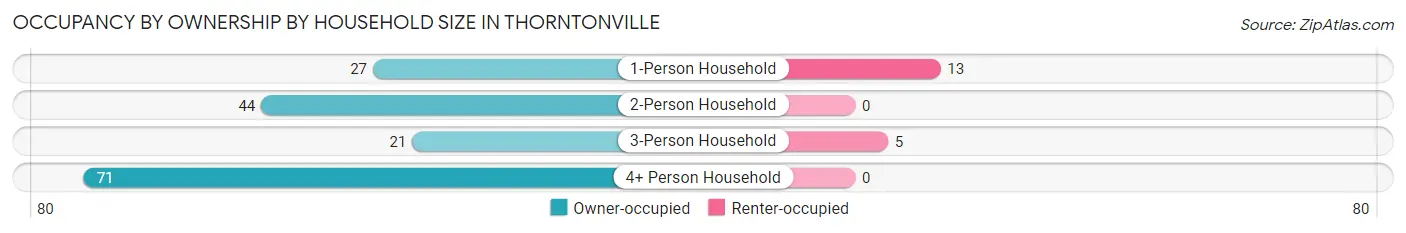
| Household Size | Owner-occupied | Renter-occupied |
| 1-Person Household | 27 (67.5%) | 13 (32.5%) |
| 2-Person Household | 44 (100.0%) | 0 (0.0%) |
| 3-Person Household | 21 (80.8%) | 5 (19.2%) |
| 4+ Person Household | 71 (100.0%) | 0 (0.0%) |
| Total Housing Units | 163 (90.1%) | 18 (9.9%) |
Occupancy by Educational Attainment in Thorntonville
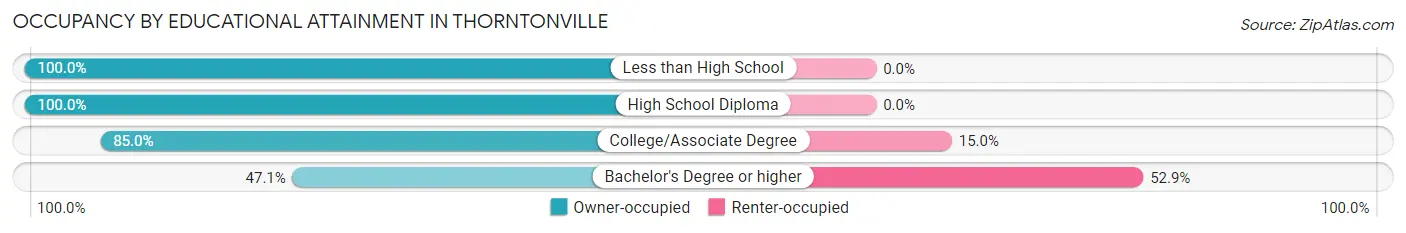
| Household Size | Owner-occupied | Renter-occupied |
| Less than High School | 44 (100.0%) | 0 (0.0%) |
| High School Diploma | 60 (100.0%) | 0 (0.0%) |
| College/Associate Degree | 51 (85.0%) | 9 (15.0%) |
| Bachelor's Degree or higher | 8 (47.1%) | 9 (52.9%) |
Occupancy by Age of Householder in Thorntonville
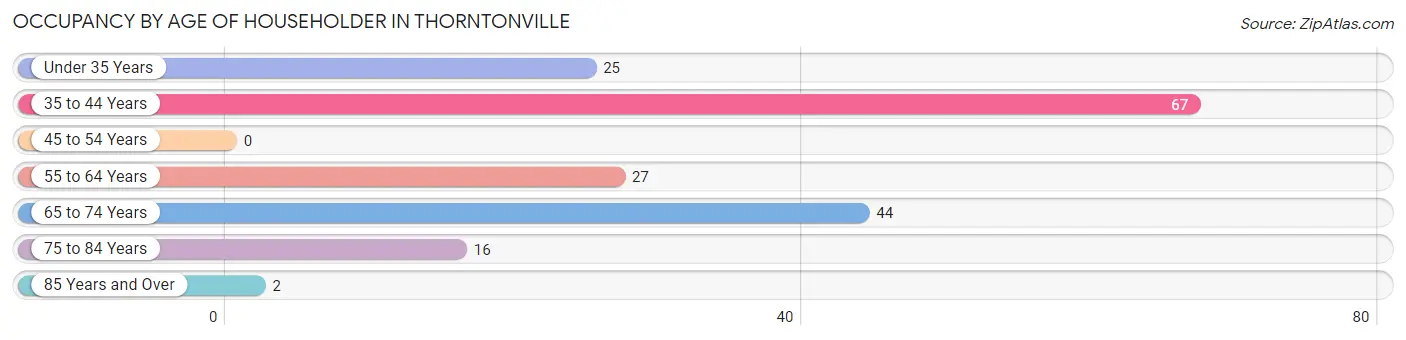
| Age Bracket | # Households | % Households |
| Under 35 Years | 25 | 13.8% |
| 35 to 44 Years | 67 | 37.0% |
| 45 to 54 Years | 0 | 0.0% |
| 55 to 64 Years | 27 | 14.9% |
| 65 to 74 Years | 44 | 24.3% |
| 75 to 84 Years | 16 | 8.8% |
| 85 Years and Over | 2 | 1.1% |
| Total | 181 | 100.0% |
Housing Finances in Thorntonville
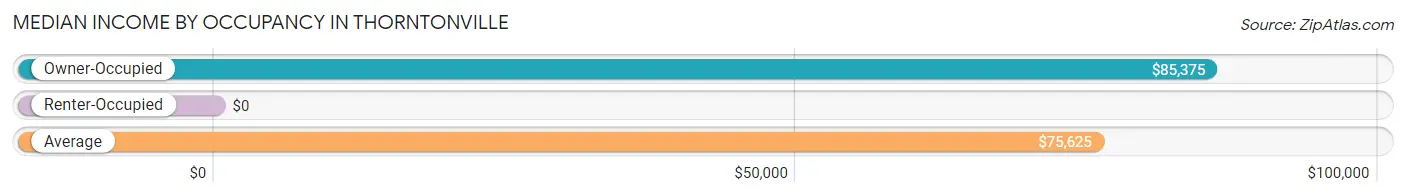
Median Income by Occupancy in Thorntonville
| Occupancy Type | # Households | Median Income |
| Owner-Occupied | 163 (90.1%) | $85,375 |
| Renter-Occupied | 18 (9.9%) | $0 |
| Average | 181 (100.0%) | $75,625 |
Occupancy by Householder Income Bracket in Thorntonville
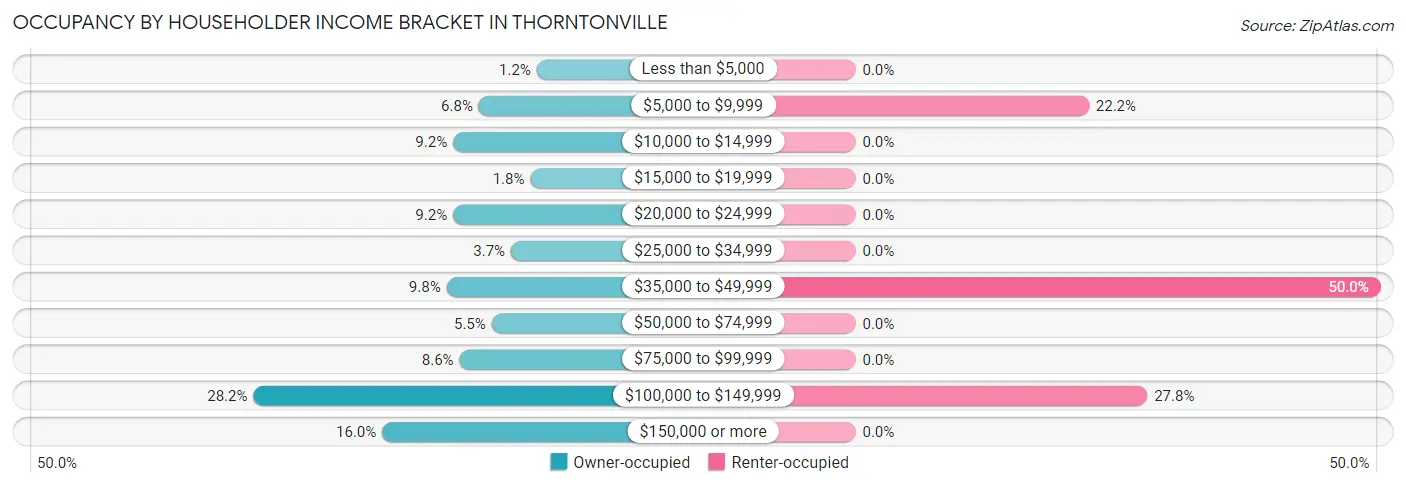
| Income Bracket | Owner-occupied | Renter-occupied |
| Less than $5,000 | 2 (1.2%) | 0 (0.0%) |
| $5,000 to $9,999 | 11 (6.8%) | 4 (22.2%) |
| $10,000 to $14,999 | 15 (9.2%) | 0 (0.0%) |
| $15,000 to $19,999 | 3 (1.8%) | 0 (0.0%) |
| $20,000 to $24,999 | 15 (9.2%) | 0 (0.0%) |
| $25,000 to $34,999 | 6 (3.7%) | 0 (0.0%) |
| $35,000 to $49,999 | 16 (9.8%) | 9 (50.0%) |
| $50,000 to $74,999 | 9 (5.5%) | 0 (0.0%) |
| $75,000 to $99,999 | 14 (8.6%) | 0 (0.0%) |
| $100,000 to $149,999 | 46 (28.2%) | 5 (27.8%) |
| $150,000 or more | 26 (16.0%) | 0 (0.0%) |
| Total | 163 (100.0%) | 18 (100.0%) |
Monthly Housing Cost Tiers in Thorntonville
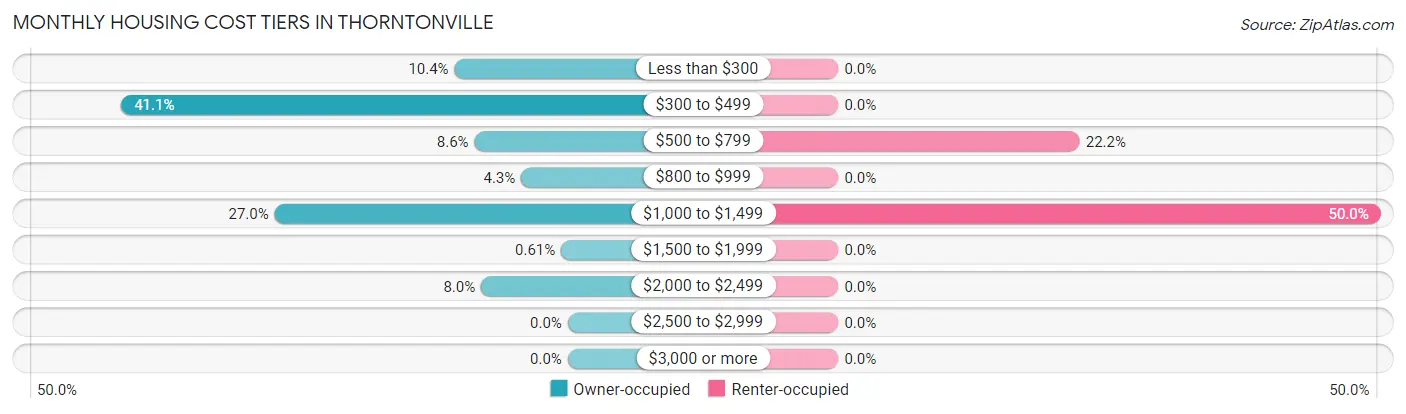
| Monthly Cost | Owner-occupied | Renter-occupied |
| Less than $300 | 17 (10.4%) | 0 (0.0%) |
| $300 to $499 | 67 (41.1%) | 0 (0.0%) |
| $500 to $799 | 14 (8.6%) | 4 (22.2%) |
| $800 to $999 | 7 (4.3%) | 0 (0.0%) |
| $1,000 to $1,499 | 44 (27.0%) | 9 (50.0%) |
| $1,500 to $1,999 | 1 (0.6%) | 0 (0.0%) |
| $2,000 to $2,499 | 13 (8.0%) | 0 (0.0%) |
| $2,500 to $2,999 | 0 (0.0%) | 0 (0.0%) |
| $3,000 or more | 0 (0.0%) | 0 (0.0%) |
| Total | 163 (100.0%) | 18 (100.0%) |
Physical Housing Characteristics in Thorntonville
Housing Structures in Thorntonville
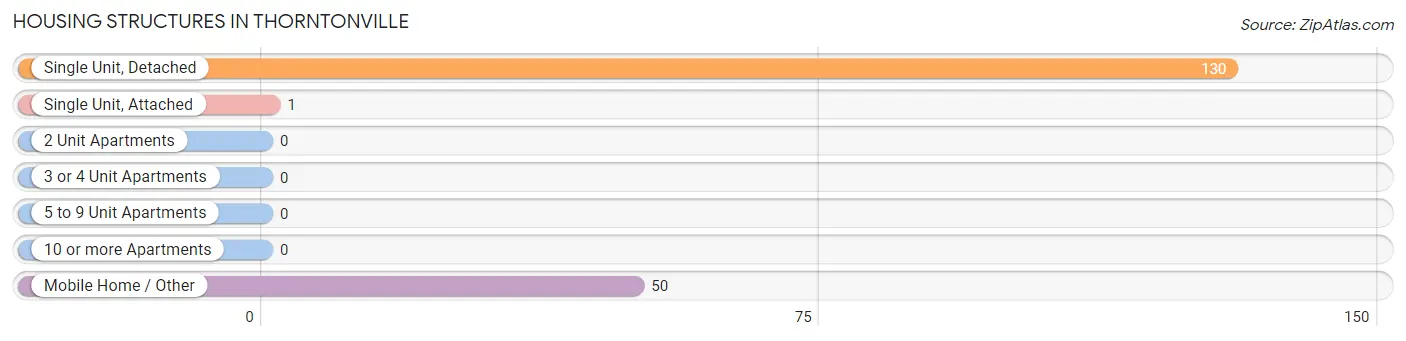
| Structure Type | # Housing Units | % Housing Units |
| Single Unit, Detached | 130 | 71.8% |
| Single Unit, Attached | 1 | 0.5% |
| 2 Unit Apartments | 0 | 0.0% |
| 3 or 4 Unit Apartments | 0 | 0.0% |
| 5 to 9 Unit Apartments | 0 | 0.0% |
| 10 or more Apartments | 0 | 0.0% |
| Mobile Home / Other | 50 | 27.6% |
| Total | 181 | 100.0% |
Housing Structures by Occupancy in Thorntonville
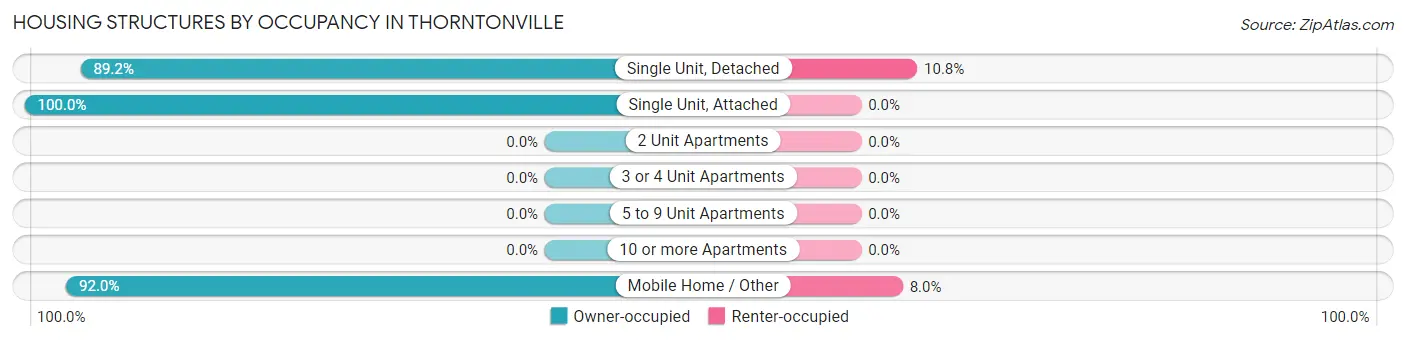
| Structure Type | Owner-occupied | Renter-occupied |
| Single Unit, Detached | 116 (89.2%) | 14 (10.8%) |
| Single Unit, Attached | 1 (100.0%) | 0 (0.0%) |
| 2 Unit Apartments | 0 (0.0%) | 0 (0.0%) |
| 3 or 4 Unit Apartments | 0 (0.0%) | 0 (0.0%) |
| 5 to 9 Unit Apartments | 0 (0.0%) | 0 (0.0%) |
| 10 or more Apartments | 0 (0.0%) | 0 (0.0%) |
| Mobile Home / Other | 46 (92.0%) | 4 (8.0%) |
| Total | 163 (90.1%) | 18 (9.9%) |
Housing Structures by Number of Rooms in Thorntonville
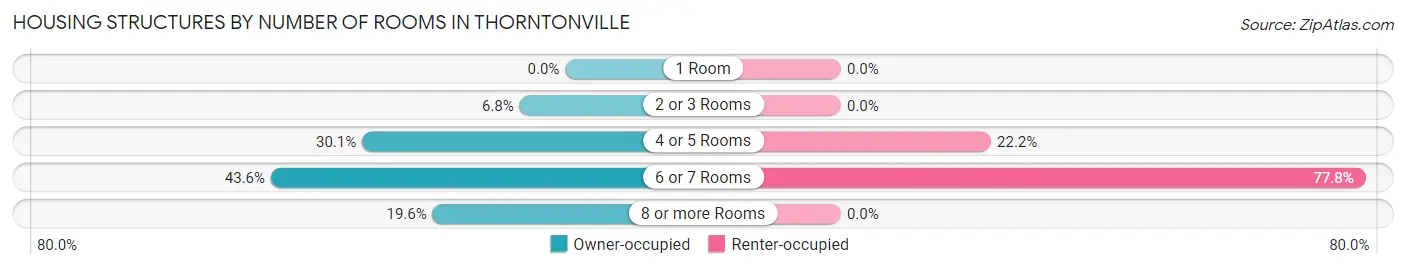
| Number of Rooms | Owner-occupied | Renter-occupied |
| 1 Room | 0 (0.0%) | 0 (0.0%) |
| 2 or 3 Rooms | 11 (6.8%) | 0 (0.0%) |
| 4 or 5 Rooms | 49 (30.1%) | 4 (22.2%) |
| 6 or 7 Rooms | 71 (43.6%) | 14 (77.8%) |
| 8 or more Rooms | 32 (19.6%) | 0 (0.0%) |
| Total | 163 (100.0%) | 18 (100.0%) |
Housing Structure by Heating Type in Thorntonville
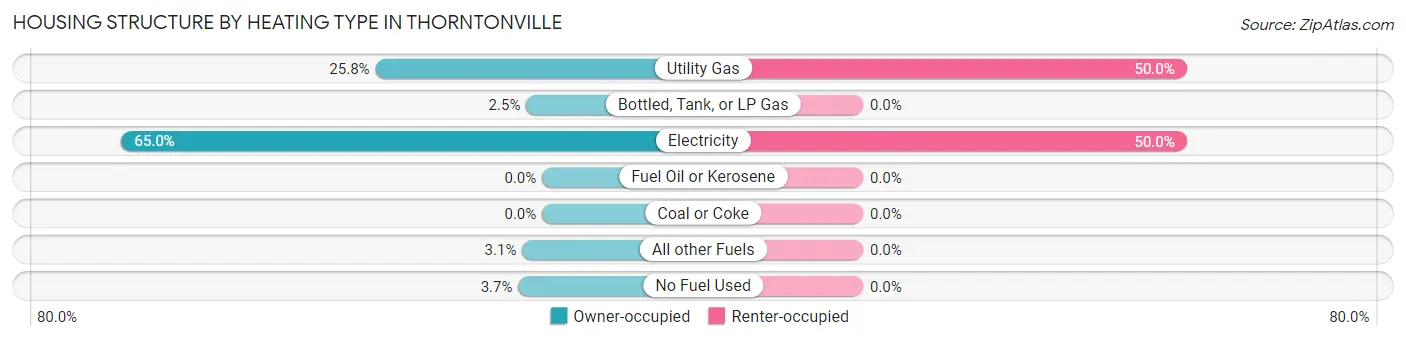
| Heating Type | Owner-occupied | Renter-occupied |
| Utility Gas | 42 (25.8%) | 9 (50.0%) |
| Bottled, Tank, or LP Gas | 4 (2.5%) | 0 (0.0%) |
| Electricity | 106 (65.0%) | 9 (50.0%) |
| Fuel Oil or Kerosene | 0 (0.0%) | 0 (0.0%) |
| Coal or Coke | 0 (0.0%) | 0 (0.0%) |
| All other Fuels | 5 (3.1%) | 0 (0.0%) |
| No Fuel Used | 6 (3.7%) | 0 (0.0%) |
| Total | 163 (100.0%) | 18 (100.0%) |
Household Vehicle Usage in Thorntonville
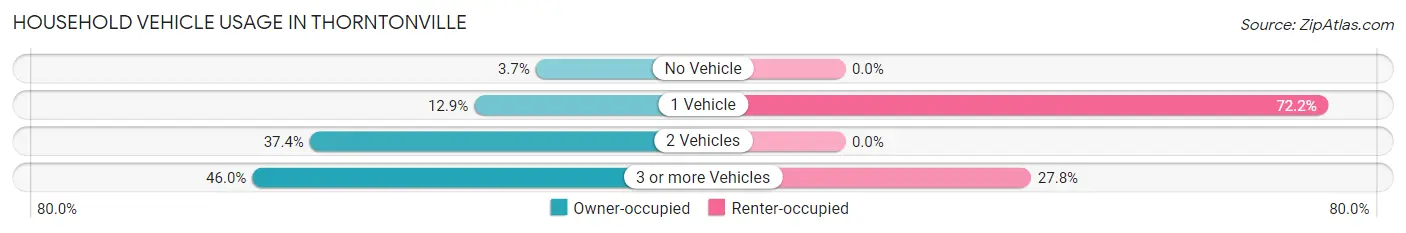
| Vehicles per Household | Owner-occupied | Renter-occupied |
| No Vehicle | 6 (3.7%) | 0 (0.0%) |
| 1 Vehicle | 21 (12.9%) | 13 (72.2%) |
| 2 Vehicles | 61 (37.4%) | 0 (0.0%) |
| 3 or more Vehicles | 75 (46.0%) | 5 (27.8%) |
| Total | 163 (100.0%) | 18 (100.0%) |
Real Estate & Mortgages in Thorntonville
Real Estate and Mortgage Overview in Thorntonville
| Characteristic | Without Mortgage | With Mortgage |
| Housing Units | 107 | 56 |
| Median Property Value | $130,600 | $215,900 |
| Median Household Income | $41,750 | $1 |
| Monthly Housing Costs | $438 | $0 |
| Real Estate Taxes | $826 | $0 |
Property Value by Mortgage Status in Thorntonville
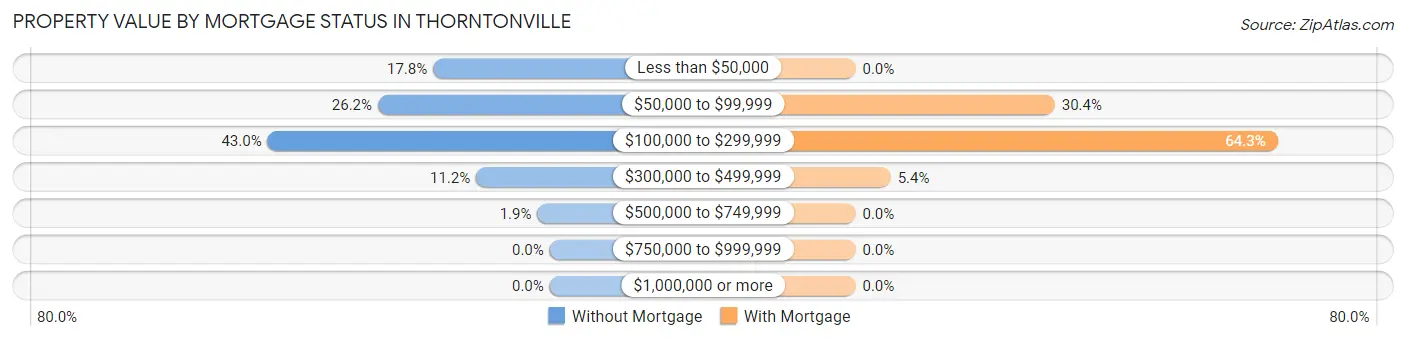
| Property Value | Without Mortgage | With Mortgage |
| Less than $50,000 | 19 (17.8%) | 0 (0.0%) |
| $50,000 to $99,999 | 28 (26.2%) | 17 (30.4%) |
| $100,000 to $299,999 | 46 (43.0%) | 36 (64.3%) |
| $300,000 to $499,999 | 12 (11.2%) | 3 (5.4%) |
| $500,000 to $749,999 | 2 (1.9%) | 0 (0.0%) |
| $750,000 to $999,999 | 0 (0.0%) | 0 (0.0%) |
| $1,000,000 or more | 0 (0.0%) | 0 (0.0%) |
| Total | 107 (100.0%) | 56 (100.0%) |
Household Income by Mortgage Status in Thorntonville
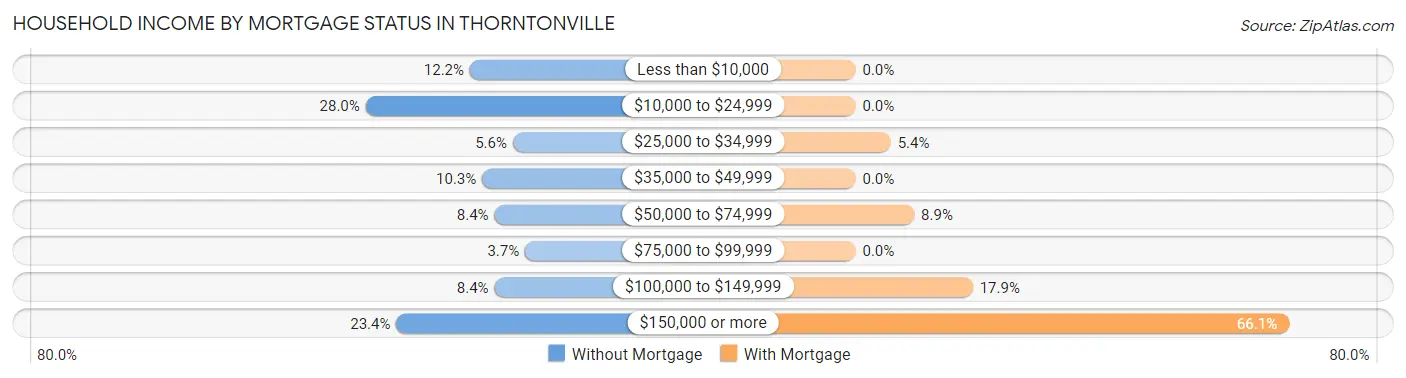
| Household Income | Without Mortgage | With Mortgage |
| Less than $10,000 | 13 (12.1%) | 0 (0.0%) |
| $10,000 to $24,999 | 30 (28.0%) | 0 (0.0%) |
| $25,000 to $34,999 | 6 (5.6%) | 3 (5.4%) |
| $35,000 to $49,999 | 11 (10.3%) | 0 (0.0%) |
| $50,000 to $74,999 | 9 (8.4%) | 5 (8.9%) |
| $75,000 to $99,999 | 4 (3.7%) | 0 (0.0%) |
| $100,000 to $149,999 | 9 (8.4%) | 10 (17.9%) |
| $150,000 or more | 25 (23.4%) | 37 (66.1%) |
| Total | 107 (100.0%) | 56 (100.0%) |
Property Value to Household Income Ratio in Thorntonville
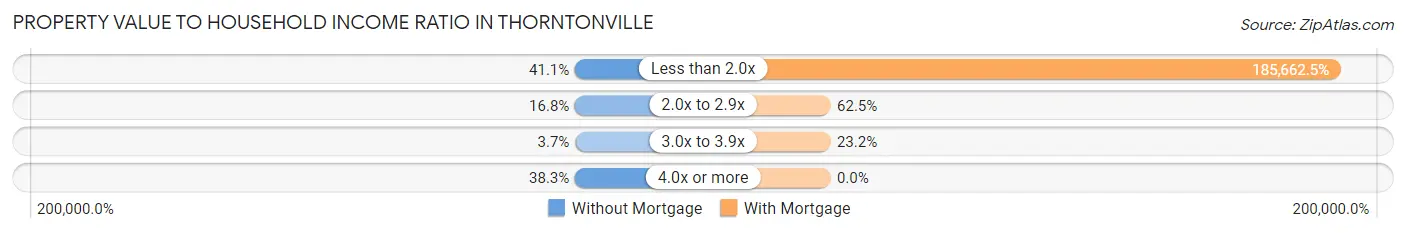
| Value-to-Income Ratio | Without Mortgage | With Mortgage |
| Less than 2.0x | 44 (41.1%) | 103,971 (185,662.5%) |
| 2.0x to 2.9x | 18 (16.8%) | 35 (62.5%) |
| 3.0x to 3.9x | 4 (3.7%) | 13 (23.2%) |
| 4.0x or more | 41 (38.3%) | 0 (0.0%) |
| Total | 107 (100.0%) | 56 (100.0%) |
Real Estate Taxes by Mortgage Status in Thorntonville
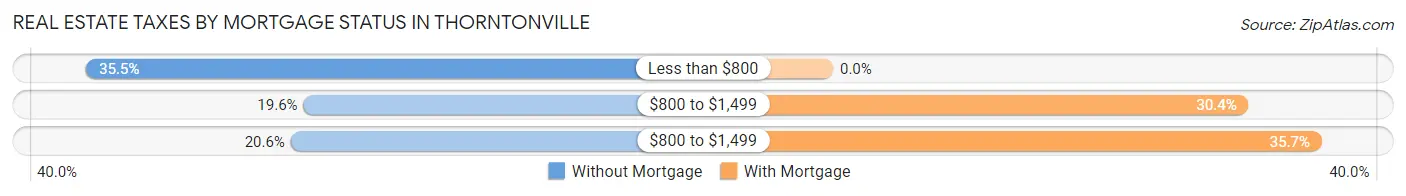
| Property Taxes | Without Mortgage | With Mortgage |
| Less than $800 | 38 (35.5%) | 0 (0.0%) |
| $800 to $1,499 | 21 (19.6%) | 17 (30.4%) |
| $800 to $1,499 | 22 (20.6%) | 20 (35.7%) |
| Total | 107 (100.0%) | 56 (100.0%) |
Health & Disability in Thorntonville
Health Insurance Coverage by Age in Thorntonville
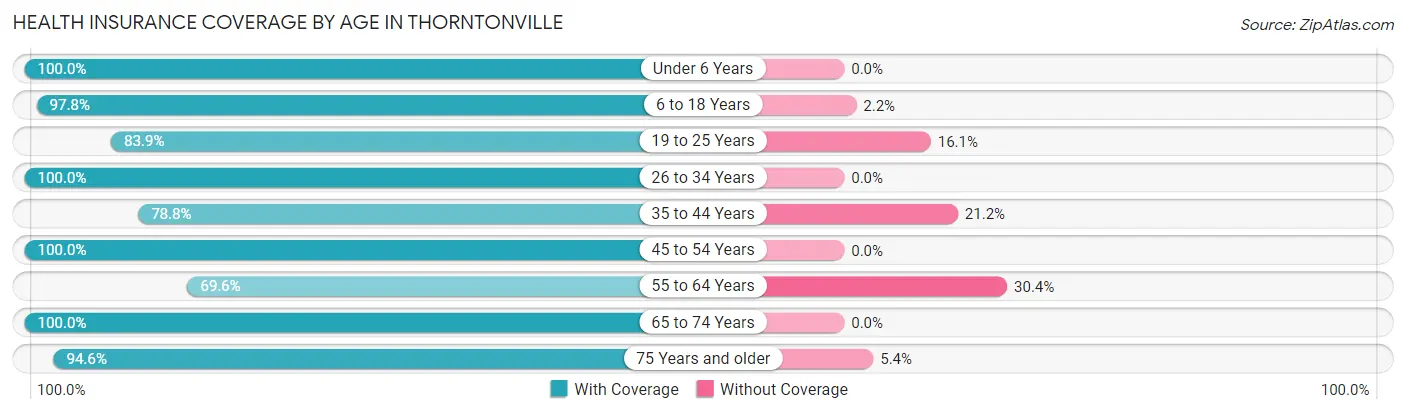
| Age Bracket | With Coverage | Without Coverage |
| Under 6 Years | 71 (100.0%) | 0 (0.0%) |
| 6 to 18 Years | 131 (97.8%) | 3 (2.2%) |
| 19 to 25 Years | 52 (83.9%) | 10 (16.1%) |
| 26 to 34 Years | 36 (100.0%) | 0 (0.0%) |
| 35 to 44 Years | 119 (78.8%) | 32 (21.2%) |
| 45 to 54 Years | 11 (100.0%) | 0 (0.0%) |
| 55 to 64 Years | 39 (69.6%) | 17 (30.4%) |
| 65 to 74 Years | 64 (100.0%) | 0 (0.0%) |
| 75 Years and older | 35 (94.6%) | 2 (5.4%) |
| Total | 558 (89.7%) | 64 (10.3%) |
Health Insurance Coverage by Citizenship Status in Thorntonville
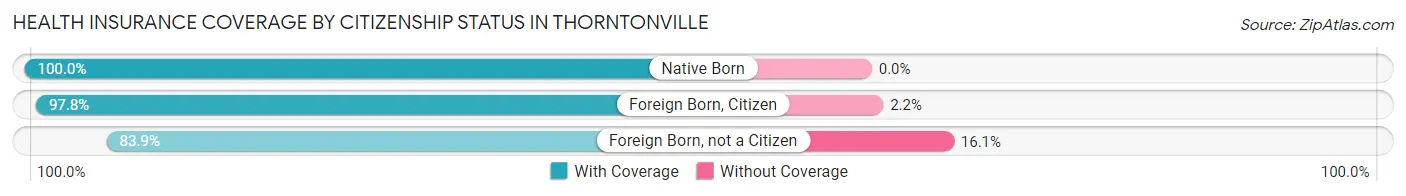
| Citizenship Status | With Coverage | Without Coverage |
| Native Born | 71 (100.0%) | 0 (0.0%) |
| Foreign Born, Citizen | 131 (97.8%) | 3 (2.2%) |
| Foreign Born, not a Citizen | 52 (83.9%) | 10 (16.1%) |
Health Insurance Coverage by Household Income in Thorntonville
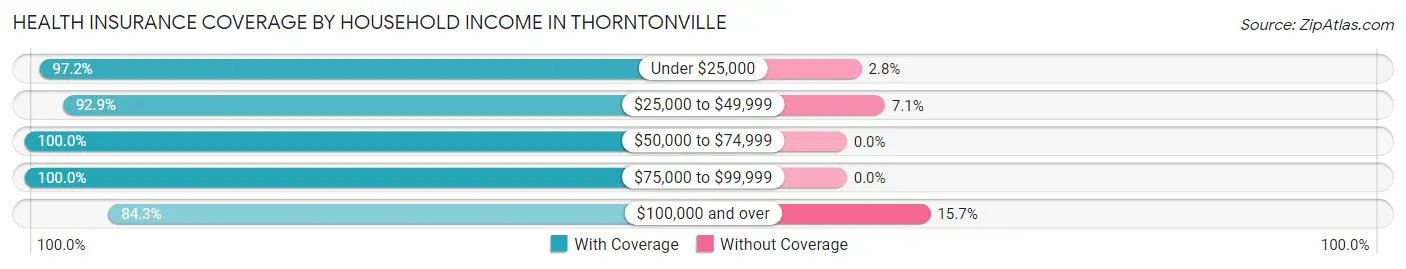
| Household Income | With Coverage | Without Coverage |
| Under $25,000 | 105 (97.2%) | 3 (2.8%) |
| $25,000 to $49,999 | 39 (92.9%) | 3 (7.1%) |
| $50,000 to $74,999 | 68 (100.0%) | 0 (0.0%) |
| $75,000 to $99,999 | 34 (100.0%) | 0 (0.0%) |
| $100,000 and over | 312 (84.3%) | 58 (15.7%) |
Public vs Private Health Insurance Coverage by Age in Thorntonville
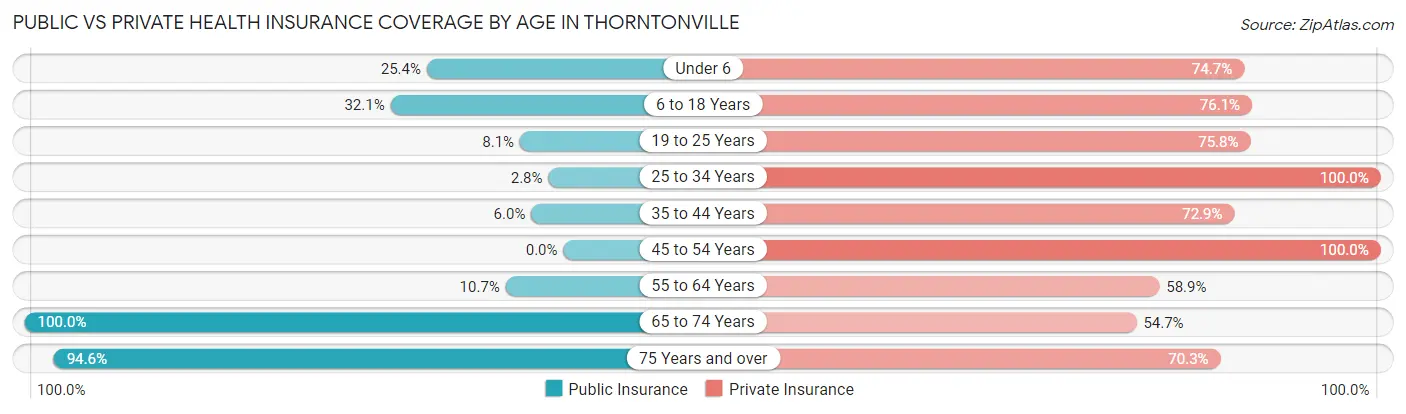
| Age Bracket | Public Insurance | Private Insurance |
| Under 6 | 18 (25.4%) | 53 (74.7%) |
| 6 to 18 Years | 43 (32.1%) | 102 (76.1%) |
| 19 to 25 Years | 5 (8.1%) | 47 (75.8%) |
| 25 to 34 Years | 1 (2.8%) | 36 (100.0%) |
| 35 to 44 Years | 9 (6.0%) | 110 (72.9%) |
| 45 to 54 Years | 0 (0.0%) | 11 (100.0%) |
| 55 to 64 Years | 6 (10.7%) | 33 (58.9%) |
| 65 to 74 Years | 64 (100.0%) | 35 (54.7%) |
| 75 Years and over | 35 (94.6%) | 26 (70.3%) |
| Total | 181 (29.1%) | 453 (72.8%) |
Disability Status by Sex by Age in Thorntonville
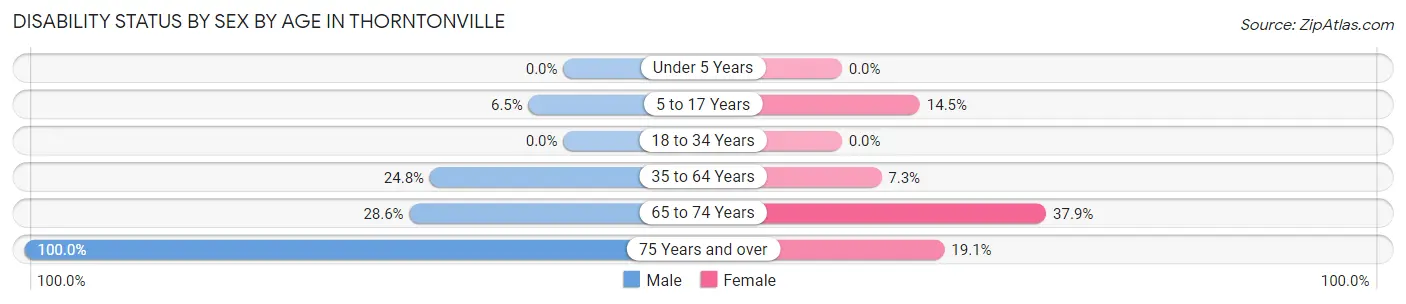
| Age Bracket | Male | Female |
| Under 5 Years | 0 (0.0%) | 0 (0.0%) |
| 5 to 17 Years | 4 (6.5%) | 10 (14.5%) |
| 18 to 34 Years | 0 (0.0%) | 0 (0.0%) |
| 35 to 64 Years | 27 (24.8%) | 8 (7.3%) |
| 65 to 74 Years | 10 (28.6%) | 11 (37.9%) |
| 75 Years and over | 16 (100.0%) | 4 (19.1%) |
Disability Class by Sex by Age in Thorntonville
Disability Class: Hearing Difficulty
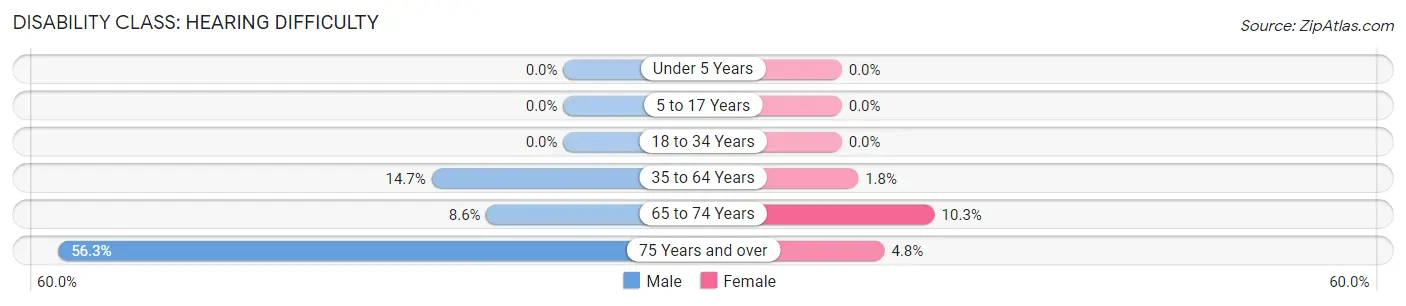
| Age Bracket | Male | Female |
| Under 5 Years | 0 (0.0%) | 0 (0.0%) |
| 5 to 17 Years | 0 (0.0%) | 0 (0.0%) |
| 18 to 34 Years | 0 (0.0%) | 0 (0.0%) |
| 35 to 64 Years | 16 (14.7%) | 2 (1.8%) |
| 65 to 74 Years | 3 (8.6%) | 3 (10.3%) |
| 75 Years and over | 9 (56.2%) | 1 (4.8%) |
Disability Class: Vision Difficulty
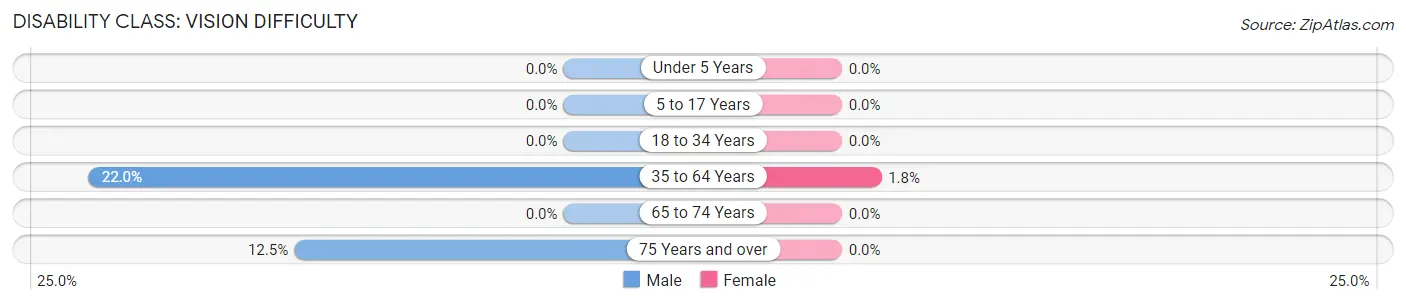
| Age Bracket | Male | Female |
| Under 5 Years | 0 (0.0%) | 0 (0.0%) |
| 5 to 17 Years | 0 (0.0%) | 0 (0.0%) |
| 18 to 34 Years | 0 (0.0%) | 0 (0.0%) |
| 35 to 64 Years | 24 (22.0%) | 2 (1.8%) |
| 65 to 74 Years | 0 (0.0%) | 0 (0.0%) |
| 75 Years and over | 2 (12.5%) | 0 (0.0%) |
Disability Class: Cognitive Difficulty
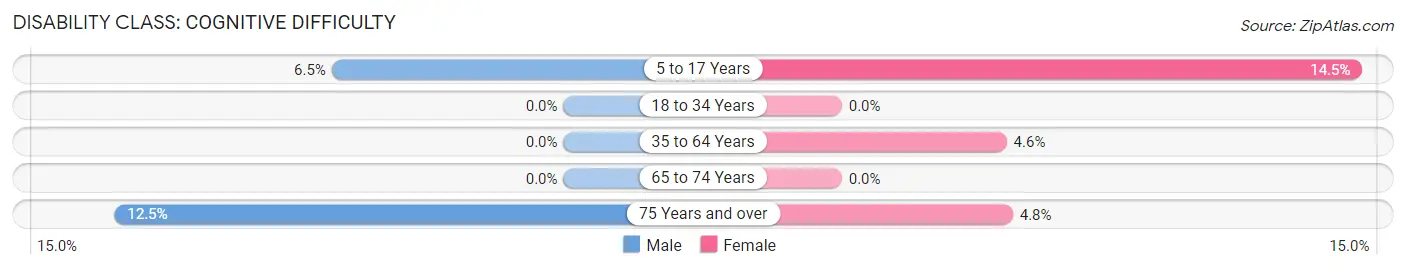
| Age Bracket | Male | Female |
| 5 to 17 Years | 4 (6.5%) | 10 (14.5%) |
| 18 to 34 Years | 0 (0.0%) | 0 (0.0%) |
| 35 to 64 Years | 0 (0.0%) | 5 (4.6%) |
| 65 to 74 Years | 0 (0.0%) | 0 (0.0%) |
| 75 Years and over | 2 (12.5%) | 1 (4.8%) |
Disability Class: Ambulatory Difficulty
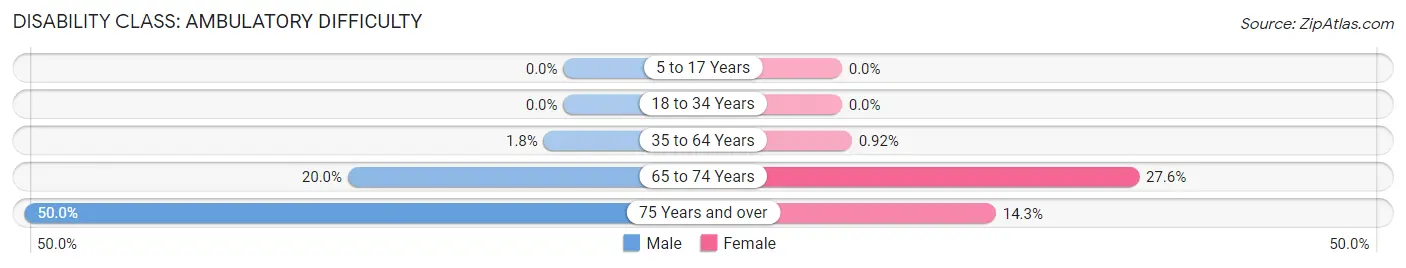
| Age Bracket | Male | Female |
| 5 to 17 Years | 0 (0.0%) | 0 (0.0%) |
| 18 to 34 Years | 0 (0.0%) | 0 (0.0%) |
| 35 to 64 Years | 2 (1.8%) | 1 (0.9%) |
| 65 to 74 Years | 7 (20.0%) | 8 (27.6%) |
| 75 Years and over | 8 (50.0%) | 3 (14.3%) |
Disability Class: Self-Care Difficulty
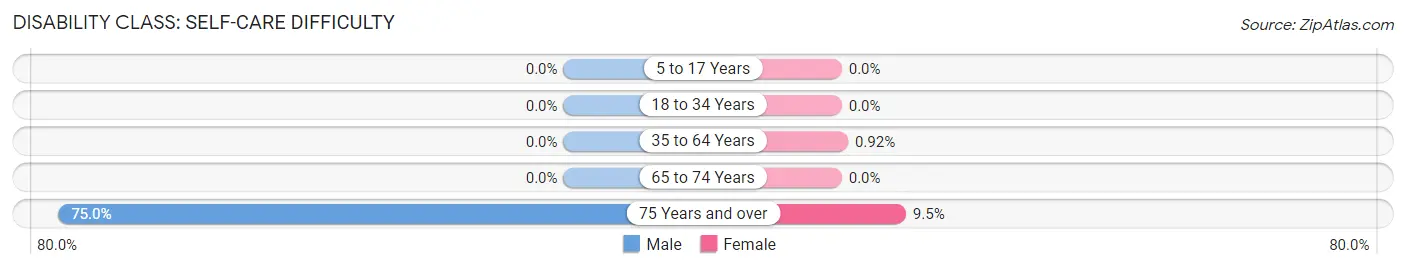
| Age Bracket | Male | Female |
| 5 to 17 Years | 0 (0.0%) | 0 (0.0%) |
| 18 to 34 Years | 0 (0.0%) | 0 (0.0%) |
| 35 to 64 Years | 0 (0.0%) | 1 (0.9%) |
| 65 to 74 Years | 0 (0.0%) | 0 (0.0%) |
| 75 Years and over | 12 (75.0%) | 2 (9.5%) |
Technology Access in Thorntonville
Computing Device Access in Thorntonville
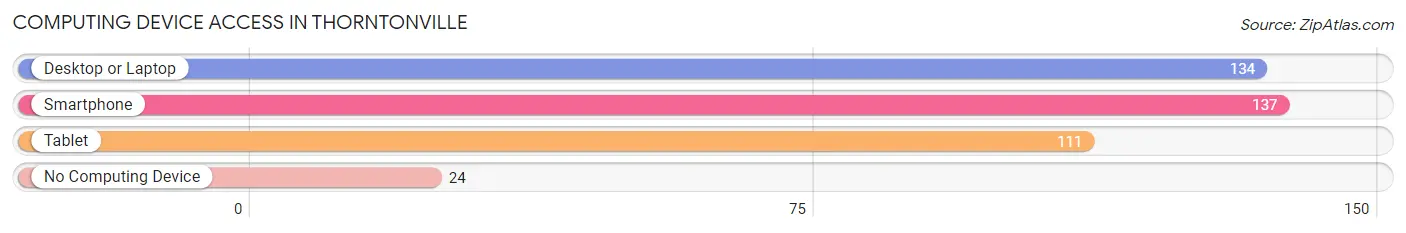
| Device Type | # Households | % Households |
| Desktop or Laptop | 134 | 74.0% |
| Smartphone | 137 | 75.7% |
| Tablet | 111 | 61.3% |
| No Computing Device | 24 | 13.3% |
| Total | 181 | 100.0% |
Internet Access in Thorntonville
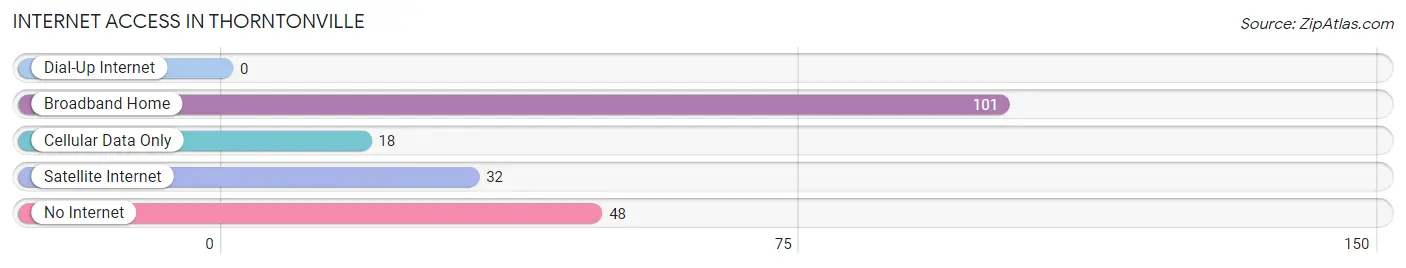
| Internet Type | # Households | % Households |
| Dial-Up Internet | 0 | 0.0% |
| Broadband Home | 101 | 55.8% |
| Cellular Data Only | 18 | 9.9% |
| Satellite Internet | 32 | 17.7% |
| No Internet | 48 | 26.5% |
| Total | 181 | 100.0% |
Thorntonville Summary
Thorntonville, Texas is a small unincorporated community located in the southeastern corner of Smith County, Texas. It is situated approximately 10 miles east of Tyler, the county seat, and is part of the Tyler Metropolitan Statistical Area. The population of Thorntonville was estimated to be around 200 people in 2020.
History
Thorntonville was founded in 1872 by William Thornton, a former Confederate soldier. He purchased the land from the state of Texas and established a small farming community. The town was named after him and was originally known as Thorntonville.
The town grew slowly but steadily over the years, and by the early 1900s, it had become a thriving agricultural community. The town was home to several cotton gins, a general store, a blacksmith shop, and a post office.
In the 1920s, the town began to decline as the Great Depression hit the area. Many of the businesses closed and the population dwindled. However, the town was able to survive and by the 1950s, it had become a small but stable community.
Geography
Thorntonville is located in the southeastern corner of Smith County, Texas. It is situated approximately 10 miles east of Tyler, the county seat. The town is located on the banks of the Neches River, which flows through the area.
The town is surrounded by rolling hills and is home to several small lakes and ponds. The area is mostly rural, with the majority of the land being used for agricultural purposes.
Economy
The economy of Thorntonville is largely based on agriculture. The town is home to several farms and ranches, which produce a variety of crops, including cotton, corn, soybeans, and hay.
The town is also home to several small businesses, including a general store, a gas station, and a few restaurants. The town is also home to a few churches, which provide a variety of services to the community.
Demographics
The population of Thorntonville was estimated to be around 200 people in 2020. The town is predominantly white, with a small Hispanic population. The median household income is around $35,000, and the median home value is around $90,000.
The town is served by the Tyler Independent School District, which provides education to the students of Thorntonville. The town is also home to a few churches, which provide a variety of services to the community.
Conclusion
Thorntonville, Texas is a small unincorporated community located in the southeastern corner of Smith County, Texas. It is situated approximately 10 miles east of Tyler, the county seat, and is part of the Tyler Metropolitan Statistical Area. The population of Thorntonville was estimated to be around 200 people in 2020. The town is predominantly white, with a small Hispanic population. The economy of Thorntonville is largely based on agriculture, with the majority of the land being used for agricultural purposes. The town is also home to several small businesses, including a general store, a gas station, and a few restaurants. The town is served by the Tyler Independent School District, which provides education to the students of Thorntonville. The town is also home to a few churches, which provide a variety of services to the community.
Common Questions
What is Per Capita Income in Thorntonville?
Per Capita income in Thorntonville is $33,252.
What is the Median Family Income in Thorntonville?
Median Family Income in Thorntonville is $103,015.
What is the Median Household income in Thorntonville?
Median Household Income in Thorntonville is $75,625.
What is Family Income Deficit in Thorntonville?
Family Income Deficit in Thorntonville is $8,376.
Families that are below poverty line in Thorntonville earn $8,376 less on average than the poverty threshold level.
What is Inequality or Gini Index in Thorntonville?
Inequality or Gini Index in Thorntonville is 0.50.
What is the Total Population of Thorntonville?
Total Population of Thorntonville is 622.
What is the Total Male Population of Thorntonville?
Total Male Population of Thorntonville is 342.
What is the Total Female Population of Thorntonville?
Total Female Population of Thorntonville is 280.
What is the Ratio of Males per 100 Females in Thorntonville?
There are 122.14 Males per 100 Females in Thorntonville.
What is the Ratio of Females per 100 Males in Thorntonville?
There are 81.87 Females per 100 Males in Thorntonville.
What is the Median Population Age in Thorntonville?
Median Population Age in Thorntonville is 36.8 Years.
What is the Average Family Size in Thorntonville
Average Family Size in Thorntonville is 4.1 People.
What is the Average Household Size in Thorntonville
Average Household Size in Thorntonville is 3.4 People.
How Large is the Labor Force in Thorntonville?
There are 276 People in the Labor Forcein in Thorntonville.
What is the Percentage of People in the Labor Force in Thorntonville?
63.2% of People are in the Labor Force in Thorntonville.
What is the Unemployment Rate in Thorntonville?
Unemployment Rate in Thorntonville is 1.8%.