Lone Star, TX Map & Demographics
Lone Star Map
Lone Star Overview
$24,912
PER CAPITA INCOME
$55,172
AVG FAMILY INCOME
$41,806
AVG HOUSEHOLD INCOME
14.1%
WAGE / INCOME GAP [ % ]
85.9¢/ $1
WAGE / INCOME GAP [ $ ]
0.41
INEQUALITY / GINI INDEX
1,653
TOTAL POPULATION
811
MALE POPULATION
842
FEMALE POPULATION
96.32
MALES / 100 FEMALES
103.82
FEMALES / 100 MALES
43.7
MEDIAN AGE
2.8
AVG FAMILY SIZE
2.3
AVG HOUSEHOLD SIZE
670
LABOR FORCE [ PEOPLE ]
48.9%
PERCENT IN LABOR FORCE
3.7%
UNEMPLOYMENT RATE
Lone Star Zip Codes
Lone Star Area Codes
Income in Lone Star
Income Overview in Lone Star
Per Capita Income in Lone Star is $24,912, while median incomes of families and households are $55,172 and $41,806 respectively.
| Characteristic | Number | Measure |
| Per Capita Income | 1,653 | $24,912 |
| Median Family Income | 468 | $55,172 |
| Mean Family Income | 468 | $64,090 |
| Median Household Income | 713 | $41,806 |
| Mean Household Income | 713 | $56,565 |
| Income Deficit | 468 | $0 |
| Wage / Income Gap (%) | 1,653 | 14.06% |
| Wage / Income Gap ($) | 1,653 | 85.94¢ per $1 |
| Gini / Inequality Index | 1,653 | 0.41 |
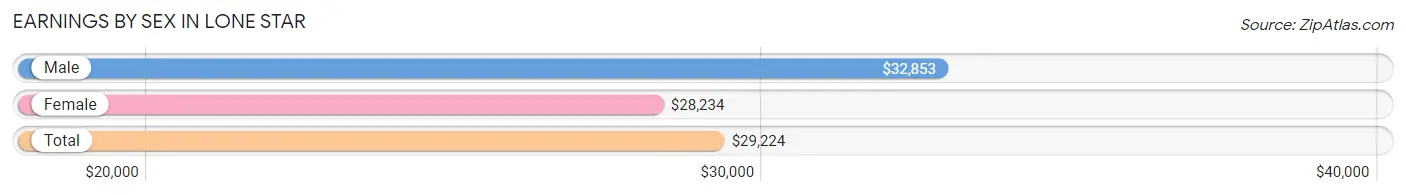
Earnings by Sex in Lone Star
Average Earnings in Lone Star are $29,224, $32,853 for men and $28,234 for women, a difference of 14.1%.
| Sex | Number | Average Earnings |
| Male | 357 (53.1%) | $32,853 |
| Female | 315 (46.9%) | $28,234 |
| Total | 672 (100.0%) | $29,224 |
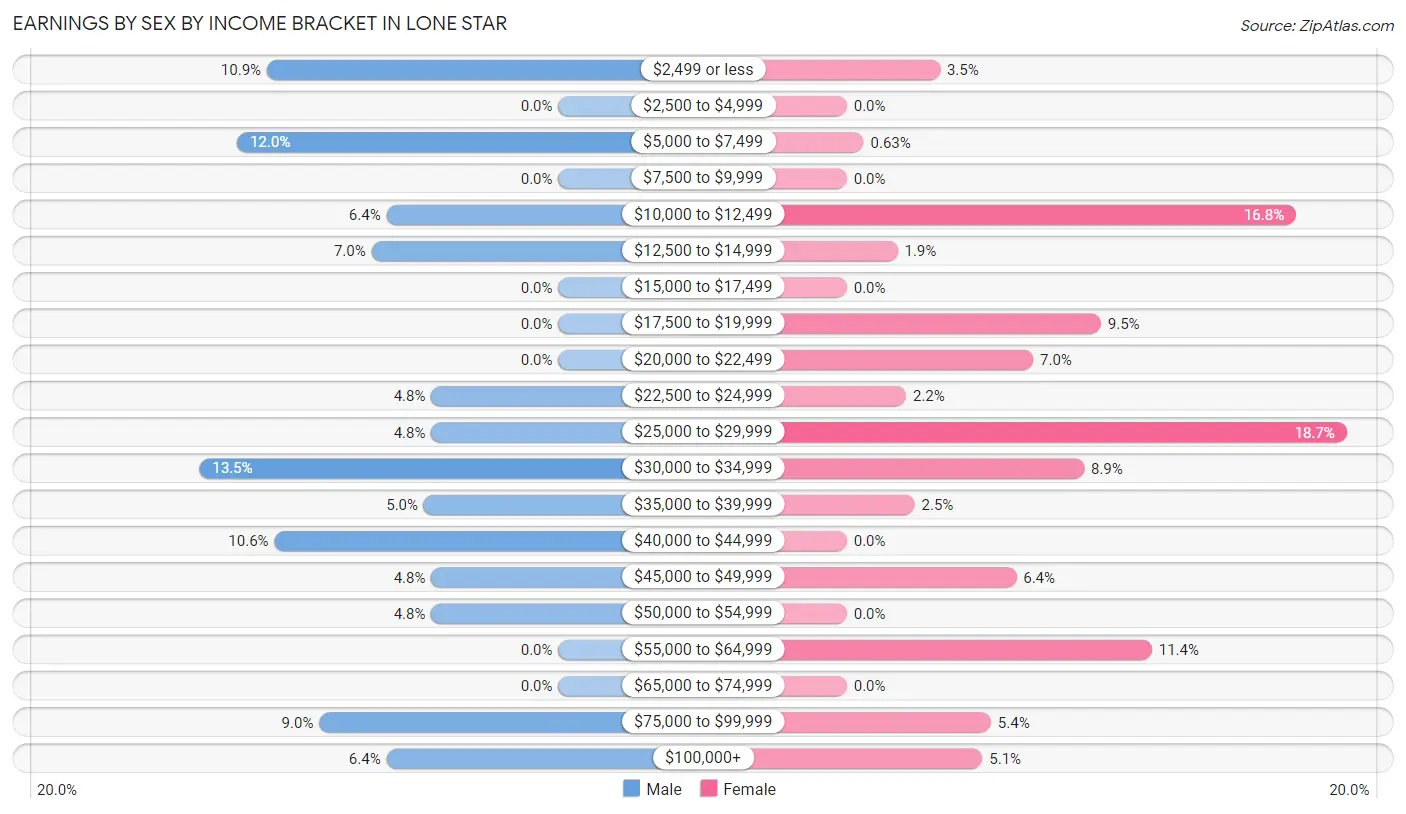
Earnings by Sex by Income Bracket in Lone Star
The most common earnings brackets in Lone Star are $30,000 to $34,999 for men (48 | 13.5%) and $25,000 to $29,999 for women (59 | 18.7%).
| Income | Male | Female |
| $2,499 or less | 39 (10.9%) | 11 (3.5%) |
| $2,500 to $4,999 | 0 (0.0%) | 0 (0.0%) |
| $5,000 to $7,499 | 43 (12.0%) | 2 (0.6%) |
| $7,500 to $9,999 | 0 (0.0%) | 0 (0.0%) |
| $10,000 to $12,499 | 23 (6.4%) | 53 (16.8%) |
| $12,500 to $14,999 | 25 (7.0%) | 6 (1.9%) |
| $15,000 to $17,499 | 0 (0.0%) | 0 (0.0%) |
| $17,500 to $19,999 | 0 (0.0%) | 30 (9.5%) |
| $20,000 to $22,499 | 0 (0.0%) | 22 (7.0%) |
| $22,500 to $24,999 | 17 (4.8%) | 7 (2.2%) |
| $25,000 to $29,999 | 17 (4.8%) | 59 (18.7%) |
| $30,000 to $34,999 | 48 (13.5%) | 28 (8.9%) |
| $35,000 to $39,999 | 18 (5.0%) | 8 (2.5%) |
| $40,000 to $44,999 | 38 (10.6%) | 0 (0.0%) |
| $45,000 to $49,999 | 17 (4.8%) | 20 (6.4%) |
| $50,000 to $54,999 | 17 (4.8%) | 0 (0.0%) |
| $55,000 to $64,999 | 0 (0.0%) | 36 (11.4%) |
| $65,000 to $74,999 | 0 (0.0%) | 0 (0.0%) |
| $75,000 to $99,999 | 32 (9.0%) | 17 (5.4%) |
| $100,000+ | 23 (6.4%) | 16 (5.1%) |
| Total | 357 (100.0%) | 315 (100.0%) |
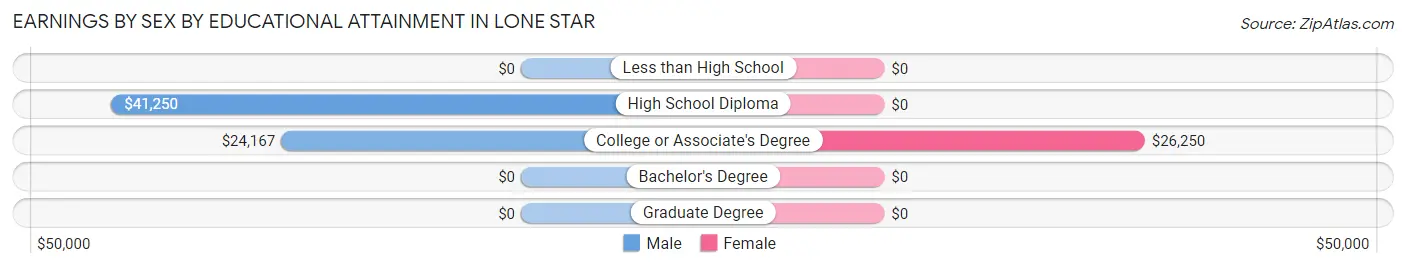
Earnings by Sex by Educational Attainment in Lone Star
Average earnings in Lone Star are $36,528 for men and $30,045 for women, a difference of 17.7%. Men with an educational attainment of high school diploma enjoy the highest average annual earnings of $41,250, while those with college or associate's degree education earn the least with $24,167. Women with an educational attainment of college or associate's degree earn the most with the average annual earnings of $26,250, while those with college or associate's degree education have the smallest earnings of $26,250.
| Educational Attainment | Male Income | Female Income |
| Less than High School | - | - |
| High School Diploma | $41,250 | $0 |
| College or Associate's Degree | $24,167 | $26,250 |
| Bachelor's Degree | - | - |
| Graduate Degree | - | - |
| Total | $36,528 | $30,045 |
Family Income in Lone Star
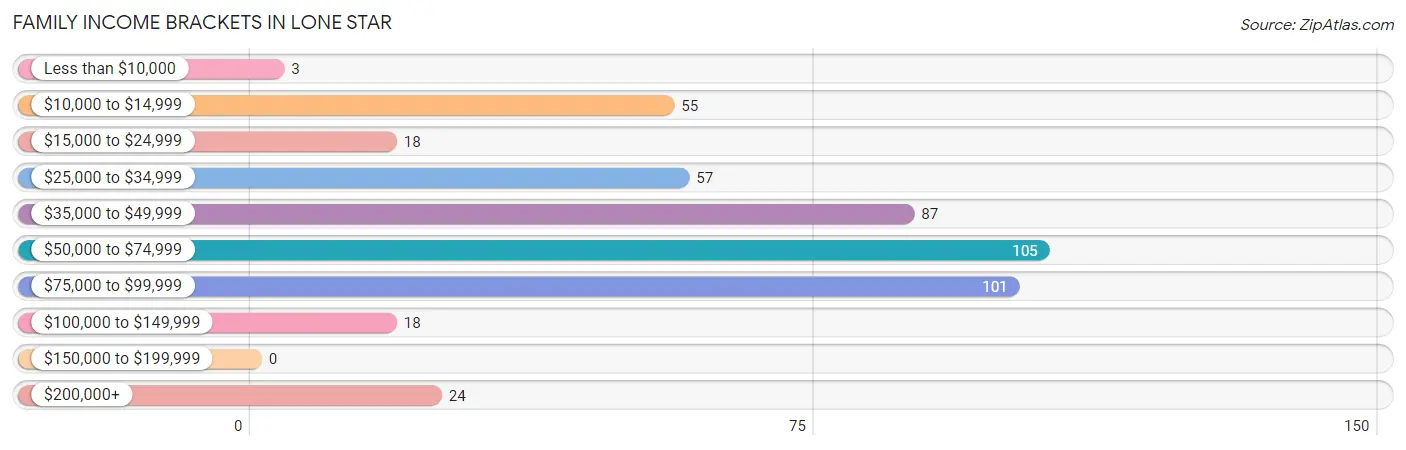
Family Income Brackets in Lone Star
According to the Lone Star family income data, there are 105 families falling into the $50,000 to $74,999 income range, which is the most common income bracket and makes up 22.4% of all families.
| Income Bracket | # Families | % Families |
| Less than $10,000 | 3 | 0.6% |
| $10,000 to $14,999 | 55 | 11.8% |
| $15,000 to $24,999 | 18 | 3.8% |
| $25,000 to $34,999 | 57 | 12.2% |
| $35,000 to $49,999 | 87 | 18.6% |
| $50,000 to $74,999 | 105 | 22.4% |
| $75,000 to $99,999 | 101 | 21.6% |
| $100,000 to $149,999 | 18 | 3.8% |
| $150,000 to $199,999 | 0 | 0.0% |
| $200,000+ | 24 | 5.1% |
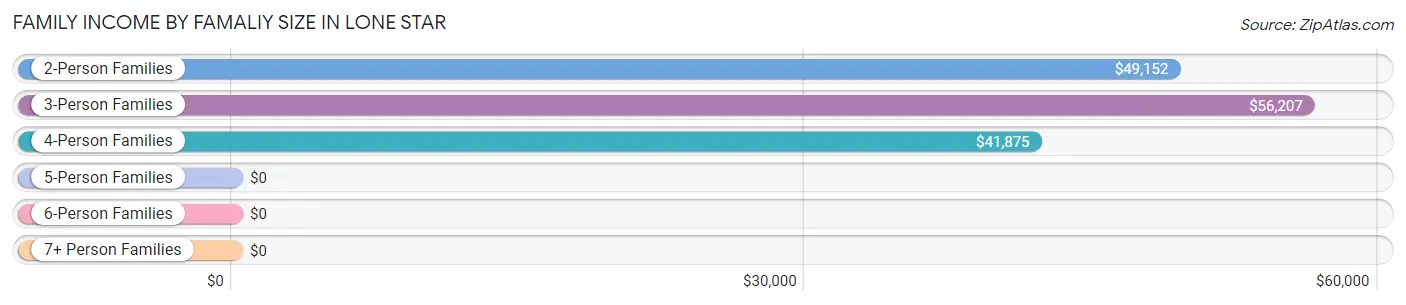
Family Income by Famaliy Size in Lone Star
3-person families (132 | 28.2%) account for the highest median family income in Lone Star with $56,207 per family, while 2-person families (269 | 57.5%) have the highest median income of $24,576 per family member.
| Income Bracket | # Families | Median Income |
| 2-Person Families | 269 (57.5%) | $49,152 |
| 3-Person Families | 132 (28.2%) | $56,207 |
| 4-Person Families | 24 (5.1%) | $41,875 |
| 5-Person Families | 0 (0.0%) | $0 |
| 6-Person Families | 35 (7.5%) | $0 |
| 7+ Person Families | 8 (1.7%) | $0 |
| Total | 468 (100.0%) | $55,172 |
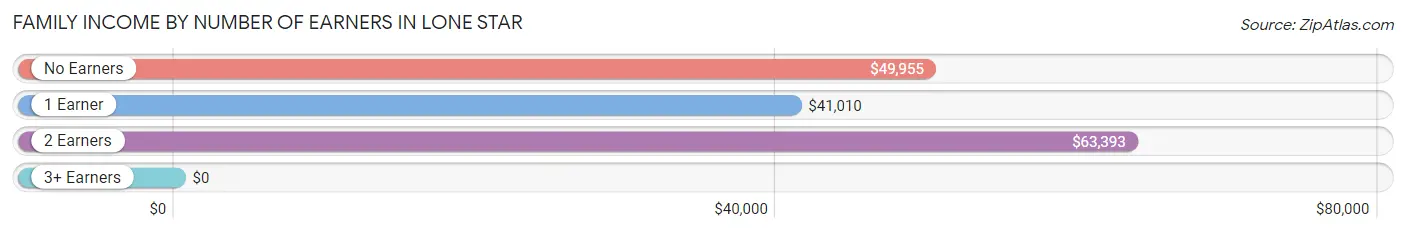
Family Income by Number of Earners in Lone Star
| Number of Earners | # Families | Median Income |
| No Earners | 117 (25.0%) | $49,955 |
| 1 Earner | 211 (45.1%) | $41,010 |
| 2 Earners | 121 (25.9%) | $63,393 |
| 3+ Earners | 19 (4.1%) | $0 |
| Total | 468 (100.0%) | $55,172 |
Household Income in Lone Star
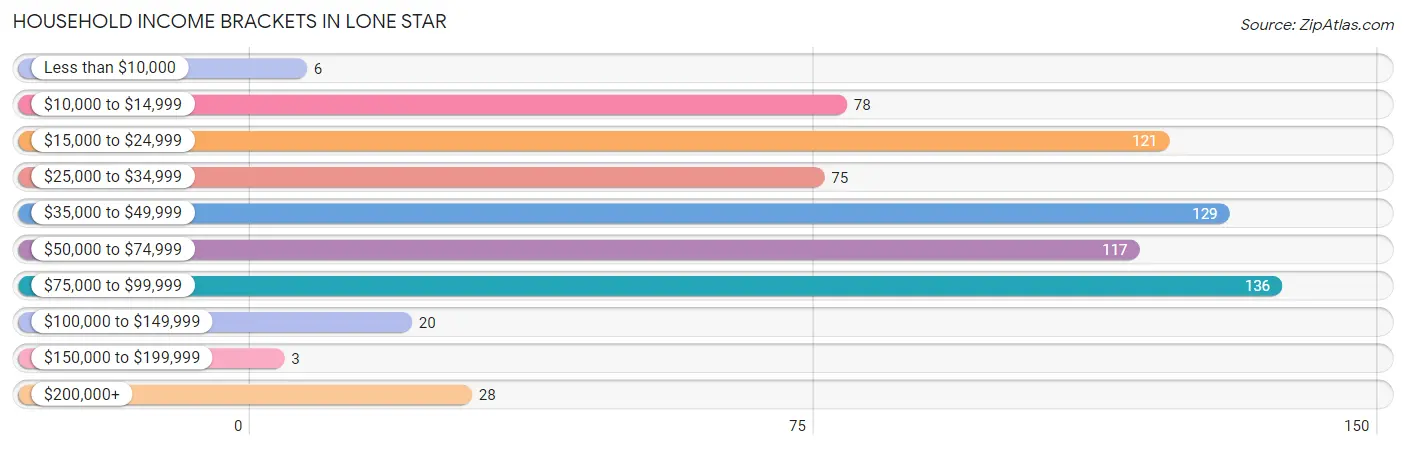
Household Income Brackets in Lone Star
With 136 households falling in the category, the $75,000 to $99,999 income range is the most frequent in Lone Star, accounting for 19.1% of all households. In contrast, only 3 households (0.4%) fall into the $150,000 to $199,999 income bracket, making it the least populous group.
| Income Bracket | # Households | % Households |
| Less than $10,000 | 6 | 0.8% |
| $10,000 to $14,999 | 78 | 10.9% |
| $15,000 to $24,999 | 121 | 17.0% |
| $25,000 to $34,999 | 75 | 10.5% |
| $35,000 to $49,999 | 129 | 18.1% |
| $50,000 to $74,999 | 117 | 16.4% |
| $75,000 to $99,999 | 136 | 19.1% |
| $100,000 to $149,999 | 20 | 2.8% |
| $150,000 to $199,999 | 3 | 0.4% |
| $200,000+ | 28 | 3.9% |
Household Income by Householder Age in Lone Star
The median household income in Lone Star is $41,806, with the highest median household income of $55,345 found in the 65+ years age bracket for the primary householder. A total of 242 households (33.9%) fall into this category. Meanwhile, the 15 to 24 years age bracket for the primary householder has the lowest median household income of $0, with 58 households (8.1%) in this group.
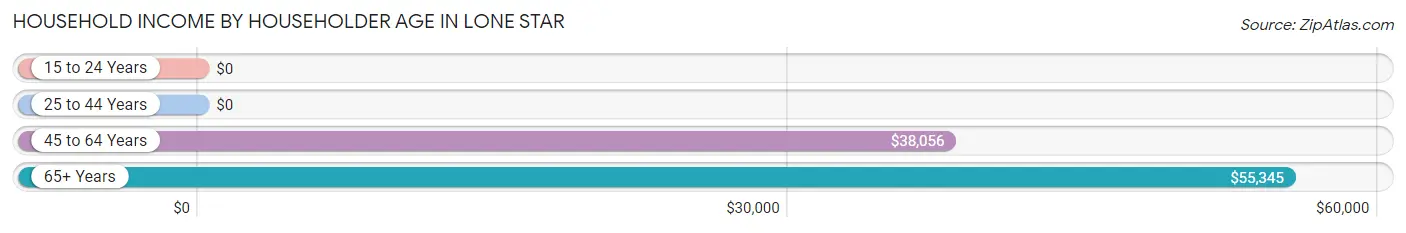
| Income Bracket | # Households | Median Income |
| 15 to 24 Years | 58 (8.1%) | $0 |
| 25 to 44 Years | 205 (28.7%) | $0 |
| 45 to 64 Years | 208 (29.2%) | $38,056 |
| 65+ Years | 242 (33.9%) | $55,345 |
| Total | 713 (100.0%) | $41,806 |
Poverty in Lone Star
Income Below Poverty by Sex and Age in Lone Star
With 13.9% poverty level for males and 17.8% for females among the residents of Lone Star, 18 to 24 year old males and 18 to 24 year old females are the most vulnerable to poverty, with 56 males (44.1%) and 64 females (48.5%) in their respective age groups living below the poverty level.
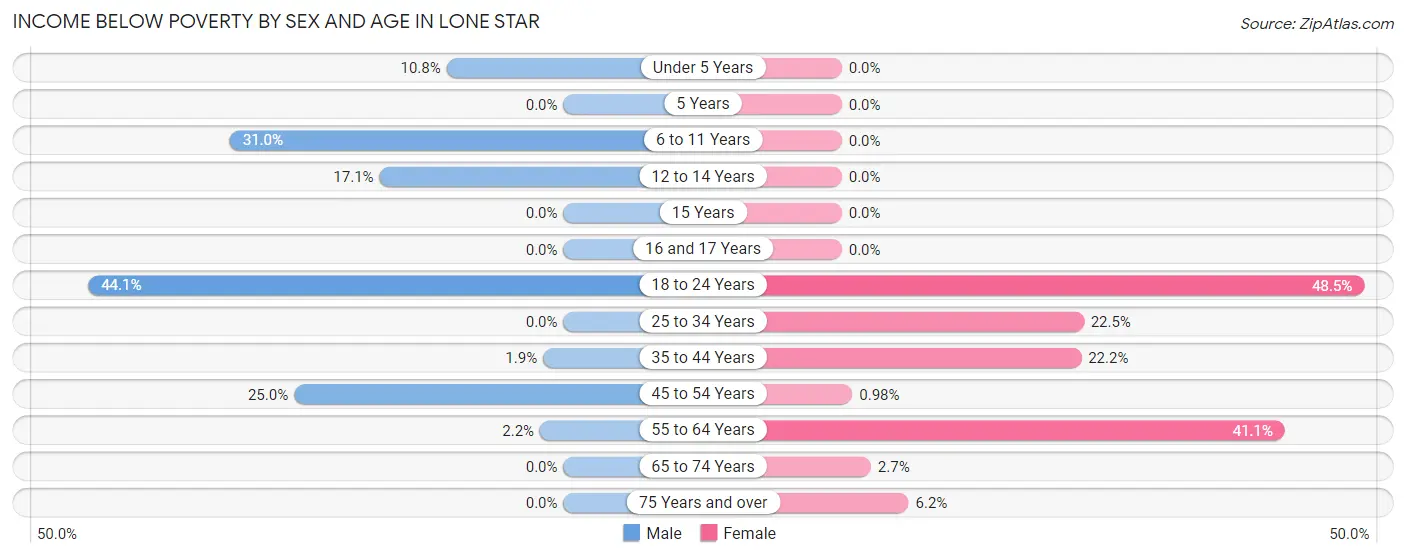
| Age Bracket | Male | Female |
| Under 5 Years | 9 (10.8%) | 0 (0.0%) |
| 5 Years | 0 (0.0%) | 0 (0.0%) |
| 6 to 11 Years | 13 (30.9%) | 0 (0.0%) |
| 12 to 14 Years | 7 (17.1%) | 0 (0.0%) |
| 15 Years | 0 (0.0%) | 0 (0.0%) |
| 16 and 17 Years | 0 (0.0%) | 0 (0.0%) |
| 18 to 24 Years | 56 (44.1%) | 64 (48.5%) |
| 25 to 34 Years | 0 (0.0%) | 11 (22.5%) |
| 35 to 44 Years | 2 (1.9%) | 26 (22.2%) |
| 45 to 54 Years | 24 (25.0%) | 1 (1.0%) |
| 55 to 64 Years | 2 (2.2%) | 37 (41.1%) |
| 65 to 74 Years | 0 (0.0%) | 3 (2.7%) |
| 75 Years and over | 0 (0.0%) | 8 (6.2%) |
| Total | 113 (13.9%) | 150 (17.8%) |
Income Above Poverty by Sex and Age in Lone Star
According to the poverty statistics in Lone Star, males aged 15 years and females aged under 5 years are the age groups that are most secure financially, with 100.0% of males and 100.0% of females in these age groups living above the poverty line.
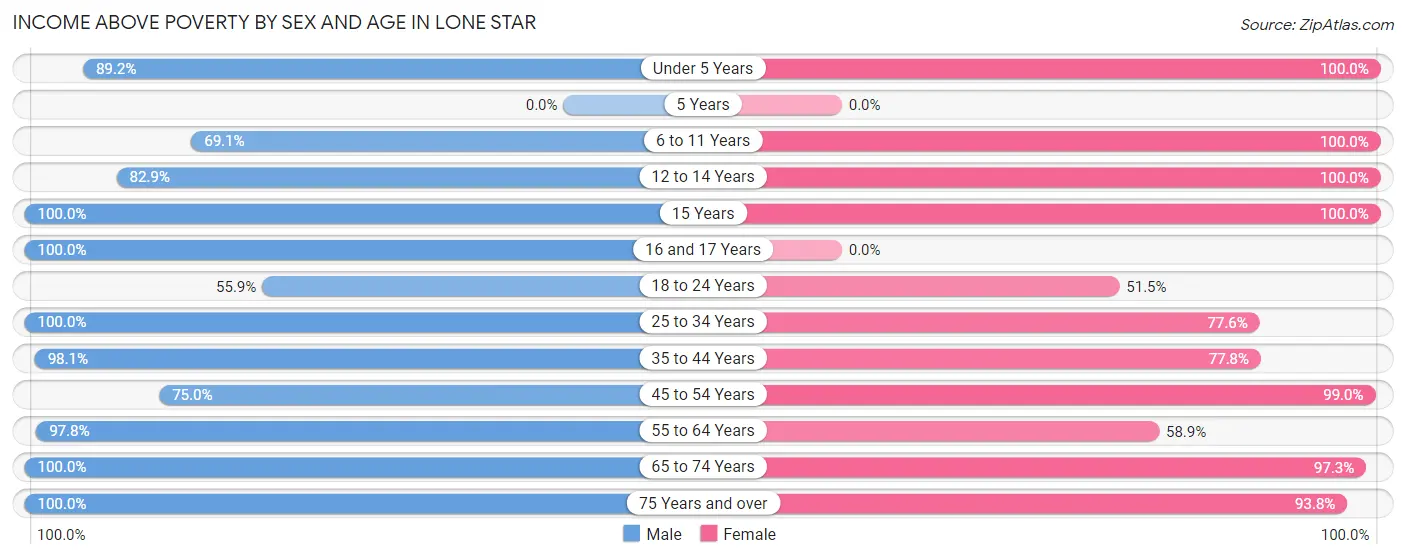
| Age Bracket | Male | Female |
| Under 5 Years | 74 (89.2%) | 64 (100.0%) |
| 5 Years | 0 (0.0%) | 0 (0.0%) |
| 6 to 11 Years | 29 (69.1%) | 23 (100.0%) |
| 12 to 14 Years | 34 (82.9%) | 8 (100.0%) |
| 15 Years | 5 (100.0%) | 17 (100.0%) |
| 16 and 17 Years | 39 (100.0%) | 0 (0.0%) |
| 18 to 24 Years | 71 (55.9%) | 68 (51.5%) |
| 25 to 34 Years | 31 (100.0%) | 38 (77.5%) |
| 35 to 44 Years | 104 (98.1%) | 91 (77.8%) |
| 45 to 54 Years | 72 (75.0%) | 101 (99.0%) |
| 55 to 64 Years | 90 (97.8%) | 53 (58.9%) |
| 65 to 74 Years | 97 (100.0%) | 108 (97.3%) |
| 75 Years and over | 52 (100.0%) | 121 (93.8%) |
| Total | 698 (86.1%) | 692 (82.2%) |
Income Below Poverty Among Married-Couple Families in Lone Star
| Children | Above Poverty | Below Poverty |
| No Children | 167 (100.0%) | 0 (0.0%) |
| 1 or 2 Children | 76 (100.0%) | 0 (0.0%) |
| 3 or 4 Children | 39 (100.0%) | 0 (0.0%) |
| 5 or more Children | 0 (0.0%) | 0 (0.0%) |
| Total | 282 (100.0%) | 0 (0.0%) |
Income Below Poverty Among Single-Parent Households in Lone Star
According to the poverty data in Lone Star, 100.0% or 39 single-father households and 17.7% or 26 single-mother households are living below the poverty line. Among single-father households, those with no children have the highest poverty rate, with 22 households (100.0%) experiencing poverty. Likewise, among single-mother households, those with 1 or 2 children have the highest poverty rate, with 16 households (31.4%) falling below the poverty line.
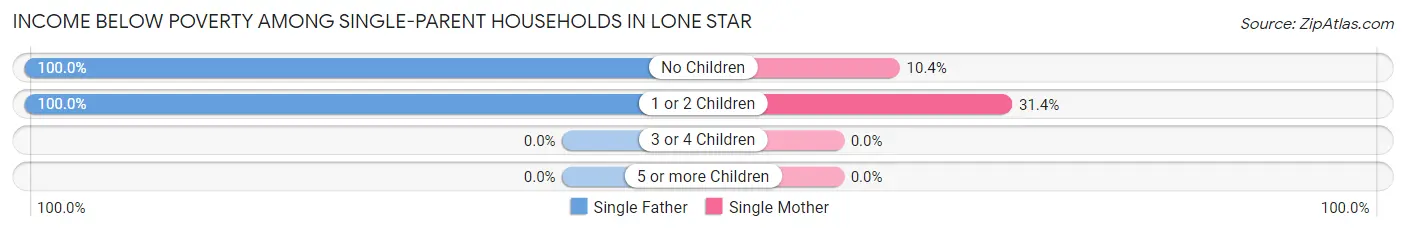
| Children | Single Father | Single Mother |
| No Children | 22 (100.0%) | 10 (10.4%) |
| 1 or 2 Children | 17 (100.0%) | 16 (31.4%) |
| 3 or 4 Children | 0 (0.0%) | 0 (0.0%) |
| 5 or more Children | 0 (0.0%) | 0 (0.0%) |
| Total | 39 (100.0%) | 26 (17.7%) |
Income Below Poverty Among Married-Couple vs Single-Parent Households in Lone Star
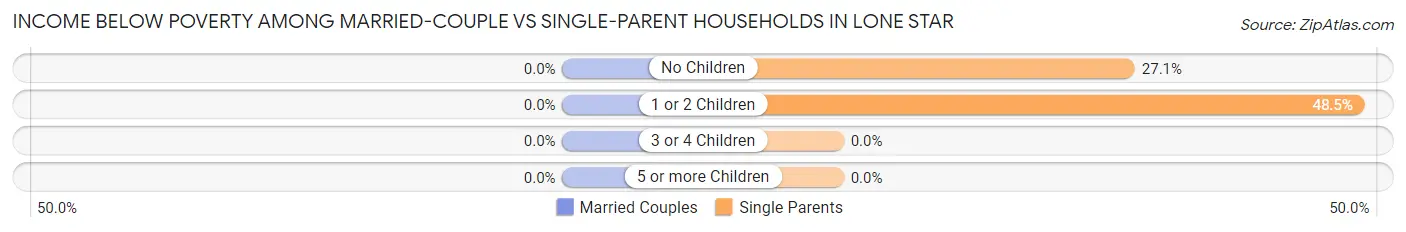
| Children | Married-Couple Families | Single-Parent Households |
| No Children | 0 (0.0%) | 32 (27.1%) |
| 1 or 2 Children | 0 (0.0%) | 33 (48.5%) |
| 3 or 4 Children | 0 (0.0%) | 0 (0.0%) |
| 5 or more Children | 0 (0.0%) | 0 (0.0%) |
| Total | 0 (0.0%) | 65 (34.9%) |
Race in Lone Star
The most populous races in Lone Star are White / Caucasian (1,078 | 65.2%), Black / African American (463 | 28.0%), and Hispanic or Latino (68 | 4.1%).
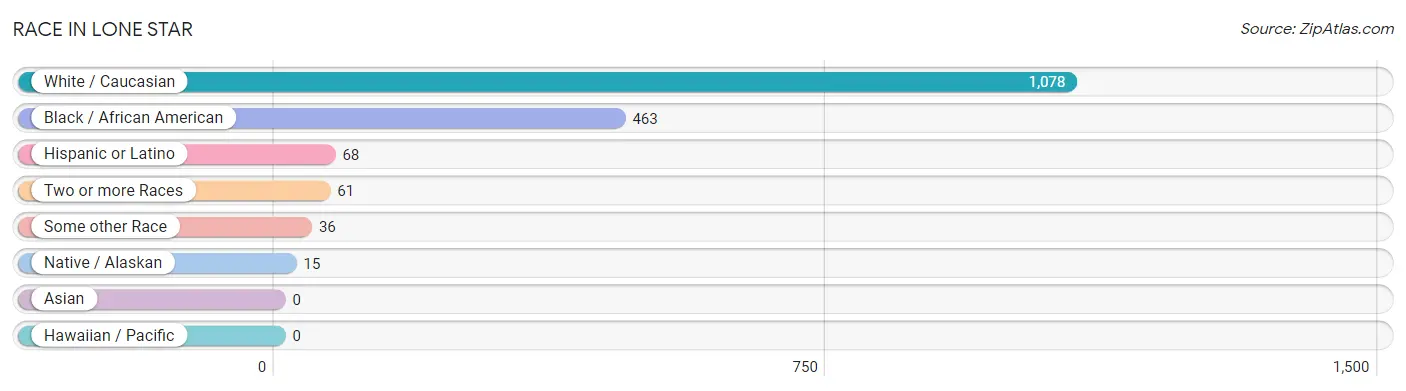
| Race | # Population | % Population |
| Asian | 0 | 0.0% |
| Black / African American | 463 | 28.0% |
| Hawaiian / Pacific | 0 | 0.0% |
| Hispanic or Latino | 68 | 4.1% |
| Native / Alaskan | 15 | 0.9% |
| White / Caucasian | 1,078 | 65.2% |
| Two or more Races | 61 | 3.7% |
| Some other Race | 36 | 2.2% |
| Total | 1,653 | 100.0% |
Ancestry in Lone Star
The most populous ancestries reported in Lone Star are American (846 | 51.2%), English (147 | 8.9%), German (144 | 8.7%), Mexican (58 | 3.5%), and Irish (48 | 2.9%), together accounting for 75.2% of all Lone Star residents.
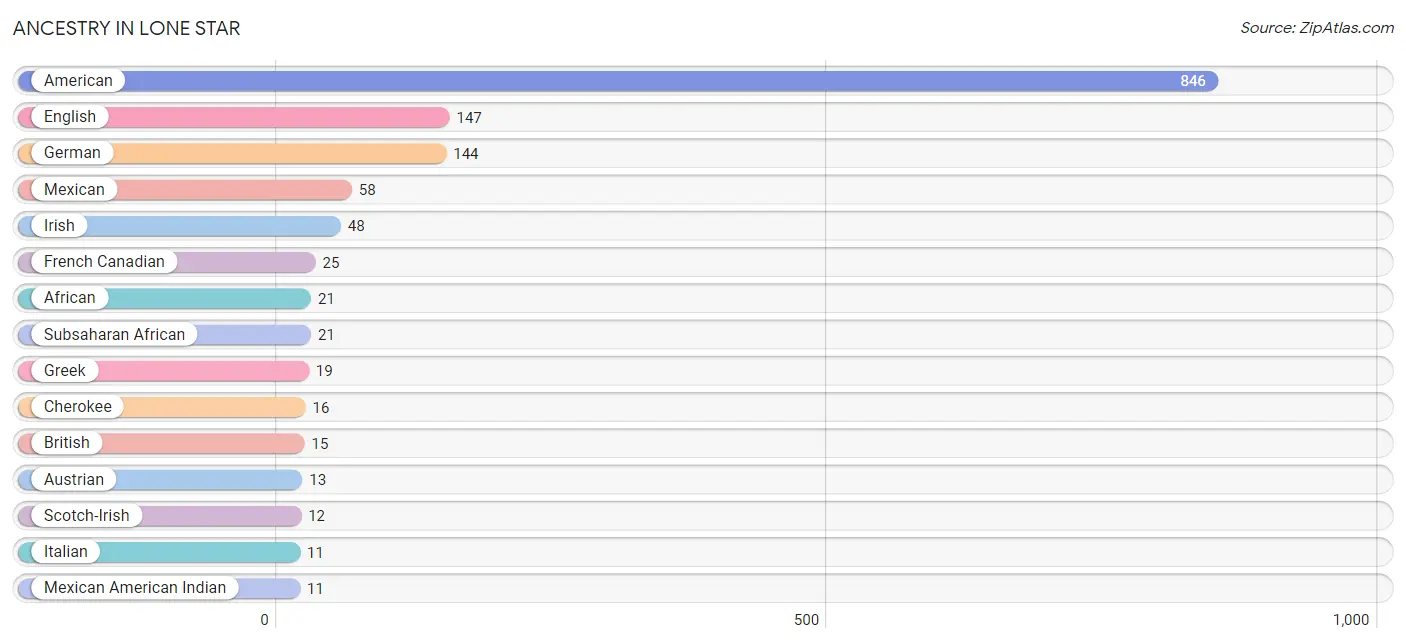
| Ancestry | # Population | % Population |
| African | 21 | 1.3% |
| American | 846 | 51.2% |
| Austrian | 13 | 0.8% |
| British | 15 | 0.9% |
| Cherokee | 16 | 1.0% |
| Choctaw | 2 | 0.1% |
| Dutch | 8 | 0.5% |
| English | 147 | 8.9% |
| European | 3 | 0.2% |
| French | 2 | 0.1% |
| French Canadian | 25 | 1.5% |
| German | 144 | 8.7% |
| Greek | 19 | 1.1% |
| Irish | 48 | 2.9% |
| Italian | 11 | 0.7% |
| Mexican | 58 | 3.5% |
| Mexican American Indian | 11 | 0.7% |
| Scotch-Irish | 12 | 0.7% |
| Subsaharan African | 21 | 1.3% | View All 19 Rows |
Immigrants in Lone Star
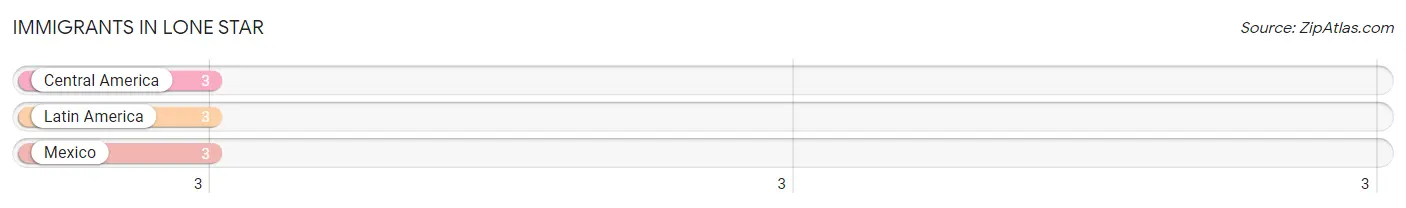
The most numerous immigrant groups reported in Lone Star came from Central America (3 | 0.2%), Latin America (3 | 0.2%), and Mexico (3 | 0.2%), together accounting for 0.5% of all Lone Star residents.
| Immigration Origin | # Population | % Population |
| Central America | 3 | 0.2% |
| Latin America | 3 | 0.2% |
| Mexico | 3 | 0.2% | View All 3 Rows |
Sex and Age in Lone Star
Sex and Age in Lone Star
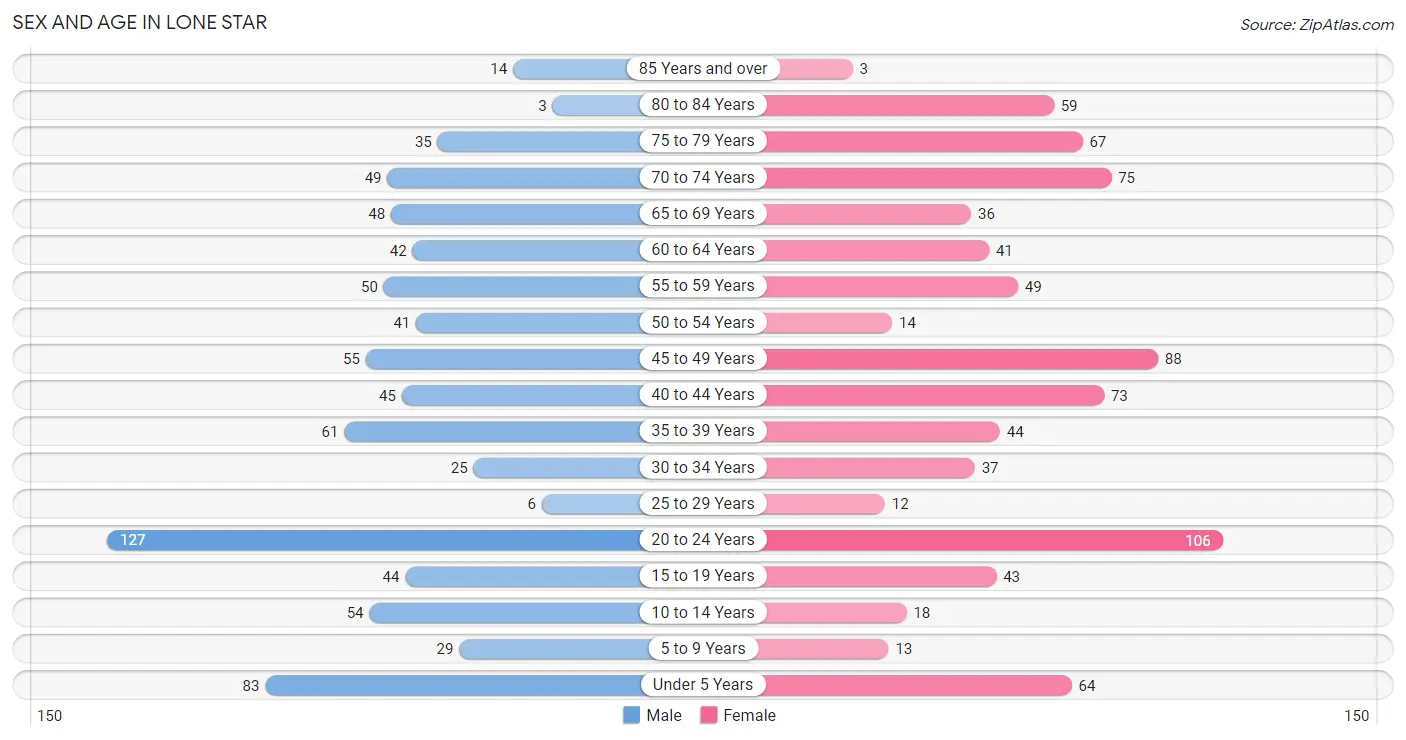
The most populous age groups in Lone Star are 20 to 24 Years (127 | 15.7%) for men and 20 to 24 Years (106 | 12.6%) for women.
| Age Bracket | Male | Female |
| Under 5 Years | 83 (10.2%) | 64 (7.6%) |
| 5 to 9 Years | 29 (3.6%) | 13 (1.5%) |
| 10 to 14 Years | 54 (6.7%) | 18 (2.1%) |
| 15 to 19 Years | 44 (5.4%) | 43 (5.1%) |
| 20 to 24 Years | 127 (15.7%) | 106 (12.6%) |
| 25 to 29 Years | 6 (0.7%) | 12 (1.4%) |
| 30 to 34 Years | 25 (3.1%) | 37 (4.4%) |
| 35 to 39 Years | 61 (7.5%) | 44 (5.2%) |
| 40 to 44 Years | 45 (5.6%) | 73 (8.7%) |
| 45 to 49 Years | 55 (6.8%) | 88 (10.4%) |
| 50 to 54 Years | 41 (5.1%) | 14 (1.7%) |
| 55 to 59 Years | 50 (6.2%) | 49 (5.8%) |
| 60 to 64 Years | 42 (5.2%) | 41 (4.9%) |
| 65 to 69 Years | 48 (5.9%) | 36 (4.3%) |
| 70 to 74 Years | 49 (6.0%) | 75 (8.9%) |
| 75 to 79 Years | 35 (4.3%) | 67 (8.0%) |
| 80 to 84 Years | 3 (0.4%) | 59 (7.0%) |
| 85 Years and over | 14 (1.7%) | 3 (0.4%) |
| Total | 811 (100.0%) | 842 (100.0%) |
Families and Households in Lone Star
Median Family Size in Lone Star
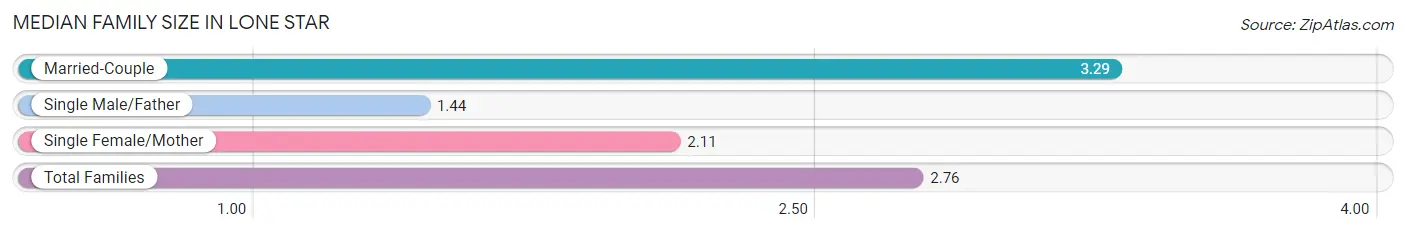
The median family size in Lone Star is 2.76 persons per family, with married-couple families (282 | 60.3%) accounting for the largest median family size of 3.29 persons per family. On the other hand, single male/father families (39 | 8.3%) represent the smallest median family size with 1.44 persons per family.
| Family Type | # Families | Family Size |
| Married-Couple | 282 (60.3%) | 3.29 |
| Single Male/Father | 39 (8.3%) | 1.44 |
| Single Female/Mother | 147 (31.4%) | 2.11 |
| Total Families | 468 (100.0%) | 2.76 |
Median Household Size in Lone Star
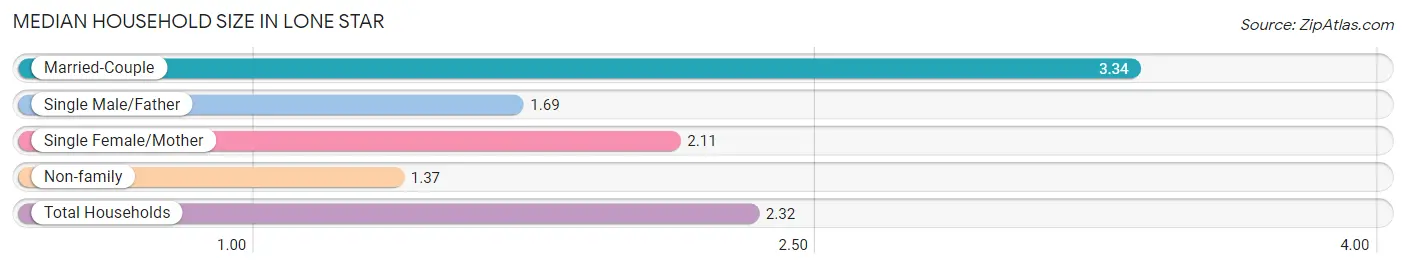
The median household size in Lone Star is 2.32 persons per household, with married-couple households (282 | 39.6%) accounting for the largest median household size of 3.34 persons per household. non-family households (245 | 34.4%) represent the smallest median household size with 1.37 persons per household.
| Household Type | # Households | Household Size |
| Married-Couple | 282 (39.6%) | 3.34 |
| Single Male/Father | 39 (5.5%) | 1.69 |
| Single Female/Mother | 147 (20.6%) | 2.11 |
| Non-family | 245 (34.4%) | 1.37 |
| Total Households | 713 (100.0%) | 2.32 |
Household Size by Marriage Status in Lone Star
Out of a total of 713 households in Lone Star, 468 (65.6%) are family households, while 245 (34.4%) are nonfamily households. The most numerous type of family households are 2-person households, comprising 247, and the most common type of nonfamily households are 1-person households, comprising 179.
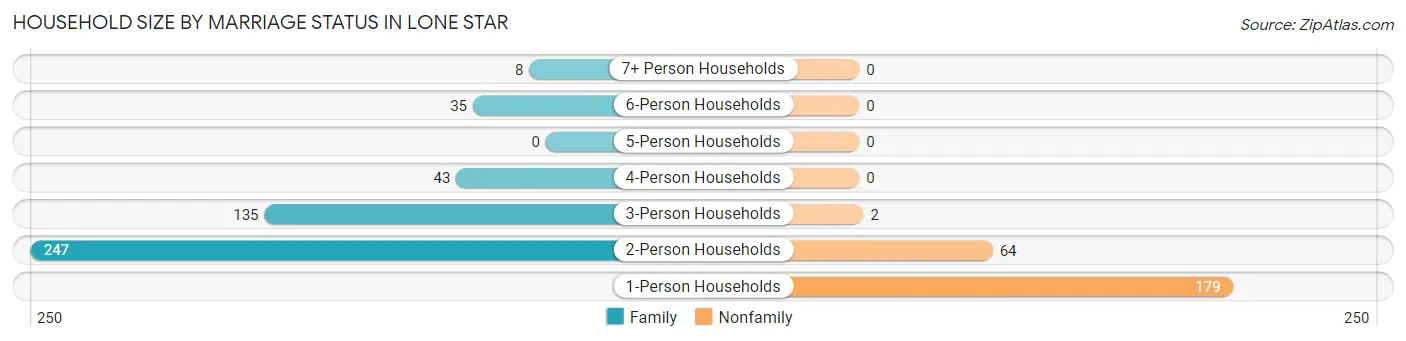
| Household Size | Family Households | Nonfamily Households |
| 1-Person Households | - | 179 (25.1%) |
| 2-Person Households | 247 (34.6%) | 64 (9.0%) |
| 3-Person Households | 135 (18.9%) | 2 (0.3%) |
| 4-Person Households | 43 (6.0%) | 0 (0.0%) |
| 5-Person Households | 0 (0.0%) | 0 (0.0%) |
| 6-Person Households | 35 (4.9%) | 0 (0.0%) |
| 7+ Person Households | 8 (1.1%) | 0 (0.0%) |
| Total | 468 (65.6%) | 245 (34.4%) |
Female Fertility in Lone Star
Fertility by Age in Lone Star
Average fertility rate in Lone Star is 82.0 births per 1,000 women. Women in the age bracket of 15 to 19 years have the highest fertility rate with 186.0 births per 1,000 women. Women in the age bracket of 20 to 34 years acount for 48.5% of all women with births.
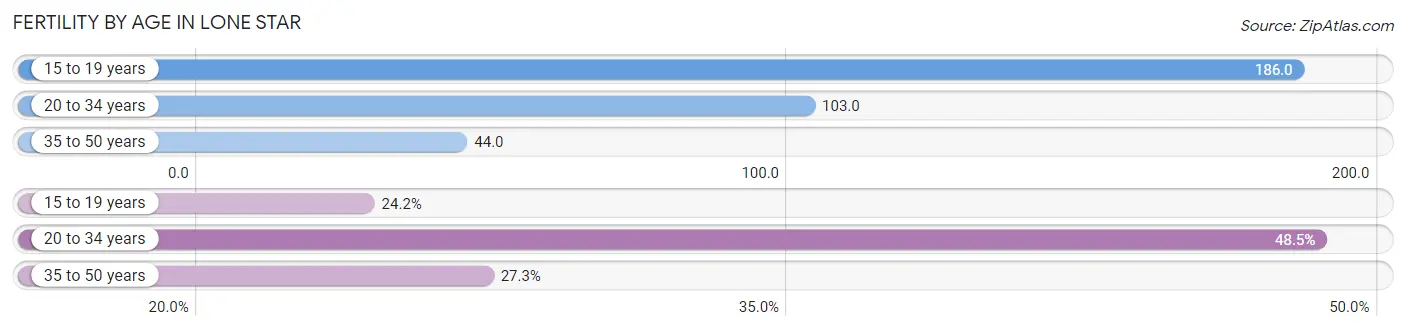
| Age Bracket | Women with Births | Births / 1,000 Women |
| 15 to 19 years | 8 (24.2%) | 186.0 |
| 20 to 34 years | 16 (48.5%) | 103.0 |
| 35 to 50 years | 9 (27.3%) | 44.0 |
| Total | 33 (100.0%) | 82.0 |
Fertility by Age by Marriage Status in Lone Star
48.5% of women with births (33) in Lone Star are married. The highest percentage of unmarried women with births falls into 15 to 19 years age bracket with 100.0% of them unmarried at the time of birth, while the lowest percentage of unmarried women with births belong to 20 to 34 years age bracket with 0.0% of them unmarried.
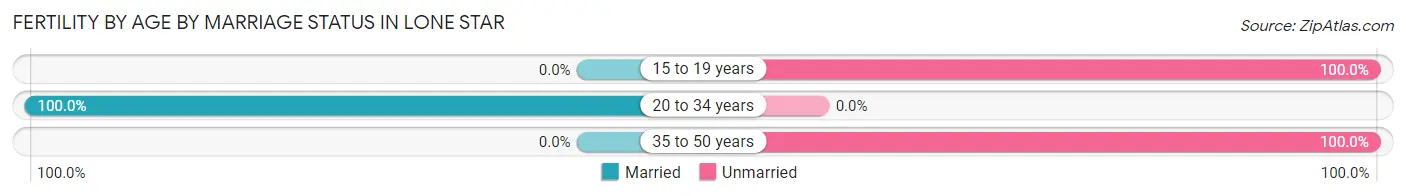
| Age Bracket | Married | Unmarried |
| 15 to 19 years | 0 (0.0%) | 8 (100.0%) |
| 20 to 34 years | 16 (100.0%) | 0 (0.0%) |
| 35 to 50 years | 0 (0.0%) | 9 (100.0%) |
| Total | 16 (48.5%) | 17 (51.5%) |
Fertility by Education in Lone Star
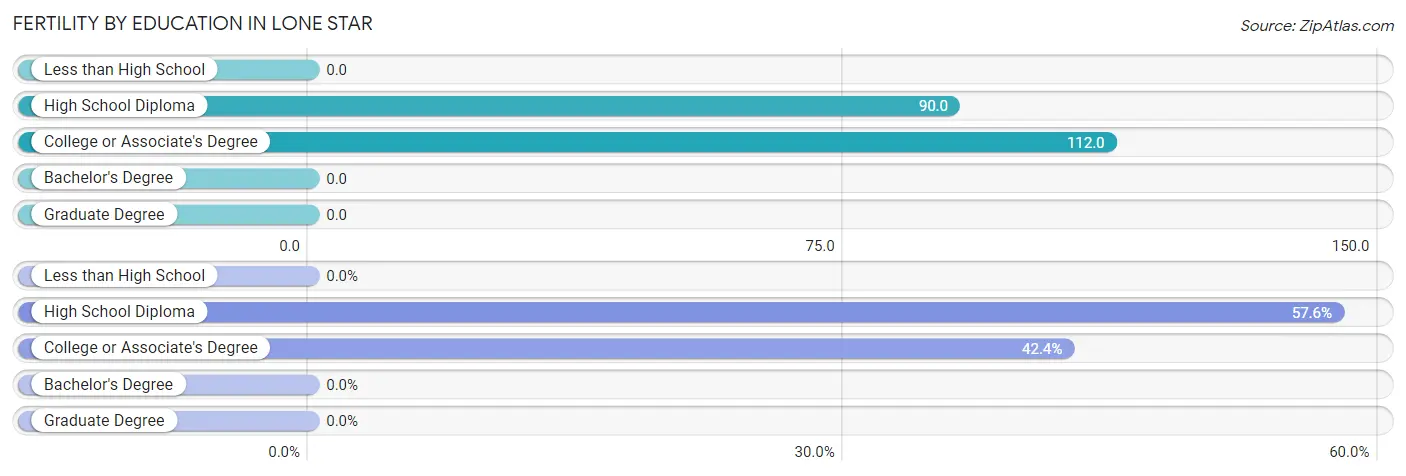
| Educational Attainment | Women with Births | Births / 1,000 Women |
| Less than High School | 0 (0.0%) | 0.0 |
| High School Diploma | 19 (57.6%) | 90.0 |
| College or Associate's Degree | 14 (42.4%) | 112.0 |
| Bachelor's Degree | 0 (0.0%) | 0.0 |
| Graduate Degree | 0 (0.0%) | 0.0 |
| Total | 33 (100.0%) | 82.0 |
Fertility by Education by Marriage Status in Lone Star
51.5% of women with births in Lone Star are unmarried. Women with the educational attainment of high school diploma are most likely to be married with 84.2% of them married at childbirth, while women with the educational attainment of college or associate's degree are least likely to be married with 100.0% of them unmarried at childbirth.
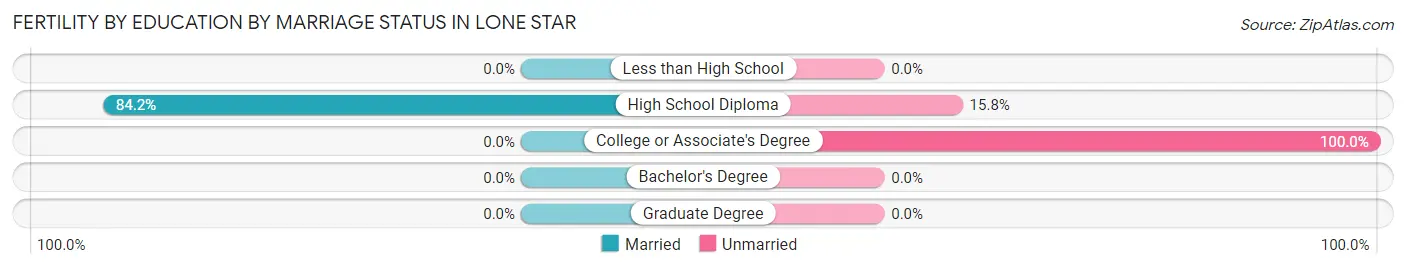
| Educational Attainment | Married | Unmarried |
| Less than High School | 0 (0.0%) | 0 (0.0%) |
| High School Diploma | 16 (84.2%) | 3 (15.8%) |
| College or Associate's Degree | 0 (0.0%) | 14 (100.0%) |
| Bachelor's Degree | 0 (0.0%) | 0 (0.0%) |
| Graduate Degree | 0 (0.0%) | 0 (0.0%) |
| Total | 16 (48.5%) | 17 (51.5%) |
Employment Characteristics in Lone Star
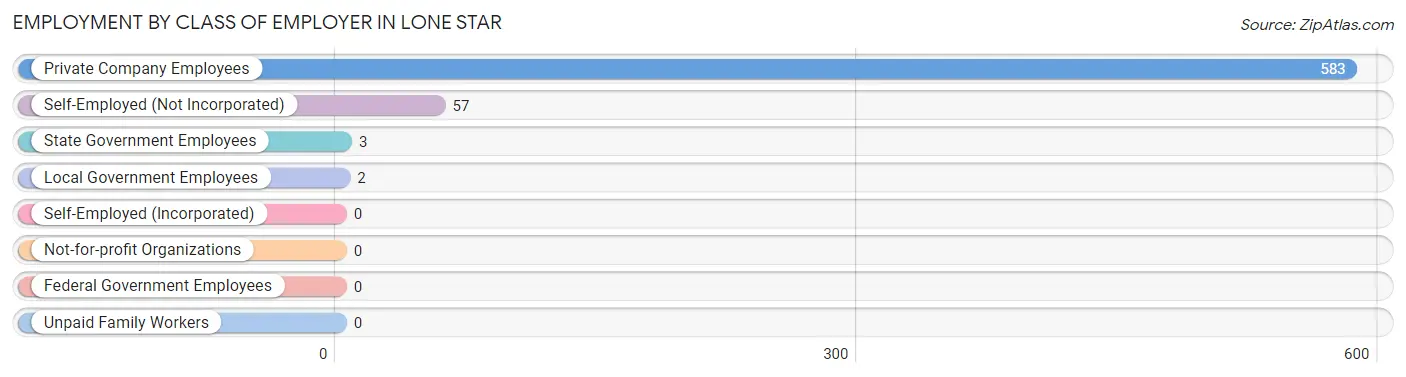
Employment by Class of Employer in Lone Star
Among the 645 employed individuals in Lone Star, private company employees (583 | 90.4%), self-employed (not incorporated) (57 | 8.8%), and state government employees (3 | 0.5%) make up the most common classes of employment.
| Employer Class | # Employees | % Employees |
| Private Company Employees | 583 | 90.4% |
| Self-Employed (Incorporated) | 0 | 0.0% |
| Self-Employed (Not Incorporated) | 57 | 8.8% |
| Not-for-profit Organizations | 0 | 0.0% |
| Local Government Employees | 2 | 0.3% |
| State Government Employees | 3 | 0.5% |
| Federal Government Employees | 0 | 0.0% |
| Unpaid Family Workers | 0 | 0.0% |
| Total | 645 | 100.0% |
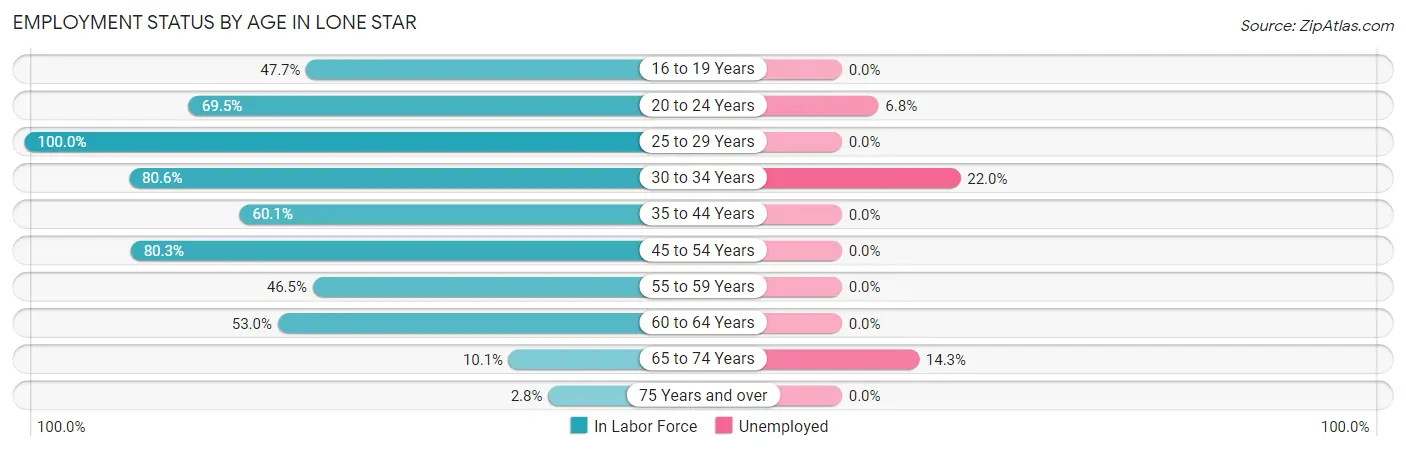
Employment Status by Age in Lone Star
According to the labor force statistics for Lone Star, out of the total population over 16 years of age (1,370), 48.9% or 670 individuals are in the labor force, with 3.7% or 25 of them unemployed. The age group with the highest labor force participation rate is 25 to 29 years, with 100.0% or 18 individuals in the labor force. Within the labor force, the 30 to 34 years age range has the highest percentage of unemployed individuals, with 22.0% or 11 of them being unemployed.
| Age Bracket | In Labor Force | Unemployed |
| 16 to 19 Years | 31 (47.7%) | 0 (0.0%) |
| 20 to 24 Years | 162 (69.5%) | 11 (6.8%) |
| 25 to 29 Years | 18 (100.0%) | 0 (0.0%) |
| 30 to 34 Years | 50 (80.6%) | 11 (22.0%) |
| 35 to 44 Years | 134 (60.1%) | 0 (0.0%) |
| 45 to 54 Years | 159 (80.3%) | 0 (0.0%) |
| 55 to 59 Years | 46 (46.5%) | 0 (0.0%) |
| 60 to 64 Years | 44 (53.0%) | 0 (0.0%) |
| 65 to 74 Years | 21 (10.1%) | 3 (14.3%) |
| 75 Years and over | 5 (2.8%) | 0 (0.0%) |
| Total | 670 (48.9%) | 25 (3.7%) |
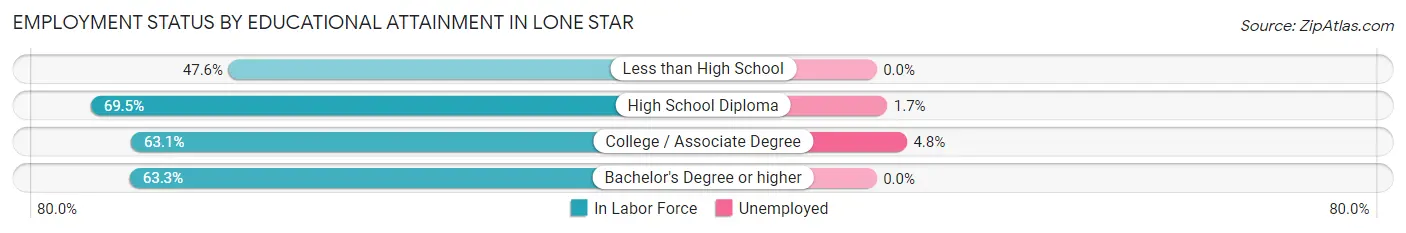
Employment Status by Educational Attainment in Lone Star
According to labor force statistics for Lone Star, 66.0% of individuals (451) out of the total population between 25 and 64 years of age (683) are in the labor force, with 2.4% or 11 of them being unemployed. The group with the highest labor force participation rate are those with the educational attainment of high school diploma, with 69.5% or 287 individuals in the labor force. Within the labor force, individuals with college / associate degree education have the highest percentage of unemployment, with 4.8% or 6 of them being unemployed.
| Educational Attainment | In Labor Force | Unemployed |
| Less than High School | 20 (47.6%) | 0 (0.0%) |
| High School Diploma | 287 (69.5%) | 7 (1.7%) |
| College / Associate Degree | 125 (63.1%) | 10 (4.8%) |
| Bachelor's Degree or higher | 19 (63.3%) | 0 (0.0%) |
| Total | 451 (66.0%) | 16 (2.4%) |
Employment Occupations by Sex in Lone Star
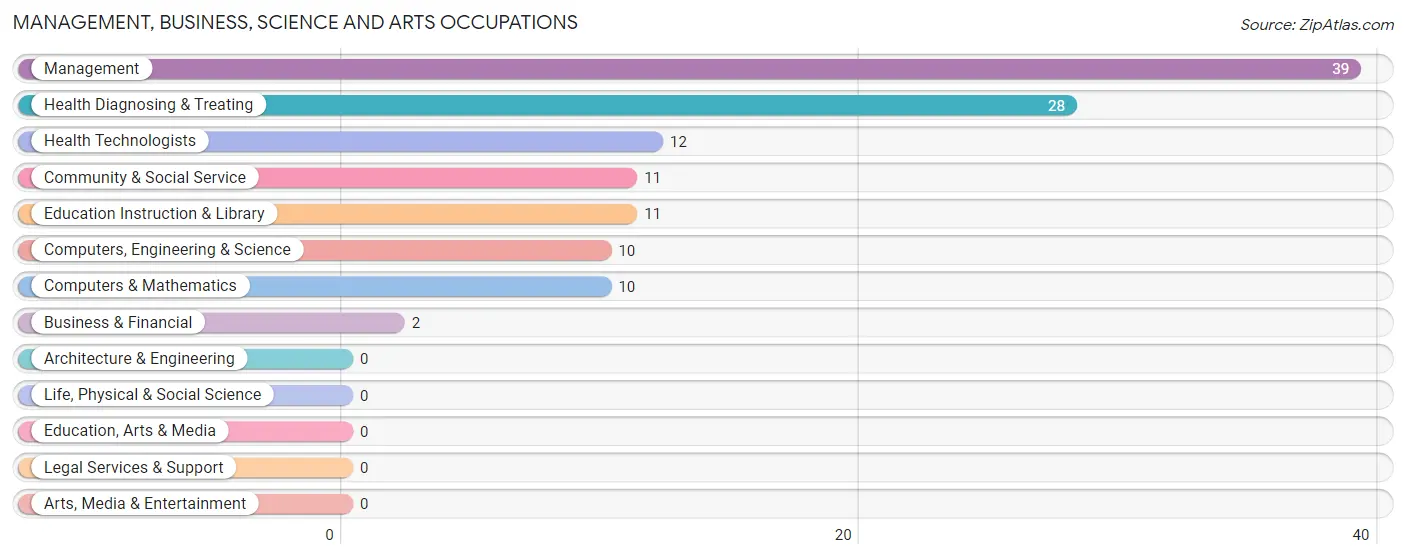
Management, Business, Science and Arts Occupations
The most common Management, Business, Science and Arts occupations in Lone Star are Management (39 | 6.0%), Health Diagnosing & Treating (28 | 4.3%), Health Technologists (12 | 1.9%), Community & Social Service (11 | 1.7%), and Education Instruction & Library (11 | 1.7%).
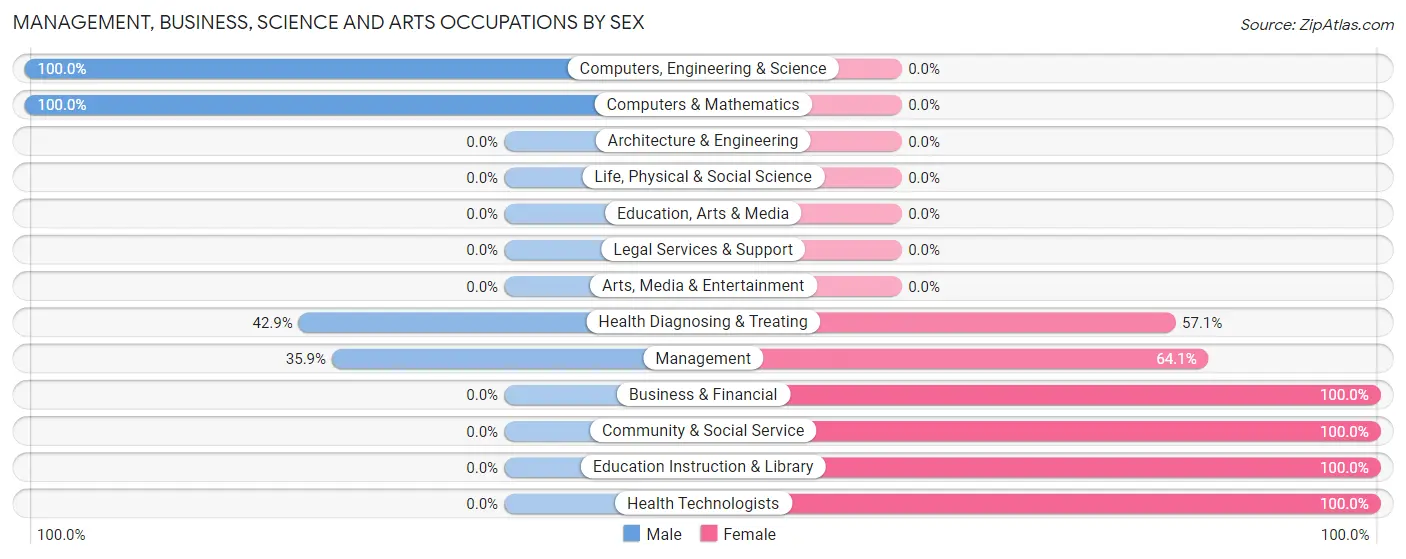
Management, Business, Science and Arts Occupations by Sex
Within the Management, Business, Science and Arts occupations in Lone Star, the most male-oriented occupations are Computers, Engineering & Science (100.0%), Computers & Mathematics (100.0%), and Health Diagnosing & Treating (42.9%), while the most female-oriented occupations are Business & Financial (100.0%), Community & Social Service (100.0%), and Education Instruction & Library (100.0%).
| Occupation | Male | Female |
| Management | 14 (35.9%) | 25 (64.1%) |
| Business & Financial | 0 (0.0%) | 2 (100.0%) |
| Computers, Engineering & Science | 10 (100.0%) | 0 (0.0%) |
| Computers & Mathematics | 10 (100.0%) | 0 (0.0%) |
| Architecture & Engineering | 0 (0.0%) | 0 (0.0%) |
| Life, Physical & Social Science | 0 (0.0%) | 0 (0.0%) |
| Community & Social Service | 0 (0.0%) | 11 (100.0%) |
| Education, Arts & Media | 0 (0.0%) | 0 (0.0%) |
| Legal Services & Support | 0 (0.0%) | 0 (0.0%) |
| Education Instruction & Library | 0 (0.0%) | 11 (100.0%) |
| Arts, Media & Entertainment | 0 (0.0%) | 0 (0.0%) |
| Health Diagnosing & Treating | 12 (42.9%) | 16 (57.1%) |
| Health Technologists | 0 (0.0%) | 12 (100.0%) |
| Total (Category) | 36 (40.0%) | 54 (60.0%) |
| Total (Overall) | 339 (52.6%) | 306 (47.4%) |
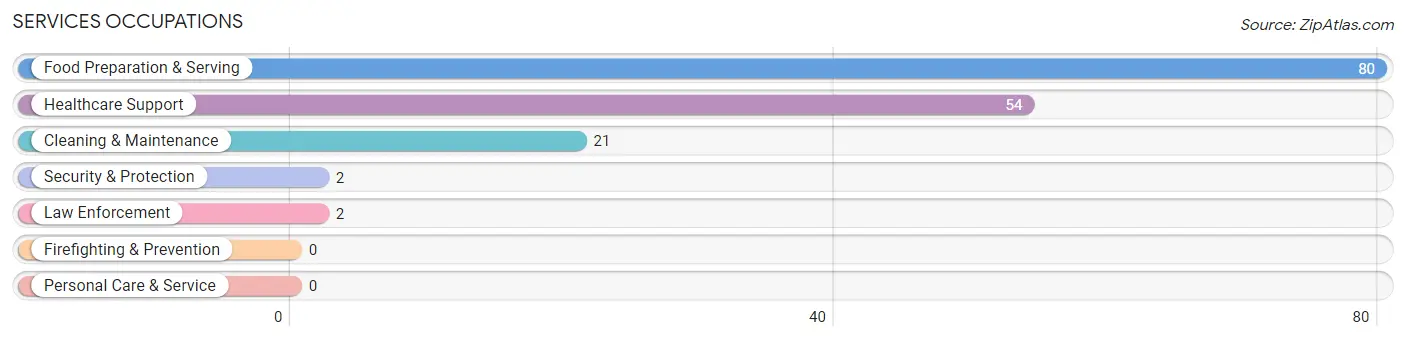
Services Occupations
The most common Services occupations in Lone Star are Food Preparation & Serving (80 | 12.4%), Healthcare Support (54 | 8.4%), Cleaning & Maintenance (21 | 3.3%), Security & Protection (2 | 0.3%), and Law Enforcement (2 | 0.3%).
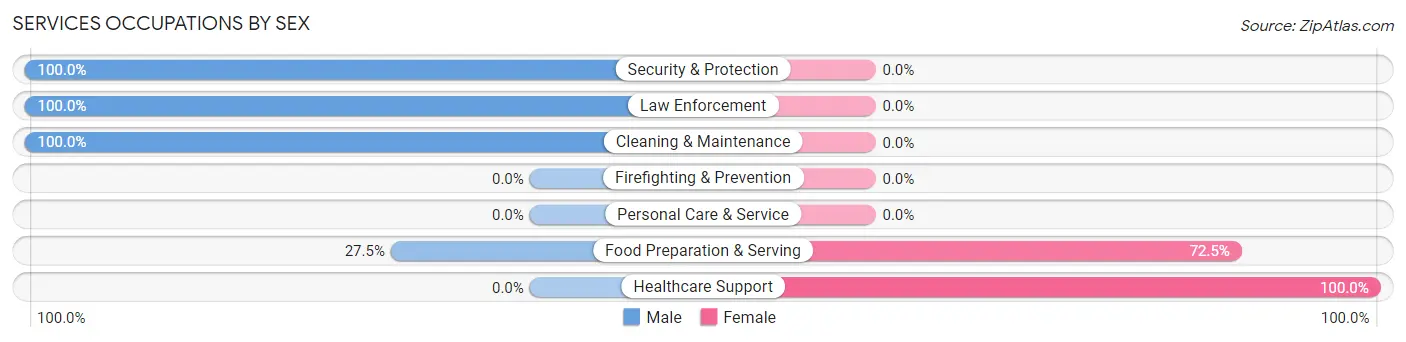
Services Occupations by Sex
Within the Services occupations in Lone Star, the most male-oriented occupations are Security & Protection (100.0%), Law Enforcement (100.0%), and Cleaning & Maintenance (100.0%), while the most female-oriented occupations are Healthcare Support (100.0%), and Food Preparation & Serving (72.5%).
| Occupation | Male | Female |
| Healthcare Support | 0 (0.0%) | 54 (100.0%) |
| Security & Protection | 2 (100.0%) | 0 (0.0%) |
| Firefighting & Prevention | 0 (0.0%) | 0 (0.0%) |
| Law Enforcement | 2 (100.0%) | 0 (0.0%) |
| Food Preparation & Serving | 22 (27.5%) | 58 (72.5%) |
| Cleaning & Maintenance | 21 (100.0%) | 0 (0.0%) |
| Personal Care & Service | 0 (0.0%) | 0 (0.0%) |
| Total (Category) | 45 (28.7%) | 112 (71.3%) |
| Total (Overall) | 339 (52.6%) | 306 (47.4%) |
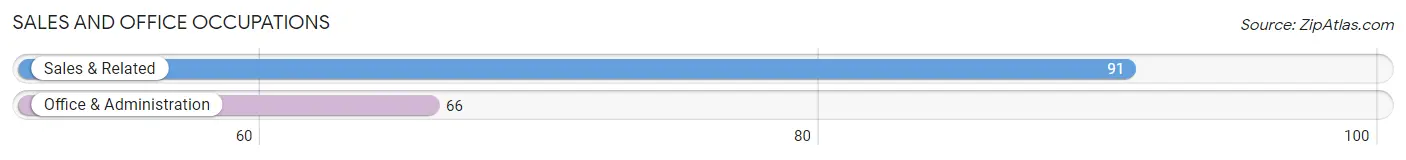
Sales and Office Occupations
The most common Sales and Office occupations in Lone Star are Sales & Related (91 | 14.1%), and Office & Administration (66 | 10.2%).
Sales and Office Occupations by Sex
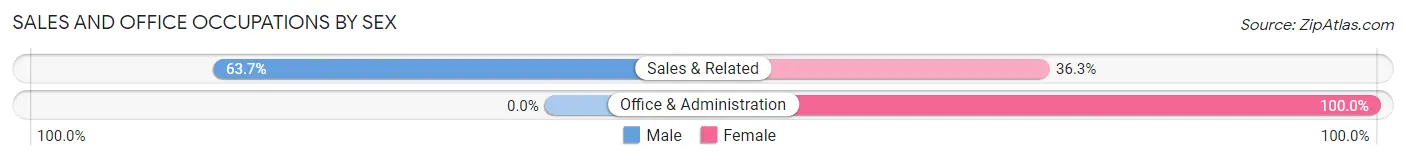
| Occupation | Male | Female |
| Sales & Related | 58 (63.7%) | 33 (36.3%) |
| Office & Administration | 0 (0.0%) | 66 (100.0%) |
| Total (Category) | 58 (36.9%) | 99 (63.1%) |
| Total (Overall) | 339 (52.6%) | 306 (47.4%) |
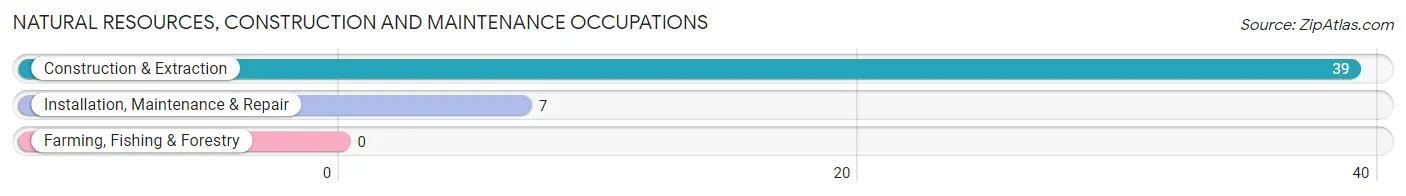
Natural Resources, Construction and Maintenance Occupations
The most common Natural Resources, Construction and Maintenance occupations in Lone Star are Construction & Extraction (39 | 6.0%), and Installation, Maintenance & Repair (7 | 1.1%).
Natural Resources, Construction and Maintenance Occupations by Sex
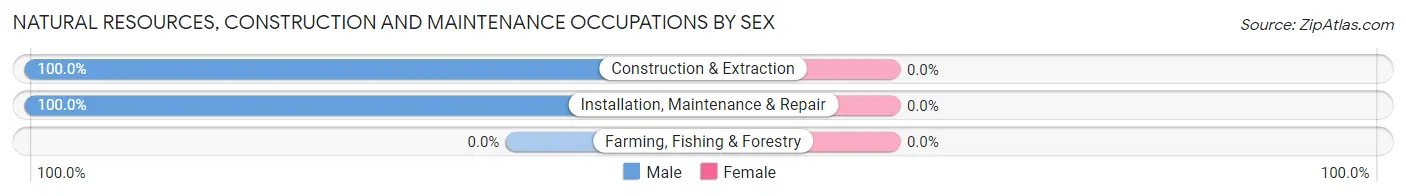
| Occupation | Male | Female |
| Farming, Fishing & Forestry | 0 (0.0%) | 0 (0.0%) |
| Construction & Extraction | 39 (100.0%) | 0 (0.0%) |
| Installation, Maintenance & Repair | 7 (100.0%) | 0 (0.0%) |
| Total (Category) | 46 (100.0%) | 0 (0.0%) |
| Total (Overall) | 339 (52.6%) | 306 (47.4%) |
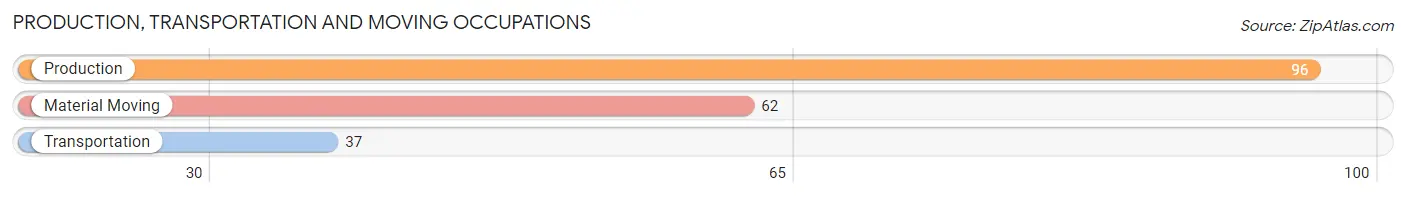
Production, Transportation and Moving Occupations
The most common Production, Transportation and Moving occupations in Lone Star are Production (96 | 14.9%), Material Moving (62 | 9.6%), and Transportation (37 | 5.7%).
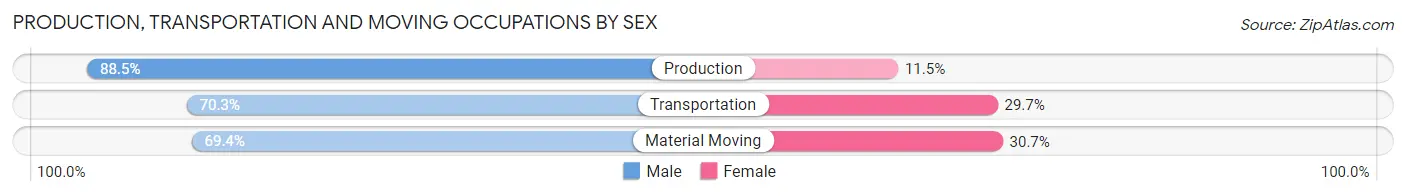
Production, Transportation and Moving Occupations by Sex
| Occupation | Male | Female |
| Production | 85 (88.5%) | 11 (11.5%) |
| Transportation | 26 (70.3%) | 11 (29.7%) |
| Material Moving | 43 (69.4%) | 19 (30.6%) |
| Total (Category) | 154 (79.0%) | 41 (21.0%) |
| Total (Overall) | 339 (52.6%) | 306 (47.4%) |
Employment Industries by Sex in Lone Star
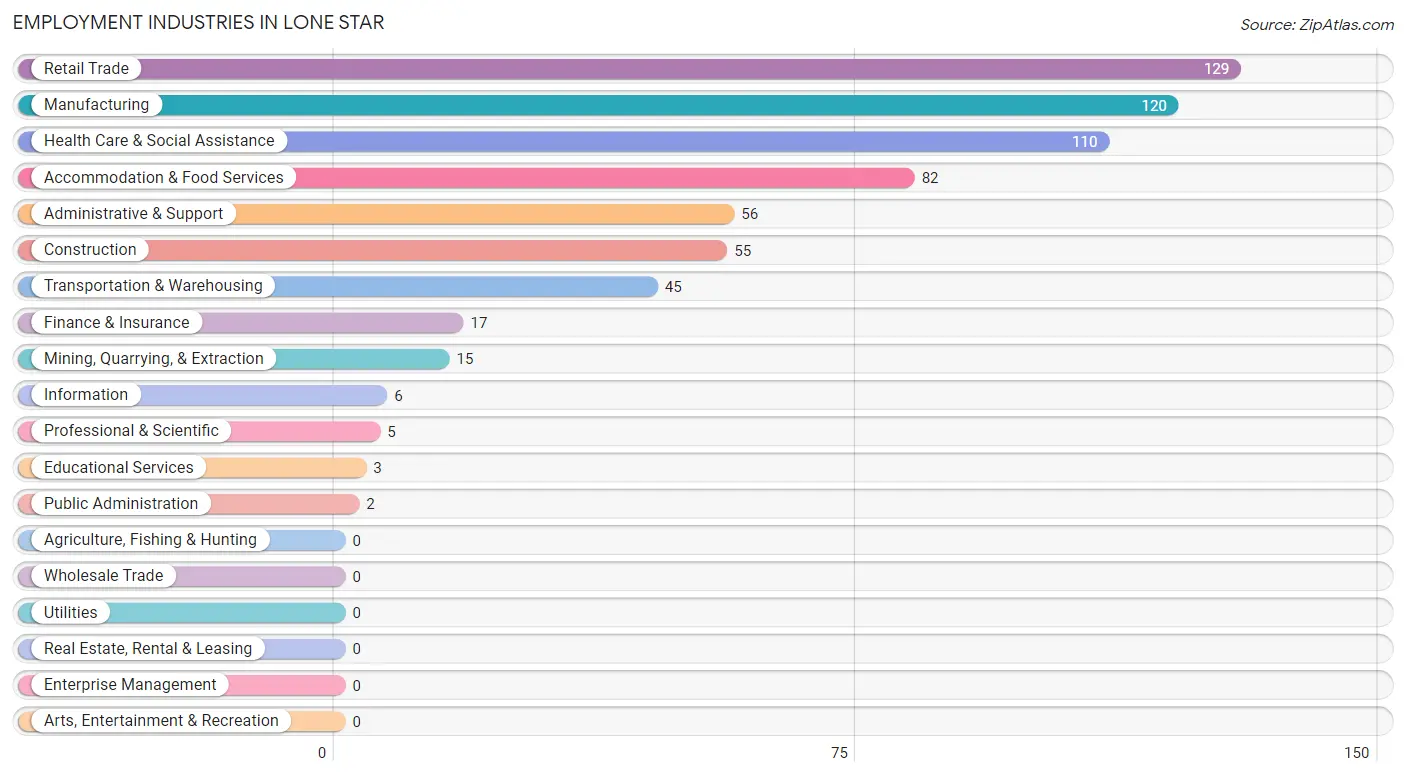
Employment Industries in Lone Star
The major employment industries in Lone Star include Retail Trade (129 | 20.0%), Manufacturing (120 | 18.6%), Health Care & Social Assistance (110 | 17.1%), Accommodation & Food Services (82 | 12.7%), and Administrative & Support (56 | 8.7%).
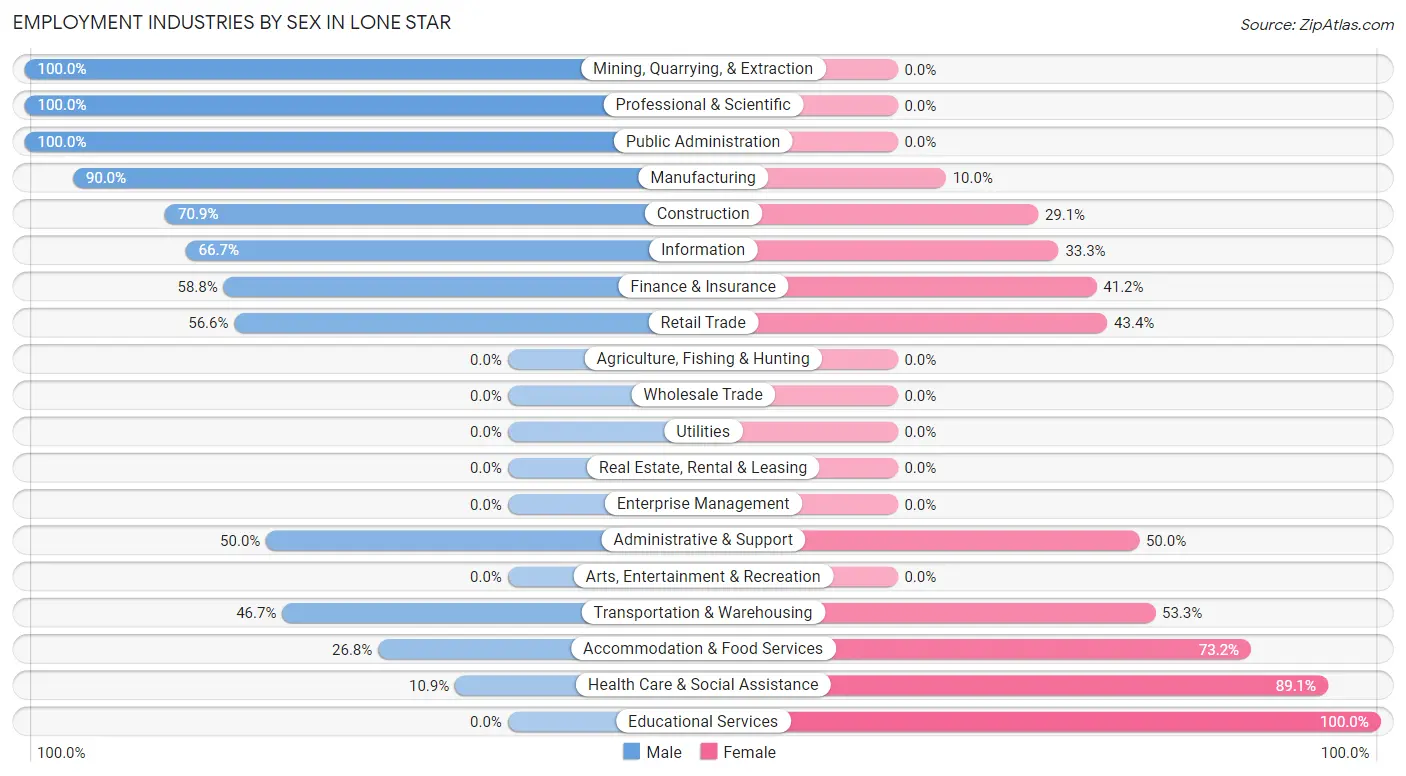
Employment Industries by Sex in Lone Star
The Lone Star industries that see more men than women are Mining, Quarrying, & Extraction (100.0%), Professional & Scientific (100.0%), and Public Administration (100.0%), whereas the industries that tend to have a higher number of women are Educational Services (100.0%), Health Care & Social Assistance (89.1%), and Accommodation & Food Services (73.2%).
| Industry | Male | Female |
| Agriculture, Fishing & Hunting | 0 (0.0%) | 0 (0.0%) |
| Mining, Quarrying, & Extraction | 15 (100.0%) | 0 (0.0%) |
| Construction | 39 (70.9%) | 16 (29.1%) |
| Manufacturing | 108 (90.0%) | 12 (10.0%) |
| Wholesale Trade | 0 (0.0%) | 0 (0.0%) |
| Retail Trade | 73 (56.6%) | 56 (43.4%) |
| Transportation & Warehousing | 21 (46.7%) | 24 (53.3%) |
| Utilities | 0 (0.0%) | 0 (0.0%) |
| Information | 4 (66.7%) | 2 (33.3%) |
| Finance & Insurance | 10 (58.8%) | 7 (41.2%) |
| Real Estate, Rental & Leasing | 0 (0.0%) | 0 (0.0%) |
| Professional & Scientific | 5 (100.0%) | 0 (0.0%) |
| Enterprise Management | 0 (0.0%) | 0 (0.0%) |
| Administrative & Support | 28 (50.0%) | 28 (50.0%) |
| Educational Services | 0 (0.0%) | 3 (100.0%) |
| Health Care & Social Assistance | 12 (10.9%) | 98 (89.1%) |
| Arts, Entertainment & Recreation | 0 (0.0%) | 0 (0.0%) |
| Accommodation & Food Services | 22 (26.8%) | 60 (73.2%) |
| Public Administration | 2 (100.0%) | 0 (0.0%) |
| Total | 339 (52.6%) | 306 (47.4%) |
Education in Lone Star
School Enrollment in Lone Star
The most common levels of schooling among the 292 students in Lone Star are college / undergraduate (82 | 28.1%), middle school (72 | 24.7%), and high school (61 | 20.9%).
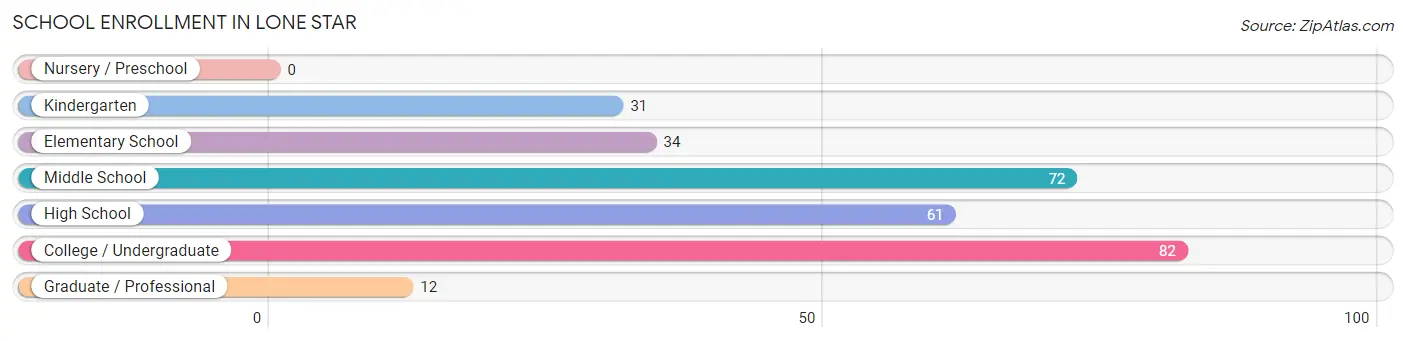
| School Level | # Students | % Students |
| Nursery / Preschool | 0 | 0.0% |
| Kindergarten | 31 | 10.6% |
| Elementary School | 34 | 11.6% |
| Middle School | 72 | 24.7% |
| High School | 61 | 20.9% |
| College / Undergraduate | 82 | 28.1% |
| Graduate / Professional | 12 | 4.1% |
| Total | 292 | 100.0% |
School Enrollment by Age by Funding Source in Lone Star
Out of a total of 292 students who are enrolled in schools in Lone Star, 8 (2.7%) attend a private institution, while the remaining 284 (97.3%) are enrolled in public schools. The age group of 18 to 19 year olds has the highest likelihood of being enrolled in private schools, with 8 (100.0% in the age bracket) enrolled. Conversely, the age group of 3 to 4 year olds has the lowest likelihood of being enrolled in a private school, with 23 (100.0% in the age bracket) attending a public institution.
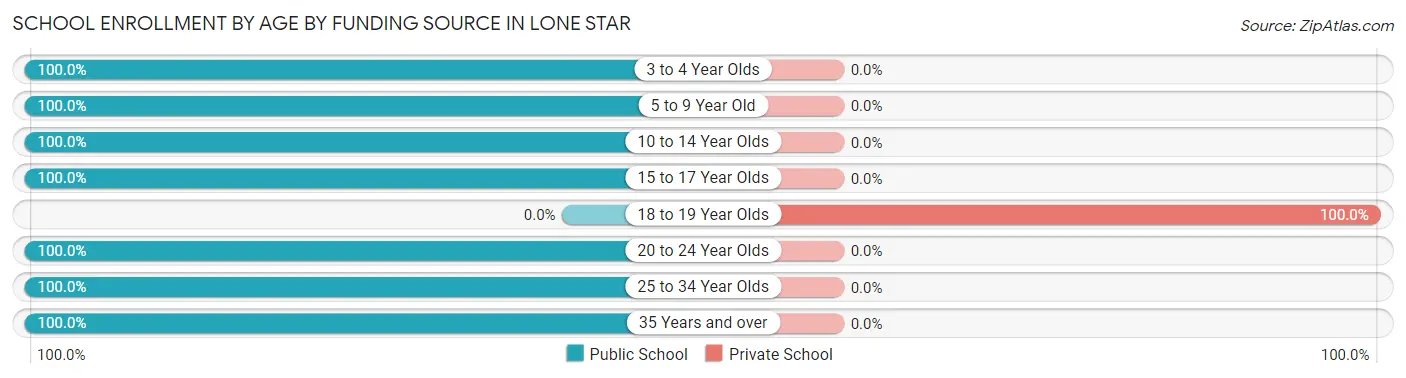
| Age Bracket | Public School | Private School |
| 3 to 4 Year Olds | 23 (100.0%) | 0 (0.0%) |
| 5 to 9 Year Old | 42 (100.0%) | 0 (0.0%) |
| 10 to 14 Year Olds | 72 (100.0%) | 0 (0.0%) |
| 15 to 17 Year Olds | 61 (100.0%) | 0 (0.0%) |
| 18 to 19 Year Olds | 0 (0.0%) | 8 (100.0%) |
| 20 to 24 Year Olds | 68 (100.0%) | 0 (0.0%) |
| 25 to 34 Year Olds | 6 (100.0%) | 0 (0.0%) |
| 35 Years and over | 12 (100.0%) | 0 (0.0%) |
| Total | 284 (97.3%) | 8 (2.7%) |
Educational Attainment by Field of Study in Lone Star
Education (25 | 35.7%), business (19 | 27.1%), social sciences (14 | 20.0%), engineering (5 | 7.1%), and science & technology (3 | 4.3%) are the most common fields of study among 70 individuals in Lone Star who have obtained a bachelor's degree or higher.
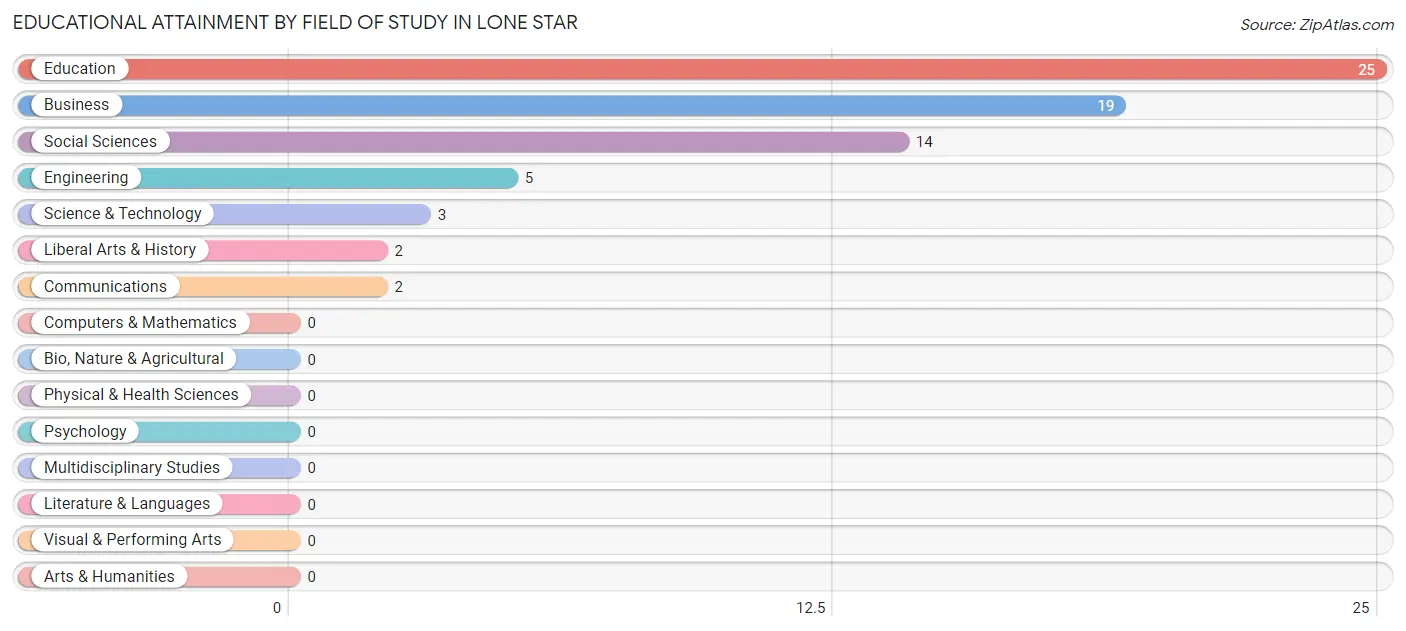
| Field of Study | # Graduates | % Graduates |
| Computers & Mathematics | 0 | 0.0% |
| Bio, Nature & Agricultural | 0 | 0.0% |
| Physical & Health Sciences | 0 | 0.0% |
| Psychology | 0 | 0.0% |
| Social Sciences | 14 | 20.0% |
| Engineering | 5 | 7.1% |
| Multidisciplinary Studies | 0 | 0.0% |
| Science & Technology | 3 | 4.3% |
| Business | 19 | 27.1% |
| Education | 25 | 35.7% |
| Literature & Languages | 0 | 0.0% |
| Liberal Arts & History | 2 | 2.9% |
| Visual & Performing Arts | 0 | 0.0% |
| Communications | 2 | 2.9% |
| Arts & Humanities | 0 | 0.0% |
| Total | 70 | 100.0% |
Transportation & Commute in Lone Star
Vehicle Availability by Sex in Lone Star
The most prevalent vehicle ownership categories in Lone Star are males with 2 vehicles (154, accounting for 45.4%) and females with 2 vehicles (140, making up 50.3%).
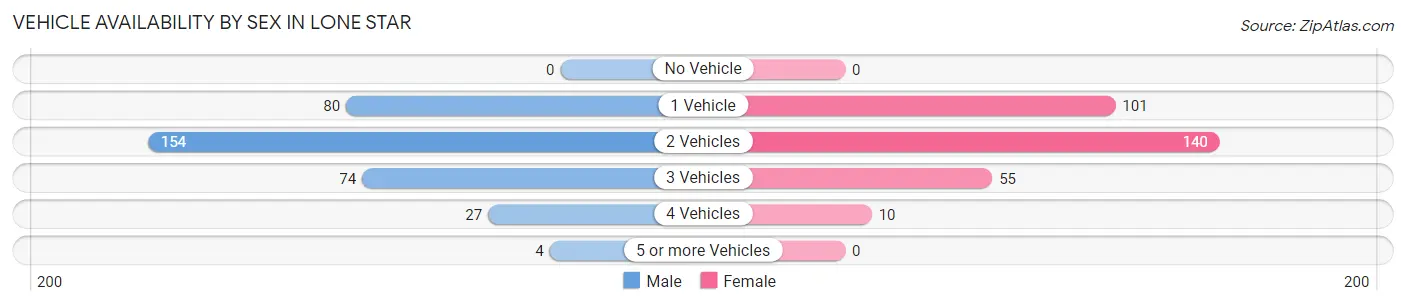
| Vehicles Available | Male | Female |
| No Vehicle | 0 (0.0%) | 0 (0.0%) |
| 1 Vehicle | 80 (23.6%) | 101 (33.0%) |
| 2 Vehicles | 154 (45.4%) | 140 (45.8%) |
| 3 Vehicles | 74 (21.8%) | 55 (18.0%) |
| 4 Vehicles | 27 (8.0%) | 10 (3.3%) |
| 5 or more Vehicles | 4 (1.2%) | 0 (0.0%) |
| Total | 339 (100.0%) | 306 (100.0%) |
Commute Time in Lone Star
The most frequently occuring commute durations in Lone Star are 45 to 59 minutes (140 commuters, 21.7%), 5 to 9 minutes (114 commuters, 17.7%), and 30 to 34 minutes (110 commuters, 17.1%).
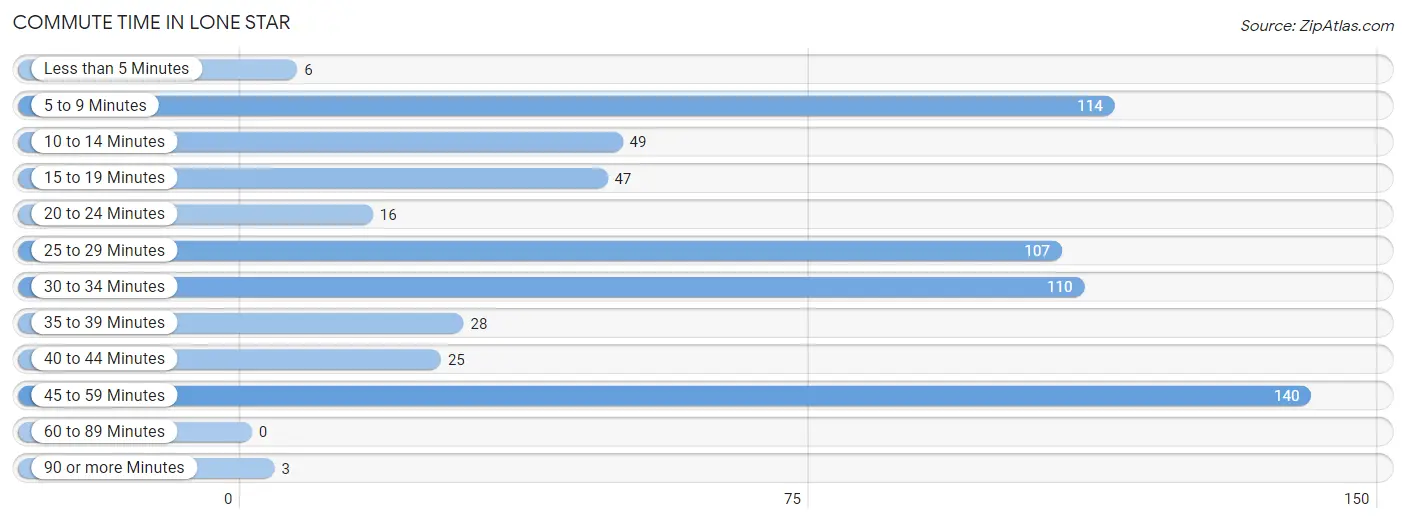
| Commute Time | # Commuters | % Commuters |
| Less than 5 Minutes | 6 | 0.9% |
| 5 to 9 Minutes | 114 | 17.7% |
| 10 to 14 Minutes | 49 | 7.6% |
| 15 to 19 Minutes | 47 | 7.3% |
| 20 to 24 Minutes | 16 | 2.5% |
| 25 to 29 Minutes | 107 | 16.6% |
| 30 to 34 Minutes | 110 | 17.1% |
| 35 to 39 Minutes | 28 | 4.3% |
| 40 to 44 Minutes | 25 | 3.9% |
| 45 to 59 Minutes | 140 | 21.7% |
| 60 to 89 Minutes | 0 | 0.0% |
| 90 or more Minutes | 3 | 0.5% |
Commute Time by Sex in Lone Star
The most common commute times in Lone Star are 45 to 59 minutes (99 commuters, 29.2%) for males and 5 to 9 minutes (79 commuters, 25.8%) for females.
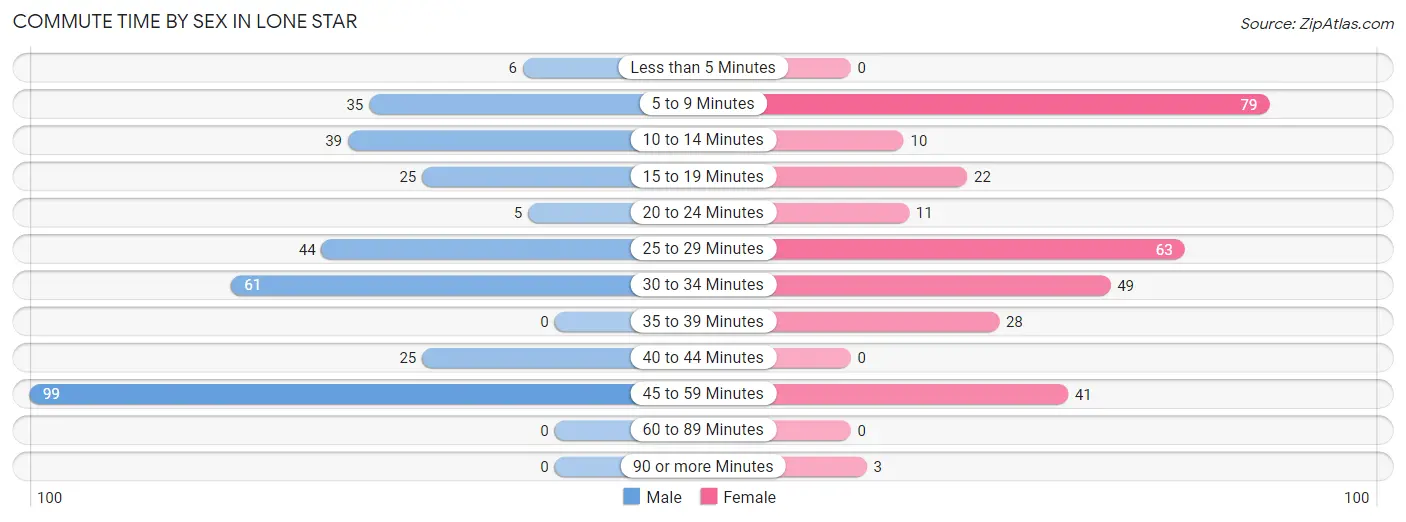
| Commute Time | Male | Female |
| Less than 5 Minutes | 6 (1.8%) | 0 (0.0%) |
| 5 to 9 Minutes | 35 (10.3%) | 79 (25.8%) |
| 10 to 14 Minutes | 39 (11.5%) | 10 (3.3%) |
| 15 to 19 Minutes | 25 (7.4%) | 22 (7.2%) |
| 20 to 24 Minutes | 5 (1.5%) | 11 (3.6%) |
| 25 to 29 Minutes | 44 (13.0%) | 63 (20.6%) |
| 30 to 34 Minutes | 61 (18.0%) | 49 (16.0%) |
| 35 to 39 Minutes | 0 (0.0%) | 28 (9.1%) |
| 40 to 44 Minutes | 25 (7.4%) | 0 (0.0%) |
| 45 to 59 Minutes | 99 (29.2%) | 41 (13.4%) |
| 60 to 89 Minutes | 0 (0.0%) | 0 (0.0%) |
| 90 or more Minutes | 0 (0.0%) | 3 (1.0%) |
Time of Departure to Work by Sex in Lone Star
The most frequent times of departure to work in Lone Star are 9:00 AM to 9:59 AM (52, 15.3%) for males and 8:00 AM to 8:29 AM (67, 21.9%) for females.
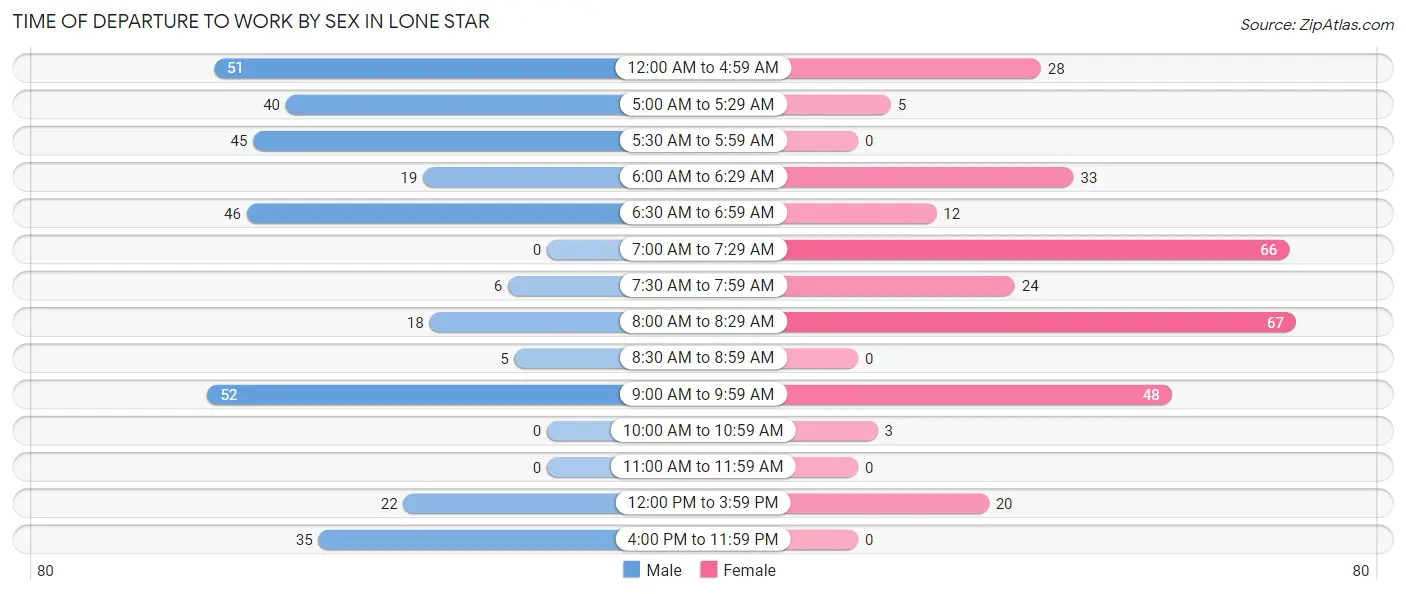
| Time of Departure | Male | Female |
| 12:00 AM to 4:59 AM | 51 (15.0%) | 28 (9.1%) |
| 5:00 AM to 5:29 AM | 40 (11.8%) | 5 (1.6%) |
| 5:30 AM to 5:59 AM | 45 (13.3%) | 0 (0.0%) |
| 6:00 AM to 6:29 AM | 19 (5.6%) | 33 (10.8%) |
| 6:30 AM to 6:59 AM | 46 (13.6%) | 12 (3.9%) |
| 7:00 AM to 7:29 AM | 0 (0.0%) | 66 (21.6%) |
| 7:30 AM to 7:59 AM | 6 (1.8%) | 24 (7.8%) |
| 8:00 AM to 8:29 AM | 18 (5.3%) | 67 (21.9%) |
| 8:30 AM to 8:59 AM | 5 (1.5%) | 0 (0.0%) |
| 9:00 AM to 9:59 AM | 52 (15.3%) | 48 (15.7%) |
| 10:00 AM to 10:59 AM | 0 (0.0%) | 3 (1.0%) |
| 11:00 AM to 11:59 AM | 0 (0.0%) | 0 (0.0%) |
| 12:00 PM to 3:59 PM | 22 (6.5%) | 20 (6.5%) |
| 4:00 PM to 11:59 PM | 35 (10.3%) | 0 (0.0%) |
| Total | 339 (100.0%) | 306 (100.0%) |
Housing Occupancy in Lone Star
Occupancy by Ownership in Lone Star
Of the total 713 dwellings in Lone Star, owner-occupied units account for 346 (48.5%), while renter-occupied units make up 367 (51.5%).
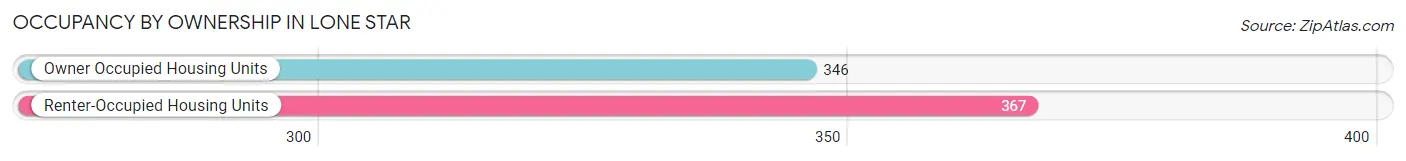
| Occupancy | # Housing Units | % Housing Units |
| Owner Occupied Housing Units | 346 | 48.5% |
| Renter-Occupied Housing Units | 367 | 51.5% |
| Total Occupied Housing Units | 713 | 100.0% |
Occupancy by Household Size in Lone Star
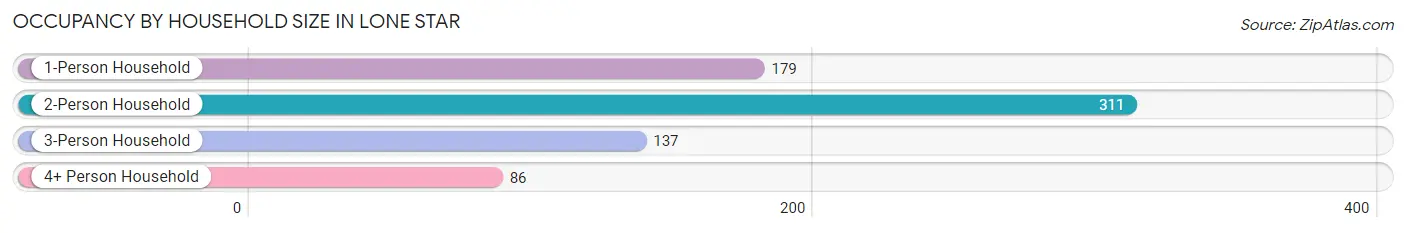
| Household Size | # Housing Units | % Housing Units |
| 1-Person Household | 179 | 25.1% |
| 2-Person Household | 311 | 43.6% |
| 3-Person Household | 137 | 19.2% |
| 4+ Person Household | 86 | 12.1% |
| Total Housing Units | 713 | 100.0% |
Occupancy by Ownership by Household Size in Lone Star
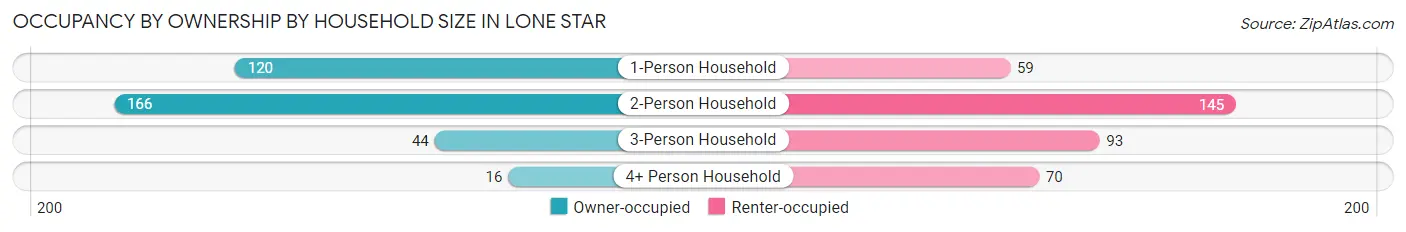
| Household Size | Owner-occupied | Renter-occupied |
| 1-Person Household | 120 (67.0%) | 59 (33.0%) |
| 2-Person Household | 166 (53.4%) | 145 (46.6%) |
| 3-Person Household | 44 (32.1%) | 93 (67.9%) |
| 4+ Person Household | 16 (18.6%) | 70 (81.4%) |
| Total Housing Units | 346 (48.5%) | 367 (51.5%) |
Occupancy by Educational Attainment in Lone Star
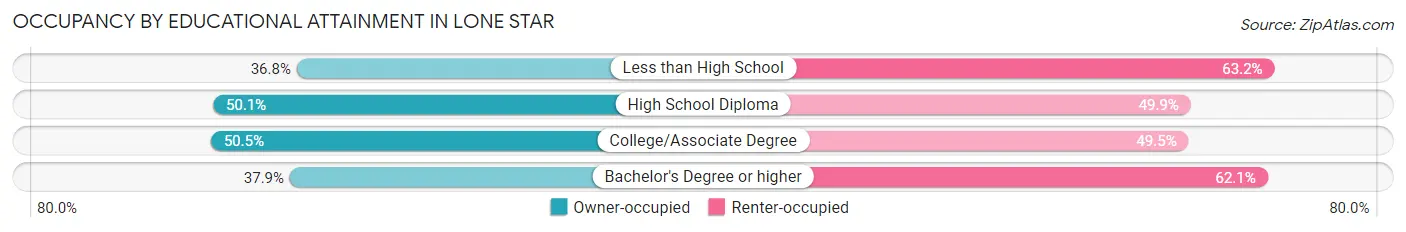
| Household Size | Owner-occupied | Renter-occupied |
| Less than High School | 14 (36.8%) | 24 (63.2%) |
| High School Diploma | 202 (50.1%) | 201 (49.9%) |
| College/Associate Degree | 108 (50.5%) | 106 (49.5%) |
| Bachelor's Degree or higher | 22 (37.9%) | 36 (62.1%) |
Occupancy by Age of Householder in Lone Star
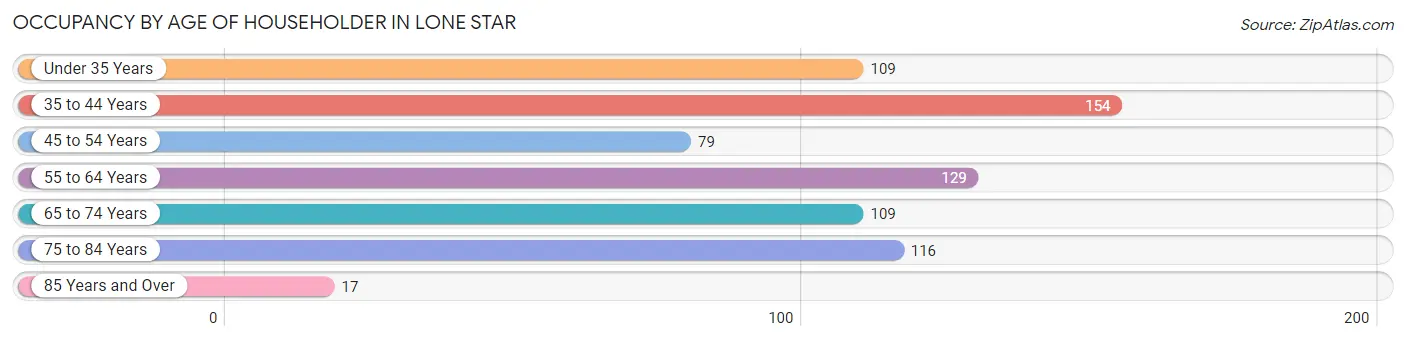
| Age Bracket | # Households | % Households |
| Under 35 Years | 109 | 15.3% |
| 35 to 44 Years | 154 | 21.6% |
| 45 to 54 Years | 79 | 11.1% |
| 55 to 64 Years | 129 | 18.1% |
| 65 to 74 Years | 109 | 15.3% |
| 75 to 84 Years | 116 | 16.3% |
| 85 Years and Over | 17 | 2.4% |
| Total | 713 | 100.0% |
Housing Finances in Lone Star
Median Income by Occupancy in Lone Star
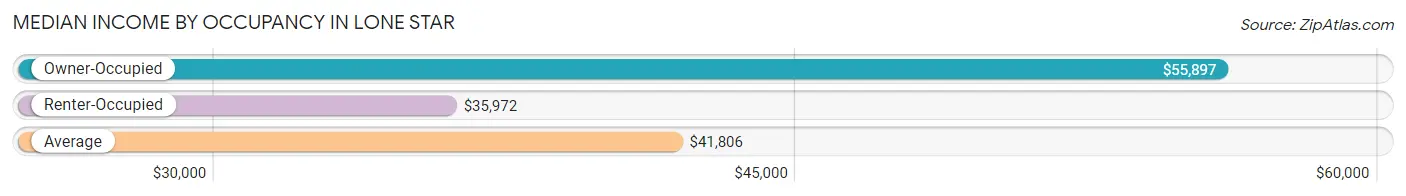
| Occupancy Type | # Households | Median Income |
| Owner-Occupied | 346 (48.5%) | $55,897 |
| Renter-Occupied | 367 (51.5%) | $35,972 |
| Average | 713 (100.0%) | $41,806 |
Occupancy by Householder Income Bracket in Lone Star
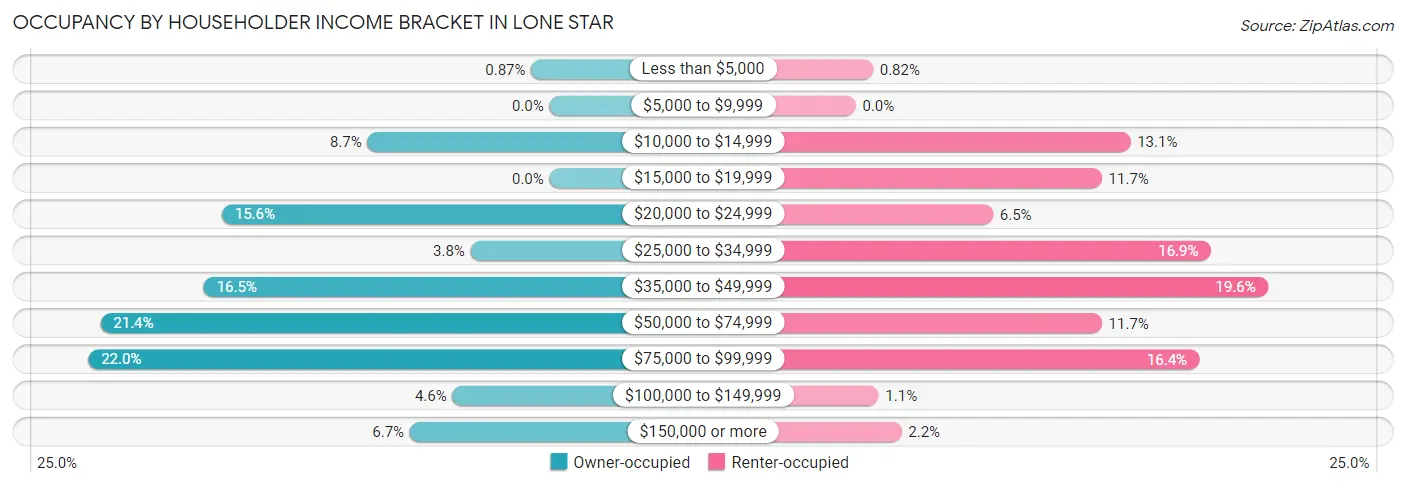
| Income Bracket | Owner-occupied | Renter-occupied |
| Less than $5,000 | 3 (0.9%) | 3 (0.8%) |
| $5,000 to $9,999 | 0 (0.0%) | 0 (0.0%) |
| $10,000 to $14,999 | 30 (8.7%) | 48 (13.1%) |
| $15,000 to $19,999 | 0 (0.0%) | 43 (11.7%) |
| $20,000 to $24,999 | 54 (15.6%) | 24 (6.5%) |
| $25,000 to $34,999 | 13 (3.8%) | 62 (16.9%) |
| $35,000 to $49,999 | 57 (16.5%) | 72 (19.6%) |
| $50,000 to $74,999 | 74 (21.4%) | 43 (11.7%) |
| $75,000 to $99,999 | 76 (22.0%) | 60 (16.4%) |
| $100,000 to $149,999 | 16 (4.6%) | 4 (1.1%) |
| $150,000 or more | 23 (6.7%) | 8 (2.2%) |
| Total | 346 (100.0%) | 367 (100.0%) |
Monthly Housing Cost Tiers in Lone Star
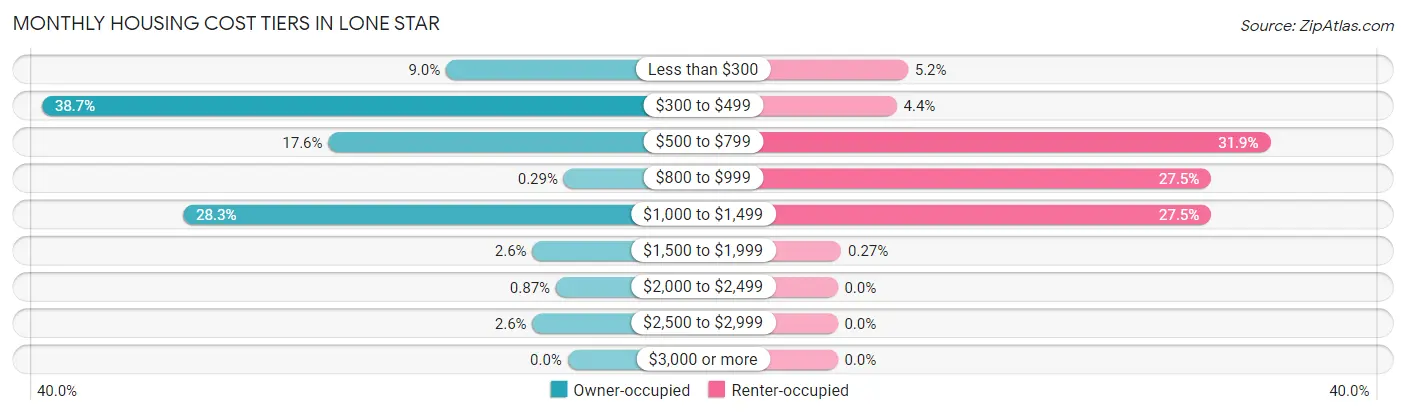
| Monthly Cost | Owner-occupied | Renter-occupied |
| Less than $300 | 31 (9.0%) | 19 (5.2%) |
| $300 to $499 | 134 (38.7%) | 16 (4.4%) |
| $500 to $799 | 61 (17.6%) | 117 (31.9%) |
| $800 to $999 | 1 (0.3%) | 101 (27.5%) |
| $1,000 to $1,499 | 98 (28.3%) | 101 (27.5%) |
| $1,500 to $1,999 | 9 (2.6%) | 1 (0.3%) |
| $2,000 to $2,499 | 3 (0.9%) | 0 (0.0%) |
| $2,500 to $2,999 | 9 (2.6%) | 0 (0.0%) |
| $3,000 or more | 0 (0.0%) | 0 (0.0%) |
| Total | 346 (100.0%) | 367 (100.0%) |
Physical Housing Characteristics in Lone Star
Housing Structures in Lone Star
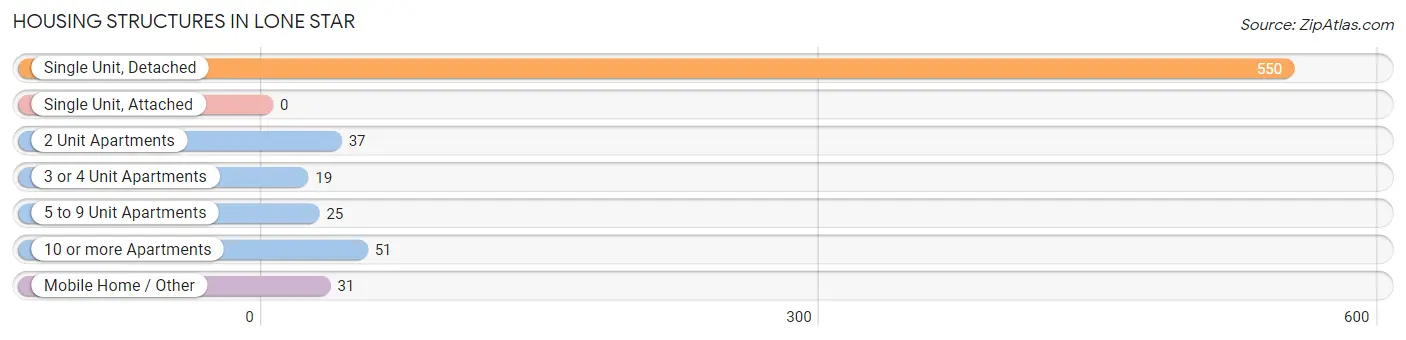
| Structure Type | # Housing Units | % Housing Units |
| Single Unit, Detached | 550 | 77.1% |
| Single Unit, Attached | 0 | 0.0% |
| 2 Unit Apartments | 37 | 5.2% |
| 3 or 4 Unit Apartments | 19 | 2.7% |
| 5 to 9 Unit Apartments | 25 | 3.5% |
| 10 or more Apartments | 51 | 7.1% |
| Mobile Home / Other | 31 | 4.3% |
| Total | 713 | 100.0% |
Housing Structures by Occupancy in Lone Star
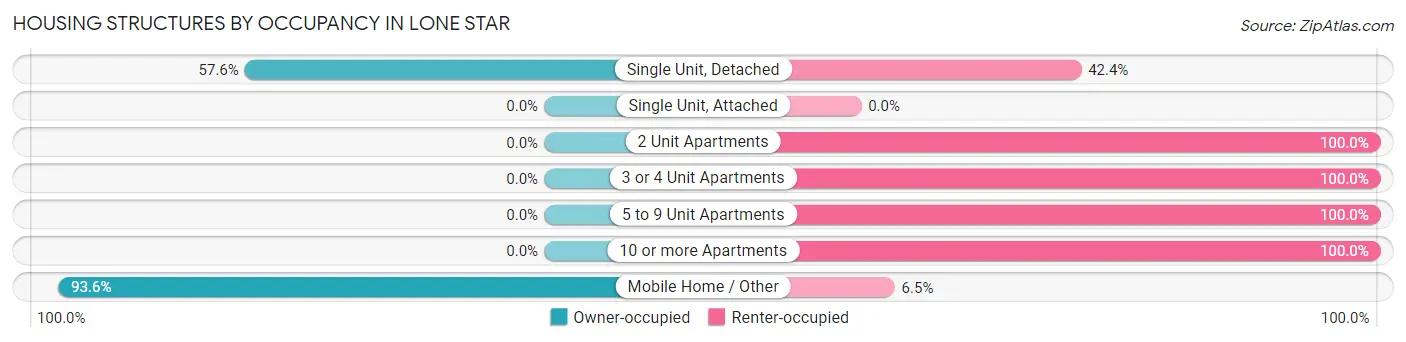
| Structure Type | Owner-occupied | Renter-occupied |
| Single Unit, Detached | 317 (57.6%) | 233 (42.4%) |
| Single Unit, Attached | 0 (0.0%) | 0 (0.0%) |
| 2 Unit Apartments | 0 (0.0%) | 37 (100.0%) |
| 3 or 4 Unit Apartments | 0 (0.0%) | 19 (100.0%) |
| 5 to 9 Unit Apartments | 0 (0.0%) | 25 (100.0%) |
| 10 or more Apartments | 0 (0.0%) | 51 (100.0%) |
| Mobile Home / Other | 29 (93.5%) | 2 (6.5%) |
| Total | 346 (48.5%) | 367 (51.5%) |
Housing Structures by Number of Rooms in Lone Star
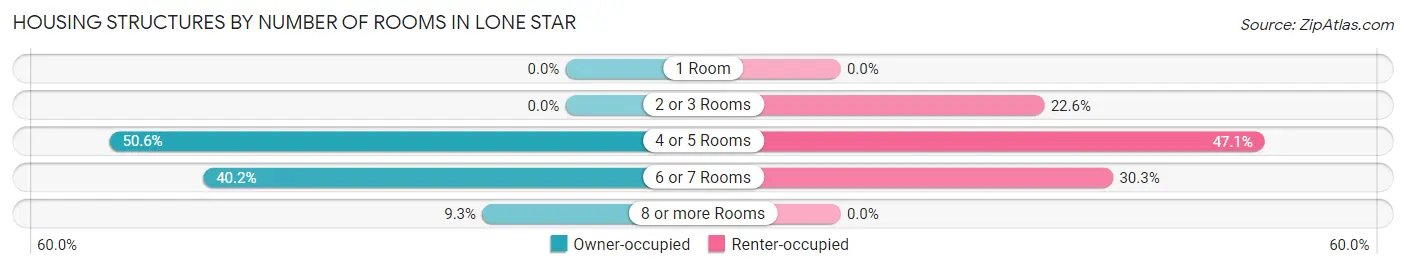
| Number of Rooms | Owner-occupied | Renter-occupied |
| 1 Room | 0 (0.0%) | 0 (0.0%) |
| 2 or 3 Rooms | 0 (0.0%) | 83 (22.6%) |
| 4 or 5 Rooms | 175 (50.6%) | 173 (47.1%) |
| 6 or 7 Rooms | 139 (40.2%) | 111 (30.2%) |
| 8 or more Rooms | 32 (9.2%) | 0 (0.0%) |
| Total | 346 (100.0%) | 367 (100.0%) |
Housing Structure by Heating Type in Lone Star
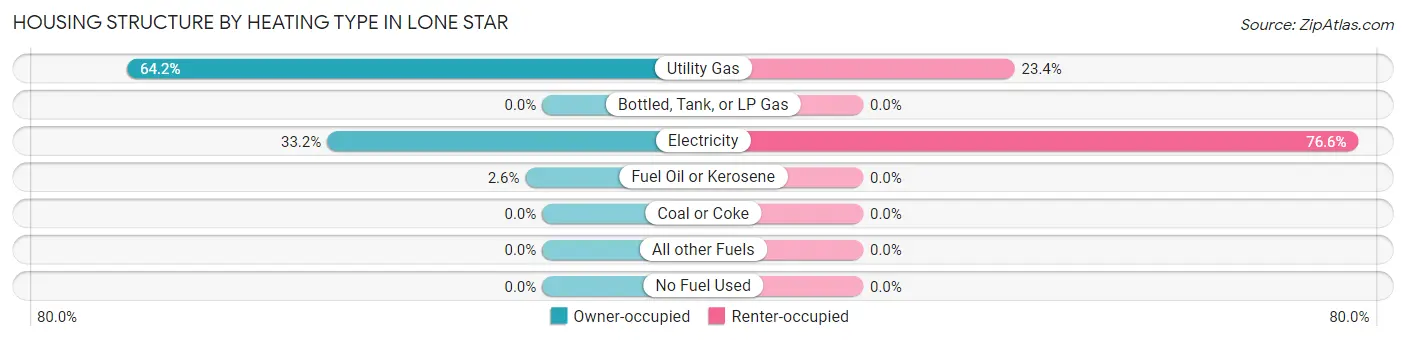
| Heating Type | Owner-occupied | Renter-occupied |
| Utility Gas | 222 (64.2%) | 86 (23.4%) |
| Bottled, Tank, or LP Gas | 0 (0.0%) | 0 (0.0%) |
| Electricity | 115 (33.2%) | 281 (76.6%) |
| Fuel Oil or Kerosene | 9 (2.6%) | 0 (0.0%) |
| Coal or Coke | 0 (0.0%) | 0 (0.0%) |
| All other Fuels | 0 (0.0%) | 0 (0.0%) |
| No Fuel Used | 0 (0.0%) | 0 (0.0%) |
| Total | 346 (100.0%) | 367 (100.0%) |
Household Vehicle Usage in Lone Star
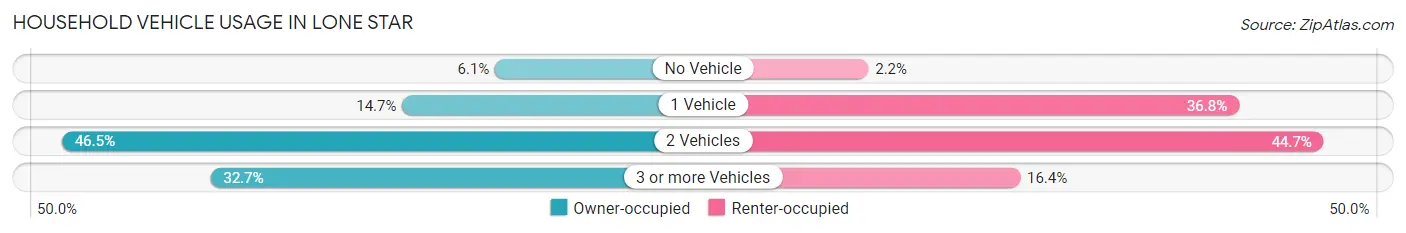
| Vehicles per Household | Owner-occupied | Renter-occupied |
| No Vehicle | 21 (6.1%) | 8 (2.2%) |
| 1 Vehicle | 51 (14.7%) | 135 (36.8%) |
| 2 Vehicles | 161 (46.5%) | 164 (44.7%) |
| 3 or more Vehicles | 113 (32.7%) | 60 (16.4%) |
| Total | 346 (100.0%) | 367 (100.0%) |
Real Estate & Mortgages in Lone Star
Real Estate and Mortgage Overview in Lone Star
| Characteristic | Without Mortgage | With Mortgage |
| Housing Units | 197 | 149 |
| Median Property Value | $125,800 | $155,000 |
| Median Household Income | $55,733 | $23 |
| Monthly Housing Costs | $445 | $0 |
| Real Estate Taxes | $1,214 | $5 |
Property Value by Mortgage Status in Lone Star
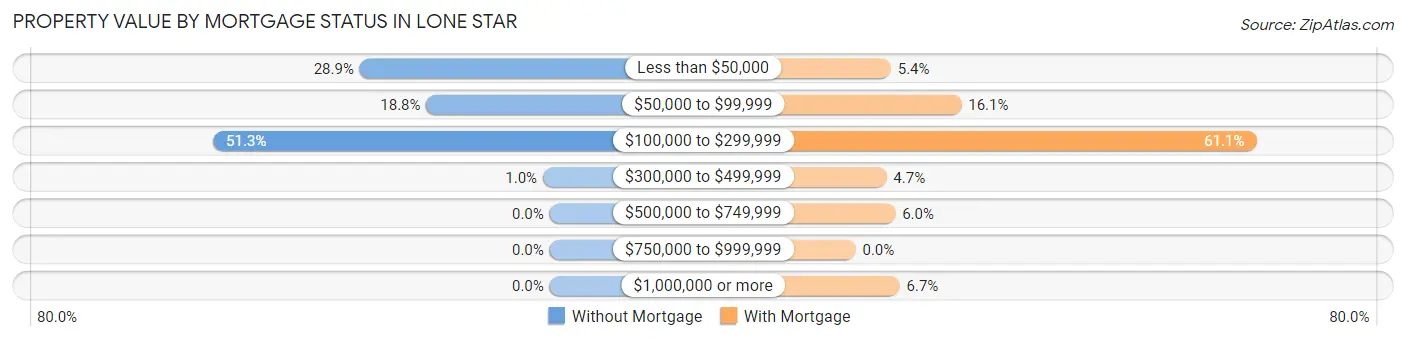
| Property Value | Without Mortgage | With Mortgage |
| Less than $50,000 | 57 (28.9%) | 8 (5.4%) |
| $50,000 to $99,999 | 37 (18.8%) | 24 (16.1%) |
| $100,000 to $299,999 | 101 (51.3%) | 91 (61.1%) |
| $300,000 to $499,999 | 2 (1.0%) | 7 (4.7%) |
| $500,000 to $749,999 | 0 (0.0%) | 9 (6.0%) |
| $750,000 to $999,999 | 0 (0.0%) | 0 (0.0%) |
| $1,000,000 or more | 0 (0.0%) | 10 (6.7%) |
| Total | 197 (100.0%) | 149 (100.0%) |
Household Income by Mortgage Status in Lone Star
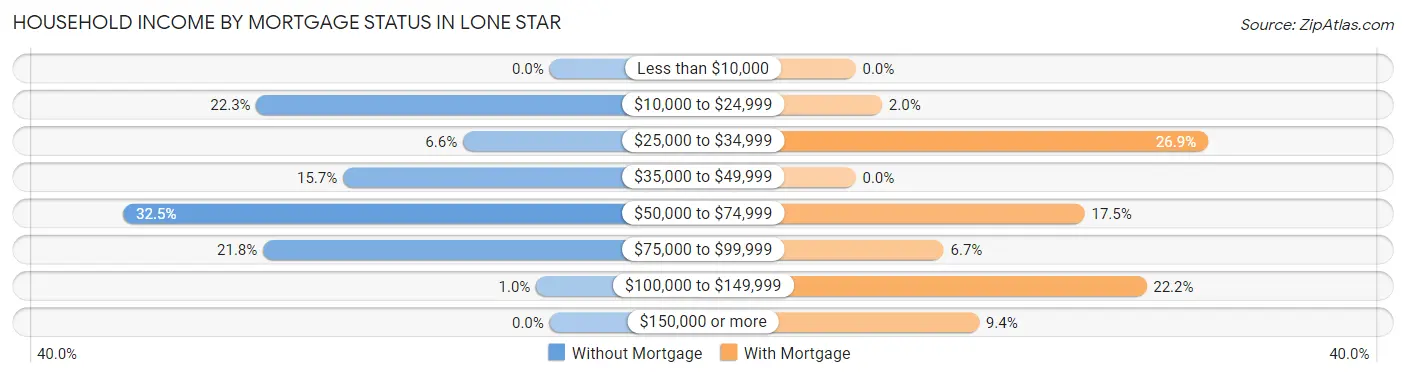
| Household Income | Without Mortgage | With Mortgage |
| Less than $10,000 | 0 (0.0%) | 0 (0.0%) |
| $10,000 to $24,999 | 44 (22.3%) | 3 (2.0%) |
| $25,000 to $34,999 | 13 (6.6%) | 40 (26.9%) |
| $35,000 to $49,999 | 31 (15.7%) | 0 (0.0%) |
| $50,000 to $74,999 | 64 (32.5%) | 26 (17.4%) |
| $75,000 to $99,999 | 43 (21.8%) | 10 (6.7%) |
| $100,000 to $149,999 | 2 (1.0%) | 33 (22.2%) |
| $150,000 or more | 0 (0.0%) | 14 (9.4%) |
| Total | 197 (100.0%) | 149 (100.0%) |
Property Value to Household Income Ratio in Lone Star
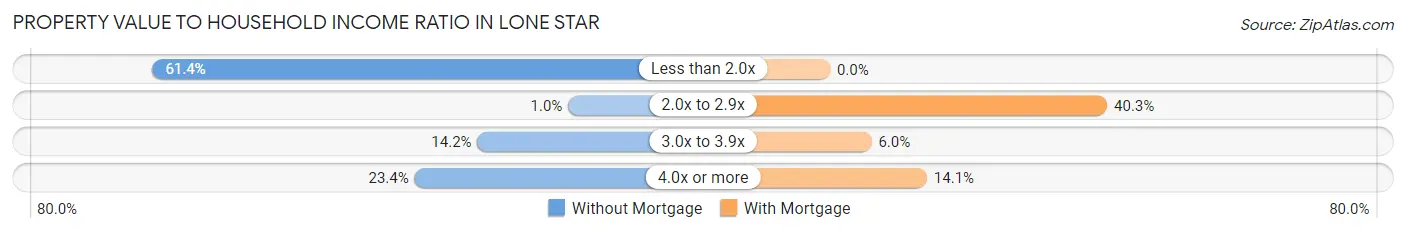
| Value-to-Income Ratio | Without Mortgage | With Mortgage |
| Less than 2.0x | 121 (61.4%) | 0 (0.0%) |
| 2.0x to 2.9x | 2 (1.0%) | 60 (40.3%) |
| 3.0x to 3.9x | 28 (14.2%) | 9 (6.0%) |
| 4.0x or more | 46 (23.4%) | 21 (14.1%) |
| Total | 197 (100.0%) | 149 (100.0%) |
Real Estate Taxes by Mortgage Status in Lone Star
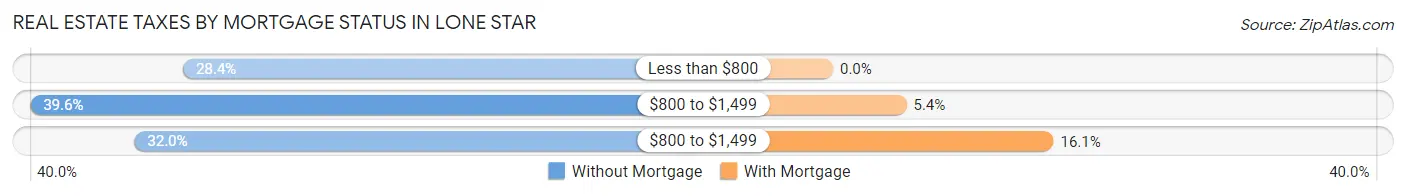
| Property Taxes | Without Mortgage | With Mortgage |
| Less than $800 | 56 (28.4%) | 0 (0.0%) |
| $800 to $1,499 | 78 (39.6%) | 8 (5.4%) |
| $800 to $1,499 | 63 (32.0%) | 24 (16.1%) |
| Total | 197 (100.0%) | 149 (100.0%) |
Health & Disability in Lone Star
Health Insurance Coverage by Age in Lone Star
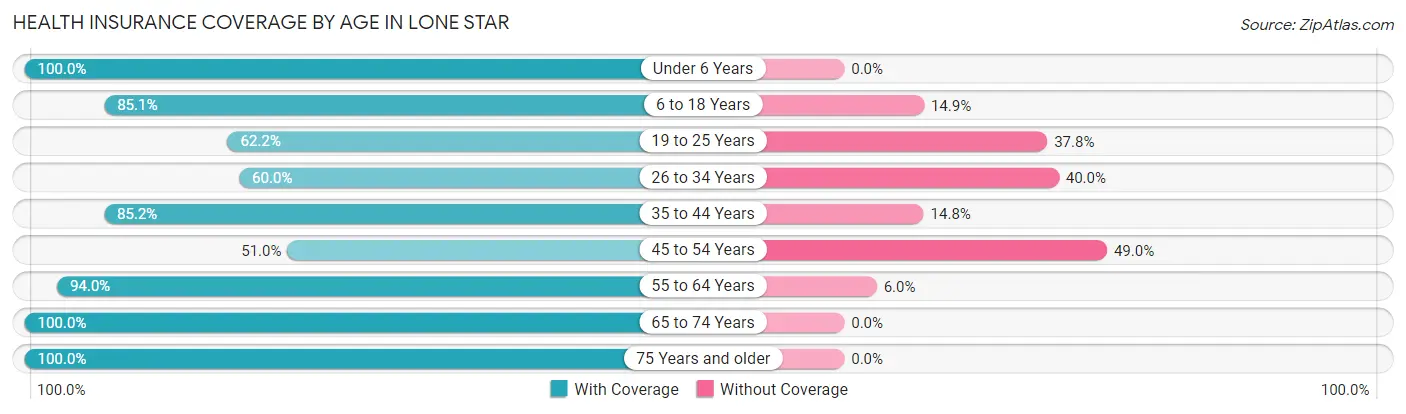
| Age Bracket | With Coverage | Without Coverage |
| Under 6 Years | 147 (100.0%) | 0 (0.0%) |
| 6 to 18 Years | 149 (85.1%) | 26 (14.9%) |
| 19 to 25 Years | 161 (62.2%) | 98 (37.8%) |
| 26 to 34 Years | 48 (60.0%) | 32 (40.0%) |
| 35 to 44 Years | 190 (85.2%) | 33 (14.8%) |
| 45 to 54 Years | 101 (51.0%) | 97 (49.0%) |
| 55 to 64 Years | 171 (94.0%) | 11 (6.0%) |
| 65 to 74 Years | 208 (100.0%) | 0 (0.0%) |
| 75 Years and older | 181 (100.0%) | 0 (0.0%) |
| Total | 1,356 (82.0%) | 297 (18.0%) |
Health Insurance Coverage by Citizenship Status in Lone Star
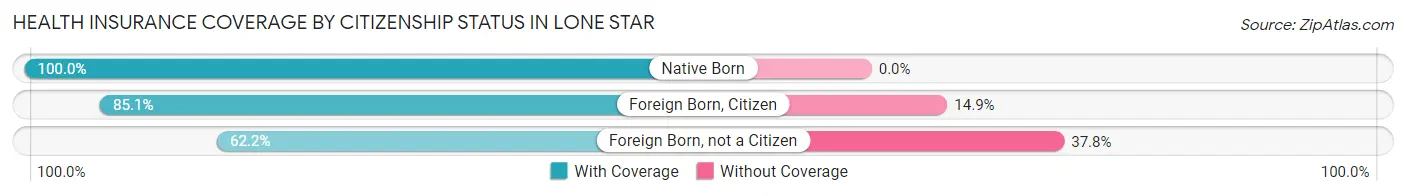
| Citizenship Status | With Coverage | Without Coverage |
| Native Born | 147 (100.0%) | 0 (0.0%) |
| Foreign Born, Citizen | 149 (85.1%) | 26 (14.9%) |
| Foreign Born, not a Citizen | 161 (62.2%) | 98 (37.8%) |
Health Insurance Coverage by Household Income in Lone Star
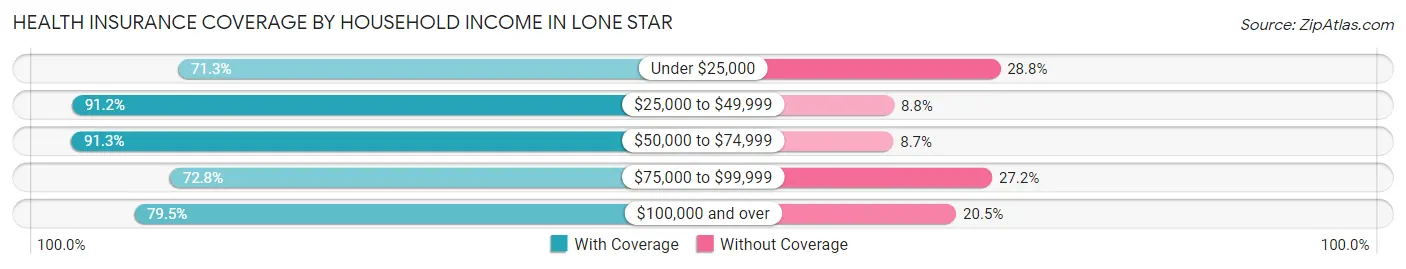
| Household Income | With Coverage | Without Coverage |
| Under $25,000 | 228 (71.3%) | 92 (28.7%) |
| $25,000 to $49,999 | 444 (91.2%) | 43 (8.8%) |
| $50,000 to $74,999 | 241 (91.3%) | 23 (8.7%) |
| $75,000 to $99,999 | 214 (72.8%) | 80 (27.2%) |
| $100,000 and over | 229 (79.5%) | 59 (20.5%) |
Public vs Private Health Insurance Coverage by Age in Lone Star
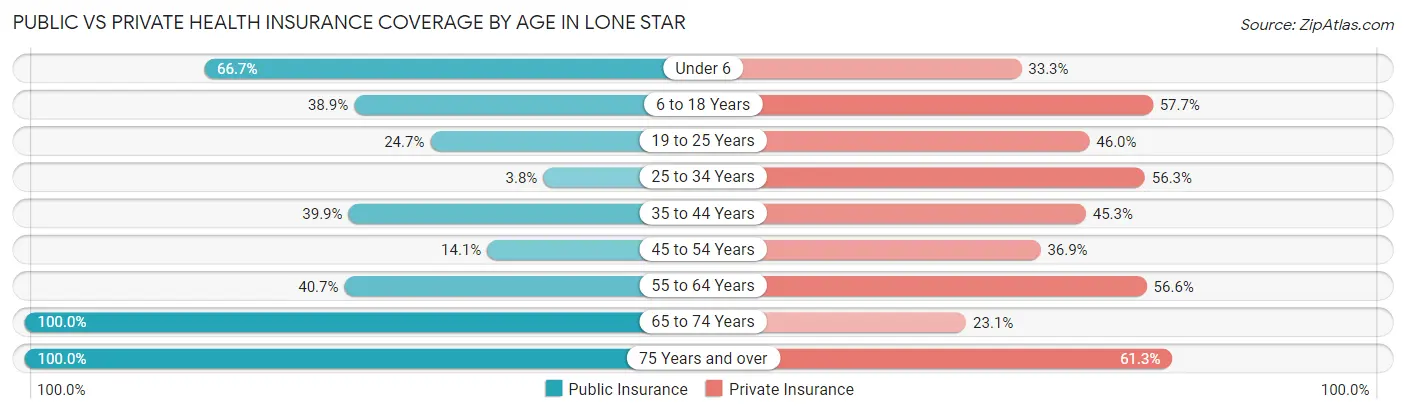
| Age Bracket | Public Insurance | Private Insurance |
| Under 6 | 98 (66.7%) | 49 (33.3%) |
| 6 to 18 Years | 68 (38.9%) | 101 (57.7%) |
| 19 to 25 Years | 64 (24.7%) | 119 (46.0%) |
| 25 to 34 Years | 3 (3.7%) | 45 (56.2%) |
| 35 to 44 Years | 89 (39.9%) | 101 (45.3%) |
| 45 to 54 Years | 28 (14.1%) | 73 (36.9%) |
| 55 to 64 Years | 74 (40.7%) | 103 (56.6%) |
| 65 to 74 Years | 208 (100.0%) | 48 (23.1%) |
| 75 Years and over | 181 (100.0%) | 111 (61.3%) |
| Total | 813 (49.2%) | 750 (45.4%) |
Disability Status by Sex by Age in Lone Star
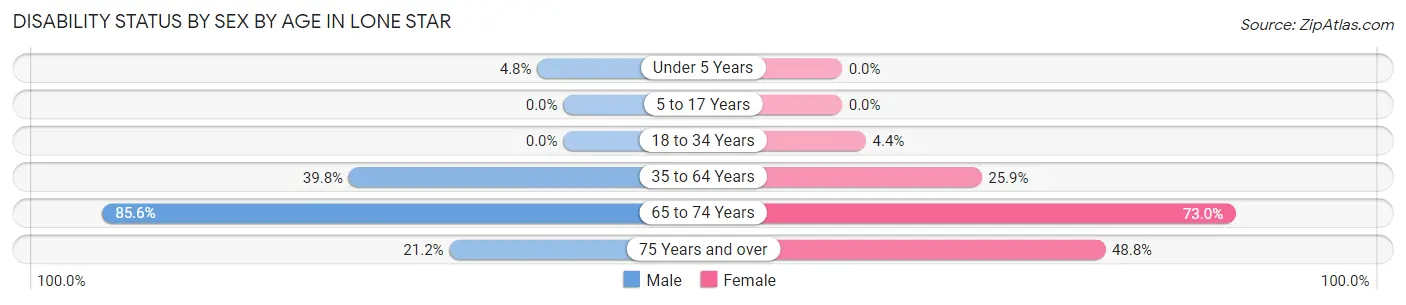
| Age Bracket | Male | Female |
| Under 5 Years | 4 (4.8%) | 0 (0.0%) |
| 5 to 17 Years | 0 (0.0%) | 0 (0.0%) |
| 18 to 34 Years | 0 (0.0%) | 8 (4.4%) |
| 35 to 64 Years | 117 (39.8%) | 80 (25.9%) |
| 65 to 74 Years | 83 (85.6%) | 81 (73.0%) |
| 75 Years and over | 11 (21.1%) | 63 (48.8%) |
Disability Class by Sex by Age in Lone Star
Disability Class: Hearing Difficulty
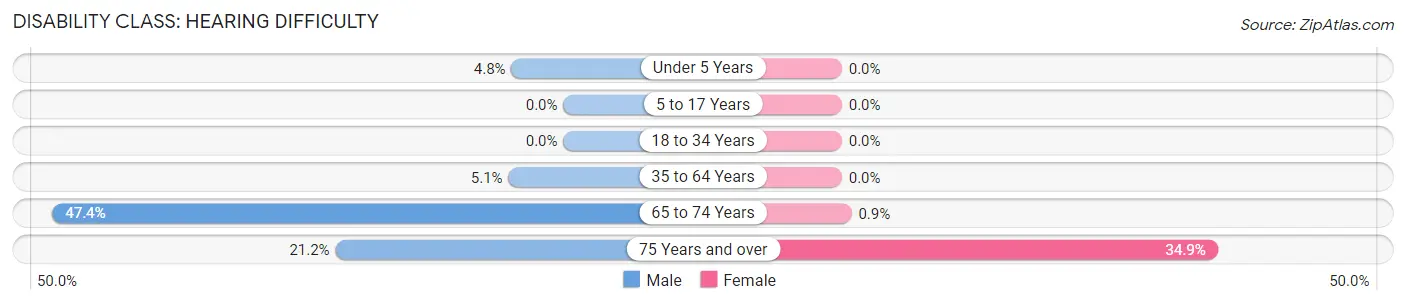
| Age Bracket | Male | Female |
| Under 5 Years | 4 (4.8%) | 0 (0.0%) |
| 5 to 17 Years | 0 (0.0%) | 0 (0.0%) |
| 18 to 34 Years | 0 (0.0%) | 0 (0.0%) |
| 35 to 64 Years | 15 (5.1%) | 0 (0.0%) |
| 65 to 74 Years | 46 (47.4%) | 1 (0.9%) |
| 75 Years and over | 11 (21.1%) | 45 (34.9%) |
Disability Class: Vision Difficulty
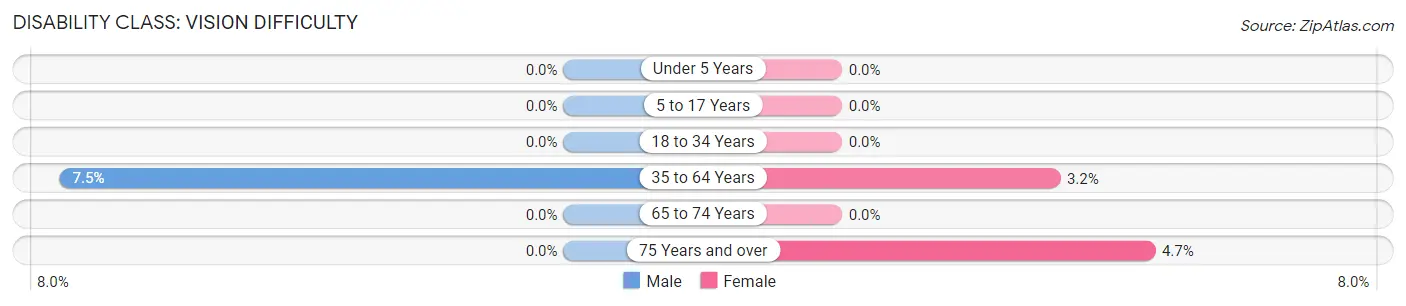
| Age Bracket | Male | Female |
| Under 5 Years | 0 (0.0%) | 0 (0.0%) |
| 5 to 17 Years | 0 (0.0%) | 0 (0.0%) |
| 18 to 34 Years | 0 (0.0%) | 0 (0.0%) |
| 35 to 64 Years | 22 (7.5%) | 10 (3.2%) |
| 65 to 74 Years | 0 (0.0%) | 0 (0.0%) |
| 75 Years and over | 0 (0.0%) | 6 (4.6%) |
Disability Class: Cognitive Difficulty
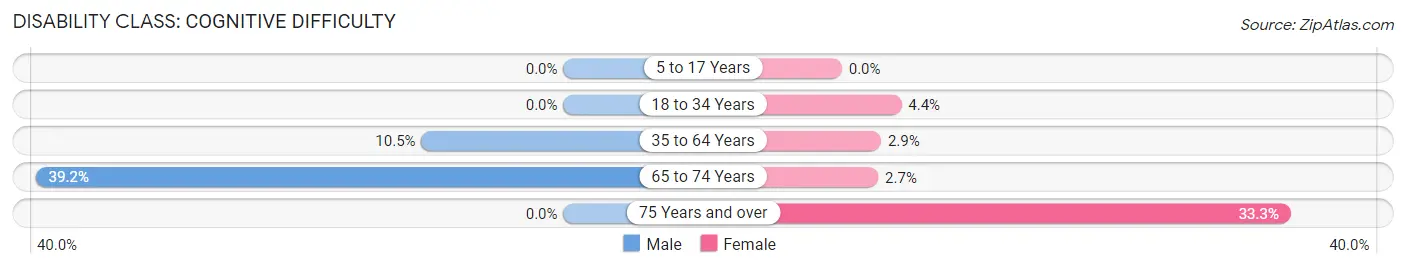
| Age Bracket | Male | Female |
| 5 to 17 Years | 0 (0.0%) | 0 (0.0%) |
| 18 to 34 Years | 0 (0.0%) | 8 (4.4%) |
| 35 to 64 Years | 31 (10.5%) | 9 (2.9%) |
| 65 to 74 Years | 38 (39.2%) | 3 (2.7%) |
| 75 Years and over | 0 (0.0%) | 43 (33.3%) |
Disability Class: Ambulatory Difficulty
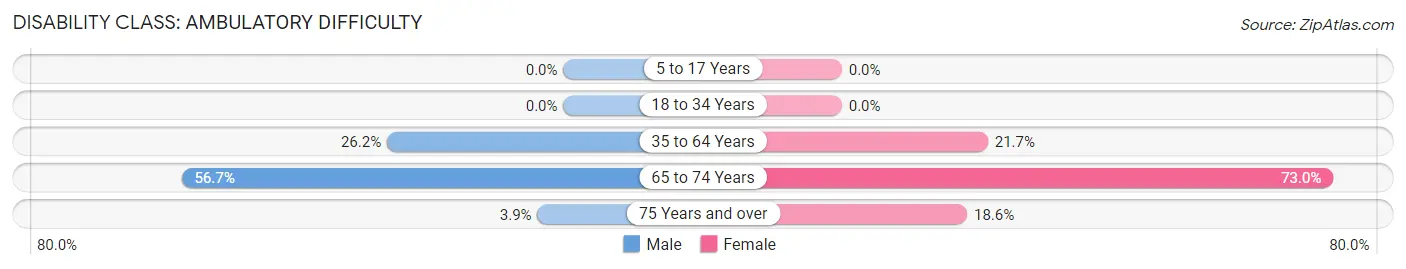
| Age Bracket | Male | Female |
| 5 to 17 Years | 0 (0.0%) | 0 (0.0%) |
| 18 to 34 Years | 0 (0.0%) | 0 (0.0%) |
| 35 to 64 Years | 77 (26.2%) | 67 (21.7%) |
| 65 to 74 Years | 55 (56.7%) | 81 (73.0%) |
| 75 Years and over | 2 (3.8%) | 24 (18.6%) |
Disability Class: Self-Care Difficulty
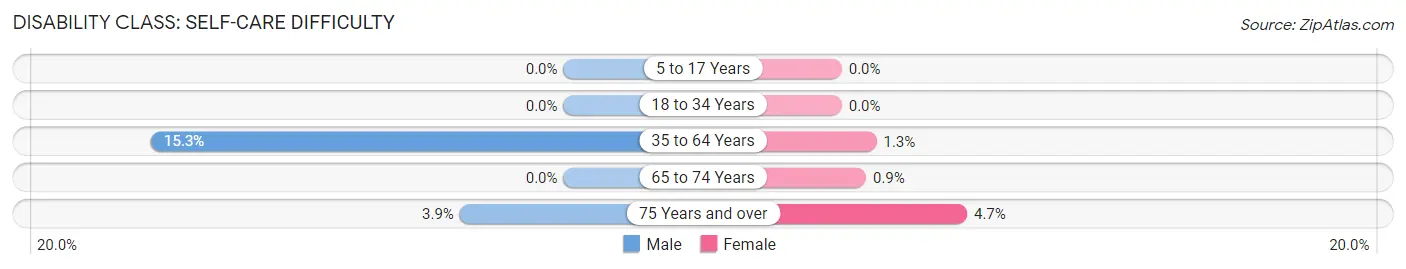
| Age Bracket | Male | Female |
| 5 to 17 Years | 0 (0.0%) | 0 (0.0%) |
| 18 to 34 Years | 0 (0.0%) | 0 (0.0%) |
| 35 to 64 Years | 45 (15.3%) | 4 (1.3%) |
| 65 to 74 Years | 0 (0.0%) | 1 (0.9%) |
| 75 Years and over | 2 (3.8%) | 6 (4.6%) |
Technology Access in Lone Star
Computing Device Access in Lone Star
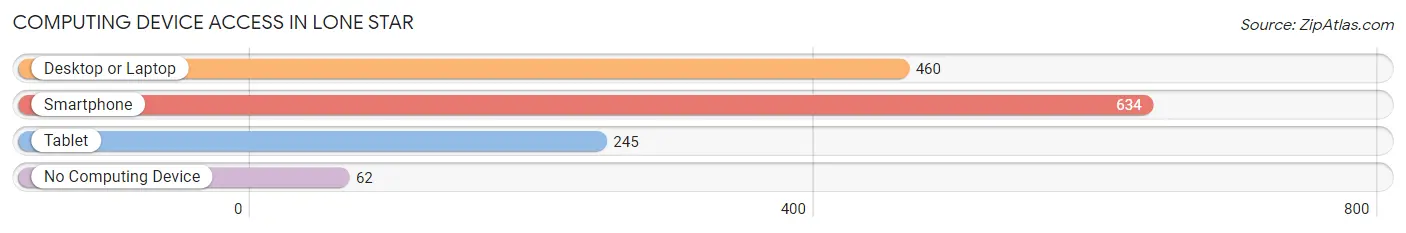
| Device Type | # Households | % Households |
| Desktop or Laptop | 460 | 64.5% |
| Smartphone | 634 | 88.9% |
| Tablet | 245 | 34.4% |
| No Computing Device | 62 | 8.7% |
| Total | 713 | 100.0% |
Internet Access in Lone Star
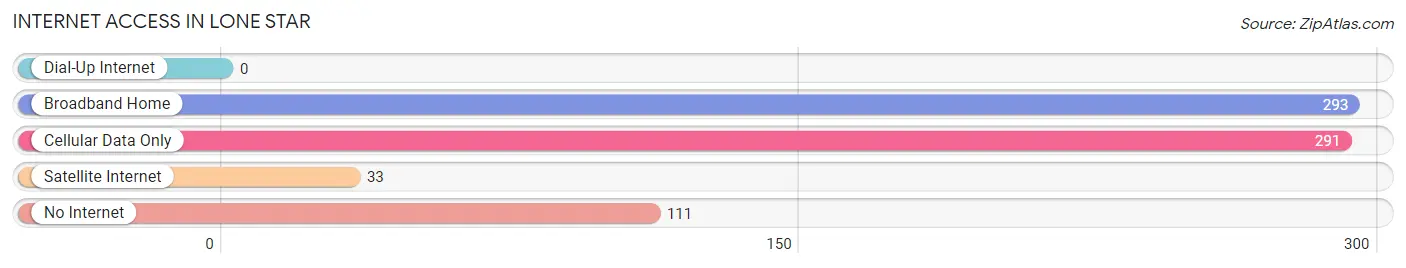
| Internet Type | # Households | % Households |
| Dial-Up Internet | 0 | 0.0% |
| Broadband Home | 293 | 41.1% |
| Cellular Data Only | 291 | 40.8% |
| Satellite Internet | 33 | 4.6% |
| No Internet | 111 | 15.6% |
| Total | 713 | 100.0% |
Lone Star Summary
Lone Star, Texas is a small town located in the northeast corner of Texas, near the border of Arkansas and Louisiana. It is part of the Texarkana metropolitan area and is situated in Bowie County. The town has a population of just over 1,000 people and is known for its rural charm and friendly atmosphere.
History
Lone Star was founded in 1873 by a group of settlers from Arkansas. The town was originally called “Lone Star” because of its location on the border of two states. The town was incorporated in 1876 and was named after the Lone Star of Texas, which is the state’s official symbol.
The town grew slowly but steadily over the years, and by the early 1900s, it had become a thriving community. The town was home to several businesses, including a cotton gin, a sawmill, and a general store. The town also had a school, a post office, and a church.
In the 1920s, the town experienced a period of growth and prosperity. The population increased from just over 500 to nearly 1,000 people. The town also saw the construction of several new buildings, including a new school, a new post office, and a new church.
Geography
Lone Star is located in the northeast corner of Texas, near the border of Arkansas and Louisiana. The town is situated in Bowie County and is part of the Texarkana metropolitan area. The town is located on the banks of the Sulphur River, which is a tributary of the Red River.
The town is surrounded by rolling hills and lush forests. The climate in Lone Star is mild and humid, with temperatures ranging from the mid-50s in the winter to the mid-90s in the summer.
Economy
Lone Star’s economy is largely based on agriculture. The town is home to several farms, which produce a variety of crops, including cotton, corn, soybeans, and wheat. The town also has several small businesses, including a general store, a hardware store, and a restaurant.
The town is also home to several manufacturing companies, which produce a variety of products, including furniture, clothing, and electronics. The town is also home to several oil and gas companies, which are involved in the exploration and production of oil and gas in the area.
Demographics
As of the 2010 census, the population of Lone Star was 1,039 people. The town is predominantly white, with a small Hispanic population. The median household income in Lone Star is $37,000, and the median home value is $90,000.
The town is served by the Lone Star Independent School District, which includes two elementary schools, one middle school, and one high school. The town is also home to several churches, including the First Baptist Church of Lone Star.
Conclusion
Lone Star, Texas is a small town located in the northeast corner of Texas, near the border of Arkansas and Louisiana. The town has a population of just over 1,000 people and is known for its rural charm and friendly atmosphere. The town’s economy is largely based on agriculture, and it is home to several small businesses and manufacturing companies. The town is served by the Lone Star Independent School District and is home to several churches.
Common Questions
What is Per Capita Income in Lone Star?
Per Capita income in Lone Star is $24,912.
What is the Median Family Income in Lone Star?
Median Family Income in Lone Star is $55,172.
What is the Median Household income in Lone Star?
Median Household Income in Lone Star is $41,806.
What is Income or Wage Gap in Lone Star?
Income or Wage Gap in Lone Star is 14.1%.
Women in Lone Star earn 85.9 cents for every dollar earned by a man.
What is Inequality or Gini Index in Lone Star?
Inequality or Gini Index in Lone Star is 0.41.
What is the Total Population of Lone Star?
Total Population of Lone Star is 1,653.
What is the Total Male Population of Lone Star?
Total Male Population of Lone Star is 811.
What is the Total Female Population of Lone Star?
Total Female Population of Lone Star is 842.
What is the Ratio of Males per 100 Females in Lone Star?
There are 96.32 Males per 100 Females in Lone Star.
What is the Ratio of Females per 100 Males in Lone Star?
There are 103.82 Females per 100 Males in Lone Star.
What is the Median Population Age in Lone Star?
Median Population Age in Lone Star is 43.7 Years.
What is the Average Family Size in Lone Star
Average Family Size in Lone Star is 2.8 People.
What is the Average Household Size in Lone Star
Average Household Size in Lone Star is 2.3 People.
How Large is the Labor Force in Lone Star?
There are 670 People in the Labor Forcein in Lone Star.
What is the Percentage of People in the Labor Force in Lone Star?
48.9% of People are in the Labor Force in Lone Star.
What is the Unemployment Rate in Lone Star?
Unemployment Rate in Lone Star is 3.7%.