Knollwood, TX Map & Demographics
Knollwood Map
Knollwood Overview
$31,509
PER CAPITA INCOME
$63,125
AVG FAMILY INCOME
$47,000
AVG HOUSEHOLD INCOME
0.46
INEQUALITY / GINI INDEX
494
TOTAL POPULATION
239
MALE POPULATION
255
FEMALE POPULATION
93.73
MALES / 100 FEMALES
106.69
FEMALES / 100 MALES
28.9
MEDIAN AGE
2.9
AVG FAMILY SIZE
1.6
AVG HOUSEHOLD SIZE
325
LABOR FORCE [ PEOPLE ]
70.8%
PERCENT IN LABOR FORCE
15.7%
UNEMPLOYMENT RATE
Knollwood Area Codes
Income in Knollwood
Income Overview in Knollwood
Per Capita Income in Knollwood is $31,509, while median incomes of families and households are $63,125 and $47,000 respectively.
| Characteristic | Number | Measure |
| Per Capita Income | 494 | $31,509 |
| Median Family Income | 81 | $63,125 |
| Mean Family Income | 81 | $77,228 |
| Median Household Income | 318 | $47,000 |
| Mean Household Income | 318 | $47,581 |
| Income Deficit | 81 | $0 |
| Wage / Income Gap (%) | 494 | 0.00% |
| Wage / Income Gap ($) | 494 | 100.00¢ per $1 |
| Gini / Inequality Index | 494 | 0.46 |
Earnings by Sex in Knollwood
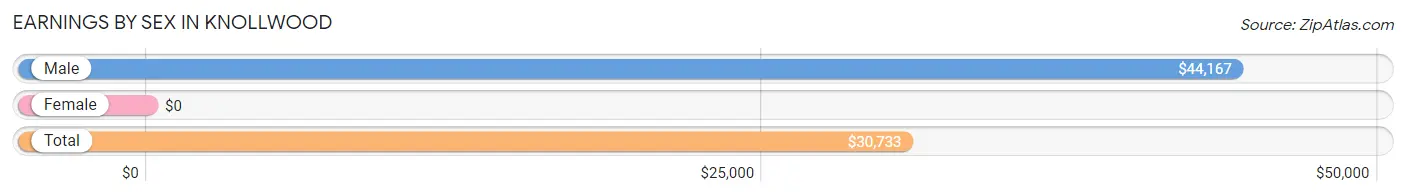
| Sex | Number | Average Earnings |
| Male | 168 (50.4%) | $44,167 |
| Female | 165 (49.5%) | $0 |
| Total | 333 (100.0%) | $30,733 |
Earnings by Sex by Income Bracket in Knollwood
The most common earnings brackets in Knollwood are $55,000 to $64,999 for men (37 | 22.0%) and $2,499 or less for women (60 | 36.4%).
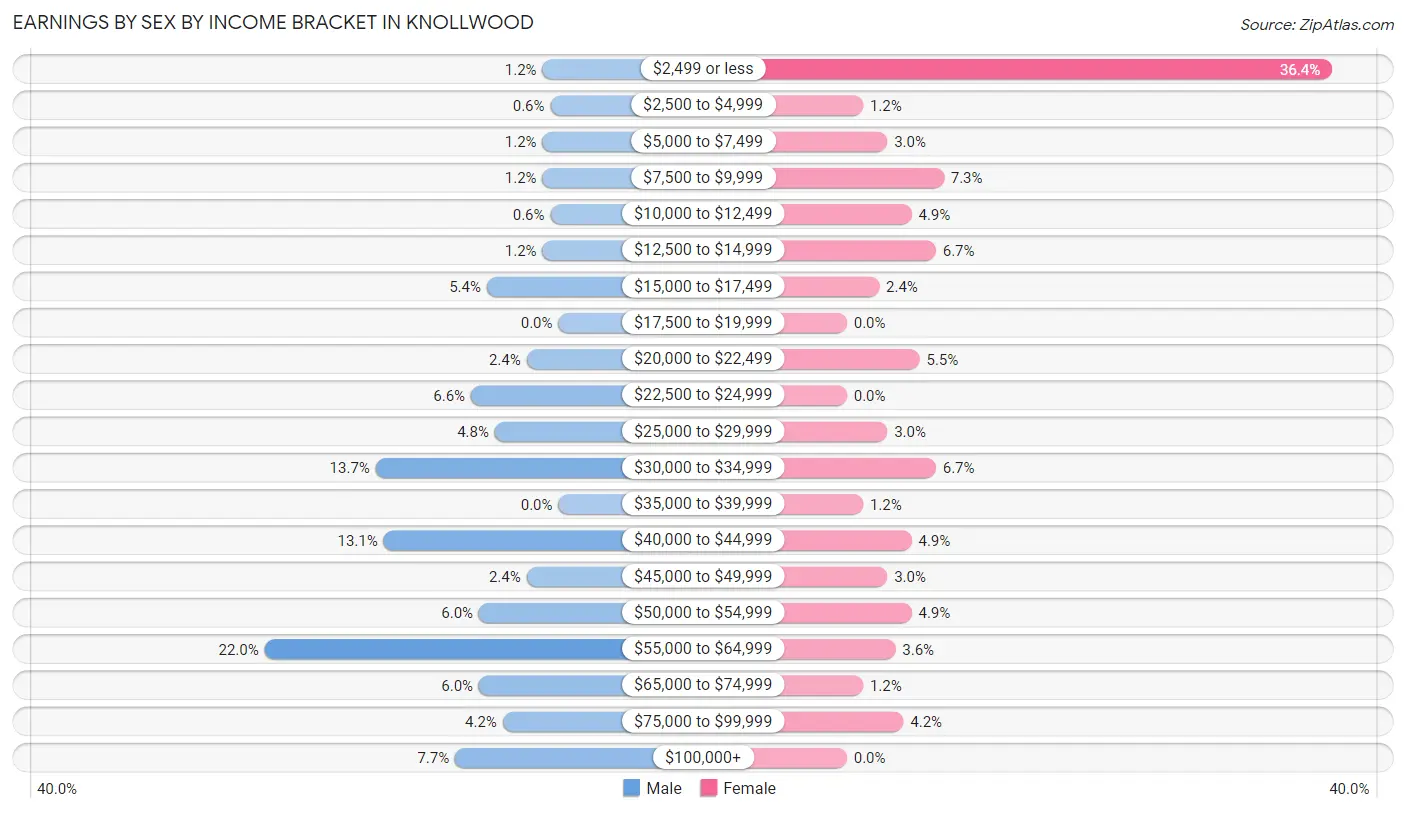
| Income | Male | Female |
| $2,499 or less | 2 (1.2%) | 60 (36.4%) |
| $2,500 to $4,999 | 1 (0.6%) | 2 (1.2%) |
| $5,000 to $7,499 | 2 (1.2%) | 5 (3.0%) |
| $7,500 to $9,999 | 2 (1.2%) | 12 (7.3%) |
| $10,000 to $12,499 | 1 (0.6%) | 8 (4.9%) |
| $12,500 to $14,999 | 2 (1.2%) | 11 (6.7%) |
| $15,000 to $17,499 | 9 (5.4%) | 4 (2.4%) |
| $17,500 to $19,999 | 0 (0.0%) | 0 (0.0%) |
| $20,000 to $22,499 | 4 (2.4%) | 9 (5.4%) |
| $22,500 to $24,999 | 11 (6.6%) | 0 (0.0%) |
| $25,000 to $29,999 | 8 (4.8%) | 5 (3.0%) |
| $30,000 to $34,999 | 23 (13.7%) | 11 (6.7%) |
| $35,000 to $39,999 | 0 (0.0%) | 2 (1.2%) |
| $40,000 to $44,999 | 22 (13.1%) | 8 (4.9%) |
| $45,000 to $49,999 | 4 (2.4%) | 5 (3.0%) |
| $50,000 to $54,999 | 10 (5.9%) | 8 (4.9%) |
| $55,000 to $64,999 | 37 (22.0%) | 6 (3.6%) |
| $65,000 to $74,999 | 10 (5.9%) | 2 (1.2%) |
| $75,000 to $99,999 | 7 (4.2%) | 7 (4.2%) |
| $100,000+ | 13 (7.7%) | 0 (0.0%) |
| Total | 168 (100.0%) | 165 (100.0%) |
Earnings by Sex by Educational Attainment in Knollwood
Average earnings in Knollwood are $55,000 for men and $22,321 for women, a difference of 59.4%. Men with an educational attainment of bachelor's degree enjoy the highest average annual earnings of $60,833, while those with high school diploma education earn the least with $33,750. Women with an educational attainment of college or associate's degree earn the most with the average annual earnings of $41,250, while those with high school diploma education have the smallest earnings of $13,333.
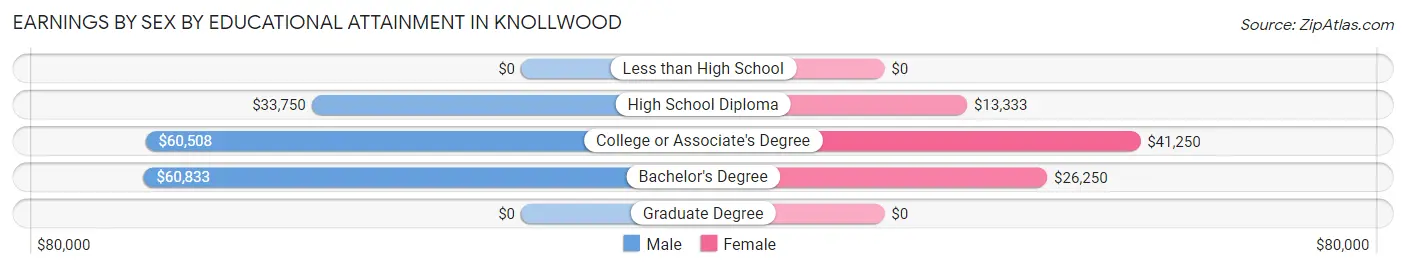
| Educational Attainment | Male Income | Female Income |
| Less than High School | - | - |
| High School Diploma | $33,750 | $13,333 |
| College or Associate's Degree | $60,508 | $41,250 |
| Bachelor's Degree | $60,833 | $26,250 |
| Graduate Degree | - | - |
| Total | $55,000 | $22,321 |
Family Income in Knollwood
Family Income Brackets in Knollwood
According to the Knollwood family income data, there are 19 families falling into the $50,000 to $74,999 income range, which is the most common income bracket and makes up 23.5% of all families.
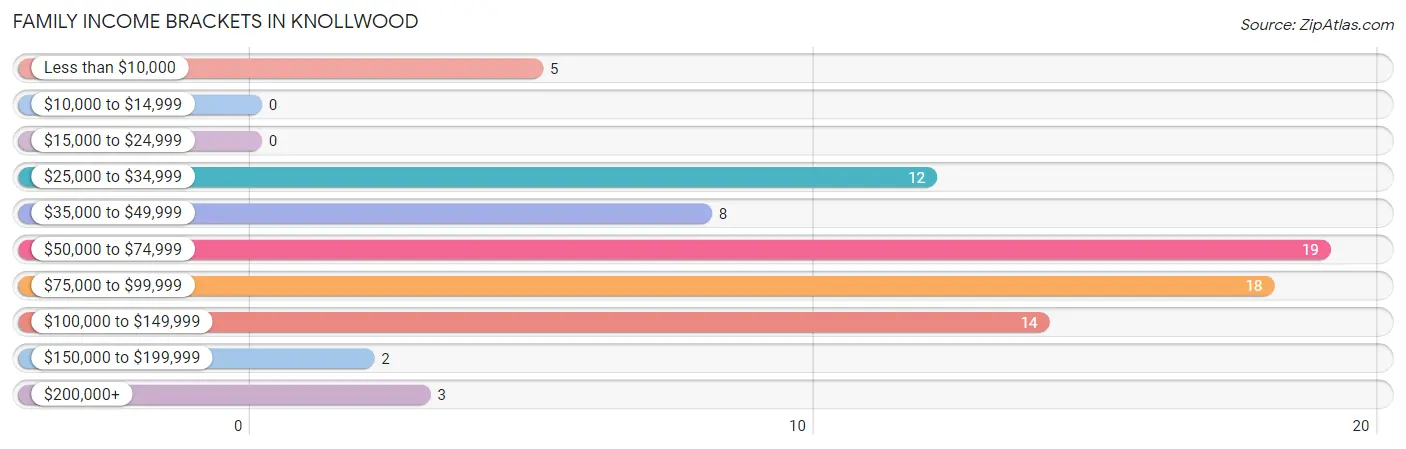
| Income Bracket | # Families | % Families |
| Less than $10,000 | 5 | 6.2% |
| $10,000 to $14,999 | 0 | 0.0% |
| $15,000 to $24,999 | 0 | 0.0% |
| $25,000 to $34,999 | 12 | 14.8% |
| $35,000 to $49,999 | 8 | 9.9% |
| $50,000 to $74,999 | 19 | 23.5% |
| $75,000 to $99,999 | 18 | 22.2% |
| $100,000 to $149,999 | 14 | 17.3% |
| $150,000 to $199,999 | 2 | 2.5% |
| $200,000+ | 3 | 3.7% |
Family Income by Famaliy Size in Knollwood
3-person families (23 | 28.4%) account for the highest median family income in Knollwood with $108,125 per family, while 3-person families (23 | 28.4%) have the highest median income of $36,042 per family member.
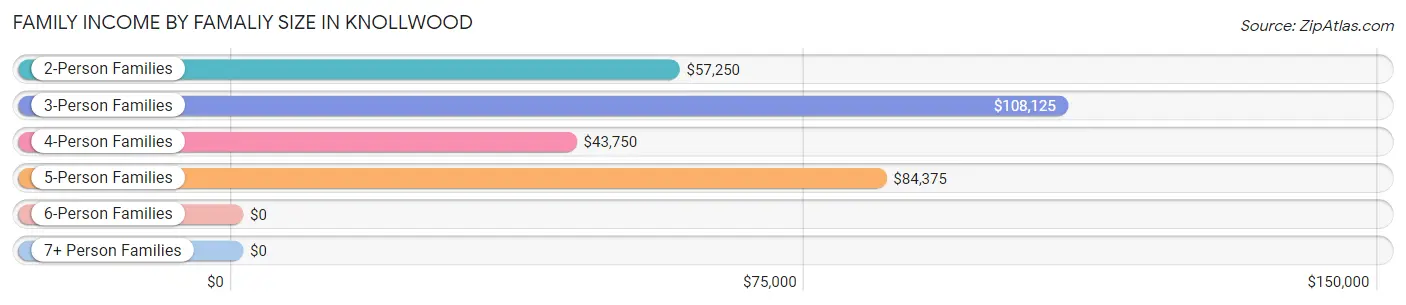
| Income Bracket | # Families | Median Income |
| 2-Person Families | 45 (55.6%) | $57,250 |
| 3-Person Families | 23 (28.4%) | $108,125 |
| 4-Person Families | 6 (7.4%) | $43,750 |
| 5-Person Families | 7 (8.6%) | $84,375 |
| 6-Person Families | 0 (0.0%) | $0 |
| 7+ Person Families | 0 (0.0%) | $0 |
| Total | 81 (100.0%) | $63,125 |
Family Income by Number of Earners in Knollwood
The median family income in Knollwood is $63,125, with families comprising 3+ earners (6) having the highest median family income of $105,000, while families with no earners (15) have the lowest median family income of $33,036, accounting for 7.4% and 18.5% of families, respectively.
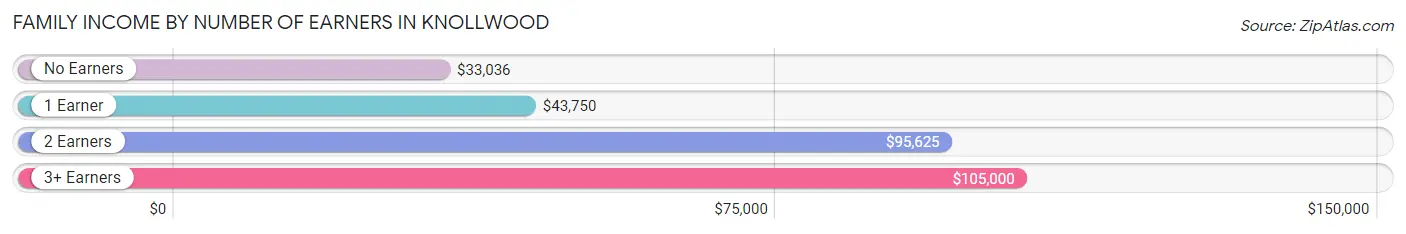
| Number of Earners | # Families | Median Income |
| No Earners | 15 (18.5%) | $33,036 |
| 1 Earner | 16 (19.8%) | $43,750 |
| 2 Earners | 44 (54.3%) | $95,625 |
| 3+ Earners | 6 (7.4%) | $105,000 |
| Total | 81 (100.0%) | $63,125 |
Household Income in Knollwood
Household Income Brackets in Knollwood
With 82 households falling in the category, the $50,000 to $74,999 income range is the most frequent in Knollwood, accounting for 25.8% of all households. In contrast, only 2 households (0.6%) fall into the $150,000 to $199,999 income bracket, making it the least populous group.
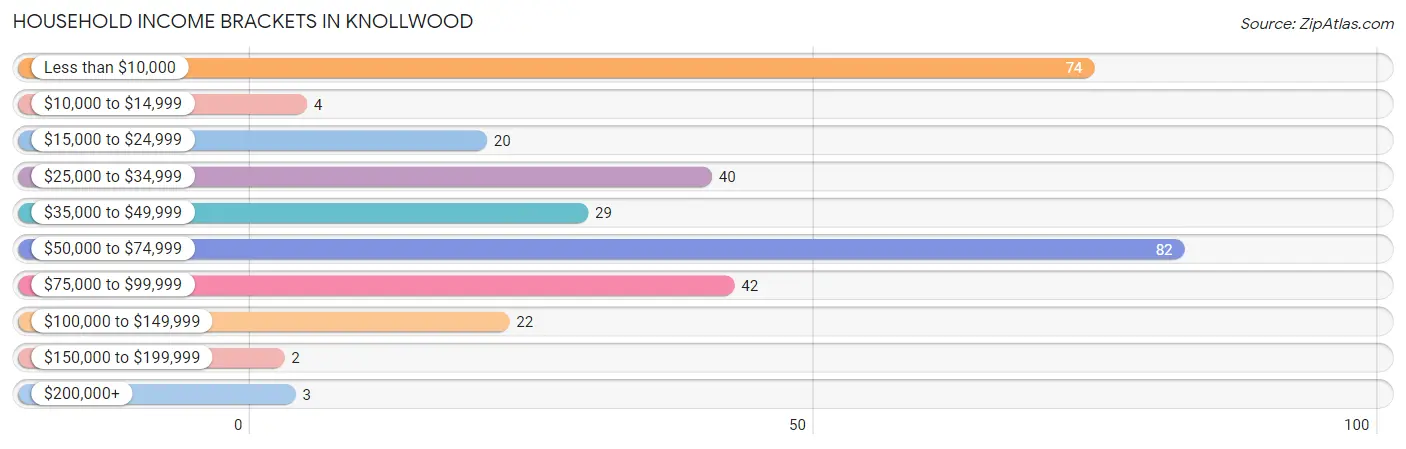
| Income Bracket | # Households | % Households |
| Less than $10,000 | 74 | 23.3% |
| $10,000 to $14,999 | 4 | 1.3% |
| $15,000 to $24,999 | 20 | 6.3% |
| $25,000 to $34,999 | 40 | 12.6% |
| $35,000 to $49,999 | 29 | 9.1% |
| $50,000 to $74,999 | 82 | 25.8% |
| $75,000 to $99,999 | 42 | 13.2% |
| $100,000 to $149,999 | 22 | 6.9% |
| $150,000 to $199,999 | 2 | 0.6% |
| $200,000+ | 3 | 0.9% |
Household Income by Householder Age in Knollwood
The median household income in Knollwood is $47,000, with the highest median household income of $75,625 found in the 45 to 64 years age bracket for the primary householder. A total of 57 households (17.9%) fall into this category. Meanwhile, the 15 to 24 years age bracket for the primary householder has the lowest median household income of $2,499, with 86 households (27.0%) in this group.
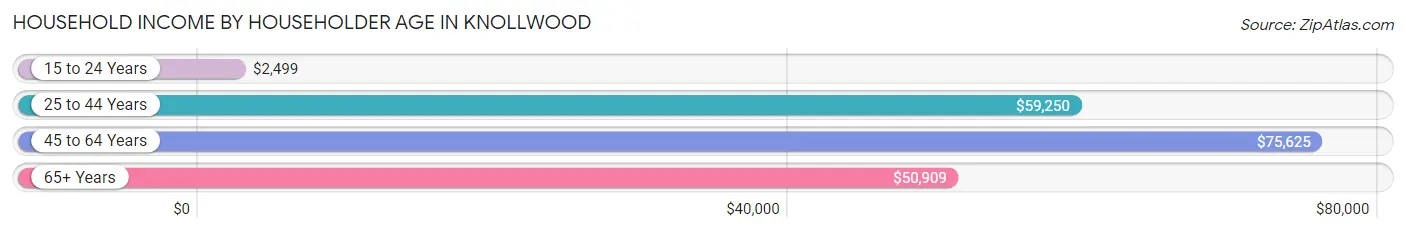
| Income Bracket | # Households | Median Income |
| 15 to 24 Years | 86 (27.0%) | $2,499 |
| 25 to 44 Years | 103 (32.4%) | $59,250 |
| 45 to 64 Years | 57 (17.9%) | $75,625 |
| 65+ Years | 72 (22.6%) | $50,909 |
| Total | 318 (100.0%) | $47,000 |
Poverty in Knollwood
Income Below Poverty by Sex and Age in Knollwood
With 2.5% poverty level for males and 35.3% for females among the residents of Knollwood, 65 to 74 year old males and 18 to 24 year old females are the most vulnerable to poverty, with 2 males (13.3%) and 67 females (73.6%) in their respective age groups living below the poverty level.
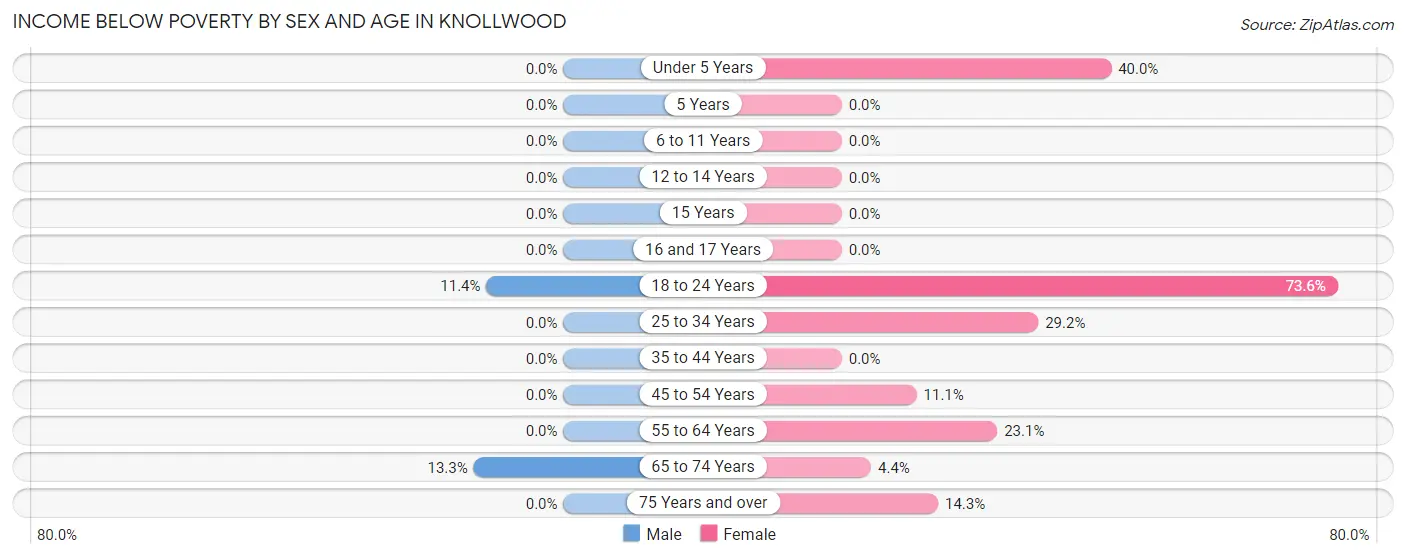
| Age Bracket | Male | Female |
| Under 5 Years | 0 (0.0%) | 4 (40.0%) |
| 5 Years | 0 (0.0%) | 0 (0.0%) |
| 6 to 11 Years | 0 (0.0%) | 0 (0.0%) |
| 12 to 14 Years | 0 (0.0%) | 0 (0.0%) |
| 15 Years | 0 (0.0%) | 0 (0.0%) |
| 16 and 17 Years | 0 (0.0%) | 0 (0.0%) |
| 18 to 24 Years | 4 (11.4%) | 67 (73.6%) |
| 25 to 34 Years | 0 (0.0%) | 7 (29.2%) |
| 35 to 44 Years | 0 (0.0%) | 0 (0.0%) |
| 45 to 54 Years | 0 (0.0%) | 2 (11.1%) |
| 55 to 64 Years | 0 (0.0%) | 6 (23.1%) |
| 65 to 74 Years | 2 (13.3%) | 2 (4.3%) |
| 75 Years and over | 0 (0.0%) | 2 (14.3%) |
| Total | 6 (2.5%) | 90 (35.3%) |
Income Above Poverty by Sex and Age in Knollwood
According to the poverty statistics in Knollwood, males aged under 5 years and females aged 12 to 14 years are the age groups that are most secure financially, with 100.0% of males and 100.0% of females in these age groups living above the poverty line.
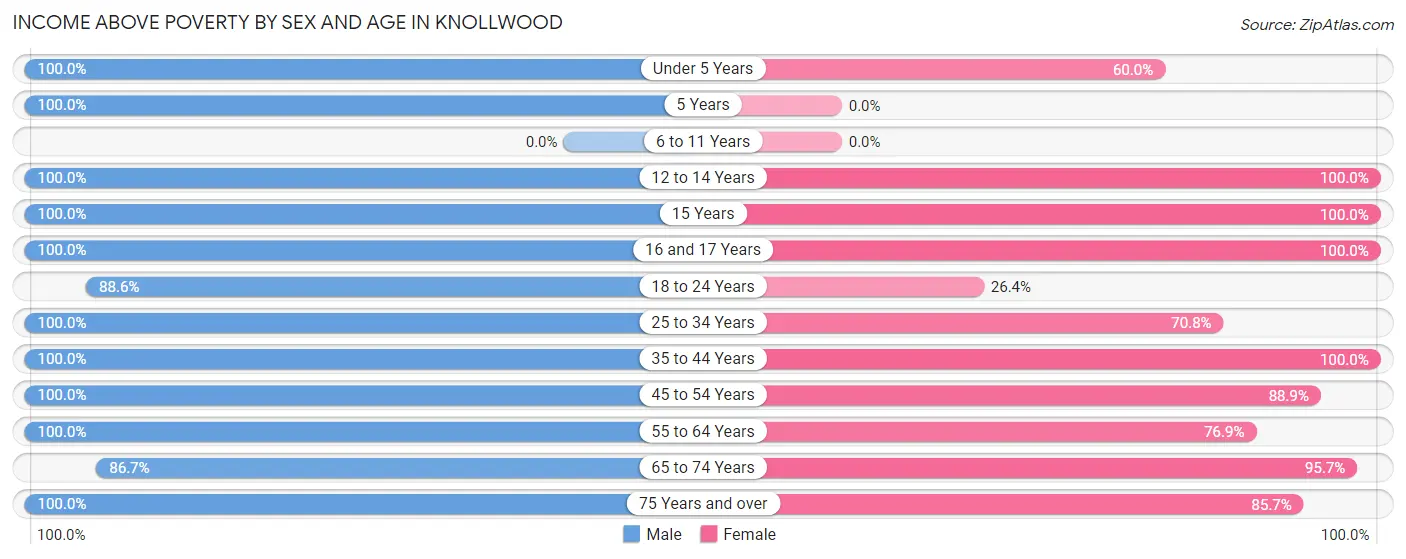
| Age Bracket | Male | Female |
| Under 5 Years | 11 (100.0%) | 6 (60.0%) |
| 5 Years | 4 (100.0%) | 0 (0.0%) |
| 6 to 11 Years | 0 (0.0%) | 0 (0.0%) |
| 12 to 14 Years | 5 (100.0%) | 1 (100.0%) |
| 15 Years | 2 (100.0%) | 2 (100.0%) |
| 16 and 17 Years | 6 (100.0%) | 6 (100.0%) |
| 18 to 24 Years | 31 (88.6%) | 24 (26.4%) |
| 25 to 34 Years | 74 (100.0%) | 17 (70.8%) |
| 35 to 44 Years | 25 (100.0%) | 17 (100.0%) |
| 45 to 54 Years | 16 (100.0%) | 16 (88.9%) |
| 55 to 64 Years | 24 (100.0%) | 20 (76.9%) |
| 65 to 74 Years | 13 (86.7%) | 44 (95.7%) |
| 75 Years and over | 22 (100.0%) | 12 (85.7%) |
| Total | 233 (97.5%) | 165 (64.7%) |
Income Below Poverty Among Married-Couple Families in Knollwood
The poverty statistics for married-couple families in Knollwood show that 3.5% or 2 of the total 57 families live below the poverty line. Families with no children have the highest poverty rate of 4.9%, comprising of 2 families. On the other hand, families with 1 or 2 children have the lowest poverty rate of 0.0%, which includes 0 families.
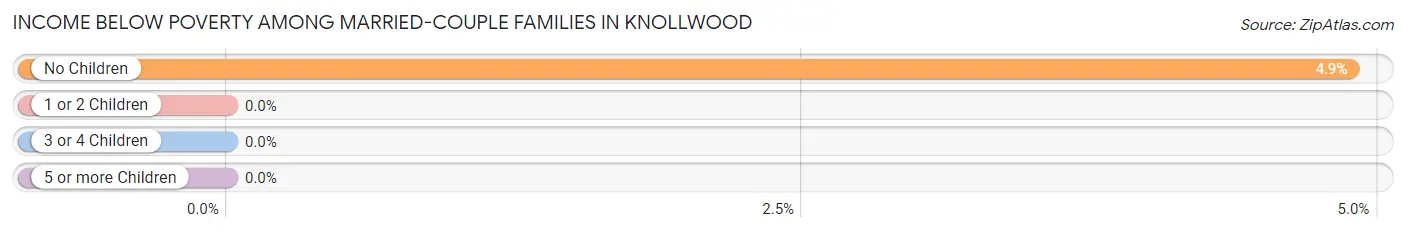
| Children | Above Poverty | Below Poverty |
| No Children | 39 (95.1%) | 2 (4.9%) |
| 1 or 2 Children | 14 (100.0%) | 0 (0.0%) |
| 3 or 4 Children | 2 (100.0%) | 0 (0.0%) |
| 5 or more Children | 0 (0.0%) | 0 (0.0%) |
| Total | 55 (96.5%) | 2 (3.5%) |
Income Below Poverty Among Single-Parent Households in Knollwood
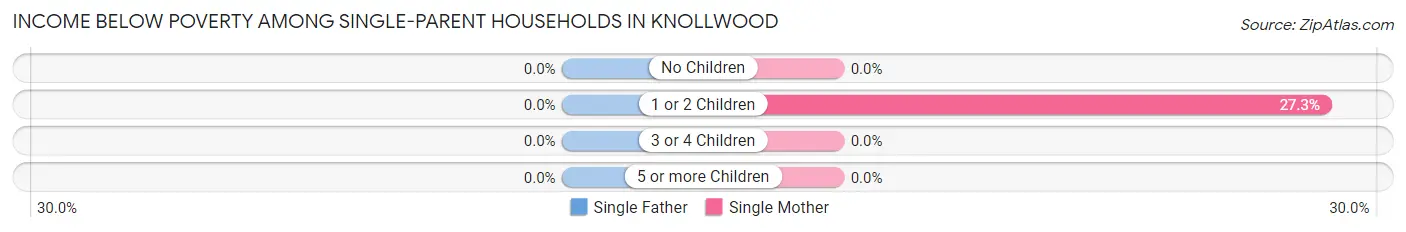
| Children | Single Father | Single Mother |
| No Children | 0 (0.0%) | 0 (0.0%) |
| 1 or 2 Children | 0 (0.0%) | 3 (27.3%) |
| 3 or 4 Children | 0 (0.0%) | 0 (0.0%) |
| 5 or more Children | 0 (0.0%) | 0 (0.0%) |
| Total | 0 (0.0%) | 3 (17.6%) |
Income Below Poverty Among Married-Couple vs Single-Parent Households in Knollwood
The poverty data for Knollwood shows that 2 of the married-couple family households (3.5%) and 3 of the single-parent households (12.5%) are living below the poverty level. Within the married-couple family households, those with no children have the highest poverty rate, with 2 households (4.9%) falling below the poverty line. Among the single-parent households, those with 1 or 2 children have the highest poverty rate, with 3 household (27.3%) living below poverty.
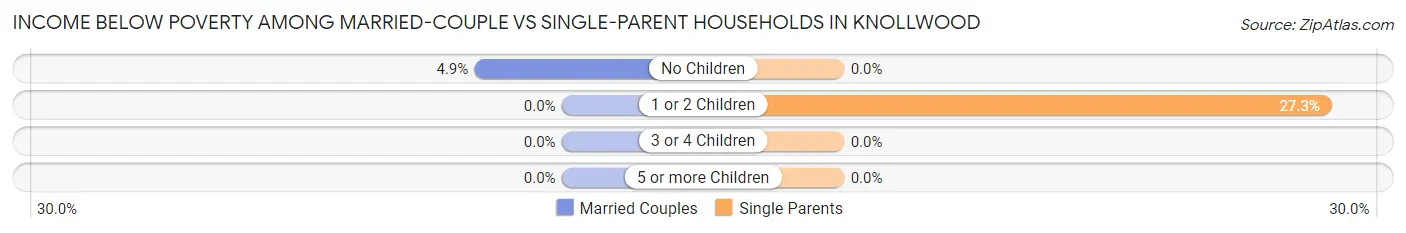
| Children | Married-Couple Families | Single-Parent Households |
| No Children | 2 (4.9%) | 0 (0.0%) |
| 1 or 2 Children | 0 (0.0%) | 3 (27.3%) |
| 3 or 4 Children | 0 (0.0%) | 0 (0.0%) |
| 5 or more Children | 0 (0.0%) | 0 (0.0%) |
| Total | 2 (3.5%) | 3 (12.5%) |
Race in Knollwood
The most populous races in Knollwood are White / Caucasian (381 | 77.1%), Two or more Races (73 | 14.8%), and Hispanic or Latino (25 | 5.1%).
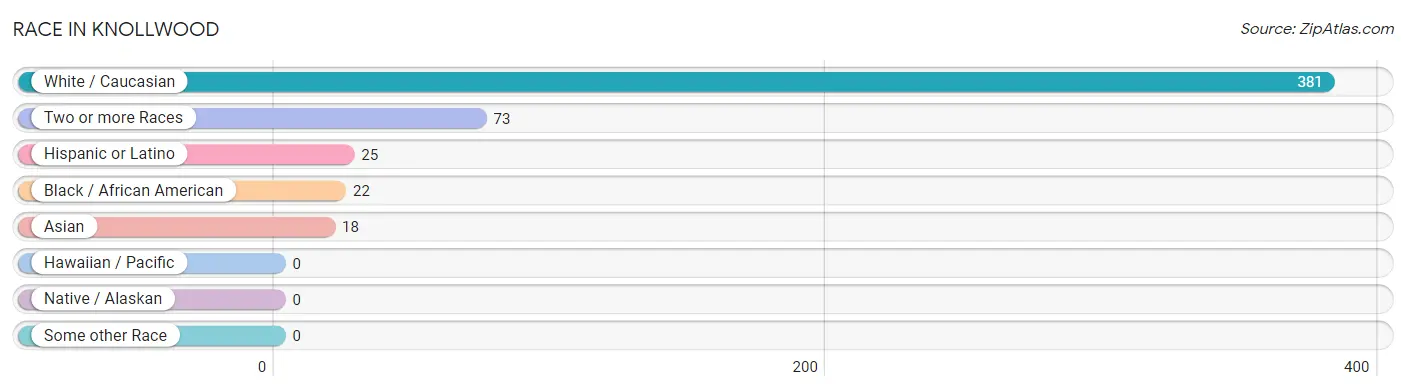
| Race | # Population | % Population |
| Asian | 18 | 3.6% |
| Black / African American | 22 | 4.4% |
| Hawaiian / Pacific | 0 | 0.0% |
| Hispanic or Latino | 25 | 5.1% |
| Native / Alaskan | 0 | 0.0% |
| White / Caucasian | 381 | 77.1% |
| Two or more Races | 73 | 14.8% |
| Some other Race | 0 | 0.0% |
| Total | 494 | 100.0% |
Ancestry in Knollwood
The most populous ancestries reported in Knollwood are Irish (98 | 19.8%), German (79 | 16.0%), English (29 | 5.9%), American (25 | 5.1%), and Mexican (20 | 4.1%), together accounting for 50.8% of all Knollwood residents.
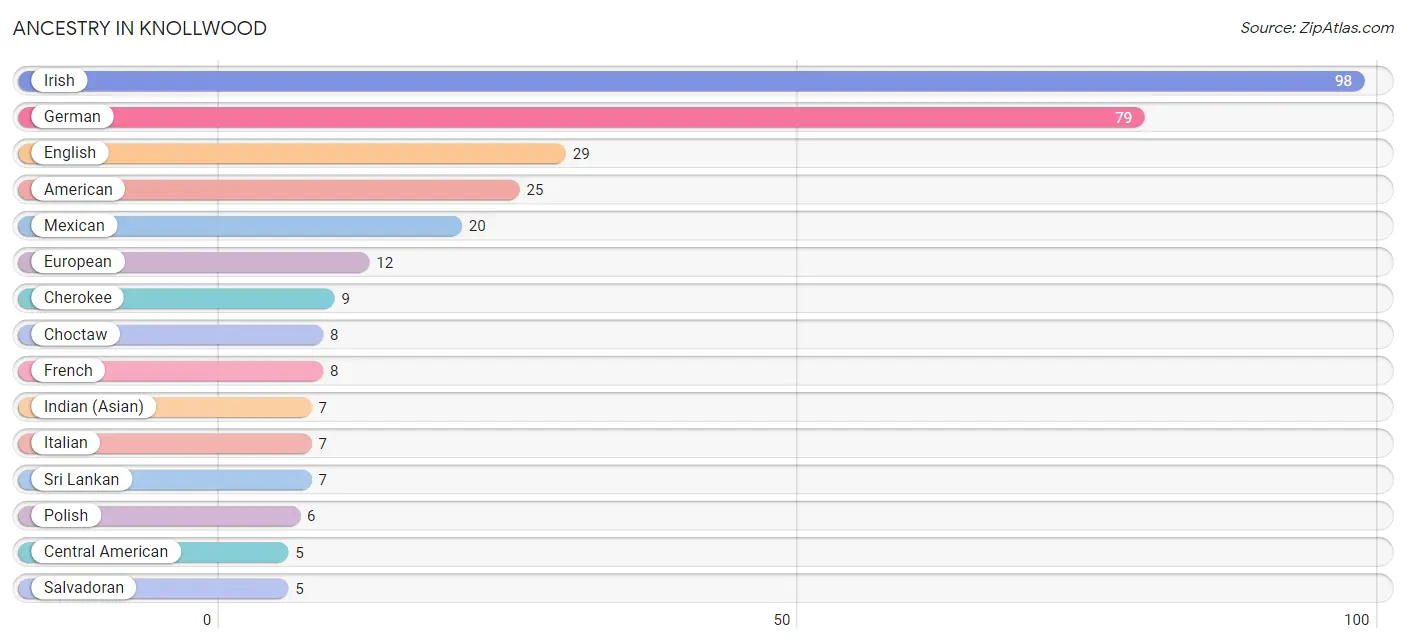
| Ancestry | # Population | % Population |
| American | 25 | 5.1% |
| Blackfeet | 1 | 0.2% |
| British | 4 | 0.8% |
| Burmese | 4 | 0.8% |
| Central American | 5 | 1.0% |
| Cherokee | 9 | 1.8% |
| Chickasaw | 2 | 0.4% |
| Choctaw | 8 | 1.6% |
| Czech | 2 | 0.4% |
| English | 29 | 5.9% |
| European | 12 | 2.4% |
| French | 8 | 1.6% |
| German | 79 | 16.0% |
| Indian (Asian) | 7 | 1.4% |
| Irish | 98 | 19.8% |
| Italian | 7 | 1.4% |
| Mexican | 20 | 4.1% |
| Polish | 6 | 1.2% |
| Salvadoran | 5 | 1.0% |
| Scotch-Irish | 5 | 1.0% |
| Scottish | 5 | 1.0% |
| Sri Lankan | 7 | 1.4% |
| Swedish | 5 | 1.0% |
| Welsh | 2 | 0.4% | View All 24 Rows |
Immigrants in Knollwood
The most numerous immigrant groups reported in Knollwood came from Asia (11 | 2.2%), South Eastern Asia (7 | 1.4%), Vietnam (7 | 1.4%), Eastern Asia (4 | 0.8%), and Korea (4 | 0.8%), together accounting for 6.7% of all Knollwood residents.
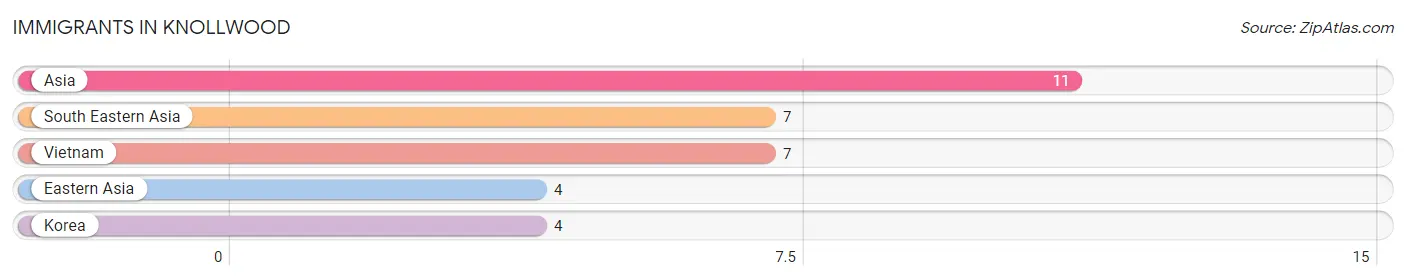
| Immigration Origin | # Population | % Population |
| Asia | 11 | 2.2% |
| Eastern Asia | 4 | 0.8% |
| Korea | 4 | 0.8% |
| South Eastern Asia | 7 | 1.4% |
| Vietnam | 7 | 1.4% | View All 5 Rows |
Sex and Age in Knollwood
Sex and Age in Knollwood
The most populous age groups in Knollwood are 25 to 29 Years (66 | 27.6%) for men and 20 to 24 Years (89 | 34.9%) for women.
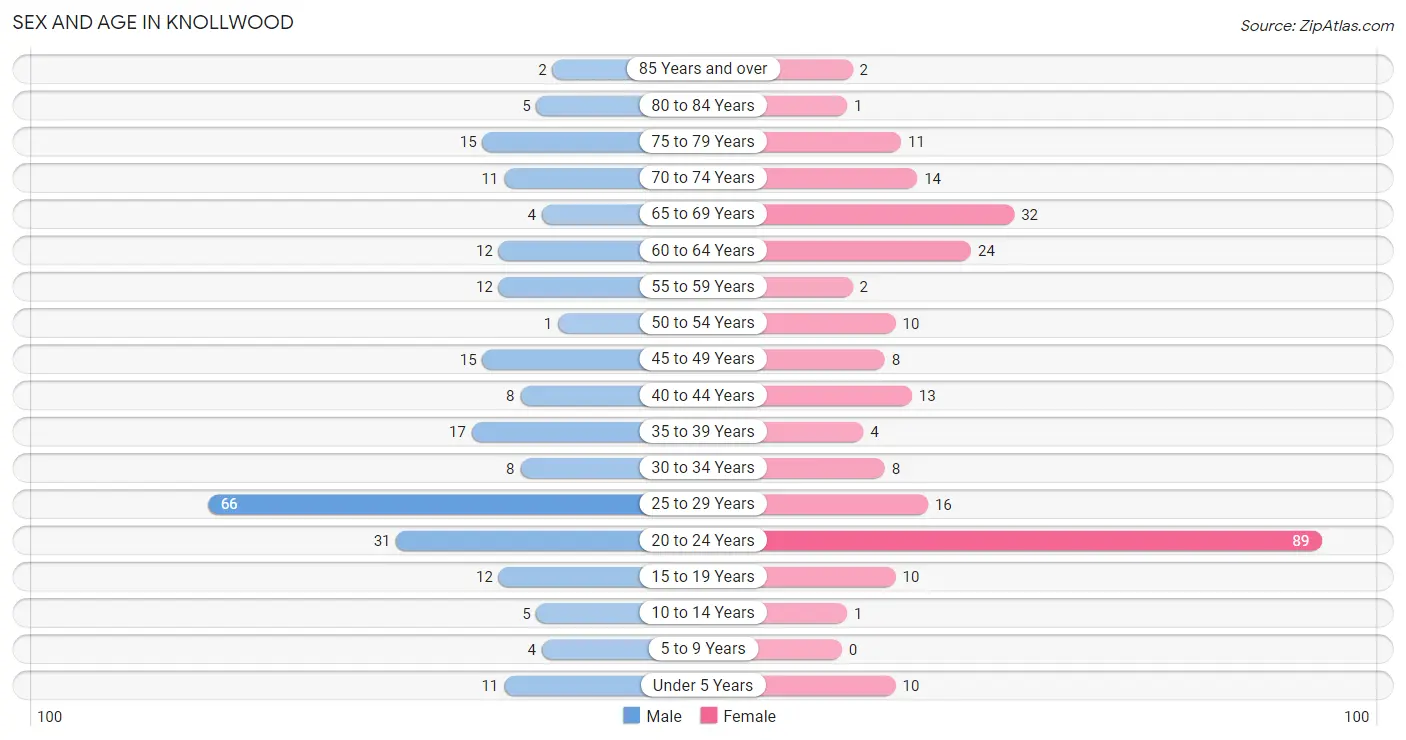
| Age Bracket | Male | Female |
| Under 5 Years | 11 (4.6%) | 10 (3.9%) |
| 5 to 9 Years | 4 (1.7%) | 0 (0.0%) |
| 10 to 14 Years | 5 (2.1%) | 1 (0.4%) |
| 15 to 19 Years | 12 (5.0%) | 10 (3.9%) |
| 20 to 24 Years | 31 (13.0%) | 89 (34.9%) |
| 25 to 29 Years | 66 (27.6%) | 16 (6.3%) |
| 30 to 34 Years | 8 (3.4%) | 8 (3.1%) |
| 35 to 39 Years | 17 (7.1%) | 4 (1.6%) |
| 40 to 44 Years | 8 (3.4%) | 13 (5.1%) |
| 45 to 49 Years | 15 (6.3%) | 8 (3.1%) |
| 50 to 54 Years | 1 (0.4%) | 10 (3.9%) |
| 55 to 59 Years | 12 (5.0%) | 2 (0.8%) |
| 60 to 64 Years | 12 (5.0%) | 24 (9.4%) |
| 65 to 69 Years | 4 (1.7%) | 32 (12.6%) |
| 70 to 74 Years | 11 (4.6%) | 14 (5.5%) |
| 75 to 79 Years | 15 (6.3%) | 11 (4.3%) |
| 80 to 84 Years | 5 (2.1%) | 1 (0.4%) |
| 85 Years and over | 2 (0.8%) | 2 (0.8%) |
| Total | 239 (100.0%) | 255 (100.0%) |
Families and Households in Knollwood
Median Family Size in Knollwood
The median family size in Knollwood is 2.85 persons per family, with single female/mother families (17 | 21.0%) accounting for the largest median family size of 3 persons per family. On the other hand, single male/father families (7 | 8.6%) represent the smallest median family size with 2.00 persons per family.
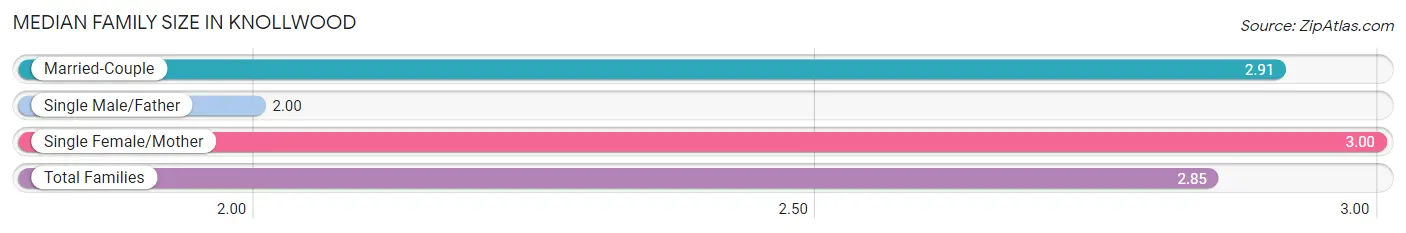
| Family Type | # Families | Family Size |
| Married-Couple | 57 (70.4%) | 2.91 |
| Single Male/Father | 7 (8.6%) | 2.00 |
| Single Female/Mother | 17 (21.0%) | 3.00 |
| Total Families | 81 (100.0%) | 2.85 |
Median Household Size in Knollwood
The median household size in Knollwood is 1.55 persons per household, with single female/mother households (17 | 5.3%) accounting for the largest median household size of 3.18 persons per household. non-family households (237 | 74.5%) represent the smallest median household size with 1.10 persons per household.
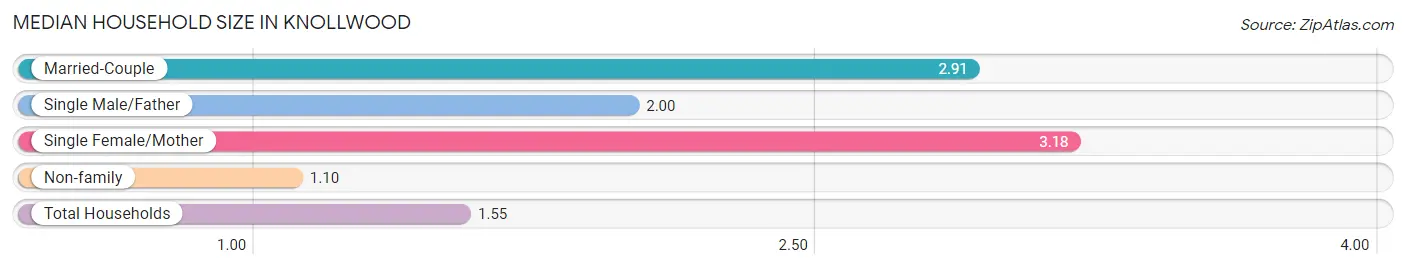
| Household Type | # Households | Household Size |
| Married-Couple | 57 (17.9%) | 2.91 |
| Single Male/Father | 7 (2.2%) | 2.00 |
| Single Female/Mother | 17 (5.3%) | 3.18 |
| Non-family | 237 (74.5%) | 1.10 |
| Total Households | 318 (100.0%) | 1.55 |
Household Size by Marriage Status in Knollwood
Out of a total of 318 households in Knollwood, 81 (25.5%) are family households, while 237 (74.5%) are nonfamily households. The most numerous type of family households are 2-person households, comprising 42, and the most common type of nonfamily households are 1-person households, comprising 215.
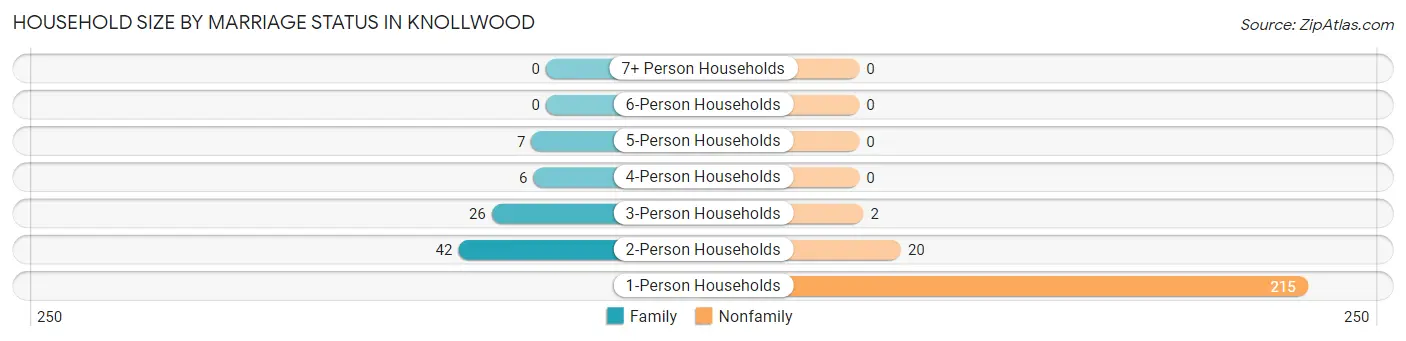
| Household Size | Family Households | Nonfamily Households |
| 1-Person Households | - | 215 (67.6%) |
| 2-Person Households | 42 (13.2%) | 20 (6.3%) |
| 3-Person Households | 26 (8.2%) | 2 (0.6%) |
| 4-Person Households | 6 (1.9%) | 0 (0.0%) |
| 5-Person Households | 7 (2.2%) | 0 (0.0%) |
| 6-Person Households | 0 (0.0%) | 0 (0.0%) |
| 7+ Person Households | 0 (0.0%) | 0 (0.0%) |
| Total | 81 (25.5%) | 237 (74.5%) |
Female Fertility in Knollwood
Fertility by Age in Knollwood
Average fertility rate in Knollwood is 67.0 births per 1,000 women. Women in the age bracket of 35 to 50 years have the highest fertility rate with 77.0 births per 1,000 women. Women in the age bracket of 20 to 34 years acount for 80.0% of all women with births.
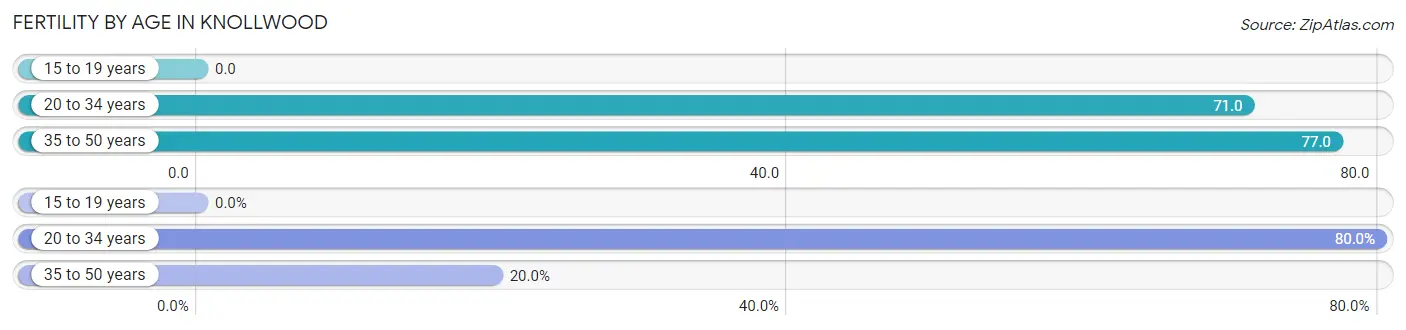
| Age Bracket | Women with Births | Births / 1,000 Women |
| 15 to 19 years | 0 (0.0%) | 0.0 |
| 20 to 34 years | 8 (80.0%) | 71.0 |
| 35 to 50 years | 2 (20.0%) | 77.0 |
| Total | 10 (100.0%) | 67.0 |
Fertility by Age by Marriage Status in Knollwood
50.0% of women with births (10) in Knollwood are married. The highest percentage of unmarried women with births falls into 35 to 50 years age bracket with 100.0% of them unmarried at the time of birth, while the lowest percentage of unmarried women with births belong to 20 to 34 years age bracket with 37.5% of them unmarried.
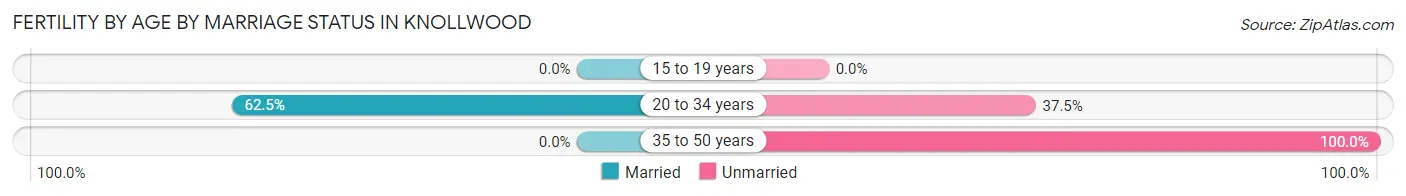
| Age Bracket | Married | Unmarried |
| 15 to 19 years | 0 (0.0%) | 0 (0.0%) |
| 20 to 34 years | 5 (62.5%) | 3 (37.5%) |
| 35 to 50 years | 0 (0.0%) | 2 (100.0%) |
| Total | 5 (50.0%) | 5 (50.0%) |
Fertility by Education in Knollwood
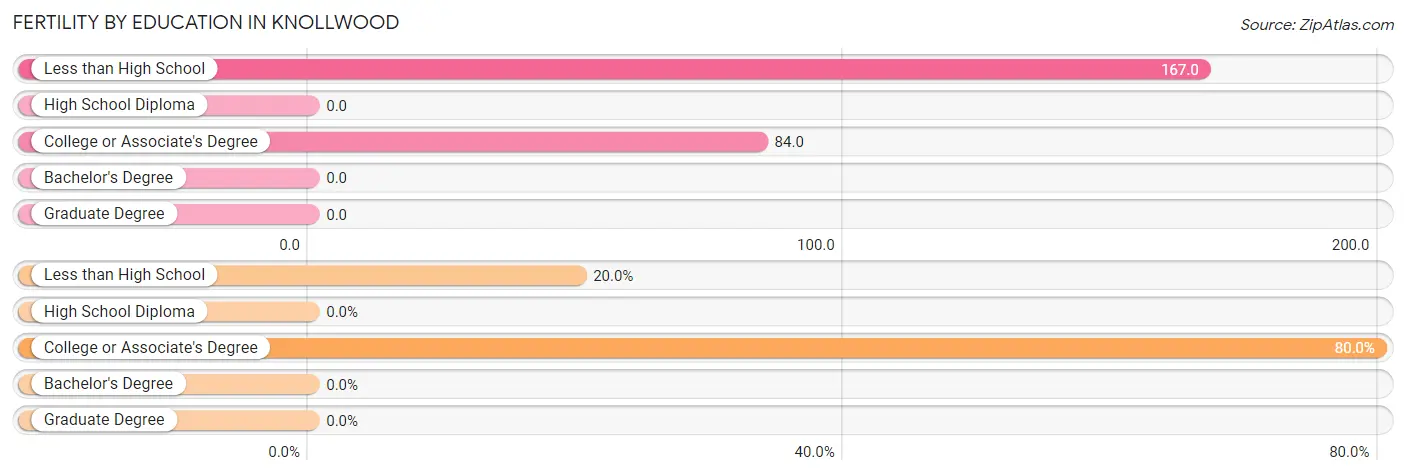
| Educational Attainment | Women with Births | Births / 1,000 Women |
| Less than High School | 2 (20.0%) | 167.0 |
| High School Diploma | 0 (0.0%) | 0.0 |
| College or Associate's Degree | 8 (80.0%) | 84.0 |
| Bachelor's Degree | 0 (0.0%) | 0.0 |
| Graduate Degree | 0 (0.0%) | 0.0 |
| Total | 10 (100.0%) | 67.0 |
Fertility by Education by Marriage Status in Knollwood
50.0% of women with births in Knollwood are unmarried. Women with the educational attainment of college or associate's degree are most likely to be married with 62.5% of them married at childbirth, while women with the educational attainment of less than high school are least likely to be married with 100.0% of them unmarried at childbirth.
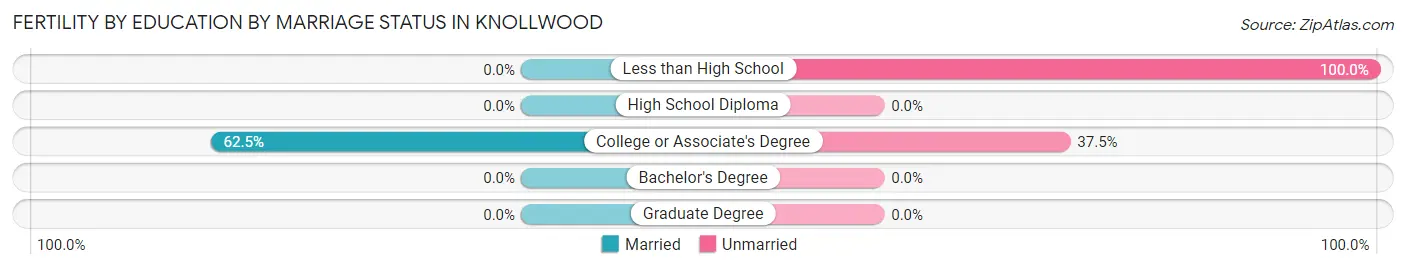
| Educational Attainment | Married | Unmarried |
| Less than High School | 0 (0.0%) | 2 (100.0%) |
| High School Diploma | 0 (0.0%) | 0 (0.0%) |
| College or Associate's Degree | 5 (62.5%) | 3 (37.5%) |
| Bachelor's Degree | 0 (0.0%) | 0 (0.0%) |
| Graduate Degree | 0 (0.0%) | 0 (0.0%) |
| Total | 5 (50.0%) | 5 (50.0%) |
Employment Characteristics in Knollwood
Employment by Class of Employer in Knollwood
Among the 271 employed individuals in Knollwood, private company employees (239 | 88.2%), not-for-profit organizations (16 | 5.9%), and self-employed (not incorporated) (5 | 1.8%) make up the most common classes of employment.
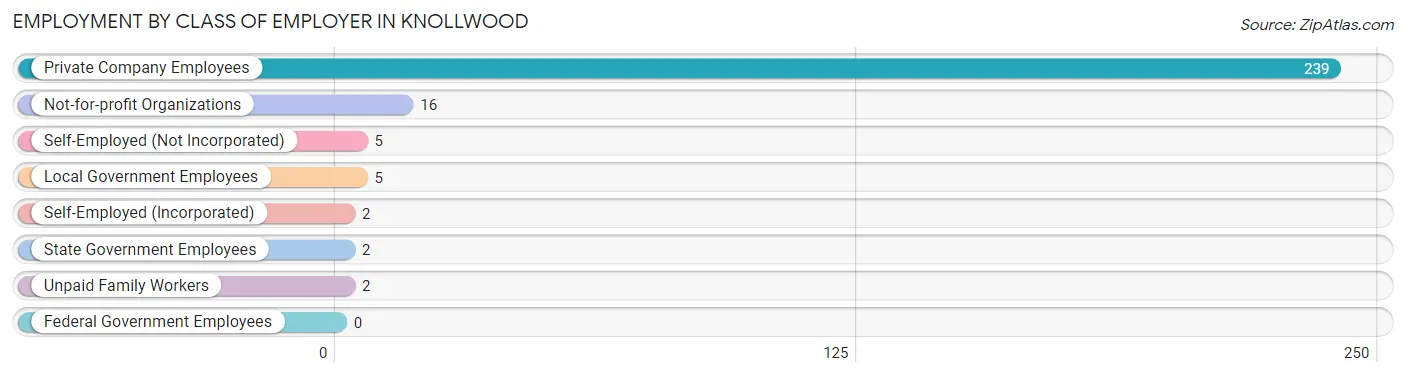
| Employer Class | # Employees | % Employees |
| Private Company Employees | 239 | 88.2% |
| Self-Employed (Incorporated) | 2 | 0.7% |
| Self-Employed (Not Incorporated) | 5 | 1.8% |
| Not-for-profit Organizations | 16 | 5.9% |
| Local Government Employees | 5 | 1.8% |
| State Government Employees | 2 | 0.7% |
| Federal Government Employees | 0 | 0.0% |
| Unpaid Family Workers | 2 | 0.7% |
| Total | 271 | 100.0% |
Employment Status by Age in Knollwood
According to the labor force statistics for Knollwood, out of the total population over 16 years of age (459), 70.8% or 325 individuals are in the labor force, with 15.7% or 51 of them unemployed. The age group with the highest labor force participation rate is 55 to 59 years, with 100.0% or 14 individuals in the labor force. Within the labor force, the 25 to 29 years age range has the highest percentage of unemployed individuals, with 42.7% or 32 of them being unemployed.
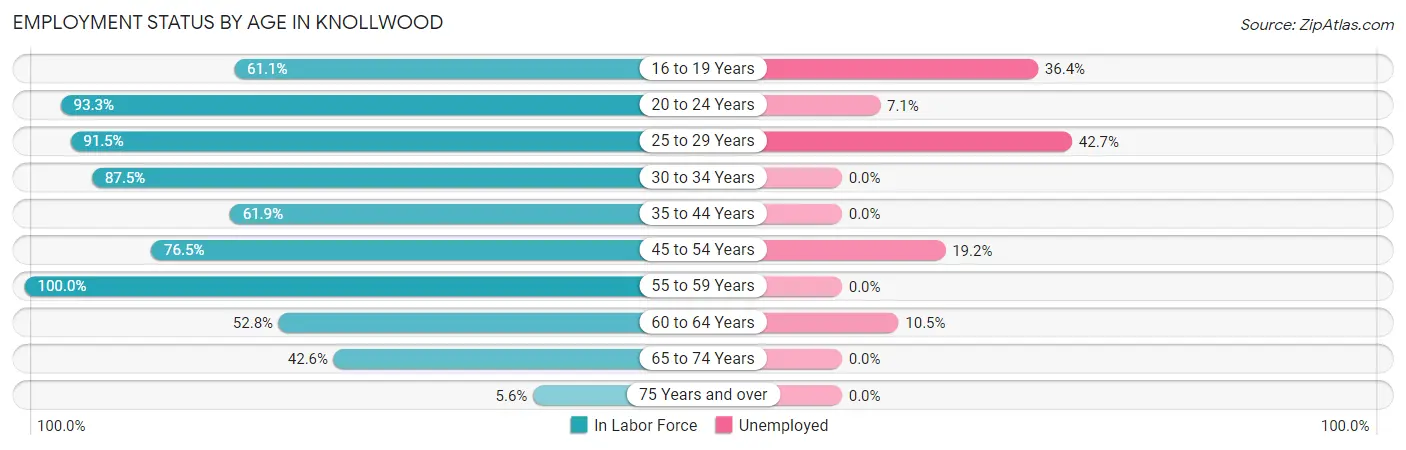
| Age Bracket | In Labor Force | Unemployed |
| 16 to 19 Years | 11 (61.1%) | 4 (36.4%) |
| 20 to 24 Years | 112 (93.3%) | 8 (7.1%) |
| 25 to 29 Years | 75 (91.5%) | 32 (42.7%) |
| 30 to 34 Years | 14 (87.5%) | 0 (0.0%) |
| 35 to 44 Years | 26 (61.9%) | 0 (0.0%) |
| 45 to 54 Years | 26 (76.5%) | 5 (19.2%) |
| 55 to 59 Years | 14 (100.0%) | 0 (0.0%) |
| 60 to 64 Years | 19 (52.8%) | 2 (10.5%) |
| 65 to 74 Years | 26 (42.6%) | 0 (0.0%) |
| 75 Years and over | 2 (5.6%) | 0 (0.0%) |
| Total | 325 (70.8%) | 51 (15.7%) |
Employment Status by Educational Attainment in Knollwood
According to labor force statistics for Knollwood, 77.7% of individuals (174) out of the total population between 25 and 64 years of age (224) are in the labor force, with 22.4% or 39 of them being unemployed. The group with the highest labor force participation rate are those with the educational attainment of college / associate degree, with 82.8% or 77 individuals in the labor force. Within the labor force, individuals with college / associate degree education have the highest percentage of unemployment, with 41.6% or 32 of them being unemployed.
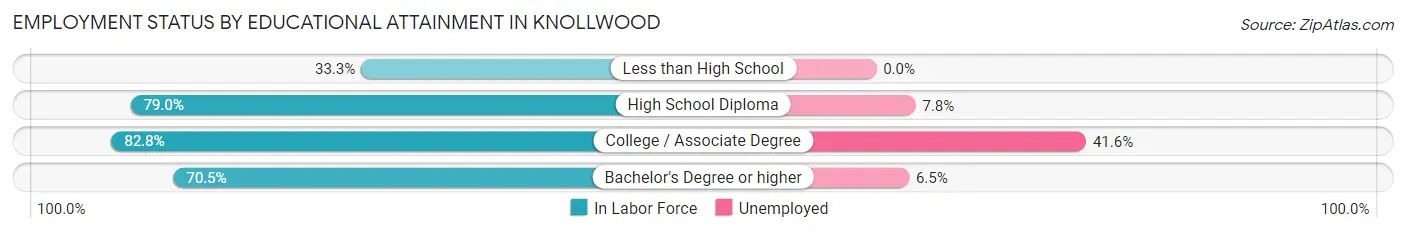
| Educational Attainment | In Labor Force | Unemployed |
| Less than High School | 2 (33.3%) | 0 (0.0%) |
| High School Diploma | 64 (79.0%) | 6 (7.8%) |
| College / Associate Degree | 77 (82.8%) | 39 (41.6%) |
| Bachelor's Degree or higher | 31 (70.5%) | 3 (6.5%) |
| Total | 174 (77.7%) | 50 (22.4%) |
Employment Occupations by Sex in Knollwood
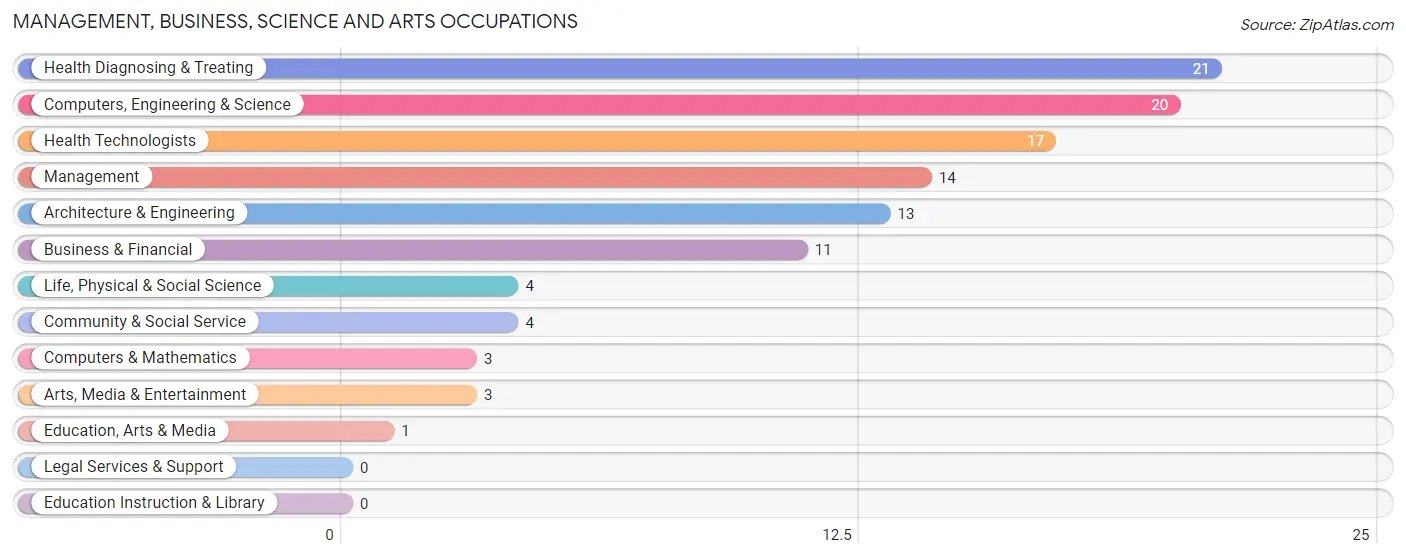
Management, Business, Science and Arts Occupations
The most common Management, Business, Science and Arts occupations in Knollwood are Health Diagnosing & Treating (21 | 7.7%), Computers, Engineering & Science (20 | 7.3%), Health Technologists (17 | 6.2%), Management (14 | 5.1%), and Architecture & Engineering (13 | 4.7%).
Management, Business, Science and Arts Occupations by Sex
Within the Management, Business, Science and Arts occupations in Knollwood, the most male-oriented occupations are Computers & Mathematics (100.0%), Architecture & Engineering (100.0%), and Arts, Media & Entertainment (100.0%), while the most female-oriented occupations are Life, Physical & Social Science (100.0%), Education, Arts & Media (100.0%), and Health Diagnosing & Treating (100.0%).
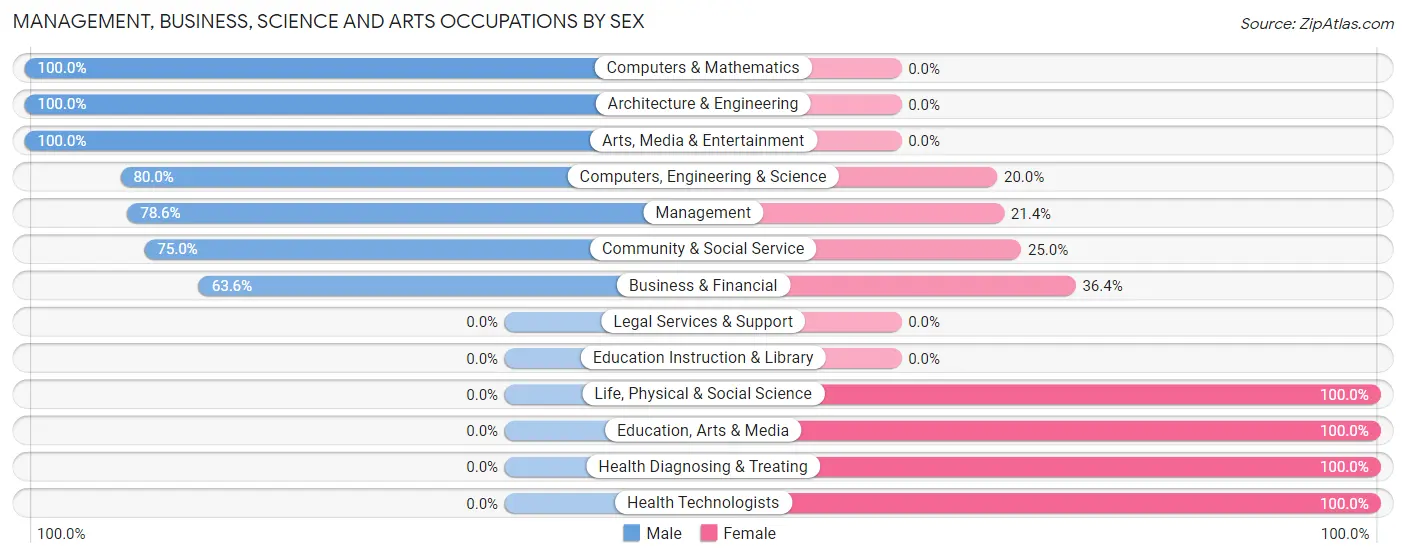
| Occupation | Male | Female |
| Management | 11 (78.6%) | 3 (21.4%) |
| Business & Financial | 7 (63.6%) | 4 (36.4%) |
| Computers, Engineering & Science | 16 (80.0%) | 4 (20.0%) |
| Computers & Mathematics | 3 (100.0%) | 0 (0.0%) |
| Architecture & Engineering | 13 (100.0%) | 0 (0.0%) |
| Life, Physical & Social Science | 0 (0.0%) | 4 (100.0%) |
| Community & Social Service | 3 (75.0%) | 1 (25.0%) |
| Education, Arts & Media | 0 (0.0%) | 1 (100.0%) |
| Legal Services & Support | 0 (0.0%) | 0 (0.0%) |
| Education Instruction & Library | 0 (0.0%) | 0 (0.0%) |
| Arts, Media & Entertainment | 3 (100.0%) | 0 (0.0%) |
| Health Diagnosing & Treating | 0 (0.0%) | 21 (100.0%) |
| Health Technologists | 0 (0.0%) | 17 (100.0%) |
| Total (Category) | 37 (52.9%) | 33 (47.1%) |
| Total (Overall) | 114 (41.6%) | 160 (58.4%) |
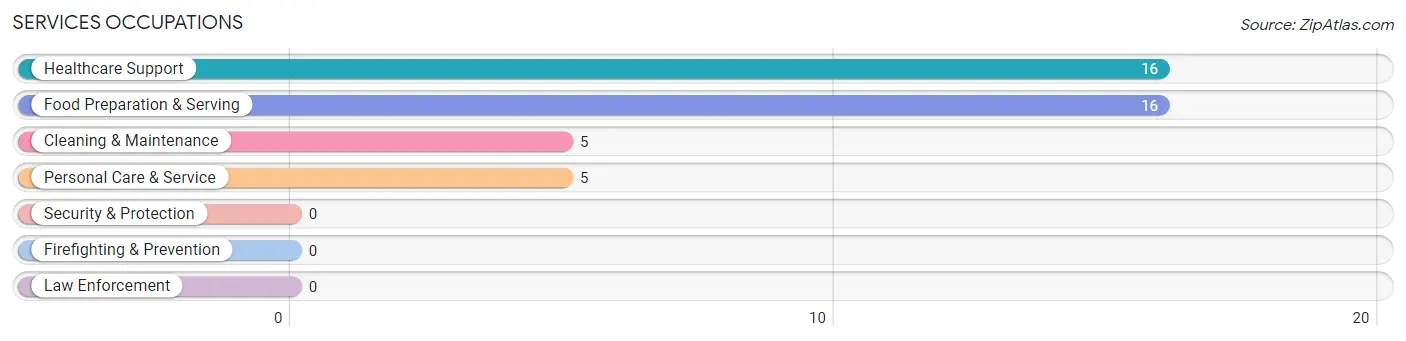
Services Occupations
The most common Services occupations in Knollwood are Healthcare Support (16 | 5.8%), Food Preparation & Serving (16 | 5.8%), Cleaning & Maintenance (5 | 1.8%), and Personal Care & Service (5 | 1.8%).
Services Occupations by Sex
Within the Services occupations in Knollwood, the most male-oriented occupations are Cleaning & Maintenance (100.0%), Food Preparation & Serving (62.5%), and Healthcare Support (25.0%), while the most female-oriented occupations are Personal Care & Service (100.0%), Healthcare Support (75.0%), and Food Preparation & Serving (37.5%).
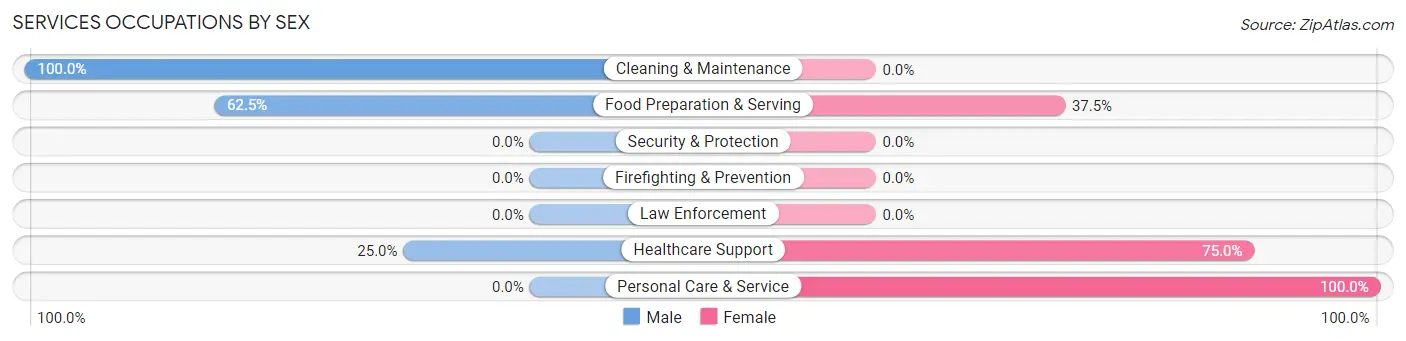
| Occupation | Male | Female |
| Healthcare Support | 4 (25.0%) | 12 (75.0%) |
| Security & Protection | 0 (0.0%) | 0 (0.0%) |
| Firefighting & Prevention | 0 (0.0%) | 0 (0.0%) |
| Law Enforcement | 0 (0.0%) | 0 (0.0%) |
| Food Preparation & Serving | 10 (62.5%) | 6 (37.5%) |
| Cleaning & Maintenance | 5 (100.0%) | 0 (0.0%) |
| Personal Care & Service | 0 (0.0%) | 5 (100.0%) |
| Total (Category) | 19 (45.2%) | 23 (54.8%) |
| Total (Overall) | 114 (41.6%) | 160 (58.4%) |
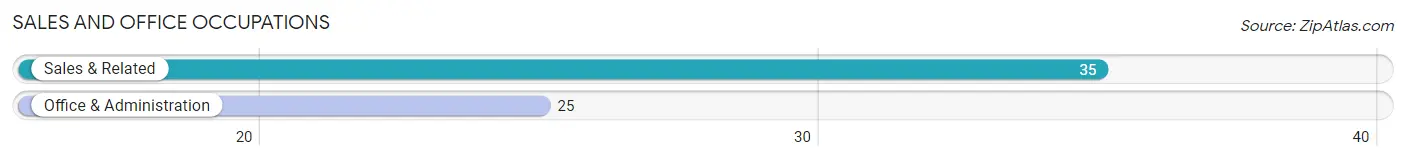
Sales and Office Occupations
The most common Sales and Office occupations in Knollwood are Sales & Related (35 | 12.8%), and Office & Administration (25 | 9.1%).
Sales and Office Occupations by Sex
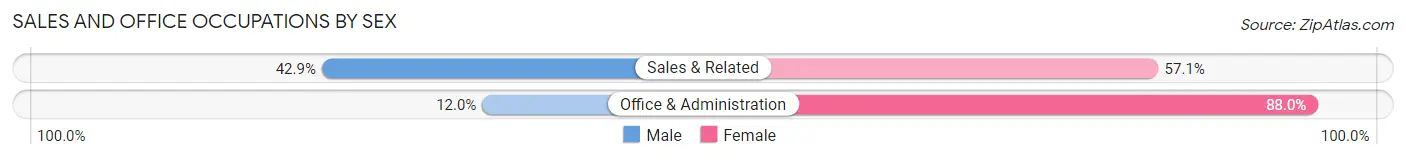
| Occupation | Male | Female |
| Sales & Related | 15 (42.9%) | 20 (57.1%) |
| Office & Administration | 3 (12.0%) | 22 (88.0%) |
| Total (Category) | 18 (30.0%) | 42 (70.0%) |
| Total (Overall) | 114 (41.6%) | 160 (58.4%) |
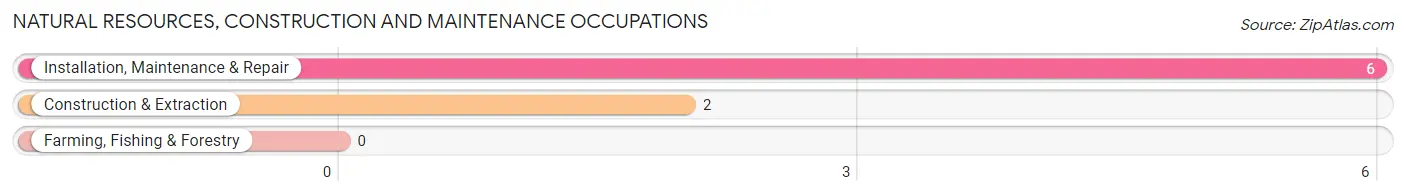
Natural Resources, Construction and Maintenance Occupations
The most common Natural Resources, Construction and Maintenance occupations in Knollwood are Installation, Maintenance & Repair (6 | 2.2%), and Construction & Extraction (2 | 0.7%).
Natural Resources, Construction and Maintenance Occupations by Sex
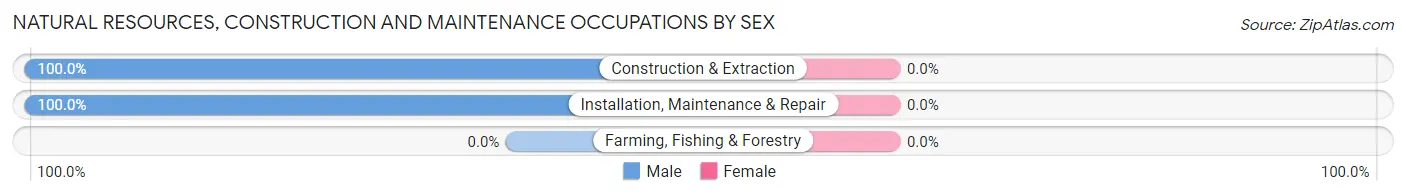
| Occupation | Male | Female |
| Farming, Fishing & Forestry | 0 (0.0%) | 0 (0.0%) |
| Construction & Extraction | 2 (100.0%) | 0 (0.0%) |
| Installation, Maintenance & Repair | 6 (100.0%) | 0 (0.0%) |
| Total (Category) | 8 (100.0%) | 0 (0.0%) |
| Total (Overall) | 114 (41.6%) | 160 (58.4%) |
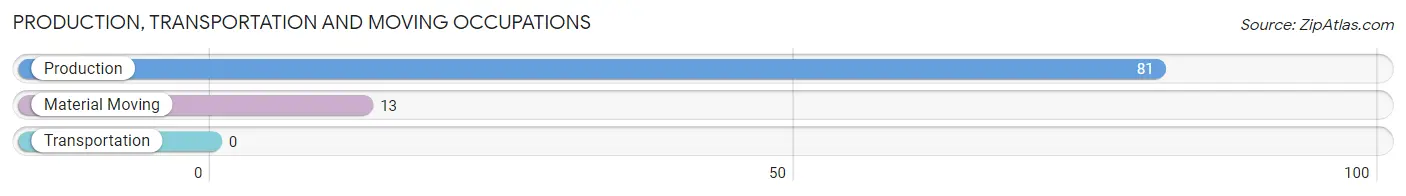
Production, Transportation and Moving Occupations
The most common Production, Transportation and Moving occupations in Knollwood are Production (81 | 29.6%), and Material Moving (13 | 4.7%).
Production, Transportation and Moving Occupations by Sex
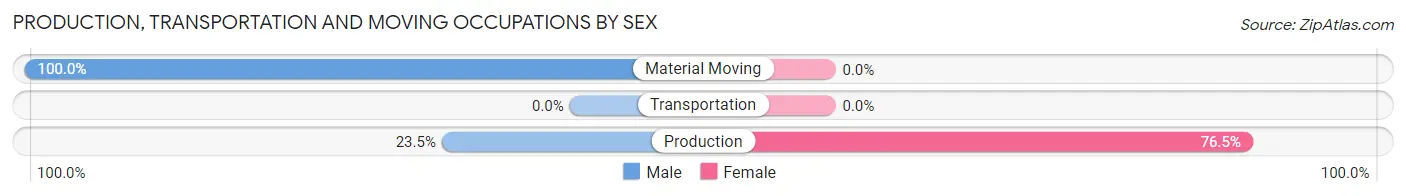
| Occupation | Male | Female |
| Production | 19 (23.5%) | 62 (76.5%) |
| Transportation | 0 (0.0%) | 0 (0.0%) |
| Material Moving | 13 (100.0%) | 0 (0.0%) |
| Total (Category) | 32 (34.0%) | 62 (66.0%) |
| Total (Overall) | 114 (41.6%) | 160 (58.4%) |
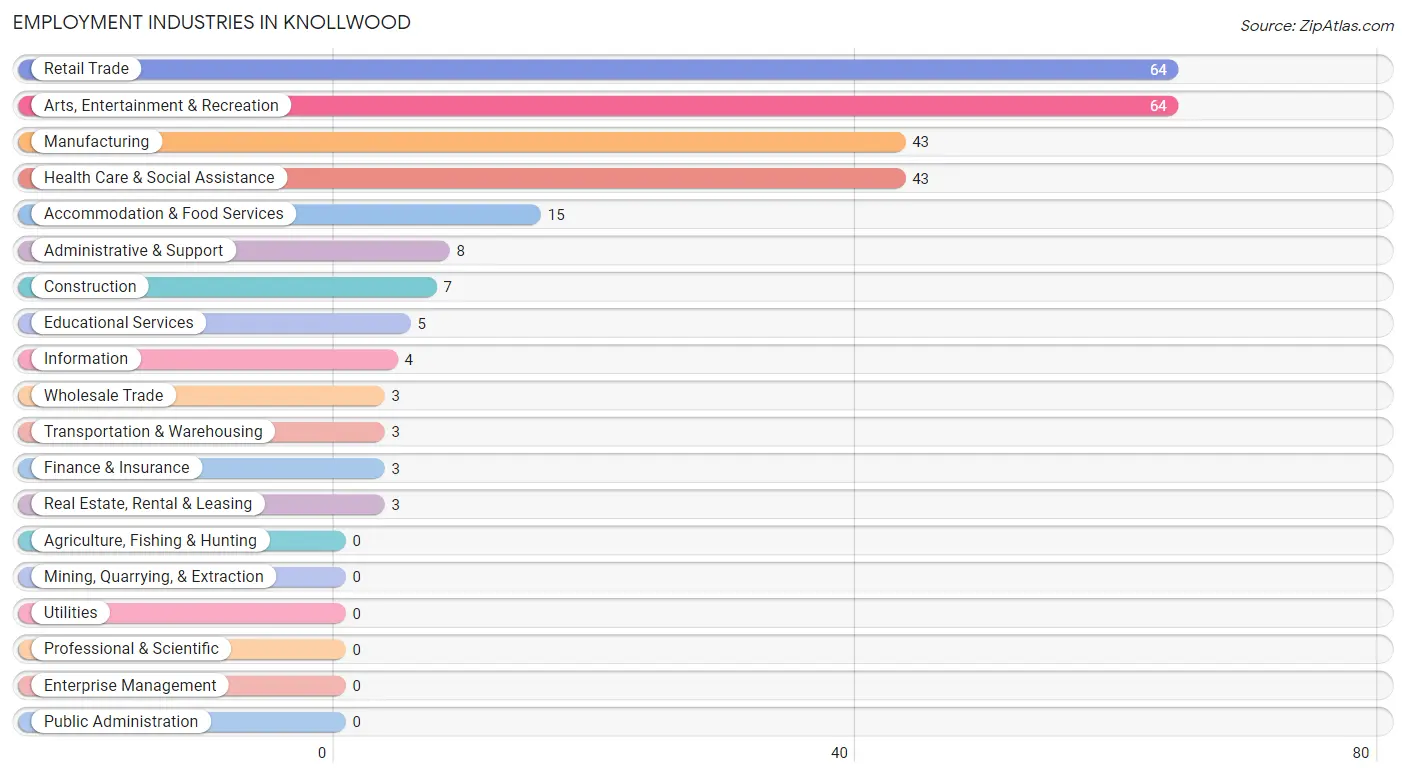
Employment Industries by Sex in Knollwood
Employment Industries in Knollwood
The major employment industries in Knollwood include Retail Trade (64 | 23.4%), Arts, Entertainment & Recreation (64 | 23.4%), Manufacturing (43 | 15.7%), Health Care & Social Assistance (43 | 15.7%), and Accommodation & Food Services (15 | 5.5%).
Employment Industries by Sex in Knollwood
The Knollwood industries that see more men than women are Construction (100.0%), Wholesale Trade (100.0%), and Transportation & Warehousing (100.0%), whereas the industries that tend to have a higher number of women are Information (100.0%), Finance & Insurance (100.0%), and Real Estate, Rental & Leasing (100.0%).
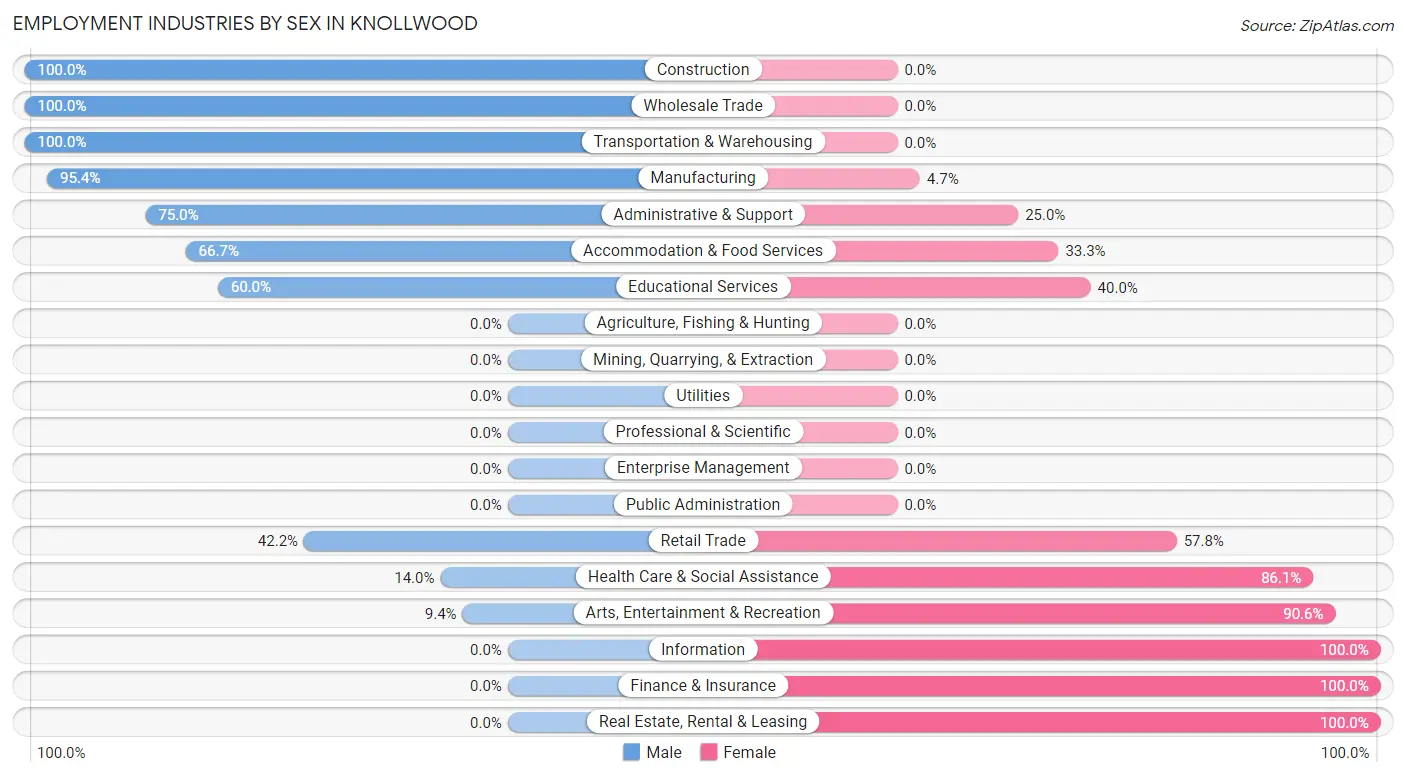
| Industry | Male | Female |
| Agriculture, Fishing & Hunting | 0 (0.0%) | 0 (0.0%) |
| Mining, Quarrying, & Extraction | 0 (0.0%) | 0 (0.0%) |
| Construction | 7 (100.0%) | 0 (0.0%) |
| Manufacturing | 41 (95.4%) | 2 (4.6%) |
| Wholesale Trade | 3 (100.0%) | 0 (0.0%) |
| Retail Trade | 27 (42.2%) | 37 (57.8%) |
| Transportation & Warehousing | 3 (100.0%) | 0 (0.0%) |
| Utilities | 0 (0.0%) | 0 (0.0%) |
| Information | 0 (0.0%) | 4 (100.0%) |
| Finance & Insurance | 0 (0.0%) | 3 (100.0%) |
| Real Estate, Rental & Leasing | 0 (0.0%) | 3 (100.0%) |
| Professional & Scientific | 0 (0.0%) | 0 (0.0%) |
| Enterprise Management | 0 (0.0%) | 0 (0.0%) |
| Administrative & Support | 6 (75.0%) | 2 (25.0%) |
| Educational Services | 3 (60.0%) | 2 (40.0%) |
| Health Care & Social Assistance | 6 (14.0%) | 37 (86.1%) |
| Arts, Entertainment & Recreation | 6 (9.4%) | 58 (90.6%) |
| Accommodation & Food Services | 10 (66.7%) | 5 (33.3%) |
| Public Administration | 0 (0.0%) | 0 (0.0%) |
| Total | 114 (41.6%) | 160 (58.4%) |
Education in Knollwood
School Enrollment in Knollwood
The most common levels of schooling among the 134 students in Knollwood are college / undergraduate (83 | 61.9%), graduate / professional (20 | 14.9%), and high school (16 | 11.9%).
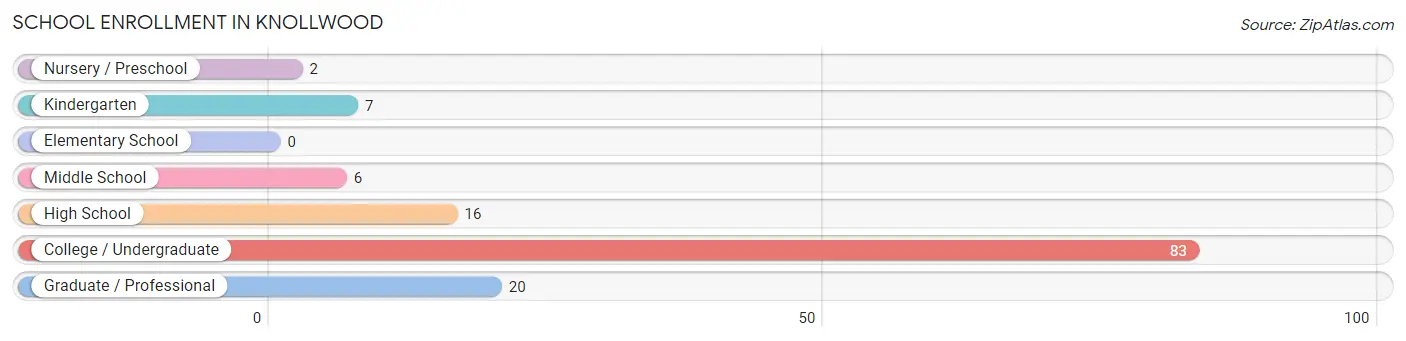
| School Level | # Students | % Students |
| Nursery / Preschool | 2 | 1.5% |
| Kindergarten | 7 | 5.2% |
| Elementary School | 0 | 0.0% |
| Middle School | 6 | 4.5% |
| High School | 16 | 11.9% |
| College / Undergraduate | 83 | 61.9% |
| Graduate / Professional | 20 | 14.9% |
| Total | 134 | 100.0% |
School Enrollment by Age by Funding Source in Knollwood
Out of a total of 134 students who are enrolled in schools in Knollwood, 4 (3.0%) attend a private institution, while the remaining 130 (97.0%) are enrolled in public schools. The age group of 35 years and over has the highest likelihood of being enrolled in private schools, with 2 (50.0% in the age bracket) enrolled. Conversely, the age group of 3 to 4 year olds has the lowest likelihood of being enrolled in a private school, with 5 (100.0% in the age bracket) attending a public institution.
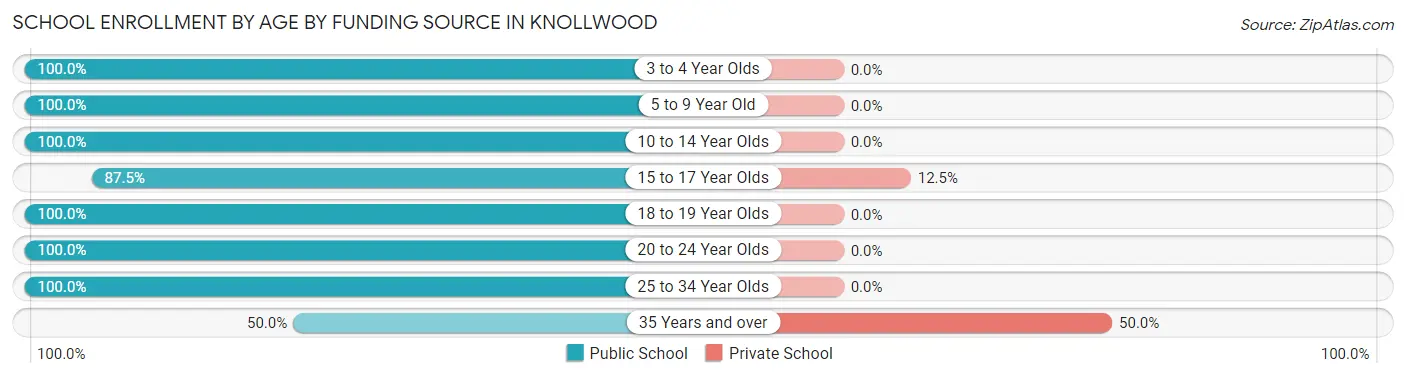
| Age Bracket | Public School | Private School |
| 3 to 4 Year Olds | 5 (100.0%) | 0 (0.0%) |
| 5 to 9 Year Old | 4 (100.0%) | 0 (0.0%) |
| 10 to 14 Year Olds | 6 (100.0%) | 0 (0.0%) |
| 15 to 17 Year Olds | 14 (87.5%) | 2 (12.5%) |
| 18 to 19 Year Olds | 5 (100.0%) | 0 (0.0%) |
| 20 to 24 Year Olds | 79 (100.0%) | 0 (0.0%) |
| 25 to 34 Year Olds | 15 (100.0%) | 0 (0.0%) |
| 35 Years and over | 2 (50.0%) | 2 (50.0%) |
| Total | 130 (97.0%) | 4 (3.0%) |
Educational Attainment by Field of Study in Knollwood
Business (25 | 35.2%), education (11 | 15.5%), bio, nature & agricultural (10 | 14.1%), arts & humanities (6 | 8.5%), and physical & health sciences (5 | 7.0%) are the most common fields of study among 71 individuals in Knollwood who have obtained a bachelor's degree or higher.
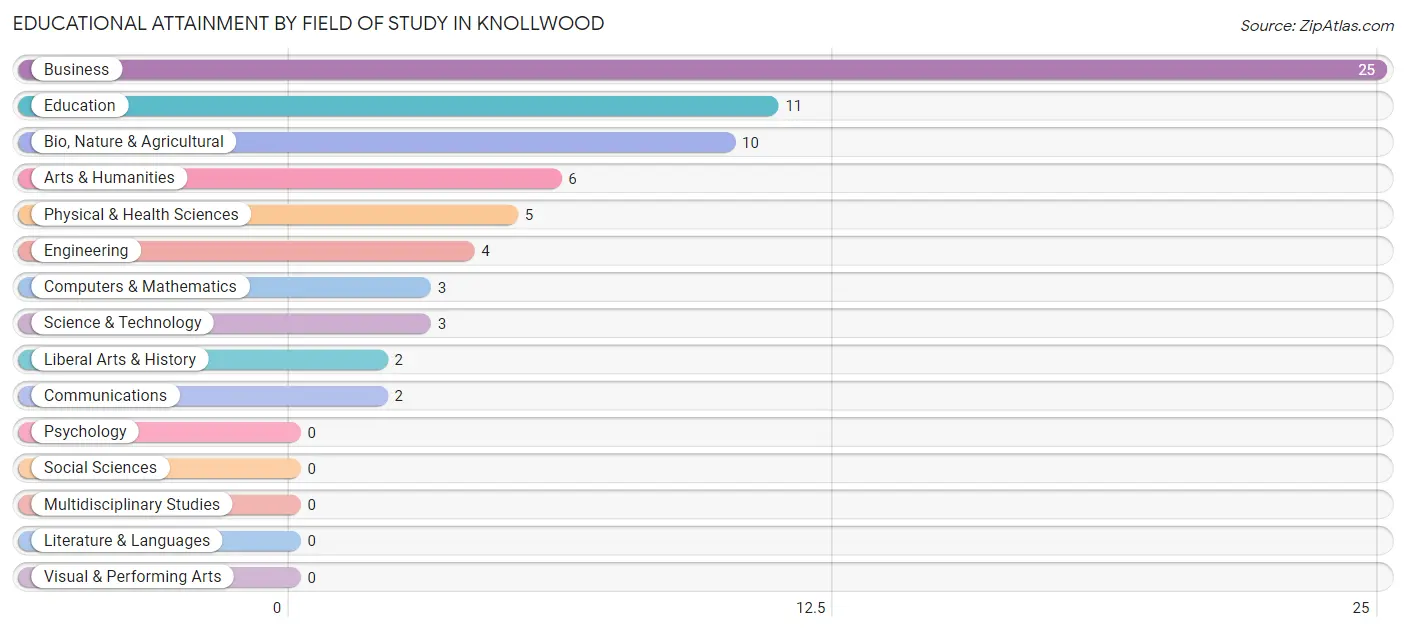
| Field of Study | # Graduates | % Graduates |
| Computers & Mathematics | 3 | 4.2% |
| Bio, Nature & Agricultural | 10 | 14.1% |
| Physical & Health Sciences | 5 | 7.0% |
| Psychology | 0 | 0.0% |
| Social Sciences | 0 | 0.0% |
| Engineering | 4 | 5.6% |
| Multidisciplinary Studies | 0 | 0.0% |
| Science & Technology | 3 | 4.2% |
| Business | 25 | 35.2% |
| Education | 11 | 15.5% |
| Literature & Languages | 0 | 0.0% |
| Liberal Arts & History | 2 | 2.8% |
| Visual & Performing Arts | 0 | 0.0% |
| Communications | 2 | 2.8% |
| Arts & Humanities | 6 | 8.5% |
| Total | 71 | 100.0% |
Transportation & Commute in Knollwood
Vehicle Availability by Sex in Knollwood
The most prevalent vehicle ownership categories in Knollwood are males with 2 vehicles (46, accounting for 41.4%) and females with 2 vehicles (48, making up 28.7%).
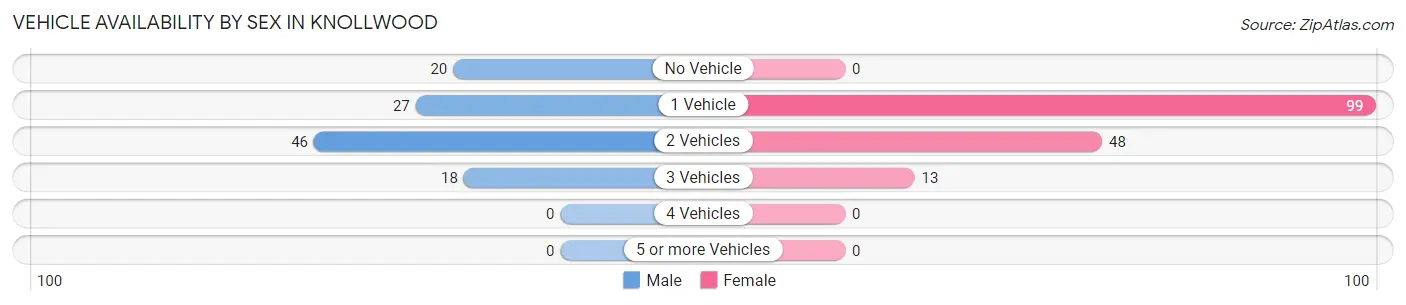
| Vehicles Available | Male | Female |
| No Vehicle | 20 (18.0%) | 0 (0.0%) |
| 1 Vehicle | 27 (24.3%) | 99 (61.9%) |
| 2 Vehicles | 46 (41.4%) | 48 (30.0%) |
| 3 Vehicles | 18 (16.2%) | 13 (8.1%) |
| 4 Vehicles | 0 (0.0%) | 0 (0.0%) |
| 5 or more Vehicles | 0 (0.0%) | 0 (0.0%) |
| Total | 111 (100.0%) | 160 (100.0%) |
Commute Time in Knollwood
The most frequently occuring commute durations in Knollwood are 90 or more minutes (66 commuters, 26.1%), 15 to 19 minutes (54 commuters, 21.3%), and 10 to 14 minutes (51 commuters, 20.2%).
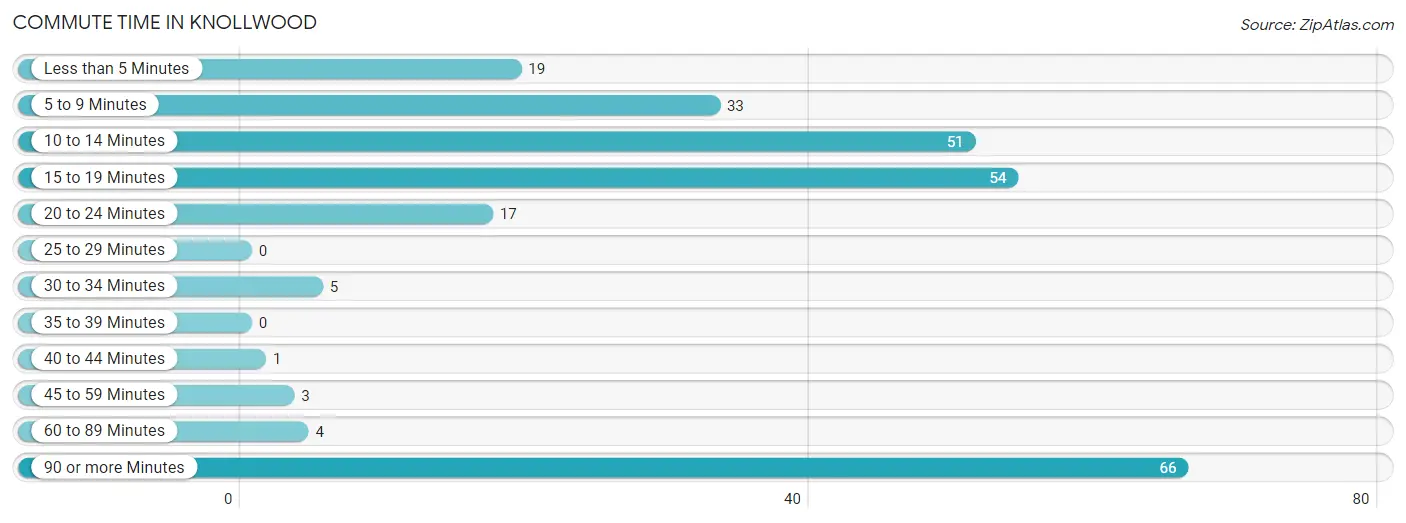
| Commute Time | # Commuters | % Commuters |
| Less than 5 Minutes | 19 | 7.5% |
| 5 to 9 Minutes | 33 | 13.0% |
| 10 to 14 Minutes | 51 | 20.2% |
| 15 to 19 Minutes | 54 | 21.3% |
| 20 to 24 Minutes | 17 | 6.7% |
| 25 to 29 Minutes | 0 | 0.0% |
| 30 to 34 Minutes | 5 | 2.0% |
| 35 to 39 Minutes | 0 | 0.0% |
| 40 to 44 Minutes | 1 | 0.4% |
| 45 to 59 Minutes | 3 | 1.2% |
| 60 to 89 Minutes | 4 | 1.6% |
| 90 or more Minutes | 66 | 26.1% |
Commute Time by Sex in Knollwood
The most common commute times in Knollwood are 15 to 19 minutes (42 commuters, 40.4%) for males and 90 or more minutes (58 commuters, 38.9%) for females.
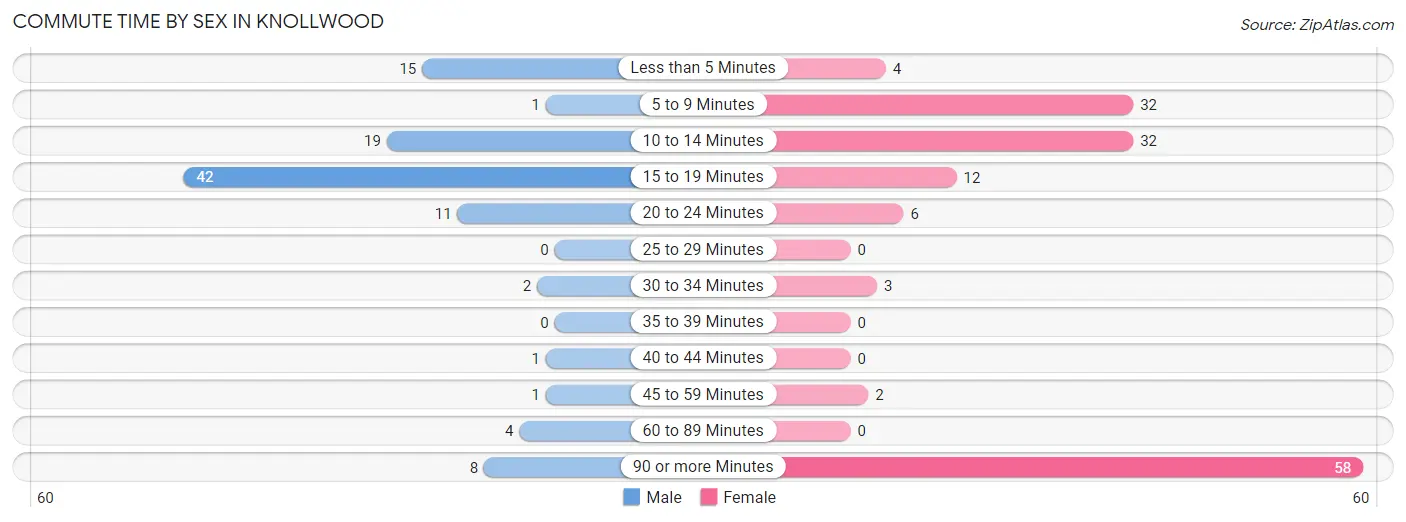
| Commute Time | Male | Female |
| Less than 5 Minutes | 15 (14.4%) | 4 (2.7%) |
| 5 to 9 Minutes | 1 (1.0%) | 32 (21.5%) |
| 10 to 14 Minutes | 19 (18.3%) | 32 (21.5%) |
| 15 to 19 Minutes | 42 (40.4%) | 12 (8.1%) |
| 20 to 24 Minutes | 11 (10.6%) | 6 (4.0%) |
| 25 to 29 Minutes | 0 (0.0%) | 0 (0.0%) |
| 30 to 34 Minutes | 2 (1.9%) | 3 (2.0%) |
| 35 to 39 Minutes | 0 (0.0%) | 0 (0.0%) |
| 40 to 44 Minutes | 1 (1.0%) | 0 (0.0%) |
| 45 to 59 Minutes | 1 (1.0%) | 2 (1.3%) |
| 60 to 89 Minutes | 4 (3.8%) | 0 (0.0%) |
| 90 or more Minutes | 8 (7.7%) | 58 (38.9%) |
Time of Departure to Work by Sex in Knollwood
The most frequent times of departure to work in Knollwood are 4:00 PM to 11:59 PM (17, 16.4%) for males and 6:30 AM to 6:59 AM (64, 42.9%) for females.
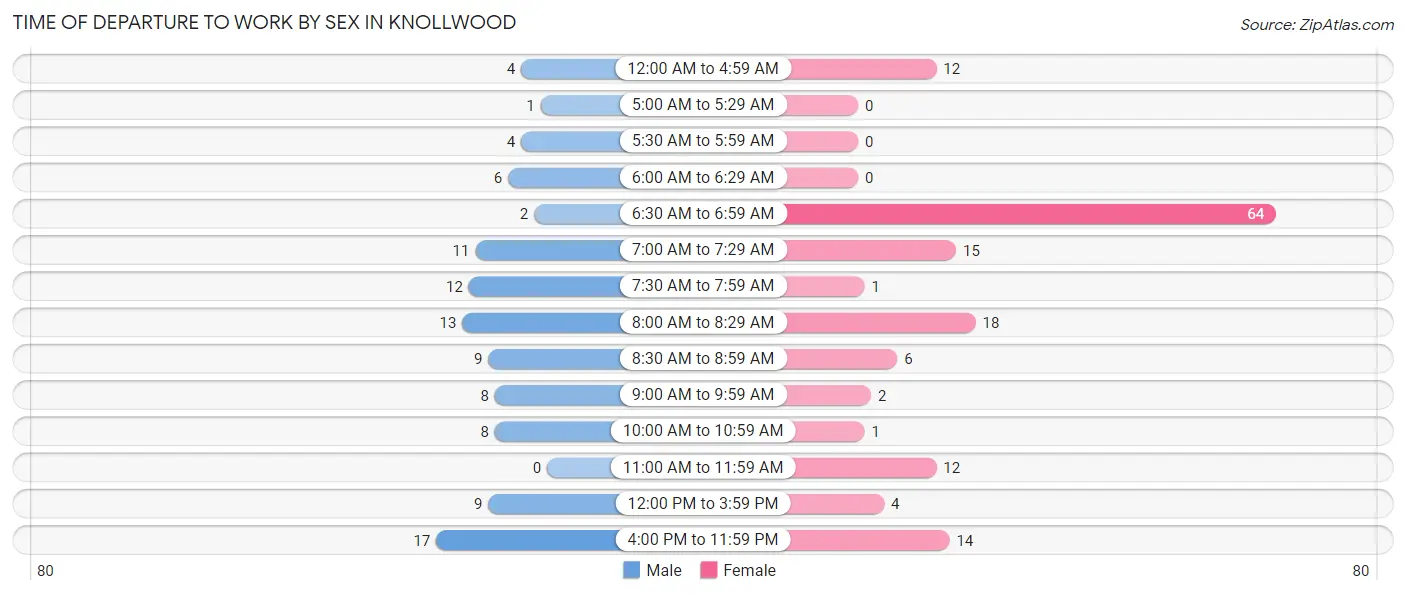
| Time of Departure | Male | Female |
| 12:00 AM to 4:59 AM | 4 (3.8%) | 12 (8.1%) |
| 5:00 AM to 5:29 AM | 1 (1.0%) | 0 (0.0%) |
| 5:30 AM to 5:59 AM | 4 (3.8%) | 0 (0.0%) |
| 6:00 AM to 6:29 AM | 6 (5.8%) | 0 (0.0%) |
| 6:30 AM to 6:59 AM | 2 (1.9%) | 64 (42.9%) |
| 7:00 AM to 7:29 AM | 11 (10.6%) | 15 (10.1%) |
| 7:30 AM to 7:59 AM | 12 (11.5%) | 1 (0.7%) |
| 8:00 AM to 8:29 AM | 13 (12.5%) | 18 (12.1%) |
| 8:30 AM to 8:59 AM | 9 (8.6%) | 6 (4.0%) |
| 9:00 AM to 9:59 AM | 8 (7.7%) | 2 (1.3%) |
| 10:00 AM to 10:59 AM | 8 (7.7%) | 1 (0.7%) |
| 11:00 AM to 11:59 AM | 0 (0.0%) | 12 (8.1%) |
| 12:00 PM to 3:59 PM | 9 (8.6%) | 4 (2.7%) |
| 4:00 PM to 11:59 PM | 17 (16.4%) | 14 (9.4%) |
| Total | 104 (100.0%) | 149 (100.0%) |
Housing Occupancy in Knollwood
Occupancy by Ownership in Knollwood
Of the total 318 dwellings in Knollwood, owner-occupied units account for 102 (32.1%), while renter-occupied units make up 216 (67.9%).
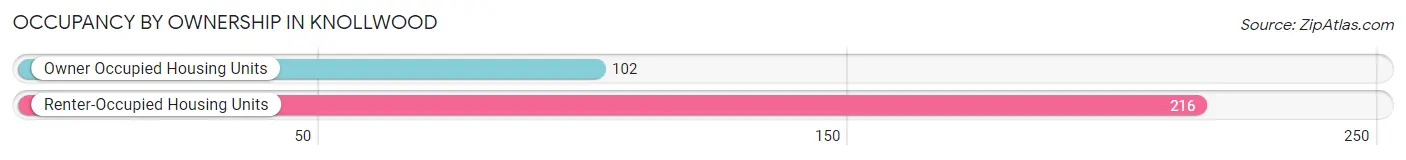
| Occupancy | # Housing Units | % Housing Units |
| Owner Occupied Housing Units | 102 | 32.1% |
| Renter-Occupied Housing Units | 216 | 67.9% |
| Total Occupied Housing Units | 318 | 100.0% |
Occupancy by Household Size in Knollwood
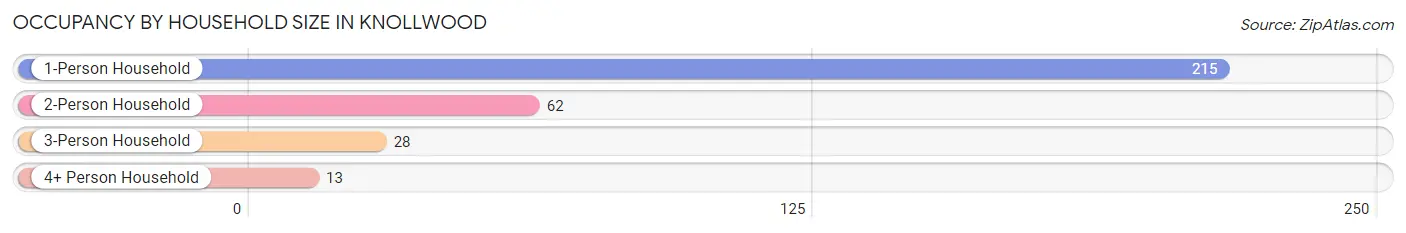
| Household Size | # Housing Units | % Housing Units |
| 1-Person Household | 215 | 67.6% |
| 2-Person Household | 62 | 19.5% |
| 3-Person Household | 28 | 8.8% |
| 4+ Person Household | 13 | 4.1% |
| Total Housing Units | 318 | 100.0% |
Occupancy by Ownership by Household Size in Knollwood
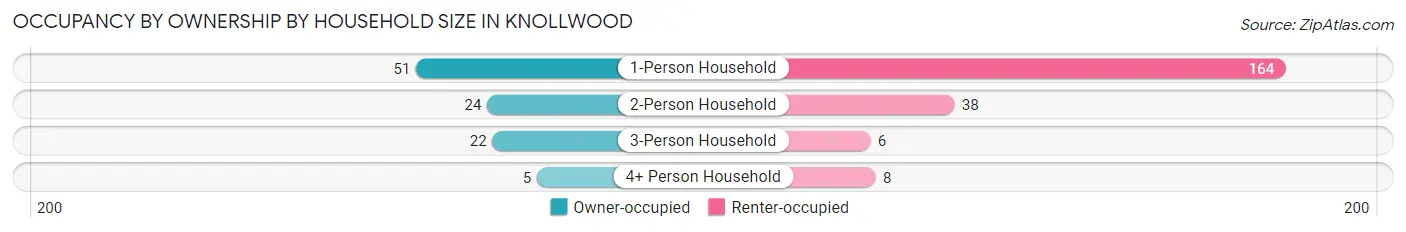
| Household Size | Owner-occupied | Renter-occupied |
| 1-Person Household | 51 (23.7%) | 164 (76.3%) |
| 2-Person Household | 24 (38.7%) | 38 (61.3%) |
| 3-Person Household | 22 (78.6%) | 6 (21.4%) |
| 4+ Person Household | 5 (38.5%) | 8 (61.5%) |
| Total Housing Units | 102 (32.1%) | 216 (67.9%) |
Occupancy by Educational Attainment in Knollwood
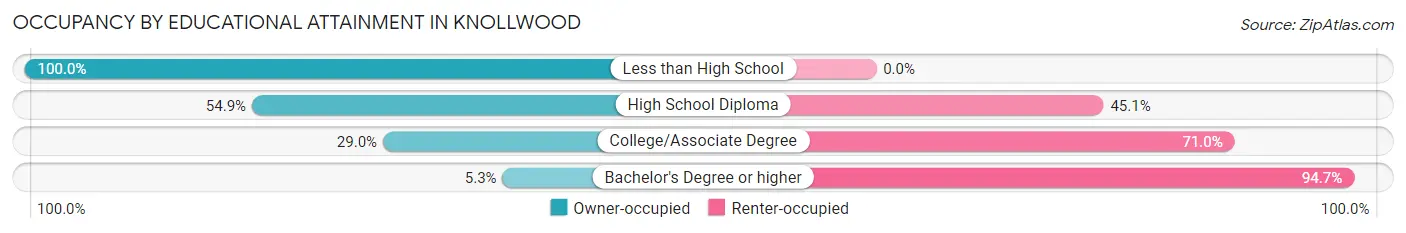
| Household Size | Owner-occupied | Renter-occupied |
| Less than High School | 7 (100.0%) | 0 (0.0%) |
| High School Diploma | 39 (54.9%) | 32 (45.1%) |
| College/Associate Degree | 53 (29.0%) | 130 (71.0%) |
| Bachelor's Degree or higher | 3 (5.3%) | 54 (94.7%) |
Occupancy by Age of Householder in Knollwood
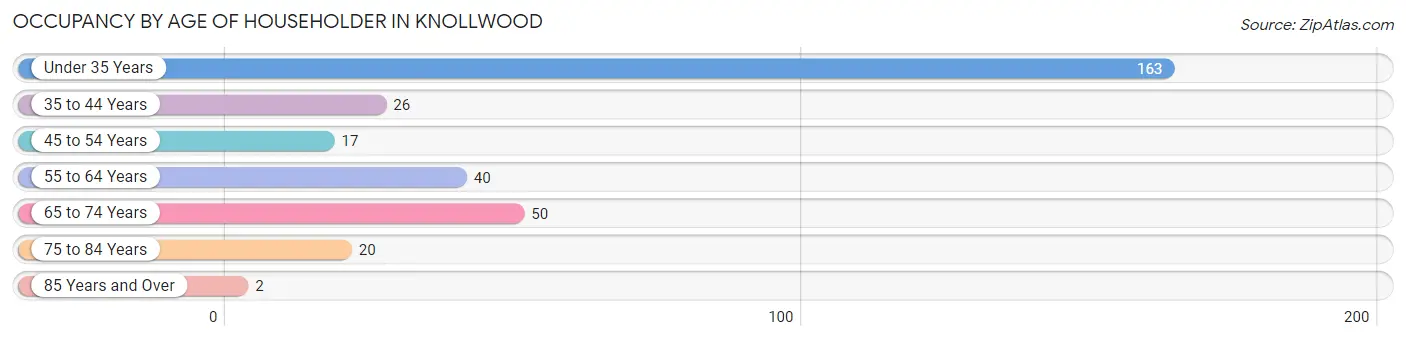
| Age Bracket | # Households | % Households |
| Under 35 Years | 163 | 51.3% |
| 35 to 44 Years | 26 | 8.2% |
| 45 to 54 Years | 17 | 5.3% |
| 55 to 64 Years | 40 | 12.6% |
| 65 to 74 Years | 50 | 15.7% |
| 75 to 84 Years | 20 | 6.3% |
| 85 Years and Over | 2 | 0.6% |
| Total | 318 | 100.0% |
Housing Finances in Knollwood
Median Income by Occupancy in Knollwood
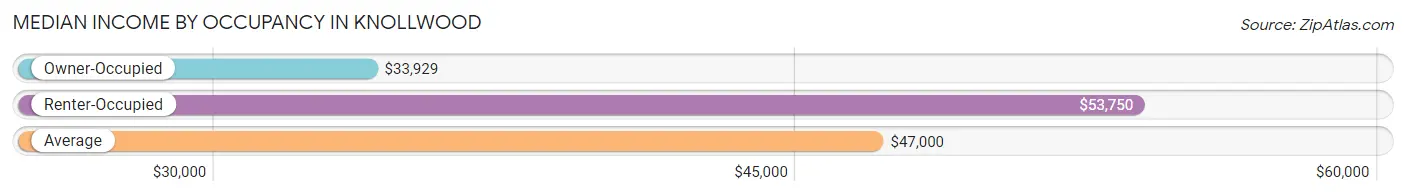
| Occupancy Type | # Households | Median Income |
| Owner-Occupied | 102 (32.1%) | $33,929 |
| Renter-Occupied | 216 (67.9%) | $53,750 |
| Average | 318 (100.0%) | $47,000 |
Occupancy by Householder Income Bracket in Knollwood
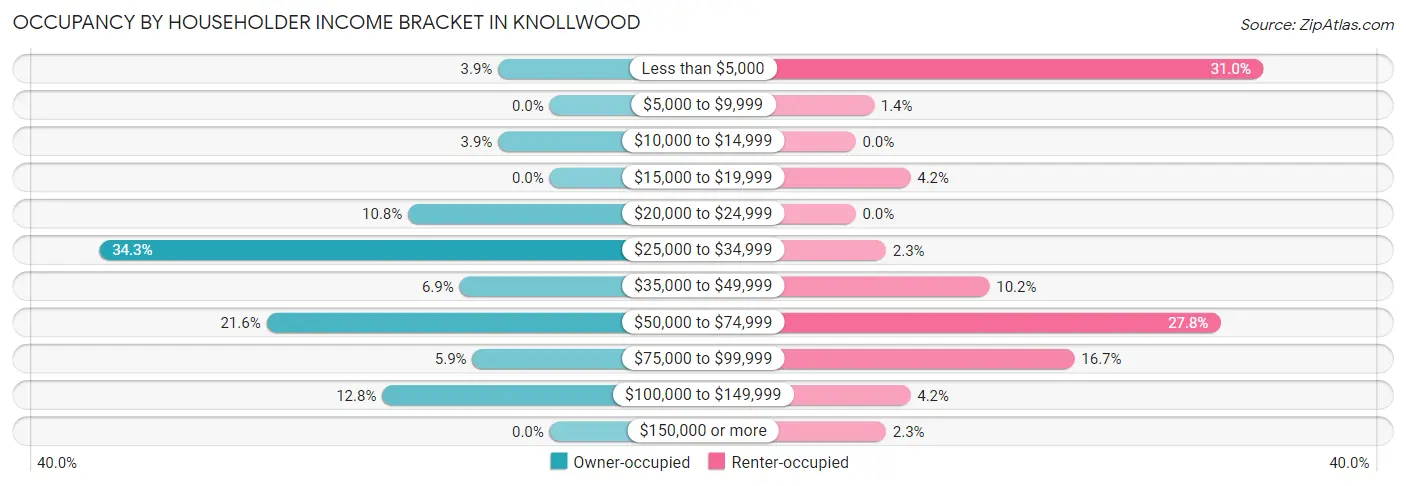
| Income Bracket | Owner-occupied | Renter-occupied |
| Less than $5,000 | 4 (3.9%) | 67 (31.0%) |
| $5,000 to $9,999 | 0 (0.0%) | 3 (1.4%) |
| $10,000 to $14,999 | 4 (3.9%) | 0 (0.0%) |
| $15,000 to $19,999 | 0 (0.0%) | 9 (4.2%) |
| $20,000 to $24,999 | 11 (10.8%) | 0 (0.0%) |
| $25,000 to $34,999 | 35 (34.3%) | 5 (2.3%) |
| $35,000 to $49,999 | 7 (6.9%) | 22 (10.2%) |
| $50,000 to $74,999 | 22 (21.6%) | 60 (27.8%) |
| $75,000 to $99,999 | 6 (5.9%) | 36 (16.7%) |
| $100,000 to $149,999 | 13 (12.8%) | 9 (4.2%) |
| $150,000 or more | 0 (0.0%) | 5 (2.3%) |
| Total | 102 (100.0%) | 216 (100.0%) |
Monthly Housing Cost Tiers in Knollwood
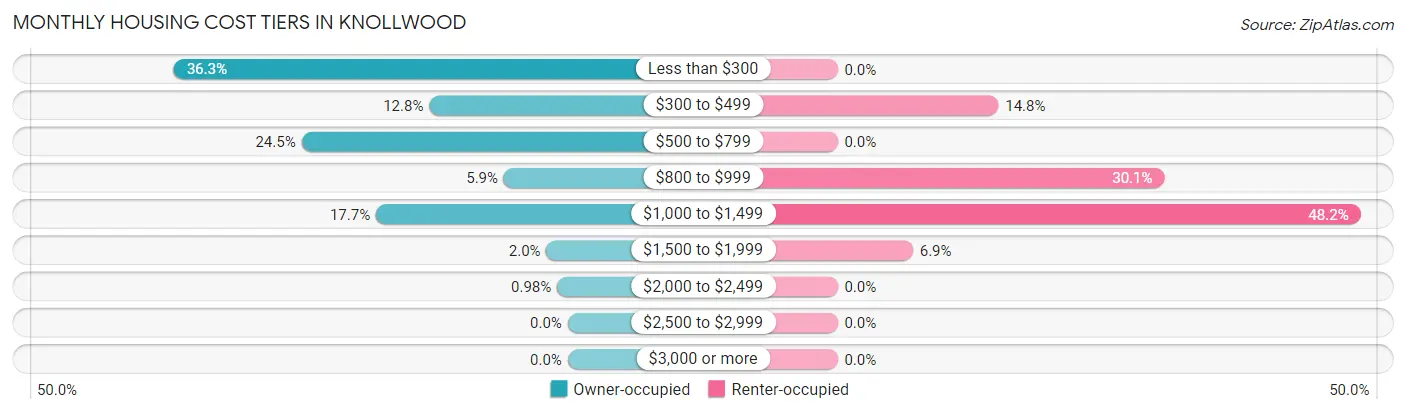
| Monthly Cost | Owner-occupied | Renter-occupied |
| Less than $300 | 37 (36.3%) | 0 (0.0%) |
| $300 to $499 | 13 (12.8%) | 32 (14.8%) |
| $500 to $799 | 25 (24.5%) | 0 (0.0%) |
| $800 to $999 | 6 (5.9%) | 65 (30.1%) |
| $1,000 to $1,499 | 18 (17.6%) | 104 (48.1%) |
| $1,500 to $1,999 | 2 (2.0%) | 15 (6.9%) |
| $2,000 to $2,499 | 1 (1.0%) | 0 (0.0%) |
| $2,500 to $2,999 | 0 (0.0%) | 0 (0.0%) |
| $3,000 or more | 0 (0.0%) | 0 (0.0%) |
| Total | 102 (100.0%) | 216 (100.0%) |
Physical Housing Characteristics in Knollwood
Housing Structures in Knollwood
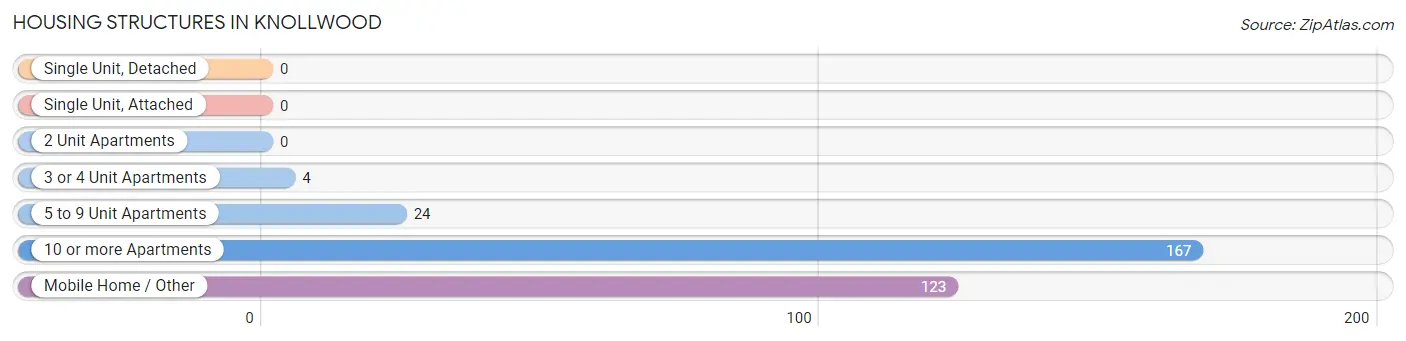
| Structure Type | # Housing Units | % Housing Units |
| Single Unit, Detached | 0 | 0.0% |
| Single Unit, Attached | 0 | 0.0% |
| 2 Unit Apartments | 0 | 0.0% |
| 3 or 4 Unit Apartments | 4 | 1.3% |
| 5 to 9 Unit Apartments | 24 | 7.5% |
| 10 or more Apartments | 167 | 52.5% |
| Mobile Home / Other | 123 | 38.7% |
| Total | 318 | 100.0% |
Housing Structures by Occupancy in Knollwood
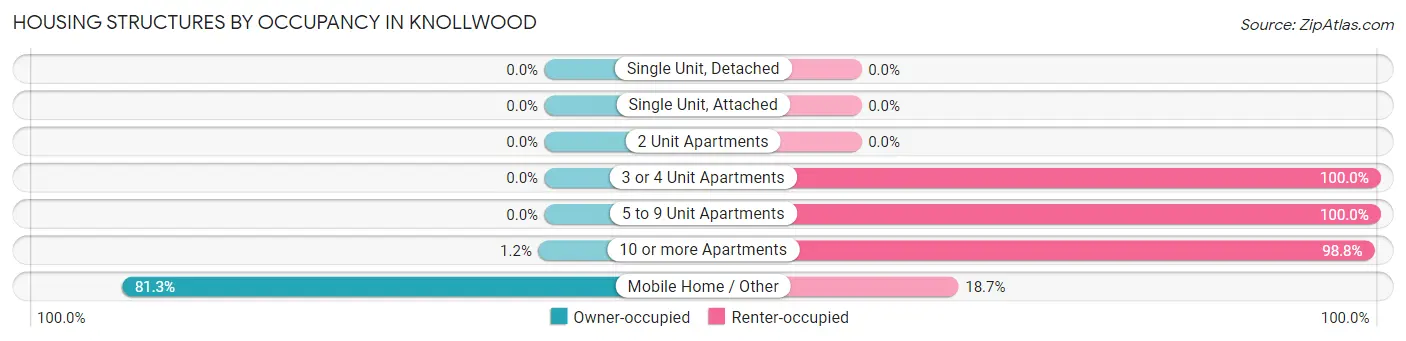
| Structure Type | Owner-occupied | Renter-occupied |
| Single Unit, Detached | 0 (0.0%) | 0 (0.0%) |
| Single Unit, Attached | 0 (0.0%) | 0 (0.0%) |
| 2 Unit Apartments | 0 (0.0%) | 0 (0.0%) |
| 3 or 4 Unit Apartments | 0 (0.0%) | 4 (100.0%) |
| 5 to 9 Unit Apartments | 0 (0.0%) | 24 (100.0%) |
| 10 or more Apartments | 2 (1.2%) | 165 (98.8%) |
| Mobile Home / Other | 100 (81.3%) | 23 (18.7%) |
| Total | 102 (32.1%) | 216 (67.9%) |
Housing Structures by Number of Rooms in Knollwood
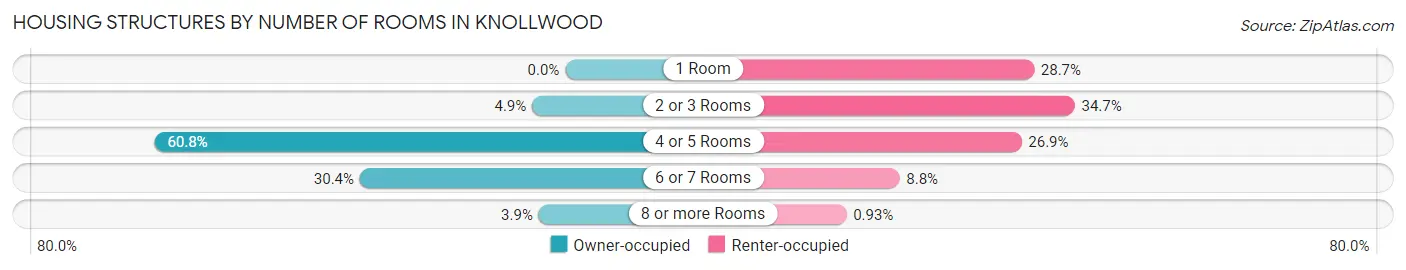
| Number of Rooms | Owner-occupied | Renter-occupied |
| 1 Room | 0 (0.0%) | 62 (28.7%) |
| 2 or 3 Rooms | 5 (4.9%) | 75 (34.7%) |
| 4 or 5 Rooms | 62 (60.8%) | 58 (26.9%) |
| 6 or 7 Rooms | 31 (30.4%) | 19 (8.8%) |
| 8 or more Rooms | 4 (3.9%) | 2 (0.9%) |
| Total | 102 (100.0%) | 216 (100.0%) |
Housing Structure by Heating Type in Knollwood
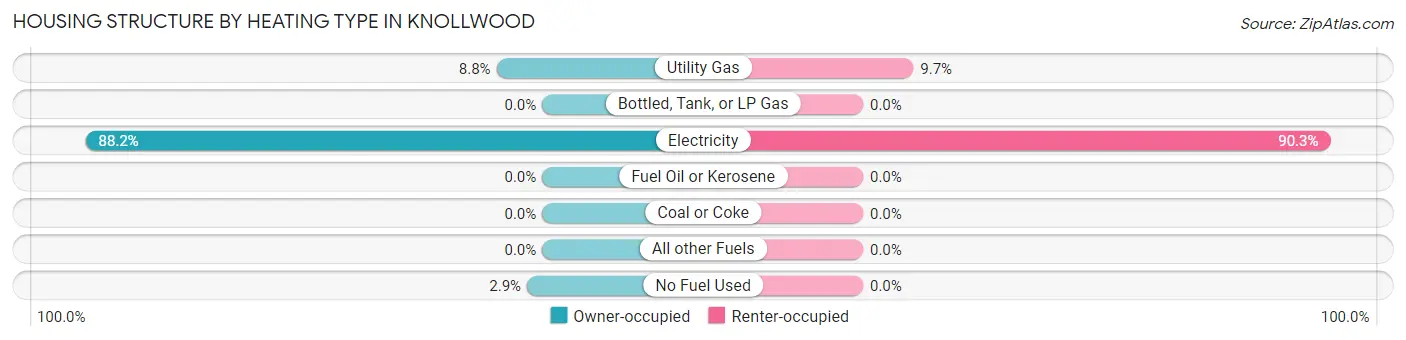
| Heating Type | Owner-occupied | Renter-occupied |
| Utility Gas | 9 (8.8%) | 21 (9.7%) |
| Bottled, Tank, or LP Gas | 0 (0.0%) | 0 (0.0%) |
| Electricity | 90 (88.2%) | 195 (90.3%) |
| Fuel Oil or Kerosene | 0 (0.0%) | 0 (0.0%) |
| Coal or Coke | 0 (0.0%) | 0 (0.0%) |
| All other Fuels | 0 (0.0%) | 0 (0.0%) |
| No Fuel Used | 3 (2.9%) | 0 (0.0%) |
| Total | 102 (100.0%) | 216 (100.0%) |
Household Vehicle Usage in Knollwood
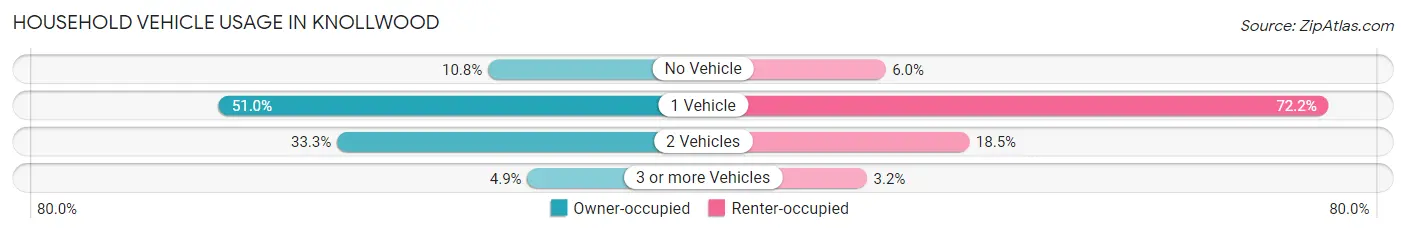
| Vehicles per Household | Owner-occupied | Renter-occupied |
| No Vehicle | 11 (10.8%) | 13 (6.0%) |
| 1 Vehicle | 52 (51.0%) | 156 (72.2%) |
| 2 Vehicles | 34 (33.3%) | 40 (18.5%) |
| 3 or more Vehicles | 5 (4.9%) | 7 (3.2%) |
| Total | 102 (100.0%) | 216 (100.0%) |
Real Estate & Mortgages in Knollwood
Real Estate and Mortgage Overview in Knollwood
| Characteristic | Without Mortgage | With Mortgage |
| Housing Units | 66 | 36 |
| Median Property Value | $17,700 | $85,400 |
| Median Household Income | $34,375 | $0 |
| Monthly Housing Costs | $283 | $0 |
| Real Estate Taxes | $199 | $2 |
Property Value by Mortgage Status in Knollwood
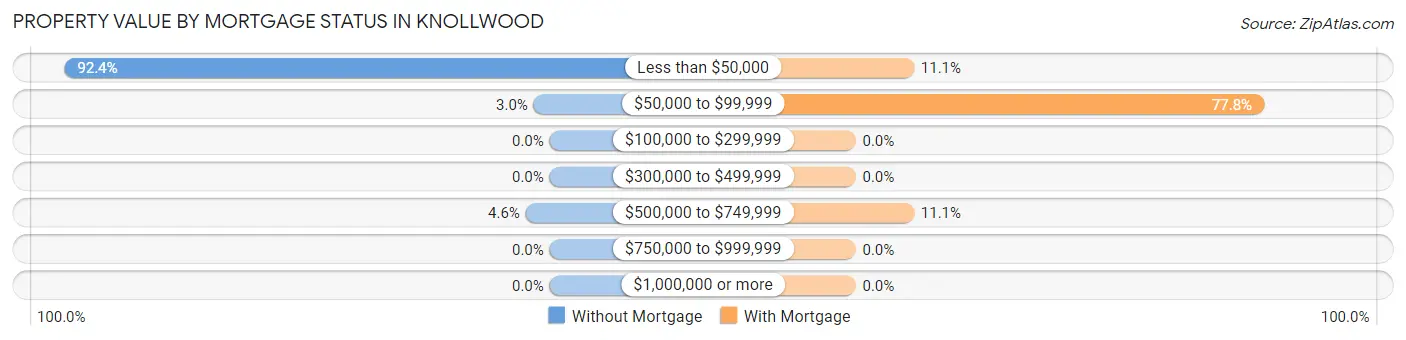
| Property Value | Without Mortgage | With Mortgage |
| Less than $50,000 | 61 (92.4%) | 4 (11.1%) |
| $50,000 to $99,999 | 2 (3.0%) | 28 (77.8%) |
| $100,000 to $299,999 | 0 (0.0%) | 0 (0.0%) |
| $300,000 to $499,999 | 0 (0.0%) | 0 (0.0%) |
| $500,000 to $749,999 | 3 (4.5%) | 4 (11.1%) |
| $750,000 to $999,999 | 0 (0.0%) | 0 (0.0%) |
| $1,000,000 or more | 0 (0.0%) | 0 (0.0%) |
| Total | 66 (100.0%) | 36 (100.0%) |
Household Income by Mortgage Status in Knollwood
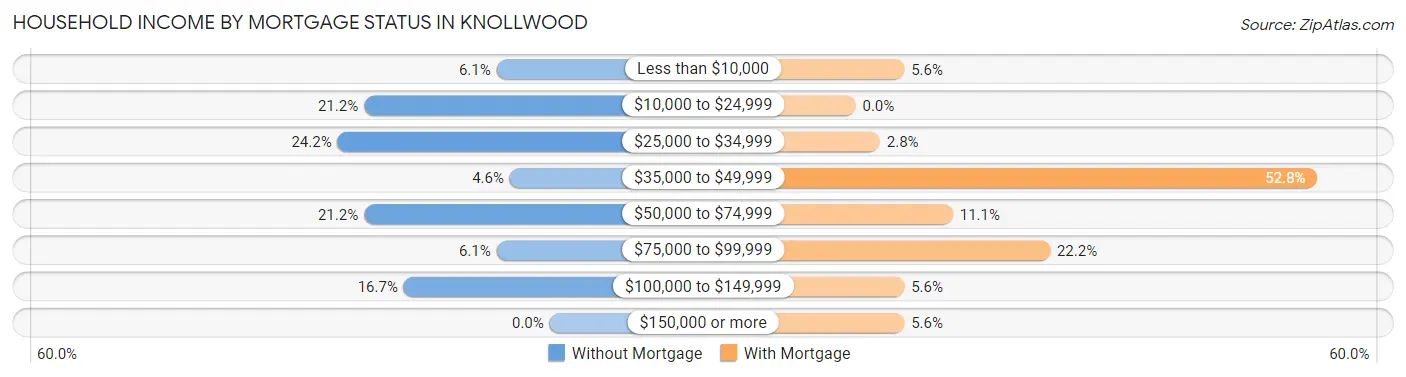
| Household Income | Without Mortgage | With Mortgage |
| Less than $10,000 | 4 (6.1%) | 2 (5.6%) |
| $10,000 to $24,999 | 14 (21.2%) | 0 (0.0%) |
| $25,000 to $34,999 | 16 (24.2%) | 1 (2.8%) |
| $35,000 to $49,999 | 3 (4.5%) | 19 (52.8%) |
| $50,000 to $74,999 | 14 (21.2%) | 4 (11.1%) |
| $75,000 to $99,999 | 4 (6.1%) | 8 (22.2%) |
| $100,000 to $149,999 | 11 (16.7%) | 2 (5.6%) |
| $150,000 or more | 0 (0.0%) | 2 (5.6%) |
| Total | 66 (100.0%) | 36 (100.0%) |
Property Value to Household Income Ratio in Knollwood
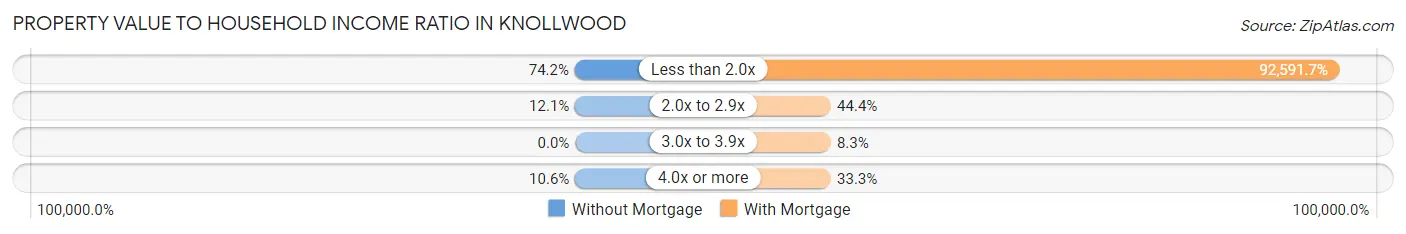
| Value-to-Income Ratio | Without Mortgage | With Mortgage |
| Less than 2.0x | 49 (74.2%) | 33,333 (92,591.7%) |
| 2.0x to 2.9x | 8 (12.1%) | 16 (44.4%) |
| 3.0x to 3.9x | 0 (0.0%) | 3 (8.3%) |
| 4.0x or more | 7 (10.6%) | 12 (33.3%) |
| Total | 66 (100.0%) | 36 (100.0%) |
Real Estate Taxes by Mortgage Status in Knollwood
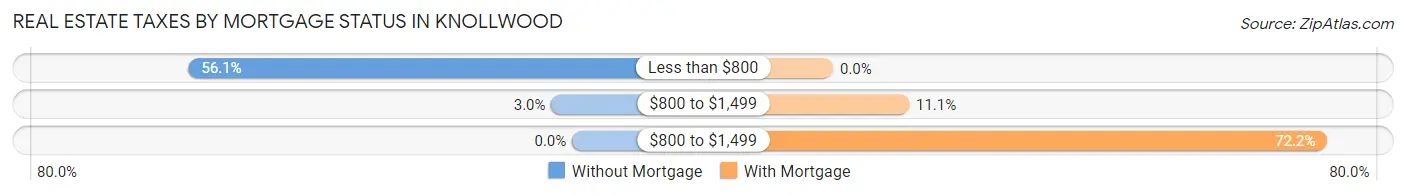
| Property Taxes | Without Mortgage | With Mortgage |
| Less than $800 | 37 (56.1%) | 0 (0.0%) |
| $800 to $1,499 | 2 (3.0%) | 4 (11.1%) |
| $800 to $1,499 | 0 (0.0%) | 26 (72.2%) |
| Total | 66 (100.0%) | 36 (100.0%) |
Health & Disability in Knollwood
Health Insurance Coverage by Age in Knollwood
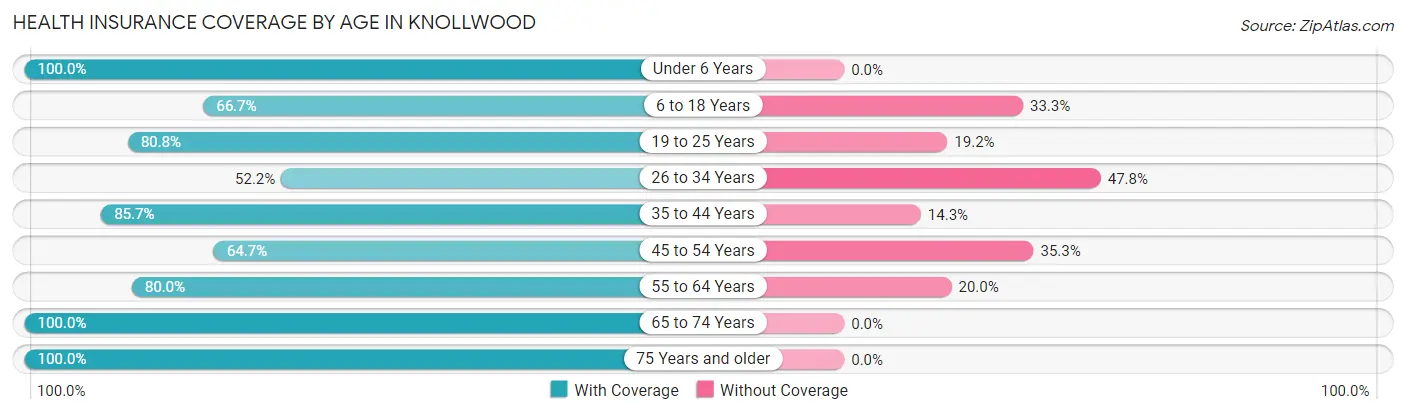
| Age Bracket | With Coverage | Without Coverage |
| Under 6 Years | 25 (100.0%) | 0 (0.0%) |
| 6 to 18 Years | 16 (66.7%) | 8 (33.3%) |
| 19 to 25 Years | 105 (80.8%) | 25 (19.2%) |
| 26 to 34 Years | 48 (52.2%) | 44 (47.8%) |
| 35 to 44 Years | 36 (85.7%) | 6 (14.3%) |
| 45 to 54 Years | 22 (64.7%) | 12 (35.3%) |
| 55 to 64 Years | 40 (80.0%) | 10 (20.0%) |
| 65 to 74 Years | 61 (100.0%) | 0 (0.0%) |
| 75 Years and older | 36 (100.0%) | 0 (0.0%) |
| Total | 389 (78.7%) | 105 (21.3%) |
Health Insurance Coverage by Citizenship Status in Knollwood
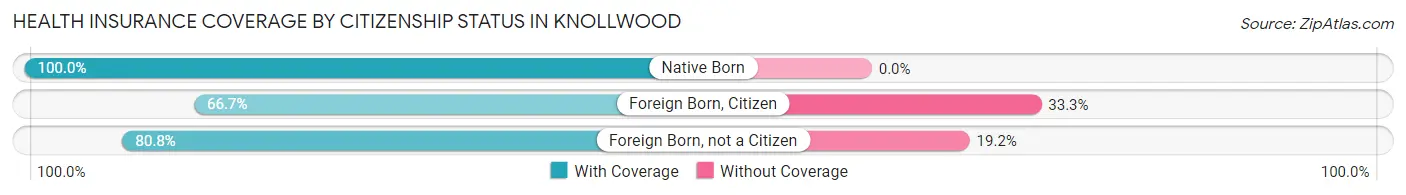
| Citizenship Status | With Coverage | Without Coverage |
| Native Born | 25 (100.0%) | 0 (0.0%) |
| Foreign Born, Citizen | 16 (66.7%) | 8 (33.3%) |
| Foreign Born, not a Citizen | 105 (80.8%) | 25 (19.2%) |
Health Insurance Coverage by Household Income in Knollwood
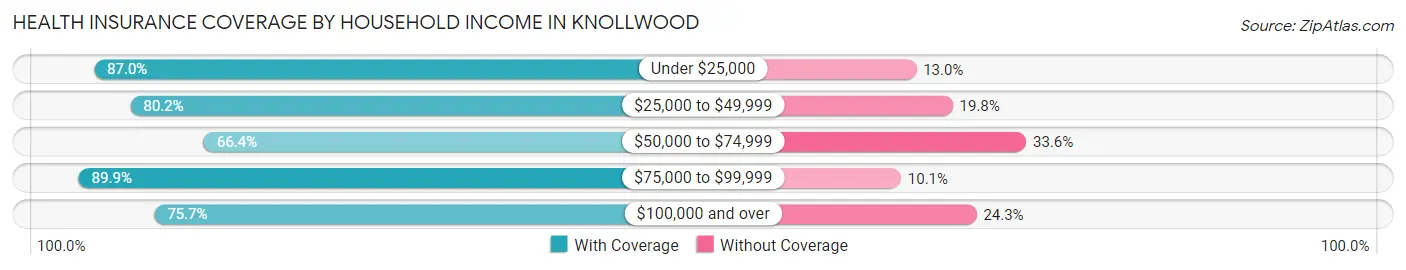
| Household Income | With Coverage | Without Coverage |
| Under $25,000 | 87 (87.0%) | 13 (13.0%) |
| $25,000 to $49,999 | 89 (80.2%) | 22 (19.8%) |
| $50,000 to $74,999 | 89 (66.4%) | 45 (33.6%) |
| $75,000 to $99,999 | 71 (89.9%) | 8 (10.1%) |
| $100,000 and over | 53 (75.7%) | 17 (24.3%) |
Public vs Private Health Insurance Coverage by Age in Knollwood
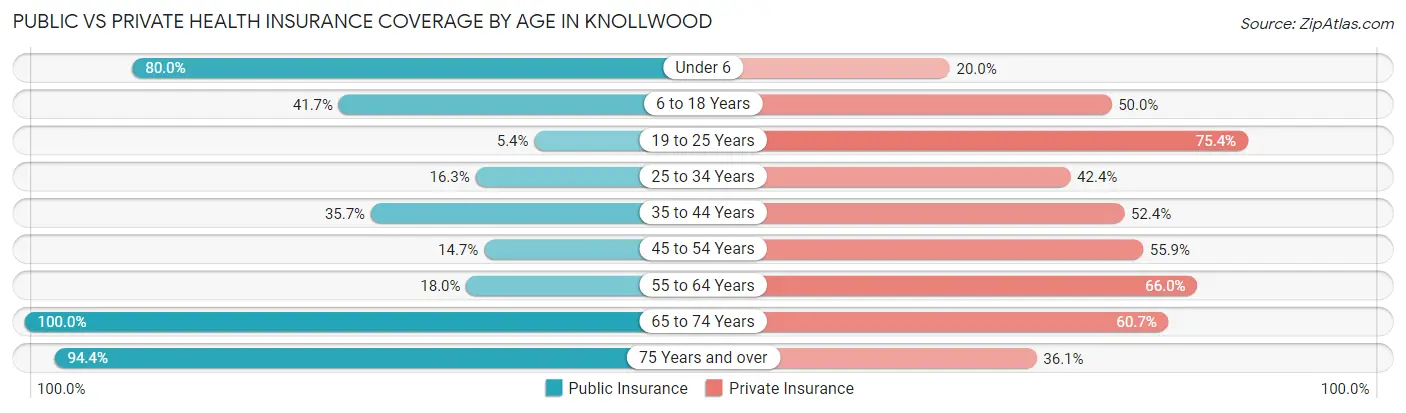
| Age Bracket | Public Insurance | Private Insurance |
| Under 6 | 20 (80.0%) | 5 (20.0%) |
| 6 to 18 Years | 10 (41.7%) | 12 (50.0%) |
| 19 to 25 Years | 7 (5.4%) | 98 (75.4%) |
| 25 to 34 Years | 15 (16.3%) | 39 (42.4%) |
| 35 to 44 Years | 15 (35.7%) | 22 (52.4%) |
| 45 to 54 Years | 5 (14.7%) | 19 (55.9%) |
| 55 to 64 Years | 9 (18.0%) | 33 (66.0%) |
| 65 to 74 Years | 61 (100.0%) | 37 (60.7%) |
| 75 Years and over | 34 (94.4%) | 13 (36.1%) |
| Total | 176 (35.6%) | 278 (56.3%) |
Disability Status by Sex by Age in Knollwood
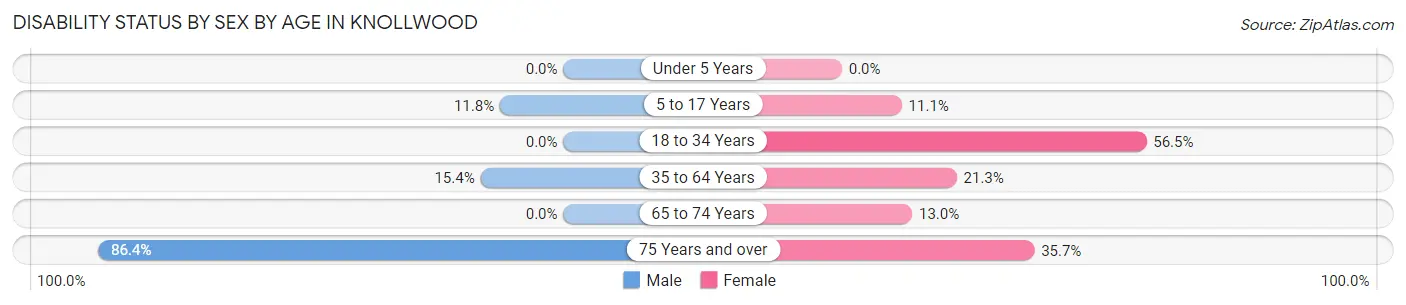
| Age Bracket | Male | Female |
| Under 5 Years | 0 (0.0%) | 0 (0.0%) |
| 5 to 17 Years | 2 (11.8%) | 1 (11.1%) |
| 18 to 34 Years | 0 (0.0%) | 65 (56.5%) |
| 35 to 64 Years | 10 (15.4%) | 13 (21.3%) |
| 65 to 74 Years | 0 (0.0%) | 6 (13.0%) |
| 75 Years and over | 19 (86.4%) | 5 (35.7%) |
Disability Class by Sex by Age in Knollwood
Disability Class: Hearing Difficulty
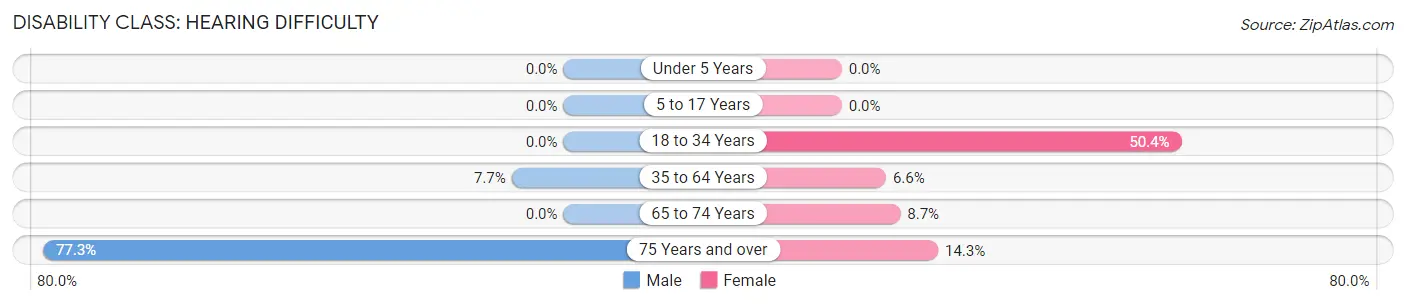
| Age Bracket | Male | Female |
| Under 5 Years | 0 (0.0%) | 0 (0.0%) |
| 5 to 17 Years | 0 (0.0%) | 0 (0.0%) |
| 18 to 34 Years | 0 (0.0%) | 58 (50.4%) |
| 35 to 64 Years | 5 (7.7%) | 4 (6.6%) |
| 65 to 74 Years | 0 (0.0%) | 4 (8.7%) |
| 75 Years and over | 17 (77.3%) | 2 (14.3%) |
Disability Class: Vision Difficulty
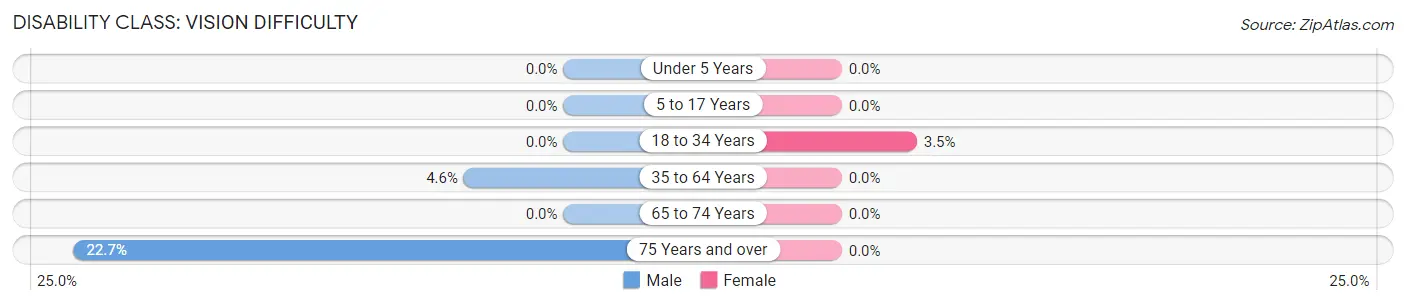
| Age Bracket | Male | Female |
| Under 5 Years | 0 (0.0%) | 0 (0.0%) |
| 5 to 17 Years | 0 (0.0%) | 0 (0.0%) |
| 18 to 34 Years | 0 (0.0%) | 4 (3.5%) |
| 35 to 64 Years | 3 (4.6%) | 0 (0.0%) |
| 65 to 74 Years | 0 (0.0%) | 0 (0.0%) |
| 75 Years and over | 5 (22.7%) | 0 (0.0%) |
Disability Class: Cognitive Difficulty
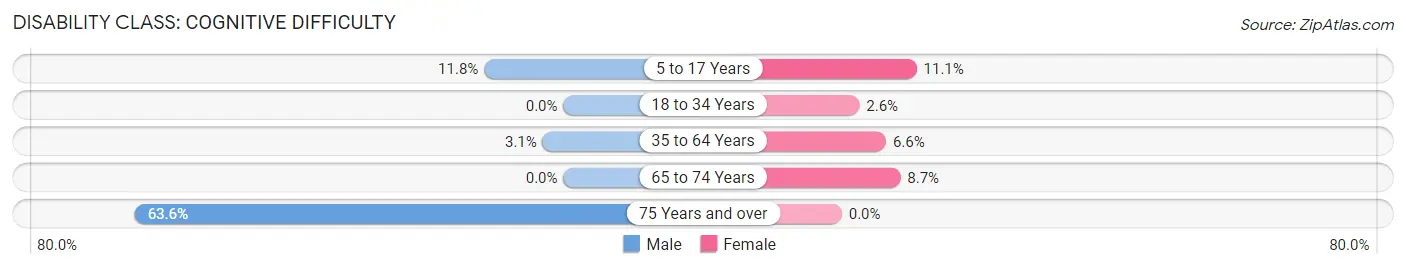
| Age Bracket | Male | Female |
| 5 to 17 Years | 2 (11.8%) | 1 (11.1%) |
| 18 to 34 Years | 0 (0.0%) | 3 (2.6%) |
| 35 to 64 Years | 2 (3.1%) | 4 (6.6%) |
| 65 to 74 Years | 0 (0.0%) | 4 (8.7%) |
| 75 Years and over | 14 (63.6%) | 0 (0.0%) |
Disability Class: Ambulatory Difficulty
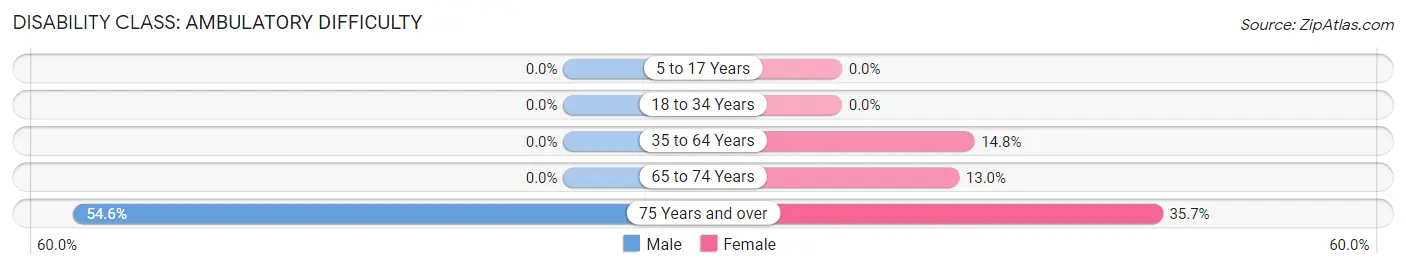
| Age Bracket | Male | Female |
| 5 to 17 Years | 0 (0.0%) | 0 (0.0%) |
| 18 to 34 Years | 0 (0.0%) | 0 (0.0%) |
| 35 to 64 Years | 0 (0.0%) | 9 (14.7%) |
| 65 to 74 Years | 0 (0.0%) | 6 (13.0%) |
| 75 Years and over | 12 (54.5%) | 5 (35.7%) |
Disability Class: Self-Care Difficulty
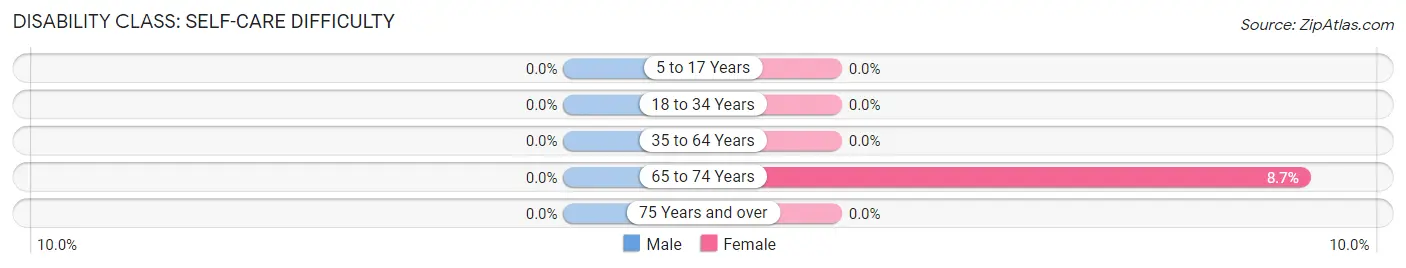
| Age Bracket | Male | Female |
| 5 to 17 Years | 0 (0.0%) | 0 (0.0%) |
| 18 to 34 Years | 0 (0.0%) | 0 (0.0%) |
| 35 to 64 Years | 0 (0.0%) | 0 (0.0%) |
| 65 to 74 Years | 0 (0.0%) | 4 (8.7%) |
| 75 Years and over | 0 (0.0%) | 0 (0.0%) |
Technology Access in Knollwood
Computing Device Access in Knollwood
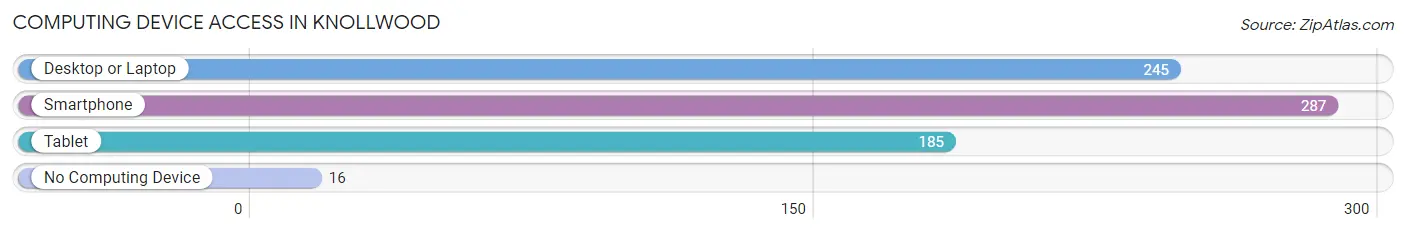
| Device Type | # Households | % Households |
| Desktop or Laptop | 245 | 77.0% |
| Smartphone | 287 | 90.2% |
| Tablet | 185 | 58.2% |
| No Computing Device | 16 | 5.0% |
| Total | 318 | 100.0% |
Internet Access in Knollwood
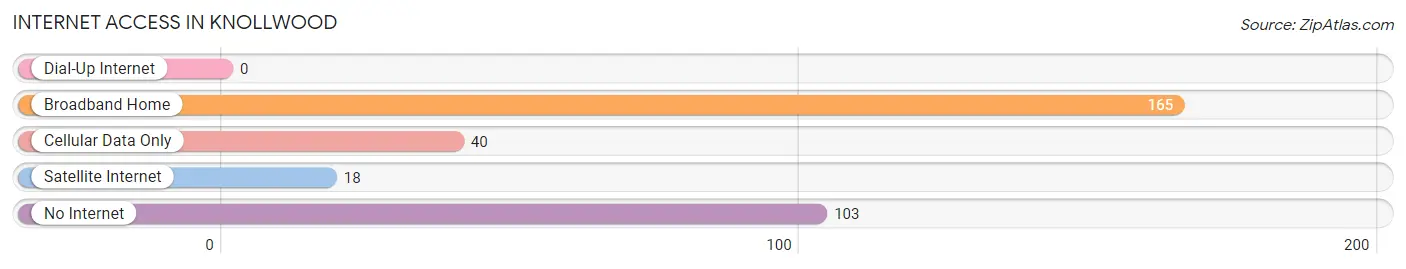
| Internet Type | # Households | % Households |
| Dial-Up Internet | 0 | 0.0% |
| Broadband Home | 165 | 51.9% |
| Cellular Data Only | 40 | 12.6% |
| Satellite Internet | 18 | 5.7% |
| No Internet | 103 | 32.4% |
| Total | 318 | 100.0% |
Knollwood Summary
Knollwood, Texas is a small unincorporated community located in the southeastern corner of Smith County, Texas. It is situated about 10 miles east of Tyler, the county seat, and about 20 miles west of Longview. The population of Knollwood was estimated to be around 1,000 in 2020.
History
Knollwood was founded in the late 1800s by a group of settlers from the nearby town of Whitehouse. The settlers were looking for a place to settle and start a new life, and they found it in the rolling hills of Smith County. The town was originally called Whitehouse Hill, but the name was changed to Knollwood in the early 1900s.
The town was a small farming community for many years, but in the 1950s, the oil and gas industry began to move into the area. This brought a new wave of economic growth to the area, and the population of Knollwood began to grow.
Geography
Knollwood is located in the southeastern corner of Smith County, Texas. It is situated about 10 miles east of Tyler, the county seat, and about 20 miles west of Longview. The town is located in the Piney Woods region of East Texas, and is surrounded by rolling hills and forests. The climate in Knollwood is humid subtropical, with hot summers and mild winters.
Economy
The economy of Knollwood is largely based on agriculture and oil and gas production. The town is home to several farms, and the surrounding area is known for its production of cotton, soybeans, and other crops. The oil and gas industry is also a major employer in the area, and many of the town’s residents work in the industry.
In addition to agriculture and oil and gas, Knollwood is also home to several small businesses, including restaurants, convenience stores, and other retail establishments. The town is also home to a few small manufacturing companies.
Demographics
The population of Knollwood was estimated to be around 1,000 in 2020. The town is predominantly white, with a small Hispanic population. The median household income in Knollwood is around $50,000, and the median home value is around $150,000.
Knollwood is a small, close-knit community with a strong sense of community and pride. The town is home to several churches, and the residents are very active in their local government. The town is also home to several parks and recreational areas, and the residents enjoy spending time outdoors.
Common Questions
What is Per Capita Income in Knollwood?
Per Capita income in Knollwood is $31,509.
What is the Median Family Income in Knollwood?
Median Family Income in Knollwood is $63,125.
What is the Median Household income in Knollwood?
Median Household Income in Knollwood is $47,000.
What is Inequality or Gini Index in Knollwood?
Inequality or Gini Index in Knollwood is 0.46.
What is the Total Population of Knollwood?
Total Population of Knollwood is 494.
What is the Total Male Population of Knollwood?
Total Male Population of Knollwood is 239.
What is the Total Female Population of Knollwood?
Total Female Population of Knollwood is 255.
What is the Ratio of Males per 100 Females in Knollwood?
There are 93.73 Males per 100 Females in Knollwood.
What is the Ratio of Females per 100 Males in Knollwood?
There are 106.69 Females per 100 Males in Knollwood.
What is the Median Population Age in Knollwood?
Median Population Age in Knollwood is 28.9 Years.
What is the Average Family Size in Knollwood
Average Family Size in Knollwood is 2.9 People.
What is the Average Household Size in Knollwood
Average Household Size in Knollwood is 1.6 People.
How Large is the Labor Force in Knollwood?
There are 325 People in the Labor Forcein in Knollwood.
What is the Percentage of People in the Labor Force in Knollwood?
70.8% of People are in the Labor Force in Knollwood.
What is the Unemployment Rate in Knollwood?
Unemployment Rate in Knollwood is 15.7%.