Zip Codes with the Highest Percentage of Population Employed in Life, Physical & Social Science in South Dakota
RELATED REPORTS & OPTIONS
Life, Physical & Social Science
South Dakota
Compare Zip Codes
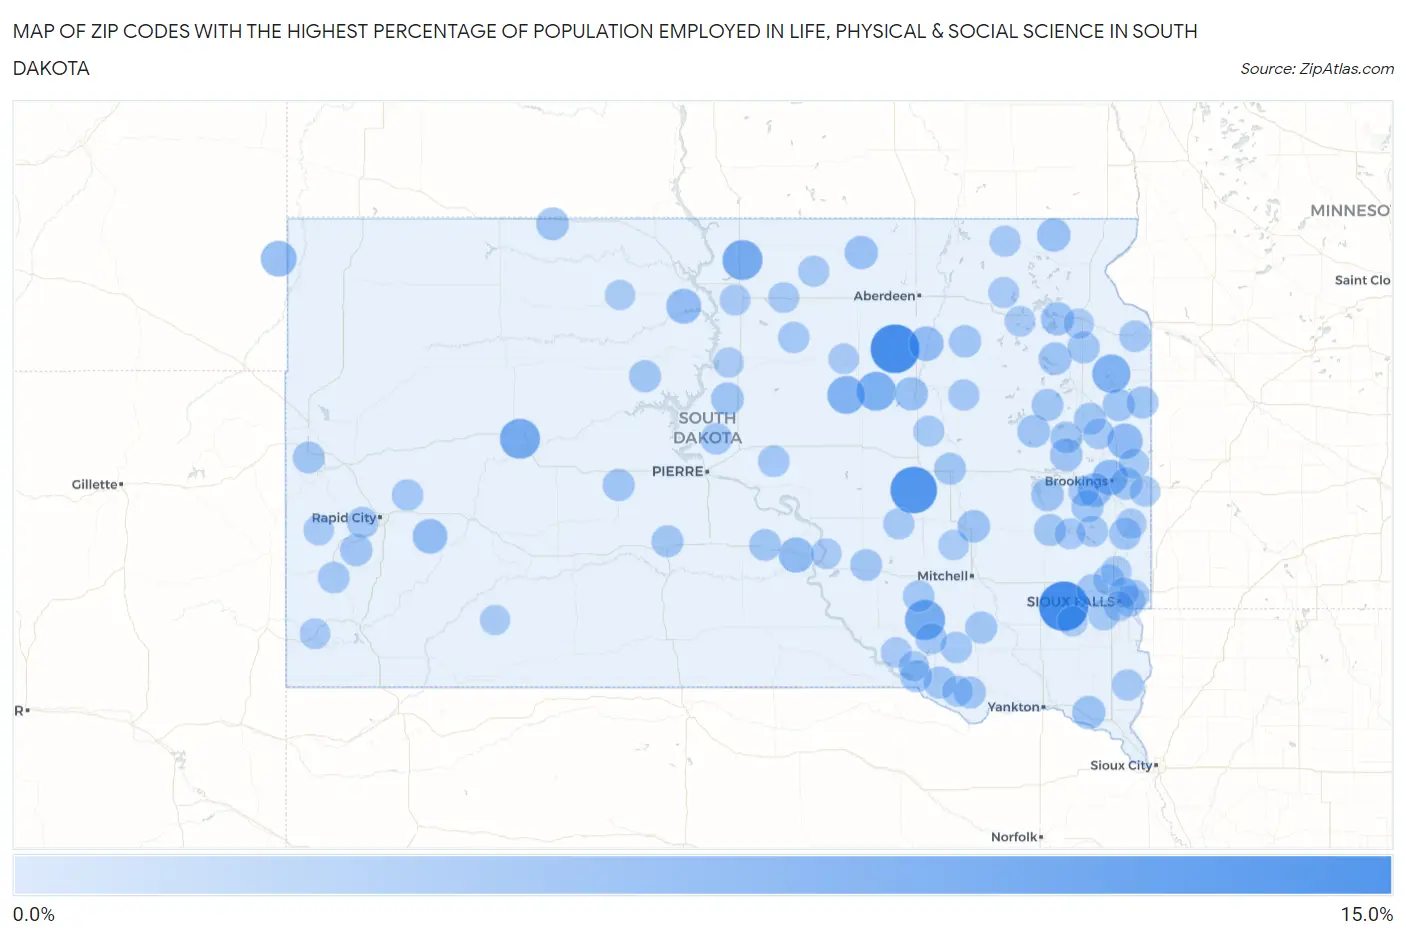
Map of Zip Codes with the Highest Percentage of Population Employed in Life, Physical & Social Science in South Dakota
0.0%
15.0%
Zip Codes with the Highest Percentage of Population Employed in Life, Physical & Social Science in South Dakota
| Zip Code | % Employed | vs State | vs National | |
| 1. | 57047 | 14.6% | 1.2%(+13.4)#1 | 1.1%(+13.5)#108 |
| 2. | 57465 | 14.0% | 1.2%(+12.9)#2 | 1.1%(+12.9)#117 |
| 3. | 57379 | 12.5% | 1.2%(+11.3)#3 | 1.1%(+11.4)#138 |
| 4. | 57328 | 7.9% | 1.2%(+6.77)#4 | 1.1%(+6.84)#326 |
| 5. | 57748 | 7.9% | 1.2%(+6.73)#5 | 1.1%(+6.80)#330 |
| 6. | 57646 | 7.8% | 1.2%(+6.65)#6 | 1.1%(+6.72)#338 |
| 7. | 57470 | 7.0% | 1.2%(+5.82)#7 | 1.1%(+5.89)#411 |
| 8. | 57265 | 6.5% | 1.2%(+5.32)#8 | 1.1%(+5.39)#477 |
| 9. | 57467 | 6.2% | 1.2%(+5.03)#9 | 1.1%(+5.10)#517 |
| 10. | 57724 | 4.8% | 1.2%(+3.64)#10 | 1.1%(+3.71)#819 |
| 11. | 57006 | 4.6% | 1.2%(+3.42)#11 | 1.1%(+3.49)#895 |
| 12. | 57268 | 4.5% | 1.2%(+3.39)#12 | 1.1%(+3.45)#910 |
| 13. | 57569 | 4.4% | 1.2%(+3.24)#13 | 1.1%(+3.30)#966 |
| 14. | 57601 | 4.1% | 1.2%(+2.97)#14 | 1.1%(+3.04)#1,085 |
| 15. | 57725 | 4.1% | 1.2%(+2.92)#15 | 1.1%(+2.99)#1,107 |
| 16. | 57461 | 4.0% | 1.2%(+2.87)#16 | 1.1%(+2.94)#1,136 |
| 17. | 57071 | 3.5% | 1.2%(+2.32)#17 | 1.1%(+2.39)#1,440 |
| 18. | 57469 | 3.2% | 1.2%(+2.00)#18 | 1.1%(+2.07)#1,696 |
| 19. | 57270 | 3.2% | 1.2%(+2.00)#19 | 1.1%(+2.07)#1,697 |
| 20. | 57456 | 3.1% | 1.2%(+1.93)#20 | 1.1%(+2.00)#1,774 |
| 21. | 57273 | 3.0% | 1.2%(+1.87)#21 | 1.1%(+1.94)#1,841 |
| 22. | 57069 | 3.0% | 1.2%(+1.82)#22 | 1.1%(+1.88)#1,908 |
| 23. | 57645 | 2.7% | 1.2%(+1.54)#23 | 1.1%(+1.61)#2,246 |
| 24. | 57520 | 2.7% | 1.2%(+1.51)#24 | 1.1%(+1.58)#2,290 |
| 25. | 57221 | 2.6% | 1.2%(+1.48)#25 | 1.1%(+1.55)#2,333 |
| 26. | 57235 | 2.6% | 1.2%(+1.47)#26 | 1.1%(+1.54)#2,346 |
| 27. | 57051 | 2.6% | 1.2%(+1.47)#27 | 1.1%(+1.54)#2,349 |
| 28. | 57214 | 2.6% | 1.2%(+1.40)#28 | 1.1%(+1.47)#2,457 |
| 29. | 57314 | 2.6% | 1.2%(+1.40)#29 | 1.1%(+1.47)#2,470 |
| 30. | 57050 | 2.5% | 1.2%(+1.30)#30 | 1.1%(+1.37)#2,646 |
| 31. | 57380 | 2.5% | 1.2%(+1.30)#31 | 1.1%(+1.36)#2,650 |
| 32. | 57751 | 2.4% | 1.2%(+1.27)#32 | 1.1%(+1.34)#2,702 |
| 33. | 57002 | 2.4% | 1.2%(+1.23)#33 | 1.1%(+1.30)#2,781 |
| 34. | 57226 | 2.4% | 1.2%(+1.22)#34 | 1.1%(+1.28)#2,803 |
| 35. | 57434 | 2.4% | 1.2%(+1.19)#35 | 1.1%(+1.26)#2,835 |
| 36. | 57552 | 2.3% | 1.2%(+1.11)#36 | 1.1%(+1.18)#3,019 |
| 37. | 57625 | 2.3% | 1.2%(+1.10)#37 | 1.1%(+1.17)#3,031 |
| 38. | 57367 | 2.2% | 1.2%(+1.06)#38 | 1.1%(+1.13)#3,126 |
| 39. | 57366 | 2.2% | 1.2%(+1.05)#39 | 1.1%(+1.12)#3,161 |
| 40. | 57076 | 2.2% | 1.2%(+1.04)#40 | 1.1%(+1.11)#3,174 |
| 41. | 57237 | 2.2% | 1.2%(+1.04)#41 | 1.1%(+1.10)#3,197 |
| 42. | 57223 | 2.2% | 1.2%(+1.03)#42 | 1.1%(+1.09)#3,215 |
| 43. | 57024 | 2.2% | 1.2%(+1.02)#43 | 1.1%(+1.09)#3,221 |
| 44. | 57242 | 2.2% | 1.2%(+1.02)#44 | 1.1%(+1.09)#3,222 |
| 45. | 57559 | 2.2% | 1.2%(+1.02)#45 | 1.1%(+1.09)#3,227 |
| 46. | 57350 | 2.2% | 1.2%(+1.01)#46 | 1.1%(+1.08)#3,259 |
| 47. | 57263 | 2.2% | 1.2%(+0.995)#47 | 1.1%(+1.06)#3,287 |
| 48. | 57783 | 2.2% | 1.2%(+0.992)#48 | 1.1%(+1.06)#3,295 |
| 49. | 57033 | 2.1% | 1.2%(+0.980)#49 | 1.1%(+1.05)#3,325 |
| 50. | 57315 | 2.1% | 1.2%(+0.973)#50 | 1.1%(+1.04)#3,341 |
| 51. | 57544 | 2.1% | 1.2%(+0.923)#51 | 1.1%(+0.992)#3,463 |
| 52. | 57248 | 2.1% | 1.2%(+0.919)#52 | 1.1%(+0.988)#3,468 |
| 53. | 57355 | 2.1% | 1.2%(+0.914)#53 | 1.1%(+0.983)#3,482 |
| 54. | 57375 | 2.0% | 1.2%(+0.820)#54 | 1.1%(+0.889)#3,744 |
| 55. | 57252 | 2.0% | 1.2%(+0.802)#55 | 1.1%(+0.871)#3,794 |
| 56. | 57501 | 1.9% | 1.2%(+0.763)#56 | 1.1%(+0.832)#3,908 |
| 57. | 57730 | 1.9% | 1.2%(+0.739)#57 | 1.1%(+0.809)#3,980 |
| 58. | 57536 | 1.9% | 1.2%(+0.715)#58 | 1.1%(+0.784)#4,056 |
| 59. | 57330 | 1.9% | 1.2%(+0.709)#59 | 1.1%(+0.778)#4,074 |
| 60. | 57719 | 1.8% | 1.2%(+0.626)#60 | 1.1%(+0.695)#4,372 |
| 61. | 57702 | 1.8% | 1.2%(+0.596)#61 | 1.1%(+0.665)#4,489 |
| 62. | 57475 | 1.8% | 1.2%(+0.594)#62 | 1.1%(+0.663)#4,499 |
| 63. | 57313 | 1.7% | 1.2%(+0.582)#63 | 1.1%(+0.651)#4,545 |
| 64. | 57075 | 1.7% | 1.2%(+0.564)#64 | 1.1%(+0.633)#4,618 |
| 65. | 57001 | 1.7% | 1.2%(+0.557)#65 | 1.1%(+0.626)#4,646 |
| 66. | 57436 | 1.7% | 1.2%(+0.549)#66 | 1.1%(+0.618)#4,681 |
| 67. | 57020 | 1.7% | 1.2%(+0.508)#67 | 1.1%(+0.577)#4,868 |
| 68. | 57382 | 1.7% | 1.2%(+0.501)#68 | 1.1%(+0.570)#4,893 |
| 69. | 57430 | 1.6% | 1.2%(+0.441)#69 | 1.1%(+0.510)#5,156 |
| 70. | 57428 | 1.6% | 1.2%(+0.434)#70 | 1.1%(+0.503)#5,189 |
| 71. | 57064 | 1.6% | 1.2%(+0.428)#71 | 1.1%(+0.498)#5,208 |
| 72. | 57448 | 1.5% | 1.2%(+0.355)#72 | 1.1%(+0.424)#5,577 |
| 73. | 57329 | 1.5% | 1.2%(+0.325)#73 | 1.1%(+0.394)#5,735 |
| 74. | 57348 | 1.5% | 1.2%(+0.315)#74 | 1.1%(+0.384)#5,798 |
| 75. | 57042 | 1.5% | 1.2%(+0.297)#75 | 1.1%(+0.366)#5,882 |
| 76. | 57234 | 1.5% | 1.2%(+0.296)#76 | 1.1%(+0.365)#5,891 |
| 77. | 57472 | 1.4% | 1.2%(+0.279)#77 | 1.1%(+0.348)#5,972 |
| 78. | 57468 | 1.4% | 1.2%(+0.268)#78 | 1.1%(+0.338)#6,037 |
| 79. | 57110 | 1.4% | 1.2%(+0.267)#79 | 1.1%(+0.336)#6,047 |
| 80. | 57005 | 1.4% | 1.2%(+0.254)#80 | 1.1%(+0.324)#6,114 |
| 81. | 57342 | 1.4% | 1.2%(+0.239)#81 | 1.1%(+0.308)#6,202 |
| 82. | 57026 | 1.3% | 1.2%(+0.177)#82 | 1.1%(+0.246)#6,554 |
| 83. | 57274 | 1.3% | 1.2%(+0.166)#83 | 1.1%(+0.236)#6,625 |
| 84. | 57735 | 1.3% | 1.2%(+0.156)#84 | 1.1%(+0.225)#6,698 |
| 85. | 57438 | 1.3% | 1.2%(+0.095)#85 | 1.1%(+0.164)#7,092 |
| 86. | 57325 | 1.2% | 1.2%(+0.083)#86 | 1.1%(+0.152)#7,188 |
| 87. | 57276 | 1.2% | 1.2%(+0.064)#87 | 1.1%(+0.133)#7,310 |
| 88. | 57356 | 1.2% | 1.2%(+0.051)#88 | 1.1%(+0.120)#7,403 |
| 89. | 57745 | 1.2% | 1.2%(+0.051)#89 | 1.1%(+0.120)#7,410 |
| 90. | 57061 | 1.2% | 1.2%(+0.045)#90 | 1.1%(+0.114)#7,461 |
| 91. | 57359 | 1.2% | 1.2%(+0.013)#91 | 1.1%(+0.082)#7,704 |
| 92. | 57003 | 1.1% | 1.2%(-0.022)#92 | 1.1%(+0.047)#7,947 |
| 93. | 57028 | 1.1% | 1.2%(-0.024)#93 | 1.1%(+0.045)#7,963 |
| 94. | 57053 | 1.1% | 1.2%(-0.046)#94 | 1.1%(+0.023)#8,113 |
| 95. | 57104 | 1.1% | 1.2%(-0.074)#95 | 1.1%(-0.005)#8,336 |
| 96. | 57266 | 1.1% | 1.2%(-0.077)#96 | 1.1%(-0.008)#8,366 |
| 97. | 57752 | 1.1% | 1.2%(-0.078)#97 | 1.1%(-0.009)#8,372 |
| 98. | 57656 | 1.1% | 1.2%(-0.085)#98 | 1.1%(-0.016)#8,429 |
| 99. | 57442 | 1.1% | 1.2%(-0.105)#99 | 1.1%(-0.036)#8,586 |
| 100. | 57105 | 1.1% | 1.2%(-0.107)#100 | 1.1%(-0.038)#8,597 |
Common Questions
What are the Top 10 Zip Codes with the Highest Percentage of Population Employed in Life, Physical & Social Science in South Dakota?
Top 10 Zip Codes with the Highest Percentage of Population Employed in Life, Physical & Social Science in South Dakota are:
What zip code has the Highest Percentage of Population Employed in Life, Physical & Social Science in South Dakota?
57047 has the Highest Percentage of Population Employed in Life, Physical & Social Science in South Dakota with 14.6%.
What is the Percentage of Population Employed in Life, Physical & Social Science in the State of South Dakota?
Percentage of Population Employed in Life, Physical & Social Science in South Dakota is 1.2%.
What is the Percentage of Population Employed in Life, Physical & Social Science in the United States?
Percentage of Population Employed in Life, Physical & Social Science in the United States is 1.1%.