Corsica, SD Map & Demographics
Corsica Map
Corsica Overview
$31,284
PER CAPITA INCOME
$91,250
AVG FAMILY INCOME
$70,294
AVG HOUSEHOLD INCOME
54.5%
WAGE / INCOME GAP [ % ]
45.5¢/ $1
WAGE / INCOME GAP [ $ ]
0.37
INEQUALITY / GINI INDEX
691
TOTAL POPULATION
332
MALE POPULATION
359
FEMALE POPULATION
92.48
MALES / 100 FEMALES
108.13
FEMALES / 100 MALES
45.8
MEDIAN AGE
2.8
AVG FAMILY SIZE
2.2
AVG HOUSEHOLD SIZE
354
LABOR FORCE [ PEOPLE ]
62.5%
PERCENT IN LABOR FORCE
Corsica Zip Codes
Corsica Area Codes
Income in Corsica
Income Overview in Corsica
Per Capita Income in Corsica is $31,284, while median incomes of families and households are $91,250 and $70,294 respectively.
| Characteristic | Number | Measure |
| Per Capita Income | 691 | $31,284 |
| Median Family Income | 179 | $91,250 |
| Mean Family Income | 179 | $91,973 |
| Median Household Income | 276 | $70,294 |
| Mean Household Income | 276 | $74,492 |
| Income Deficit | 179 | $0 |
| Wage / Income Gap (%) | 691 | 54.48% |
| Wage / Income Gap ($) | 691 | 45.52¢ per $1 |
| Gini / Inequality Index | 691 | 0.37 |
Earnings by Sex in Corsica
Average Earnings in Corsica are $38,250, $57,667 for men and $26,250 for women, a difference of 54.5%.
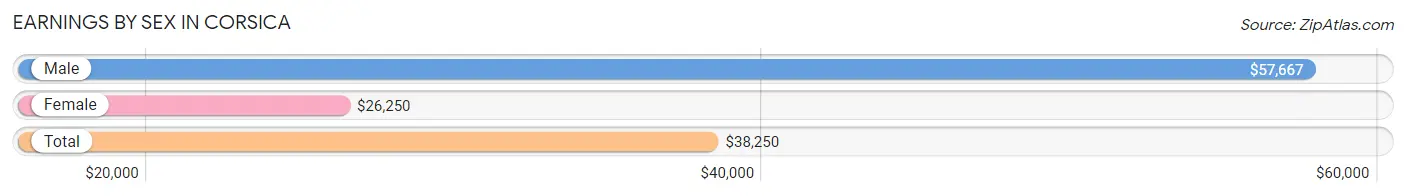
| Sex | Number | Average Earnings |
| Male | 206 (50.2%) | $57,667 |
| Female | 204 (49.8%) | $26,250 |
| Total | 410 (100.0%) | $38,250 |
Earnings by Sex by Income Bracket in Corsica
The most common earnings brackets in Corsica are $55,000 to $64,999 for men (50 | 24.3%) and $2,500 to $4,999 for women (30 | 14.7%).
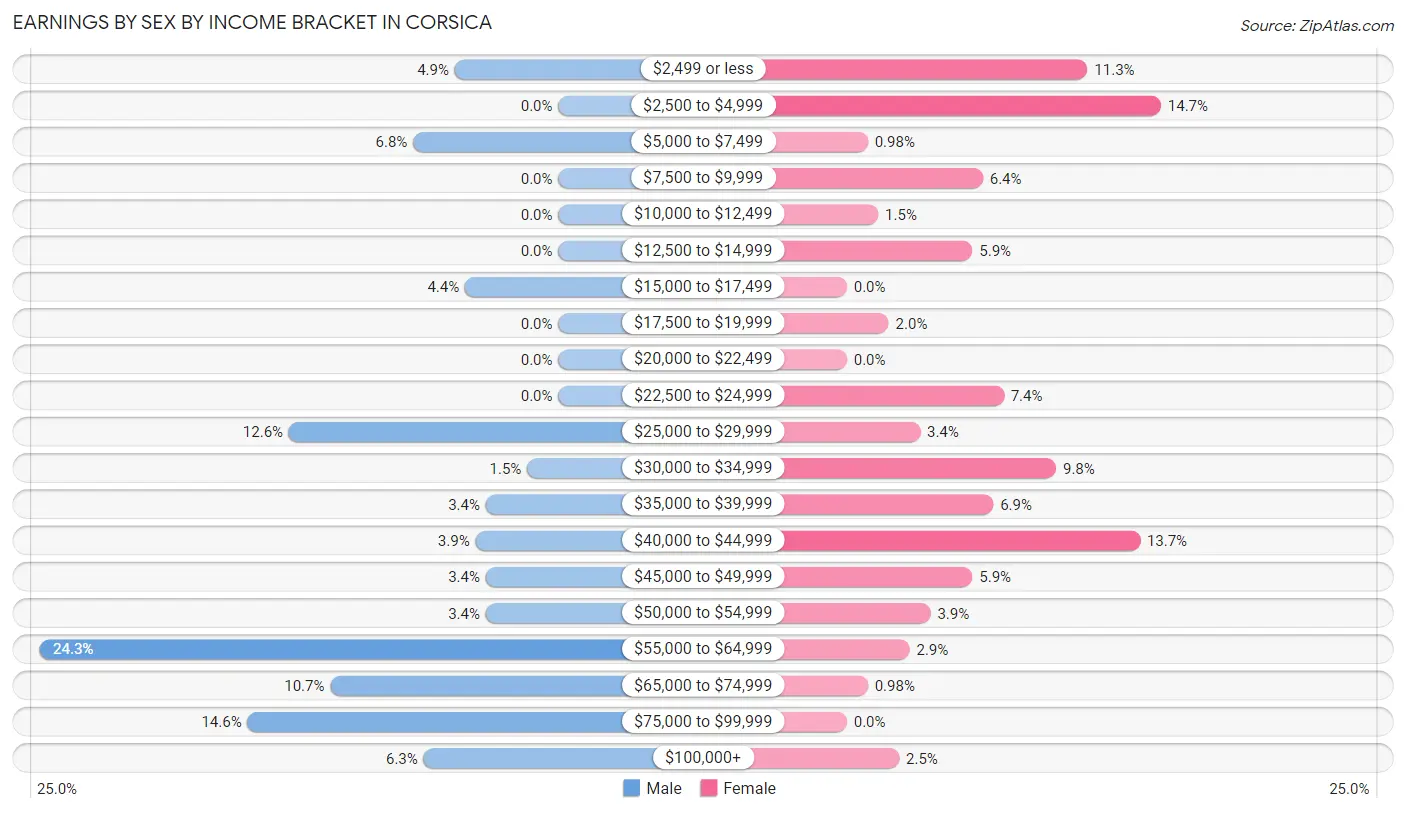
| Income | Male | Female |
| $2,499 or less | 10 (4.9%) | 23 (11.3%) |
| $2,500 to $4,999 | 0 (0.0%) | 30 (14.7%) |
| $5,000 to $7,499 | 14 (6.8%) | 2 (1.0%) |
| $7,500 to $9,999 | 0 (0.0%) | 13 (6.4%) |
| $10,000 to $12,499 | 0 (0.0%) | 3 (1.5%) |
| $12,500 to $14,999 | 0 (0.0%) | 12 (5.9%) |
| $15,000 to $17,499 | 9 (4.4%) | 0 (0.0%) |
| $17,500 to $19,999 | 0 (0.0%) | 4 (2.0%) |
| $20,000 to $22,499 | 0 (0.0%) | 0 (0.0%) |
| $22,500 to $24,999 | 0 (0.0%) | 15 (7.3%) |
| $25,000 to $29,999 | 26 (12.6%) | 7 (3.4%) |
| $30,000 to $34,999 | 3 (1.5%) | 20 (9.8%) |
| $35,000 to $39,999 | 7 (3.4%) | 14 (6.9%) |
| $40,000 to $44,999 | 8 (3.9%) | 28 (13.7%) |
| $45,000 to $49,999 | 7 (3.4%) | 12 (5.9%) |
| $50,000 to $54,999 | 7 (3.4%) | 8 (3.9%) |
| $55,000 to $64,999 | 50 (24.3%) | 6 (2.9%) |
| $65,000 to $74,999 | 22 (10.7%) | 2 (1.0%) |
| $75,000 to $99,999 | 30 (14.6%) | 0 (0.0%) |
| $100,000+ | 13 (6.3%) | 5 (2.5%) |
| Total | 206 (100.0%) | 204 (100.0%) |
Earnings by Sex by Educational Attainment in Corsica
Average earnings in Corsica are $60,536 for men and $33,750 for women, a difference of 44.3%. Men with an educational attainment of graduate degree enjoy the highest average annual earnings of $74,375, while those with less than high school education earn the least with $2,499. Women with an educational attainment of bachelor's degree earn the most with the average annual earnings of $46,563, while those with high school diploma education have the smallest earnings of $24,135.
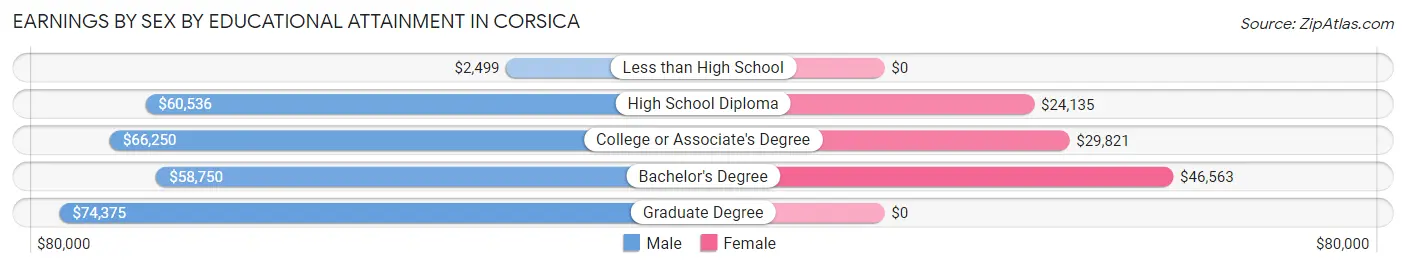
| Educational Attainment | Male Income | Female Income |
| Less than High School | $2,499 | $0 |
| High School Diploma | $60,536 | $24,135 |
| College or Associate's Degree | $66,250 | $29,821 |
| Bachelor's Degree | $58,750 | $46,563 |
| Graduate Degree | $74,375 | $0 |
| Total | $60,536 | $33,750 |
Family Income in Corsica
Family Income Brackets in Corsica
According to the Corsica family income data, there are 63 families falling into the $100,000 to $149,999 income range, which is the most common income bracket and makes up 35.2% of all families.
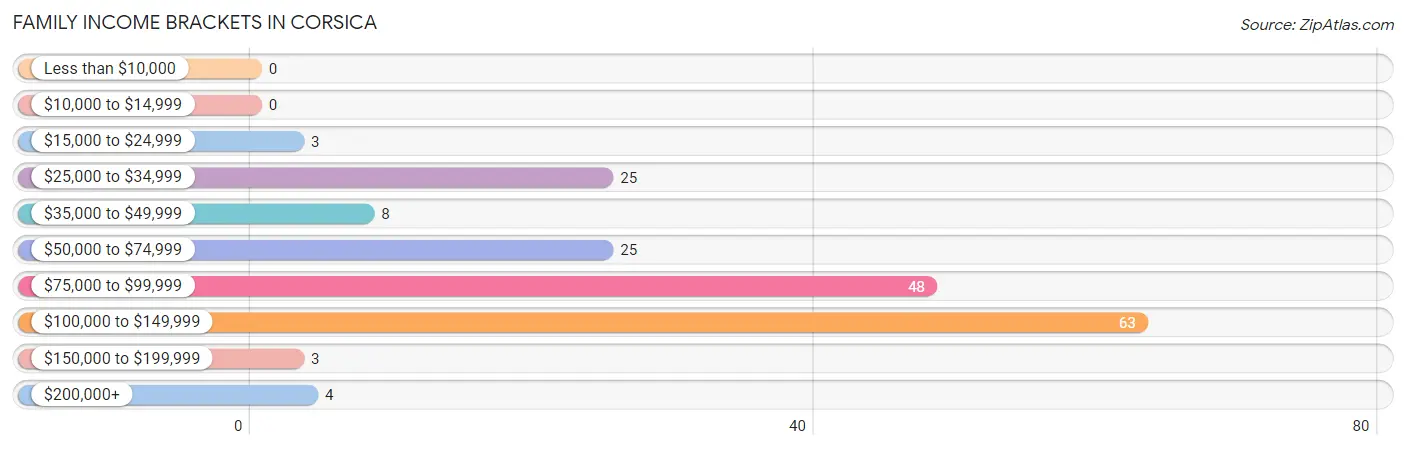
| Income Bracket | # Families | % Families |
| Less than $10,000 | 0 | 0.0% |
| $10,000 to $14,999 | 0 | 0.0% |
| $15,000 to $24,999 | 3 | 1.7% |
| $25,000 to $34,999 | 25 | 14.0% |
| $35,000 to $49,999 | 8 | 4.5% |
| $50,000 to $74,999 | 25 | 14.0% |
| $75,000 to $99,999 | 48 | 26.8% |
| $100,000 to $149,999 | 63 | 35.2% |
| $150,000 to $199,999 | 3 | 1.7% |
| $200,000+ | 4 | 2.2% |
Family Income by Famaliy Size in Corsica
4-person families (21 | 11.7%) account for the highest median family income in Corsica with $118,625 per family, while 2-person families (96 | 53.6%) have the highest median income of $40,909 per family member.
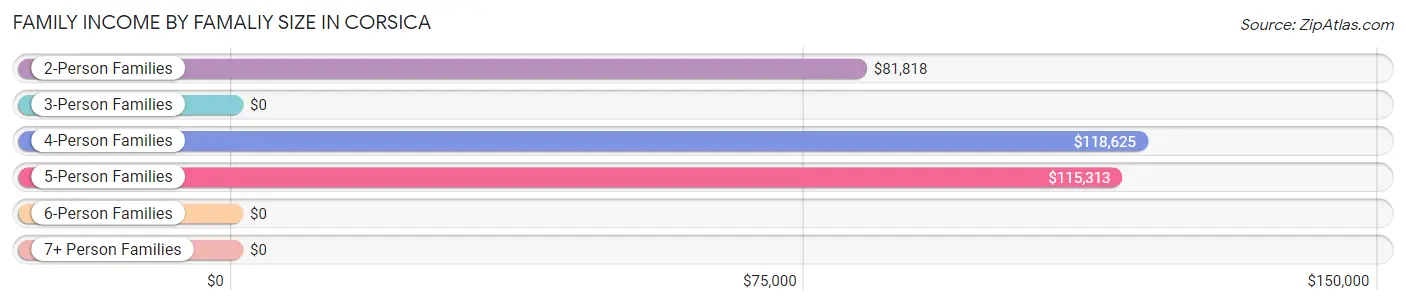
| Income Bracket | # Families | Median Income |
| 2-Person Families | 96 (53.6%) | $81,818 |
| 3-Person Families | 38 (21.2%) | $0 |
| 4-Person Families | 21 (11.7%) | $118,625 |
| 5-Person Families | 13 (7.3%) | $115,313 |
| 6-Person Families | 11 (6.1%) | $0 |
| 7+ Person Families | 0 (0.0%) | $0 |
| Total | 179 (100.0%) | $91,250 |
Family Income by Number of Earners in Corsica
The median family income in Corsica is $91,250, with families comprising 3+ earners (18) having the highest median family income of $130,455, while families with 1 earner (19) have the lowest median family income of $38,125, accounting for 10.1% and 10.6% of families, respectively.
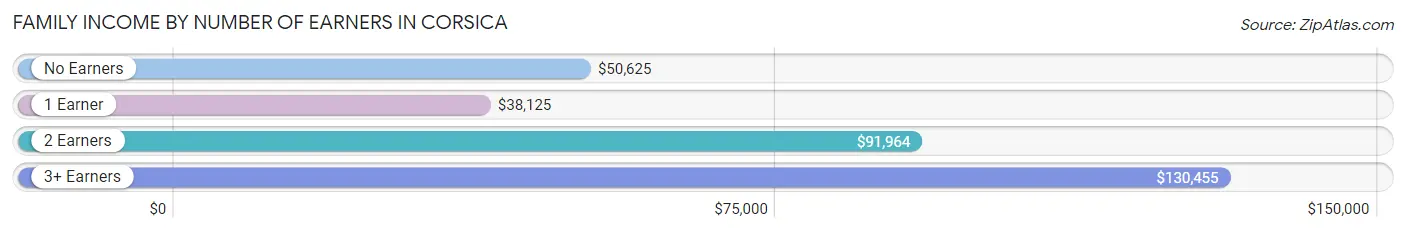
| Number of Earners | # Families | Median Income |
| No Earners | 11 (6.1%) | $50,625 |
| 1 Earner | 19 (10.6%) | $38,125 |
| 2 Earners | 131 (73.2%) | $91,964 |
| 3+ Earners | 18 (10.1%) | $130,455 |
| Total | 179 (100.0%) | $91,250 |
Household Income in Corsica
Household Income Brackets in Corsica
With 64 households falling in the category, the $100,000 to $149,999 income range is the most frequent in Corsica, accounting for 23.2% of all households. In contrast, only 4 households (1.5%) fall into the $150,000 to $199,999 income bracket, making it the least populous group.
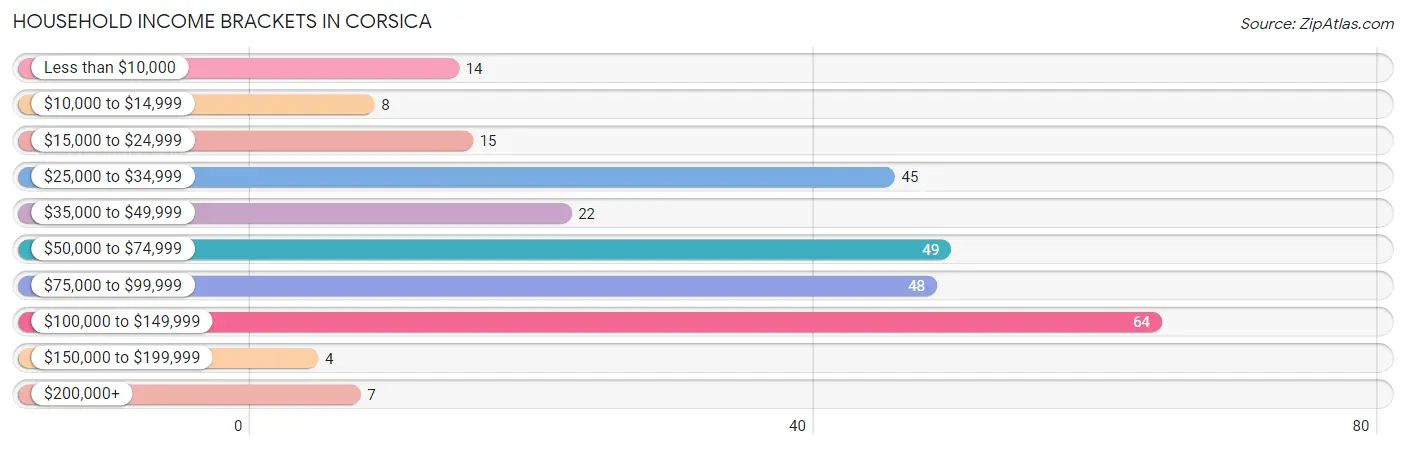
| Income Bracket | # Households | % Households |
| Less than $10,000 | 14 | 5.1% |
| $10,000 to $14,999 | 8 | 2.9% |
| $15,000 to $24,999 | 15 | 5.4% |
| $25,000 to $34,999 | 45 | 16.3% |
| $35,000 to $49,999 | 22 | 8.0% |
| $50,000 to $74,999 | 49 | 17.8% |
| $75,000 to $99,999 | 48 | 17.4% |
| $100,000 to $149,999 | 64 | 23.2% |
| $150,000 to $199,999 | 4 | 1.4% |
| $200,000+ | 7 | 2.5% |
Household Income by Householder Age in Corsica
The median household income in Corsica is $70,294, with the highest median household income of $100,625 found in the 25 to 44 years age bracket for the primary householder. A total of 61 households (22.1%) fall into this category. Meanwhile, the 15 to 24 years age bracket for the primary householder has the lowest median household income of $0, with 32 households (11.6%) in this group.
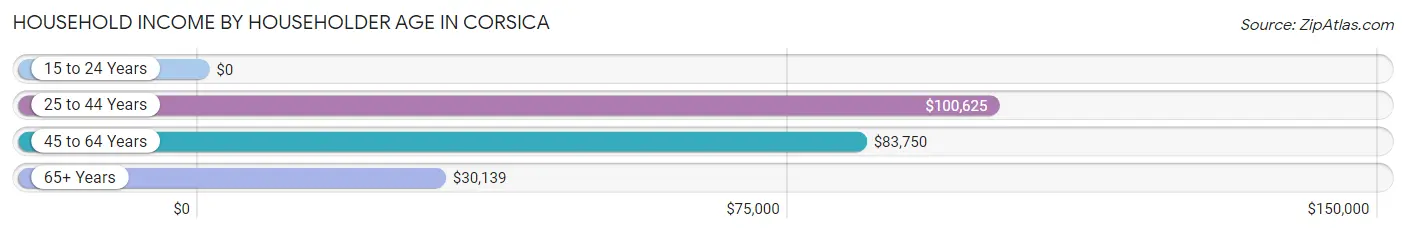
| Income Bracket | # Households | Median Income |
| 15 to 24 Years | 32 (11.6%) | $0 |
| 25 to 44 Years | 61 (22.1%) | $100,625 |
| 45 to 64 Years | 94 (34.1%) | $83,750 |
| 65+ Years | 89 (32.3%) | $30,139 |
| Total | 276 (100.0%) | $70,294 |
Poverty in Corsica
Income Below Poverty by Sex and Age in Corsica
With 4.4% poverty level for males and 10.6% for females among the residents of Corsica, 65 to 74 year old males and 45 to 54 year old females are the most vulnerable to poverty, with 10 males (23.3%) and 12 females (23.5%) in their respective age groups living below the poverty level.
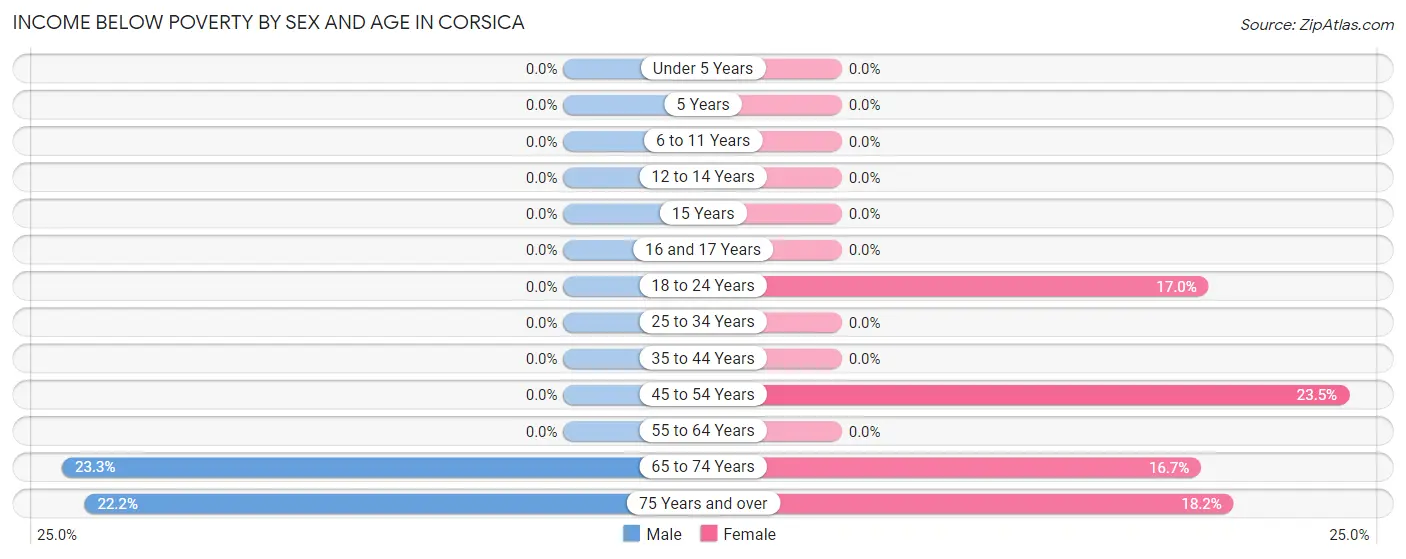
| Age Bracket | Male | Female |
| Under 5 Years | 0 (0.0%) | 0 (0.0%) |
| 5 Years | 0 (0.0%) | 0 (0.0%) |
| 6 to 11 Years | 0 (0.0%) | 0 (0.0%) |
| 12 to 14 Years | 0 (0.0%) | 0 (0.0%) |
| 15 Years | 0 (0.0%) | 0 (0.0%) |
| 16 and 17 Years | 0 (0.0%) | 0 (0.0%) |
| 18 to 24 Years | 0 (0.0%) | 8 (17.0%) |
| 25 to 34 Years | 0 (0.0%) | 0 (0.0%) |
| 35 to 44 Years | 0 (0.0%) | 0 (0.0%) |
| 45 to 54 Years | 0 (0.0%) | 12 (23.5%) |
| 55 to 64 Years | 0 (0.0%) | 0 (0.0%) |
| 65 to 74 Years | 10 (23.3%) | 5 (16.7%) |
| 75 Years and over | 4 (22.2%) | 8 (18.2%) |
| Total | 14 (4.4%) | 33 (10.6%) |
Income Above Poverty by Sex and Age in Corsica
According to the poverty statistics in Corsica, males aged under 5 years and females aged under 5 years are the age groups that are most secure financially, with 100.0% of males and 100.0% of females in these age groups living above the poverty line.
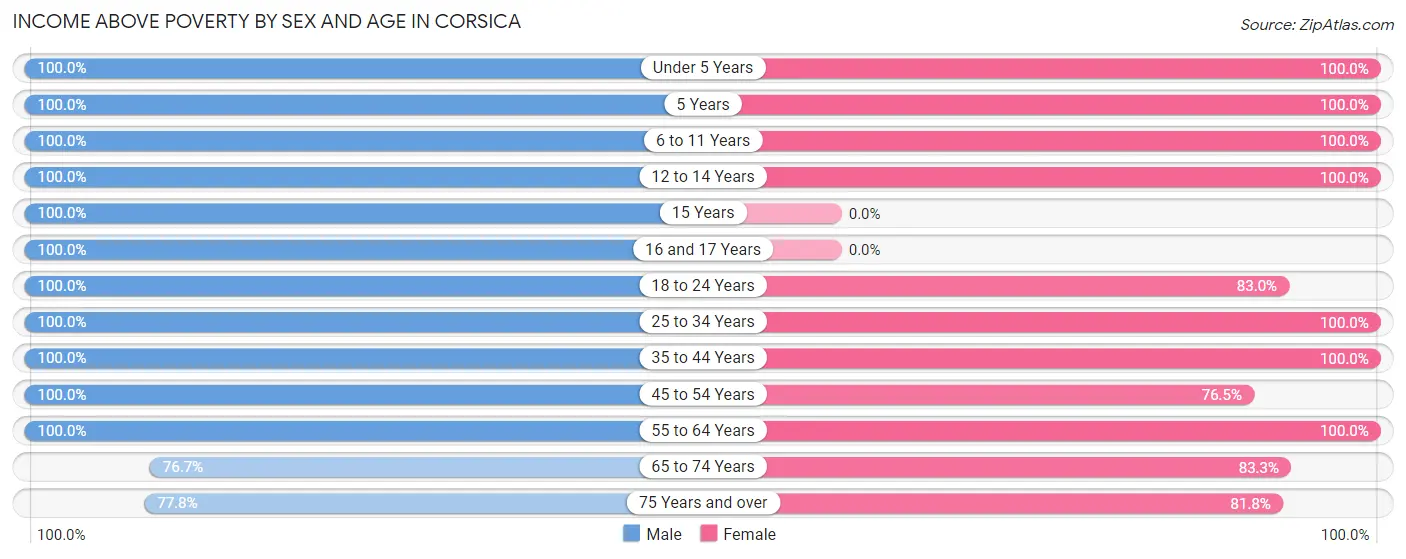
| Age Bracket | Male | Female |
| Under 5 Years | 20 (100.0%) | 36 (100.0%) |
| 5 Years | 10 (100.0%) | 2 (100.0%) |
| 6 to 11 Years | 19 (100.0%) | 10 (100.0%) |
| 12 to 14 Years | 5 (100.0%) | 9 (100.0%) |
| 15 Years | 14 (100.0%) | 0 (0.0%) |
| 16 and 17 Years | 7 (100.0%) | 0 (0.0%) |
| 18 to 24 Years | 45 (100.0%) | 39 (83.0%) |
| 25 to 34 Years | 37 (100.0%) | 38 (100.0%) |
| 35 to 44 Years | 18 (100.0%) | 17 (100.0%) |
| 45 to 54 Years | 34 (100.0%) | 39 (76.5%) |
| 55 to 64 Years | 48 (100.0%) | 27 (100.0%) |
| 65 to 74 Years | 33 (76.7%) | 25 (83.3%) |
| 75 Years and over | 14 (77.8%) | 36 (81.8%) |
| Total | 304 (95.6%) | 278 (89.4%) |
Income Below Poverty Among Married-Couple Families in Corsica
The poverty statistics for married-couple families in Corsica show that 1.7% or 3 of the total 173 families live below the poverty line. Families with no children have the highest poverty rate of 2.9%, comprising of 3 families. On the other hand, families with 1 or 2 children have the lowest poverty rate of 0.0%, which includes 0 families.
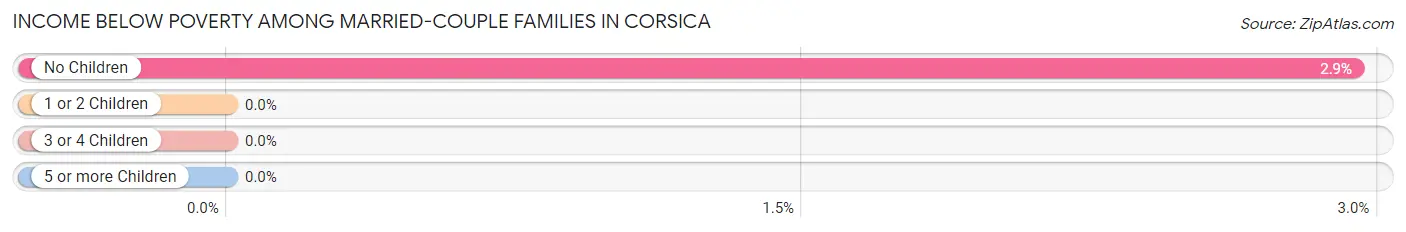
| Children | Above Poverty | Below Poverty |
| No Children | 99 (97.1%) | 3 (2.9%) |
| 1 or 2 Children | 47 (100.0%) | 0 (0.0%) |
| 3 or 4 Children | 24 (100.0%) | 0 (0.0%) |
| 5 or more Children | 0 (0.0%) | 0 (0.0%) |
| Total | 170 (98.3%) | 3 (1.7%) |
Income Below Poverty Among Single-Parent Households in Corsica
| Children | Single Father | Single Mother |
| No Children | 0 (0.0%) | 0 (0.0%) |
| 1 or 2 Children | 0 (0.0%) | 0 (0.0%) |
| 3 or 4 Children | 0 (0.0%) | 0 (0.0%) |
| 5 or more Children | 0 (0.0%) | 0 (0.0%) |
| Total | 0 (0.0%) | 0 (0.0%) |
Income Below Poverty Among Married-Couple vs Single-Parent Households in Corsica
| Children | Married-Couple Families | Single-Parent Households |
| No Children | 3 (2.9%) | 0 (0.0%) |
| 1 or 2 Children | 0 (0.0%) | 0 (0.0%) |
| 3 or 4 Children | 0 (0.0%) | 0 (0.0%) |
| 5 or more Children | 0 (0.0%) | 0 (0.0%) |
| Total | 3 (1.7%) | 0 (0.0%) |
Race in Corsica
The most populous races in Corsica are White / Caucasian (663 | 96.0%), Native / Alaskan (22 | 3.2%), and Two or more Races (6 | 0.9%).
| Race | # Population | % Population |
| Asian | 0 | 0.0% |
| Black / African American | 0 | 0.0% |
| Hawaiian / Pacific | 0 | 0.0% |
| Hispanic or Latino | 1 | 0.1% |
| Native / Alaskan | 22 | 3.2% |
| White / Caucasian | 663 | 96.0% |
| Two or more Races | 6 | 0.9% |
| Some other Race | 0 | 0.0% |
| Total | 691 | 100.0% |
Ancestry in Corsica
The most populous ancestries reported in Corsica are Dutch (239 | 34.6%), German (219 | 31.7%), English (38 | 5.5%), Norwegian (35 | 5.1%), and Irish (26 | 3.8%), together accounting for 80.6% of all Corsica residents.
| Ancestry | # Population | % Population |
| American | 19 | 2.8% |
| Bhutanese | 6 | 0.9% |
| Burmese | 6 | 0.9% |
| Czech | 2 | 0.3% |
| Dutch | 239 | 34.6% |
| English | 38 | 5.5% |
| European | 4 | 0.6% |
| Finnish | 2 | 0.3% |
| French | 7 | 1.0% |
| French Canadian | 2 | 0.3% |
| German | 219 | 31.7% |
| Irish | 26 | 3.8% |
| Mexican | 1 | 0.1% |
| Norwegian | 35 | 5.1% |
| Russian | 6 | 0.9% |
| Sioux | 10 | 1.5% |
| Swedish | 4 | 0.6% |
| Yugoslavian | 7 | 1.0% | View All 18 Rows |
Immigrants in Corsica
The most numerous immigrant groups reported in Corsica came from Europe (21 | 3.0%), Netherlands (17 | 2.5%), Western Europe (17 | 2.5%), Bosnia and Herzegovina (4 | 0.6%), and Eastern Europe (4 | 0.6%), together accounting for 9.1% of all Corsica residents.
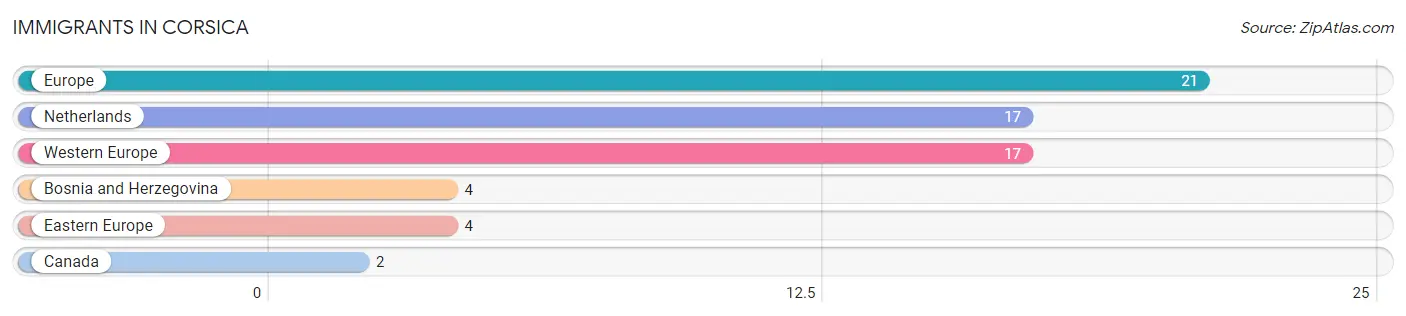
| Immigration Origin | # Population | % Population |
| Bosnia and Herzegovina | 4 | 0.6% |
| Canada | 2 | 0.3% |
| Eastern Europe | 4 | 0.6% |
| Europe | 21 | 3.0% |
| Netherlands | 17 | 2.5% |
| Western Europe | 17 | 2.5% | View All 6 Rows |
Sex and Age in Corsica
Sex and Age in Corsica
The most populous age groups in Corsica are 55 to 59 Years (37 | 11.1%) for men and 85 Years and over (52 | 14.5%) for women.
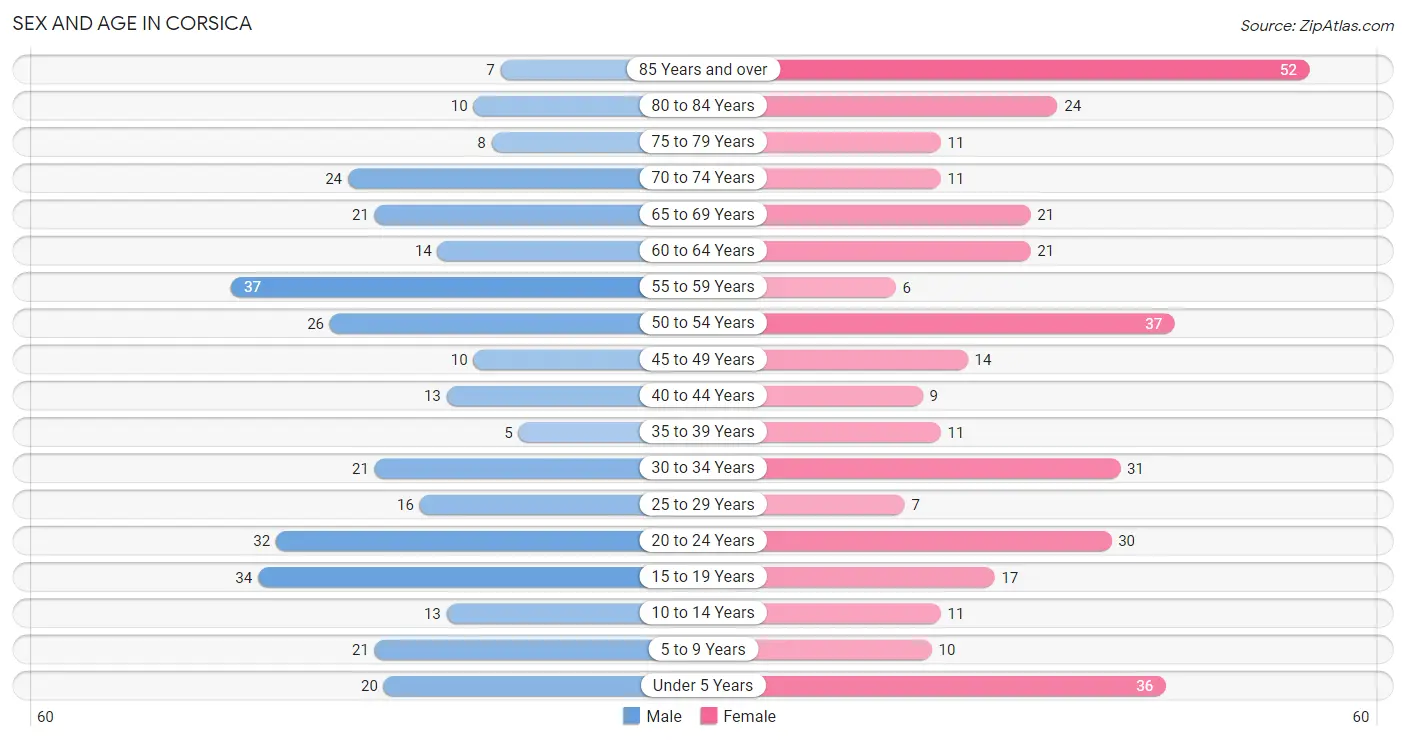
| Age Bracket | Male | Female |
| Under 5 Years | 20 (6.0%) | 36 (10.0%) |
| 5 to 9 Years | 21 (6.3%) | 10 (2.8%) |
| 10 to 14 Years | 13 (3.9%) | 11 (3.1%) |
| 15 to 19 Years | 34 (10.2%) | 17 (4.7%) |
| 20 to 24 Years | 32 (9.6%) | 30 (8.4%) |
| 25 to 29 Years | 16 (4.8%) | 7 (1.9%) |
| 30 to 34 Years | 21 (6.3%) | 31 (8.6%) |
| 35 to 39 Years | 5 (1.5%) | 11 (3.1%) |
| 40 to 44 Years | 13 (3.9%) | 9 (2.5%) |
| 45 to 49 Years | 10 (3.0%) | 14 (3.9%) |
| 50 to 54 Years | 26 (7.8%) | 37 (10.3%) |
| 55 to 59 Years | 37 (11.1%) | 6 (1.7%) |
| 60 to 64 Years | 14 (4.2%) | 21 (5.9%) |
| 65 to 69 Years | 21 (6.3%) | 21 (5.9%) |
| 70 to 74 Years | 24 (7.2%) | 11 (3.1%) |
| 75 to 79 Years | 8 (2.4%) | 11 (3.1%) |
| 80 to 84 Years | 10 (3.0%) | 24 (6.7%) |
| 85 Years and over | 7 (2.1%) | 52 (14.5%) |
| Total | 332 (100.0%) | 359 (100.0%) |
Families and Households in Corsica
Median Family Size in Corsica
The median family size in Corsica is 2.83 persons per family, with single female/mother families (5 | 2.8%) accounting for the largest median family size of 3 persons per family. On the other hand, single male/father families (1 | 0.6%) represent the smallest median family size with 2.00 persons per family.
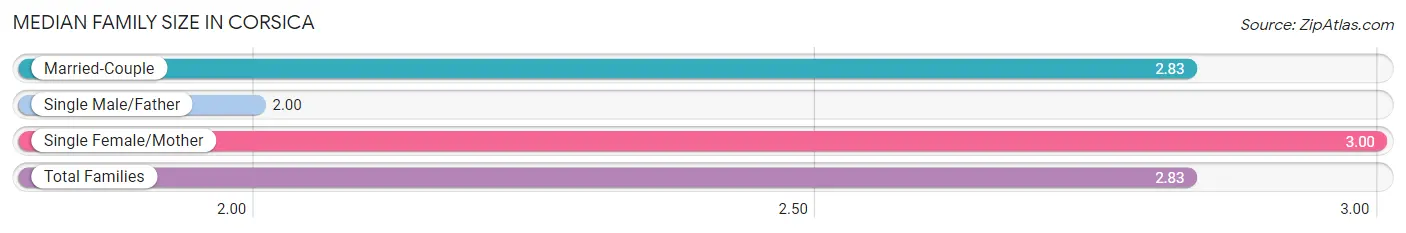
| Family Type | # Families | Family Size |
| Married-Couple | 173 (96.7%) | 2.83 |
| Single Male/Father | 1 (0.6%) | 2.00 |
| Single Female/Mother | 5 (2.8%) | 3.00 |
| Total Families | 179 (100.0%) | 2.83 |
Median Household Size in Corsica
The median household size in Corsica is 2.25 persons per household, with single male/father households (1 | 0.4%) accounting for the largest median household size of 4 persons per household. non-family households (97 | 35.1%) represent the smallest median household size with 1.15 persons per household.
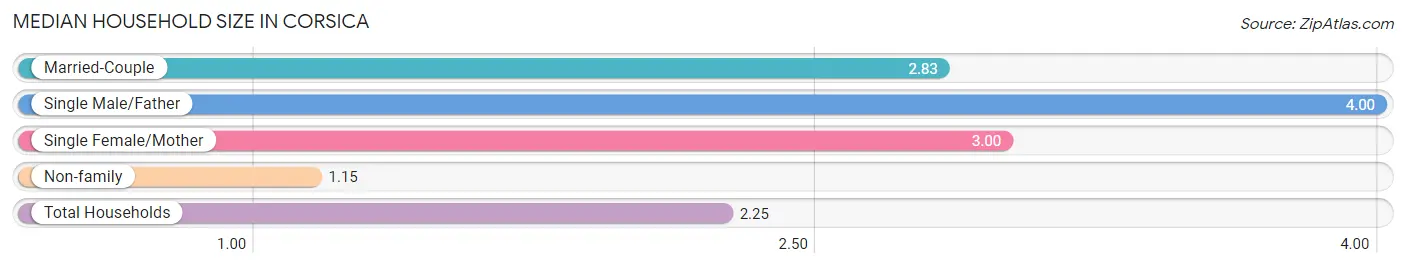
| Household Type | # Households | Household Size |
| Married-Couple | 173 (62.7%) | 2.83 |
| Single Male/Father | 1 (0.4%) | 4.00 |
| Single Female/Mother | 5 (1.8%) | 3.00 |
| Non-family | 97 (35.1%) | 1.15 |
| Total Households | 276 (100.0%) | 2.25 |
Household Size by Marriage Status in Corsica
Out of a total of 276 households in Corsica, 179 (64.9%) are family households, while 97 (35.1%) are nonfamily households. The most numerous type of family households are 2-person households, comprising 95, and the most common type of nonfamily households are 1-person households, comprising 85.
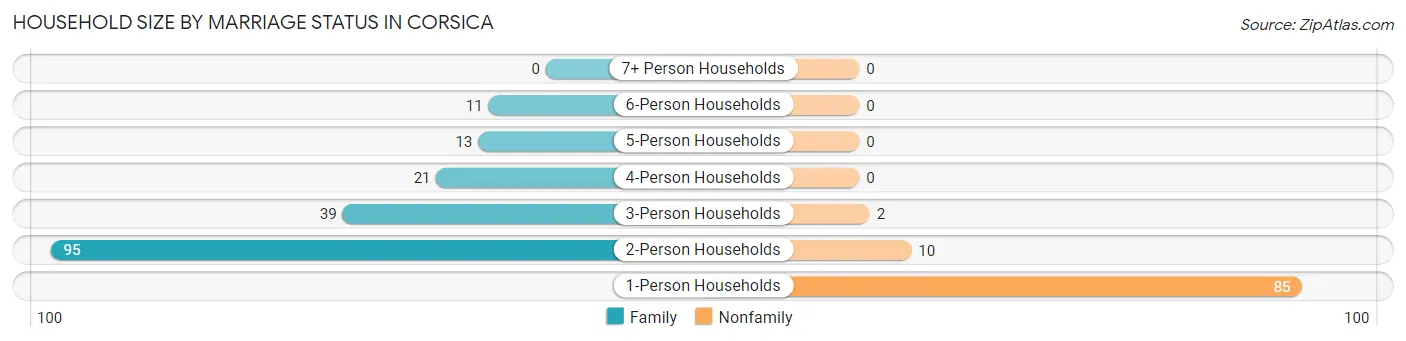
| Household Size | Family Households | Nonfamily Households |
| 1-Person Households | - | 85 (30.8%) |
| 2-Person Households | 95 (34.4%) | 10 (3.6%) |
| 3-Person Households | 39 (14.1%) | 2 (0.7%) |
| 4-Person Households | 21 (7.6%) | 0 (0.0%) |
| 5-Person Households | 13 (4.7%) | 0 (0.0%) |
| 6-Person Households | 11 (4.0%) | 0 (0.0%) |
| 7+ Person Households | 0 (0.0%) | 0 (0.0%) |
| Total | 179 (64.9%) | 97 (35.1%) |
Female Fertility in Corsica
Fertility by Age in Corsica
Average fertility rate in Corsica is 267.0 births per 1,000 women. Women in the age bracket of 15 to 19 years have the highest fertility rate with 1,000.0 births per 1,000 women. Women in the age bracket of 15 to 19 years acount for 48.6% of all women with births.
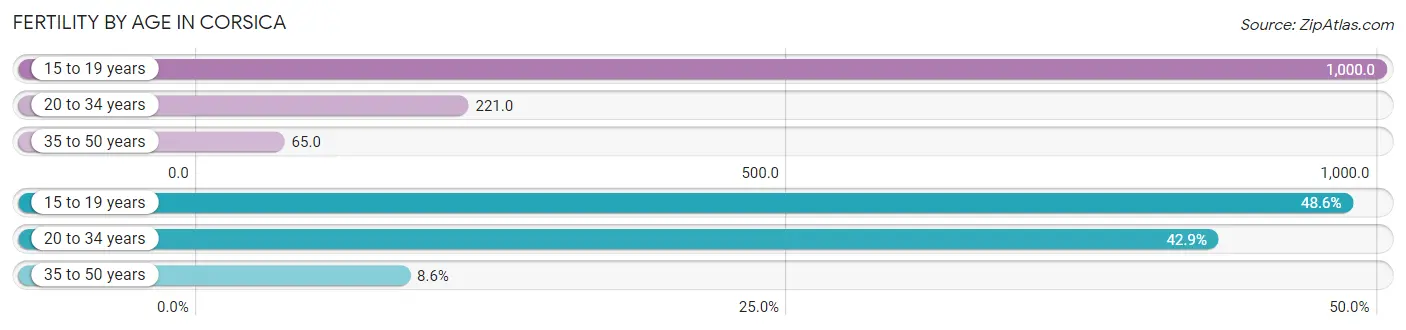
| Age Bracket | Women with Births | Births / 1,000 Women |
| 15 to 19 years | 17 (48.6%) | 1,000.0 |
| 20 to 34 years | 15 (42.9%) | 221.0 |
| 35 to 50 years | 3 (8.6%) | 65.0 |
| Total | 35 (100.0%) | 267.0 |
Fertility by Age by Marriage Status in Corsica
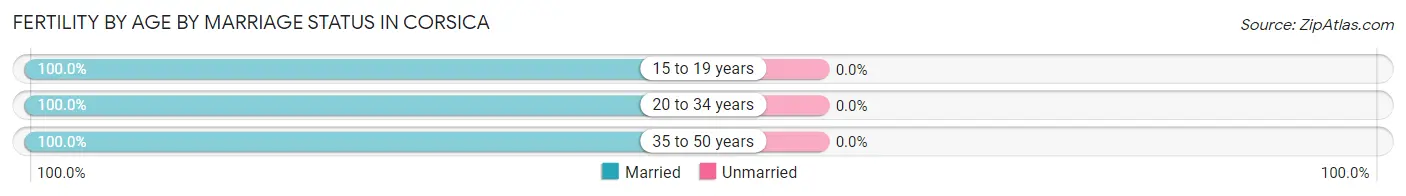
| Age Bracket | Married | Unmarried |
| 15 to 19 years | 17 (100.0%) | 0 (0.0%) |
| 20 to 34 years | 15 (100.0%) | 0 (0.0%) |
| 35 to 50 years | 3 (100.0%) | 0 (0.0%) |
| Total | 35 (100.0%) | 0 (0.0%) |
Fertility by Education in Corsica
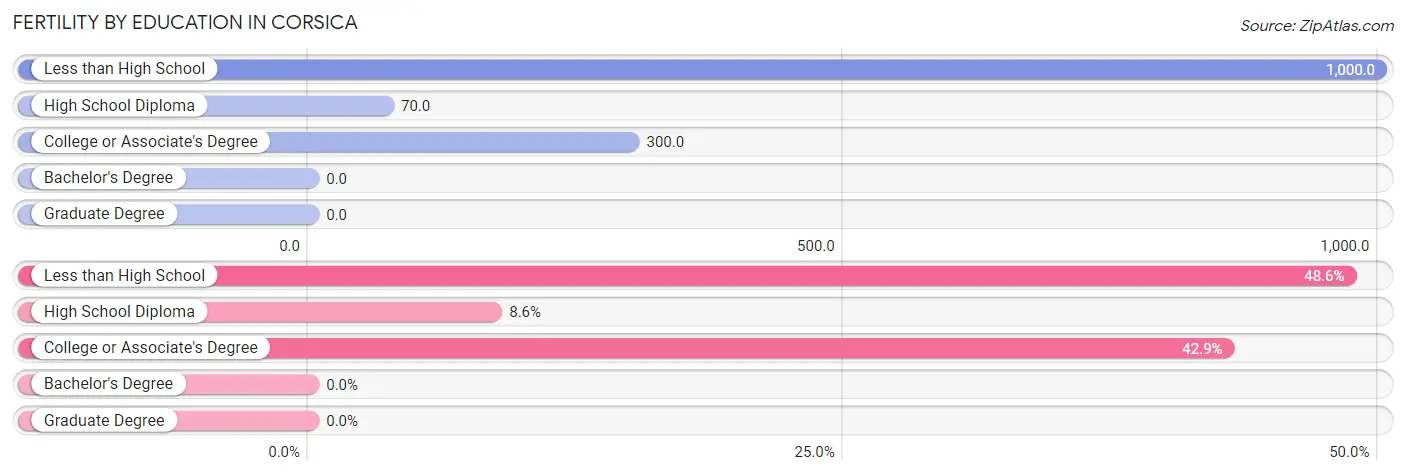
| Educational Attainment | Women with Births | Births / 1,000 Women |
| Less than High School | 17 (48.6%) | 1,000.0 |
| High School Diploma | 3 (8.6%) | 70.0 |
| College or Associate's Degree | 15 (42.9%) | 300.0 |
| Bachelor's Degree | 0 (0.0%) | 0.0 |
| Graduate Degree | 0 (0.0%) | 0.0 |
| Total | 35 (100.0%) | 267.0 |
Fertility by Education by Marriage Status in Corsica
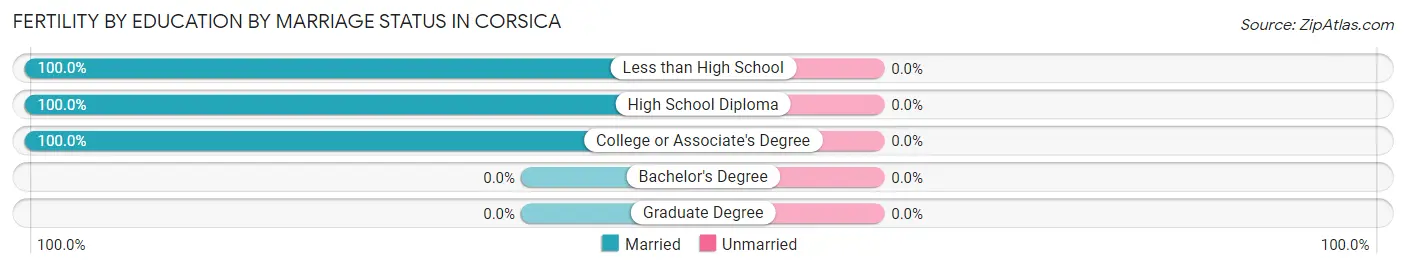
| Educational Attainment | Married | Unmarried |
| Less than High School | 17 (100.0%) | 0 (0.0%) |
| High School Diploma | 3 (100.0%) | 0 (0.0%) |
| College or Associate's Degree | 15 (100.0%) | 0 (0.0%) |
| Bachelor's Degree | 0 (0.0%) | 0 (0.0%) |
| Graduate Degree | 0 (0.0%) | 0 (0.0%) |
| Total | 35 (100.0%) | 0 (0.0%) |
Employment Characteristics in Corsica
Employment by Class of Employer in Corsica
Among the 354 employed individuals in Corsica, private company employees (171 | 48.3%), not-for-profit organizations (57 | 16.1%), and self-employed (incorporated) (41 | 11.6%) make up the most common classes of employment.
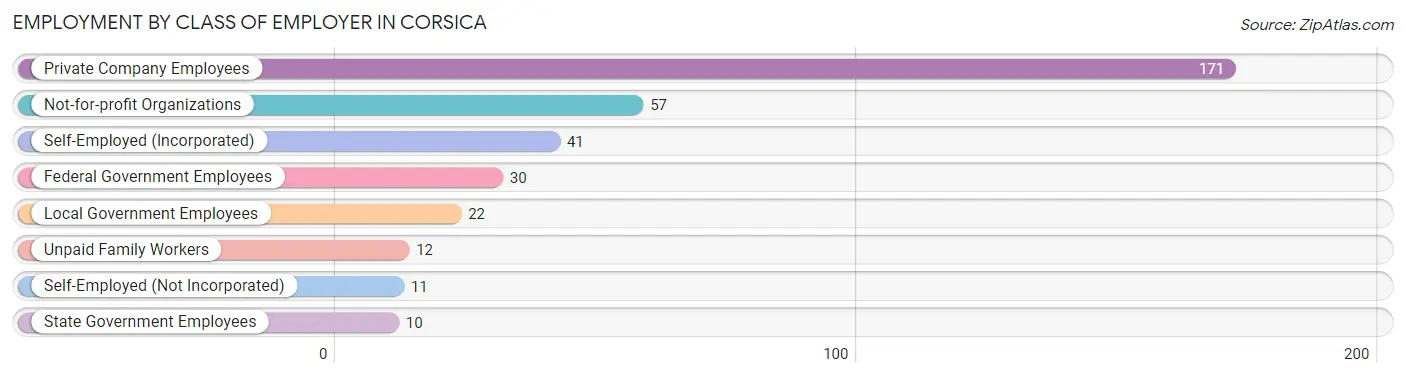
| Employer Class | # Employees | % Employees |
| Private Company Employees | 171 | 48.3% |
| Self-Employed (Incorporated) | 41 | 11.6% |
| Self-Employed (Not Incorporated) | 11 | 3.1% |
| Not-for-profit Organizations | 57 | 16.1% |
| Local Government Employees | 22 | 6.2% |
| State Government Employees | 10 | 2.8% |
| Federal Government Employees | 30 | 8.5% |
| Unpaid Family Workers | 12 | 3.4% |
| Total | 354 | 100.0% |
Employment Status by Age in Corsica
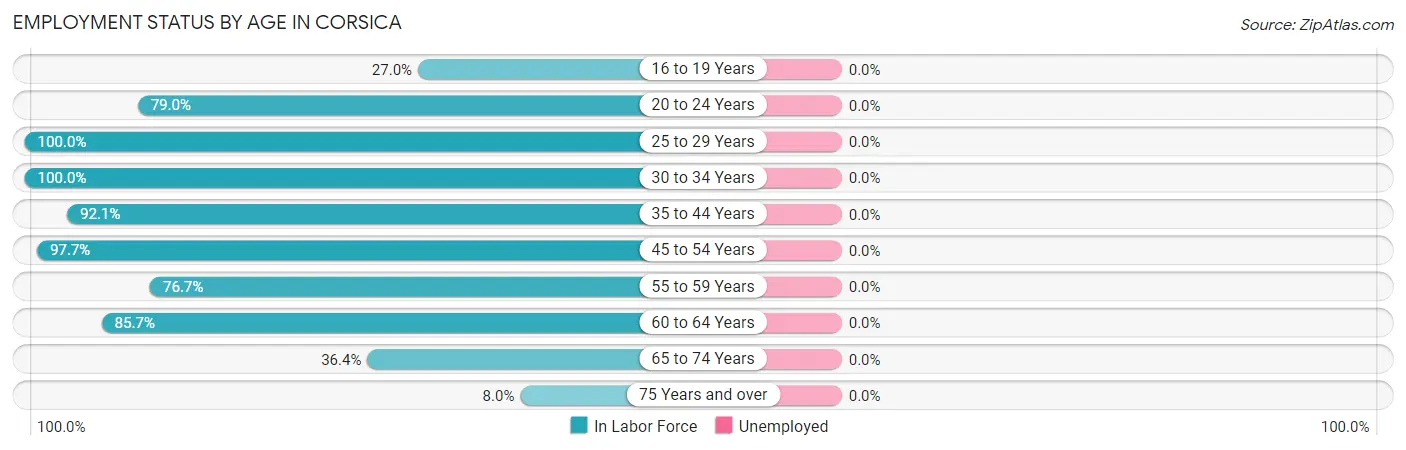
| Age Bracket | In Labor Force | Unemployed |
| 16 to 19 Years | 10 (27.0%) | 0 (0.0%) |
| 20 to 24 Years | 49 (79.0%) | 0 (0.0%) |
| 25 to 29 Years | 23 (100.0%) | 0 (0.0%) |
| 30 to 34 Years | 52 (100.0%) | 0 (0.0%) |
| 35 to 44 Years | 35 (92.1%) | 0 (0.0%) |
| 45 to 54 Years | 85 (97.7%) | 0 (0.0%) |
| 55 to 59 Years | 33 (76.7%) | 0 (0.0%) |
| 60 to 64 Years | 30 (85.7%) | 0 (0.0%) |
| 65 to 74 Years | 28 (36.4%) | 0 (0.0%) |
| 75 Years and over | 9 (8.0%) | 0 (0.0%) |
| Total | 354 (62.5%) | 0 (0.0%) |
Employment Status by Educational Attainment in Corsica
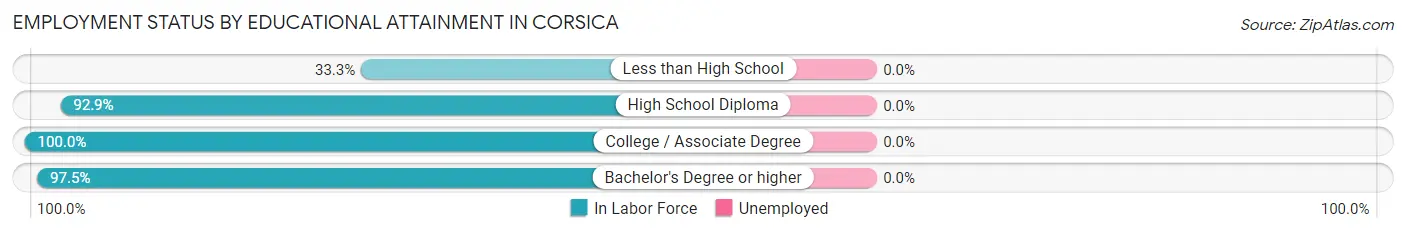
| Educational Attainment | In Labor Force | Unemployed |
| Less than High School | 5 (33.3%) | 0 (0.0%) |
| High School Diploma | 104 (92.9%) | 0 (0.0%) |
| College / Associate Degree | 70 (100.0%) | 0 (0.0%) |
| Bachelor's Degree or higher | 79 (97.5%) | 0 (0.0%) |
| Total | 258 (92.8%) | 0 (0.0%) |
Employment Occupations by Sex in Corsica
Management, Business, Science and Arts Occupations
The most common Management, Business, Science and Arts occupations in Corsica are Computers, Engineering & Science (42 | 11.9%), Community & Social Service (40 | 11.3%), Management (39 | 11.0%), Life, Physical & Social Science (30 | 8.5%), and Health Diagnosing & Treating (23 | 6.5%).
Management, Business, Science and Arts Occupations by Sex
Within the Management, Business, Science and Arts occupations in Corsica, the most male-oriented occupations are Life, Physical & Social Science (100.0%), Education, Arts & Media (94.4%), and Computers, Engineering & Science (73.8%), while the most female-oriented occupations are Health Diagnosing & Treating (100.0%), Health Technologists (100.0%), and Computers & Mathematics (91.7%).
| Occupation | Male | Female |
| Management | 28 (71.8%) | 11 (28.2%) |
| Business & Financial | 3 (42.9%) | 4 (57.1%) |
| Computers, Engineering & Science | 31 (73.8%) | 11 (26.2%) |
| Computers & Mathematics | 1 (8.3%) | 11 (91.7%) |
| Architecture & Engineering | 0 (0.0%) | 0 (0.0%) |
| Life, Physical & Social Science | 30 (100.0%) | 0 (0.0%) |
| Community & Social Service | 26 (65.0%) | 14 (35.0%) |
| Education, Arts & Media | 17 (94.4%) | 1 (5.6%) |
| Legal Services & Support | 0 (0.0%) | 0 (0.0%) |
| Education Instruction & Library | 9 (40.9%) | 13 (59.1%) |
| Arts, Media & Entertainment | 0 (0.0%) | 0 (0.0%) |
| Health Diagnosing & Treating | 0 (0.0%) | 23 (100.0%) |
| Health Technologists | 0 (0.0%) | 18 (100.0%) |
| Total (Category) | 88 (58.3%) | 63 (41.7%) |
| Total (Overall) | 190 (53.7%) | 164 (46.3%) |
Services Occupations
The most common Services occupations in Corsica are Healthcare Support (39 | 11.0%), and Food Preparation & Serving (14 | 4.0%).
Services Occupations by Sex
| Occupation | Male | Female |
| Healthcare Support | 0 (0.0%) | 39 (100.0%) |
| Security & Protection | 0 (0.0%) | 0 (0.0%) |
| Firefighting & Prevention | 0 (0.0%) | 0 (0.0%) |
| Law Enforcement | 0 (0.0%) | 0 (0.0%) |
| Food Preparation & Serving | 9 (64.3%) | 5 (35.7%) |
| Cleaning & Maintenance | 0 (0.0%) | 0 (0.0%) |
| Personal Care & Service | 0 (0.0%) | 0 (0.0%) |
| Total (Category) | 9 (17.0%) | 44 (83.0%) |
| Total (Overall) | 190 (53.7%) | 164 (46.3%) |
Sales and Office Occupations
The most common Sales and Office occupations in Corsica are Office & Administration (36 | 10.2%), and Sales & Related (24 | 6.8%).
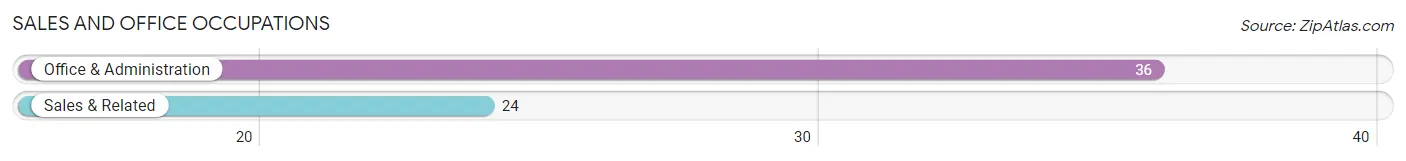
Sales and Office Occupations by Sex
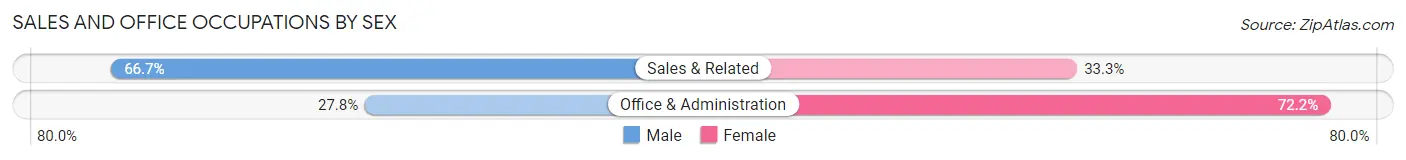
| Occupation | Male | Female |
| Sales & Related | 16 (66.7%) | 8 (33.3%) |
| Office & Administration | 10 (27.8%) | 26 (72.2%) |
| Total (Category) | 26 (43.3%) | 34 (56.7%) |
| Total (Overall) | 190 (53.7%) | 164 (46.3%) |
Natural Resources, Construction and Maintenance Occupations
The most common Natural Resources, Construction and Maintenance occupations in Corsica are Construction & Extraction (28 | 7.9%), Farming, Fishing & Forestry (26 | 7.3%), and Installation, Maintenance & Repair (9 | 2.5%).
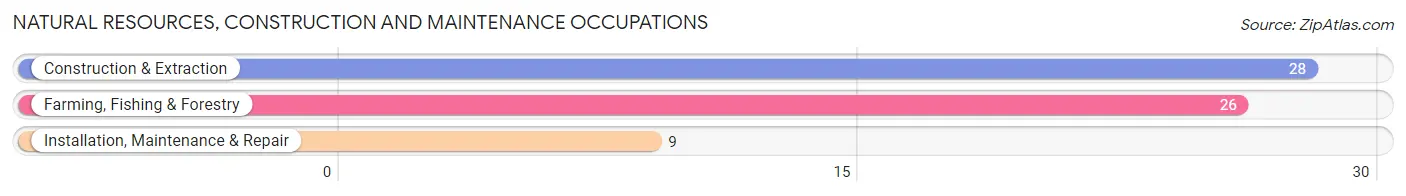
Natural Resources, Construction and Maintenance Occupations by Sex
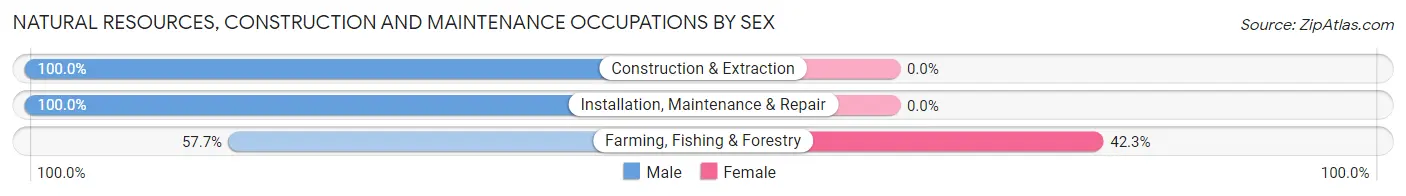
| Occupation | Male | Female |
| Farming, Fishing & Forestry | 15 (57.7%) | 11 (42.3%) |
| Construction & Extraction | 28 (100.0%) | 0 (0.0%) |
| Installation, Maintenance & Repair | 9 (100.0%) | 0 (0.0%) |
| Total (Category) | 52 (82.5%) | 11 (17.5%) |
| Total (Overall) | 190 (53.7%) | 164 (46.3%) |
Production, Transportation and Moving Occupations
The most common Production, Transportation and Moving occupations in Corsica are Production (12 | 3.4%), Transportation (8 | 2.3%), and Material Moving (7 | 2.0%).
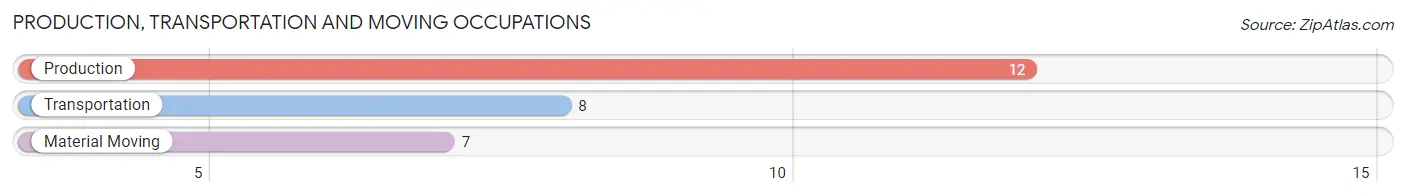
Production, Transportation and Moving Occupations by Sex
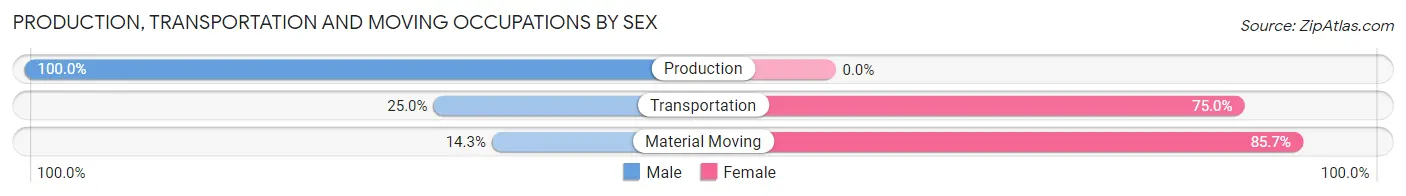
| Occupation | Male | Female |
| Production | 12 (100.0%) | 0 (0.0%) |
| Transportation | 2 (25.0%) | 6 (75.0%) |
| Material Moving | 1 (14.3%) | 6 (85.7%) |
| Total (Category) | 15 (55.6%) | 12 (44.4%) |
| Total (Overall) | 190 (53.7%) | 164 (46.3%) |
Employment Industries by Sex in Corsica
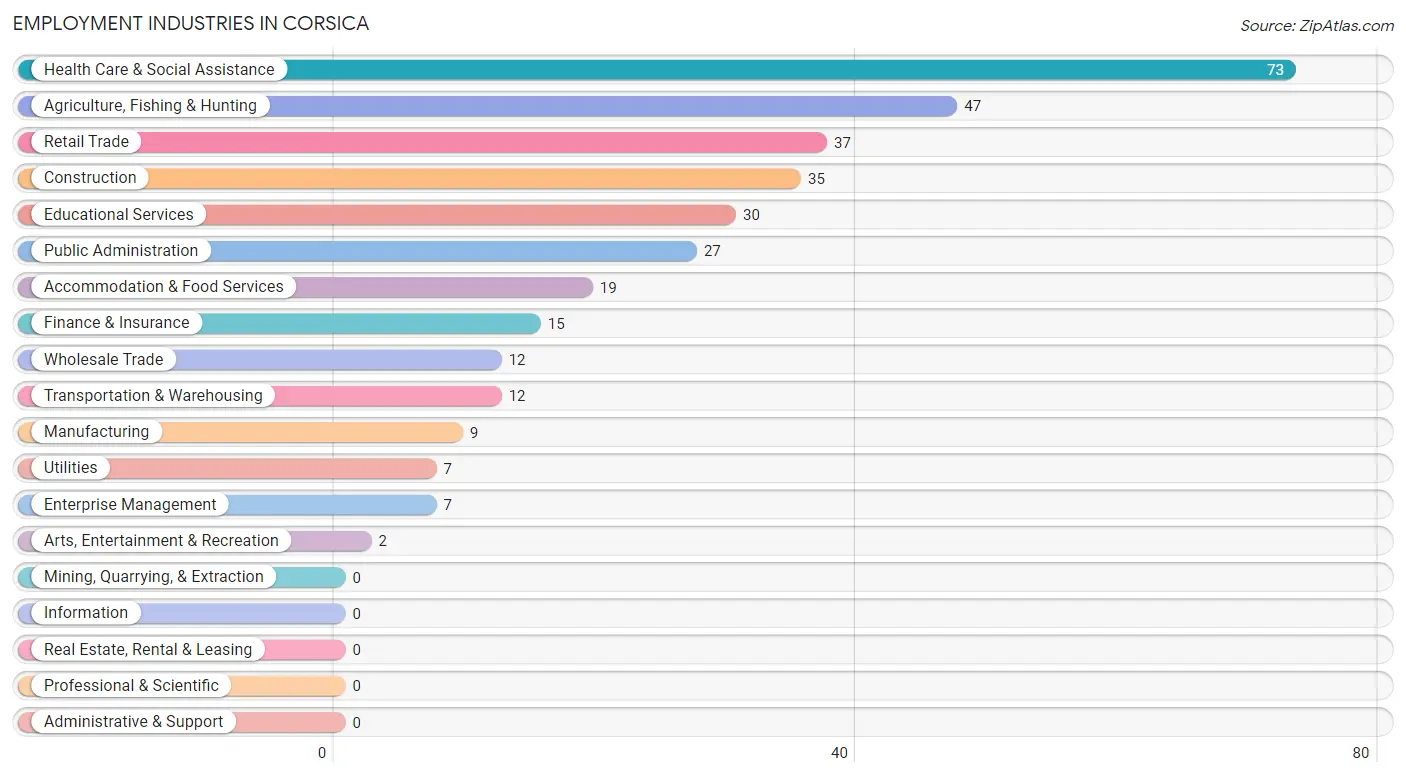
Employment Industries in Corsica
The major employment industries in Corsica include Health Care & Social Assistance (73 | 20.6%), Agriculture, Fishing & Hunting (47 | 13.3%), Retail Trade (37 | 10.4%), Construction (35 | 9.9%), and Educational Services (30 | 8.5%).
Employment Industries by Sex in Corsica
The Corsica industries that see more men than women are Construction (100.0%), Utilities (100.0%), and Arts, Entertainment & Recreation (100.0%), whereas the industries that tend to have a higher number of women are Finance & Insurance (100.0%), Accommodation & Food Services (100.0%), and Health Care & Social Assistance (97.3%).
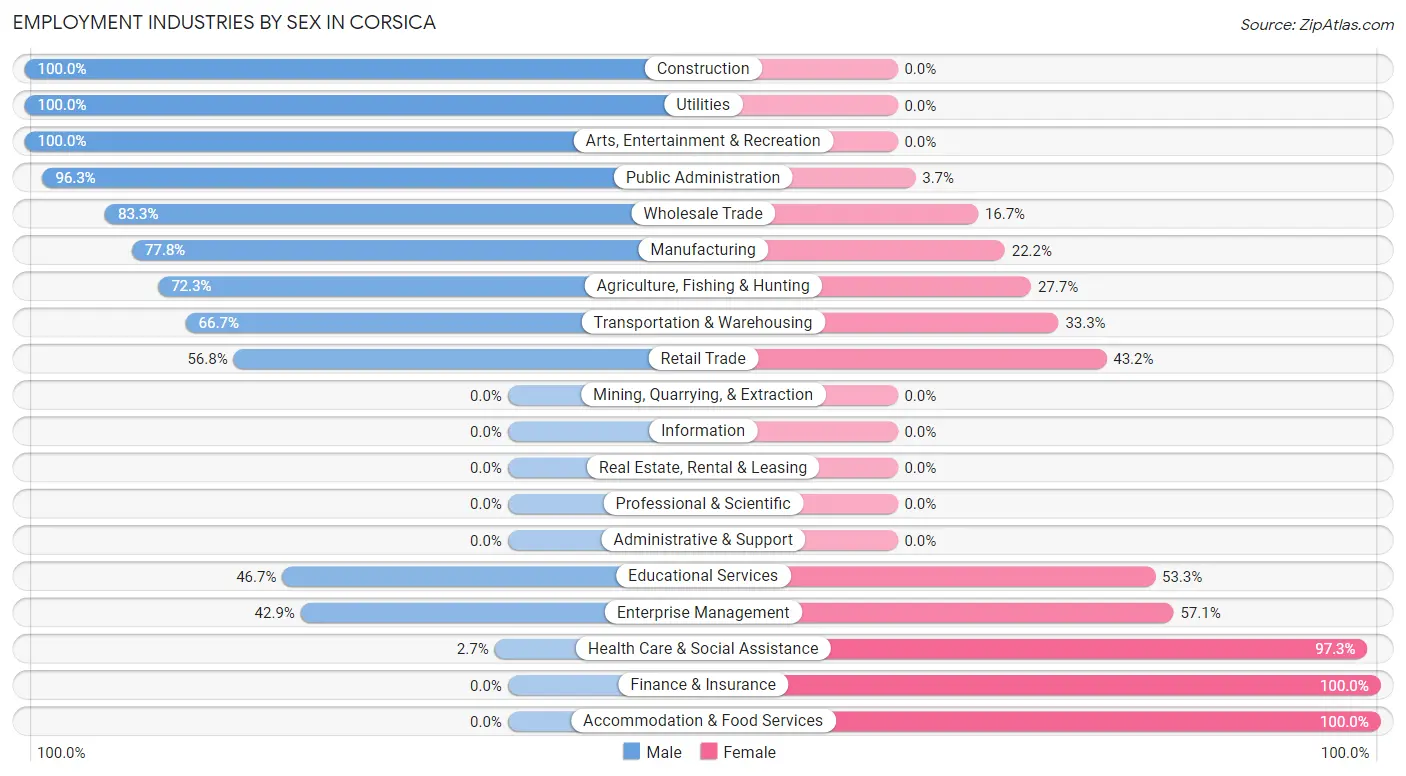
| Industry | Male | Female |
| Agriculture, Fishing & Hunting | 34 (72.3%) | 13 (27.7%) |
| Mining, Quarrying, & Extraction | 0 (0.0%) | 0 (0.0%) |
| Construction | 35 (100.0%) | 0 (0.0%) |
| Manufacturing | 7 (77.8%) | 2 (22.2%) |
| Wholesale Trade | 10 (83.3%) | 2 (16.7%) |
| Retail Trade | 21 (56.8%) | 16 (43.2%) |
| Transportation & Warehousing | 8 (66.7%) | 4 (33.3%) |
| Utilities | 7 (100.0%) | 0 (0.0%) |
| Information | 0 (0.0%) | 0 (0.0%) |
| Finance & Insurance | 0 (0.0%) | 15 (100.0%) |
| Real Estate, Rental & Leasing | 0 (0.0%) | 0 (0.0%) |
| Professional & Scientific | 0 (0.0%) | 0 (0.0%) |
| Enterprise Management | 3 (42.9%) | 4 (57.1%) |
| Administrative & Support | 0 (0.0%) | 0 (0.0%) |
| Educational Services | 14 (46.7%) | 16 (53.3%) |
| Health Care & Social Assistance | 2 (2.7%) | 71 (97.3%) |
| Arts, Entertainment & Recreation | 2 (100.0%) | 0 (0.0%) |
| Accommodation & Food Services | 0 (0.0%) | 19 (100.0%) |
| Public Administration | 26 (96.3%) | 1 (3.7%) |
| Total | 190 (53.7%) | 164 (46.3%) |
Education in Corsica
School Enrollment in Corsica
The most common levels of schooling among the 93 students in Corsica are high school (31 | 33.3%), middle school (21 | 22.6%), and elementary school (11 | 11.8%).
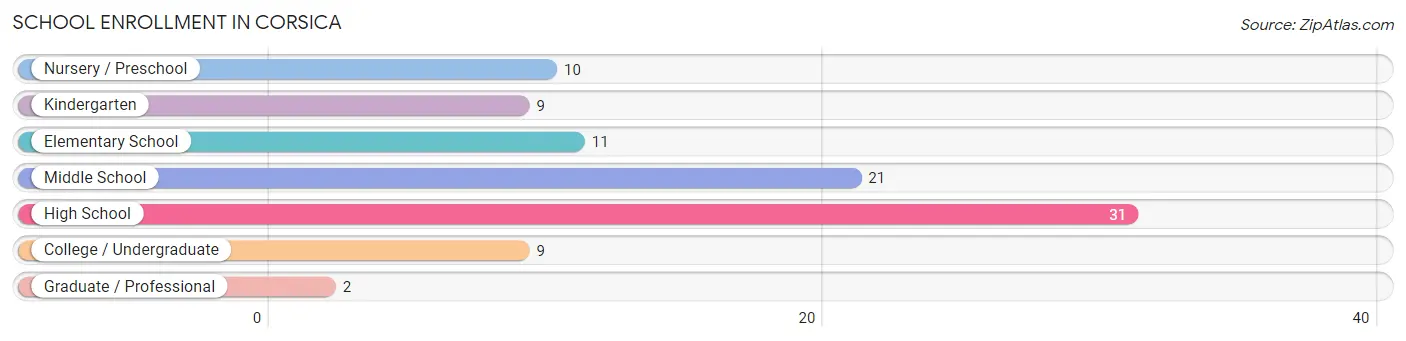
| School Level | # Students | % Students |
| Nursery / Preschool | 10 | 10.7% |
| Kindergarten | 9 | 9.7% |
| Elementary School | 11 | 11.8% |
| Middle School | 21 | 22.6% |
| High School | 31 | 33.3% |
| College / Undergraduate | 9 | 9.7% |
| Graduate / Professional | 2 | 2.1% |
| Total | 93 | 100.0% |
School Enrollment by Age by Funding Source in Corsica
Out of a total of 93 students who are enrolled in schools in Corsica, 6 (6.5%) attend a private institution, while the remaining 87 (93.5%) are enrolled in public schools. The age group of 10 to 14 year olds has the highest likelihood of being enrolled in private schools, with 4 (16.7% in the age bracket) enrolled. Conversely, the age group of 15 to 17 year olds has the lowest likelihood of being enrolled in a private school, with 21 (100.0% in the age bracket) attending a public institution.
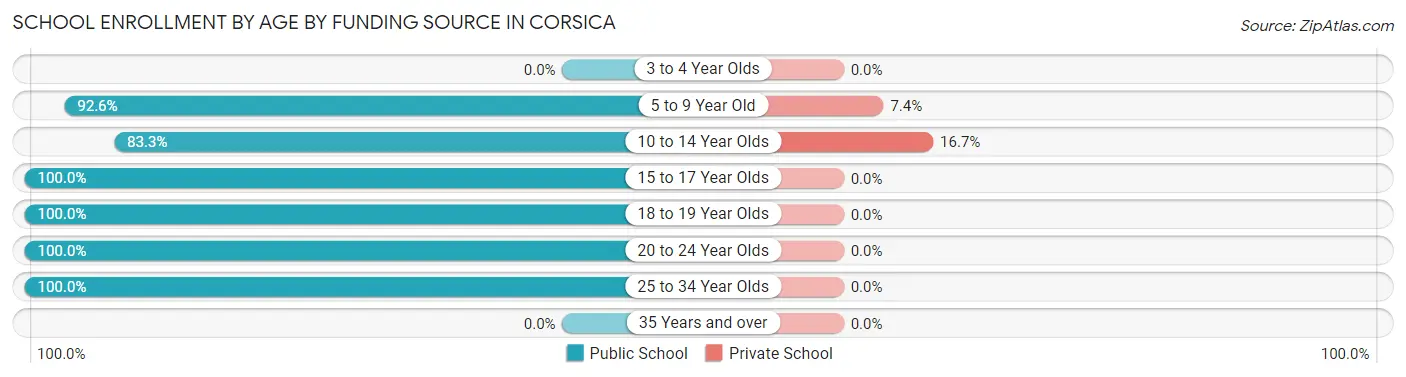
| Age Bracket | Public School | Private School |
| 3 to 4 Year Olds | 0 (0.0%) | 0 (0.0%) |
| 5 to 9 Year Old | 25 (92.6%) | 2 (7.4%) |
| 10 to 14 Year Olds | 20 (83.3%) | 4 (16.7%) |
| 15 to 17 Year Olds | 21 (100.0%) | 0 (0.0%) |
| 18 to 19 Year Olds | 10 (100.0%) | 0 (0.0%) |
| 20 to 24 Year Olds | 5 (100.0%) | 0 (0.0%) |
| 25 to 34 Year Olds | 6 (100.0%) | 0 (0.0%) |
| 35 Years and over | 0 (0.0%) | 0 (0.0%) |
| Total | 87 (93.5%) | 6 (6.5%) |
Educational Attainment by Field of Study in Corsica
Education (36 | 30.2%), business (23 | 19.3%), science & technology (18 | 15.1%), liberal arts & history (17 | 14.3%), and bio, nature & agricultural (9 | 7.6%) are the most common fields of study among 119 individuals in Corsica who have obtained a bachelor's degree or higher.
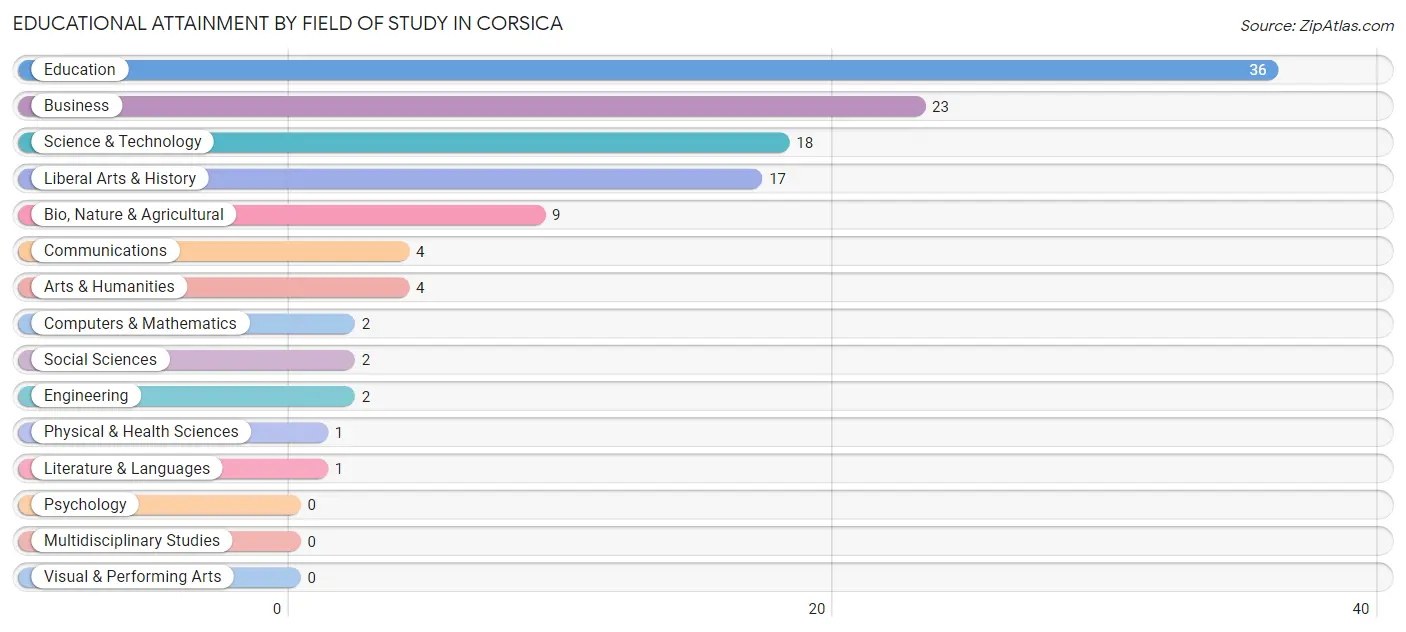
| Field of Study | # Graduates | % Graduates |
| Computers & Mathematics | 2 | 1.7% |
| Bio, Nature & Agricultural | 9 | 7.6% |
| Physical & Health Sciences | 1 | 0.8% |
| Psychology | 0 | 0.0% |
| Social Sciences | 2 | 1.7% |
| Engineering | 2 | 1.7% |
| Multidisciplinary Studies | 0 | 0.0% |
| Science & Technology | 18 | 15.1% |
| Business | 23 | 19.3% |
| Education | 36 | 30.2% |
| Literature & Languages | 1 | 0.8% |
| Liberal Arts & History | 17 | 14.3% |
| Visual & Performing Arts | 0 | 0.0% |
| Communications | 4 | 3.4% |
| Arts & Humanities | 4 | 3.4% |
| Total | 119 | 100.0% |
Transportation & Commute in Corsica
Vehicle Availability by Sex in Corsica
The most prevalent vehicle ownership categories in Corsica are males with 3 vehicles (66, accounting for 34.7%) and females with 3 vehicles (46, making up 41.8%).
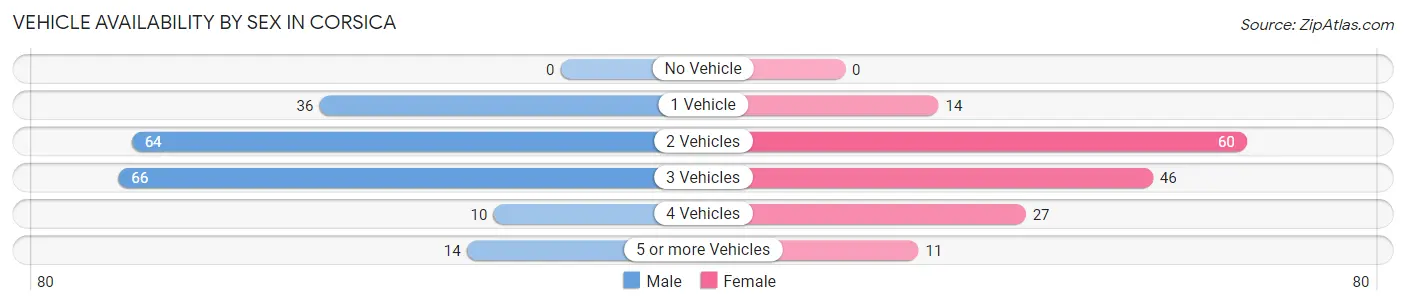
| Vehicles Available | Male | Female |
| No Vehicle | 0 (0.0%) | 0 (0.0%) |
| 1 Vehicle | 36 (19.0%) | 14 (8.9%) |
| 2 Vehicles | 64 (33.7%) | 60 (38.0%) |
| 3 Vehicles | 66 (34.7%) | 46 (29.1%) |
| 4 Vehicles | 10 (5.3%) | 27 (17.1%) |
| 5 or more Vehicles | 14 (7.4%) | 11 (7.0%) |
| Total | 190 (100.0%) | 158 (100.0%) |
Commute Time in Corsica
The most frequently occuring commute durations in Corsica are 5 to 9 minutes (97 commuters, 28.4%), less than 5 minutes (89 commuters, 26.0%), and 10 to 14 minutes (31 commuters, 9.1%).
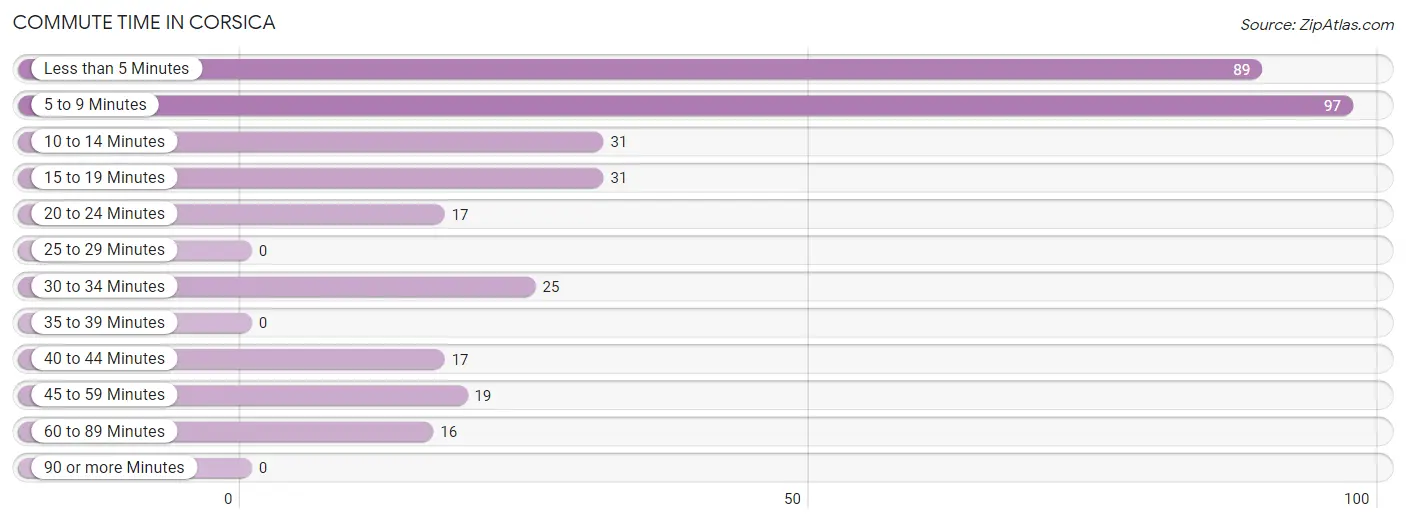
| Commute Time | # Commuters | % Commuters |
| Less than 5 Minutes | 89 | 26.0% |
| 5 to 9 Minutes | 97 | 28.4% |
| 10 to 14 Minutes | 31 | 9.1% |
| 15 to 19 Minutes | 31 | 9.1% |
| 20 to 24 Minutes | 17 | 5.0% |
| 25 to 29 Minutes | 0 | 0.0% |
| 30 to 34 Minutes | 25 | 7.3% |
| 35 to 39 Minutes | 0 | 0.0% |
| 40 to 44 Minutes | 17 | 5.0% |
| 45 to 59 Minutes | 19 | 5.6% |
| 60 to 89 Minutes | 16 | 4.7% |
| 90 or more Minutes | 0 | 0.0% |
Commute Time by Sex in Corsica
The most common commute times in Corsica are 5 to 9 minutes (64 commuters, 34.0%) for males and 5 to 9 minutes (33 commuters, 21.4%) for females.
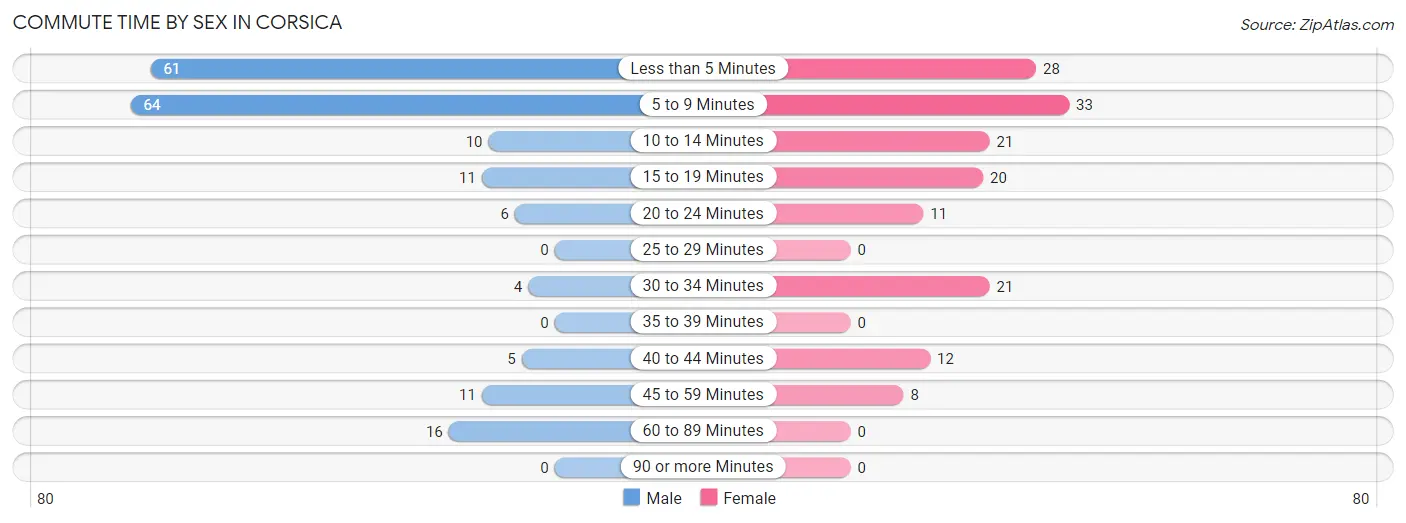
| Commute Time | Male | Female |
| Less than 5 Minutes | 61 (32.5%) | 28 (18.2%) |
| 5 to 9 Minutes | 64 (34.0%) | 33 (21.4%) |
| 10 to 14 Minutes | 10 (5.3%) | 21 (13.6%) |
| 15 to 19 Minutes | 11 (5.9%) | 20 (13.0%) |
| 20 to 24 Minutes | 6 (3.2%) | 11 (7.1%) |
| 25 to 29 Minutes | 0 (0.0%) | 0 (0.0%) |
| 30 to 34 Minutes | 4 (2.1%) | 21 (13.6%) |
| 35 to 39 Minutes | 0 (0.0%) | 0 (0.0%) |
| 40 to 44 Minutes | 5 (2.7%) | 12 (7.8%) |
| 45 to 59 Minutes | 11 (5.9%) | 8 (5.2%) |
| 60 to 89 Minutes | 16 (8.5%) | 0 (0.0%) |
| 90 or more Minutes | 0 (0.0%) | 0 (0.0%) |
Time of Departure to Work by Sex in Corsica
The most frequent times of departure to work in Corsica are 7:30 AM to 7:59 AM (41, 21.8%) for males and 7:30 AM to 7:59 AM (54, 35.1%) for females.
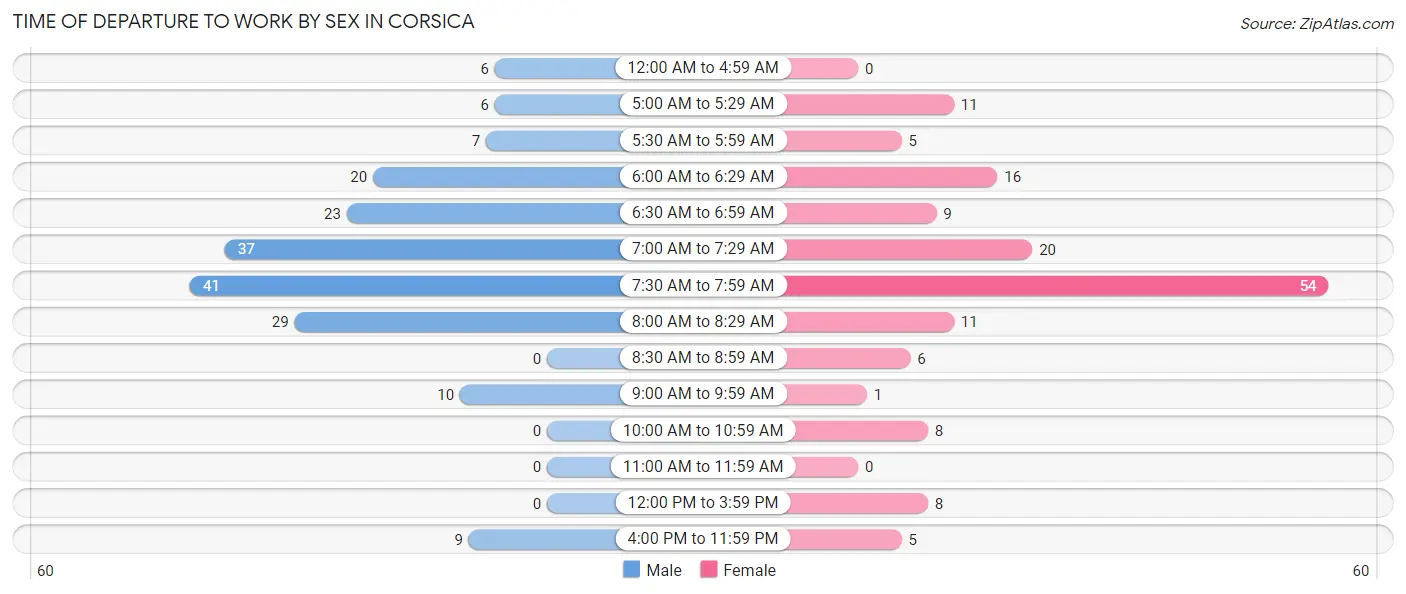
| Time of Departure | Male | Female |
| 12:00 AM to 4:59 AM | 6 (3.2%) | 0 (0.0%) |
| 5:00 AM to 5:29 AM | 6 (3.2%) | 11 (7.1%) |
| 5:30 AM to 5:59 AM | 7 (3.7%) | 5 (3.3%) |
| 6:00 AM to 6:29 AM | 20 (10.6%) | 16 (10.4%) |
| 6:30 AM to 6:59 AM | 23 (12.2%) | 9 (5.8%) |
| 7:00 AM to 7:29 AM | 37 (19.7%) | 20 (13.0%) |
| 7:30 AM to 7:59 AM | 41 (21.8%) | 54 (35.1%) |
| 8:00 AM to 8:29 AM | 29 (15.4%) | 11 (7.1%) |
| 8:30 AM to 8:59 AM | 0 (0.0%) | 6 (3.9%) |
| 9:00 AM to 9:59 AM | 10 (5.3%) | 1 (0.6%) |
| 10:00 AM to 10:59 AM | 0 (0.0%) | 8 (5.2%) |
| 11:00 AM to 11:59 AM | 0 (0.0%) | 0 (0.0%) |
| 12:00 PM to 3:59 PM | 0 (0.0%) | 8 (5.2%) |
| 4:00 PM to 11:59 PM | 9 (4.8%) | 5 (3.3%) |
| Total | 188 (100.0%) | 154 (100.0%) |
Housing Occupancy in Corsica
Occupancy by Ownership in Corsica
Of the total 276 dwellings in Corsica, owner-occupied units account for 203 (73.6%), while renter-occupied units make up 73 (26.5%).
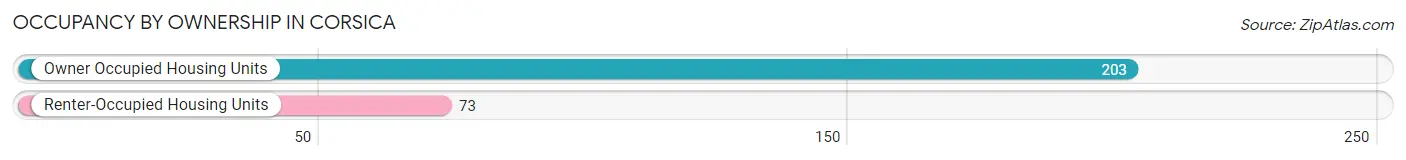
| Occupancy | # Housing Units | % Housing Units |
| Owner Occupied Housing Units | 203 | 73.6% |
| Renter-Occupied Housing Units | 73 | 26.5% |
| Total Occupied Housing Units | 276 | 100.0% |
Occupancy by Household Size in Corsica
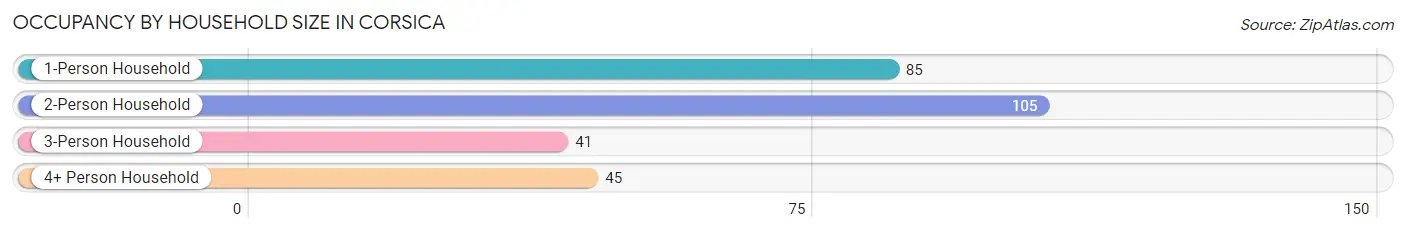
| Household Size | # Housing Units | % Housing Units |
| 1-Person Household | 85 | 30.8% |
| 2-Person Household | 105 | 38.0% |
| 3-Person Household | 41 | 14.9% |
| 4+ Person Household | 45 | 16.3% |
| Total Housing Units | 276 | 100.0% |
Occupancy by Ownership by Household Size in Corsica
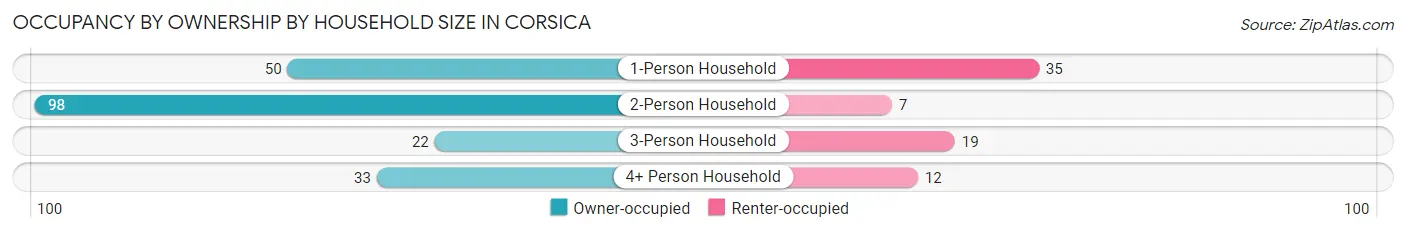
| Household Size | Owner-occupied | Renter-occupied |
| 1-Person Household | 50 (58.8%) | 35 (41.2%) |
| 2-Person Household | 98 (93.3%) | 7 (6.7%) |
| 3-Person Household | 22 (53.7%) | 19 (46.3%) |
| 4+ Person Household | 33 (73.3%) | 12 (26.7%) |
| Total Housing Units | 203 (73.6%) | 73 (26.5%) |
Occupancy by Educational Attainment in Corsica
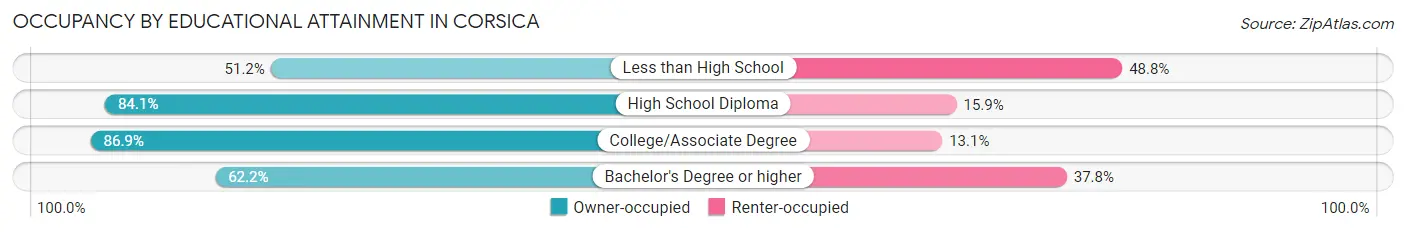
| Household Size | Owner-occupied | Renter-occupied |
| Less than High School | 21 (51.2%) | 20 (48.8%) |
| High School Diploma | 58 (84.1%) | 11 (15.9%) |
| College/Associate Degree | 73 (86.9%) | 11 (13.1%) |
| Bachelor's Degree or higher | 51 (62.2%) | 31 (37.8%) |
Occupancy by Age of Householder in Corsica
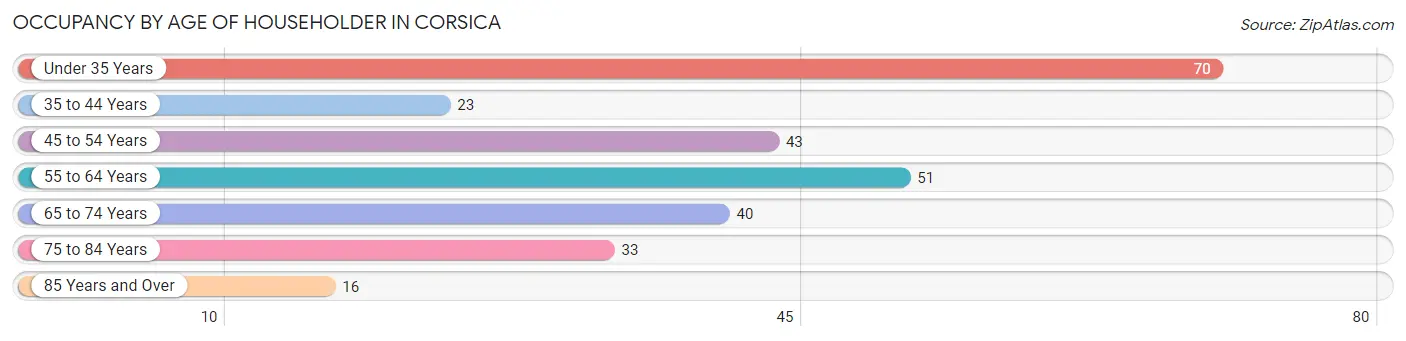
| Age Bracket | # Households | % Households |
| Under 35 Years | 70 | 25.4% |
| 35 to 44 Years | 23 | 8.3% |
| 45 to 54 Years | 43 | 15.6% |
| 55 to 64 Years | 51 | 18.5% |
| 65 to 74 Years | 40 | 14.5% |
| 75 to 84 Years | 33 | 12.0% |
| 85 Years and Over | 16 | 5.8% |
| Total | 276 | 100.0% |
Housing Finances in Corsica
Median Income by Occupancy in Corsica
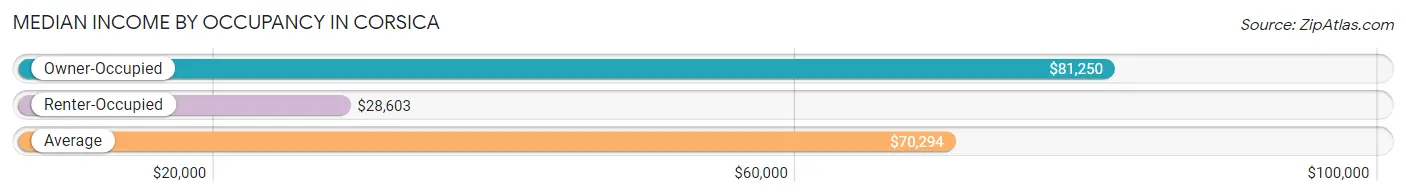
| Occupancy Type | # Households | Median Income |
| Owner-Occupied | 203 (73.6%) | $81,250 |
| Renter-Occupied | 73 (26.5%) | $28,603 |
| Average | 276 (100.0%) | $70,294 |
Occupancy by Householder Income Bracket in Corsica
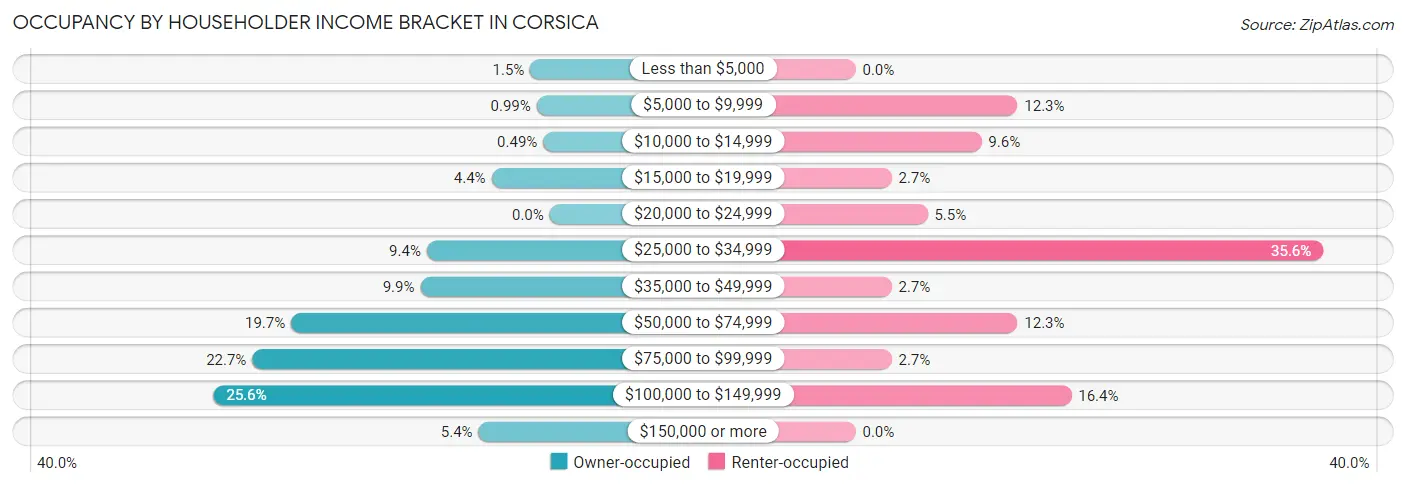
| Income Bracket | Owner-occupied | Renter-occupied |
| Less than $5,000 | 3 (1.5%) | 0 (0.0%) |
| $5,000 to $9,999 | 2 (1.0%) | 9 (12.3%) |
| $10,000 to $14,999 | 1 (0.5%) | 7 (9.6%) |
| $15,000 to $19,999 | 9 (4.4%) | 2 (2.7%) |
| $20,000 to $24,999 | 0 (0.0%) | 4 (5.5%) |
| $25,000 to $34,999 | 19 (9.4%) | 26 (35.6%) |
| $35,000 to $49,999 | 20 (9.9%) | 2 (2.7%) |
| $50,000 to $74,999 | 40 (19.7%) | 9 (12.3%) |
| $75,000 to $99,999 | 46 (22.7%) | 2 (2.7%) |
| $100,000 to $149,999 | 52 (25.6%) | 12 (16.4%) |
| $150,000 or more | 11 (5.4%) | 0 (0.0%) |
| Total | 203 (100.0%) | 73 (100.0%) |
Monthly Housing Cost Tiers in Corsica
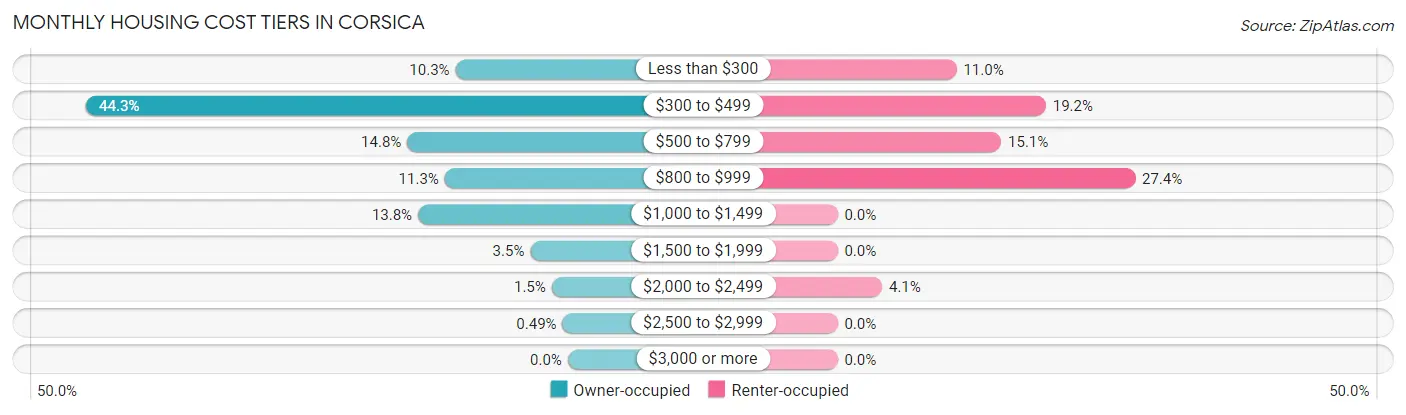
| Monthly Cost | Owner-occupied | Renter-occupied |
| Less than $300 | 21 (10.3%) | 8 (11.0%) |
| $300 to $499 | 90 (44.3%) | 14 (19.2%) |
| $500 to $799 | 30 (14.8%) | 11 (15.1%) |
| $800 to $999 | 23 (11.3%) | 20 (27.4%) |
| $1,000 to $1,499 | 28 (13.8%) | 0 (0.0%) |
| $1,500 to $1,999 | 7 (3.5%) | 0 (0.0%) |
| $2,000 to $2,499 | 3 (1.5%) | 3 (4.1%) |
| $2,500 to $2,999 | 1 (0.5%) | 0 (0.0%) |
| $3,000 or more | 0 (0.0%) | 0 (0.0%) |
| Total | 203 (100.0%) | 73 (100.0%) |
Physical Housing Characteristics in Corsica
Housing Structures in Corsica
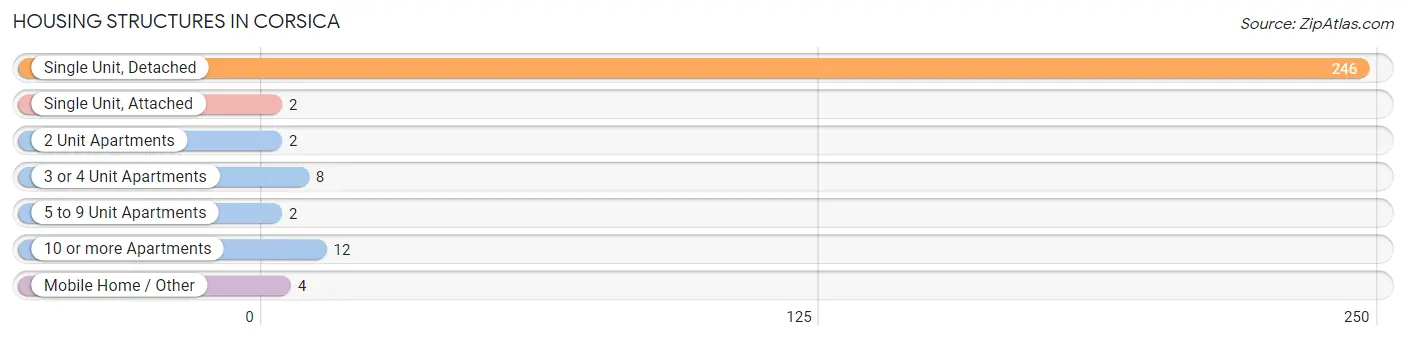
| Structure Type | # Housing Units | % Housing Units |
| Single Unit, Detached | 246 | 89.1% |
| Single Unit, Attached | 2 | 0.7% |
| 2 Unit Apartments | 2 | 0.7% |
| 3 or 4 Unit Apartments | 8 | 2.9% |
| 5 to 9 Unit Apartments | 2 | 0.7% |
| 10 or more Apartments | 12 | 4.3% |
| Mobile Home / Other | 4 | 1.5% |
| Total | 276 | 100.0% |
Housing Structures by Occupancy in Corsica
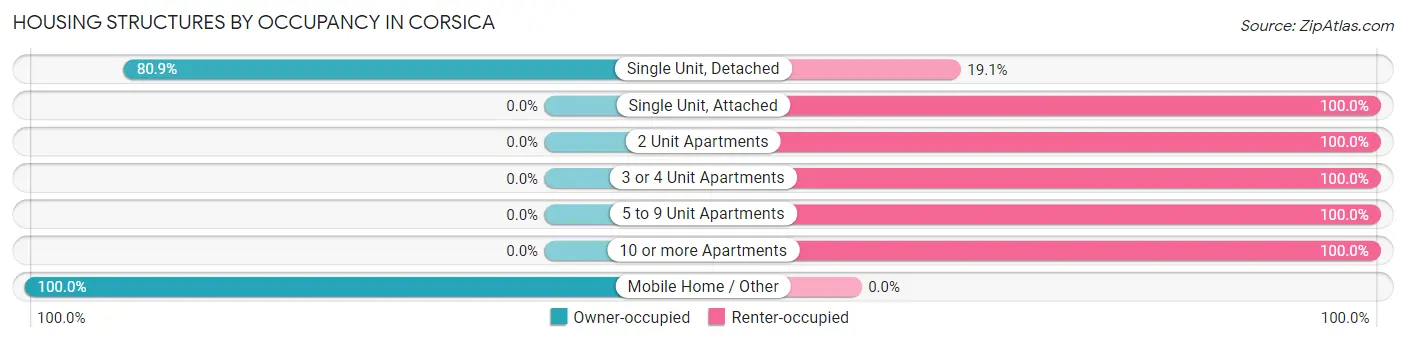
| Structure Type | Owner-occupied | Renter-occupied |
| Single Unit, Detached | 199 (80.9%) | 47 (19.1%) |
| Single Unit, Attached | 0 (0.0%) | 2 (100.0%) |
| 2 Unit Apartments | 0 (0.0%) | 2 (100.0%) |
| 3 or 4 Unit Apartments | 0 (0.0%) | 8 (100.0%) |
| 5 to 9 Unit Apartments | 0 (0.0%) | 2 (100.0%) |
| 10 or more Apartments | 0 (0.0%) | 12 (100.0%) |
| Mobile Home / Other | 4 (100.0%) | 0 (0.0%) |
| Total | 203 (73.6%) | 73 (26.5%) |
Housing Structures by Number of Rooms in Corsica
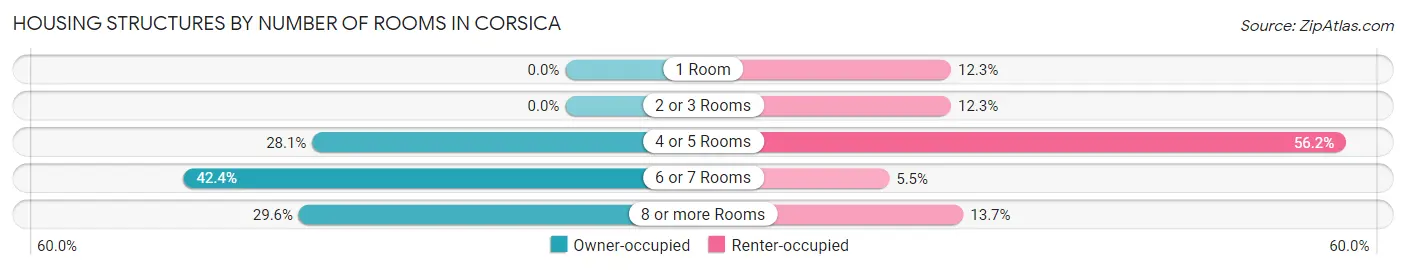
| Number of Rooms | Owner-occupied | Renter-occupied |
| 1 Room | 0 (0.0%) | 9 (12.3%) |
| 2 or 3 Rooms | 0 (0.0%) | 9 (12.3%) |
| 4 or 5 Rooms | 57 (28.1%) | 41 (56.2%) |
| 6 or 7 Rooms | 86 (42.4%) | 4 (5.5%) |
| 8 or more Rooms | 60 (29.6%) | 10 (13.7%) |
| Total | 203 (100.0%) | 73 (100.0%) |
Housing Structure by Heating Type in Corsica
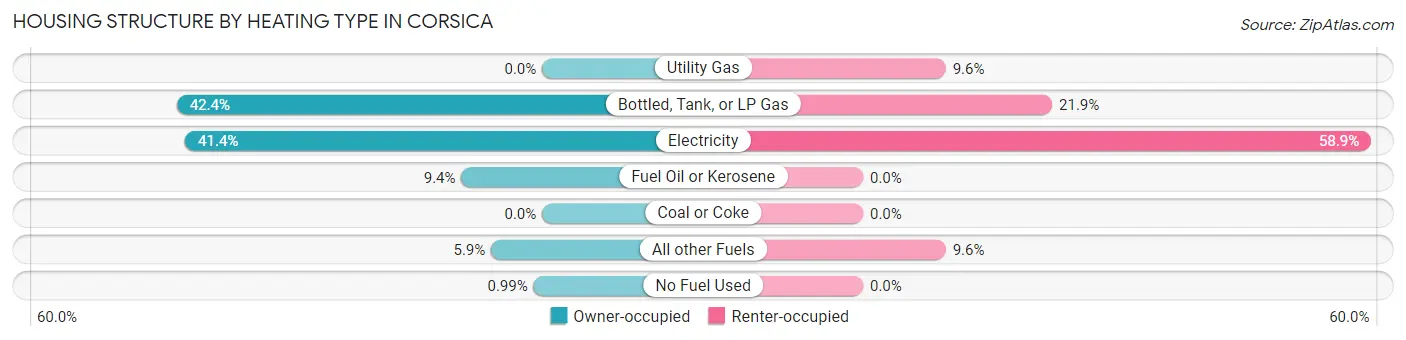
| Heating Type | Owner-occupied | Renter-occupied |
| Utility Gas | 0 (0.0%) | 7 (9.6%) |
| Bottled, Tank, or LP Gas | 86 (42.4%) | 16 (21.9%) |
| Electricity | 84 (41.4%) | 43 (58.9%) |
| Fuel Oil or Kerosene | 19 (9.4%) | 0 (0.0%) |
| Coal or Coke | 0 (0.0%) | 0 (0.0%) |
| All other Fuels | 12 (5.9%) | 7 (9.6%) |
| No Fuel Used | 2 (1.0%) | 0 (0.0%) |
| Total | 203 (100.0%) | 73 (100.0%) |
Household Vehicle Usage in Corsica
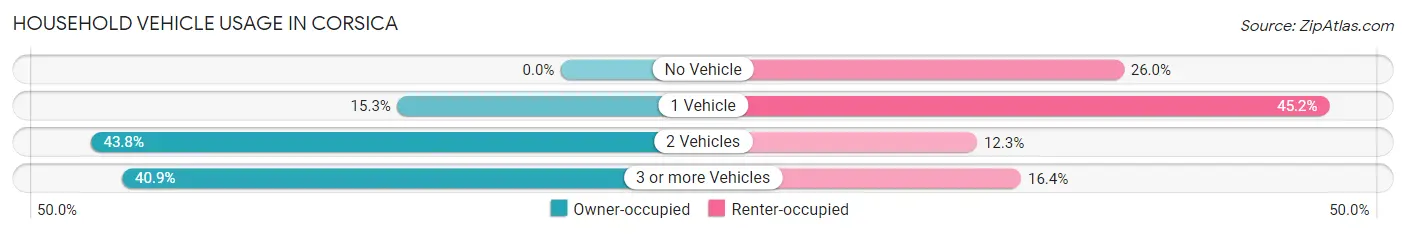
| Vehicles per Household | Owner-occupied | Renter-occupied |
| No Vehicle | 0 (0.0%) | 19 (26.0%) |
| 1 Vehicle | 31 (15.3%) | 33 (45.2%) |
| 2 Vehicles | 89 (43.8%) | 9 (12.3%) |
| 3 or more Vehicles | 83 (40.9%) | 12 (16.4%) |
| Total | 203 (100.0%) | 73 (100.0%) |
Real Estate & Mortgages in Corsica
Real Estate and Mortgage Overview in Corsica
| Characteristic | Without Mortgage | With Mortgage |
| Housing Units | 136 | 67 |
| Median Property Value | $105,400 | $98,100 |
| Median Household Income | $70,278 | $3 |
| Monthly Housing Costs | $430 | $0 |
| Real Estate Taxes | $987 | $0 |
Property Value by Mortgage Status in Corsica
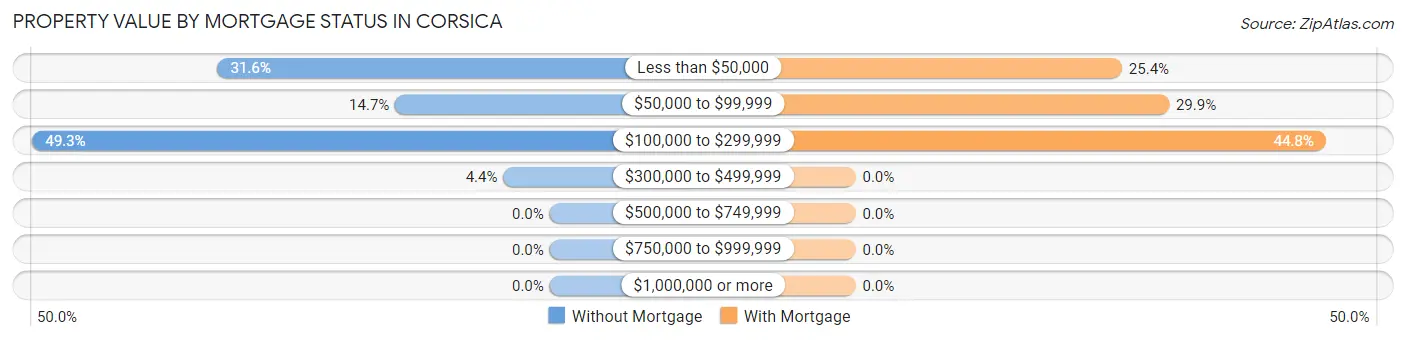
| Property Value | Without Mortgage | With Mortgage |
| Less than $50,000 | 43 (31.6%) | 17 (25.4%) |
| $50,000 to $99,999 | 20 (14.7%) | 20 (29.8%) |
| $100,000 to $299,999 | 67 (49.3%) | 30 (44.8%) |
| $300,000 to $499,999 | 6 (4.4%) | 0 (0.0%) |
| $500,000 to $749,999 | 0 (0.0%) | 0 (0.0%) |
| $750,000 to $999,999 | 0 (0.0%) | 0 (0.0%) |
| $1,000,000 or more | 0 (0.0%) | 0 (0.0%) |
| Total | 136 (100.0%) | 67 (100.0%) |
Household Income by Mortgage Status in Corsica
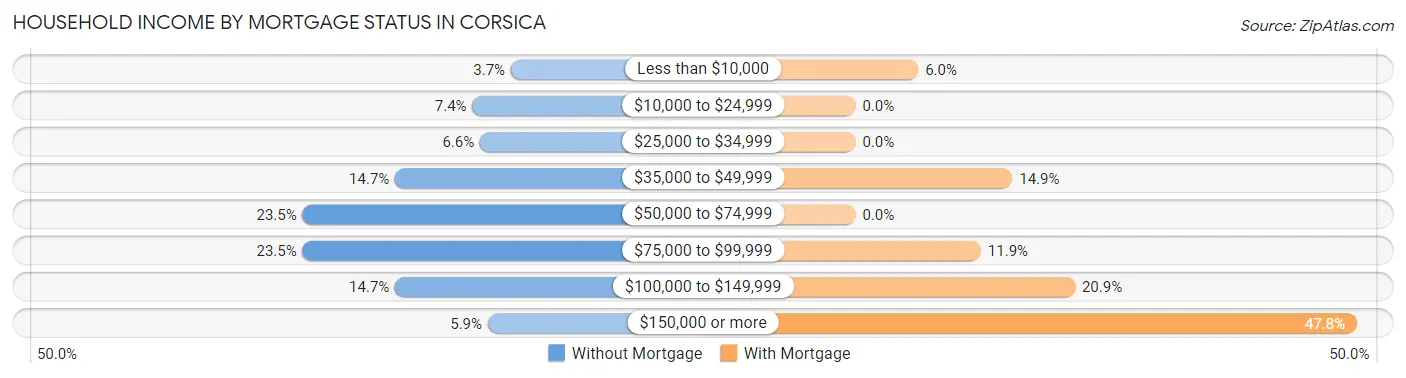
| Household Income | Without Mortgage | With Mortgage |
| Less than $10,000 | 5 (3.7%) | 4 (6.0%) |
| $10,000 to $24,999 | 10 (7.3%) | 0 (0.0%) |
| $25,000 to $34,999 | 9 (6.6%) | 0 (0.0%) |
| $35,000 to $49,999 | 20 (14.7%) | 10 (14.9%) |
| $50,000 to $74,999 | 32 (23.5%) | 0 (0.0%) |
| $75,000 to $99,999 | 32 (23.5%) | 8 (11.9%) |
| $100,000 to $149,999 | 20 (14.7%) | 14 (20.9%) |
| $150,000 or more | 8 (5.9%) | 32 (47.8%) |
| Total | 136 (100.0%) | 67 (100.0%) |
Property Value to Household Income Ratio in Corsica
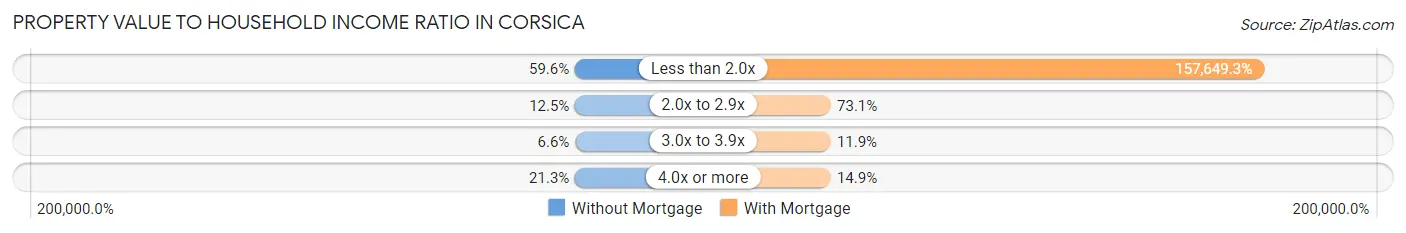
| Value-to-Income Ratio | Without Mortgage | With Mortgage |
| Less than 2.0x | 81 (59.6%) | 105,625 (157,649.3%) |
| 2.0x to 2.9x | 17 (12.5%) | 49 (73.1%) |
| 3.0x to 3.9x | 9 (6.6%) | 8 (11.9%) |
| 4.0x or more | 29 (21.3%) | 10 (14.9%) |
| Total | 136 (100.0%) | 67 (100.0%) |
Real Estate Taxes by Mortgage Status in Corsica
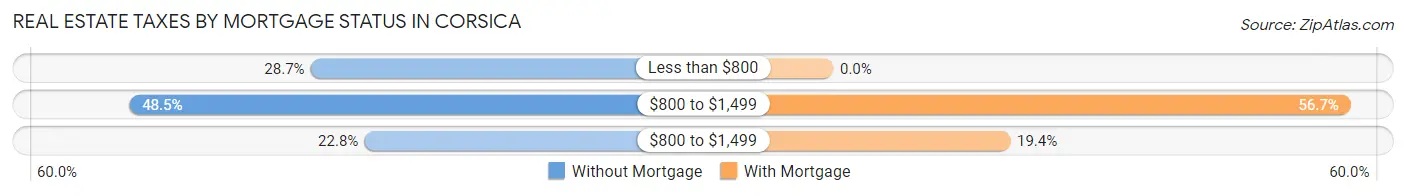
| Property Taxes | Without Mortgage | With Mortgage |
| Less than $800 | 39 (28.7%) | 0 (0.0%) |
| $800 to $1,499 | 66 (48.5%) | 38 (56.7%) |
| $800 to $1,499 | 31 (22.8%) | 13 (19.4%) |
| Total | 136 (100.0%) | 67 (100.0%) |
Health & Disability in Corsica
Health Insurance Coverage by Age in Corsica
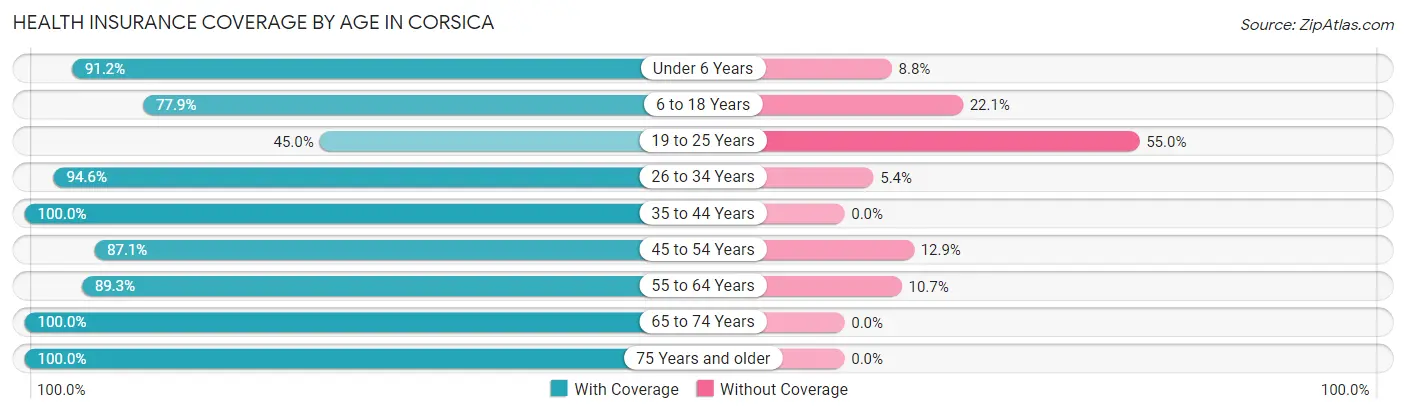
| Age Bracket | With Coverage | Without Coverage |
| Under 6 Years | 62 (91.2%) | 6 (8.8%) |
| 6 to 18 Years | 60 (77.9%) | 17 (22.1%) |
| 19 to 25 Years | 36 (45.0%) | 44 (55.0%) |
| 26 to 34 Years | 70 (94.6%) | 4 (5.4%) |
| 35 to 44 Years | 35 (100.0%) | 0 (0.0%) |
| 45 to 54 Years | 74 (87.1%) | 11 (12.9%) |
| 55 to 64 Years | 67 (89.3%) | 8 (10.7%) |
| 65 to 74 Years | 73 (100.0%) | 0 (0.0%) |
| 75 Years and older | 62 (100.0%) | 0 (0.0%) |
| Total | 539 (85.7%) | 90 (14.3%) |
Health Insurance Coverage by Citizenship Status in Corsica
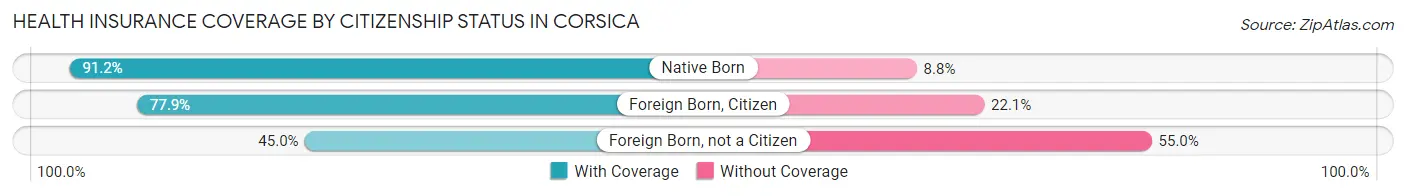
| Citizenship Status | With Coverage | Without Coverage |
| Native Born | 62 (91.2%) | 6 (8.8%) |
| Foreign Born, Citizen | 60 (77.9%) | 17 (22.1%) |
| Foreign Born, not a Citizen | 36 (45.0%) | 44 (55.0%) |
Health Insurance Coverage by Household Income in Corsica
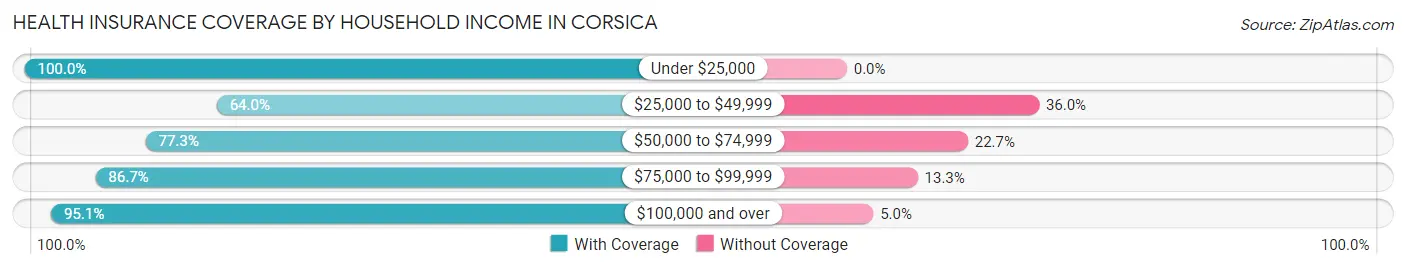
| Household Income | With Coverage | Without Coverage |
| Under $25,000 | 39 (100.0%) | 0 (0.0%) |
| $25,000 to $49,999 | 80 (64.0%) | 45 (36.0%) |
| $50,000 to $74,999 | 58 (77.3%) | 17 (22.7%) |
| $75,000 to $99,999 | 85 (86.7%) | 13 (13.3%) |
| $100,000 and over | 269 (95.1%) | 14 (5.0%) |
Public vs Private Health Insurance Coverage by Age in Corsica
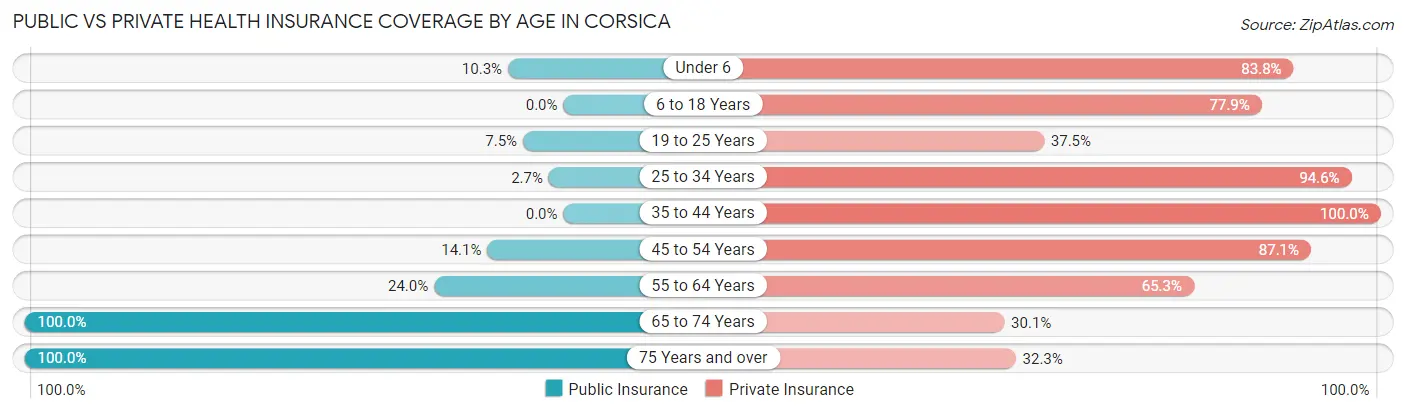
| Age Bracket | Public Insurance | Private Insurance |
| Under 6 | 7 (10.3%) | 57 (83.8%) |
| 6 to 18 Years | 0 (0.0%) | 60 (77.9%) |
| 19 to 25 Years | 6 (7.5%) | 30 (37.5%) |
| 25 to 34 Years | 2 (2.7%) | 70 (94.6%) |
| 35 to 44 Years | 0 (0.0%) | 35 (100.0%) |
| 45 to 54 Years | 12 (14.1%) | 74 (87.1%) |
| 55 to 64 Years | 18 (24.0%) | 49 (65.3%) |
| 65 to 74 Years | 73 (100.0%) | 22 (30.1%) |
| 75 Years and over | 62 (100.0%) | 20 (32.3%) |
| Total | 180 (28.6%) | 417 (66.3%) |
Disability Status by Sex by Age in Corsica
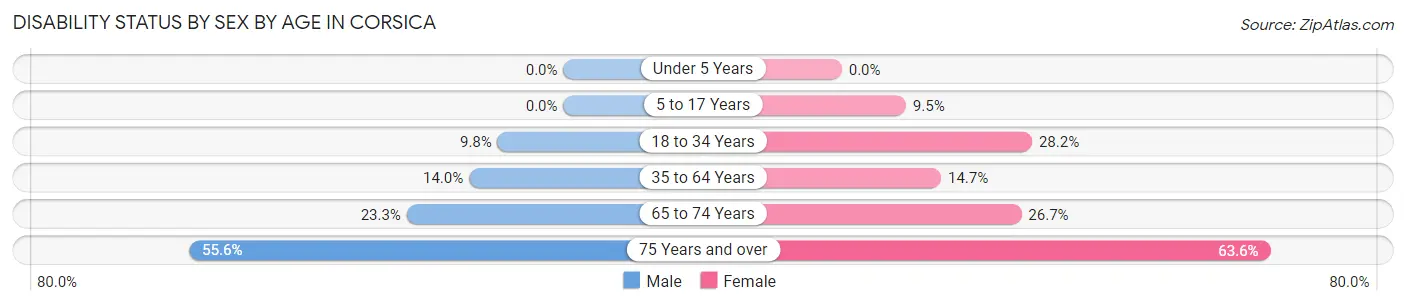
| Age Bracket | Male | Female |
| Under 5 Years | 0 (0.0%) | 0 (0.0%) |
| 5 to 17 Years | 0 (0.0%) | 2 (9.5%) |
| 18 to 34 Years | 8 (9.8%) | 24 (28.2%) |
| 35 to 64 Years | 14 (14.0%) | 14 (14.7%) |
| 65 to 74 Years | 10 (23.3%) | 8 (26.7%) |
| 75 Years and over | 10 (55.6%) | 28 (63.6%) |
Disability Class by Sex by Age in Corsica
Disability Class: Hearing Difficulty
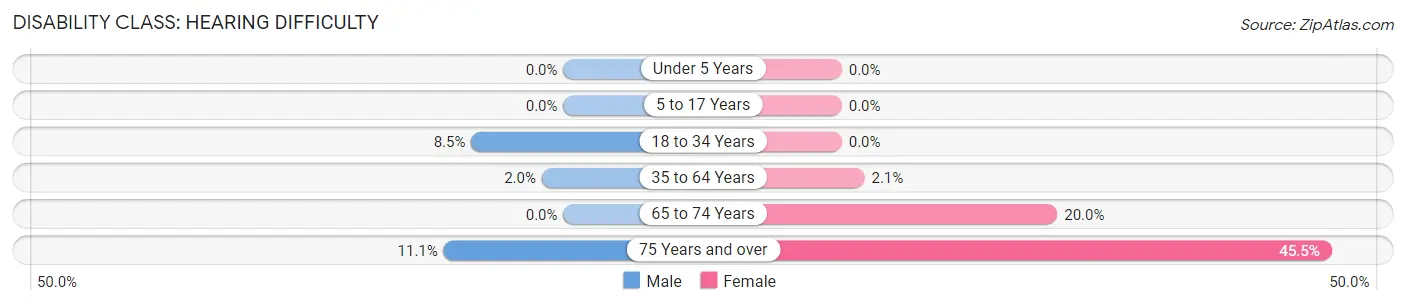
| Age Bracket | Male | Female |
| Under 5 Years | 0 (0.0%) | 0 (0.0%) |
| 5 to 17 Years | 0 (0.0%) | 0 (0.0%) |
| 18 to 34 Years | 7 (8.5%) | 0 (0.0%) |
| 35 to 64 Years | 2 (2.0%) | 2 (2.1%) |
| 65 to 74 Years | 0 (0.0%) | 6 (20.0%) |
| 75 Years and over | 2 (11.1%) | 20 (45.5%) |
Disability Class: Vision Difficulty
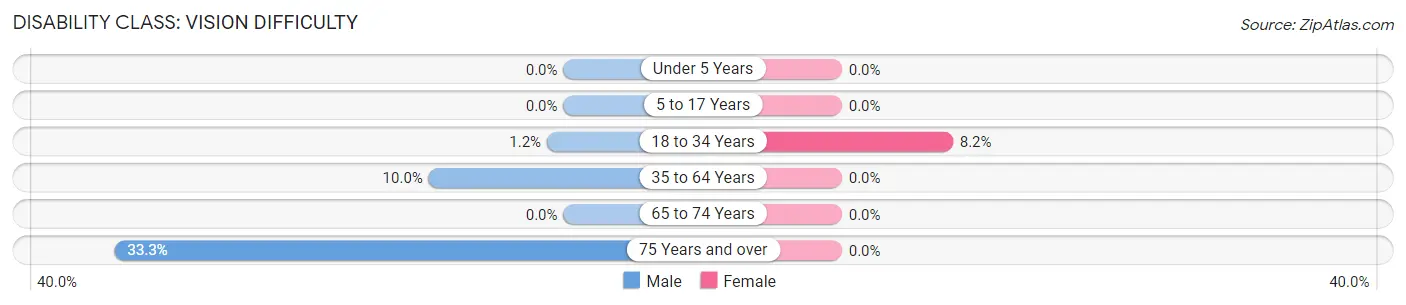
| Age Bracket | Male | Female |
| Under 5 Years | 0 (0.0%) | 0 (0.0%) |
| 5 to 17 Years | 0 (0.0%) | 0 (0.0%) |
| 18 to 34 Years | 1 (1.2%) | 7 (8.2%) |
| 35 to 64 Years | 10 (10.0%) | 0 (0.0%) |
| 65 to 74 Years | 0 (0.0%) | 0 (0.0%) |
| 75 Years and over | 6 (33.3%) | 0 (0.0%) |
Disability Class: Cognitive Difficulty
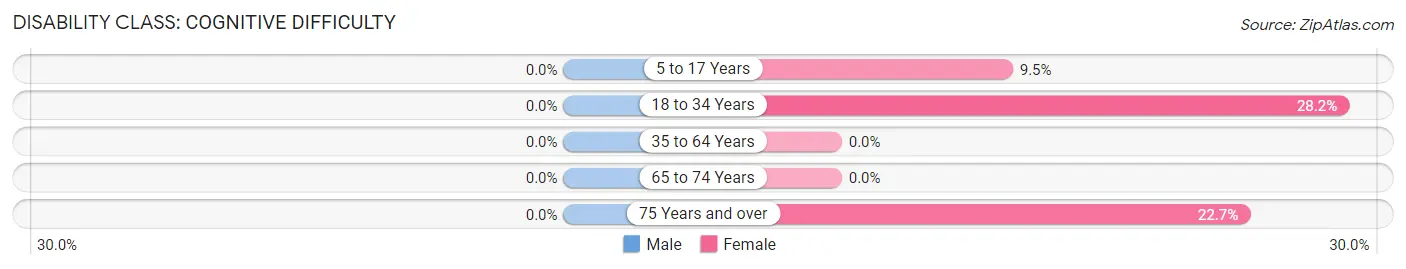
| Age Bracket | Male | Female |
| 5 to 17 Years | 0 (0.0%) | 2 (9.5%) |
| 18 to 34 Years | 0 (0.0%) | 24 (28.2%) |
| 35 to 64 Years | 0 (0.0%) | 0 (0.0%) |
| 65 to 74 Years | 0 (0.0%) | 0 (0.0%) |
| 75 Years and over | 0 (0.0%) | 10 (22.7%) |
Disability Class: Ambulatory Difficulty
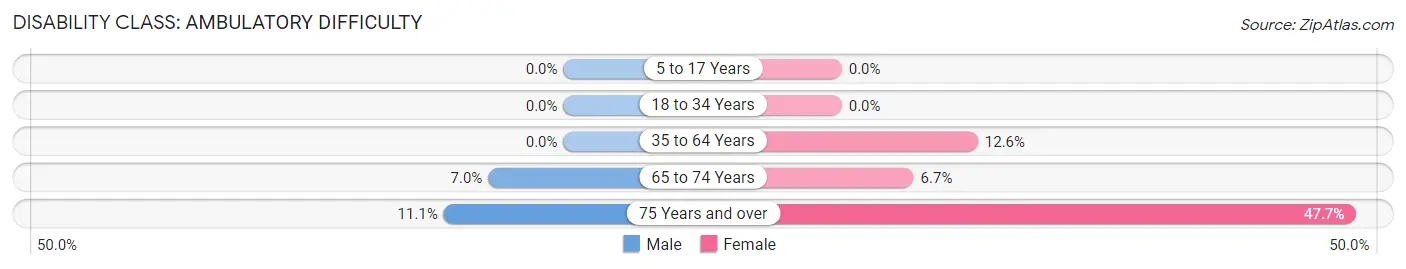
| Age Bracket | Male | Female |
| 5 to 17 Years | 0 (0.0%) | 0 (0.0%) |
| 18 to 34 Years | 0 (0.0%) | 0 (0.0%) |
| 35 to 64 Years | 0 (0.0%) | 12 (12.6%) |
| 65 to 74 Years | 3 (7.0%) | 2 (6.7%) |
| 75 Years and over | 2 (11.1%) | 21 (47.7%) |
Disability Class: Self-Care Difficulty
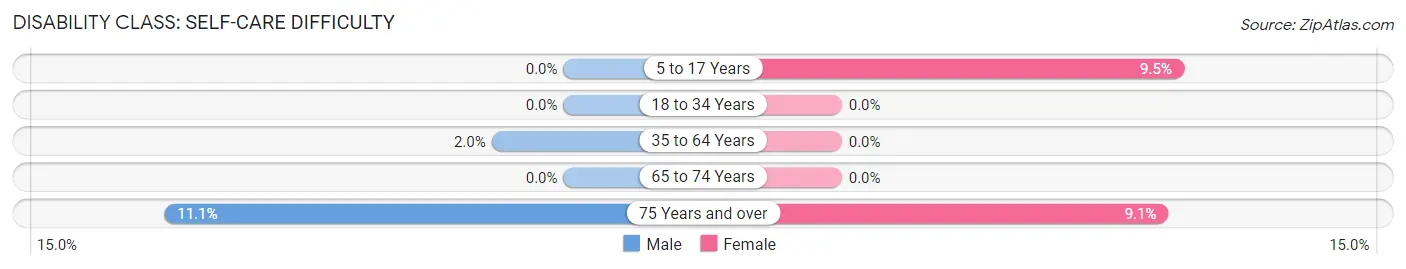
| Age Bracket | Male | Female |
| 5 to 17 Years | 0 (0.0%) | 2 (9.5%) |
| 18 to 34 Years | 0 (0.0%) | 0 (0.0%) |
| 35 to 64 Years | 2 (2.0%) | 0 (0.0%) |
| 65 to 74 Years | 0 (0.0%) | 0 (0.0%) |
| 75 Years and over | 2 (11.1%) | 4 (9.1%) |
Technology Access in Corsica
Computing Device Access in Corsica
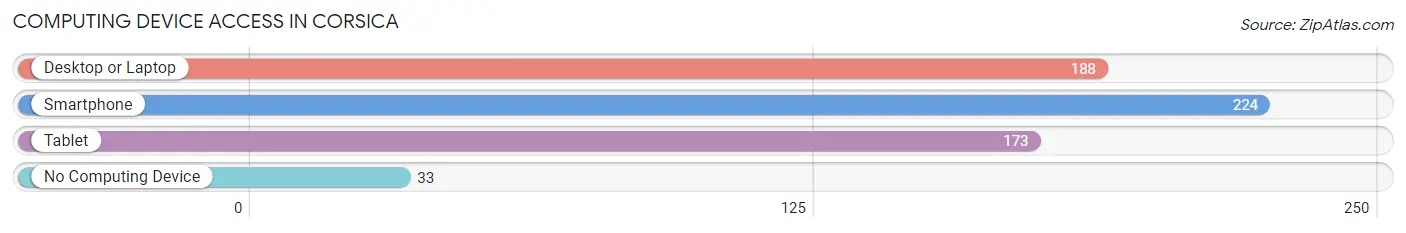
| Device Type | # Households | % Households |
| Desktop or Laptop | 188 | 68.1% |
| Smartphone | 224 | 81.2% |
| Tablet | 173 | 62.7% |
| No Computing Device | 33 | 12.0% |
| Total | 276 | 100.0% |
Internet Access in Corsica
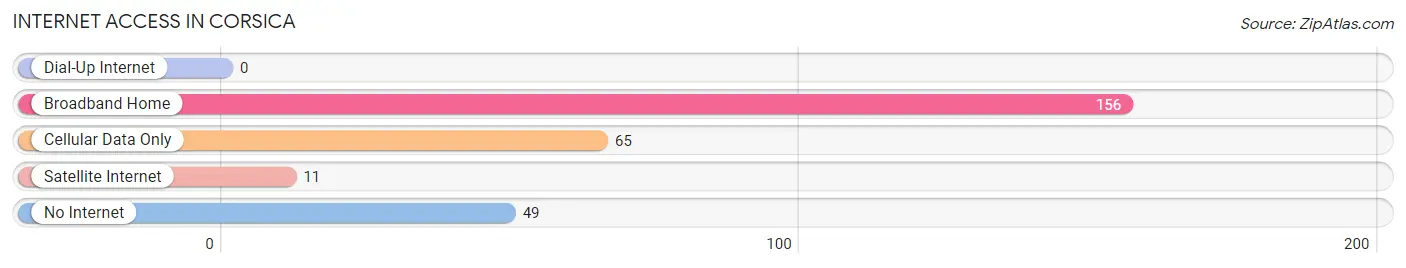
| Internet Type | # Households | % Households |
| Dial-Up Internet | 0 | 0.0% |
| Broadband Home | 156 | 56.5% |
| Cellular Data Only | 65 | 23.5% |
| Satellite Internet | 11 | 4.0% |
| No Internet | 49 | 17.7% |
| Total | 276 | 100.0% |
Corsica Summary
Corsica is a small town located in the southeastern corner of South Dakota, in the United States. It is situated in the Missouri River Valley, and is part of the larger region known as the Great Plains. The town has a population of approximately 1,000 people, and is the county seat of Douglas County.
History
The area that is now Corsica was first settled in the late 1800s by German and Scandinavian immigrants. The town was originally known as “Corsica Station”, and was established in 1883. The town was named after the Mediterranean island of Corsica, which was the birthplace of Napoleon Bonaparte. The town was officially incorporated in 1887.
In the early 1900s, Corsica was a thriving agricultural community. The town was home to several grain elevators, a creamery, and a flour mill. The town also had a number of businesses, including a bank, a hotel, a blacksmith shop, and a livery stable.
In the mid-1900s, the town began to decline as the agricultural industry shifted away from the area. The town’s population began to decline, and many of the businesses closed. In the late 1900s, the town began to experience a resurgence as it became a popular tourist destination.
Geography
Corsica is located in the southeastern corner of South Dakota, in the United States. It is situated in the Missouri River Valley, and is part of the larger region known as the Great Plains. The town is located at an elevation of 1,845 feet (562 meters).
The town is located in a semi-arid climate, with hot summers and cold winters. The average annual temperature is around 50°F (10°C). The average annual precipitation is around 20 inches (51 cm).
Economy
Corsica’s economy is largely based on tourism. The town is home to several tourist attractions, including the Corsica Historical Museum, the Corsica Arts Center, and the Corsica Wildlife Refuge. The town also has several restaurants, shops, and lodging options.
The town is also home to several small businesses, including a grocery store, a hardware store, and a gas station. The town also has a number of agricultural businesses, including a dairy farm and a grain elevator.
Demographics
As of the 2010 census, the population of Corsica was 1,000 people. The racial makeup of the town was 97.2% White, 0.7% African American, 0.3% Native American, 0.2% Asian, 0.1% Pacific Islander, and 1.5% from other races. The median household income was $37,500, and the median family income was $45,000.
Conclusion
Corsica is a small town located in the southeastern corner of South Dakota, in the United States. It is situated in the Missouri River Valley, and is part of the larger region known as the Great Plains. The town has a population of approximately 1,000 people, and is the county seat of Douglas County. The town’s economy is largely based on tourism, and it is home to several tourist attractions, restaurants, shops, and lodging options. The town also has several small businesses, including a grocery store, a hardware store, and a gas station. The racial makeup of the town is 97.2% White, 0.7% African American, 0.3% Native American, 0.2% Asian, 0.1% Pacific Islander, and 1.5% from other races. The median household income was $37,500, and the median family income was $45,000.
Common Questions
What is Per Capita Income in Corsica?
Per Capita income in Corsica is $31,284.
What is the Median Family Income in Corsica?
Median Family Income in Corsica is $91,250.
What is the Median Household income in Corsica?
Median Household Income in Corsica is $70,294.
What is Income or Wage Gap in Corsica?
Income or Wage Gap in Corsica is 54.5%.
Women in Corsica earn 45.5 cents for every dollar earned by a man.
What is Inequality or Gini Index in Corsica?
Inequality or Gini Index in Corsica is 0.37.
What is the Total Population of Corsica?
Total Population of Corsica is 691.
What is the Total Male Population of Corsica?
Total Male Population of Corsica is 332.
What is the Total Female Population of Corsica?
Total Female Population of Corsica is 359.
What is the Ratio of Males per 100 Females in Corsica?
There are 92.48 Males per 100 Females in Corsica.
What is the Ratio of Females per 100 Males in Corsica?
There are 108.13 Females per 100 Males in Corsica.
What is the Median Population Age in Corsica?
Median Population Age in Corsica is 45.8 Years.
What is the Average Family Size in Corsica
Average Family Size in Corsica is 2.8 People.
What is the Average Household Size in Corsica
Average Household Size in Corsica is 2.2 People.
How Large is the Labor Force in Corsica?
There are 354 People in the Labor Forcein in Corsica.
What is the Percentage of People in the Labor Force in Corsica?
62.5% of People are in the Labor Force in Corsica.