Colonial Pine Hills, SD Map & Demographics
Colonial Pine Hills Map
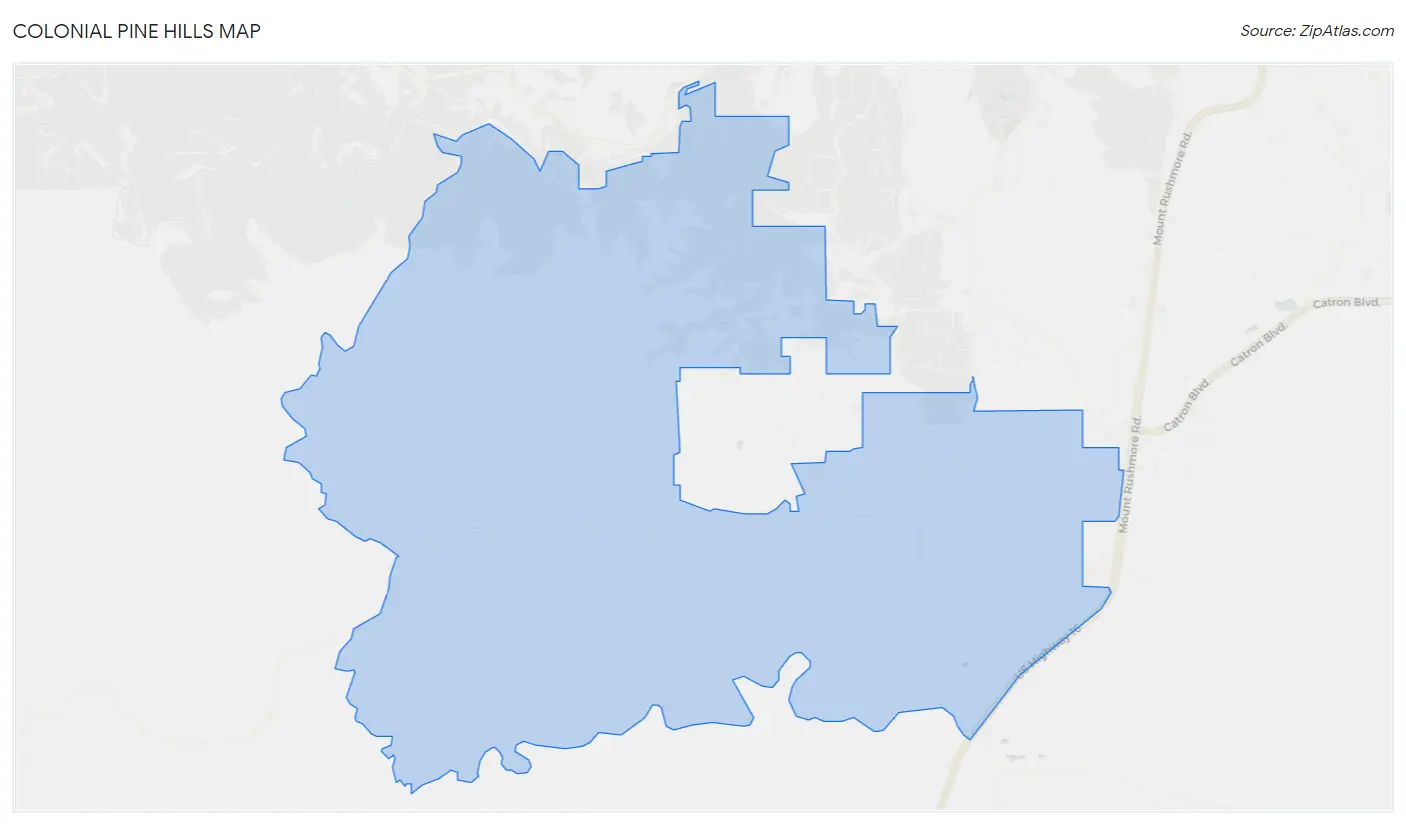
Colonial Pine Hills Overview
$56,270
PER CAPITA INCOME
$79,345
AVG FAMILY INCOME
$79,702
AVG HOUSEHOLD INCOME
14.3%
WAGE / INCOME GAP [ % ]
85.7¢/ $1
WAGE / INCOME GAP [ $ ]
0.51
INEQUALITY / GINI INDEX
2,346
TOTAL POPULATION
1,302
MALE POPULATION
1,044
FEMALE POPULATION
124.71
MALES / 100 FEMALES
80.18
FEMALES / 100 MALES
55.5
MEDIAN AGE
2.8
AVG FAMILY SIZE
2.5
AVG HOUSEHOLD SIZE
1,278
LABOR FORCE [ PEOPLE ]
70.7%
PERCENT IN LABOR FORCE
7.6%
UNEMPLOYMENT RATE
Income in Colonial Pine Hills
Income Overview in Colonial Pine Hills
Per Capita Income in Colonial Pine Hills is $56,270, while median incomes of families and households are $79,345 and $79,702 respectively.
| Characteristic | Number | Measure |
| Per Capita Income | 2,346 | $56,270 |
| Median Family Income | 787 | $79,345 |
| Mean Family Income | 787 | $154,311 |
| Median Household Income | 933 | $79,702 |
| Mean Household Income | 933 | $143,575 |
| Income Deficit | 787 | $0 |
| Wage / Income Gap (%) | 2,346 | 14.26% |
| Wage / Income Gap ($) | 2,346 | 85.74¢ per $1 |
| Gini / Inequality Index | 2,346 | 0.51 |
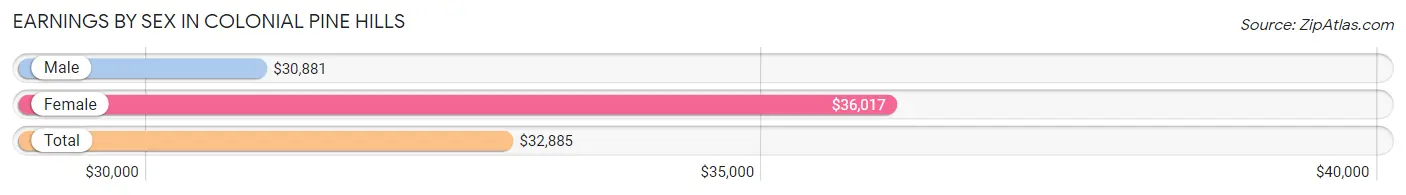
Earnings by Sex in Colonial Pine Hills
Average Earnings in Colonial Pine Hills are $32,885, $30,881 for men and $36,017 for women, a difference of 14.3%.
| Sex | Number | Average Earnings |
| Male | 817 (58.5%) | $30,881 |
| Female | 579 (41.5%) | $36,017 |
| Total | 1,396 (100.0%) | $32,885 |
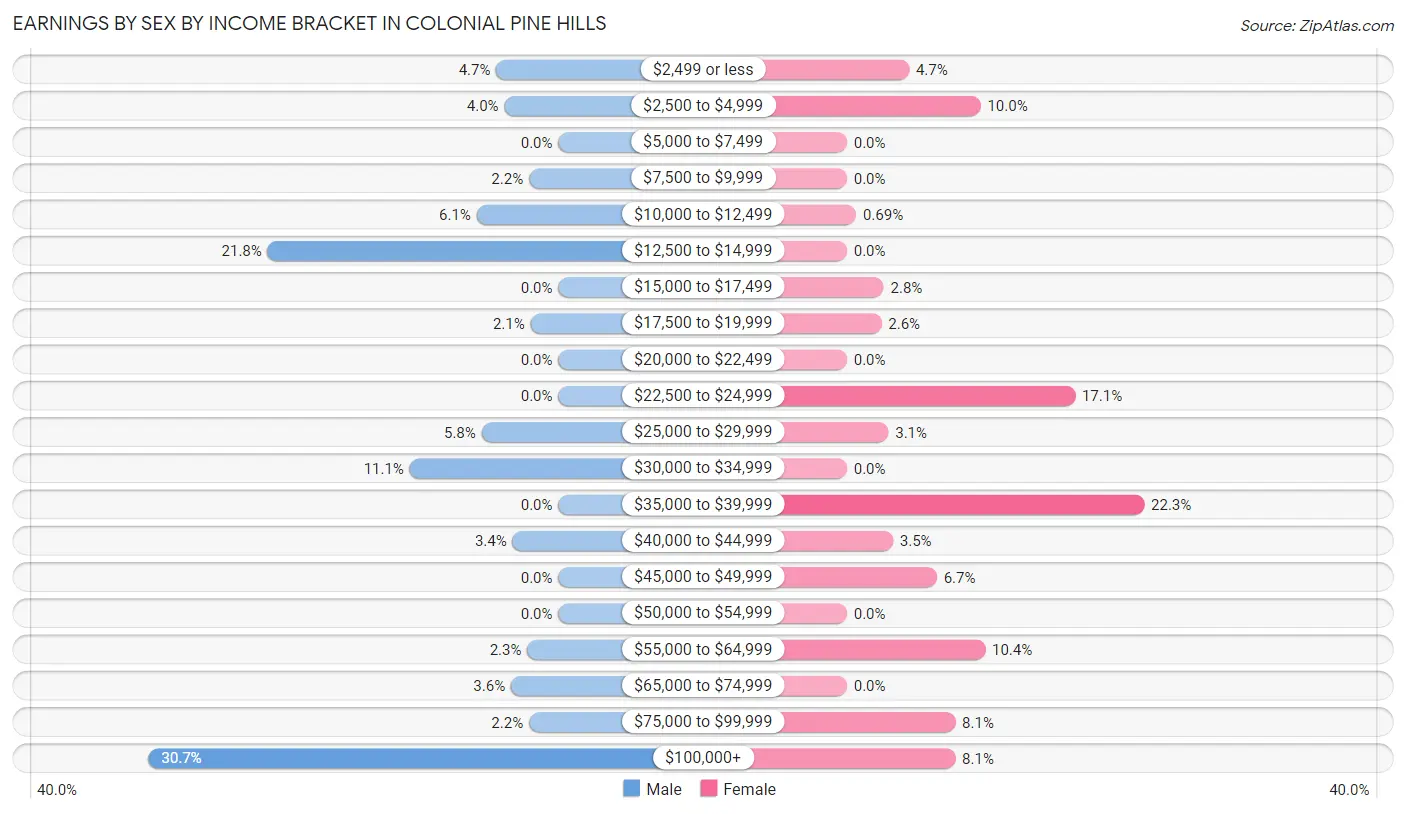
Earnings by Sex by Income Bracket in Colonial Pine Hills
The most common earnings brackets in Colonial Pine Hills are $100,000+ for men (251 | 30.7%) and $35,000 to $39,999 for women (129 | 22.3%).
| Income | Male | Female |
| $2,499 or less | 38 (4.6%) | 27 (4.7%) |
| $2,500 to $4,999 | 33 (4.0%) | 58 (10.0%) |
| $5,000 to $7,499 | 0 (0.0%) | 0 (0.0%) |
| $7,500 to $9,999 | 18 (2.2%) | 0 (0.0%) |
| $10,000 to $12,499 | 50 (6.1%) | 4 (0.7%) |
| $12,500 to $14,999 | 178 (21.8%) | 0 (0.0%) |
| $15,000 to $17,499 | 0 (0.0%) | 16 (2.8%) |
| $17,500 to $19,999 | 17 (2.1%) | 15 (2.6%) |
| $20,000 to $22,499 | 0 (0.0%) | 0 (0.0%) |
| $22,500 to $24,999 | 0 (0.0%) | 99 (17.1%) |
| $25,000 to $29,999 | 47 (5.8%) | 18 (3.1%) |
| $30,000 to $34,999 | 91 (11.1%) | 0 (0.0%) |
| $35,000 to $39,999 | 0 (0.0%) | 129 (22.3%) |
| $40,000 to $44,999 | 28 (3.4%) | 20 (3.5%) |
| $45,000 to $49,999 | 0 (0.0%) | 39 (6.7%) |
| $50,000 to $54,999 | 0 (0.0%) | 0 (0.0%) |
| $55,000 to $64,999 | 19 (2.3%) | 60 (10.4%) |
| $65,000 to $74,999 | 29 (3.5%) | 0 (0.0%) |
| $75,000 to $99,999 | 18 (2.2%) | 47 (8.1%) |
| $100,000+ | 251 (30.7%) | 47 (8.1%) |
| Total | 817 (100.0%) | 579 (100.0%) |
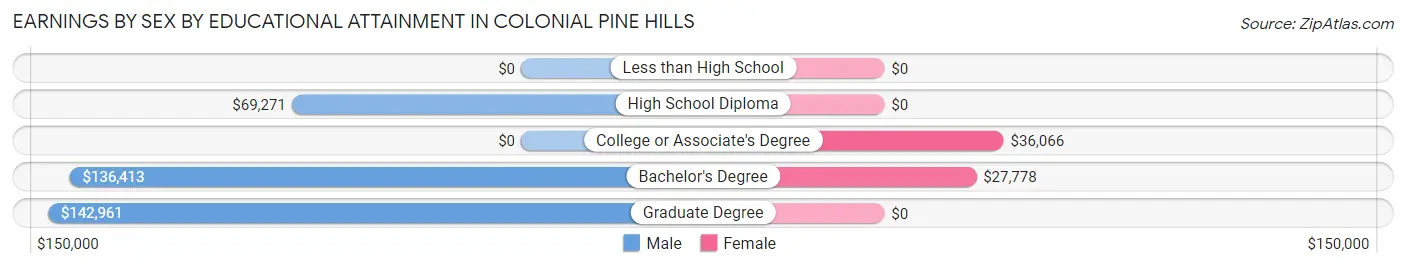
Earnings by Sex by Educational Attainment in Colonial Pine Hills
| Educational Attainment | Male Income | Female Income |
| Less than High School | - | - |
| High School Diploma | $69,271 | $0 |
| College or Associate's Degree | - | - |
| Bachelor's Degree | $136,413 | $27,778 |
| Graduate Degree | $142,961 | $0 |
| Total | - | - |
Family Income in Colonial Pine Hills
Family Income Brackets in Colonial Pine Hills
According to the Colonial Pine Hills family income data, there are 250 families falling into the $50,000 to $74,999 income range, which is the most common income bracket and makes up 31.8% of all families.
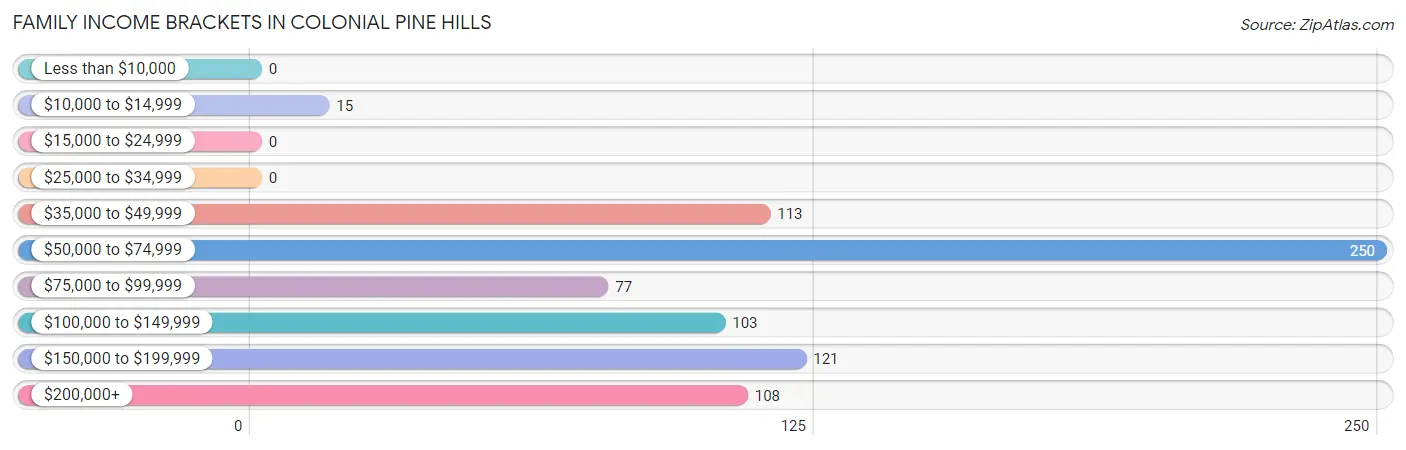
| Income Bracket | # Families | % Families |
| Less than $10,000 | 0 | 0.0% |
| $10,000 to $14,999 | 15 | 1.9% |
| $15,000 to $24,999 | 0 | 0.0% |
| $25,000 to $34,999 | 0 | 0.0% |
| $35,000 to $49,999 | 113 | 14.4% |
| $50,000 to $74,999 | 250 | 31.8% |
| $75,000 to $99,999 | 77 | 9.8% |
| $100,000 to $149,999 | 103 | 13.1% |
| $150,000 to $199,999 | 121 | 15.4% |
| $200,000+ | 108 | 13.7% |
Family Income by Famaliy Size in Colonial Pine Hills
5-person families (86 | 10.9%) account for the highest median family income in Colonial Pine Hills with $171,920 per family, while 3-person families (99 | 12.6%) have the highest median income of $40,669 per family member.
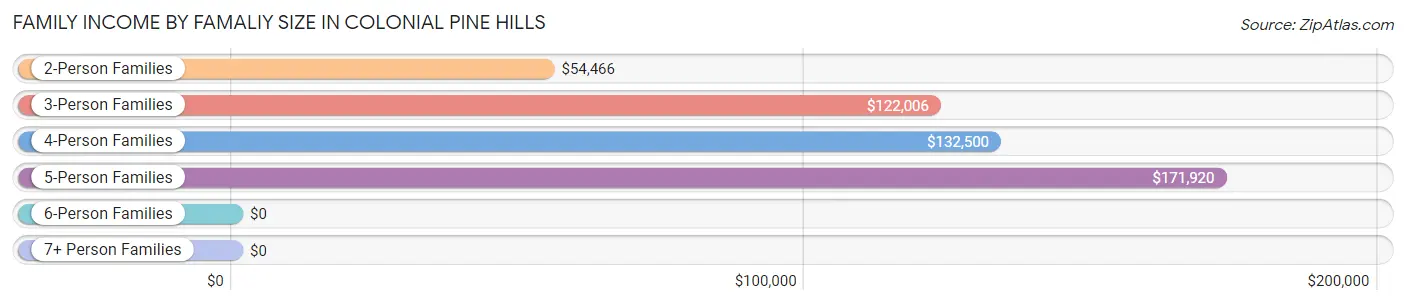
| Income Bracket | # Families | Median Income |
| 2-Person Families | 506 (64.3%) | $54,466 |
| 3-Person Families | 99 (12.6%) | $122,006 |
| 4-Person Families | 96 (12.2%) | $132,500 |
| 5-Person Families | 86 (10.9%) | $171,920 |
| 6-Person Families | 0 (0.0%) | $0 |
| 7+ Person Families | 0 (0.0%) | $0 |
| Total | 787 (100.0%) | $79,345 |
Family Income by Number of Earners in Colonial Pine Hills
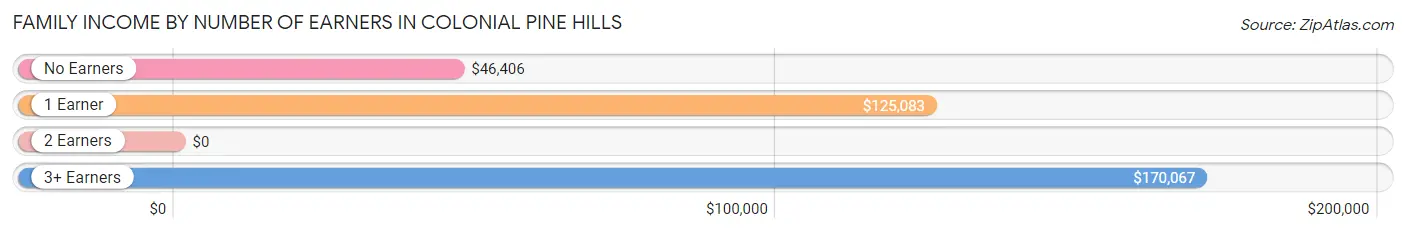
| Number of Earners | # Families | Median Income |
| No Earners | 142 (18.0%) | $46,406 |
| 1 Earner | 89 (11.3%) | $125,083 |
| 2 Earners | 401 (50.9%) | $0 |
| 3+ Earners | 155 (19.7%) | $170,067 |
| Total | 787 (100.0%) | $79,345 |
Household Income in Colonial Pine Hills
Household Income Brackets in Colonial Pine Hills
With 250 households falling in the category, the $50,000 to $74,999 income range is the most frequent in Colonial Pine Hills, accounting for 26.8% of all households.
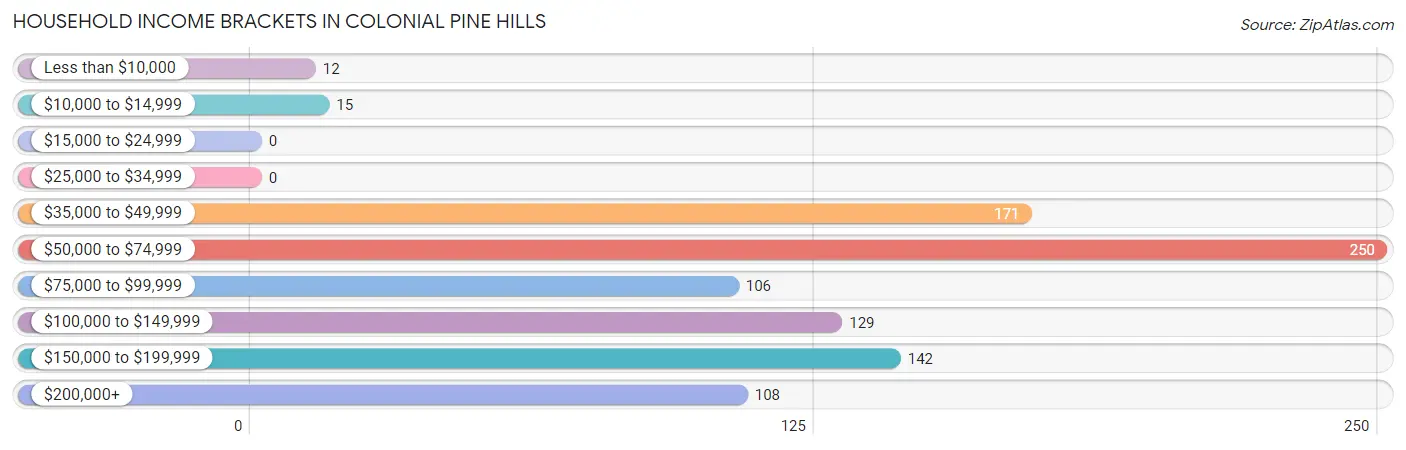
| Income Bracket | # Households | % Households |
| Less than $10,000 | 12 | 1.3% |
| $10,000 to $14,999 | 15 | 1.6% |
| $15,000 to $24,999 | 0 | 0.0% |
| $25,000 to $34,999 | 0 | 0.0% |
| $35,000 to $49,999 | 171 | 18.3% |
| $50,000 to $74,999 | 250 | 26.8% |
| $75,000 to $99,999 | 106 | 11.4% |
| $100,000 to $149,999 | 129 | 13.8% |
| $150,000 to $199,999 | 142 | 15.2% |
| $200,000+ | 108 | 11.6% |
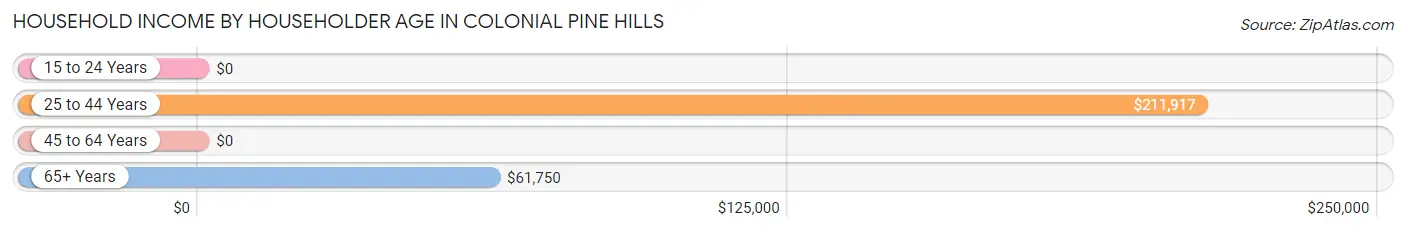
Household Income by Householder Age in Colonial Pine Hills
The median household income in Colonial Pine Hills is $79,702, with the highest median household income of $211,917 found in the 25 to 44 years age bracket for the primary householder. A total of 111 households (11.9%) fall into this category.
| Income Bracket | # Households | Median Income |
| 15 to 24 Years | 0 (0.0%) | $0 |
| 25 to 44 Years | 111 (11.9%) | $211,917 |
| 45 to 64 Years | 501 (53.7%) | $0 |
| 65+ Years | 321 (34.4%) | $61,750 |
| Total | 933 (100.0%) | $79,702 |
Poverty in Colonial Pine Hills
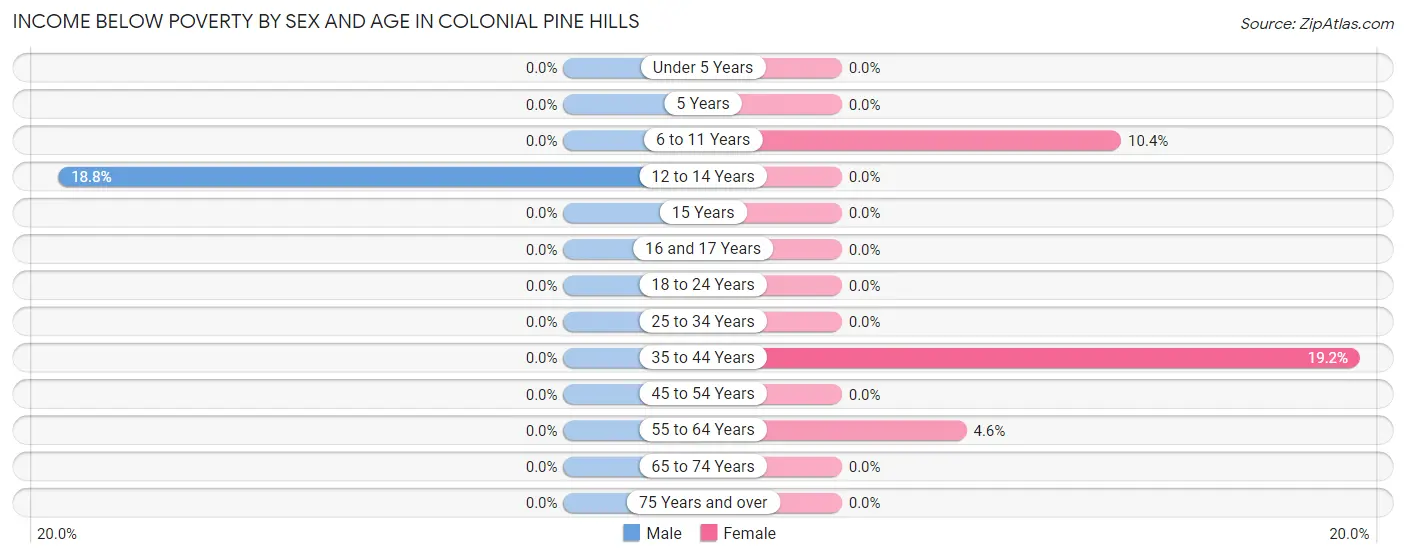
Income Below Poverty by Sex and Age in Colonial Pine Hills
With 1.1% poverty level for males and 4.2% for females among the residents of Colonial Pine Hills, 12 to 14 year old males and 35 to 44 year old females are the most vulnerable to poverty, with 15 males (18.8%) and 15 females (19.2%) in their respective age groups living below the poverty level.
| Age Bracket | Male | Female |
| Under 5 Years | 0 (0.0%) | 0 (0.0%) |
| 5 Years | 0 (0.0%) | 0 (0.0%) |
| 6 to 11 Years | 0 (0.0%) | 17 (10.4%) |
| 12 to 14 Years | 15 (18.8%) | 0 (0.0%) |
| 15 Years | 0 (0.0%) | 0 (0.0%) |
| 16 and 17 Years | 0 (0.0%) | 0 (0.0%) |
| 18 to 24 Years | 0 (0.0%) | 0 (0.0%) |
| 25 to 34 Years | 0 (0.0%) | 0 (0.0%) |
| 35 to 44 Years | 0 (0.0%) | 15 (19.2%) |
| 45 to 54 Years | 0 (0.0%) | 0 (0.0%) |
| 55 to 64 Years | 0 (0.0%) | 12 (4.6%) |
| 65 to 74 Years | 0 (0.0%) | 0 (0.0%) |
| 75 Years and over | 0 (0.0%) | 0 (0.0%) |
| Total | 15 (1.1%) | 44 (4.2%) |
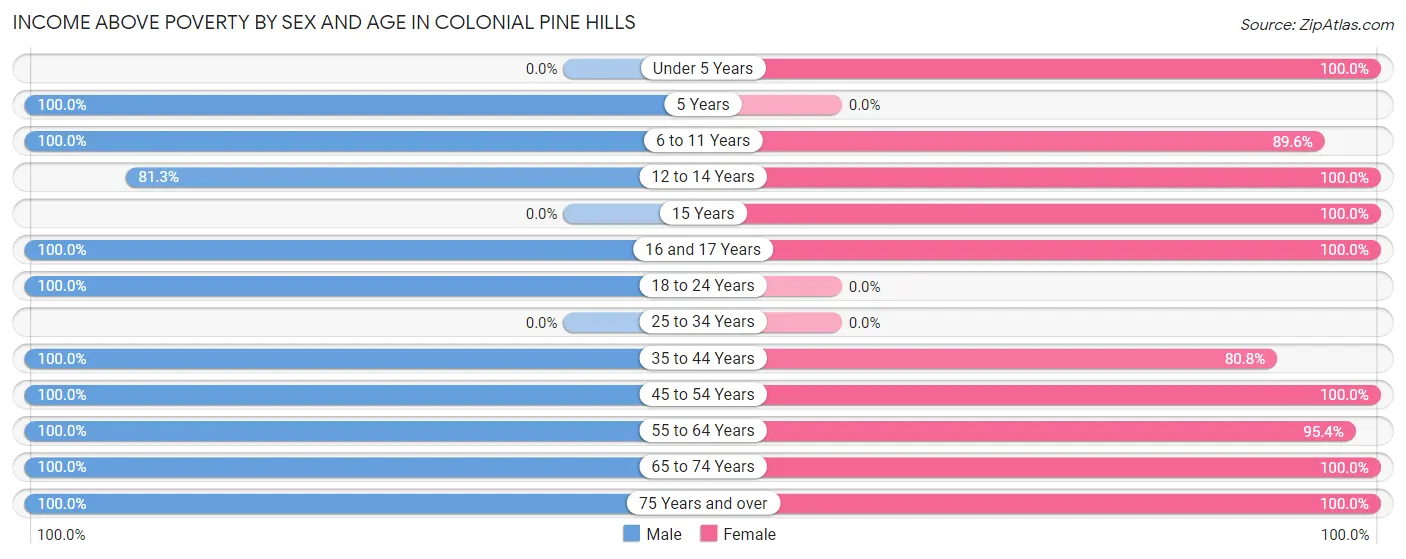
Income Above Poverty by Sex and Age in Colonial Pine Hills
According to the poverty statistics in Colonial Pine Hills, males aged 5 years and females aged under 5 years are the age groups that are most secure financially, with 100.0% of males and 100.0% of females in these age groups living above the poverty line.
| Age Bracket | Male | Female |
| Under 5 Years | 0 (0.0%) | 27 (100.0%) |
| 5 Years | 24 (100.0%) | 0 (0.0%) |
| 6 to 11 Years | 188 (100.0%) | 147 (89.6%) |
| 12 to 14 Years | 65 (81.2%) | 38 (100.0%) |
| 15 Years | 0 (0.0%) | 18 (100.0%) |
| 16 and 17 Years | 30 (100.0%) | 59 (100.0%) |
| 18 to 24 Years | 60 (100.0%) | 0 (0.0%) |
| 25 to 34 Years | 0 (0.0%) | 0 (0.0%) |
| 35 to 44 Years | 127 (100.0%) | 63 (80.8%) |
| 45 to 54 Years | 113 (100.0%) | 158 (100.0%) |
| 55 to 64 Years | 367 (100.0%) | 247 (95.4%) |
| 65 to 74 Years | 286 (100.0%) | 194 (100.0%) |
| 75 Years and over | 27 (100.0%) | 49 (100.0%) |
| Total | 1,287 (98.9%) | 1,000 (95.8%) |
Income Below Poverty Among Married-Couple Families in Colonial Pine Hills
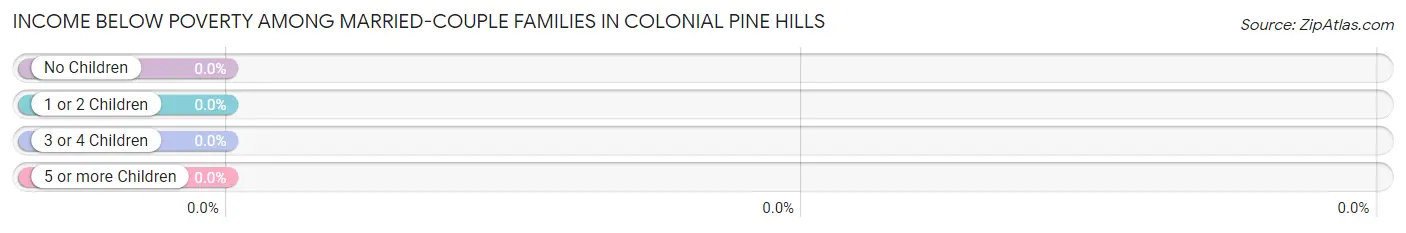
| Children | Above Poverty | Below Poverty |
| No Children | 535 (100.0%) | 0 (0.0%) |
| 1 or 2 Children | 193 (100.0%) | 0 (0.0%) |
| 3 or 4 Children | 30 (100.0%) | 0 (0.0%) |
| 5 or more Children | 0 (0.0%) | 0 (0.0%) |
| Total | 758 (100.0%) | 0 (0.0%) |
Income Below Poverty Among Single-Parent Households in Colonial Pine Hills
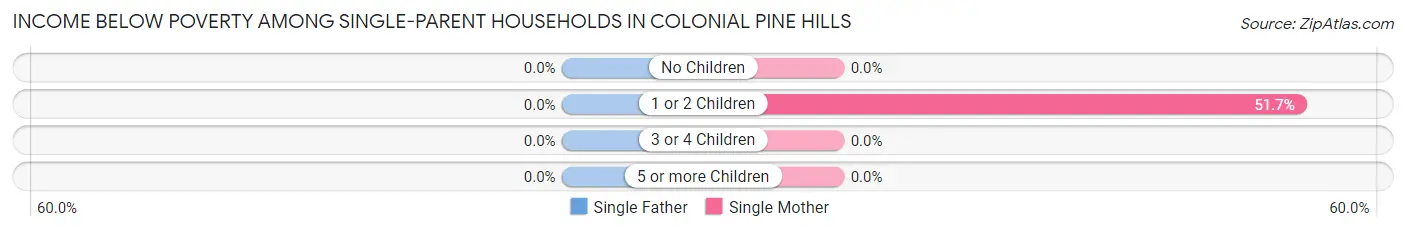
| Children | Single Father | Single Mother |
| No Children | 0 (0.0%) | 0 (0.0%) |
| 1 or 2 Children | 0 (0.0%) | 15 (51.7%) |
| 3 or 4 Children | 0 (0.0%) | 0 (0.0%) |
| 5 or more Children | 0 (0.0%) | 0 (0.0%) |
| Total | 0 (0.0%) | 15 (51.7%) |
Income Below Poverty Among Married-Couple vs Single-Parent Households in Colonial Pine Hills
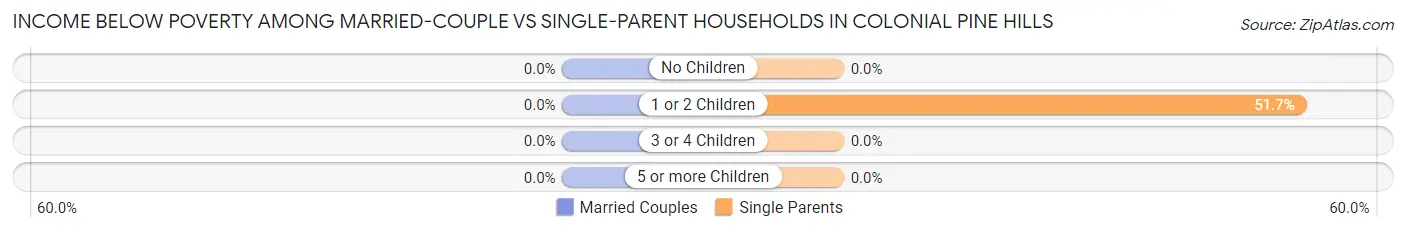
| Children | Married-Couple Families | Single-Parent Households |
| No Children | 0 (0.0%) | 0 (0.0%) |
| 1 or 2 Children | 0 (0.0%) | 15 (51.7%) |
| 3 or 4 Children | 0 (0.0%) | 0 (0.0%) |
| 5 or more Children | 0 (0.0%) | 0 (0.0%) |
| Total | 0 (0.0%) | 15 (51.7%) |
Race in Colonial Pine Hills
The most populous races in Colonial Pine Hills are White / Caucasian (2,303 | 98.2%), Hispanic or Latino (190 | 8.1%), and Black / African American (16 | 0.7%).
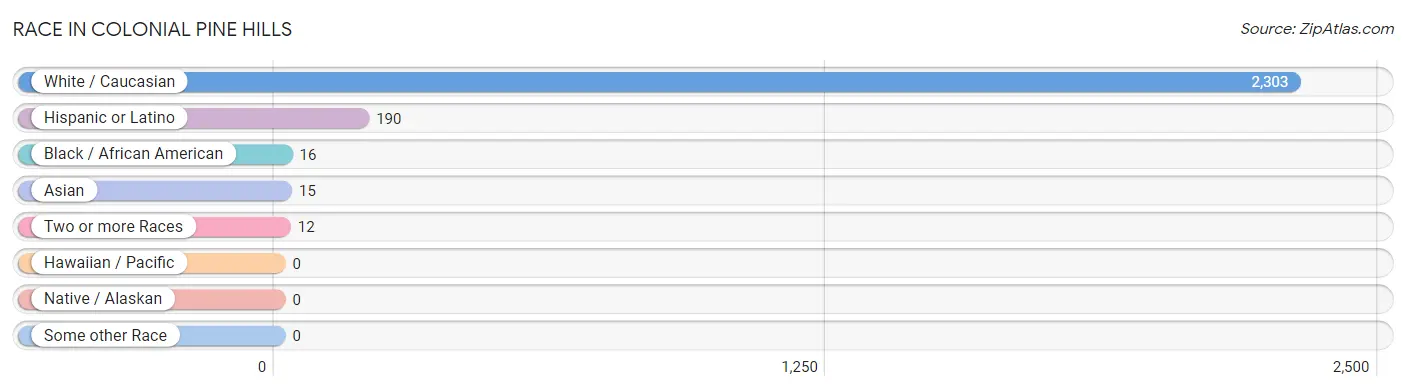
| Race | # Population | % Population |
| Asian | 15 | 0.6% |
| Black / African American | 16 | 0.7% |
| Hawaiian / Pacific | 0 | 0.0% |
| Hispanic or Latino | 190 | 8.1% |
| Native / Alaskan | 0 | 0.0% |
| White / Caucasian | 2,303 | 98.2% |
| Two or more Races | 12 | 0.5% |
| Some other Race | 0 | 0.0% |
| Total | 2,346 | 100.0% |
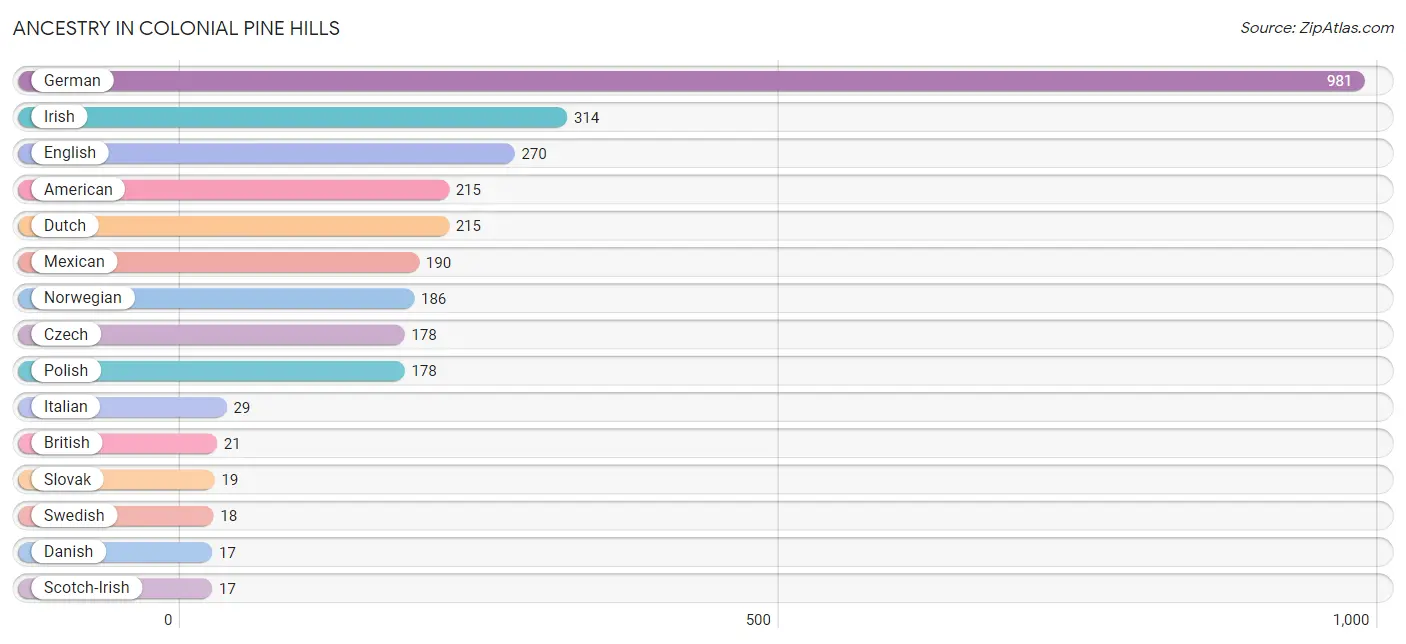
Ancestry in Colonial Pine Hills
The most populous ancestries reported in Colonial Pine Hills are German (981 | 41.8%), Irish (314 | 13.4%), English (270 | 11.5%), American (215 | 9.2%), and Dutch (215 | 9.2%), together accounting for 85.0% of all Colonial Pine Hills residents.
| Ancestry | # Population | % Population |
| African | 16 | 0.7% |
| American | 215 | 9.2% |
| British | 21 | 0.9% |
| Czech | 178 | 7.6% |
| Danish | 17 | 0.7% |
| Dutch | 215 | 9.2% |
| English | 270 | 11.5% |
| European | 16 | 0.7% |
| German | 981 | 41.8% |
| Irish | 314 | 13.4% |
| Italian | 29 | 1.2% |
| Laotian | 15 | 0.6% |
| Mexican | 190 | 8.1% |
| Norwegian | 186 | 7.9% |
| Polish | 178 | 7.6% |
| Scandinavian | 16 | 0.7% |
| Scotch-Irish | 17 | 0.7% |
| Sioux | 12 | 0.5% |
| Slovak | 19 | 0.8% |
| Subsaharan African | 16 | 0.7% |
| Swedish | 18 | 0.8% | View All 21 Rows |
Immigrants in Colonial Pine Hills
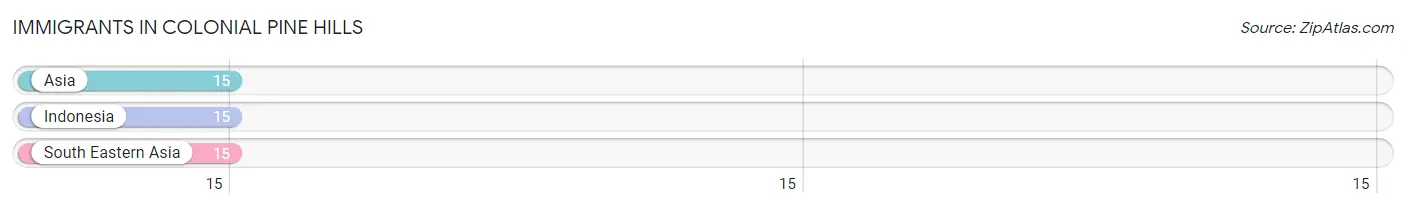
The most numerous immigrant groups reported in Colonial Pine Hills came from Asia (15 | 0.6%), Indonesia (15 | 0.6%), and South Eastern Asia (15 | 0.6%), together accounting for 1.9% of all Colonial Pine Hills residents.
| Immigration Origin | # Population | % Population |
| Asia | 15 | 0.6% |
| Indonesia | 15 | 0.6% |
| South Eastern Asia | 15 | 0.6% | View All 3 Rows |
Sex and Age in Colonial Pine Hills
Sex and Age in Colonial Pine Hills
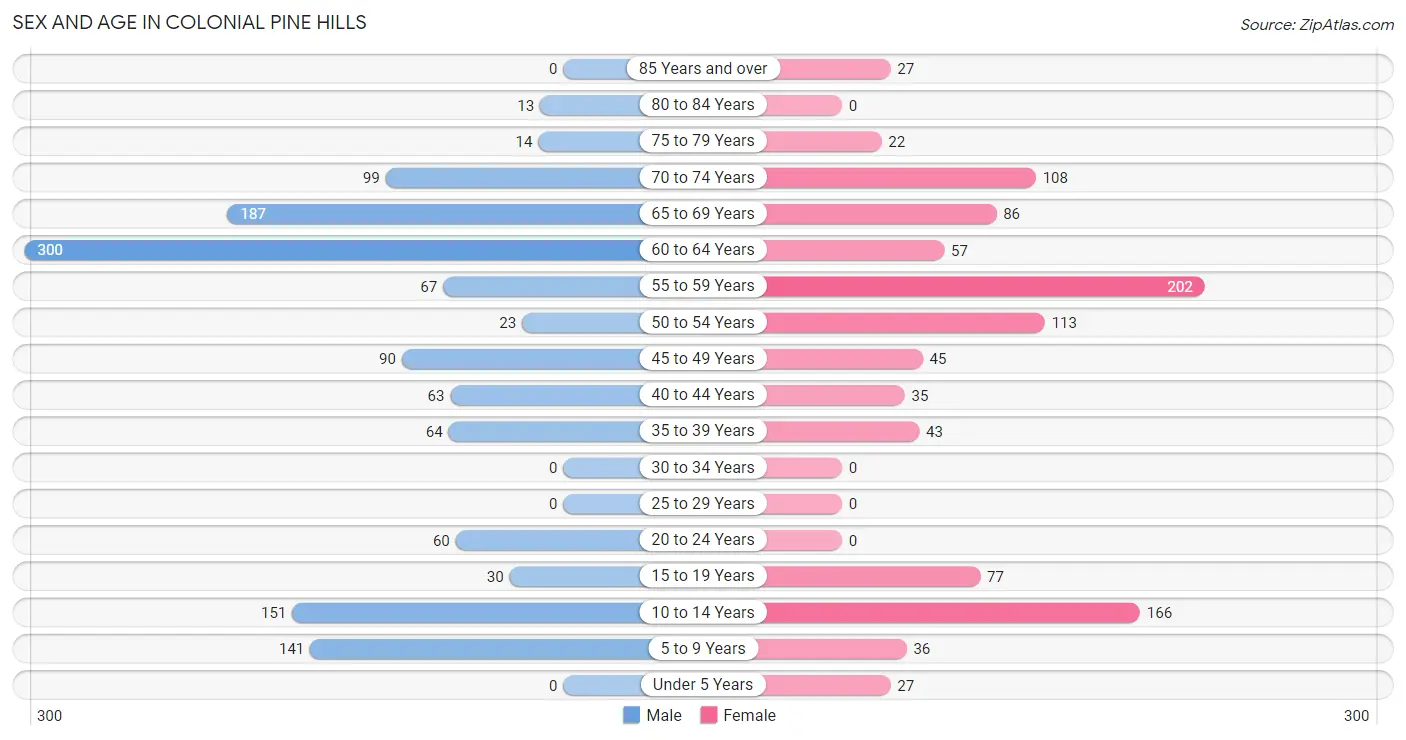
The most populous age groups in Colonial Pine Hills are 60 to 64 Years (300 | 23.0%) for men and 55 to 59 Years (202 | 19.4%) for women.
| Age Bracket | Male | Female |
| Under 5 Years | 0 (0.0%) | 27 (2.6%) |
| 5 to 9 Years | 141 (10.8%) | 36 (3.5%) |
| 10 to 14 Years | 151 (11.6%) | 166 (15.9%) |
| 15 to 19 Years | 30 (2.3%) | 77 (7.4%) |
| 20 to 24 Years | 60 (4.6%) | 0 (0.0%) |
| 25 to 29 Years | 0 (0.0%) | 0 (0.0%) |
| 30 to 34 Years | 0 (0.0%) | 0 (0.0%) |
| 35 to 39 Years | 64 (4.9%) | 43 (4.1%) |
| 40 to 44 Years | 63 (4.8%) | 35 (3.4%) |
| 45 to 49 Years | 90 (6.9%) | 45 (4.3%) |
| 50 to 54 Years | 23 (1.8%) | 113 (10.8%) |
| 55 to 59 Years | 67 (5.1%) | 202 (19.4%) |
| 60 to 64 Years | 300 (23.0%) | 57 (5.5%) |
| 65 to 69 Years | 187 (14.4%) | 86 (8.2%) |
| 70 to 74 Years | 99 (7.6%) | 108 (10.3%) |
| 75 to 79 Years | 14 (1.1%) | 22 (2.1%) |
| 80 to 84 Years | 13 (1.0%) | 0 (0.0%) |
| 85 Years and over | 0 (0.0%) | 27 (2.6%) |
| Total | 1,302 (100.0%) | 1,044 (100.0%) |
Families and Households in Colonial Pine Hills
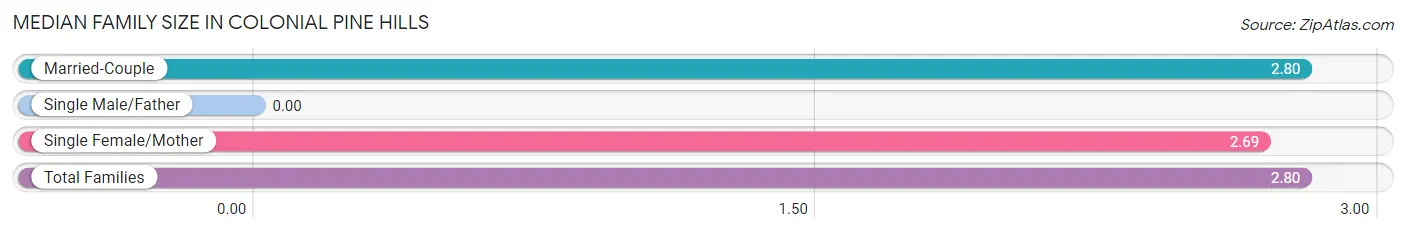
Median Family Size in Colonial Pine Hills
| Family Type | # Families | Family Size |
| Married-Couple | 758 (96.3%) | 2.80 |
| Single Male/Father | 0 (0.0%) | - |
| Single Female/Mother | 29 (3.7%) | 2.69 |
| Total Families | 787 (100.0%) | 2.80 |
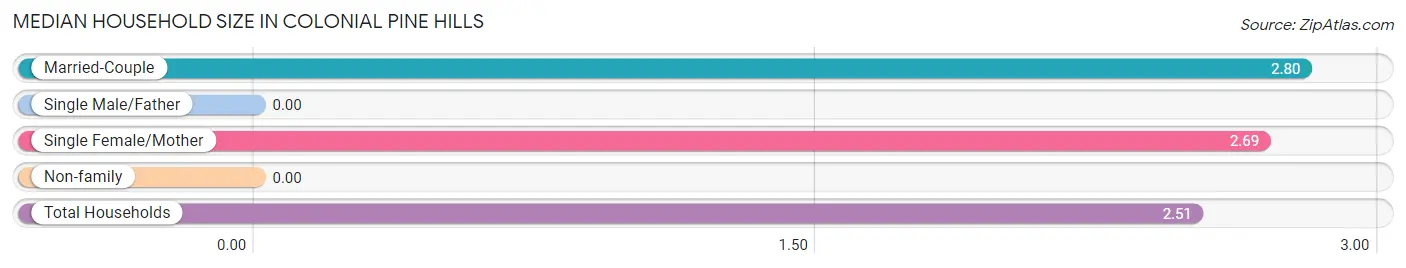
Median Household Size in Colonial Pine Hills
| Household Type | # Households | Household Size |
| Married-Couple | 758 (81.2%) | 2.80 |
| Single Male/Father | 0 (0.0%) | - |
| Single Female/Mother | 29 (3.1%) | 2.69 |
| Non-family | 146 (15.7%) | - |
| Total Households | 933 (100.0%) | 2.51 |
Household Size by Marriage Status in Colonial Pine Hills
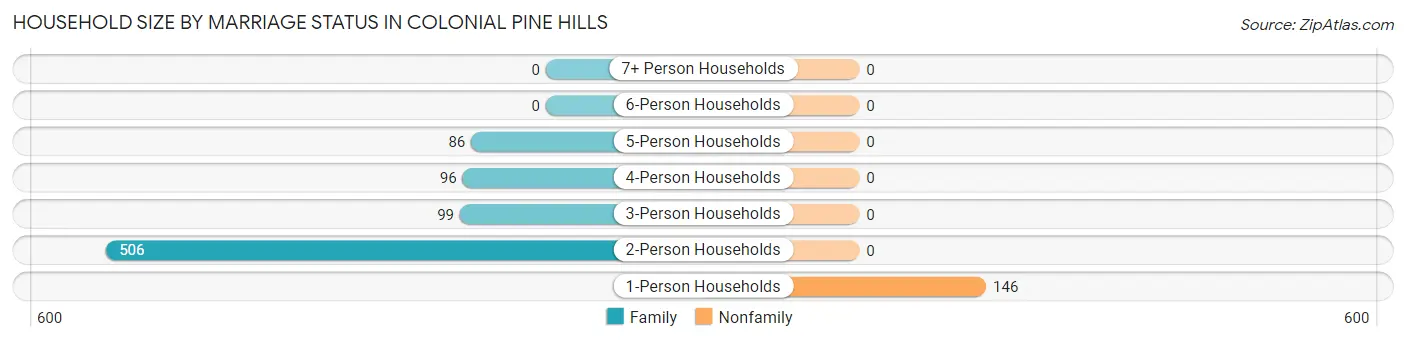
Out of a total of 933 households in Colonial Pine Hills, 787 (84.4%) are family households, while 146 (15.7%) are nonfamily households. The most numerous type of family households are 2-person households, comprising 506, and the most common type of nonfamily households are 1-person households, comprising 146.
| Household Size | Family Households | Nonfamily Households |
| 1-Person Households | - | 146 (15.7%) |
| 2-Person Households | 506 (54.2%) | 0 (0.0%) |
| 3-Person Households | 99 (10.6%) | 0 (0.0%) |
| 4-Person Households | 96 (10.3%) | 0 (0.0%) |
| 5-Person Households | 86 (9.2%) | 0 (0.0%) |
| 6-Person Households | 0 (0.0%) | 0 (0.0%) |
| 7+ Person Households | 0 (0.0%) | 0 (0.0%) |
| Total | 787 (84.4%) | 146 (15.7%) |
Female Fertility in Colonial Pine Hills
Fertility by Age in Colonial Pine Hills
| Age Bracket | Women with Births | Births / 1,000 Women |
| 15 to 19 years | 0 (0.0%) | 0.0 |
| 20 to 34 years | 0 (0.0%) | 0.0 |
| 35 to 50 years | 0 (0.0%) | 0.0 |
| Total | 0 (0.0%) | 0.0 |
Fertility by Age by Marriage Status in Colonial Pine Hills
| Age Bracket | Married | Unmarried |
| 15 to 19 years | 0 (0.0%) | 0 (0.0%) |
| 20 to 34 years | 0 (0.0%) | 0 (0.0%) |
| 35 to 50 years | 0 (0.0%) | 0 (0.0%) |
| Total | 0 (0.0%) | 0 (0.0%) |
Fertility by Education in Colonial Pine Hills
| Educational Attainment | Women with Births | Births / 1,000 Women |
| Less than High School | 0 (0.0%) | 0.0 |
| High School Diploma | 0 (0.0%) | 0.0 |
| College or Associate's Degree | 0 (0.0%) | 0.0 |
| Bachelor's Degree | 0 (0.0%) | 0.0 |
| Graduate Degree | 0 (0.0%) | 0.0 |
| Total | 0 (0.0%) | 0.0 |
Fertility by Education by Marriage Status in Colonial Pine Hills
| Educational Attainment | Married | Unmarried |
| Less than High School | 0 (0.0%) | 0 (0.0%) |
| High School Diploma | 0 (0.0%) | 0 (0.0%) |
| College or Associate's Degree | 0 (0.0%) | 0 (0.0%) |
| Bachelor's Degree | 0 (0.0%) | 0 (0.0%) |
| Graduate Degree | 0 (0.0%) | 0 (0.0%) |
| Total | 0 (0.0%) | 0 (0.0%) |
Employment Characteristics in Colonial Pine Hills
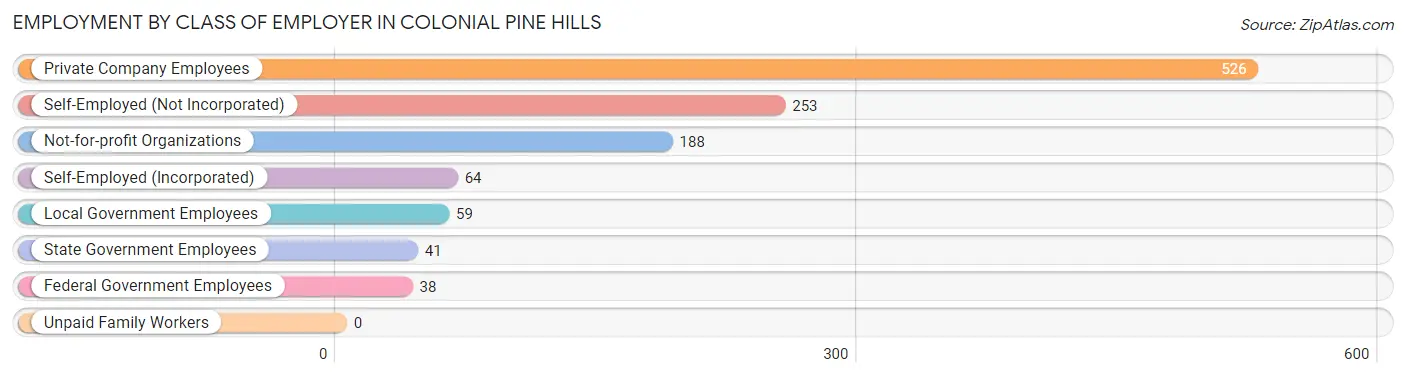
Employment by Class of Employer in Colonial Pine Hills
Among the 1,169 employed individuals in Colonial Pine Hills, private company employees (526 | 45.0%), self-employed (not incorporated) (253 | 21.6%), and not-for-profit organizations (188 | 16.1%) make up the most common classes of employment.
| Employer Class | # Employees | % Employees |
| Private Company Employees | 526 | 45.0% |
| Self-Employed (Incorporated) | 64 | 5.5% |
| Self-Employed (Not Incorporated) | 253 | 21.6% |
| Not-for-profit Organizations | 188 | 16.1% |
| Local Government Employees | 59 | 5.1% |
| State Government Employees | 41 | 3.5% |
| Federal Government Employees | 38 | 3.3% |
| Unpaid Family Workers | 0 | 0.0% |
| Total | 1,169 | 100.0% |
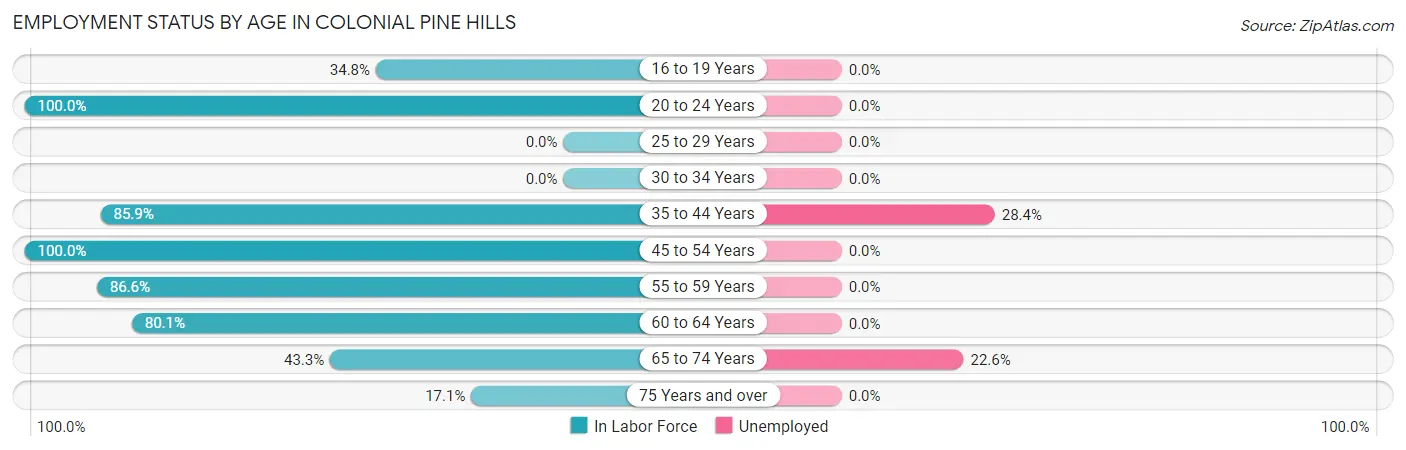
Employment Status by Age in Colonial Pine Hills
According to the labor force statistics for Colonial Pine Hills, out of the total population over 16 years of age (1,807), 70.7% or 1,278 individuals are in the labor force, with 7.6% or 97 of them unemployed. The age group with the highest labor force participation rate is 20 to 24 years, with 100.0% or 60 individuals in the labor force. Within the labor force, the 35 to 44 years age range has the highest percentage of unemployed individuals, with 28.4% or 50 of them being unemployed.
| Age Bracket | In Labor Force | Unemployed |
| 16 to 19 Years | 31 (34.8%) | 0 (0.0%) |
| 20 to 24 Years | 60 (100.0%) | 0 (0.0%) |
| 25 to 29 Years | 0 (0.0%) | 0 (0.0%) |
| 30 to 34 Years | 0 (0.0%) | 0 (0.0%) |
| 35 to 44 Years | 176 (85.9%) | 50 (28.4%) |
| 45 to 54 Years | 271 (100.0%) | 0 (0.0%) |
| 55 to 59 Years | 233 (86.6%) | 0 (0.0%) |
| 60 to 64 Years | 286 (80.1%) | 0 (0.0%) |
| 65 to 74 Years | 208 (43.3%) | 47 (22.6%) |
| 75 Years and over | 13 (17.1%) | 0 (0.0%) |
| Total | 1,278 (70.7%) | 97 (7.6%) |
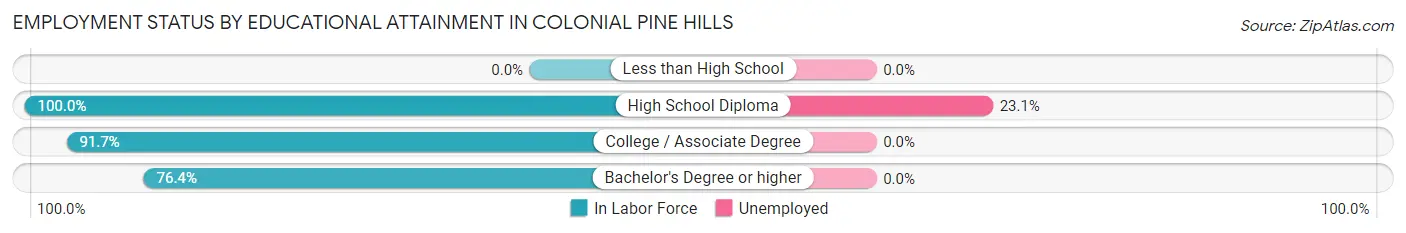
Employment Status by Educational Attainment in Colonial Pine Hills
According to labor force statistics for Colonial Pine Hills, 87.7% of individuals (966) out of the total population between 25 and 64 years of age (1,102) are in the labor force, with 5.2% or 50 of them being unemployed. The group with the highest labor force participation rate are those with the educational attainment of high school diploma, with 100.0% or 216 individuals in the labor force. Within the labor force, individuals with high school diploma education have the highest percentage of unemployment, with 23.1% or 50 of them being unemployed.
| Educational Attainment | In Labor Force | Unemployed |
| Less than High School | 0 (0.0%) | 0 (0.0%) |
| High School Diploma | 216 (100.0%) | 50 (23.1%) |
| College / Associate Degree | 440 (91.7%) | 0 (0.0%) |
| Bachelor's Degree or higher | 310 (76.4%) | 0 (0.0%) |
| Total | 966 (87.7%) | 57 (5.2%) |
Employment Occupations by Sex in Colonial Pine Hills
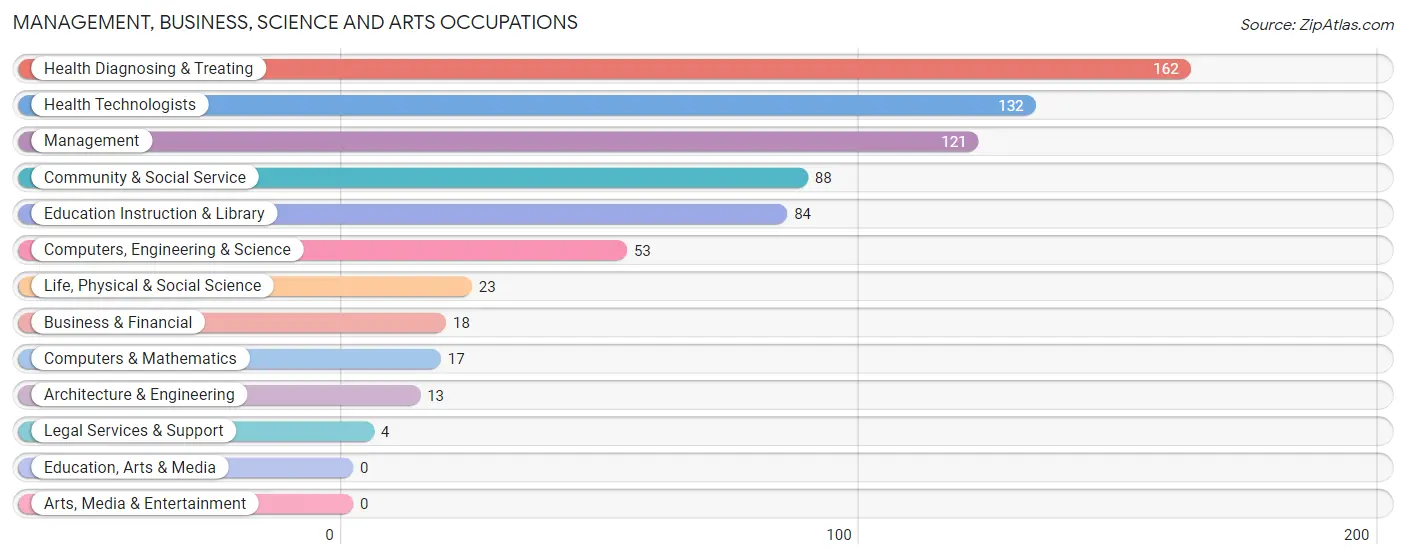
Management, Business, Science and Arts Occupations
The most common Management, Business, Science and Arts occupations in Colonial Pine Hills are Health Diagnosing & Treating (162 | 13.7%), Health Technologists (132 | 11.2%), Management (121 | 10.2%), Community & Social Service (88 | 7.4%), and Education Instruction & Library (84 | 7.1%).
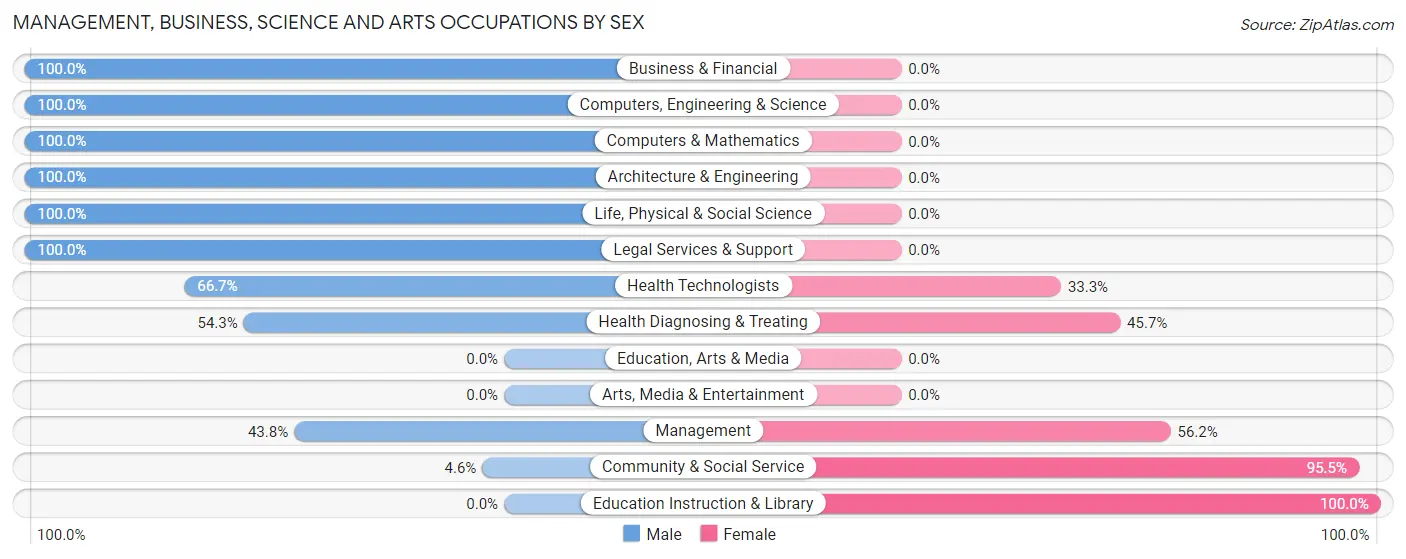
Management, Business, Science and Arts Occupations by Sex
Within the Management, Business, Science and Arts occupations in Colonial Pine Hills, the most male-oriented occupations are Business & Financial (100.0%), Computers, Engineering & Science (100.0%), and Computers & Mathematics (100.0%), while the most female-oriented occupations are Education Instruction & Library (100.0%), Community & Social Service (95.5%), and Management (56.2%).
| Occupation | Male | Female |
| Management | 53 (43.8%) | 68 (56.2%) |
| Business & Financial | 18 (100.0%) | 0 (0.0%) |
| Computers, Engineering & Science | 53 (100.0%) | 0 (0.0%) |
| Computers & Mathematics | 17 (100.0%) | 0 (0.0%) |
| Architecture & Engineering | 13 (100.0%) | 0 (0.0%) |
| Life, Physical & Social Science | 23 (100.0%) | 0 (0.0%) |
| Community & Social Service | 4 (4.5%) | 84 (95.5%) |
| Education, Arts & Media | 0 (0.0%) | 0 (0.0%) |
| Legal Services & Support | 4 (100.0%) | 0 (0.0%) |
| Education Instruction & Library | 0 (0.0%) | 84 (100.0%) |
| Arts, Media & Entertainment | 0 (0.0%) | 0 (0.0%) |
| Health Diagnosing & Treating | 88 (54.3%) | 74 (45.7%) |
| Health Technologists | 88 (66.7%) | 44 (33.3%) |
| Total (Category) | 216 (48.9%) | 226 (51.1%) |
| Total (Overall) | 645 (54.6%) | 536 (45.4%) |
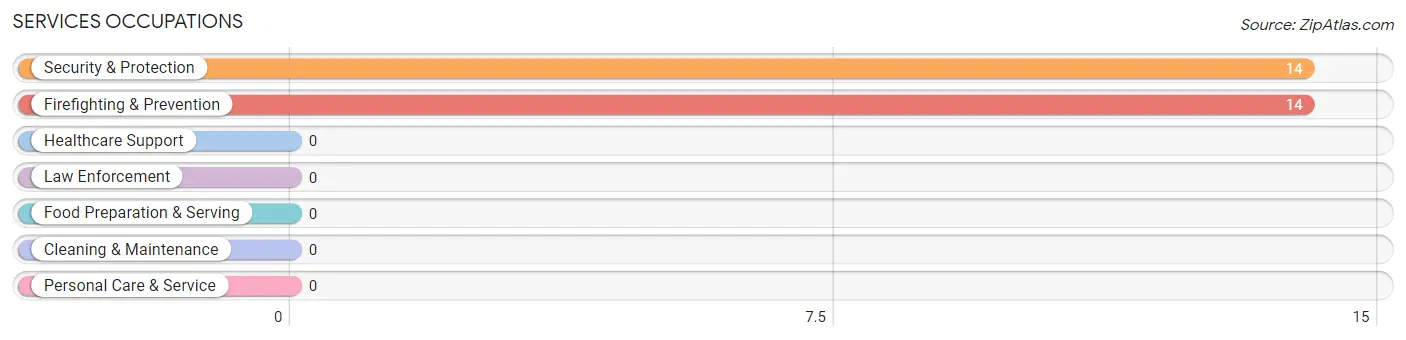
Services Occupations
The most common Services occupations in Colonial Pine Hills are Security & Protection (14 | 1.2%), and Firefighting & Prevention (14 | 1.2%).
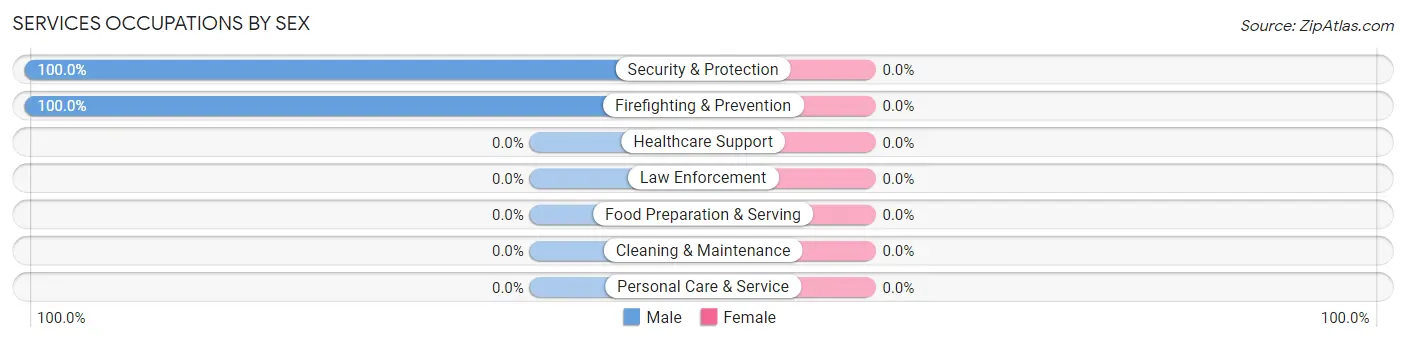
Services Occupations by Sex
| Occupation | Male | Female |
| Healthcare Support | 0 (0.0%) | 0 (0.0%) |
| Security & Protection | 14 (100.0%) | 0 (0.0%) |
| Firefighting & Prevention | 14 (100.0%) | 0 (0.0%) |
| Law Enforcement | 0 (0.0%) | 0 (0.0%) |
| Food Preparation & Serving | 0 (0.0%) | 0 (0.0%) |
| Cleaning & Maintenance | 0 (0.0%) | 0 (0.0%) |
| Personal Care & Service | 0 (0.0%) | 0 (0.0%) |
| Total (Category) | 14 (100.0%) | 0 (0.0%) |
| Total (Overall) | 645 (54.6%) | 536 (45.4%) |
Sales and Office Occupations
The most common Sales and Office occupations in Colonial Pine Hills are Office & Administration (260 | 22.0%), and Sales & Related (51 | 4.3%).
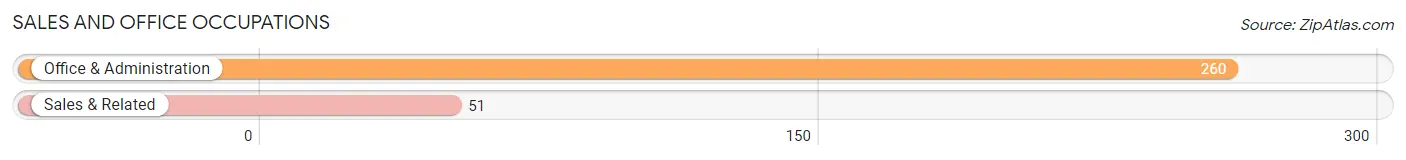
Sales and Office Occupations by Sex

| Occupation | Male | Female |
| Sales & Related | 31 (60.8%) | 20 (39.2%) |
| Office & Administration | 28 (10.8%) | 232 (89.2%) |
| Total (Category) | 59 (19.0%) | 252 (81.0%) |
| Total (Overall) | 645 (54.6%) | 536 (45.4%) |
Natural Resources, Construction and Maintenance Occupations
The most common Natural Resources, Construction and Maintenance occupations in Colonial Pine Hills are , and Construction & Extraction (26 | 2.2%).
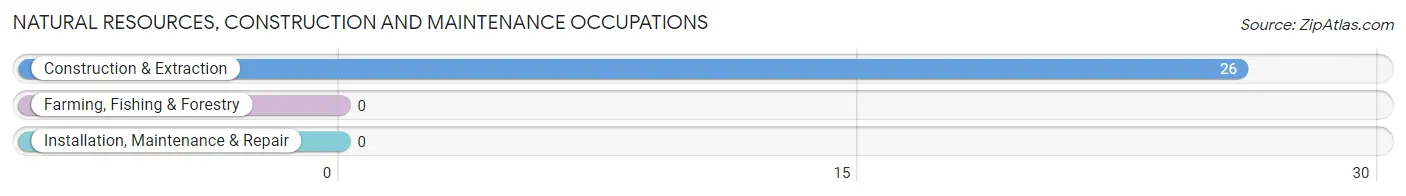
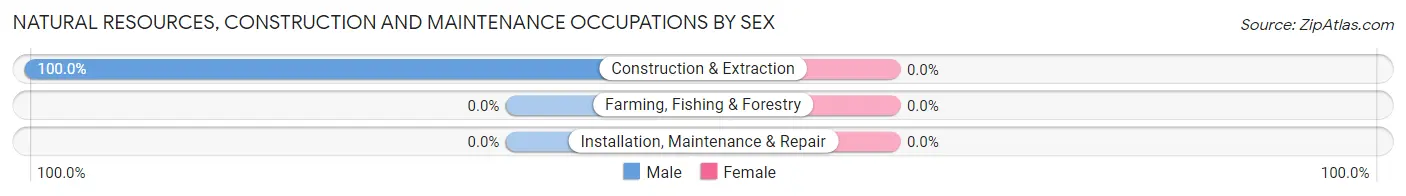
Natural Resources, Construction and Maintenance Occupations by Sex
| Occupation | Male | Female |
| Farming, Fishing & Forestry | 0 (0.0%) | 0 (0.0%) |
| Construction & Extraction | 26 (100.0%) | 0 (0.0%) |
| Installation, Maintenance & Repair | 0 (0.0%) | 0 (0.0%) |
| Total (Category) | 26 (100.0%) | 0 (0.0%) |
| Total (Overall) | 645 (54.6%) | 536 (45.4%) |
Production, Transportation and Moving Occupations
The most common Production, Transportation and Moving occupations in Colonial Pine Hills are Material Moving (178 | 15.1%), Production (174 | 14.7%), and Transportation (36 | 3.0%).
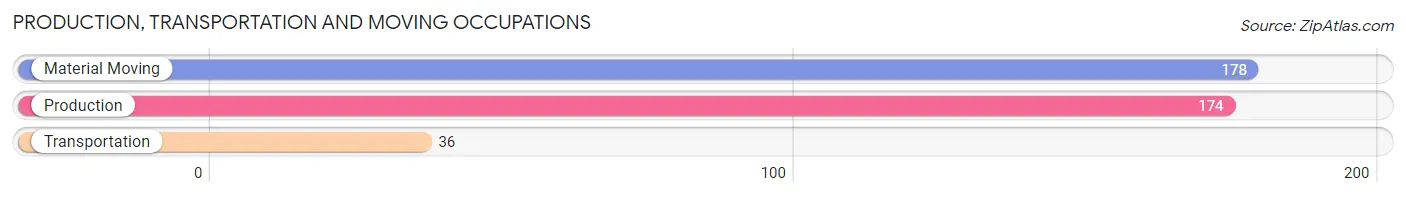
Production, Transportation and Moving Occupations by Sex
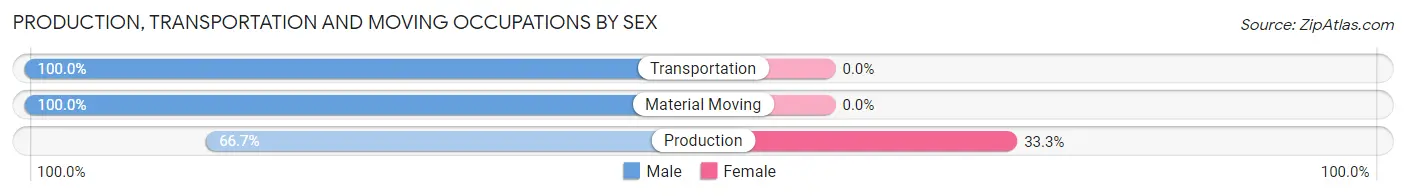
| Occupation | Male | Female |
| Production | 116 (66.7%) | 58 (33.3%) |
| Transportation | 36 (100.0%) | 0 (0.0%) |
| Material Moving | 178 (100.0%) | 0 (0.0%) |
| Total (Category) | 330 (85.1%) | 58 (14.9%) |
| Total (Overall) | 645 (54.6%) | 536 (45.4%) |
Employment Industries by Sex in Colonial Pine Hills
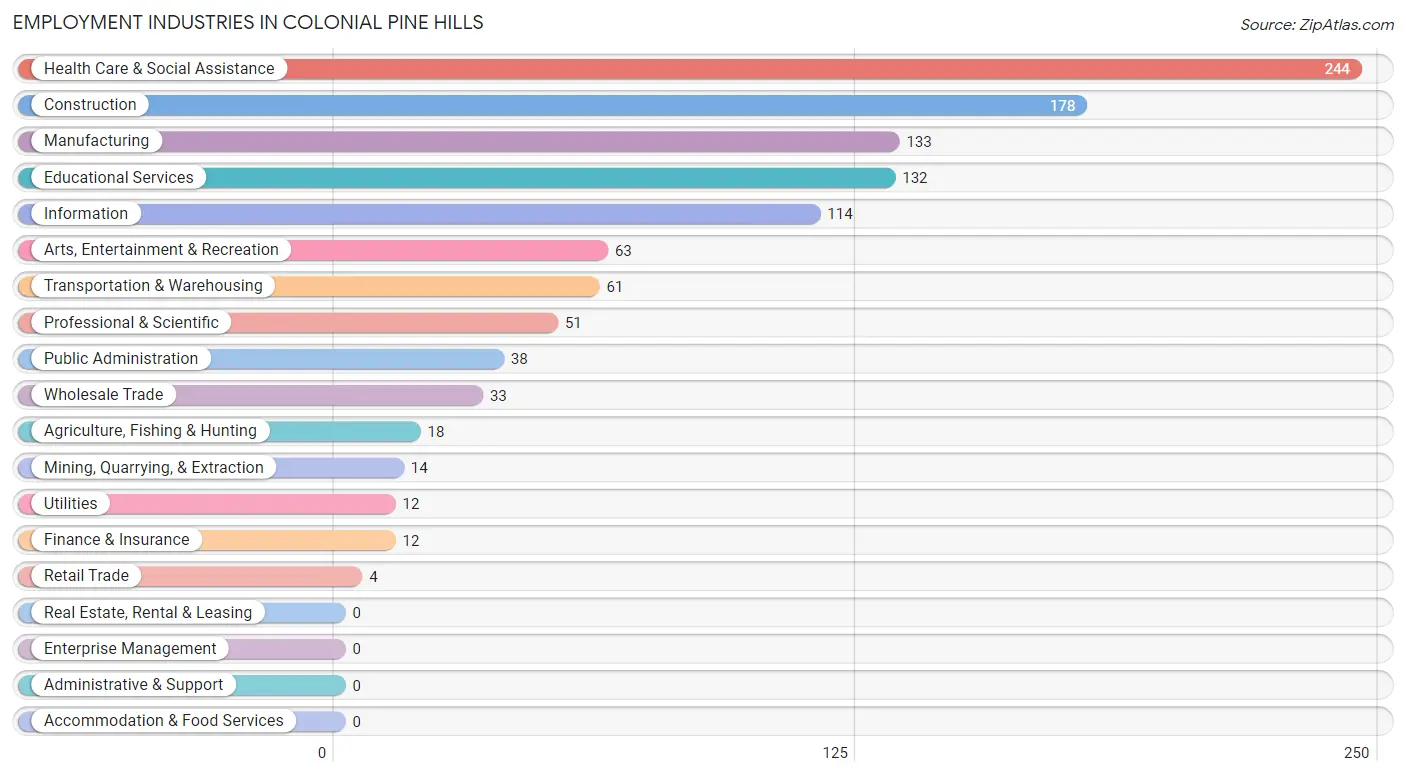
Employment Industries in Colonial Pine Hills
The major employment industries in Colonial Pine Hills include Health Care & Social Assistance (244 | 20.7%), Construction (178 | 15.1%), Manufacturing (133 | 11.3%), Educational Services (132 | 11.2%), and Information (114 | 9.7%).
Employment Industries by Sex in Colonial Pine Hills
The Colonial Pine Hills industries that see more men than women are Agriculture, Fishing & Hunting (100.0%), Mining, Quarrying, & Extraction (100.0%), and Construction (100.0%), whereas the industries that tend to have a higher number of women are Retail Trade (100.0%), Information (100.0%), and Finance & Insurance (100.0%).
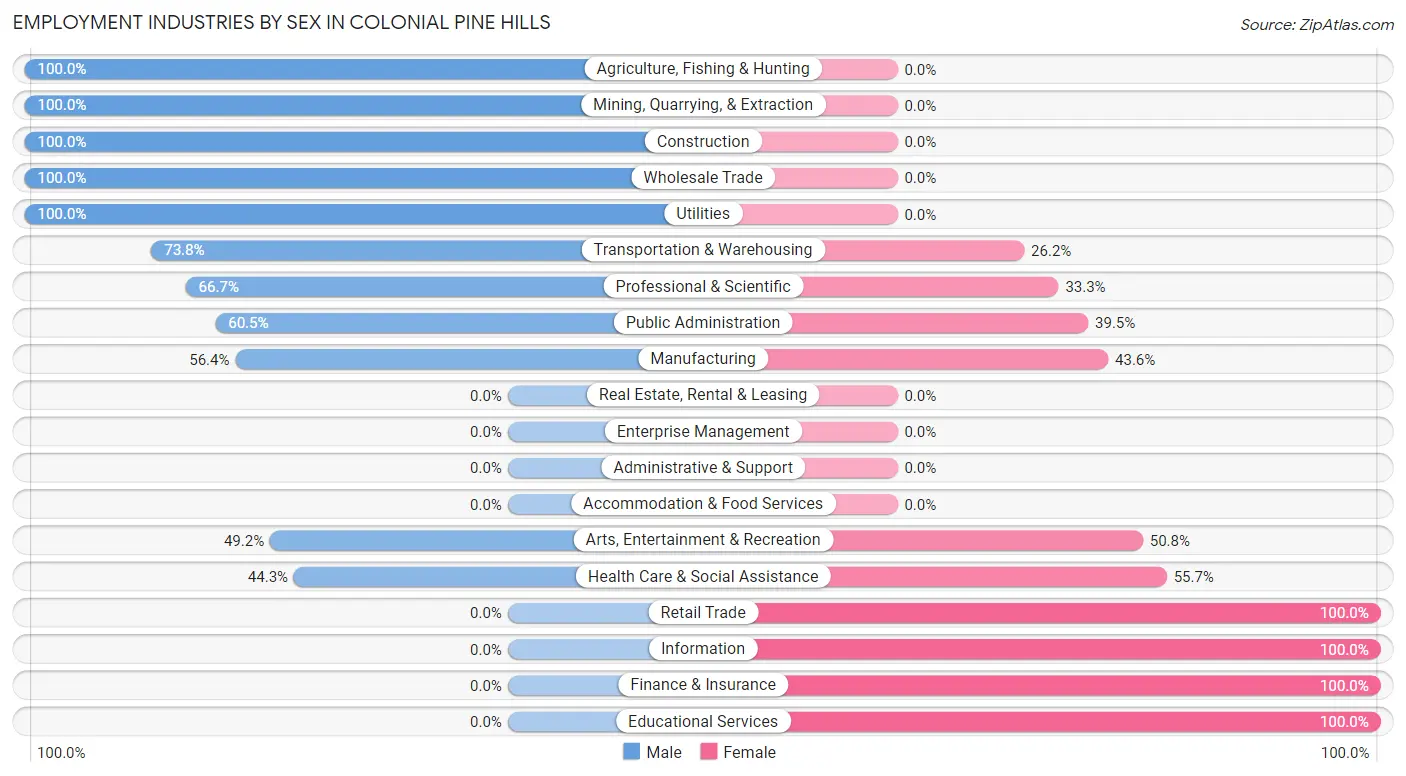
| Industry | Male | Female |
| Agriculture, Fishing & Hunting | 18 (100.0%) | 0 (0.0%) |
| Mining, Quarrying, & Extraction | 14 (100.0%) | 0 (0.0%) |
| Construction | 178 (100.0%) | 0 (0.0%) |
| Manufacturing | 75 (56.4%) | 58 (43.6%) |
| Wholesale Trade | 33 (100.0%) | 0 (0.0%) |
| Retail Trade | 0 (0.0%) | 4 (100.0%) |
| Transportation & Warehousing | 45 (73.8%) | 16 (26.2%) |
| Utilities | 12 (100.0%) | 0 (0.0%) |
| Information | 0 (0.0%) | 114 (100.0%) |
| Finance & Insurance | 0 (0.0%) | 12 (100.0%) |
| Real Estate, Rental & Leasing | 0 (0.0%) | 0 (0.0%) |
| Professional & Scientific | 34 (66.7%) | 17 (33.3%) |
| Enterprise Management | 0 (0.0%) | 0 (0.0%) |
| Administrative & Support | 0 (0.0%) | 0 (0.0%) |
| Educational Services | 0 (0.0%) | 132 (100.0%) |
| Health Care & Social Assistance | 108 (44.3%) | 136 (55.7%) |
| Arts, Entertainment & Recreation | 31 (49.2%) | 32 (50.8%) |
| Accommodation & Food Services | 0 (0.0%) | 0 (0.0%) |
| Public Administration | 23 (60.5%) | 15 (39.5%) |
| Total | 645 (54.6%) | 536 (45.4%) |
Education in Colonial Pine Hills
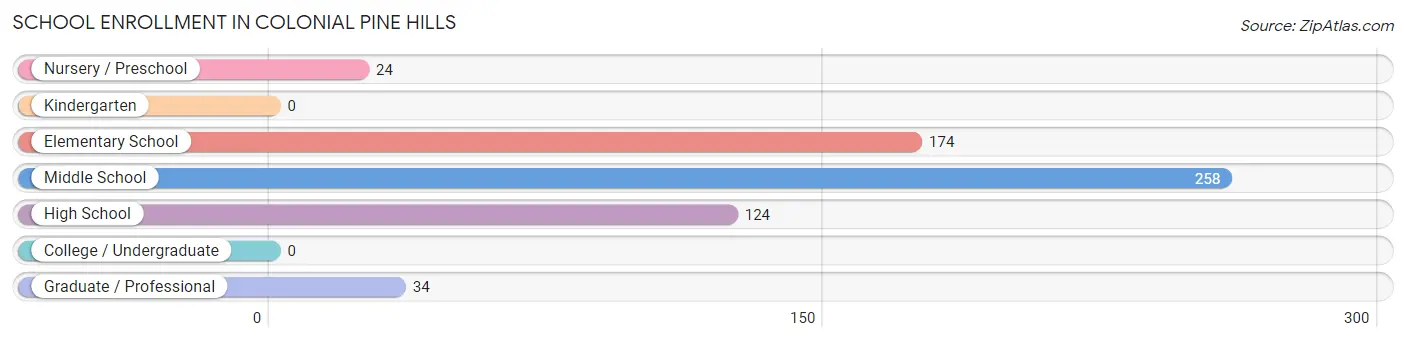
School Enrollment in Colonial Pine Hills
The most common levels of schooling among the 614 students in Colonial Pine Hills are middle school (258 | 42.0%), elementary school (174 | 28.3%), and high school (124 | 20.2%).
| School Level | # Students | % Students |
| Nursery / Preschool | 24 | 3.9% |
| Kindergarten | 0 | 0.0% |
| Elementary School | 174 | 28.3% |
| Middle School | 258 | 42.0% |
| High School | 124 | 20.2% |
| College / Undergraduate | 0 | 0.0% |
| Graduate / Professional | 34 | 5.5% |
| Total | 614 | 100.0% |
School Enrollment by Age by Funding Source in Colonial Pine Hills
Out of a total of 614 students who are enrolled in schools in Colonial Pine Hills, 104 (16.9%) attend a private institution, while the remaining 510 (83.1%) are enrolled in public schools. The age group of 5 to 9 year old has the highest likelihood of being enrolled in private schools, with 41 (23.2% in the age bracket) enrolled. Conversely, the age group of 35 years and over has the lowest likelihood of being enrolled in a private school, with 34 (100.0% in the age bracket) attending a public institution.
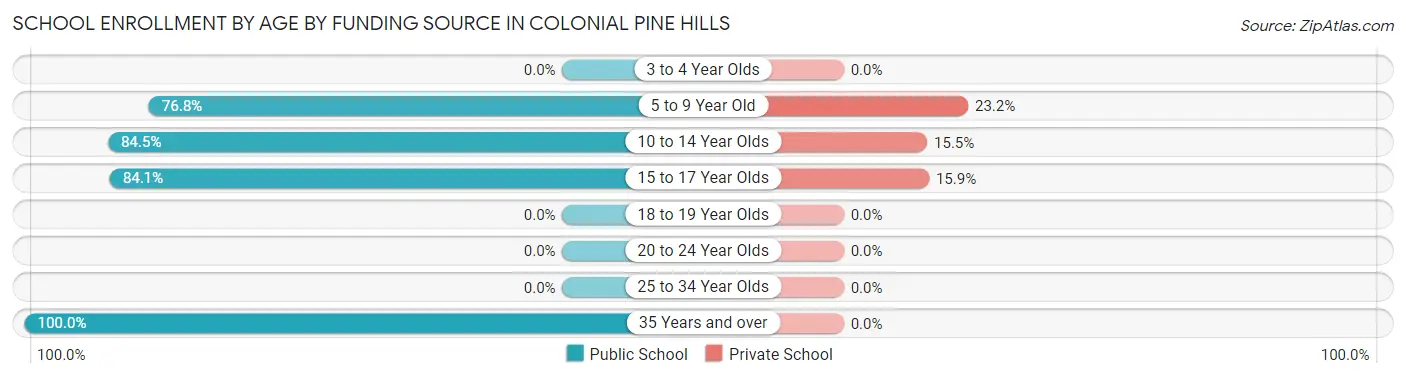
| Age Bracket | Public School | Private School |
| 3 to 4 Year Olds | 0 (0.0%) | 0 (0.0%) |
| 5 to 9 Year Old | 136 (76.8%) | 41 (23.2%) |
| 10 to 14 Year Olds | 250 (84.5%) | 46 (15.5%) |
| 15 to 17 Year Olds | 90 (84.1%) | 17 (15.9%) |
| 18 to 19 Year Olds | 0 (0.0%) | 0 (0.0%) |
| 20 to 24 Year Olds | 0 (0.0%) | 0 (0.0%) |
| 25 to 34 Year Olds | 0 (0.0%) | 0 (0.0%) |
| 35 Years and over | 34 (100.0%) | 0 (0.0%) |
| Total | 510 (83.1%) | 104 (16.9%) |
Educational Attainment by Field of Study in Colonial Pine Hills
Education (108 | 18.2%), business (95 | 16.0%), science & technology (71 | 12.0%), bio, nature & agricultural (67 | 11.3%), and physical & health sciences (60 | 10.1%) are the most common fields of study among 593 individuals in Colonial Pine Hills who have obtained a bachelor's degree or higher.
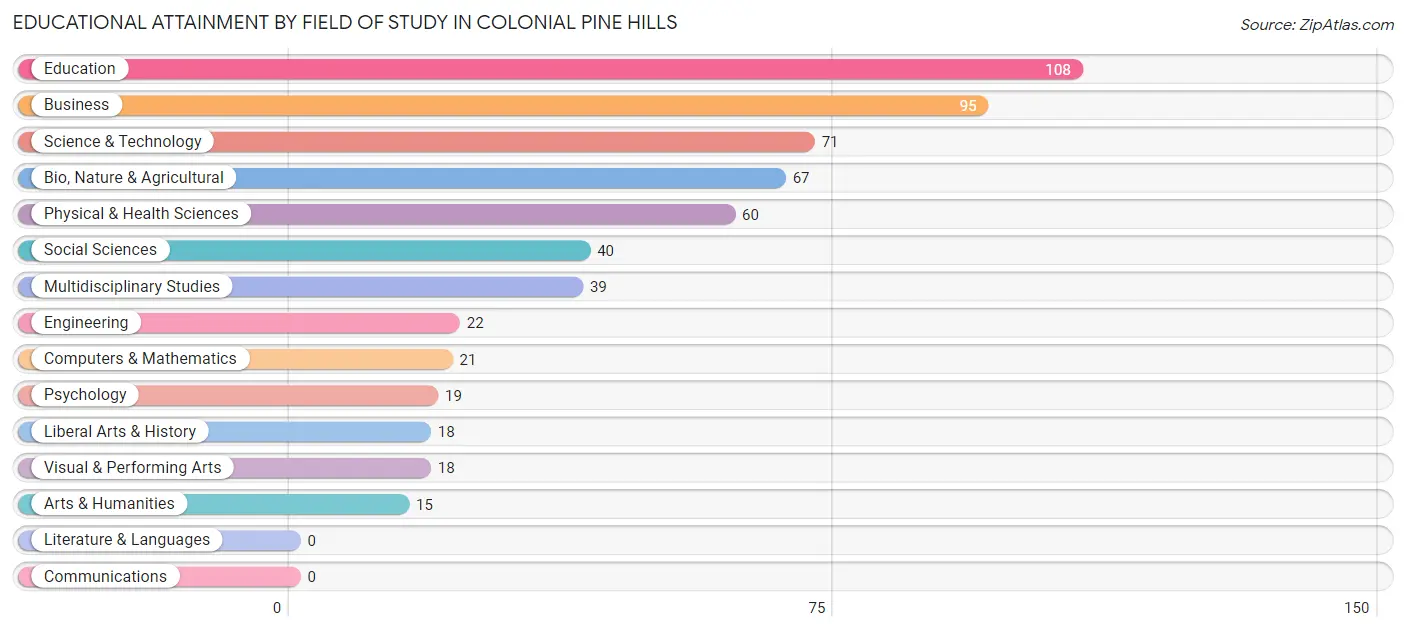
| Field of Study | # Graduates | % Graduates |
| Computers & Mathematics | 21 | 3.5% |
| Bio, Nature & Agricultural | 67 | 11.3% |
| Physical & Health Sciences | 60 | 10.1% |
| Psychology | 19 | 3.2% |
| Social Sciences | 40 | 6.8% |
| Engineering | 22 | 3.7% |
| Multidisciplinary Studies | 39 | 6.6% |
| Science & Technology | 71 | 12.0% |
| Business | 95 | 16.0% |
| Education | 108 | 18.2% |
| Literature & Languages | 0 | 0.0% |
| Liberal Arts & History | 18 | 3.0% |
| Visual & Performing Arts | 18 | 3.0% |
| Communications | 0 | 0.0% |
| Arts & Humanities | 15 | 2.5% |
| Total | 593 | 100.0% |
Transportation & Commute in Colonial Pine Hills
Vehicle Availability by Sex in Colonial Pine Hills
The most prevalent vehicle ownership categories in Colonial Pine Hills are males with 3 vehicles (271, accounting for 42.0%) and females with 3 vehicles (202, making up 51.7%).
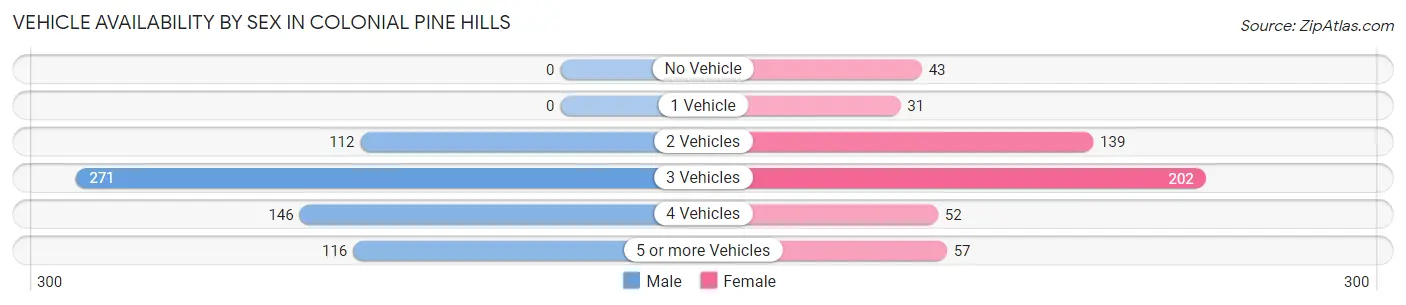
| Vehicles Available | Male | Female |
| No Vehicle | 0 (0.0%) | 43 (8.2%) |
| 1 Vehicle | 0 (0.0%) | 31 (5.9%) |
| 2 Vehicles | 112 (17.4%) | 139 (26.5%) |
| 3 Vehicles | 271 (42.0%) | 202 (38.6%) |
| 4 Vehicles | 146 (22.6%) | 52 (9.9%) |
| 5 or more Vehicles | 116 (18.0%) | 57 (10.9%) |
| Total | 645 (100.0%) | 524 (100.0%) |
Commute Time in Colonial Pine Hills
The most frequently occuring commute durations in Colonial Pine Hills are 20 to 24 minutes (449 commuters, 39.4%), 15 to 19 minutes (266 commuters, 23.3%), and 25 to 29 minutes (193 commuters, 16.9%).
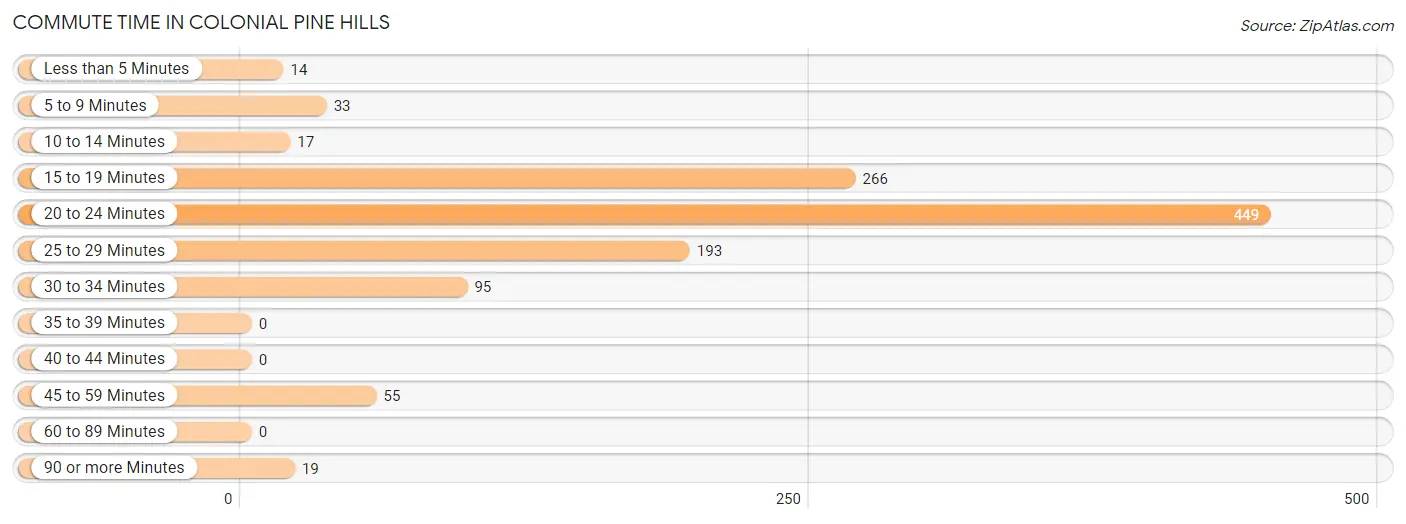
| Commute Time | # Commuters | % Commuters |
| Less than 5 Minutes | 14 | 1.2% |
| 5 to 9 Minutes | 33 | 2.9% |
| 10 to 14 Minutes | 17 | 1.5% |
| 15 to 19 Minutes | 266 | 23.3% |
| 20 to 24 Minutes | 449 | 39.4% |
| 25 to 29 Minutes | 193 | 16.9% |
| 30 to 34 Minutes | 95 | 8.3% |
| 35 to 39 Minutes | 0 | 0.0% |
| 40 to 44 Minutes | 0 | 0.0% |
| 45 to 59 Minutes | 55 | 4.8% |
| 60 to 89 Minutes | 0 | 0.0% |
| 90 or more Minutes | 19 | 1.7% |
Commute Time by Sex in Colonial Pine Hills
The most common commute times in Colonial Pine Hills are 20 to 24 minutes (239 commuters, 37.8%) for males and 20 to 24 minutes (210 commuters, 41.3%) for females.
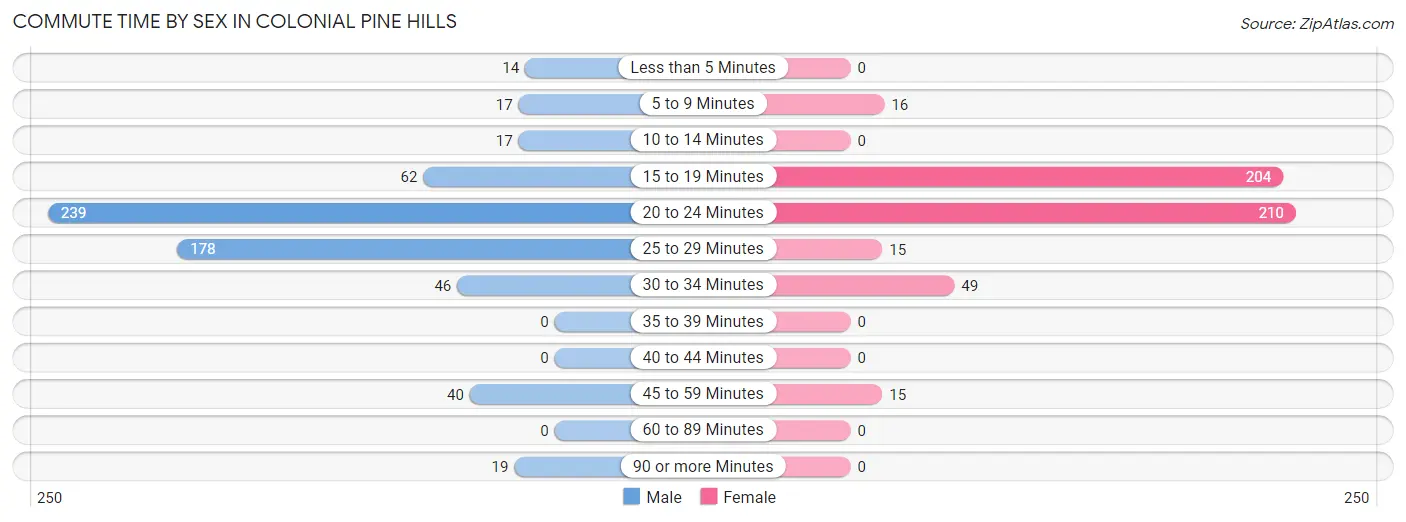
| Commute Time | Male | Female |
| Less than 5 Minutes | 14 (2.2%) | 0 (0.0%) |
| 5 to 9 Minutes | 17 (2.7%) | 16 (3.1%) |
| 10 to 14 Minutes | 17 (2.7%) | 0 (0.0%) |
| 15 to 19 Minutes | 62 (9.8%) | 204 (40.1%) |
| 20 to 24 Minutes | 239 (37.8%) | 210 (41.3%) |
| 25 to 29 Minutes | 178 (28.2%) | 15 (2.9%) |
| 30 to 34 Minutes | 46 (7.3%) | 49 (9.6%) |
| 35 to 39 Minutes | 0 (0.0%) | 0 (0.0%) |
| 40 to 44 Minutes | 0 (0.0%) | 0 (0.0%) |
| 45 to 59 Minutes | 40 (6.3%) | 15 (2.9%) |
| 60 to 89 Minutes | 0 (0.0%) | 0 (0.0%) |
| 90 or more Minutes | 19 (3.0%) | 0 (0.0%) |
Time of Departure to Work by Sex in Colonial Pine Hills
The most frequent times of departure to work in Colonial Pine Hills are 8:00 AM to 8:29 AM (253, 40.0%) for males and 6:30 AM to 6:59 AM (217, 42.6%) for females.
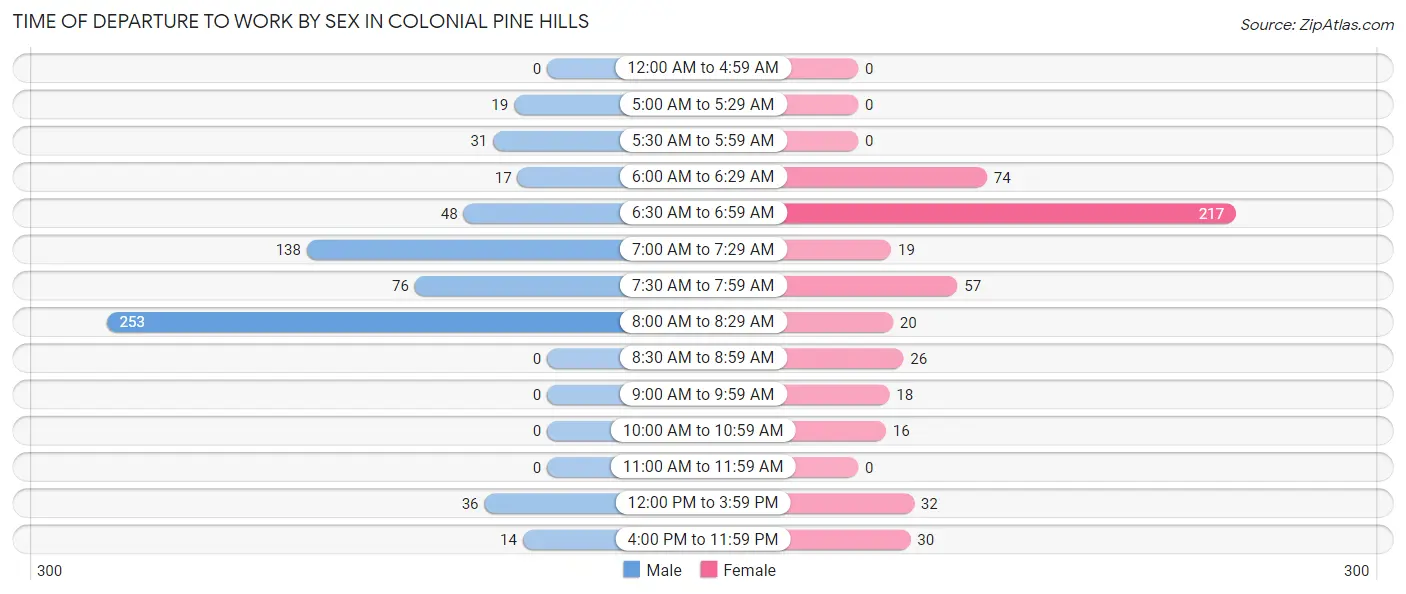
| Time of Departure | Male | Female |
| 12:00 AM to 4:59 AM | 0 (0.0%) | 0 (0.0%) |
| 5:00 AM to 5:29 AM | 19 (3.0%) | 0 (0.0%) |
| 5:30 AM to 5:59 AM | 31 (4.9%) | 0 (0.0%) |
| 6:00 AM to 6:29 AM | 17 (2.7%) | 74 (14.5%) |
| 6:30 AM to 6:59 AM | 48 (7.6%) | 217 (42.6%) |
| 7:00 AM to 7:29 AM | 138 (21.8%) | 19 (3.7%) |
| 7:30 AM to 7:59 AM | 76 (12.0%) | 57 (11.2%) |
| 8:00 AM to 8:29 AM | 253 (40.0%) | 20 (3.9%) |
| 8:30 AM to 8:59 AM | 0 (0.0%) | 26 (5.1%) |
| 9:00 AM to 9:59 AM | 0 (0.0%) | 18 (3.5%) |
| 10:00 AM to 10:59 AM | 0 (0.0%) | 16 (3.1%) |
| 11:00 AM to 11:59 AM | 0 (0.0%) | 0 (0.0%) |
| 12:00 PM to 3:59 PM | 36 (5.7%) | 32 (6.3%) |
| 4:00 PM to 11:59 PM | 14 (2.2%) | 30 (5.9%) |
| Total | 632 (100.0%) | 509 (100.0%) |
Housing Occupancy in Colonial Pine Hills
Occupancy by Ownership in Colonial Pine Hills
Of the total 933 dwellings in Colonial Pine Hills, owner-occupied units account for 933 (100.0%), while renter-occupied units make up 0 (0.0%).
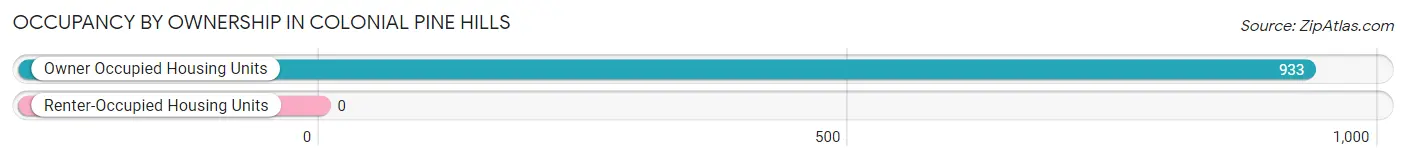
| Occupancy | # Housing Units | % Housing Units |
| Owner Occupied Housing Units | 933 | 100.0% |
| Renter-Occupied Housing Units | 0 | 0.0% |
| Total Occupied Housing Units | 933 | 100.0% |
Occupancy by Household Size in Colonial Pine Hills
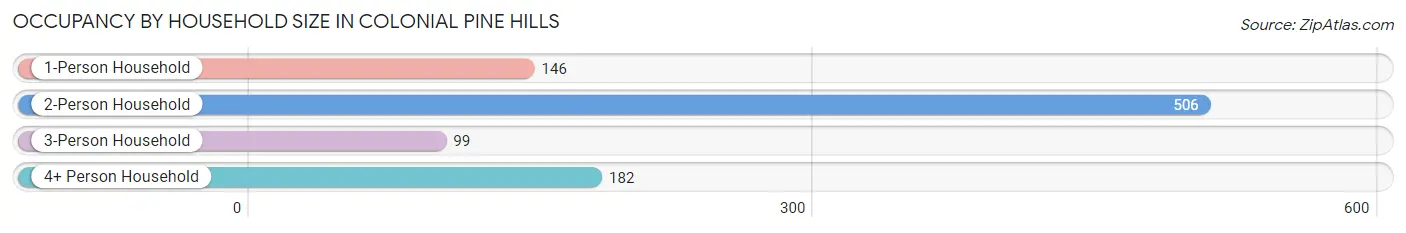
| Household Size | # Housing Units | % Housing Units |
| 1-Person Household | 146 | 15.7% |
| 2-Person Household | 506 | 54.2% |
| 3-Person Household | 99 | 10.6% |
| 4+ Person Household | 182 | 19.5% |
| Total Housing Units | 933 | 100.0% |
Occupancy by Ownership by Household Size in Colonial Pine Hills
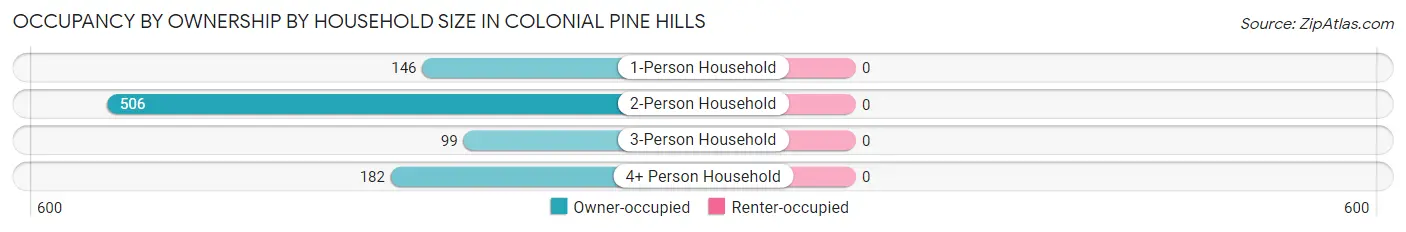
| Household Size | Owner-occupied | Renter-occupied |
| 1-Person Household | 146 (100.0%) | 0 (0.0%) |
| 2-Person Household | 506 (100.0%) | 0 (0.0%) |
| 3-Person Household | 99 (100.0%) | 0 (0.0%) |
| 4+ Person Household | 182 (100.0%) | 0 (0.0%) |
| Total Housing Units | 933 (100.0%) | 0 (0.0%) |
Occupancy by Educational Attainment in Colonial Pine Hills
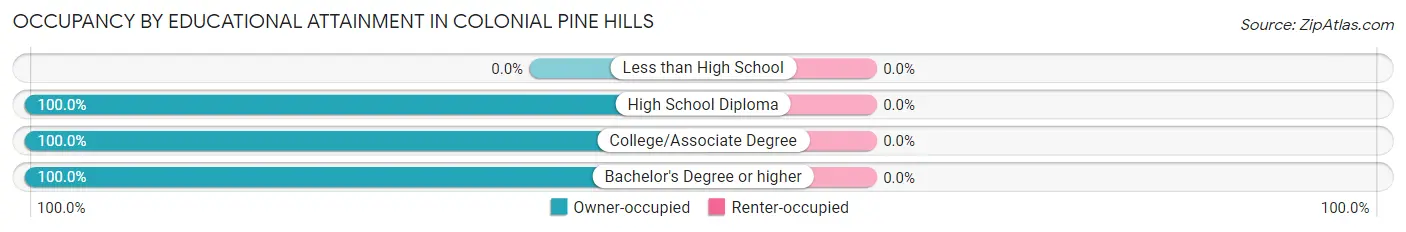
| Household Size | Owner-occupied | Renter-occupied |
| Less than High School | 0 (0.0%) | 0 (0.0%) |
| High School Diploma | 259 (100.0%) | 0 (0.0%) |
| College/Associate Degree | 298 (100.0%) | 0 (0.0%) |
| Bachelor's Degree or higher | 376 (100.0%) | 0 (0.0%) |
Occupancy by Age of Householder in Colonial Pine Hills
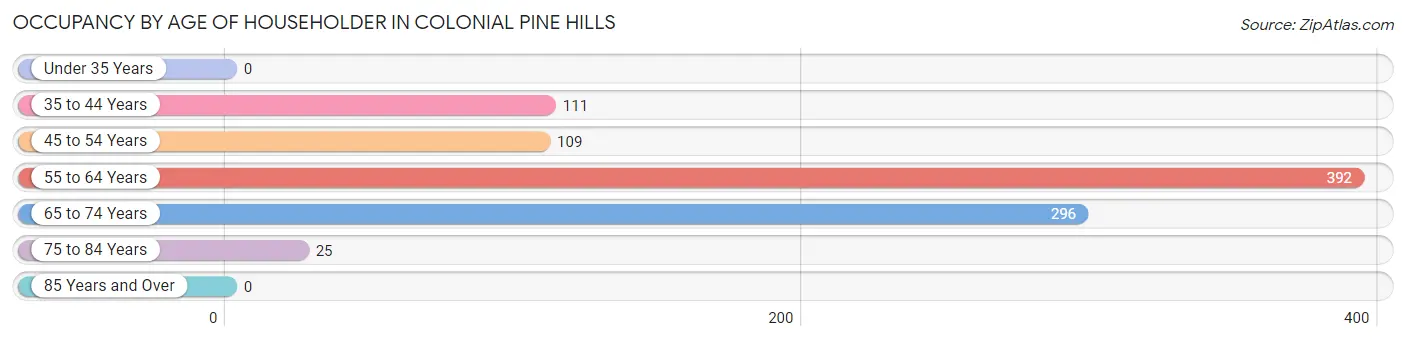
| Age Bracket | # Households | % Households |
| Under 35 Years | 0 | 0.0% |
| 35 to 44 Years | 111 | 11.9% |
| 45 to 54 Years | 109 | 11.7% |
| 55 to 64 Years | 392 | 42.0% |
| 65 to 74 Years | 296 | 31.7% |
| 75 to 84 Years | 25 | 2.7% |
| 85 Years and Over | 0 | 0.0% |
| Total | 933 | 100.0% |
Housing Finances in Colonial Pine Hills
Median Income by Occupancy in Colonial Pine Hills
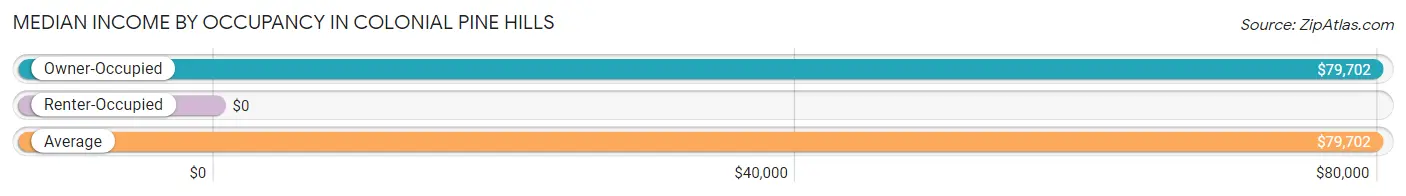
| Occupancy Type | # Households | Median Income |
| Owner-Occupied | 933 (100.0%) | $79,702 |
| Renter-Occupied | 0 (0.0%) | $0 |
| Average | 933 (100.0%) | $79,702 |
Occupancy by Householder Income Bracket in Colonial Pine Hills
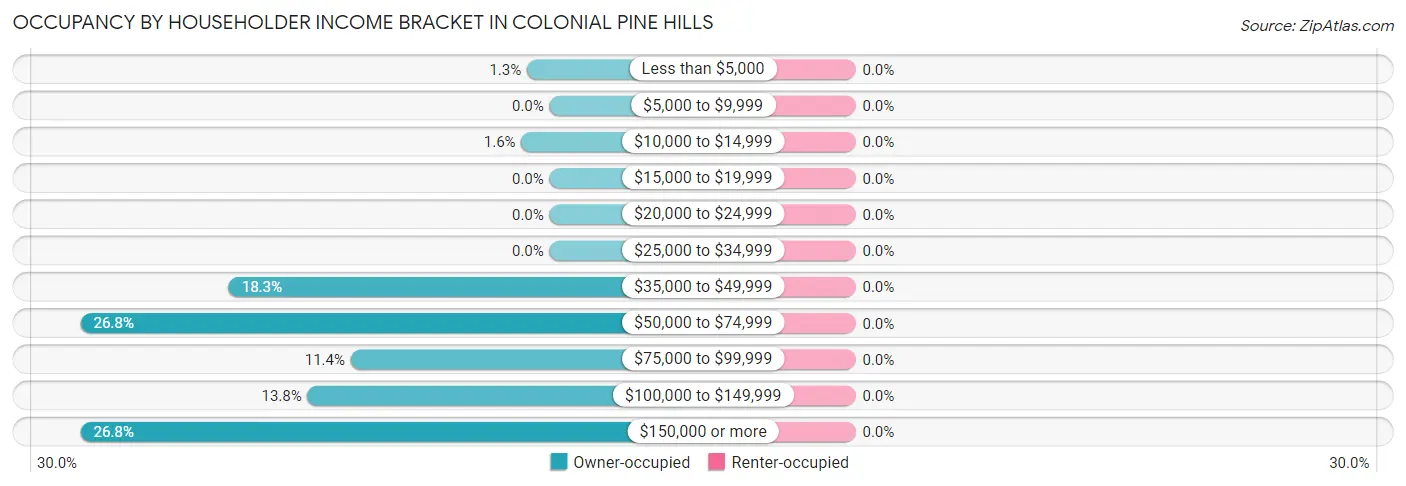
| Income Bracket | Owner-occupied | Renter-occupied |
| Less than $5,000 | 12 (1.3%) | 0 (0.0%) |
| $5,000 to $9,999 | 0 (0.0%) | 0 (0.0%) |
| $10,000 to $14,999 | 15 (1.6%) | 0 (0.0%) |
| $15,000 to $19,999 | 0 (0.0%) | 0 (0.0%) |
| $20,000 to $24,999 | 0 (0.0%) | 0 (0.0%) |
| $25,000 to $34,999 | 0 (0.0%) | 0 (0.0%) |
| $35,000 to $49,999 | 171 (18.3%) | 0 (0.0%) |
| $50,000 to $74,999 | 250 (26.8%) | 0 (0.0%) |
| $75,000 to $99,999 | 106 (11.4%) | 0 (0.0%) |
| $100,000 to $149,999 | 129 (13.8%) | 0 (0.0%) |
| $150,000 or more | 250 (26.8%) | 0 (0.0%) |
| Total | 933 (100.0%) | 0 (0.0%) |
Monthly Housing Cost Tiers in Colonial Pine Hills
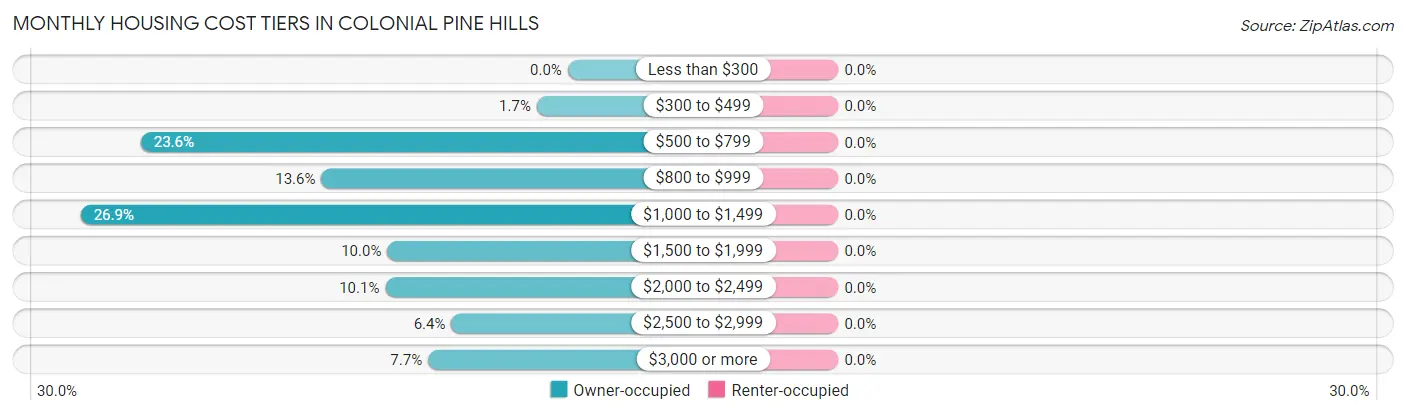
| Monthly Cost | Owner-occupied | Renter-occupied |
| Less than $300 | 0 (0.0%) | 0 (0.0%) |
| $300 to $499 | 16 (1.7%) | 0 (0.0%) |
| $500 to $799 | 220 (23.6%) | 0 (0.0%) |
| $800 to $999 | 127 (13.6%) | 0 (0.0%) |
| $1,000 to $1,499 | 251 (26.9%) | 0 (0.0%) |
| $1,500 to $1,999 | 93 (10.0%) | 0 (0.0%) |
| $2,000 to $2,499 | 94 (10.1%) | 0 (0.0%) |
| $2,500 to $2,999 | 60 (6.4%) | 0 (0.0%) |
| $3,000 or more | 72 (7.7%) | 0 (0.0%) |
| Total | 933 (100.0%) | 0 (0.0%) |
Physical Housing Characteristics in Colonial Pine Hills
Housing Structures in Colonial Pine Hills
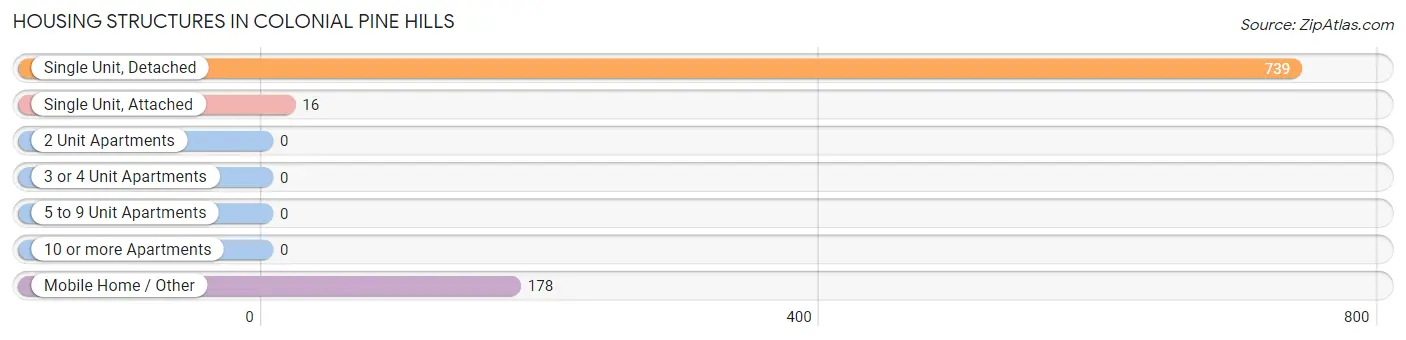
| Structure Type | # Housing Units | % Housing Units |
| Single Unit, Detached | 739 | 79.2% |
| Single Unit, Attached | 16 | 1.7% |
| 2 Unit Apartments | 0 | 0.0% |
| 3 or 4 Unit Apartments | 0 | 0.0% |
| 5 to 9 Unit Apartments | 0 | 0.0% |
| 10 or more Apartments | 0 | 0.0% |
| Mobile Home / Other | 178 | 19.1% |
| Total | 933 | 100.0% |
Housing Structures by Occupancy in Colonial Pine Hills
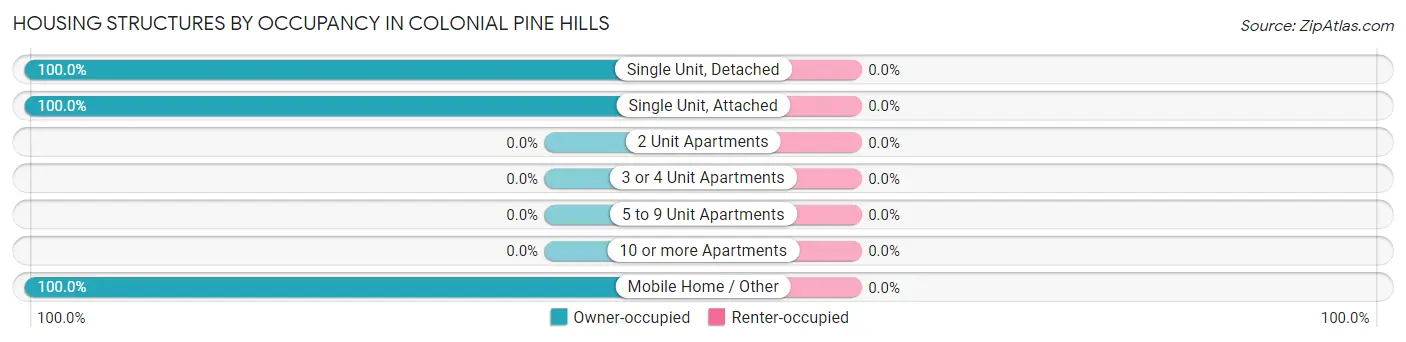
| Structure Type | Owner-occupied | Renter-occupied |
| Single Unit, Detached | 739 (100.0%) | 0 (0.0%) |
| Single Unit, Attached | 16 (100.0%) | 0 (0.0%) |
| 2 Unit Apartments | 0 (0.0%) | 0 (0.0%) |
| 3 or 4 Unit Apartments | 0 (0.0%) | 0 (0.0%) |
| 5 to 9 Unit Apartments | 0 (0.0%) | 0 (0.0%) |
| 10 or more Apartments | 0 (0.0%) | 0 (0.0%) |
| Mobile Home / Other | 178 (100.0%) | 0 (0.0%) |
| Total | 933 (100.0%) | 0 (0.0%) |
Housing Structures by Number of Rooms in Colonial Pine Hills
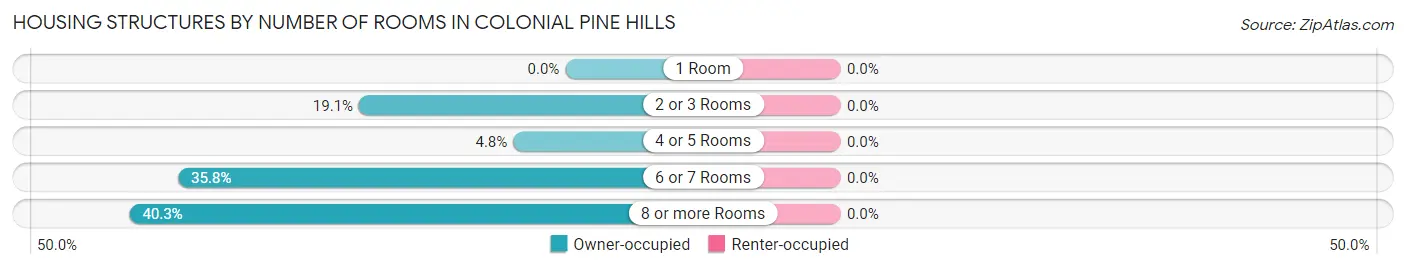
| Number of Rooms | Owner-occupied | Renter-occupied |
| 1 Room | 0 (0.0%) | 0 (0.0%) |
| 2 or 3 Rooms | 178 (19.1%) | 0 (0.0%) |
| 4 or 5 Rooms | 45 (4.8%) | 0 (0.0%) |
| 6 or 7 Rooms | 334 (35.8%) | 0 (0.0%) |
| 8 or more Rooms | 376 (40.3%) | 0 (0.0%) |
| Total | 933 (100.0%) | 0 (0.0%) |
Housing Structure by Heating Type in Colonial Pine Hills
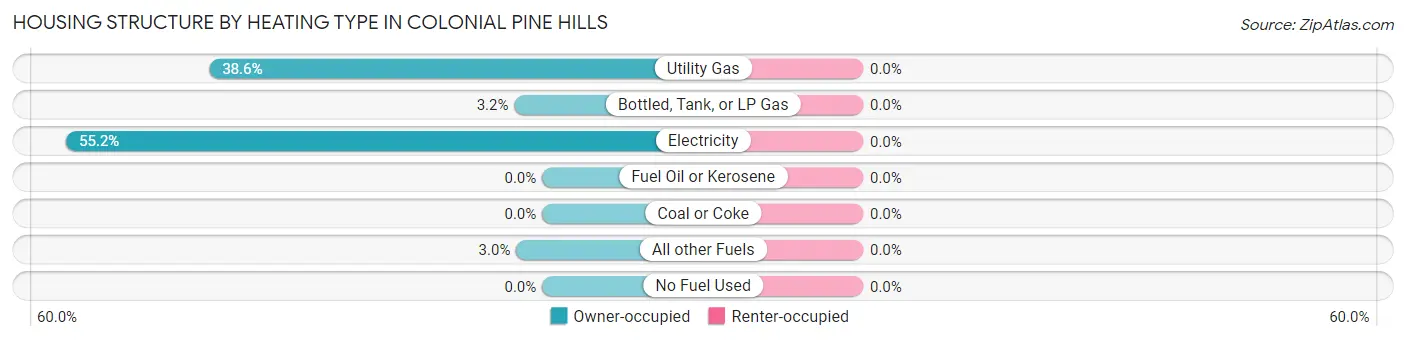
| Heating Type | Owner-occupied | Renter-occupied |
| Utility Gas | 360 (38.6%) | 0 (0.0%) |
| Bottled, Tank, or LP Gas | 30 (3.2%) | 0 (0.0%) |
| Electricity | 515 (55.2%) | 0 (0.0%) |
| Fuel Oil or Kerosene | 0 (0.0%) | 0 (0.0%) |
| Coal or Coke | 0 (0.0%) | 0 (0.0%) |
| All other Fuels | 28 (3.0%) | 0 (0.0%) |
| No Fuel Used | 0 (0.0%) | 0 (0.0%) |
| Total | 933 (100.0%) | 0 (0.0%) |
Household Vehicle Usage in Colonial Pine Hills
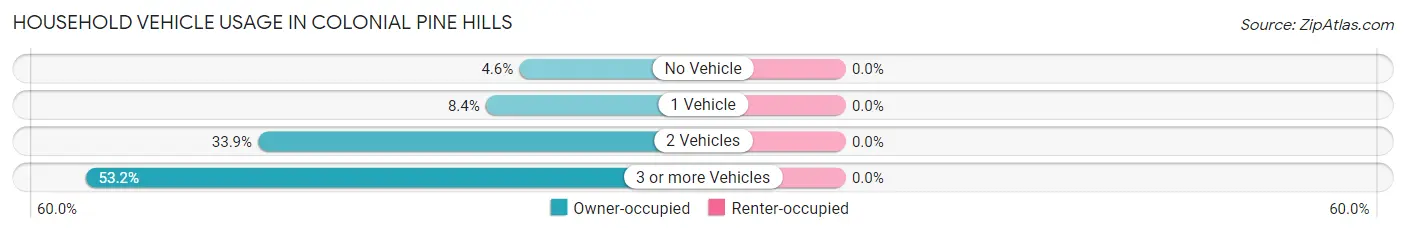
| Vehicles per Household | Owner-occupied | Renter-occupied |
| No Vehicle | 43 (4.6%) | 0 (0.0%) |
| 1 Vehicle | 78 (8.4%) | 0 (0.0%) |
| 2 Vehicles | 316 (33.9%) | 0 (0.0%) |
| 3 or more Vehicles | 496 (53.2%) | 0 (0.0%) |
| Total | 933 (100.0%) | 0 (0.0%) |
Real Estate & Mortgages in Colonial Pine Hills
Real Estate and Mortgage Overview in Colonial Pine Hills
| Characteristic | Without Mortgage | With Mortgage |
| Housing Units | 512 | 421 |
| Median Property Value | $292,900 | $373,500 |
| Median Household Income | $54,087 | $138 |
| Monthly Housing Costs | $990 | $72 |
| Real Estate Taxes | $4,699 | $0 |
Property Value by Mortgage Status in Colonial Pine Hills
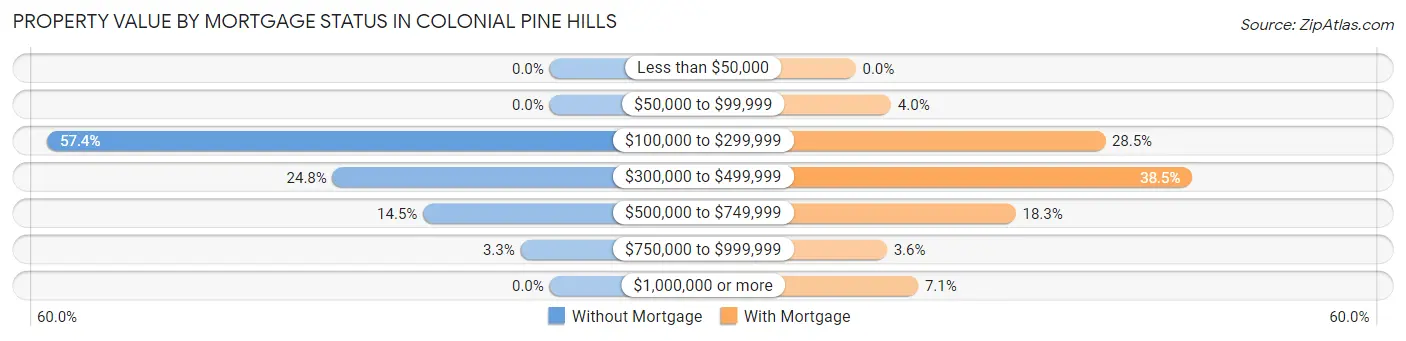
| Property Value | Without Mortgage | With Mortgage |
| Less than $50,000 | 0 (0.0%) | 0 (0.0%) |
| $50,000 to $99,999 | 0 (0.0%) | 17 (4.0%) |
| $100,000 to $299,999 | 294 (57.4%) | 120 (28.5%) |
| $300,000 to $499,999 | 127 (24.8%) | 162 (38.5%) |
| $500,000 to $749,999 | 74 (14.4%) | 77 (18.3%) |
| $750,000 to $999,999 | 17 (3.3%) | 15 (3.6%) |
| $1,000,000 or more | 0 (0.0%) | 30 (7.1%) |
| Total | 512 (100.0%) | 421 (100.0%) |
Household Income by Mortgage Status in Colonial Pine Hills
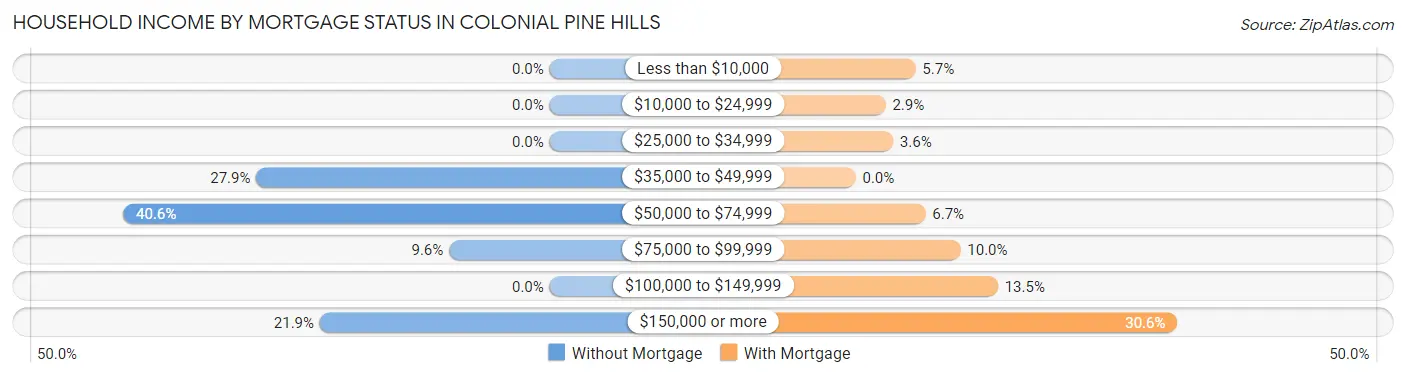
| Household Income | Without Mortgage | With Mortgage |
| Less than $10,000 | 0 (0.0%) | 24 (5.7%) |
| $10,000 to $24,999 | 0 (0.0%) | 12 (2.9%) |
| $25,000 to $34,999 | 0 (0.0%) | 15 (3.6%) |
| $35,000 to $49,999 | 143 (27.9%) | 0 (0.0%) |
| $50,000 to $74,999 | 208 (40.6%) | 28 (6.7%) |
| $75,000 to $99,999 | 49 (9.6%) | 42 (10.0%) |
| $100,000 to $149,999 | 0 (0.0%) | 57 (13.5%) |
| $150,000 or more | 112 (21.9%) | 129 (30.6%) |
| Total | 512 (100.0%) | 421 (100.0%) |
Property Value to Household Income Ratio in Colonial Pine Hills
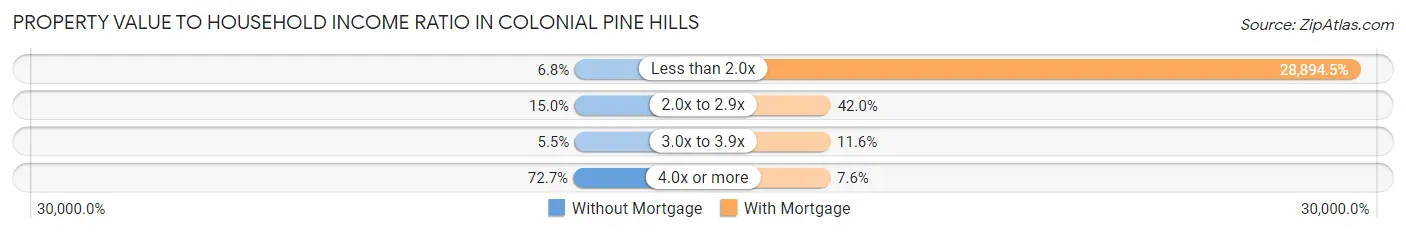
| Value-to-Income Ratio | Without Mortgage | With Mortgage |
| Less than 2.0x | 35 (6.8%) | 121,646 (28,894.5%) |
| 2.0x to 2.9x | 77 (15.0%) | 177 (42.0%) |
| 3.0x to 3.9x | 28 (5.5%) | 49 (11.6%) |
| 4.0x or more | 372 (72.7%) | 32 (7.6%) |
| Total | 512 (100.0%) | 421 (100.0%) |
Real Estate Taxes by Mortgage Status in Colonial Pine Hills

| Property Taxes | Without Mortgage | With Mortgage |
| Less than $800 | 0 (0.0%) | 0 (0.0%) |
| $800 to $1,499 | 0 (0.0%) | 0 (0.0%) |
| $800 to $1,499 | 512 (100.0%) | 34 (8.1%) |
| Total | 512 (100.0%) | 421 (100.0%) |
Health & Disability in Colonial Pine Hills
Health Insurance Coverage by Age in Colonial Pine Hills
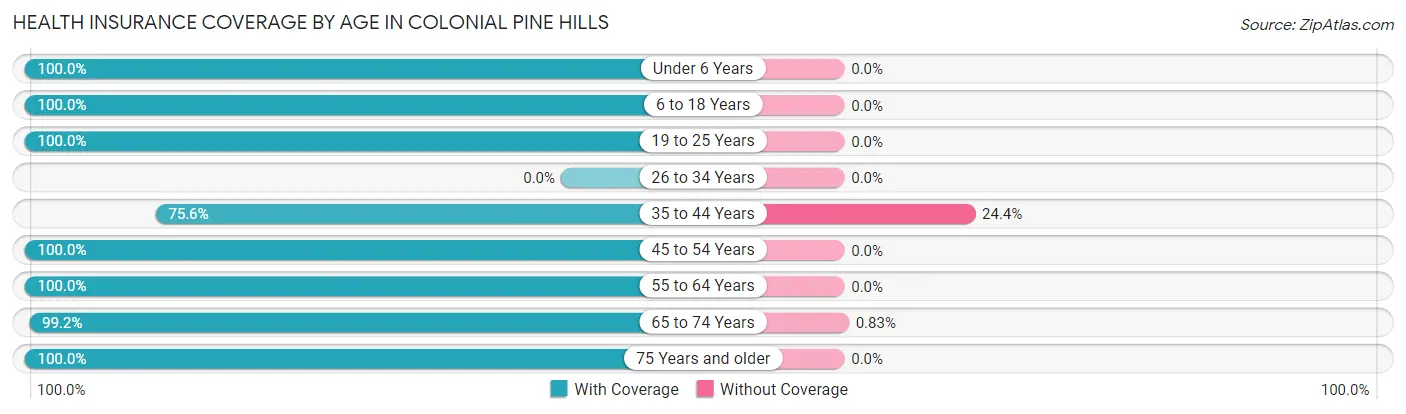
| Age Bracket | With Coverage | Without Coverage |
| Under 6 Years | 51 (100.0%) | 0 (0.0%) |
| 6 to 18 Years | 577 (100.0%) | 0 (0.0%) |
| 19 to 25 Years | 60 (100.0%) | 0 (0.0%) |
| 26 to 34 Years | 0 (0.0%) | 0 (0.0%) |
| 35 to 44 Years | 155 (75.6%) | 50 (24.4%) |
| 45 to 54 Years | 271 (100.0%) | 0 (0.0%) |
| 55 to 64 Years | 626 (100.0%) | 0 (0.0%) |
| 65 to 74 Years | 476 (99.2%) | 4 (0.8%) |
| 75 Years and older | 76 (100.0%) | 0 (0.0%) |
| Total | 2,292 (97.7%) | 54 (2.3%) |
Health Insurance Coverage by Citizenship Status in Colonial Pine Hills

| Citizenship Status | With Coverage | Without Coverage |
| Native Born | 51 (100.0%) | 0 (0.0%) |
| Foreign Born, Citizen | 577 (100.0%) | 0 (0.0%) |
| Foreign Born, not a Citizen | 60 (100.0%) | 0 (0.0%) |
Health Insurance Coverage by Household Income in Colonial Pine Hills
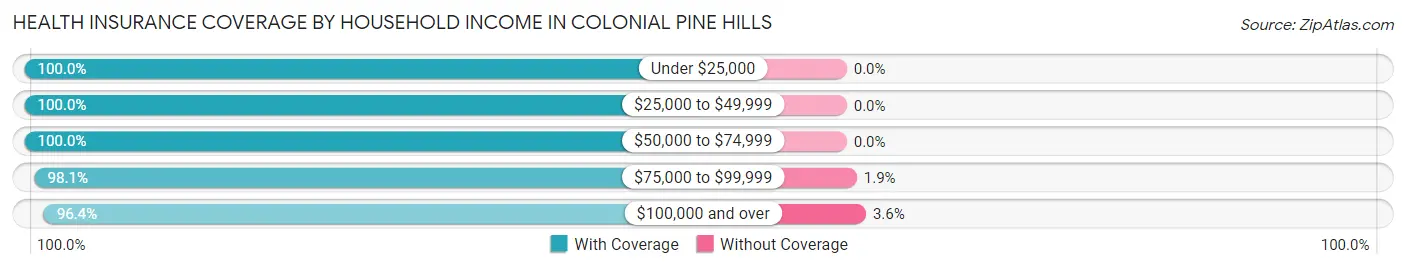
| Household Income | With Coverage | Without Coverage |
| Under $25,000 | 59 (100.0%) | 0 (0.0%) |
| $25,000 to $49,999 | 253 (100.0%) | 0 (0.0%) |
| $50,000 to $74,999 | 433 (100.0%) | 0 (0.0%) |
| $75,000 to $99,999 | 208 (98.1%) | 4 (1.9%) |
| $100,000 and over | 1,339 (96.4%) | 50 (3.6%) |
Public vs Private Health Insurance Coverage by Age in Colonial Pine Hills
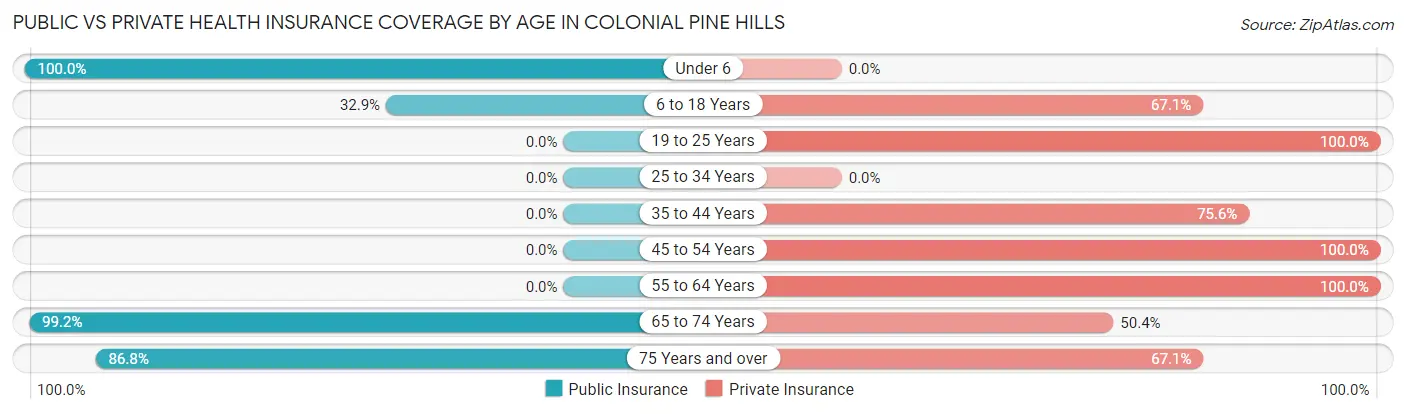
| Age Bracket | Public Insurance | Private Insurance |
| Under 6 | 51 (100.0%) | 0 (0.0%) |
| 6 to 18 Years | 190 (32.9%) | 387 (67.1%) |
| 19 to 25 Years | 0 (0.0%) | 60 (100.0%) |
| 25 to 34 Years | 0 (0.0%) | 0 (0.0%) |
| 35 to 44 Years | 0 (0.0%) | 155 (75.6%) |
| 45 to 54 Years | 0 (0.0%) | 271 (100.0%) |
| 55 to 64 Years | 0 (0.0%) | 626 (100.0%) |
| 65 to 74 Years | 476 (99.2%) | 242 (50.4%) |
| 75 Years and over | 66 (86.8%) | 51 (67.1%) |
| Total | 783 (33.4%) | 1,792 (76.4%) |
Disability Status by Sex by Age in Colonial Pine Hills
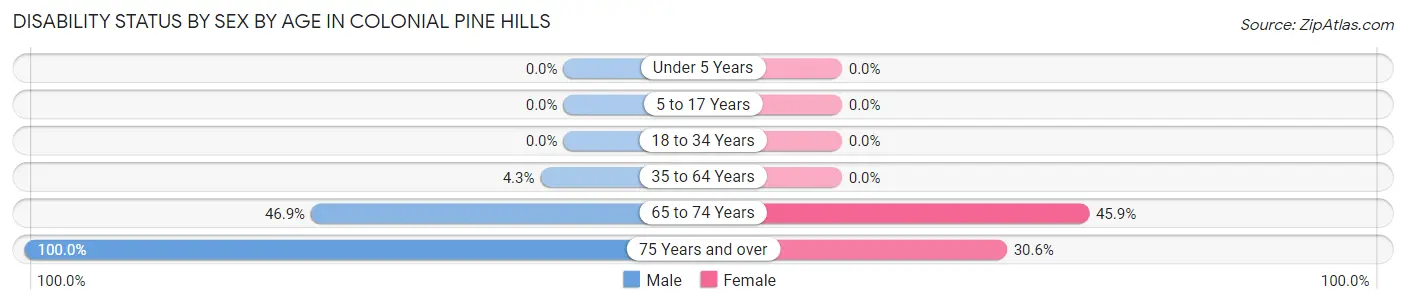
| Age Bracket | Male | Female |
| Under 5 Years | 0 (0.0%) | 0 (0.0%) |
| 5 to 17 Years | 0 (0.0%) | 0 (0.0%) |
| 18 to 34 Years | 0 (0.0%) | 0 (0.0%) |
| 35 to 64 Years | 26 (4.3%) | 0 (0.0%) |
| 65 to 74 Years | 134 (46.9%) | 89 (45.9%) |
| 75 Years and over | 27 (100.0%) | 15 (30.6%) |
Disability Class by Sex by Age in Colonial Pine Hills
Disability Class: Hearing Difficulty
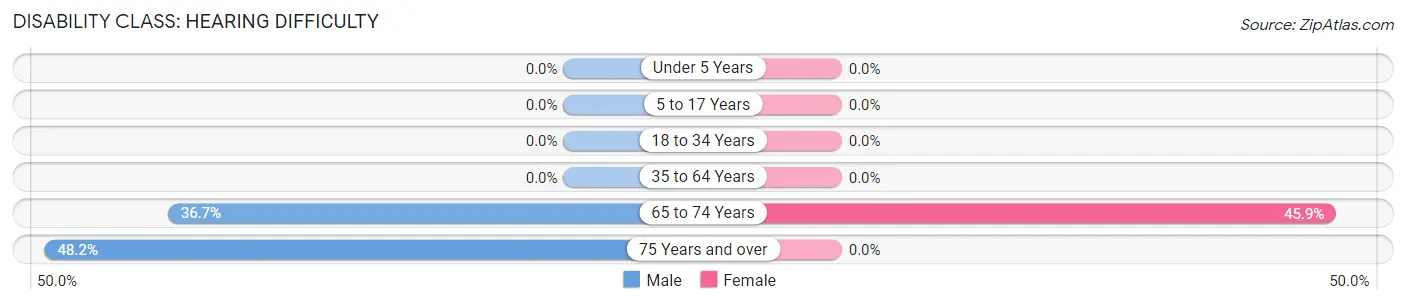
| Age Bracket | Male | Female |
| Under 5 Years | 0 (0.0%) | 0 (0.0%) |
| 5 to 17 Years | 0 (0.0%) | 0 (0.0%) |
| 18 to 34 Years | 0 (0.0%) | 0 (0.0%) |
| 35 to 64 Years | 0 (0.0%) | 0 (0.0%) |
| 65 to 74 Years | 105 (36.7%) | 89 (45.9%) |
| 75 Years and over | 13 (48.1%) | 0 (0.0%) |
Disability Class: Vision Difficulty
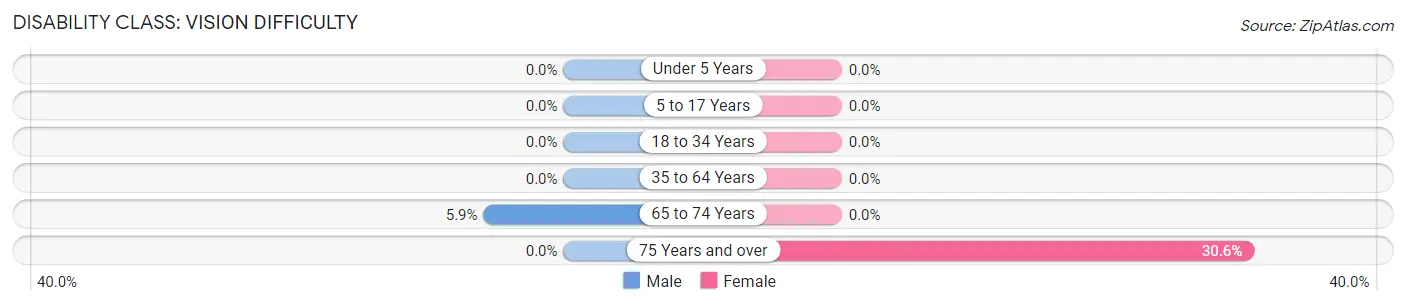
| Age Bracket | Male | Female |
| Under 5 Years | 0 (0.0%) | 0 (0.0%) |
| 5 to 17 Years | 0 (0.0%) | 0 (0.0%) |
| 18 to 34 Years | 0 (0.0%) | 0 (0.0%) |
| 35 to 64 Years | 0 (0.0%) | 0 (0.0%) |
| 65 to 74 Years | 17 (5.9%) | 0 (0.0%) |
| 75 Years and over | 0 (0.0%) | 15 (30.6%) |
Disability Class: Cognitive Difficulty
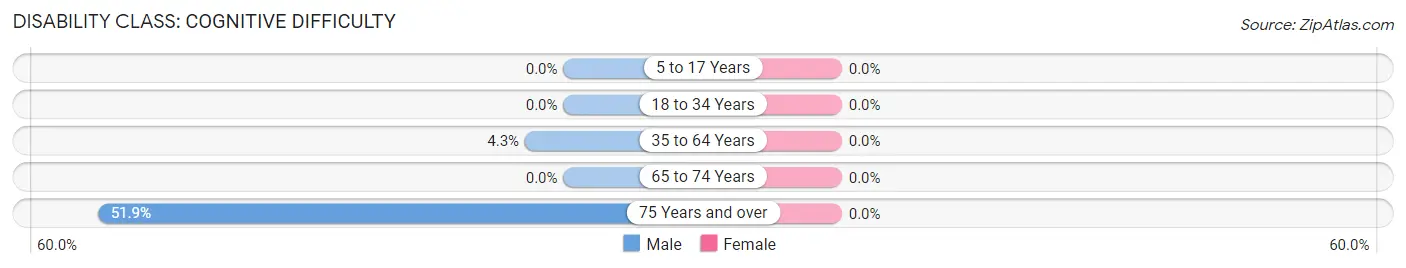
| Age Bracket | Male | Female |
| 5 to 17 Years | 0 (0.0%) | 0 (0.0%) |
| 18 to 34 Years | 0 (0.0%) | 0 (0.0%) |
| 35 to 64 Years | 26 (4.3%) | 0 (0.0%) |
| 65 to 74 Years | 0 (0.0%) | 0 (0.0%) |
| 75 Years and over | 14 (51.8%) | 0 (0.0%) |
Disability Class: Ambulatory Difficulty
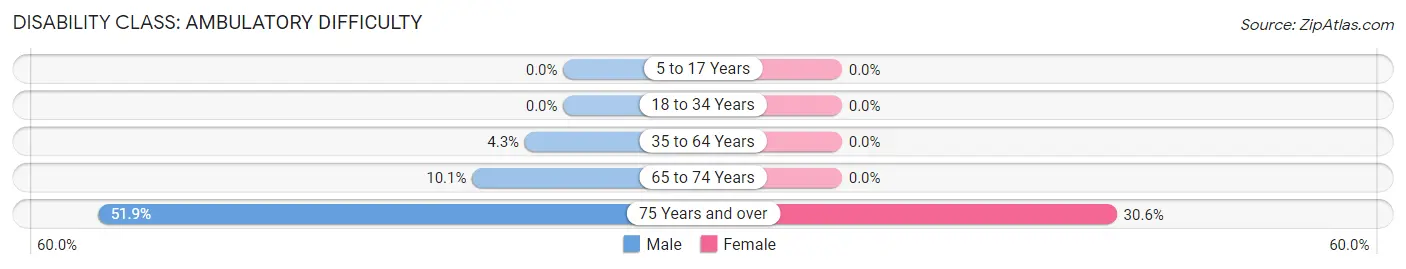
| Age Bracket | Male | Female |
| 5 to 17 Years | 0 (0.0%) | 0 (0.0%) |
| 18 to 34 Years | 0 (0.0%) | 0 (0.0%) |
| 35 to 64 Years | 26 (4.3%) | 0 (0.0%) |
| 65 to 74 Years | 29 (10.1%) | 0 (0.0%) |
| 75 Years and over | 14 (51.8%) | 15 (30.6%) |
Disability Class: Self-Care Difficulty
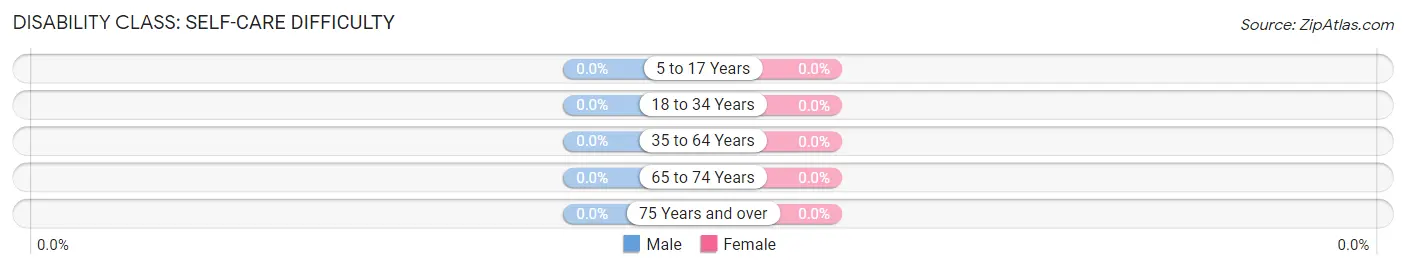
| Age Bracket | Male | Female |
| 5 to 17 Years | 0 (0.0%) | 0 (0.0%) |
| 18 to 34 Years | 0 (0.0%) | 0 (0.0%) |
| 35 to 64 Years | 0 (0.0%) | 0 (0.0%) |
| 65 to 74 Years | 0 (0.0%) | 0 (0.0%) |
| 75 Years and over | 0 (0.0%) | 0 (0.0%) |
Technology Access in Colonial Pine Hills
Computing Device Access in Colonial Pine Hills
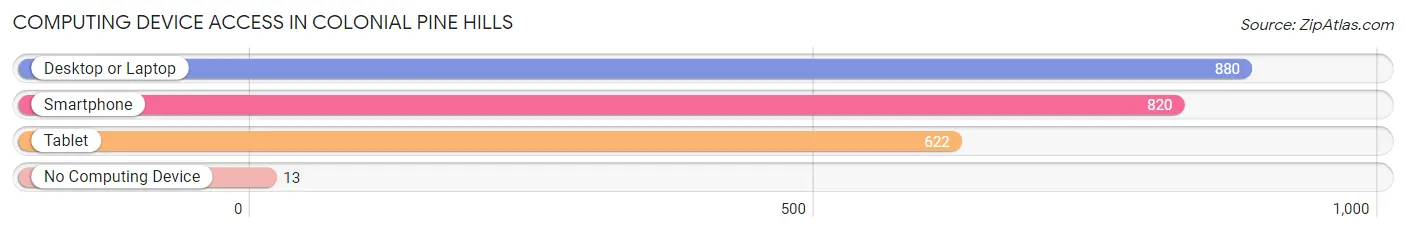
| Device Type | # Households | % Households |
| Desktop or Laptop | 880 | 94.3% |
| Smartphone | 820 | 87.9% |
| Tablet | 622 | 66.7% |
| No Computing Device | 13 | 1.4% |
| Total | 933 | 100.0% |
Internet Access in Colonial Pine Hills
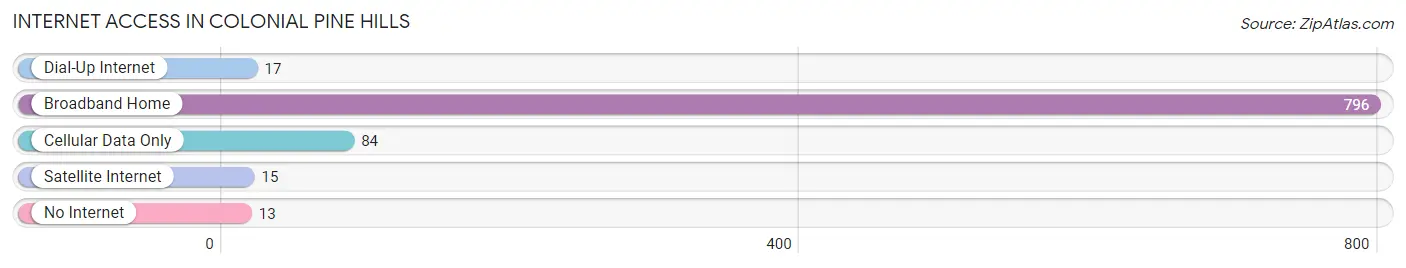
| Internet Type | # Households | % Households |
| Dial-Up Internet | 17 | 1.8% |
| Broadband Home | 796 | 85.3% |
| Cellular Data Only | 84 | 9.0% |
| Satellite Internet | 15 | 1.6% |
| No Internet | 13 | 1.4% |
| Total | 933 | 100.0% |
Colonial Pine Hills Summary
Colonial Pine Hills, South Dakota is a small town located in the Black Hills region of the state. It is situated in Pennington County, approximately 10 miles east of Rapid City. The town was founded in 1876 by a group of settlers from the Midwest who were looking for a place to settle and start a new life. The town was named after the nearby pine-covered hills, and it quickly grew into a thriving community.
Geography
Colonial Pine Hills is located in the Black Hills region of South Dakota, which is known for its rugged terrain and beautiful scenery. The town is situated in Pennington County, approximately 10 miles east of Rapid City. The town is surrounded by rolling hills and is situated at an elevation of 4,400 feet. The town is located in the Black Hills National Forest, which is home to a variety of wildlife, including deer, elk, and bighorn sheep.
The town is located near several popular tourist attractions, including Mount Rushmore National Memorial, Crazy Horse Memorial, and Custer State Park. The town is also close to several ski resorts, including Terry Peak Ski Area and Deer Mountain Ski Area.
Economy
The economy of Colonial Pine Hills is largely based on tourism. The town is home to several popular tourist attractions, including Mount Rushmore National Memorial, Crazy Horse Memorial, and Custer State Park. The town is also close to several ski resorts, including Terry Peak Ski Area and Deer Mountain Ski Area.
The town is also home to several businesses, including restaurants, hotels, and retail stores. The town is also home to several manufacturing companies, including a furniture factory and a woodworking shop.
Demographics
As of the 2010 census, the population of Colonial Pine Hills was 1,845. The town is predominantly white, with 92.3% of the population identifying as white. The town is also home to a small Native American population, with 4.2% of the population identifying as Native American. The town is also home to a small Hispanic population, with 2.2% of the population identifying as Hispanic or Latino.
The median household income in Colonial Pine Hills is $41,944, and the median home value is $127,400. The town has a poverty rate of 11.3%, which is slightly higher than the national average.
Conclusion
Colonial Pine Hills, South Dakota is a small town located in the Black Hills region of the state. It is situated in Pennington County, approximately 10 miles east of Rapid City. The town was founded in 1876 by a group of settlers from the Midwest who were looking for a place to settle and start a new life. The town is surrounded by rolling hills and is situated at an elevation of 4,400 feet. The town is home to several popular tourist attractions, including Mount Rushmore National Memorial, Crazy Horse Memorial, and Custer State Park. The town is also home to several businesses, including restaurants, hotels, and retail stores. The population of Colonial Pine Hills is predominantly white, with 92.3% of the population identifying as white. The median household income in Colonial Pine Hills is $41,944, and the median home value is $127,400. The town has a poverty rate of 11.3%, which is slightly higher than the national average.
Common Questions
What is Per Capita Income in Colonial Pine Hills?
Per Capita income in Colonial Pine Hills is $56,270.
What is the Median Family Income in Colonial Pine Hills?
Median Family Income in Colonial Pine Hills is $79,345.
What is the Median Household income in Colonial Pine Hills?
Median Household Income in Colonial Pine Hills is $79,702.
What is Income or Wage Gap in Colonial Pine Hills?
Income or Wage Gap in Colonial Pine Hills is 14.3%.
Women in Colonial Pine Hills earn 85.7 cents for every dollar earned by a man.
What is Inequality or Gini Index in Colonial Pine Hills?
Inequality or Gini Index in Colonial Pine Hills is 0.51.
What is the Total Population of Colonial Pine Hills?
Total Population of Colonial Pine Hills is 2,346.
What is the Total Male Population of Colonial Pine Hills?
Total Male Population of Colonial Pine Hills is 1,302.
What is the Total Female Population of Colonial Pine Hills?
Total Female Population of Colonial Pine Hills is 1,044.
What is the Ratio of Males per 100 Females in Colonial Pine Hills?
There are 124.71 Males per 100 Females in Colonial Pine Hills.
What is the Ratio of Females per 100 Males in Colonial Pine Hills?
There are 80.18 Females per 100 Males in Colonial Pine Hills.
What is the Median Population Age in Colonial Pine Hills?
Median Population Age in Colonial Pine Hills is 55.5 Years.
What is the Average Family Size in Colonial Pine Hills
Average Family Size in Colonial Pine Hills is 2.8 People.
What is the Average Household Size in Colonial Pine Hills
Average Household Size in Colonial Pine Hills is 2.5 People.
How Large is the Labor Force in Colonial Pine Hills?
There are 1,278 People in the Labor Forcein in Colonial Pine Hills.
What is the Percentage of People in the Labor Force in Colonial Pine Hills?
70.7% of People are in the Labor Force in Colonial Pine Hills.
What is the Unemployment Rate in Colonial Pine Hills?
Unemployment Rate in Colonial Pine Hills is 7.6%.