White, SD Map & Demographics
White Map
White Overview
$33,935
PER CAPITA INCOME
$84,250
AVG FAMILY INCOME
$64,226
AVG HOUSEHOLD INCOME
7.8%
WAGE / INCOME GAP [ % ]
92.2¢/ $1
WAGE / INCOME GAP [ $ ]
0.34
INEQUALITY / GINI INDEX
478
TOTAL POPULATION
245
MALE POPULATION
233
FEMALE POPULATION
105.15
MALES / 100 FEMALES
95.10
FEMALES / 100 MALES
31.4
MEDIAN AGE
2.8
AVG FAMILY SIZE
2.4
AVG HOUSEHOLD SIZE
302
LABOR FORCE [ PEOPLE ]
78.6%
PERCENT IN LABOR FORCE
2.3%
UNEMPLOYMENT RATE
White Zip Codes
White Area Codes
Income in White
Income Overview in White
Per Capita Income in White is $33,935, while median incomes of families and households are $84,250 and $64,226 respectively.
| Characteristic | Number | Measure |
| Per Capita Income | 478 | $33,935 |
| Median Family Income | 137 | $84,250 |
| Mean Family Income | 137 | $87,627 |
| Median Household Income | 201 | $64,226 |
| Mean Household Income | 201 | $77,141 |
| Income Deficit | 137 | $0 |
| Wage / Income Gap (%) | 478 | 7.78% |
| Wage / Income Gap ($) | 478 | 92.22¢ per $1 |
| Gini / Inequality Index | 478 | 0.34 |
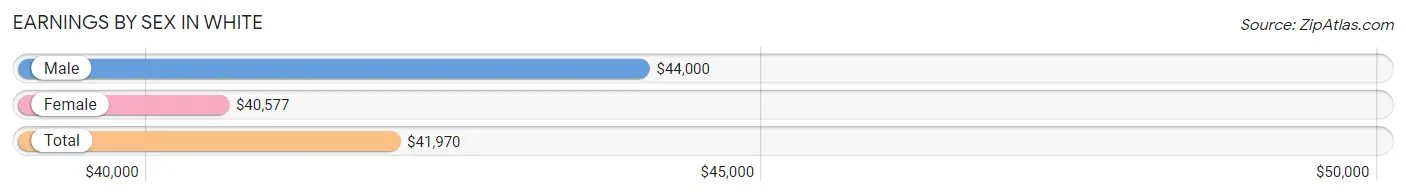
Earnings by Sex in White
Average Earnings in White are $41,970, $44,000 for men and $40,577 for women, a difference of 7.8%.
| Sex | Number | Average Earnings |
| Male | 174 (56.5%) | $44,000 |
| Female | 134 (43.5%) | $40,577 |
| Total | 308 (100.0%) | $41,970 |
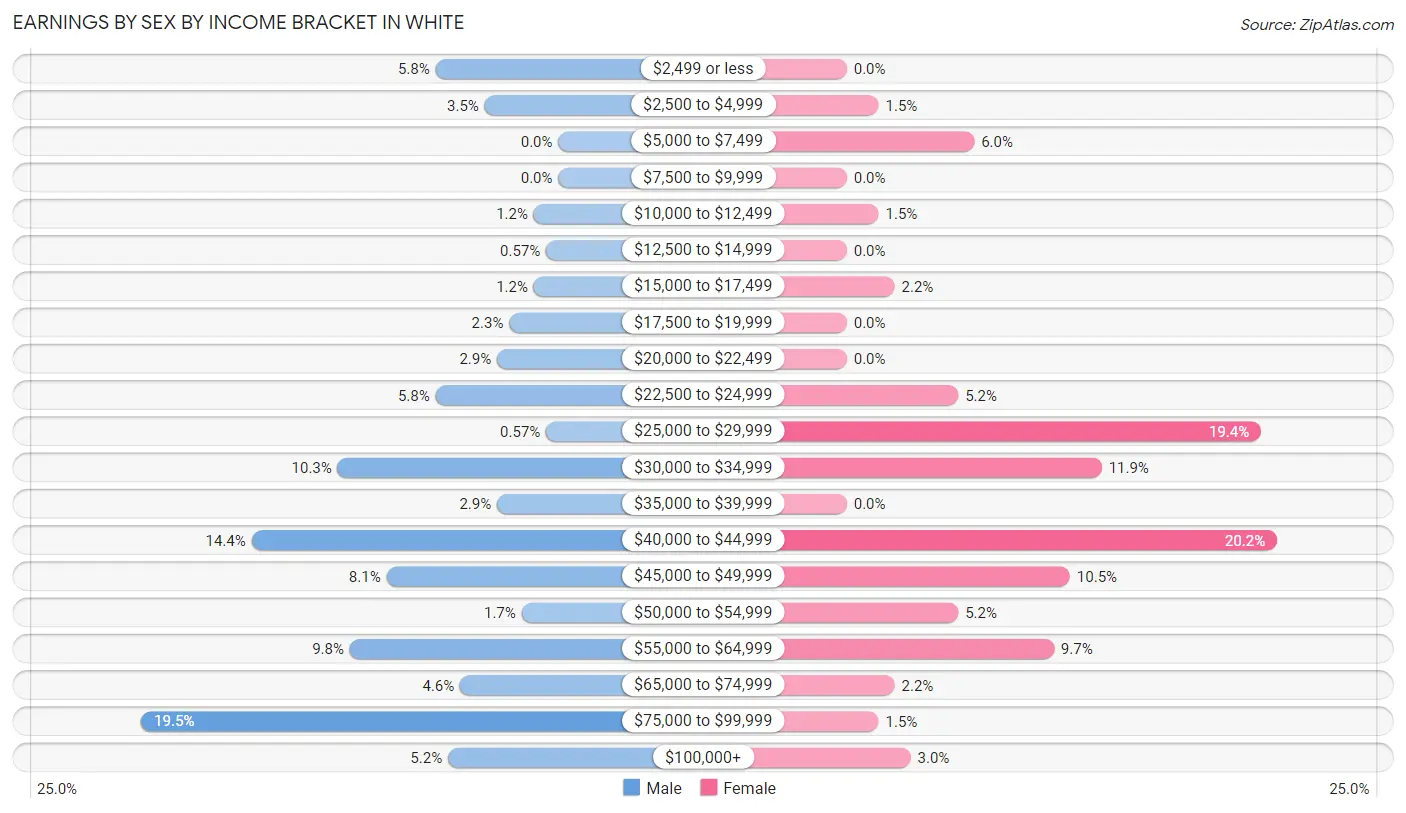
Earnings by Sex by Income Bracket in White
The most common earnings brackets in White are $75,000 to $99,999 for men (34 | 19.5%) and $40,000 to $44,999 for women (27 | 20.2%).
| Income | Male | Female |
| $2,499 or less | 10 (5.8%) | 0 (0.0%) |
| $2,500 to $4,999 | 6 (3.5%) | 2 (1.5%) |
| $5,000 to $7,499 | 0 (0.0%) | 8 (6.0%) |
| $7,500 to $9,999 | 0 (0.0%) | 0 (0.0%) |
| $10,000 to $12,499 | 2 (1.1%) | 2 (1.5%) |
| $12,500 to $14,999 | 1 (0.6%) | 0 (0.0%) |
| $15,000 to $17,499 | 2 (1.1%) | 3 (2.2%) |
| $17,500 to $19,999 | 4 (2.3%) | 0 (0.0%) |
| $20,000 to $22,499 | 5 (2.9%) | 0 (0.0%) |
| $22,500 to $24,999 | 10 (5.8%) | 7 (5.2%) |
| $25,000 to $29,999 | 1 (0.6%) | 26 (19.4%) |
| $30,000 to $34,999 | 18 (10.3%) | 16 (11.9%) |
| $35,000 to $39,999 | 5 (2.9%) | 0 (0.0%) |
| $40,000 to $44,999 | 25 (14.4%) | 27 (20.2%) |
| $45,000 to $49,999 | 14 (8.1%) | 14 (10.4%) |
| $50,000 to $54,999 | 3 (1.7%) | 7 (5.2%) |
| $55,000 to $64,999 | 17 (9.8%) | 13 (9.7%) |
| $65,000 to $74,999 | 8 (4.6%) | 3 (2.2%) |
| $75,000 to $99,999 | 34 (19.5%) | 2 (1.5%) |
| $100,000+ | 9 (5.2%) | 4 (3.0%) |
| Total | 174 (100.0%) | 134 (100.0%) |
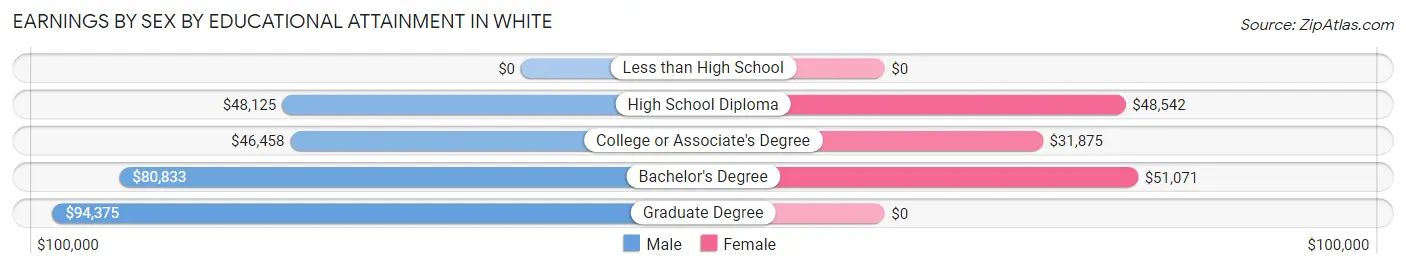
Earnings by Sex by Educational Attainment in White
Average earnings in White are $46,458 for men and $42,857 for women, a difference of 7.7%. Men with an educational attainment of graduate degree enjoy the highest average annual earnings of $94,375, while those with college or associate's degree education earn the least with $46,458. Women with an educational attainment of bachelor's degree earn the most with the average annual earnings of $51,071, while those with college or associate's degree education have the smallest earnings of $31,875.
| Educational Attainment | Male Income | Female Income |
| Less than High School | - | - |
| High School Diploma | $48,125 | $48,542 |
| College or Associate's Degree | $46,458 | $31,875 |
| Bachelor's Degree | $80,833 | $51,071 |
| Graduate Degree | $94,375 | $0 |
| Total | $46,458 | $42,857 |
Family Income in White
Family Income Brackets in White
According to the White family income data, there are 34 families falling into the $50,000 to $74,999 income range, which is the most common income bracket and makes up 24.8% of all families.
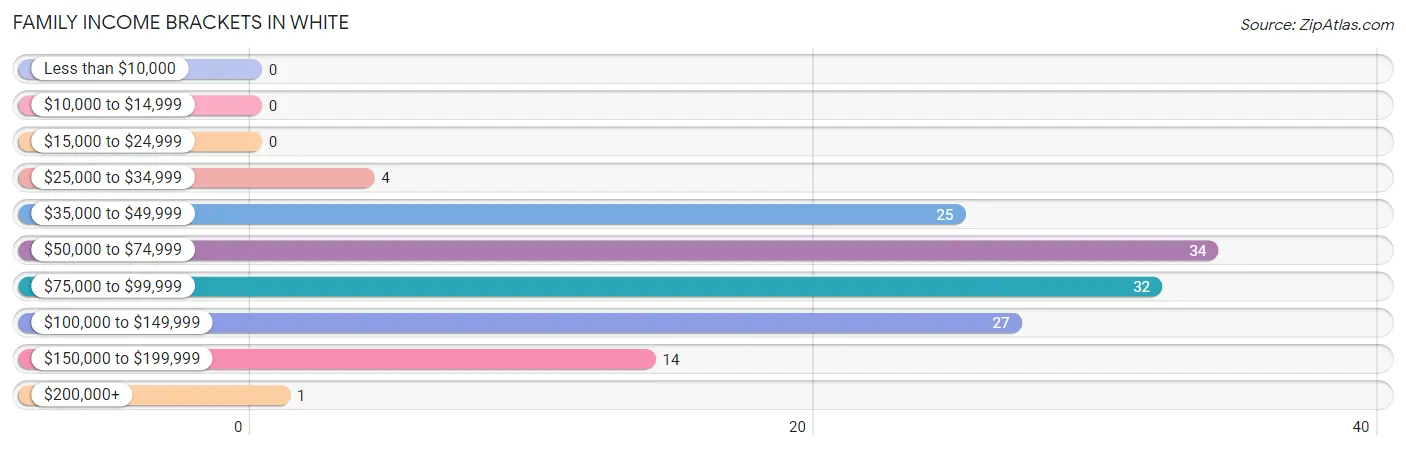
| Income Bracket | # Families | % Families |
| Less than $10,000 | 0 | 0.0% |
| $10,000 to $14,999 | 0 | 0.0% |
| $15,000 to $24,999 | 0 | 0.0% |
| $25,000 to $34,999 | 4 | 2.9% |
| $35,000 to $49,999 | 25 | 18.2% |
| $50,000 to $74,999 | 34 | 24.8% |
| $75,000 to $99,999 | 32 | 23.4% |
| $100,000 to $149,999 | 27 | 19.7% |
| $150,000 to $199,999 | 14 | 10.2% |
| $200,000+ | 1 | 0.7% |
Family Income by Famaliy Size in White
4-person families (14 | 10.2%) account for the highest median family income in White with $94,583 per family, while 2-person families (64 | 46.7%) have the highest median income of $38,125 per family member.
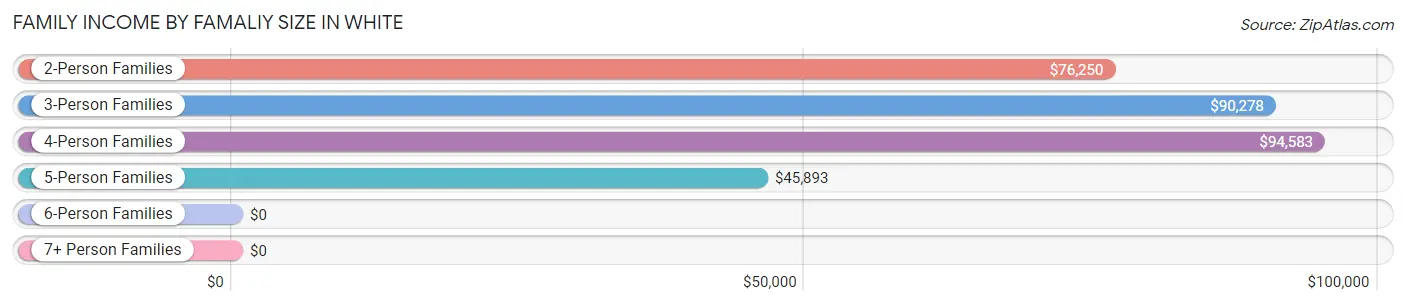
| Income Bracket | # Families | Median Income |
| 2-Person Families | 64 (46.7%) | $76,250 |
| 3-Person Families | 46 (33.6%) | $90,278 |
| 4-Person Families | 14 (10.2%) | $94,583 |
| 5-Person Families | 13 (9.5%) | $45,893 |
| 6-Person Families | 0 (0.0%) | $0 |
| 7+ Person Families | 0 (0.0%) | $0 |
| Total | 137 (100.0%) | $84,250 |
Family Income by Number of Earners in White
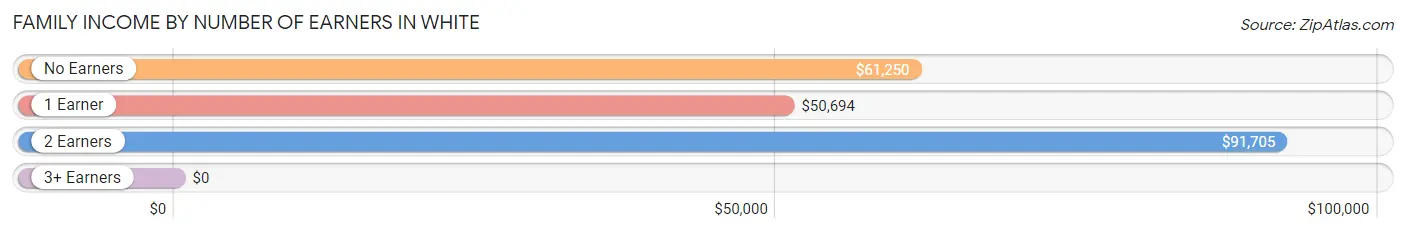
| Number of Earners | # Families | Median Income |
| No Earners | 10 (7.3%) | $61,250 |
| 1 Earner | 29 (21.2%) | $50,694 |
| 2 Earners | 91 (66.4%) | $91,705 |
| 3+ Earners | 7 (5.1%) | $0 |
| Total | 137 (100.0%) | $84,250 |
Household Income in White
Household Income Brackets in White
With 44 households falling in the category, the $50,000 to $74,999 income range is the most frequent in White, accounting for 21.9% of all households. In contrast, only 3 households (1.5%) fall into the $200,000+ income bracket, making it the least populous group.
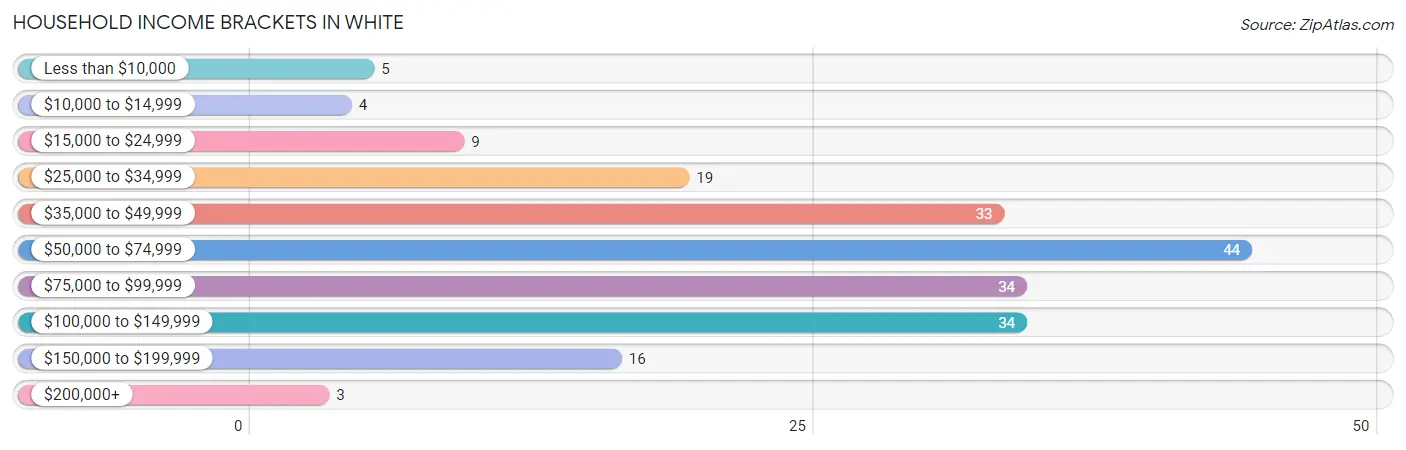
| Income Bracket | # Households | % Households |
| Less than $10,000 | 5 | 2.5% |
| $10,000 to $14,999 | 4 | 2.0% |
| $15,000 to $24,999 | 9 | 4.5% |
| $25,000 to $34,999 | 19 | 9.5% |
| $35,000 to $49,999 | 33 | 16.4% |
| $50,000 to $74,999 | 44 | 21.9% |
| $75,000 to $99,999 | 34 | 16.9% |
| $100,000 to $149,999 | 34 | 16.9% |
| $150,000 to $199,999 | 16 | 8.0% |
| $200,000+ | 3 | 1.5% |
Household Income by Householder Age in White
The median household income in White is $64,226, with the highest median household income of $92,727 found in the 45 to 64 years age bracket for the primary householder. A total of 54 households (26.9%) fall into this category. Meanwhile, the 65+ years age bracket for the primary householder has the lowest median household income of $46,250, with 38 households (18.9%) in this group.

| Income Bracket | # Households | Median Income |
| 15 to 24 Years | 37 (18.4%) | $67,917 |
| 25 to 44 Years | 72 (35.8%) | $64,167 |
| 45 to 64 Years | 54 (26.9%) | $92,727 |
| 65+ Years | 38 (18.9%) | $46,250 |
| Total | 201 (100.0%) | $64,226 |
Poverty in White
Income Below Poverty by Sex and Age in White
With 4.1% poverty level for males and 6.4% for females among the residents of White, 5 year old males and 6 to 11 year old females are the most vulnerable to poverty, with 2 males (100.0%) and 4 females (33.3%) in their respective age groups living below the poverty level.
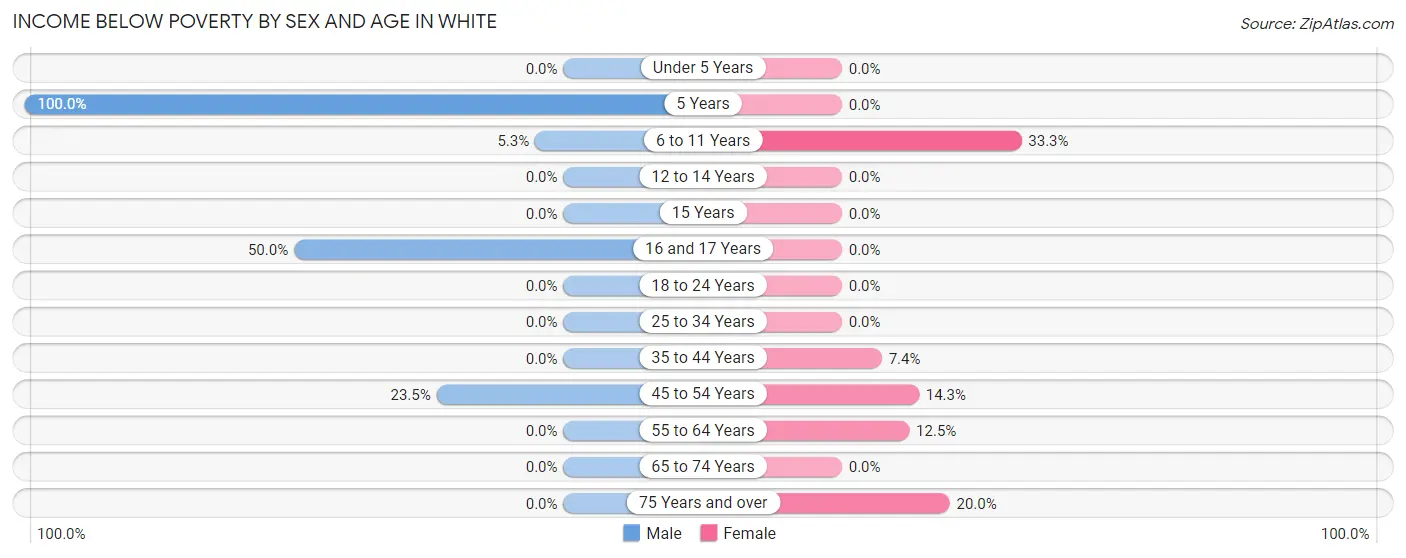
| Age Bracket | Male | Female |
| Under 5 Years | 0 (0.0%) | 0 (0.0%) |
| 5 Years | 2 (100.0%) | 0 (0.0%) |
| 6 to 11 Years | 1 (5.3%) | 4 (33.3%) |
| 12 to 14 Years | 0 (0.0%) | 0 (0.0%) |
| 15 Years | 0 (0.0%) | 0 (0.0%) |
| 16 and 17 Years | 3 (50.0%) | 0 (0.0%) |
| 18 to 24 Years | 0 (0.0%) | 0 (0.0%) |
| 25 to 34 Years | 0 (0.0%) | 0 (0.0%) |
| 35 to 44 Years | 0 (0.0%) | 2 (7.4%) |
| 45 to 54 Years | 4 (23.5%) | 2 (14.3%) |
| 55 to 64 Years | 0 (0.0%) | 3 (12.5%) |
| 65 to 74 Years | 0 (0.0%) | 0 (0.0%) |
| 75 Years and over | 0 (0.0%) | 4 (20.0%) |
| Total | 10 (4.1%) | 15 (6.4%) |
Income Above Poverty by Sex and Age in White
According to the poverty statistics in White, males aged under 5 years and females aged under 5 years are the age groups that are most secure financially, with 100.0% of males and 100.0% of females in these age groups living above the poverty line.
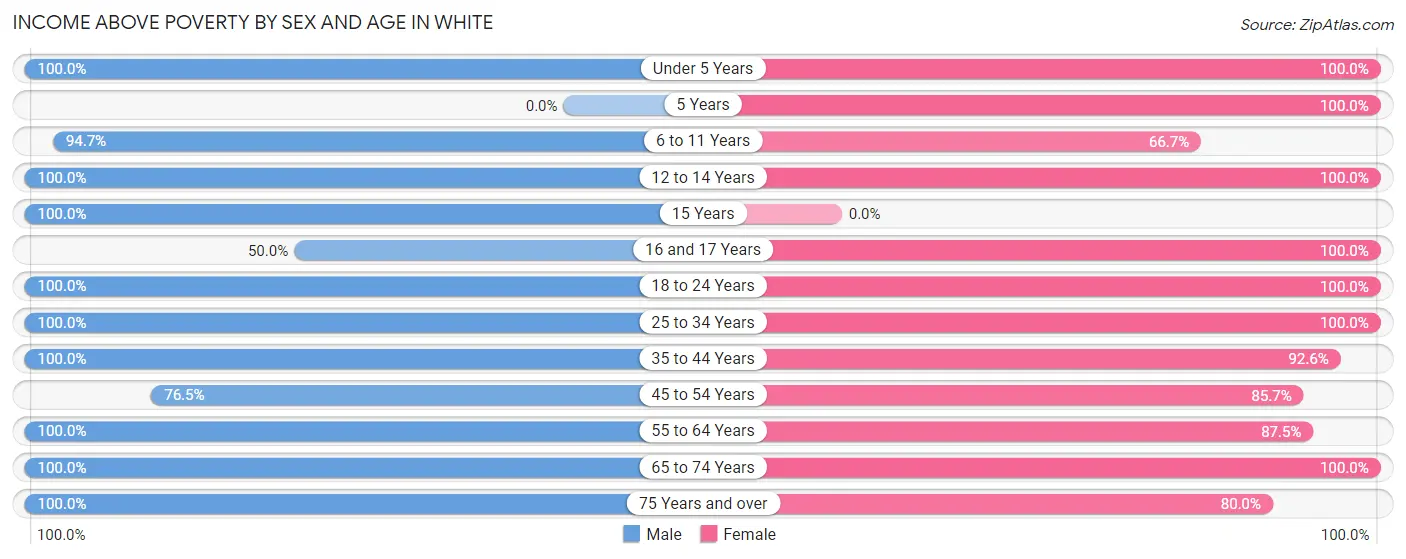
| Age Bracket | Male | Female |
| Under 5 Years | 22 (100.0%) | 20 (100.0%) |
| 5 Years | 0 (0.0%) | 7 (100.0%) |
| 6 to 11 Years | 18 (94.7%) | 8 (66.7%) |
| 12 to 14 Years | 8 (100.0%) | 2 (100.0%) |
| 15 Years | 2 (100.0%) | 0 (0.0%) |
| 16 and 17 Years | 3 (50.0%) | 19 (100.0%) |
| 18 to 24 Years | 34 (100.0%) | 30 (100.0%) |
| 25 to 34 Years | 51 (100.0%) | 45 (100.0%) |
| 35 to 44 Years | 24 (100.0%) | 25 (92.6%) |
| 45 to 54 Years | 13 (76.5%) | 12 (85.7%) |
| 55 to 64 Years | 35 (100.0%) | 21 (87.5%) |
| 65 to 74 Years | 12 (100.0%) | 13 (100.0%) |
| 75 Years and over | 13 (100.0%) | 16 (80.0%) |
| Total | 235 (95.9%) | 218 (93.6%) |
Income Below Poverty Among Married-Couple Families in White
The poverty statistics for married-couple families in White show that 3.5% or 4 of the total 113 families live below the poverty line. Families with 3 or 4 children have the highest poverty rate of 30.8%, comprising of 4 families. On the other hand, families with no children have the lowest poverty rate of 0.0%, which includes 0 families.
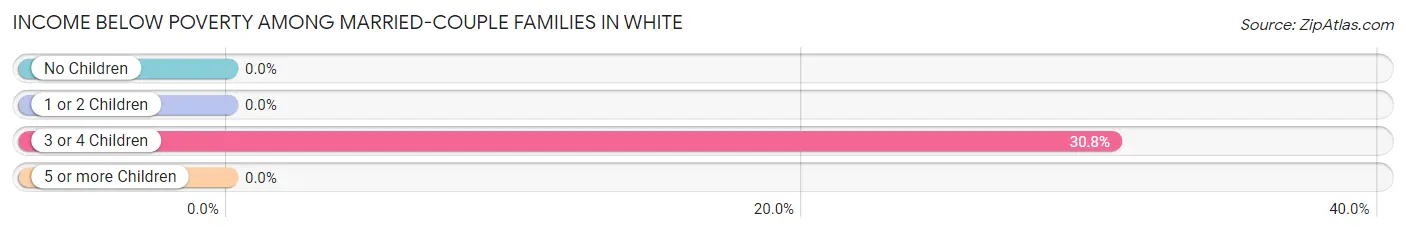
| Children | Above Poverty | Below Poverty |
| No Children | 69 (100.0%) | 0 (0.0%) |
| 1 or 2 Children | 31 (100.0%) | 0 (0.0%) |
| 3 or 4 Children | 9 (69.2%) | 4 (30.8%) |
| 5 or more Children | 0 (0.0%) | 0 (0.0%) |
| Total | 109 (96.5%) | 4 (3.5%) |
Income Below Poverty Among Single-Parent Households in White
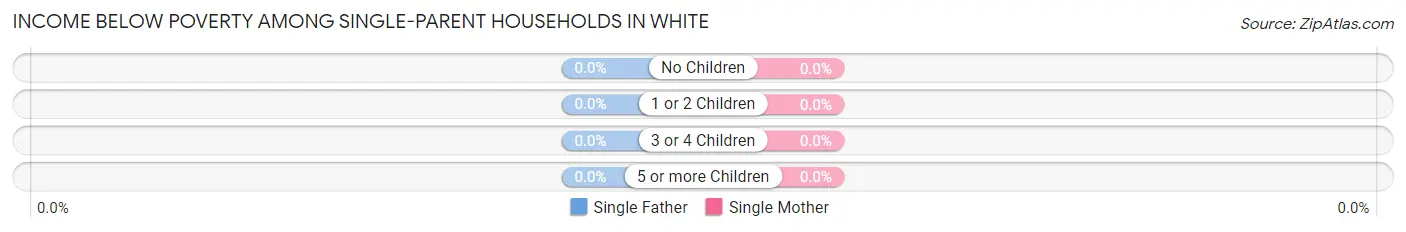
| Children | Single Father | Single Mother |
| No Children | 0 (0.0%) | 0 (0.0%) |
| 1 or 2 Children | 0 (0.0%) | 0 (0.0%) |
| 3 or 4 Children | 0 (0.0%) | 0 (0.0%) |
| 5 or more Children | 0 (0.0%) | 0 (0.0%) |
| Total | 0 (0.0%) | 0 (0.0%) |
Income Below Poverty Among Married-Couple vs Single-Parent Households in White
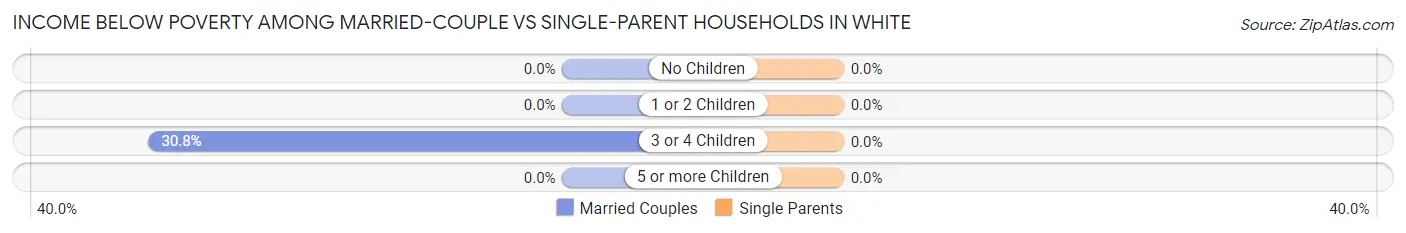
| Children | Married-Couple Families | Single-Parent Households |
| No Children | 0 (0.0%) | 0 (0.0%) |
| 1 or 2 Children | 0 (0.0%) | 0 (0.0%) |
| 3 or 4 Children | 4 (30.8%) | 0 (0.0%) |
| 5 or more Children | 0 (0.0%) | 0 (0.0%) |
| Total | 4 (3.5%) | 0 (0.0%) |
Race in White
The most populous races in White are , and White / Caucasian (478 | 100.0%).
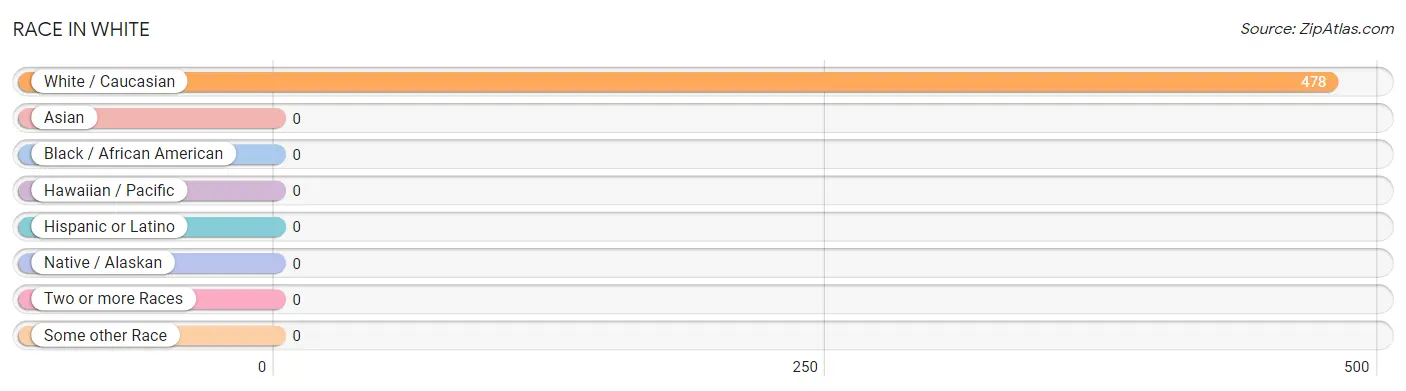
| Race | # Population | % Population |
| Asian | 0 | 0.0% |
| Black / African American | 0 | 0.0% |
| Hawaiian / Pacific | 0 | 0.0% |
| Hispanic or Latino | 0 | 0.0% |
| Native / Alaskan | 0 | 0.0% |
| White / Caucasian | 478 | 100.0% |
| Two or more Races | 0 | 0.0% |
| Some other Race | 0 | 0.0% |
| Total | 478 | 100.0% |
Ancestry in White
The most populous ancestries reported in White are German (182 | 38.1%), Norwegian (100 | 20.9%), Irish (43 | 9.0%), English (42 | 8.8%), and American (15 | 3.1%), together accounting for 79.9% of all White residents.
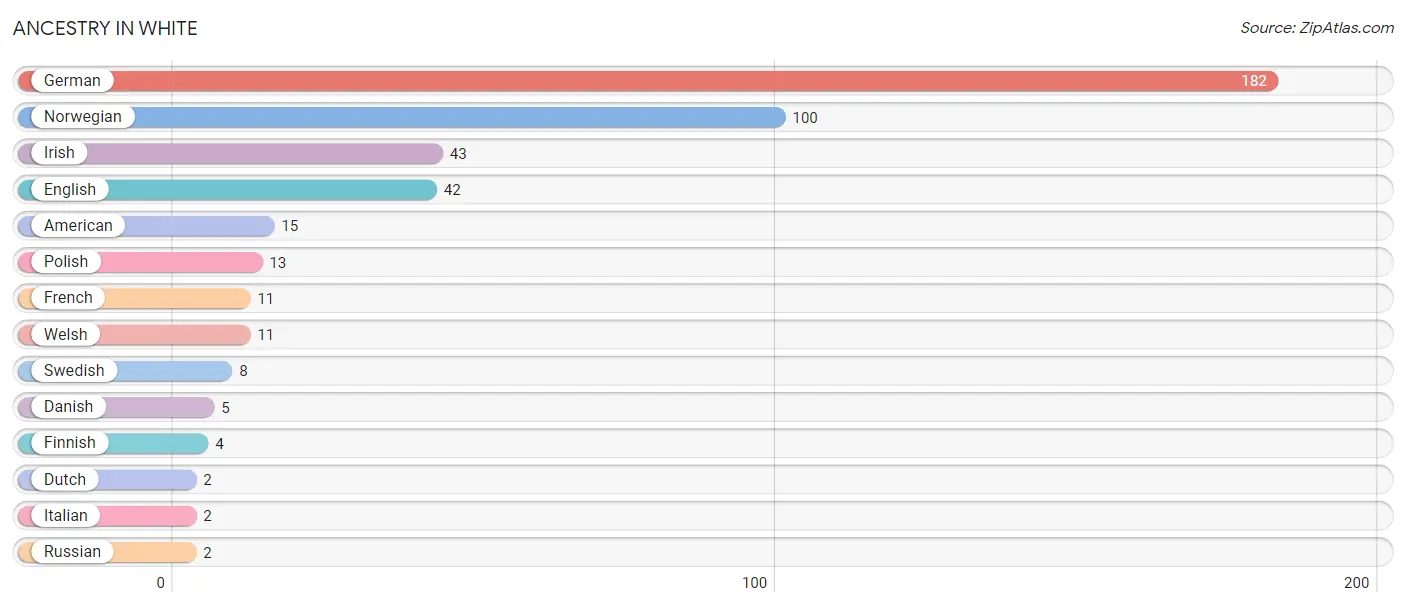
| Ancestry | # Population | % Population |
| American | 15 | 3.1% |
| Danish | 5 | 1.1% |
| Dutch | 2 | 0.4% |
| English | 42 | 8.8% |
| Finnish | 4 | 0.8% |
| French | 11 | 2.3% |
| German | 182 | 38.1% |
| Irish | 43 | 9.0% |
| Italian | 2 | 0.4% |
| Norwegian | 100 | 20.9% |
| Polish | 13 | 2.7% |
| Russian | 2 | 0.4% |
| Swedish | 8 | 1.7% |
| Welsh | 11 | 2.3% | View All 14 Rows |
Immigrants in White

| Immigration Origin | # Population | % Population | View All 0 Rows |
Sex and Age in White
Sex and Age in White
The most populous age groups in White are 30 to 34 Years (34 | 13.9%) for men and 30 to 34 Years (39 | 16.7%) for women.
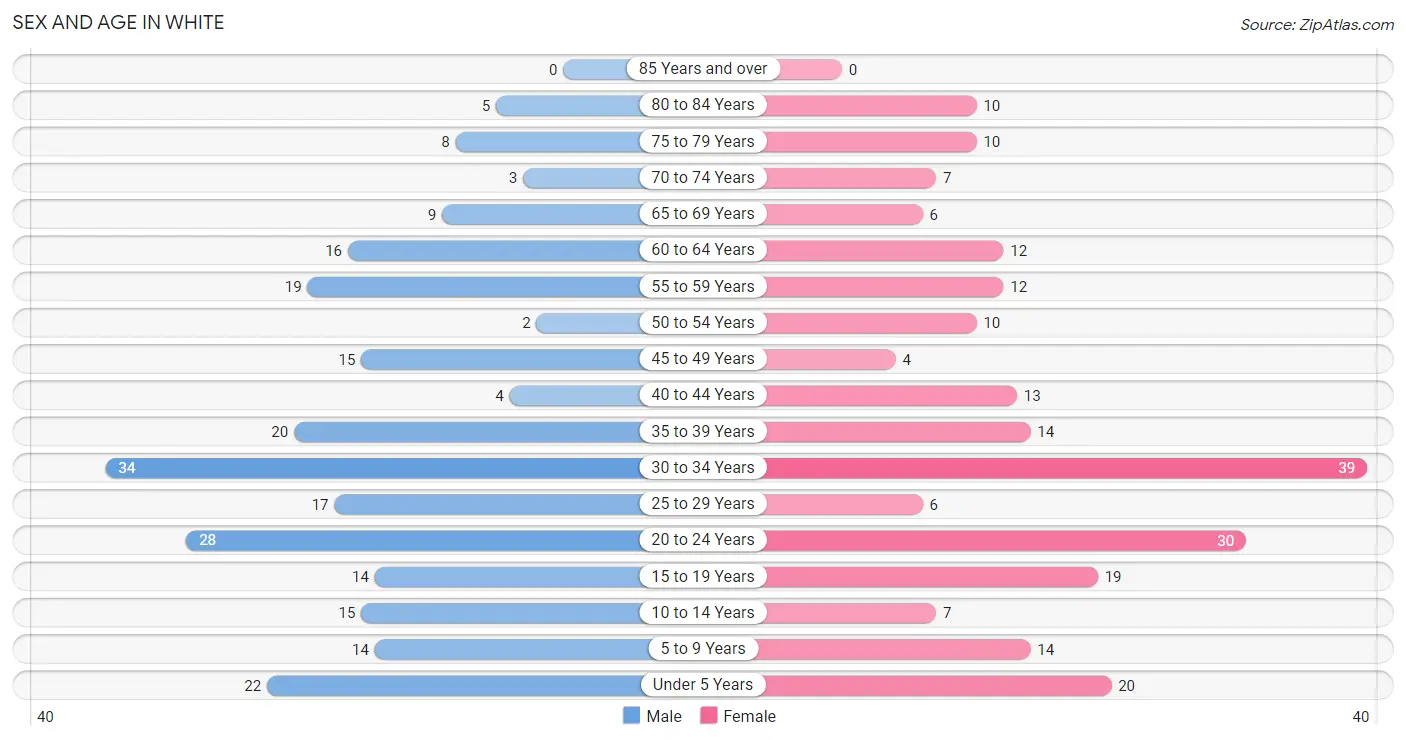
| Age Bracket | Male | Female |
| Under 5 Years | 22 (9.0%) | 20 (8.6%) |
| 5 to 9 Years | 14 (5.7%) | 14 (6.0%) |
| 10 to 14 Years | 15 (6.1%) | 7 (3.0%) |
| 15 to 19 Years | 14 (5.7%) | 19 (8.2%) |
| 20 to 24 Years | 28 (11.4%) | 30 (12.9%) |
| 25 to 29 Years | 17 (6.9%) | 6 (2.6%) |
| 30 to 34 Years | 34 (13.9%) | 39 (16.7%) |
| 35 to 39 Years | 20 (8.2%) | 14 (6.0%) |
| 40 to 44 Years | 4 (1.6%) | 13 (5.6%) |
| 45 to 49 Years | 15 (6.1%) | 4 (1.7%) |
| 50 to 54 Years | 2 (0.8%) | 10 (4.3%) |
| 55 to 59 Years | 19 (7.8%) | 12 (5.1%) |
| 60 to 64 Years | 16 (6.5%) | 12 (5.1%) |
| 65 to 69 Years | 9 (3.7%) | 6 (2.6%) |
| 70 to 74 Years | 3 (1.2%) | 7 (3.0%) |
| 75 to 79 Years | 8 (3.3%) | 10 (4.3%) |
| 80 to 84 Years | 5 (2.0%) | 10 (4.3%) |
| 85 Years and over | 0 (0.0%) | 0 (0.0%) |
| Total | 245 (100.0%) | 233 (100.0%) |
Families and Households in White
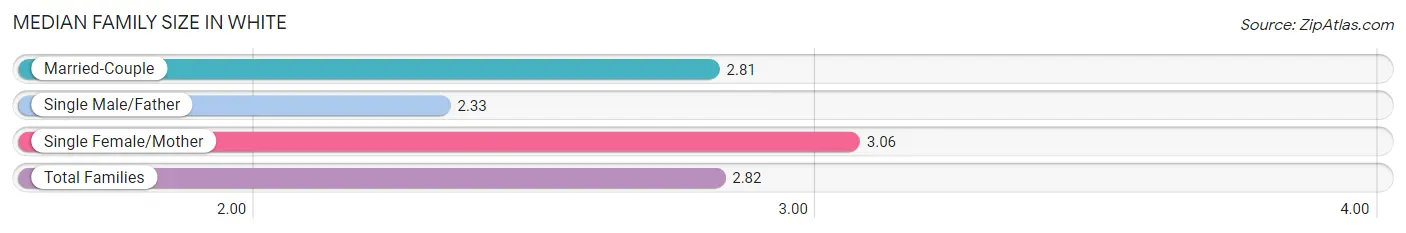
Median Family Size in White
The median family size in White is 2.82 persons per family, with single female/mother families (18 | 13.1%) accounting for the largest median family size of 3.06 persons per family. On the other hand, single male/father families (6 | 4.4%) represent the smallest median family size with 2.33 persons per family.
| Family Type | # Families | Family Size |
| Married-Couple | 113 (82.5%) | 2.81 |
| Single Male/Father | 6 (4.4%) | 2.33 |
| Single Female/Mother | 18 (13.1%) | 3.06 |
| Total Families | 137 (100.0%) | 2.82 |
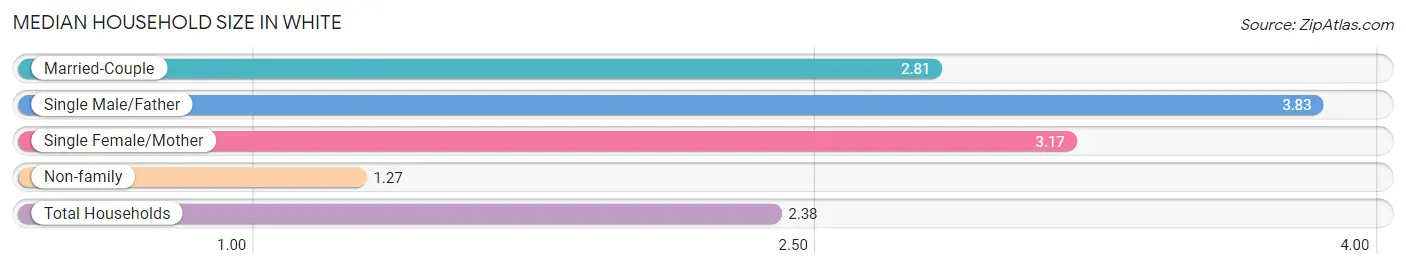
Median Household Size in White
The median household size in White is 2.38 persons per household, with single male/father households (6 | 3.0%) accounting for the largest median household size of 3.83 persons per household. non-family households (64 | 31.8%) represent the smallest median household size with 1.27 persons per household.
| Household Type | # Households | Household Size |
| Married-Couple | 113 (56.2%) | 2.81 |
| Single Male/Father | 6 (3.0%) | 3.83 |
| Single Female/Mother | 18 (9.0%) | 3.17 |
| Non-family | 64 (31.8%) | 1.27 |
| Total Households | 201 (100.0%) | 2.38 |
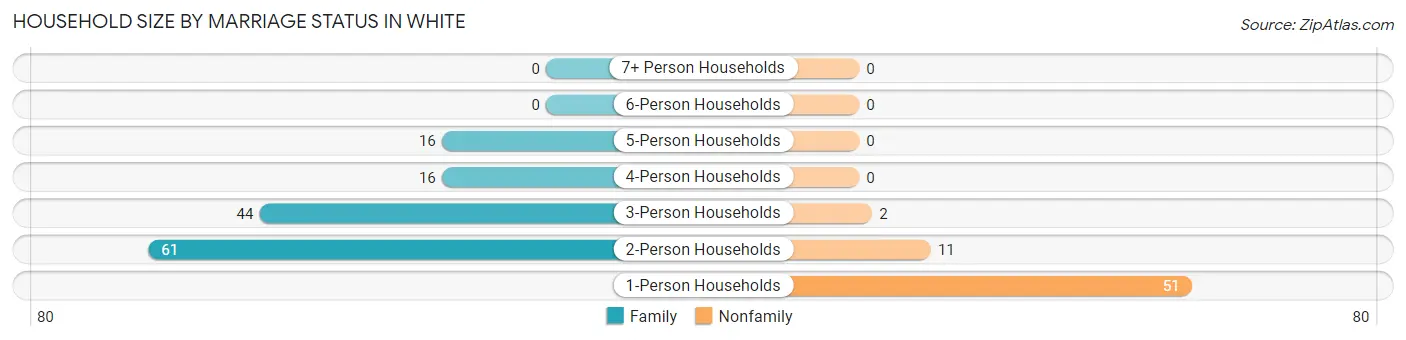
Household Size by Marriage Status in White
Out of a total of 201 households in White, 137 (68.2%) are family households, while 64 (31.8%) are nonfamily households. The most numerous type of family households are 2-person households, comprising 61, and the most common type of nonfamily households are 1-person households, comprising 51.
| Household Size | Family Households | Nonfamily Households |
| 1-Person Households | - | 51 (25.4%) |
| 2-Person Households | 61 (30.3%) | 11 (5.5%) |
| 3-Person Households | 44 (21.9%) | 2 (1.0%) |
| 4-Person Households | 16 (8.0%) | 0 (0.0%) |
| 5-Person Households | 16 (8.0%) | 0 (0.0%) |
| 6-Person Households | 0 (0.0%) | 0 (0.0%) |
| 7+ Person Households | 0 (0.0%) | 0 (0.0%) |
| Total | 137 (68.2%) | 64 (31.8%) |
Female Fertility in White
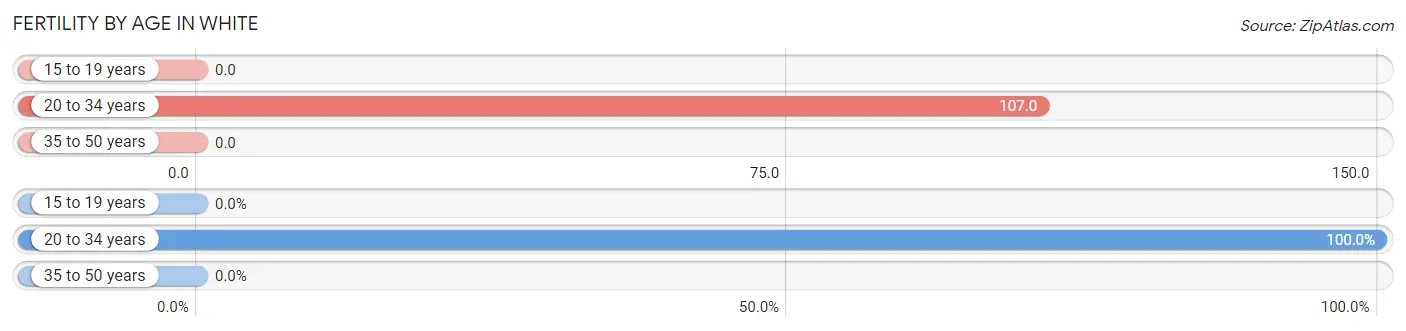
Fertility by Age in White
Average fertility rate in White is 61.0 births per 1,000 women. Women in the age bracket of 20 to 34 years have the highest fertility rate with 107.0 births per 1,000 women. Women in the age bracket of 20 to 34 years acount for 100.0% of all women with births.
| Age Bracket | Women with Births | Births / 1,000 Women |
| 15 to 19 years | 0 (0.0%) | 0.0 |
| 20 to 34 years | 8 (100.0%) | 107.0 |
| 35 to 50 years | 0 (0.0%) | 0.0 |
| Total | 8 (100.0%) | 61.0 |
Fertility by Age by Marriage Status in White
62.5% of women with births (8) in White are married. The highest percentage of unmarried women with births falls into 20 to 34 years age bracket with 37.5% of them unmarried at the time of birth, while the lowest percentage of unmarried women with births belong to 20 to 34 years age bracket with 37.5% of them unmarried.
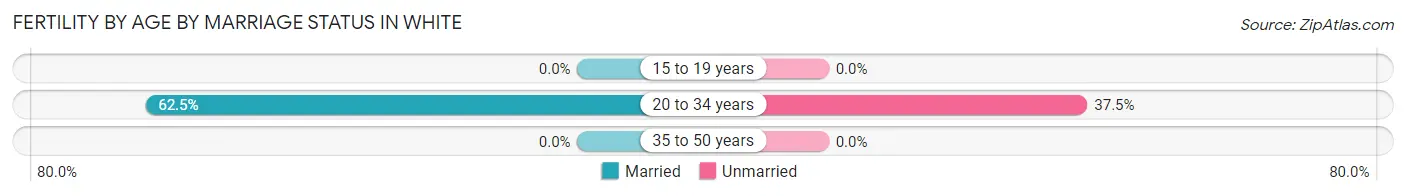
| Age Bracket | Married | Unmarried |
| 15 to 19 years | 0 (0.0%) | 0 (0.0%) |
| 20 to 34 years | 5 (62.5%) | 3 (37.5%) |
| 35 to 50 years | 0 (0.0%) | 0 (0.0%) |
| Total | 5 (62.5%) | 3 (37.5%) |
Fertility by Education in White
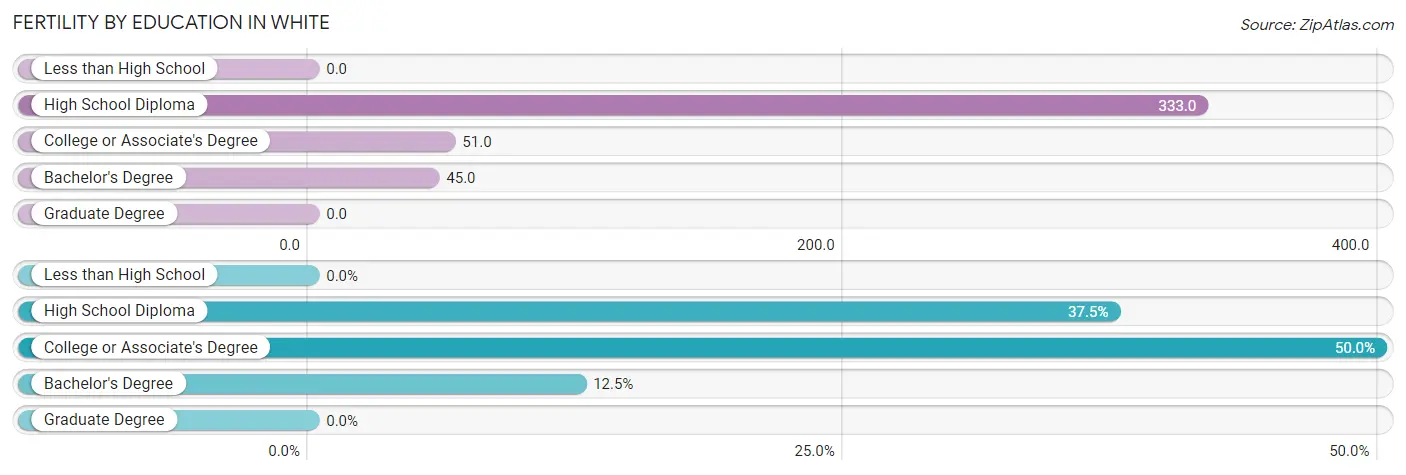
| Educational Attainment | Women with Births | Births / 1,000 Women |
| Less than High School | 0 (0.0%) | 0.0 |
| High School Diploma | 3 (37.5%) | 333.0 |
| College or Associate's Degree | 4 (50.0%) | 51.0 |
| Bachelor's Degree | 1 (12.5%) | 45.0 |
| Graduate Degree | 0 (0.0%) | 0.0 |
| Total | 8 (100.0%) | 61.0 |
Fertility by Education by Marriage Status in White
37.5% of women with births in White are unmarried. Women with the educational attainment of college or associate's degree are most likely to be married with 100.0% of them married at childbirth, while women with the educational attainment of high school diploma are least likely to be married with 100.0% of them unmarried at childbirth.
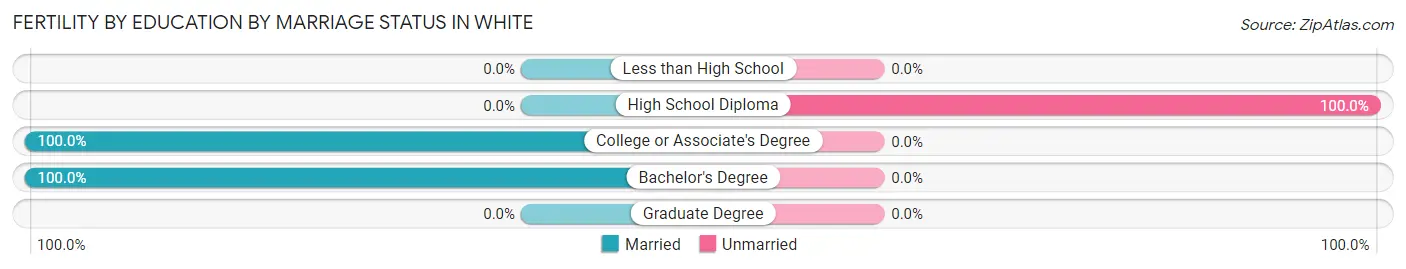
| Educational Attainment | Married | Unmarried |
| Less than High School | 0 (0.0%) | 0 (0.0%) |
| High School Diploma | 0 (0.0%) | 3 (100.0%) |
| College or Associate's Degree | 4 (100.0%) | 0 (0.0%) |
| Bachelor's Degree | 1 (100.0%) | 0 (0.0%) |
| Graduate Degree | 0 (0.0%) | 0 (0.0%) |
| Total | 5 (62.5%) | 3 (37.5%) |
Employment Characteristics in White
Employment by Class of Employer in White
Among the 290 employed individuals in White, private company employees (212 | 73.1%), self-employed (not incorporated) (25 | 8.6%), and state government employees (22 | 7.6%) make up the most common classes of employment.
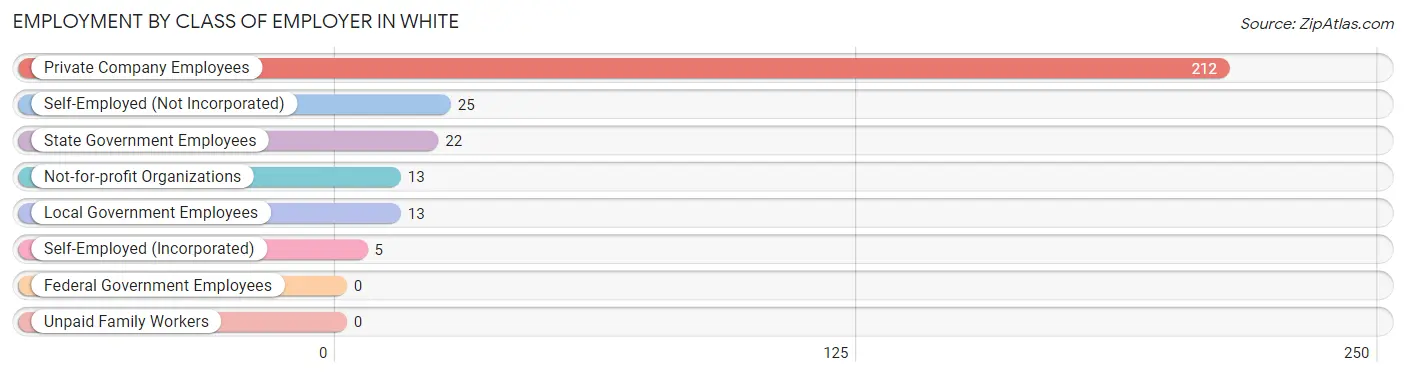
| Employer Class | # Employees | % Employees |
| Private Company Employees | 212 | 73.1% |
| Self-Employed (Incorporated) | 5 | 1.7% |
| Self-Employed (Not Incorporated) | 25 | 8.6% |
| Not-for-profit Organizations | 13 | 4.5% |
| Local Government Employees | 13 | 4.5% |
| State Government Employees | 22 | 7.6% |
| Federal Government Employees | 0 | 0.0% |
| Unpaid Family Workers | 0 | 0.0% |
| Total | 290 | 100.0% |
Employment Status by Age in White
According to the labor force statistics for White, out of the total population over 16 years of age (384), 78.6% or 302 individuals are in the labor force, with 2.3% or 7 of them unemployed. The age group with the highest labor force participation rate is 25 to 29 years, with 100.0% or 23 individuals in the labor force. Within the labor force, the 35 to 44 years age range has the highest percentage of unemployed individuals, with 14.3% or 7 of them being unemployed.
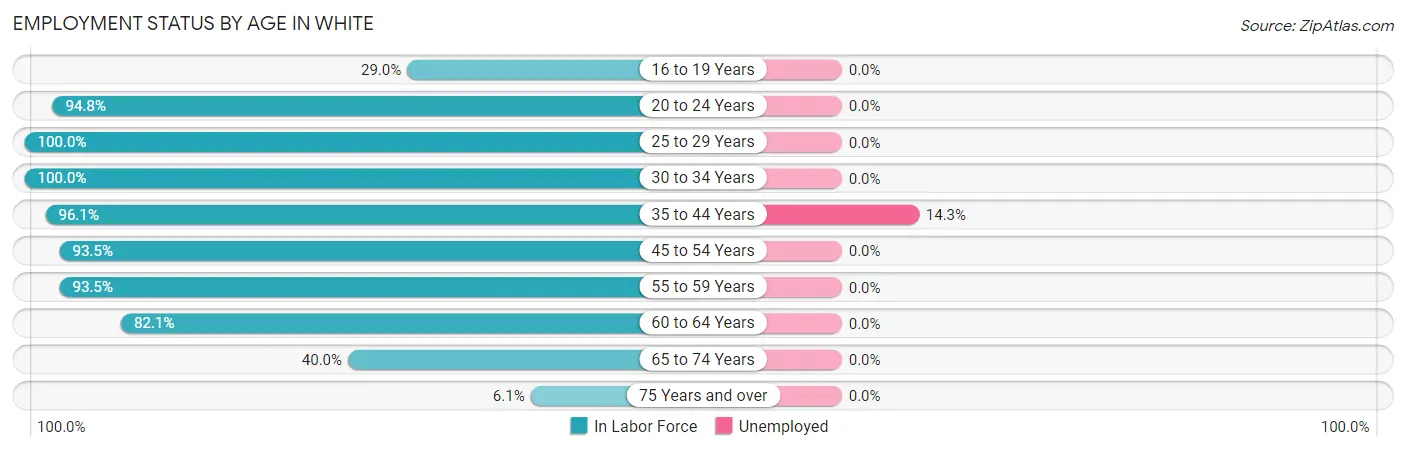
| Age Bracket | In Labor Force | Unemployed |
| 16 to 19 Years | 9 (29.0%) | 0 (0.0%) |
| 20 to 24 Years | 55 (94.8%) | 0 (0.0%) |
| 25 to 29 Years | 23 (100.0%) | 0 (0.0%) |
| 30 to 34 Years | 73 (100.0%) | 0 (0.0%) |
| 35 to 44 Years | 49 (96.1%) | 7 (14.3%) |
| 45 to 54 Years | 29 (93.5%) | 0 (0.0%) |
| 55 to 59 Years | 29 (93.5%) | 0 (0.0%) |
| 60 to 64 Years | 23 (82.1%) | 0 (0.0%) |
| 65 to 74 Years | 10 (40.0%) | 0 (0.0%) |
| 75 Years and over | 2 (6.1%) | 0 (0.0%) |
| Total | 302 (78.6%) | 7 (2.3%) |
Employment Status by Educational Attainment in White
According to labor force statistics for White, 95.4% of individuals (226) out of the total population between 25 and 64 years of age (237) are in the labor force, with 3.1% or 7 of them being unemployed. The group with the highest labor force participation rate are those with the educational attainment of less than high school, with 100.0% or 12 individuals in the labor force. Within the labor force, individuals with college / associate degree education have the highest percentage of unemployment, with 6.5% or 7 of them being unemployed.
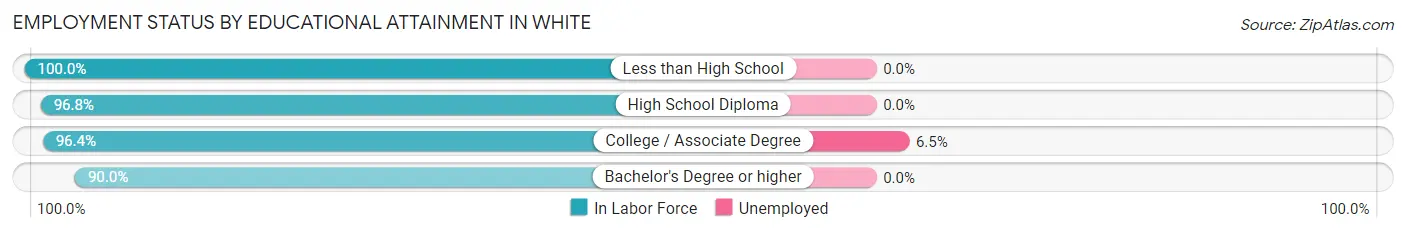
| Educational Attainment | In Labor Force | Unemployed |
| Less than High School | 12 (100.0%) | 0 (0.0%) |
| High School Diploma | 61 (96.8%) | 0 (0.0%) |
| College / Associate Degree | 108 (96.4%) | 7 (6.5%) |
| Bachelor's Degree or higher | 45 (90.0%) | 0 (0.0%) |
| Total | 226 (95.4%) | 7 (3.1%) |
Employment Occupations by Sex in White
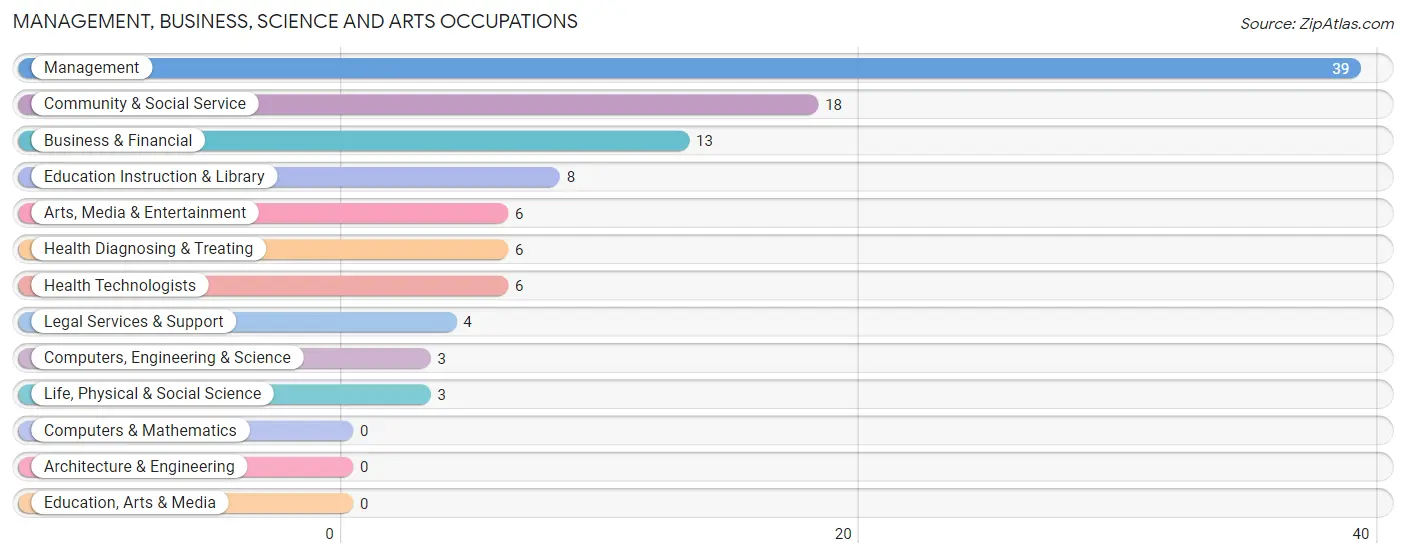
Management, Business, Science and Arts Occupations
The most common Management, Business, Science and Arts occupations in White are Management (39 | 13.2%), Community & Social Service (18 | 6.1%), Business & Financial (13 | 4.4%), Education Instruction & Library (8 | 2.7%), and Arts, Media & Entertainment (6 | 2.0%).
Management, Business, Science and Arts Occupations by Sex
Within the Management, Business, Science and Arts occupations in White, the most male-oriented occupations are Arts, Media & Entertainment (100.0%), Management (84.6%), and Community & Social Service (44.4%), while the most female-oriented occupations are Business & Financial (100.0%), Computers, Engineering & Science (100.0%), and Life, Physical & Social Science (100.0%).
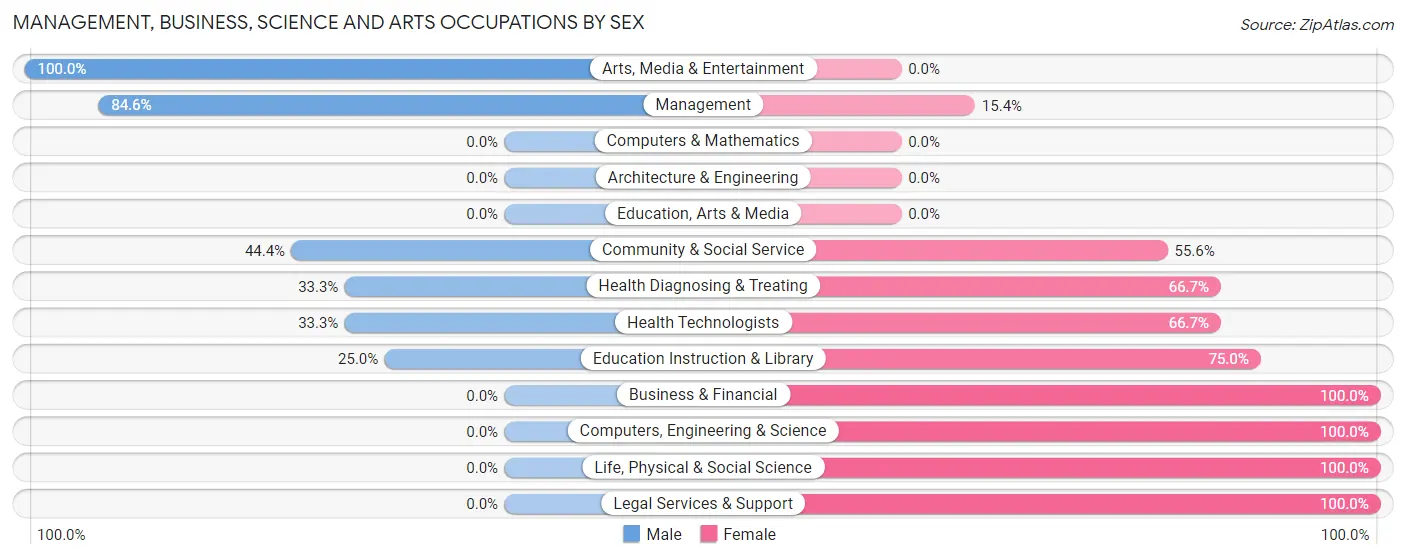
| Occupation | Male | Female |
| Management | 33 (84.6%) | 6 (15.4%) |
| Business & Financial | 0 (0.0%) | 13 (100.0%) |
| Computers, Engineering & Science | 0 (0.0%) | 3 (100.0%) |
| Computers & Mathematics | 0 (0.0%) | 0 (0.0%) |
| Architecture & Engineering | 0 (0.0%) | 0 (0.0%) |
| Life, Physical & Social Science | 0 (0.0%) | 3 (100.0%) |
| Community & Social Service | 8 (44.4%) | 10 (55.6%) |
| Education, Arts & Media | 0 (0.0%) | 0 (0.0%) |
| Legal Services & Support | 0 (0.0%) | 4 (100.0%) |
| Education Instruction & Library | 2 (25.0%) | 6 (75.0%) |
| Arts, Media & Entertainment | 6 (100.0%) | 0 (0.0%) |
| Health Diagnosing & Treating | 2 (33.3%) | 4 (66.7%) |
| Health Technologists | 2 (33.3%) | 4 (66.7%) |
| Total (Category) | 43 (54.4%) | 36 (45.6%) |
| Total (Overall) | 170 (57.6%) | 125 (42.4%) |
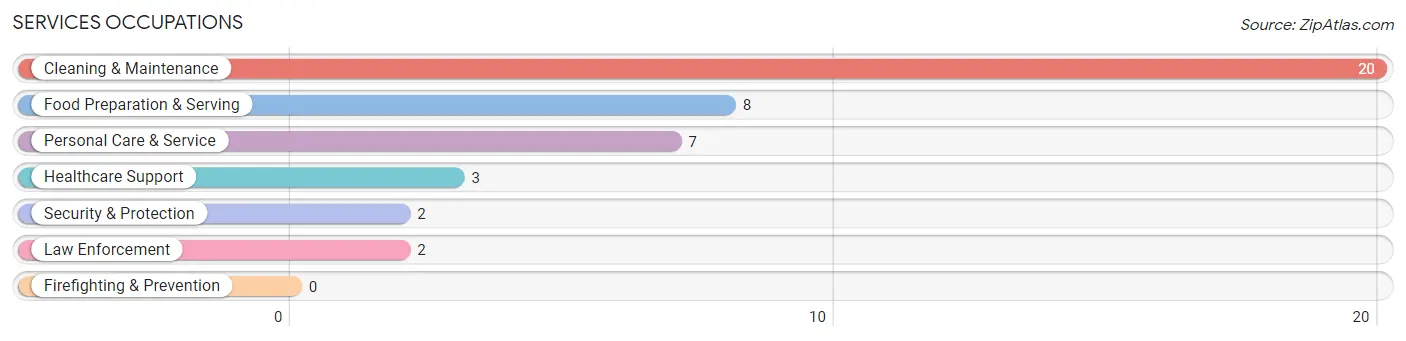
Services Occupations
The most common Services occupations in White are Cleaning & Maintenance (20 | 6.8%), Food Preparation & Serving (8 | 2.7%), Personal Care & Service (7 | 2.4%), Healthcare Support (3 | 1.0%), and Security & Protection (2 | 0.7%).
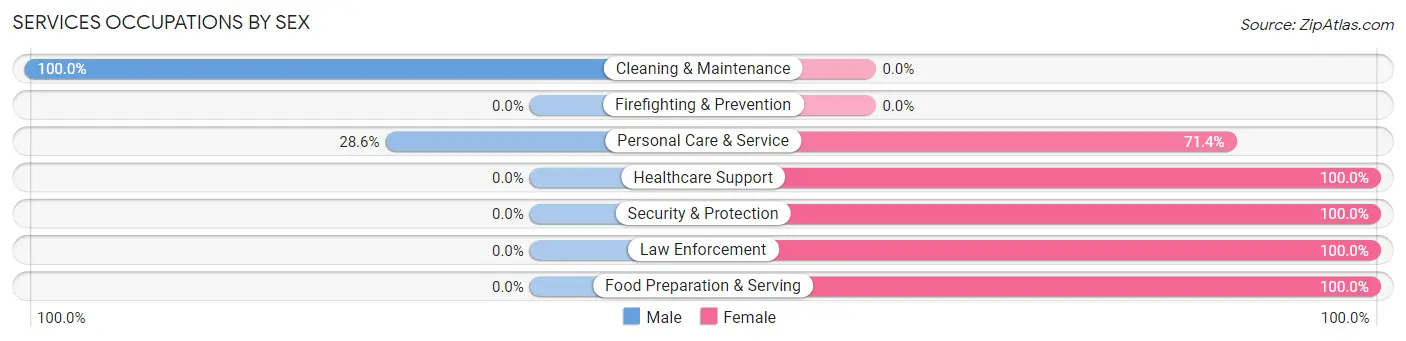
Services Occupations by Sex
Within the Services occupations in White, the most male-oriented occupations are Cleaning & Maintenance (100.0%), and Personal Care & Service (28.6%), while the most female-oriented occupations are Healthcare Support (100.0%), Security & Protection (100.0%), and Law Enforcement (100.0%).
| Occupation | Male | Female |
| Healthcare Support | 0 (0.0%) | 3 (100.0%) |
| Security & Protection | 0 (0.0%) | 2 (100.0%) |
| Firefighting & Prevention | 0 (0.0%) | 0 (0.0%) |
| Law Enforcement | 0 (0.0%) | 2 (100.0%) |
| Food Preparation & Serving | 0 (0.0%) | 8 (100.0%) |
| Cleaning & Maintenance | 20 (100.0%) | 0 (0.0%) |
| Personal Care & Service | 2 (28.6%) | 5 (71.4%) |
| Total (Category) | 22 (55.0%) | 18 (45.0%) |
| Total (Overall) | 170 (57.6%) | 125 (42.4%) |
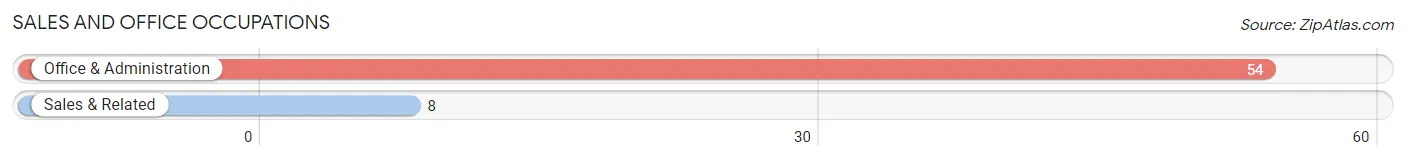
Sales and Office Occupations
The most common Sales and Office occupations in White are Office & Administration (54 | 18.3%), and Sales & Related (8 | 2.7%).
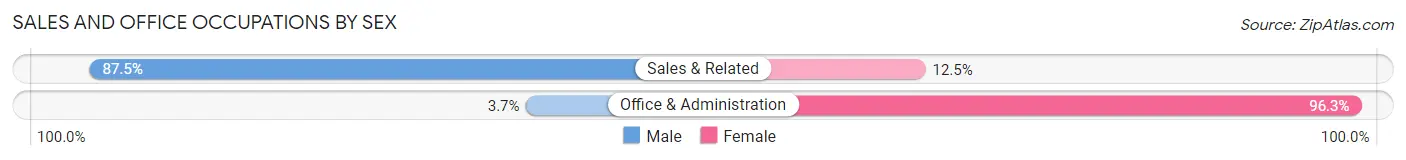
Sales and Office Occupations by Sex
| Occupation | Male | Female |
| Sales & Related | 7 (87.5%) | 1 (12.5%) |
| Office & Administration | 2 (3.7%) | 52 (96.3%) |
| Total (Category) | 9 (14.5%) | 53 (85.5%) |
| Total (Overall) | 170 (57.6%) | 125 (42.4%) |
Natural Resources, Construction and Maintenance Occupations
The most common Natural Resources, Construction and Maintenance occupations in White are Construction & Extraction (23 | 7.8%), Installation, Maintenance & Repair (17 | 5.8%), and Farming, Fishing & Forestry (12 | 4.1%).
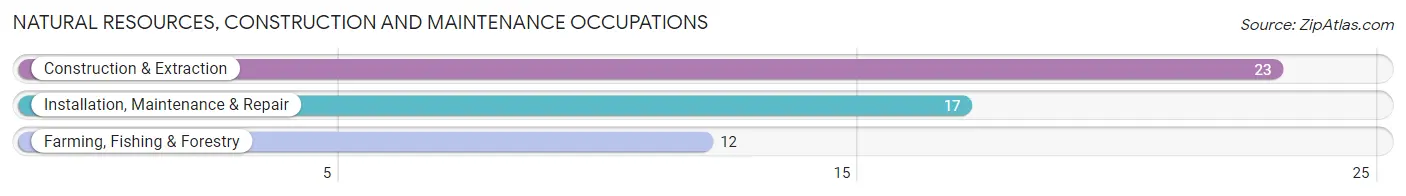
Natural Resources, Construction and Maintenance Occupations by Sex
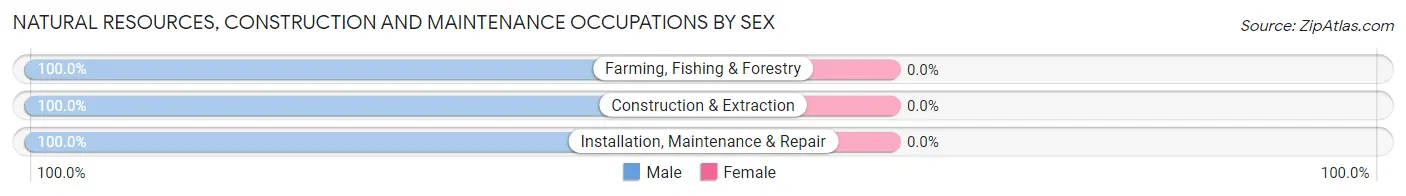
| Occupation | Male | Female |
| Farming, Fishing & Forestry | 12 (100.0%) | 0 (0.0%) |
| Construction & Extraction | 23 (100.0%) | 0 (0.0%) |
| Installation, Maintenance & Repair | 17 (100.0%) | 0 (0.0%) |
| Total (Category) | 52 (100.0%) | 0 (0.0%) |
| Total (Overall) | 170 (57.6%) | 125 (42.4%) |
Production, Transportation and Moving Occupations
The most common Production, Transportation and Moving occupations in White are Production (41 | 13.9%), Transportation (14 | 4.8%), and Material Moving (7 | 2.4%).
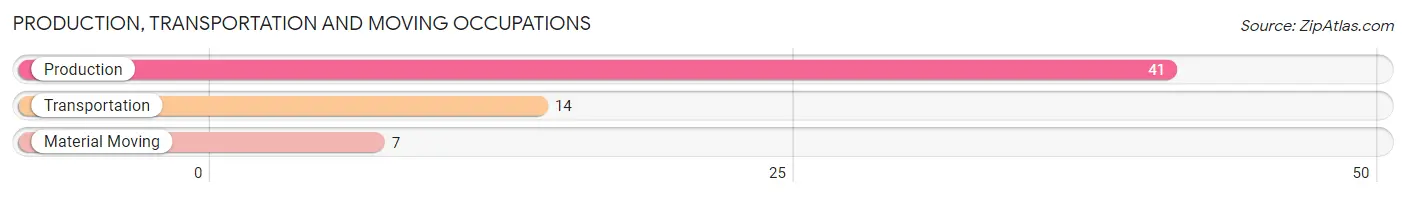
Production, Transportation and Moving Occupations by Sex
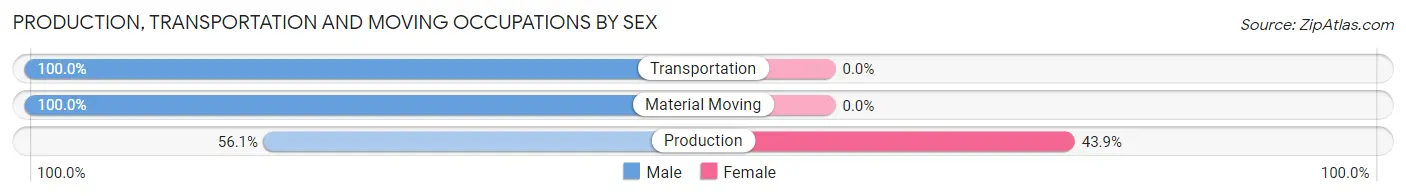
| Occupation | Male | Female |
| Production | 23 (56.1%) | 18 (43.9%) |
| Transportation | 14 (100.0%) | 0 (0.0%) |
| Material Moving | 7 (100.0%) | 0 (0.0%) |
| Total (Category) | 44 (71.0%) | 18 (29.0%) |
| Total (Overall) | 170 (57.6%) | 125 (42.4%) |
Employment Industries by Sex in White
Employment Industries in White
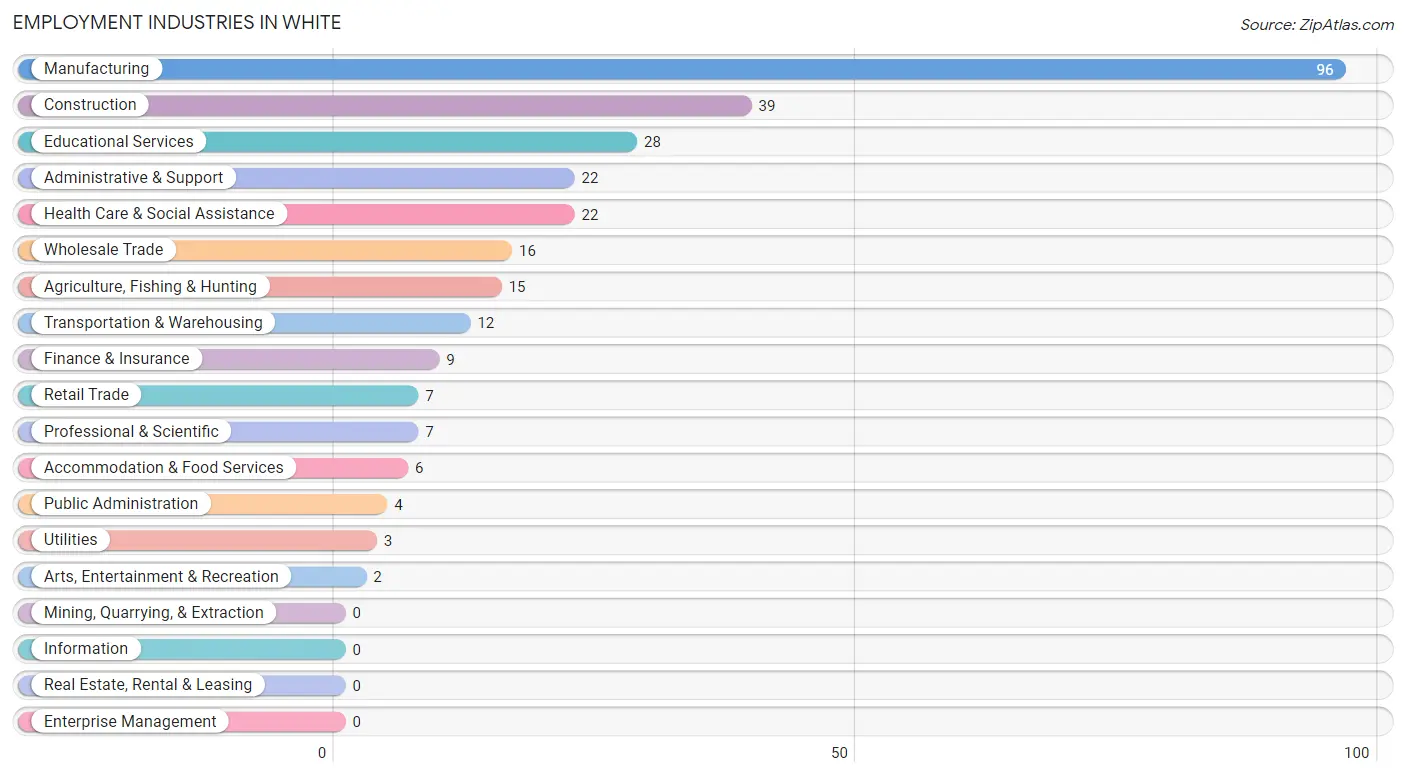
The major employment industries in White include Manufacturing (96 | 32.5%), Construction (39 | 13.2%), Educational Services (28 | 9.5%), Administrative & Support (22 | 7.5%), and Health Care & Social Assistance (22 | 7.5%).
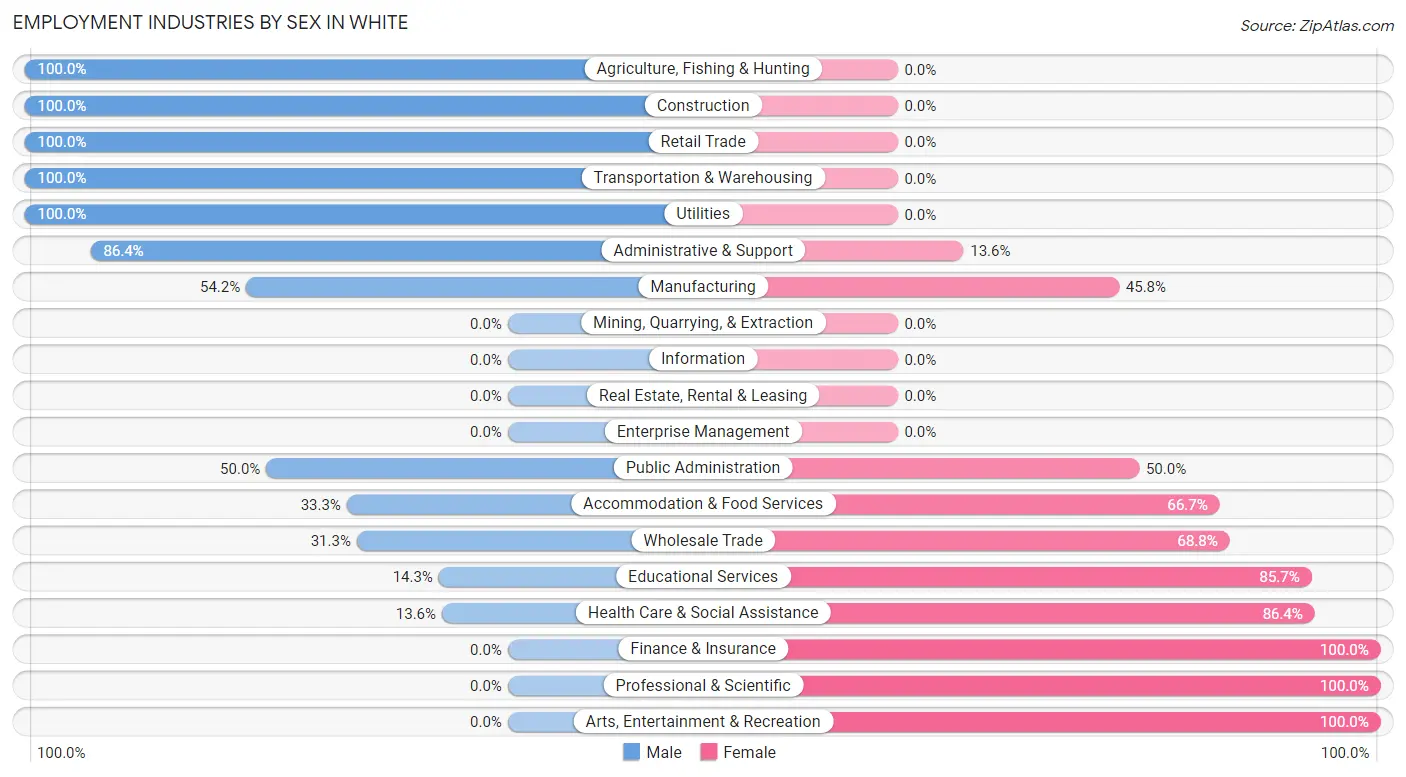
Employment Industries by Sex in White
The White industries that see more men than women are Agriculture, Fishing & Hunting (100.0%), Construction (100.0%), and Retail Trade (100.0%), whereas the industries that tend to have a higher number of women are Finance & Insurance (100.0%), Professional & Scientific (100.0%), and Arts, Entertainment & Recreation (100.0%).
| Industry | Male | Female |
| Agriculture, Fishing & Hunting | 15 (100.0%) | 0 (0.0%) |
| Mining, Quarrying, & Extraction | 0 (0.0%) | 0 (0.0%) |
| Construction | 39 (100.0%) | 0 (0.0%) |
| Manufacturing | 52 (54.2%) | 44 (45.8%) |
| Wholesale Trade | 5 (31.2%) | 11 (68.8%) |
| Retail Trade | 7 (100.0%) | 0 (0.0%) |
| Transportation & Warehousing | 12 (100.0%) | 0 (0.0%) |
| Utilities | 3 (100.0%) | 0 (0.0%) |
| Information | 0 (0.0%) | 0 (0.0%) |
| Finance & Insurance | 0 (0.0%) | 9 (100.0%) |
| Real Estate, Rental & Leasing | 0 (0.0%) | 0 (0.0%) |
| Professional & Scientific | 0 (0.0%) | 7 (100.0%) |
| Enterprise Management | 0 (0.0%) | 0 (0.0%) |
| Administrative & Support | 19 (86.4%) | 3 (13.6%) |
| Educational Services | 4 (14.3%) | 24 (85.7%) |
| Health Care & Social Assistance | 3 (13.6%) | 19 (86.4%) |
| Arts, Entertainment & Recreation | 0 (0.0%) | 2 (100.0%) |
| Accommodation & Food Services | 2 (33.3%) | 4 (66.7%) |
| Public Administration | 2 (50.0%) | 2 (50.0%) |
| Total | 170 (57.6%) | 125 (42.4%) |
Education in White
School Enrollment in White
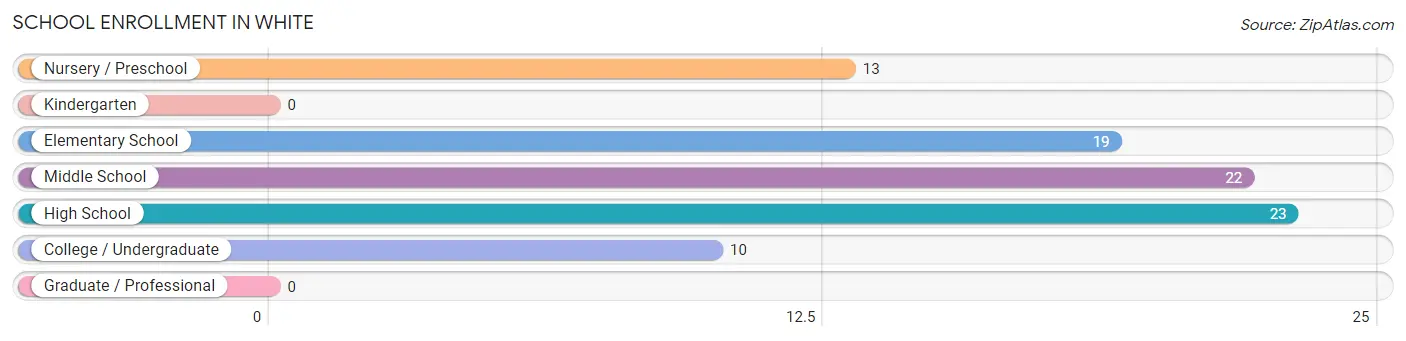
The most common levels of schooling among the 87 students in White are high school (23 | 26.4%), middle school (22 | 25.3%), and elementary school (19 | 21.8%).
| School Level | # Students | % Students |
| Nursery / Preschool | 13 | 14.9% |
| Kindergarten | 0 | 0.0% |
| Elementary School | 19 | 21.8% |
| Middle School | 22 | 25.3% |
| High School | 23 | 26.4% |
| College / Undergraduate | 10 | 11.5% |
| Graduate / Professional | 0 | 0.0% |
| Total | 87 | 100.0% |
School Enrollment by Age by Funding Source in White
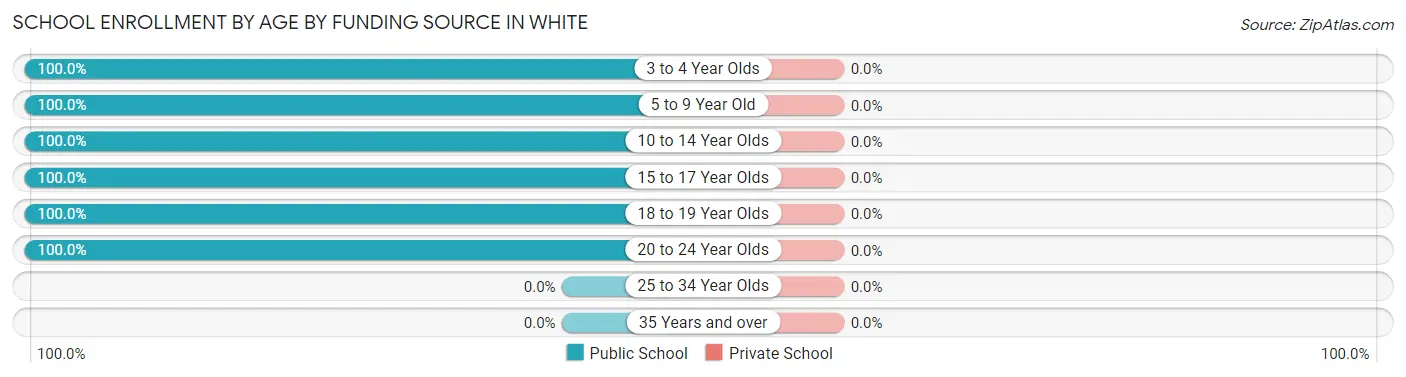
| Age Bracket | Public School | Private School |
| 3 to 4 Year Olds | 4 (100.0%) | 0 (0.0%) |
| 5 to 9 Year Old | 28 (100.0%) | 0 (0.0%) |
| 10 to 14 Year Olds | 22 (100.0%) | 0 (0.0%) |
| 15 to 17 Year Olds | 17 (100.0%) | 0 (0.0%) |
| 18 to 19 Year Olds | 6 (100.0%) | 0 (0.0%) |
| 20 to 24 Year Olds | 10 (100.0%) | 0 (0.0%) |
| 25 to 34 Year Olds | 0 (0.0%) | 0 (0.0%) |
| 35 Years and over | 0 (0.0%) | 0 (0.0%) |
| Total | 87 (100.0%) | 0 (0.0%) |
Educational Attainment by Field of Study in White
Business (17 | 27.0%), education (12 | 19.1%), bio, nature & agricultural (9 | 14.3%), science & technology (6 | 9.5%), and liberal arts & history (6 | 9.5%) are the most common fields of study among 63 individuals in White who have obtained a bachelor's degree or higher.
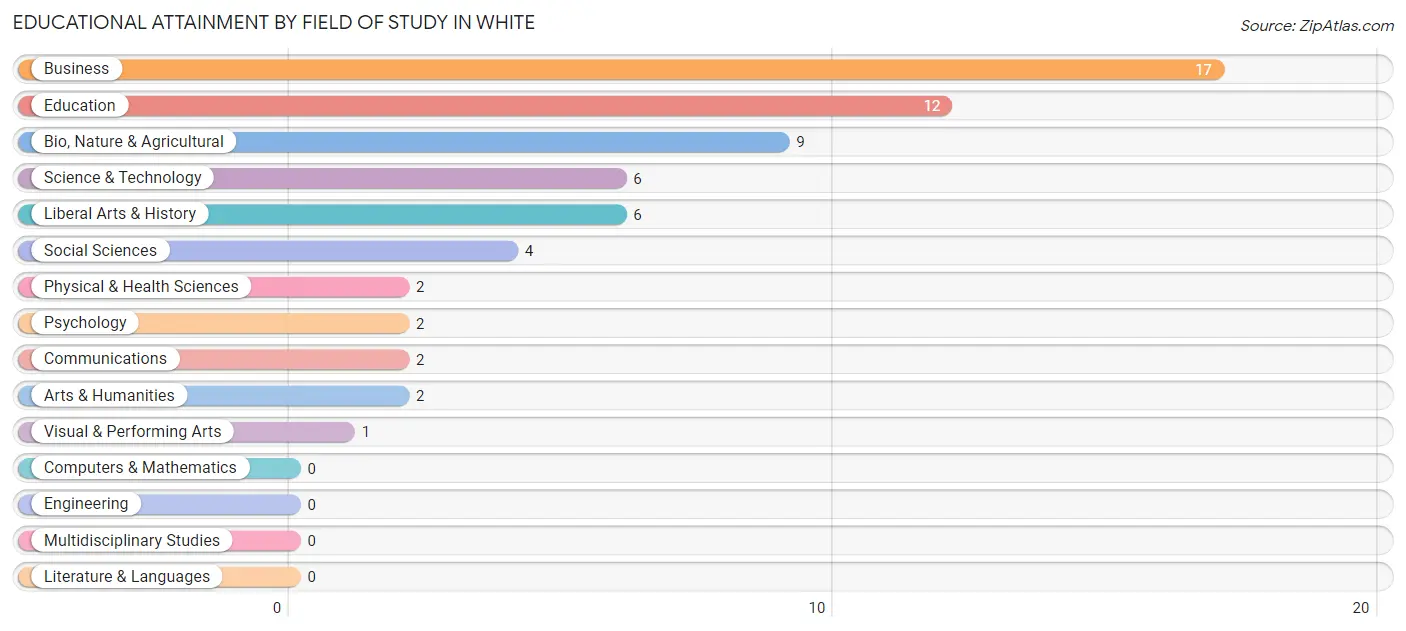
| Field of Study | # Graduates | % Graduates |
| Computers & Mathematics | 0 | 0.0% |
| Bio, Nature & Agricultural | 9 | 14.3% |
| Physical & Health Sciences | 2 | 3.2% |
| Psychology | 2 | 3.2% |
| Social Sciences | 4 | 6.4% |
| Engineering | 0 | 0.0% |
| Multidisciplinary Studies | 0 | 0.0% |
| Science & Technology | 6 | 9.5% |
| Business | 17 | 27.0% |
| Education | 12 | 19.1% |
| Literature & Languages | 0 | 0.0% |
| Liberal Arts & History | 6 | 9.5% |
| Visual & Performing Arts | 1 | 1.6% |
| Communications | 2 | 3.2% |
| Arts & Humanities | 2 | 3.2% |
| Total | 63 | 100.0% |
Transportation & Commute in White
Vehicle Availability by Sex in White
The most prevalent vehicle ownership categories in White are males with 2 vehicles (62, accounting for 37.6%) and females with 2 vehicles (48, making up 49.6%).
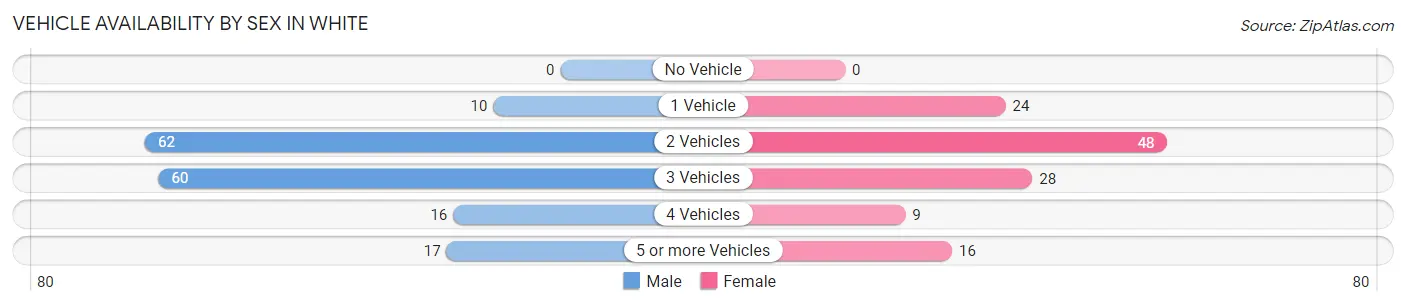
| Vehicles Available | Male | Female |
| No Vehicle | 0 (0.0%) | 0 (0.0%) |
| 1 Vehicle | 10 (6.1%) | 24 (19.2%) |
| 2 Vehicles | 62 (37.6%) | 48 (38.4%) |
| 3 Vehicles | 60 (36.4%) | 28 (22.4%) |
| 4 Vehicles | 16 (9.7%) | 9 (7.2%) |
| 5 or more Vehicles | 17 (10.3%) | 16 (12.8%) |
| Total | 165 (100.0%) | 125 (100.0%) |
Commute Time in White
The most frequently occuring commute durations in White are 20 to 24 minutes (94 commuters, 33.9%), 15 to 19 minutes (74 commuters, 26.7%), and 30 to 34 minutes (35 commuters, 12.6%).
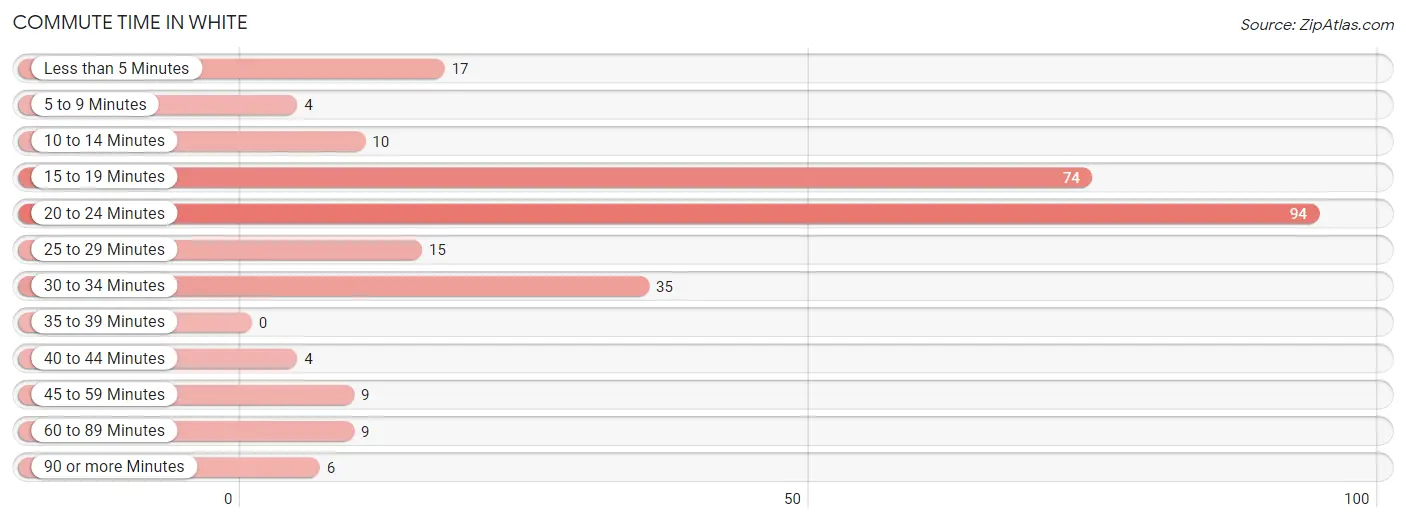
| Commute Time | # Commuters | % Commuters |
| Less than 5 Minutes | 17 | 6.1% |
| 5 to 9 Minutes | 4 | 1.4% |
| 10 to 14 Minutes | 10 | 3.6% |
| 15 to 19 Minutes | 74 | 26.7% |
| 20 to 24 Minutes | 94 | 33.9% |
| 25 to 29 Minutes | 15 | 5.4% |
| 30 to 34 Minutes | 35 | 12.6% |
| 35 to 39 Minutes | 0 | 0.0% |
| 40 to 44 Minutes | 4 | 1.4% |
| 45 to 59 Minutes | 9 | 3.3% |
| 60 to 89 Minutes | 9 | 3.3% |
| 90 or more Minutes | 6 | 2.2% |
Commute Time by Sex in White
The most common commute times in White are 15 to 19 minutes (45 commuters, 28.3%) for males and 20 to 24 minutes (53 commuters, 44.9%) for females.
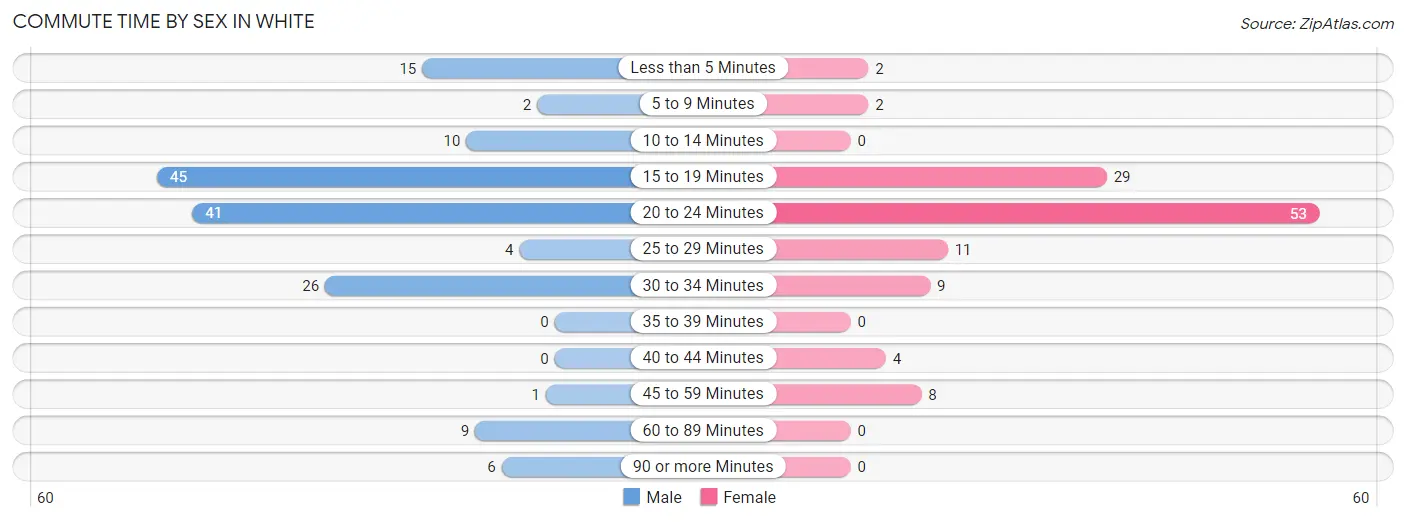
| Commute Time | Male | Female |
| Less than 5 Minutes | 15 (9.4%) | 2 (1.7%) |
| 5 to 9 Minutes | 2 (1.3%) | 2 (1.7%) |
| 10 to 14 Minutes | 10 (6.3%) | 0 (0.0%) |
| 15 to 19 Minutes | 45 (28.3%) | 29 (24.6%) |
| 20 to 24 Minutes | 41 (25.8%) | 53 (44.9%) |
| 25 to 29 Minutes | 4 (2.5%) | 11 (9.3%) |
| 30 to 34 Minutes | 26 (16.4%) | 9 (7.6%) |
| 35 to 39 Minutes | 0 (0.0%) | 0 (0.0%) |
| 40 to 44 Minutes | 0 (0.0%) | 4 (3.4%) |
| 45 to 59 Minutes | 1 (0.6%) | 8 (6.8%) |
| 60 to 89 Minutes | 9 (5.7%) | 0 (0.0%) |
| 90 or more Minutes | 6 (3.8%) | 0 (0.0%) |
Time of Departure to Work by Sex in White
The most frequent times of departure to work in White are 7:30 AM to 7:59 AM (58, 36.5%) for males and 7:30 AM to 7:59 AM (29, 24.6%) for females.
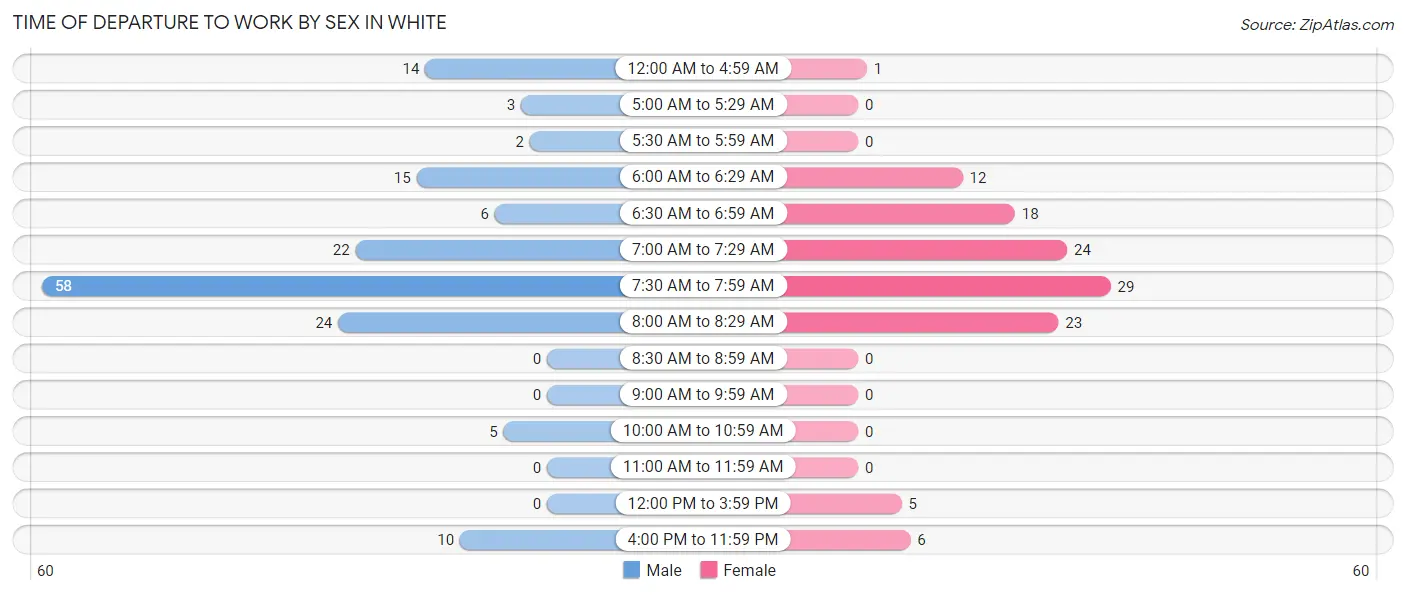
| Time of Departure | Male | Female |
| 12:00 AM to 4:59 AM | 14 (8.8%) | 1 (0.9%) |
| 5:00 AM to 5:29 AM | 3 (1.9%) | 0 (0.0%) |
| 5:30 AM to 5:59 AM | 2 (1.3%) | 0 (0.0%) |
| 6:00 AM to 6:29 AM | 15 (9.4%) | 12 (10.2%) |
| 6:30 AM to 6:59 AM | 6 (3.8%) | 18 (15.2%) |
| 7:00 AM to 7:29 AM | 22 (13.8%) | 24 (20.3%) |
| 7:30 AM to 7:59 AM | 58 (36.5%) | 29 (24.6%) |
| 8:00 AM to 8:29 AM | 24 (15.1%) | 23 (19.5%) |
| 8:30 AM to 8:59 AM | 0 (0.0%) | 0 (0.0%) |
| 9:00 AM to 9:59 AM | 0 (0.0%) | 0 (0.0%) |
| 10:00 AM to 10:59 AM | 5 (3.1%) | 0 (0.0%) |
| 11:00 AM to 11:59 AM | 0 (0.0%) | 0 (0.0%) |
| 12:00 PM to 3:59 PM | 0 (0.0%) | 5 (4.2%) |
| 4:00 PM to 11:59 PM | 10 (6.3%) | 6 (5.1%) |
| Total | 159 (100.0%) | 118 (100.0%) |
Housing Occupancy in White
Occupancy by Ownership in White
Of the total 201 dwellings in White, owner-occupied units account for 133 (66.2%), while renter-occupied units make up 68 (33.8%).
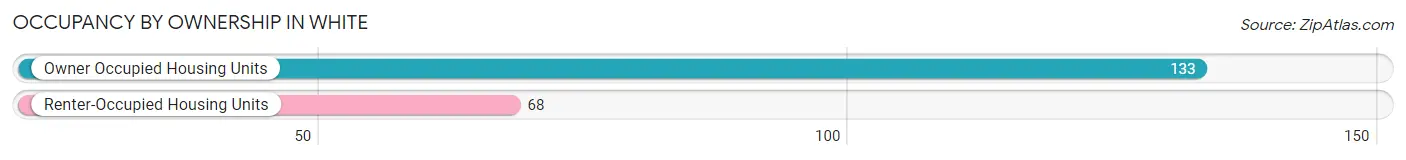
| Occupancy | # Housing Units | % Housing Units |
| Owner Occupied Housing Units | 133 | 66.2% |
| Renter-Occupied Housing Units | 68 | 33.8% |
| Total Occupied Housing Units | 201 | 100.0% |
Occupancy by Household Size in White
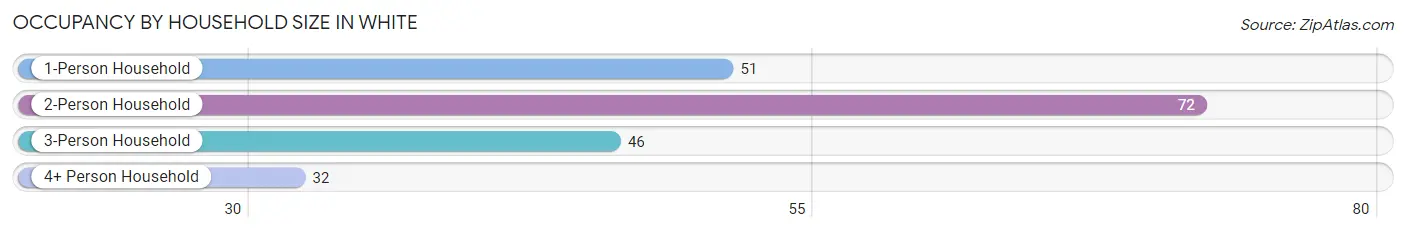
| Household Size | # Housing Units | % Housing Units |
| 1-Person Household | 51 | 25.4% |
| 2-Person Household | 72 | 35.8% |
| 3-Person Household | 46 | 22.9% |
| 4+ Person Household | 32 | 15.9% |
| Total Housing Units | 201 | 100.0% |
Occupancy by Ownership by Household Size in White
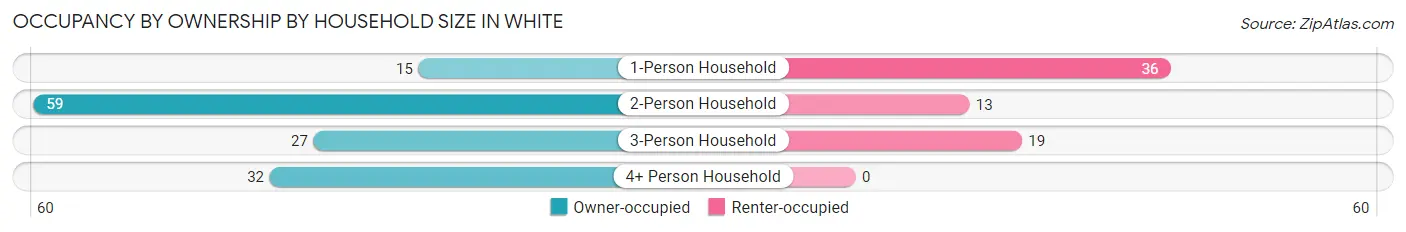
| Household Size | Owner-occupied | Renter-occupied |
| 1-Person Household | 15 (29.4%) | 36 (70.6%) |
| 2-Person Household | 59 (81.9%) | 13 (18.1%) |
| 3-Person Household | 27 (58.7%) | 19 (41.3%) |
| 4+ Person Household | 32 (100.0%) | 0 (0.0%) |
| Total Housing Units | 133 (66.2%) | 68 (33.8%) |
Occupancy by Educational Attainment in White
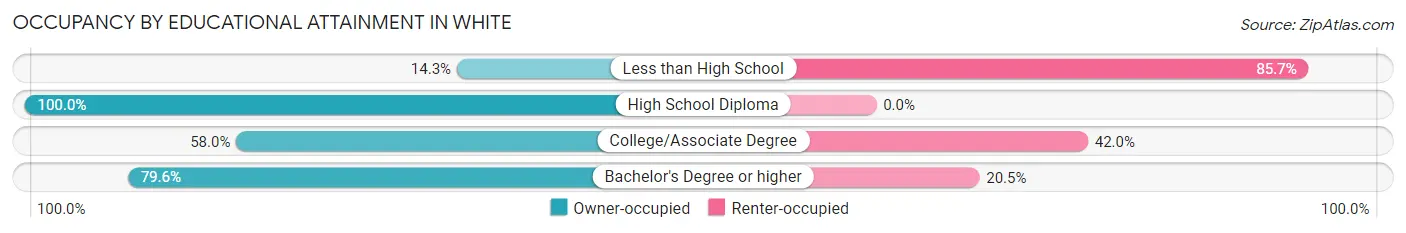
| Household Size | Owner-occupied | Renter-occupied |
| Less than High School | 2 (14.3%) | 12 (85.7%) |
| High School Diploma | 31 (100.0%) | 0 (0.0%) |
| College/Associate Degree | 65 (58.0%) | 47 (42.0%) |
| Bachelor's Degree or higher | 35 (79.5%) | 9 (20.4%) |
Occupancy by Age of Householder in White
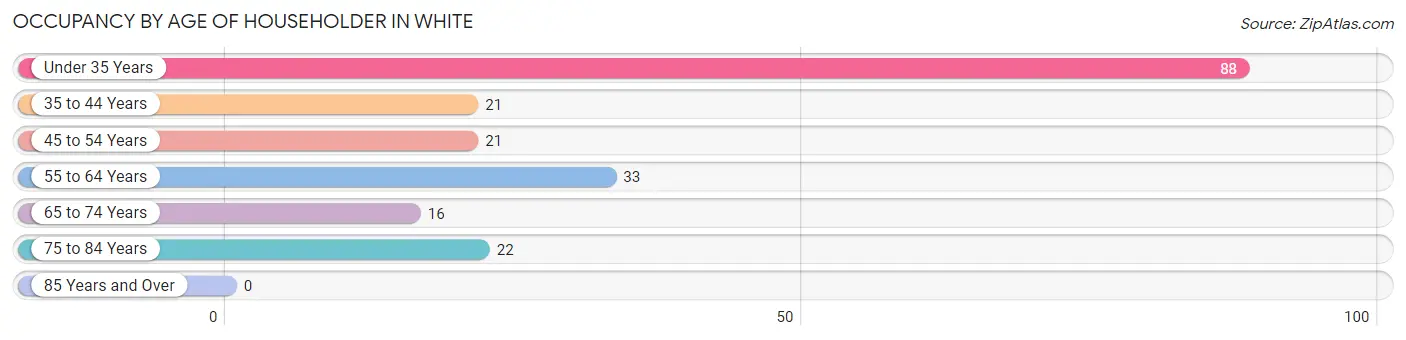
| Age Bracket | # Households | % Households |
| Under 35 Years | 88 | 43.8% |
| 35 to 44 Years | 21 | 10.4% |
| 45 to 54 Years | 21 | 10.4% |
| 55 to 64 Years | 33 | 16.4% |
| 65 to 74 Years | 16 | 8.0% |
| 75 to 84 Years | 22 | 11.0% |
| 85 Years and Over | 0 | 0.0% |
| Total | 201 | 100.0% |
Housing Finances in White
Median Income by Occupancy in White
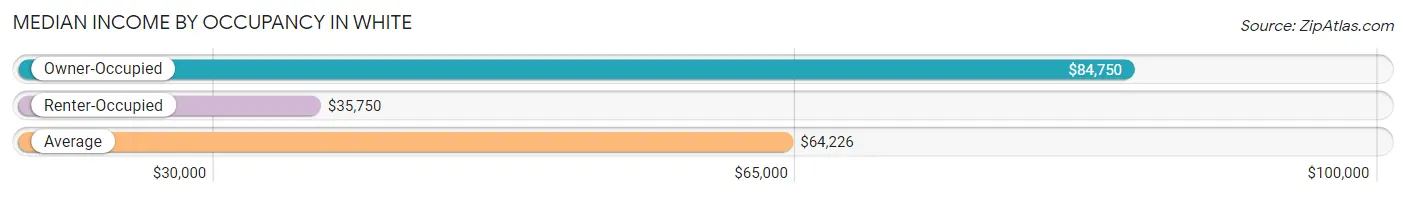
| Occupancy Type | # Households | Median Income |
| Owner-Occupied | 133 (66.2%) | $84,750 |
| Renter-Occupied | 68 (33.8%) | $35,750 |
| Average | 201 (100.0%) | $64,226 |
Occupancy by Householder Income Bracket in White
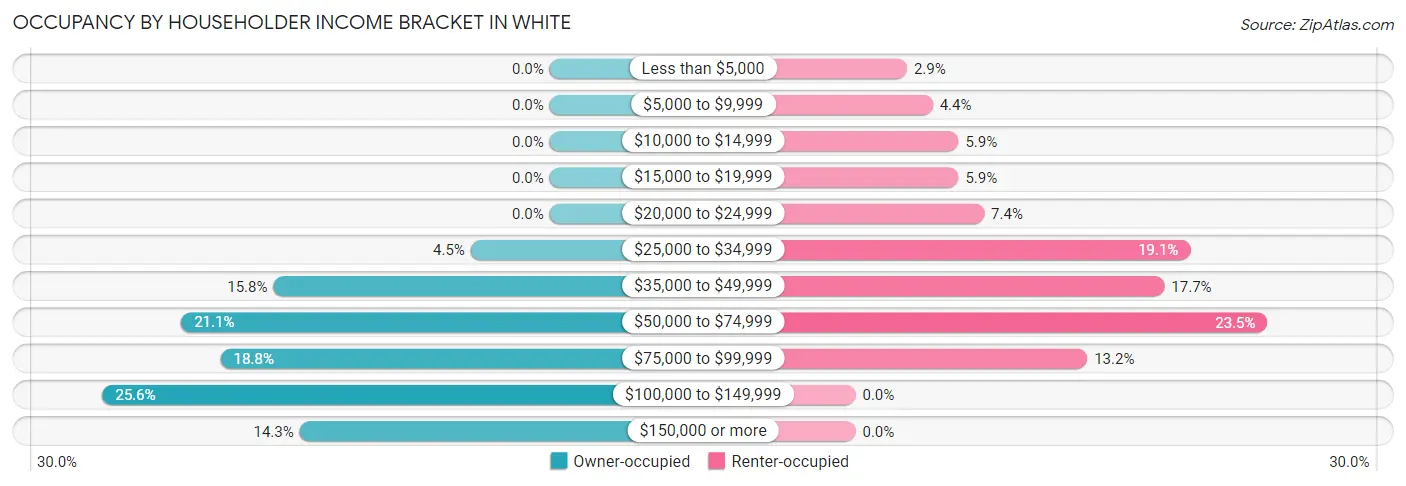
| Income Bracket | Owner-occupied | Renter-occupied |
| Less than $5,000 | 0 (0.0%) | 2 (2.9%) |
| $5,000 to $9,999 | 0 (0.0%) | 3 (4.4%) |
| $10,000 to $14,999 | 0 (0.0%) | 4 (5.9%) |
| $15,000 to $19,999 | 0 (0.0%) | 4 (5.9%) |
| $20,000 to $24,999 | 0 (0.0%) | 5 (7.3%) |
| $25,000 to $34,999 | 6 (4.5%) | 13 (19.1%) |
| $35,000 to $49,999 | 21 (15.8%) | 12 (17.6%) |
| $50,000 to $74,999 | 28 (21.0%) | 16 (23.5%) |
| $75,000 to $99,999 | 25 (18.8%) | 9 (13.2%) |
| $100,000 to $149,999 | 34 (25.6%) | 0 (0.0%) |
| $150,000 or more | 19 (14.3%) | 0 (0.0%) |
| Total | 133 (100.0%) | 68 (100.0%) |
Monthly Housing Cost Tiers in White
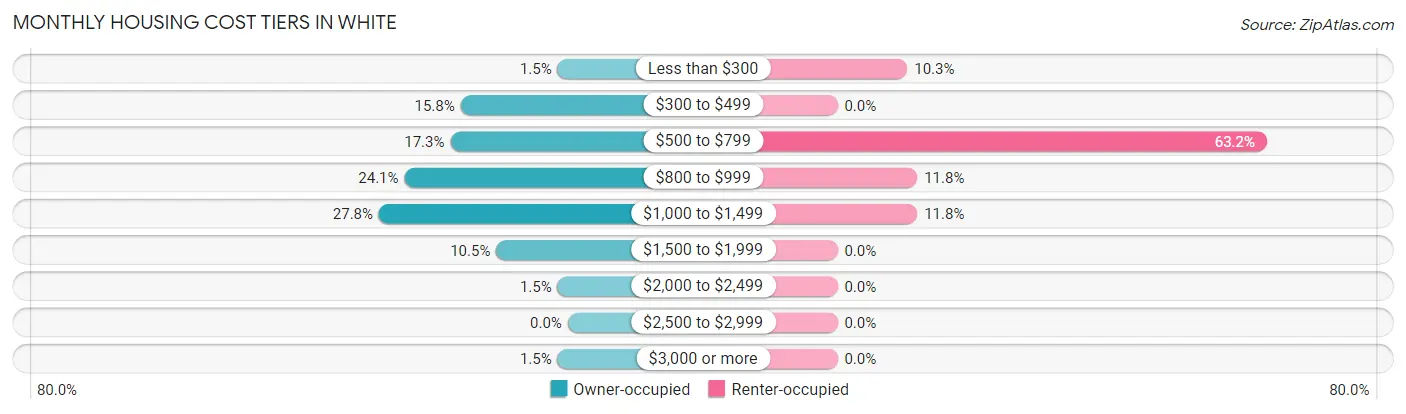
| Monthly Cost | Owner-occupied | Renter-occupied |
| Less than $300 | 2 (1.5%) | 7 (10.3%) |
| $300 to $499 | 21 (15.8%) | 0 (0.0%) |
| $500 to $799 | 23 (17.3%) | 43 (63.2%) |
| $800 to $999 | 32 (24.1%) | 8 (11.8%) |
| $1,000 to $1,499 | 37 (27.8%) | 8 (11.8%) |
| $1,500 to $1,999 | 14 (10.5%) | 0 (0.0%) |
| $2,000 to $2,499 | 2 (1.5%) | 0 (0.0%) |
| $2,500 to $2,999 | 0 (0.0%) | 0 (0.0%) |
| $3,000 or more | 2 (1.5%) | 0 (0.0%) |
| Total | 133 (100.0%) | 68 (100.0%) |
Physical Housing Characteristics in White
Housing Structures in White
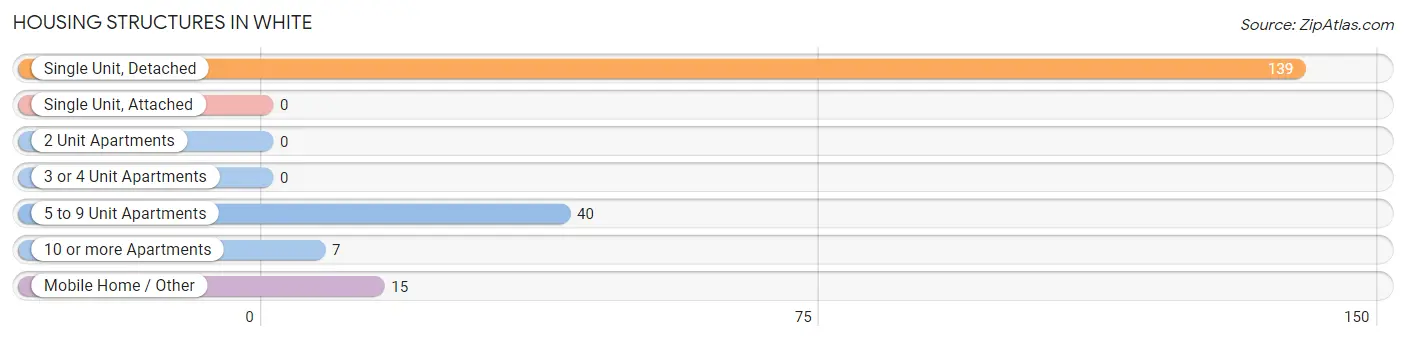
| Structure Type | # Housing Units | % Housing Units |
| Single Unit, Detached | 139 | 69.2% |
| Single Unit, Attached | 0 | 0.0% |
| 2 Unit Apartments | 0 | 0.0% |
| 3 or 4 Unit Apartments | 0 | 0.0% |
| 5 to 9 Unit Apartments | 40 | 19.9% |
| 10 or more Apartments | 7 | 3.5% |
| Mobile Home / Other | 15 | 7.5% |
| Total | 201 | 100.0% |
Housing Structures by Occupancy in White
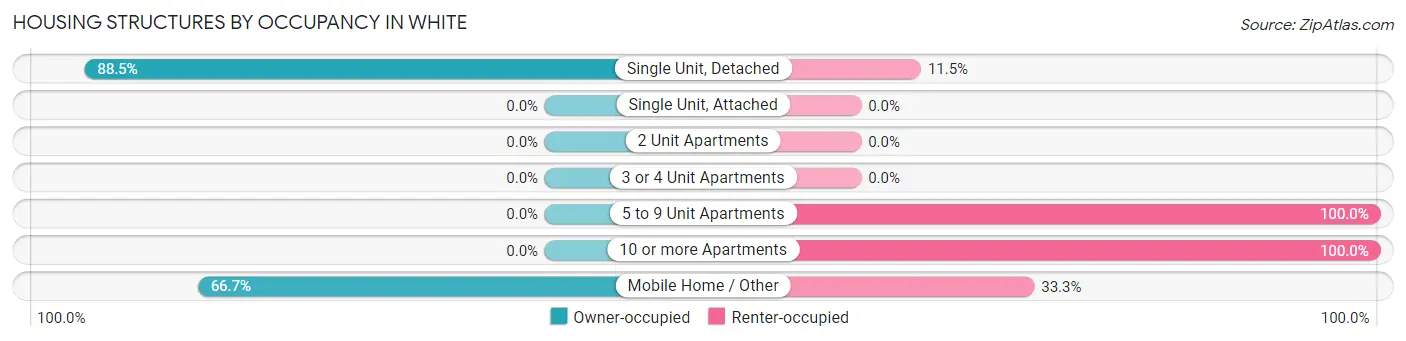
| Structure Type | Owner-occupied | Renter-occupied |
| Single Unit, Detached | 123 (88.5%) | 16 (11.5%) |
| Single Unit, Attached | 0 (0.0%) | 0 (0.0%) |
| 2 Unit Apartments | 0 (0.0%) | 0 (0.0%) |
| 3 or 4 Unit Apartments | 0 (0.0%) | 0 (0.0%) |
| 5 to 9 Unit Apartments | 0 (0.0%) | 40 (100.0%) |
| 10 or more Apartments | 0 (0.0%) | 7 (100.0%) |
| Mobile Home / Other | 10 (66.7%) | 5 (33.3%) |
| Total | 133 (66.2%) | 68 (33.8%) |
Housing Structures by Number of Rooms in White
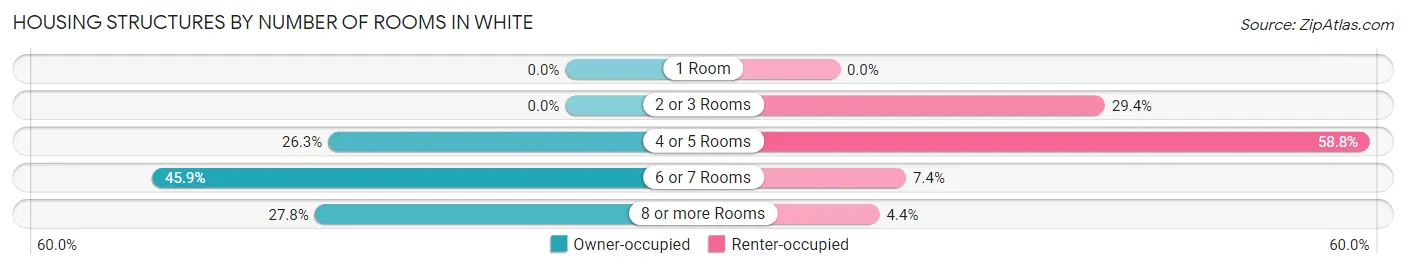
| Number of Rooms | Owner-occupied | Renter-occupied |
| 1 Room | 0 (0.0%) | 0 (0.0%) |
| 2 or 3 Rooms | 0 (0.0%) | 20 (29.4%) |
| 4 or 5 Rooms | 35 (26.3%) | 40 (58.8%) |
| 6 or 7 Rooms | 61 (45.9%) | 5 (7.3%) |
| 8 or more Rooms | 37 (27.8%) | 3 (4.4%) |
| Total | 133 (100.0%) | 68 (100.0%) |
Housing Structure by Heating Type in White
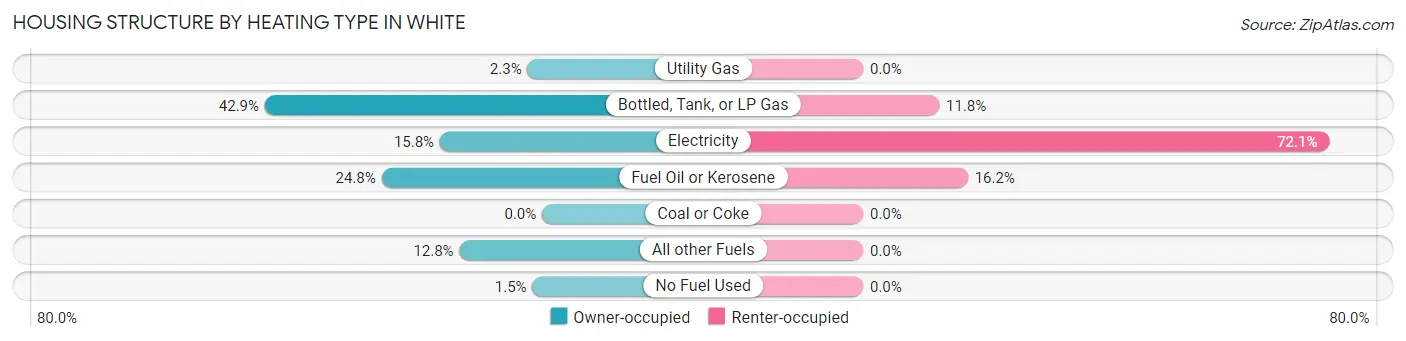
| Heating Type | Owner-occupied | Renter-occupied |
| Utility Gas | 3 (2.3%) | 0 (0.0%) |
| Bottled, Tank, or LP Gas | 57 (42.9%) | 8 (11.8%) |
| Electricity | 21 (15.8%) | 49 (72.1%) |
| Fuel Oil or Kerosene | 33 (24.8%) | 11 (16.2%) |
| Coal or Coke | 0 (0.0%) | 0 (0.0%) |
| All other Fuels | 17 (12.8%) | 0 (0.0%) |
| No Fuel Used | 2 (1.5%) | 0 (0.0%) |
| Total | 133 (100.0%) | 68 (100.0%) |
Household Vehicle Usage in White
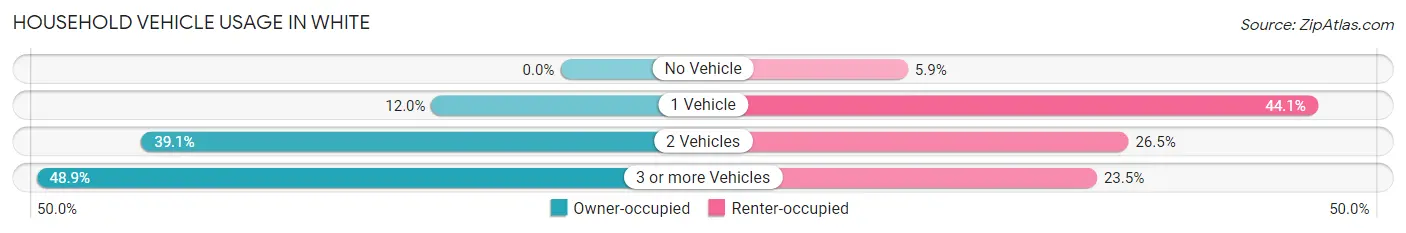
| Vehicles per Household | Owner-occupied | Renter-occupied |
| No Vehicle | 0 (0.0%) | 4 (5.9%) |
| 1 Vehicle | 16 (12.0%) | 30 (44.1%) |
| 2 Vehicles | 52 (39.1%) | 18 (26.5%) |
| 3 or more Vehicles | 65 (48.9%) | 16 (23.5%) |
| Total | 133 (100.0%) | 68 (100.0%) |
Real Estate & Mortgages in White
Real Estate and Mortgage Overview in White
| Characteristic | Without Mortgage | With Mortgage |
| Housing Units | 50 | 83 |
| Median Property Value | $127,800 | $143,400 |
| Median Household Income | $48,750 | $15 |
| Monthly Housing Costs | $520 | $2 |
| Real Estate Taxes | $1,766 | $0 |
Property Value by Mortgage Status in White
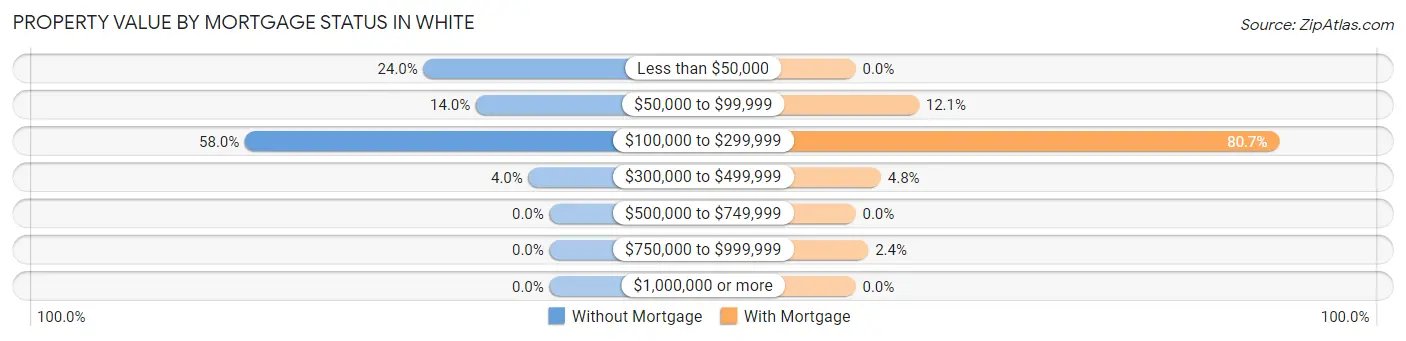
| Property Value | Without Mortgage | With Mortgage |
| Less than $50,000 | 12 (24.0%) | 0 (0.0%) |
| $50,000 to $99,999 | 7 (14.0%) | 10 (12.0%) |
| $100,000 to $299,999 | 29 (58.0%) | 67 (80.7%) |
| $300,000 to $499,999 | 2 (4.0%) | 4 (4.8%) |
| $500,000 to $749,999 | 0 (0.0%) | 0 (0.0%) |
| $750,000 to $999,999 | 0 (0.0%) | 2 (2.4%) |
| $1,000,000 or more | 0 (0.0%) | 0 (0.0%) |
| Total | 50 (100.0%) | 83 (100.0%) |
Household Income by Mortgage Status in White
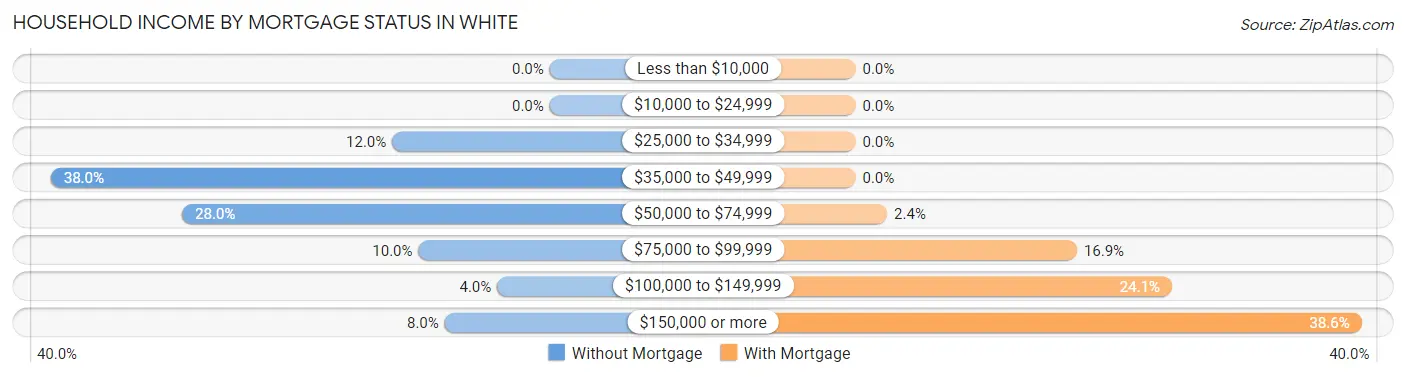
| Household Income | Without Mortgage | With Mortgage |
| Less than $10,000 | 0 (0.0%) | 0 (0.0%) |
| $10,000 to $24,999 | 0 (0.0%) | 0 (0.0%) |
| $25,000 to $34,999 | 6 (12.0%) | 0 (0.0%) |
| $35,000 to $49,999 | 19 (38.0%) | 0 (0.0%) |
| $50,000 to $74,999 | 14 (28.0%) | 2 (2.4%) |
| $75,000 to $99,999 | 5 (10.0%) | 14 (16.9%) |
| $100,000 to $149,999 | 2 (4.0%) | 20 (24.1%) |
| $150,000 or more | 4 (8.0%) | 32 (38.6%) |
| Total | 50 (100.0%) | 83 (100.0%) |
Property Value to Household Income Ratio in White
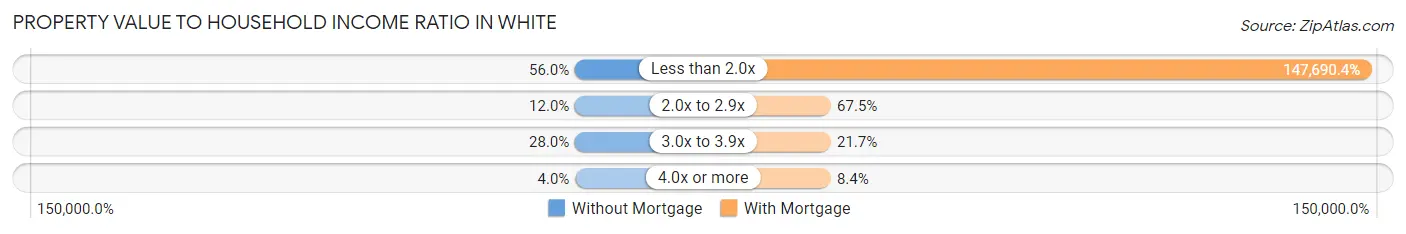
| Value-to-Income Ratio | Without Mortgage | With Mortgage |
| Less than 2.0x | 28 (56.0%) | 122,583 (147,690.4%) |
| 2.0x to 2.9x | 6 (12.0%) | 56 (67.5%) |
| 3.0x to 3.9x | 14 (28.0%) | 18 (21.7%) |
| 4.0x or more | 2 (4.0%) | 7 (8.4%) |
| Total | 50 (100.0%) | 83 (100.0%) |
Real Estate Taxes by Mortgage Status in White
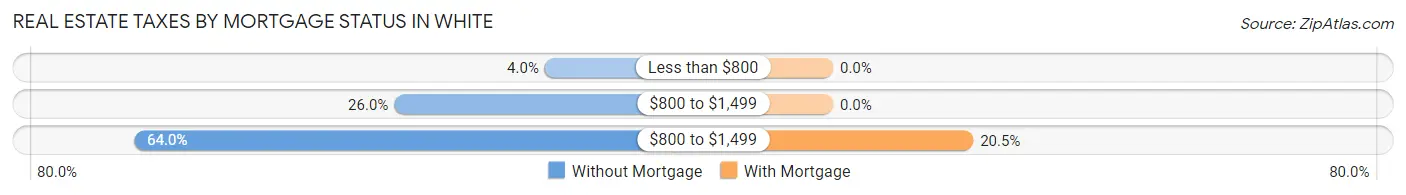
| Property Taxes | Without Mortgage | With Mortgage |
| Less than $800 | 2 (4.0%) | 0 (0.0%) |
| $800 to $1,499 | 13 (26.0%) | 0 (0.0%) |
| $800 to $1,499 | 32 (64.0%) | 17 (20.5%) |
| Total | 50 (100.0%) | 83 (100.0%) |
Health & Disability in White
Health Insurance Coverage by Age in White
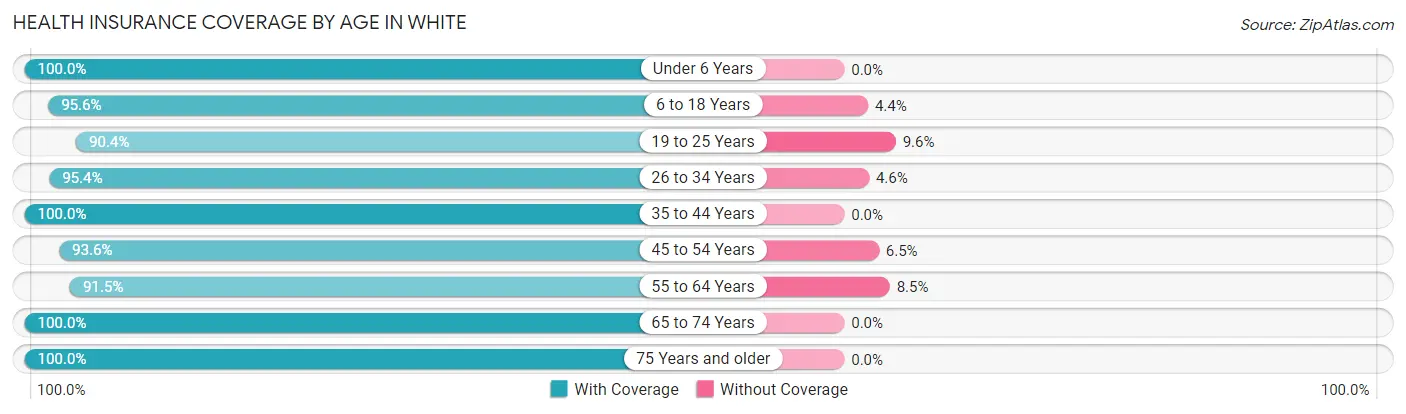
| Age Bracket | With Coverage | Without Coverage |
| Under 6 Years | 51 (100.0%) | 0 (0.0%) |
| 6 to 18 Years | 65 (95.6%) | 3 (4.4%) |
| 19 to 25 Years | 66 (90.4%) | 7 (9.6%) |
| 26 to 34 Years | 83 (95.4%) | 4 (4.6%) |
| 35 to 44 Years | 51 (100.0%) | 0 (0.0%) |
| 45 to 54 Years | 29 (93.5%) | 2 (6.5%) |
| 55 to 64 Years | 54 (91.5%) | 5 (8.5%) |
| 65 to 74 Years | 25 (100.0%) | 0 (0.0%) |
| 75 Years and older | 33 (100.0%) | 0 (0.0%) |
| Total | 457 (95.6%) | 21 (4.4%) |
Health Insurance Coverage by Citizenship Status in White
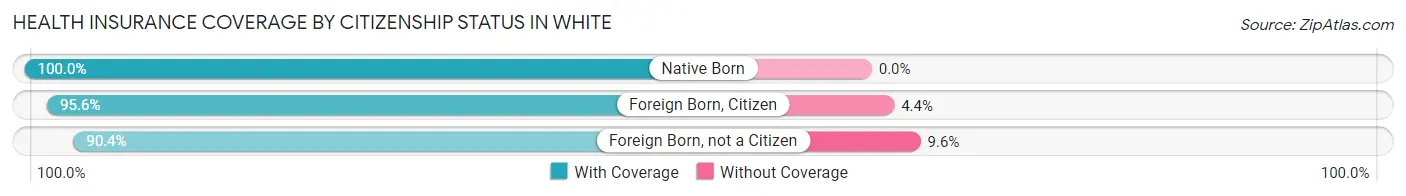
| Citizenship Status | With Coverage | Without Coverage |
| Native Born | 51 (100.0%) | 0 (0.0%) |
| Foreign Born, Citizen | 65 (95.6%) | 3 (4.4%) |
| Foreign Born, not a Citizen | 66 (90.4%) | 7 (9.6%) |
Health Insurance Coverage by Household Income in White
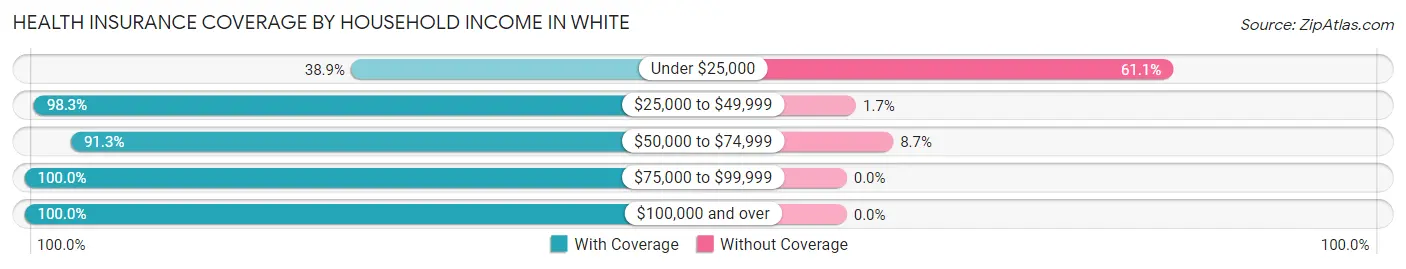
| Household Income | With Coverage | Without Coverage |
| Under $25,000 | 7 (38.9%) | 11 (61.1%) |
| $25,000 to $49,999 | 113 (98.3%) | 2 (1.7%) |
| $50,000 to $74,999 | 84 (91.3%) | 8 (8.7%) |
| $75,000 to $99,999 | 83 (100.0%) | 0 (0.0%) |
| $100,000 and over | 170 (100.0%) | 0 (0.0%) |
Public vs Private Health Insurance Coverage by Age in White
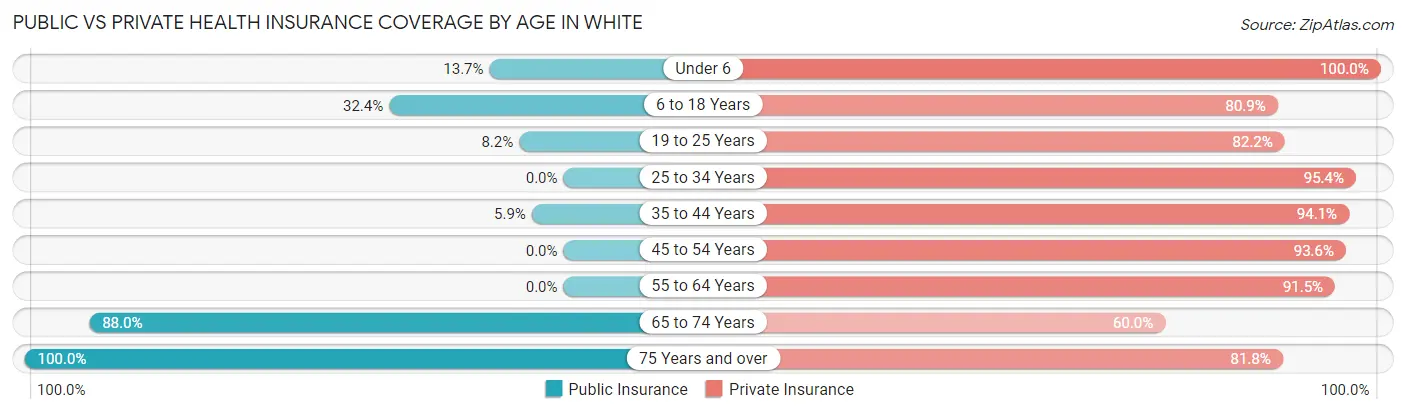
| Age Bracket | Public Insurance | Private Insurance |
| Under 6 | 7 (13.7%) | 51 (100.0%) |
| 6 to 18 Years | 22 (32.4%) | 55 (80.9%) |
| 19 to 25 Years | 6 (8.2%) | 60 (82.2%) |
| 25 to 34 Years | 0 (0.0%) | 83 (95.4%) |
| 35 to 44 Years | 3 (5.9%) | 48 (94.1%) |
| 45 to 54 Years | 0 (0.0%) | 29 (93.5%) |
| 55 to 64 Years | 0 (0.0%) | 54 (91.5%) |
| 65 to 74 Years | 22 (88.0%) | 15 (60.0%) |
| 75 Years and over | 33 (100.0%) | 27 (81.8%) |
| Total | 93 (19.5%) | 422 (88.3%) |
Disability Status by Sex by Age in White
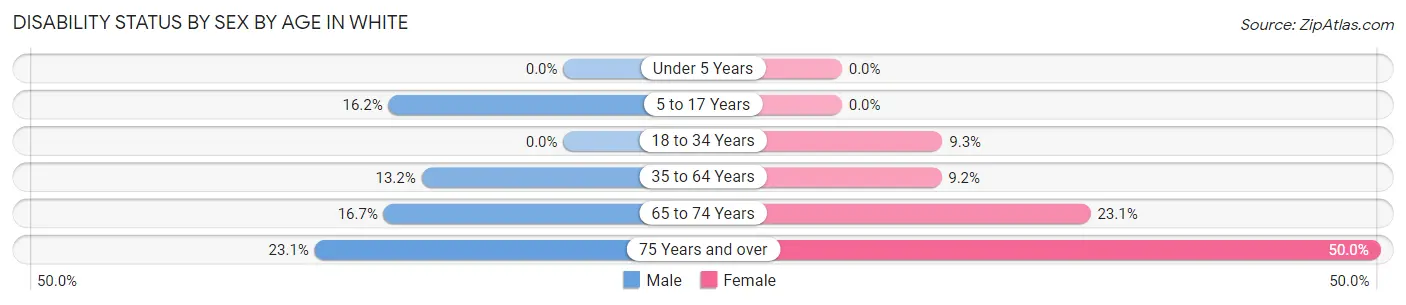
| Age Bracket | Male | Female |
| Under 5 Years | 0 (0.0%) | 0 (0.0%) |
| 5 to 17 Years | 6 (16.2%) | 0 (0.0%) |
| 18 to 34 Years | 0 (0.0%) | 7 (9.3%) |
| 35 to 64 Years | 10 (13.2%) | 6 (9.2%) |
| 65 to 74 Years | 2 (16.7%) | 3 (23.1%) |
| 75 Years and over | 3 (23.1%) | 10 (50.0%) |
Disability Class by Sex by Age in White
Disability Class: Hearing Difficulty
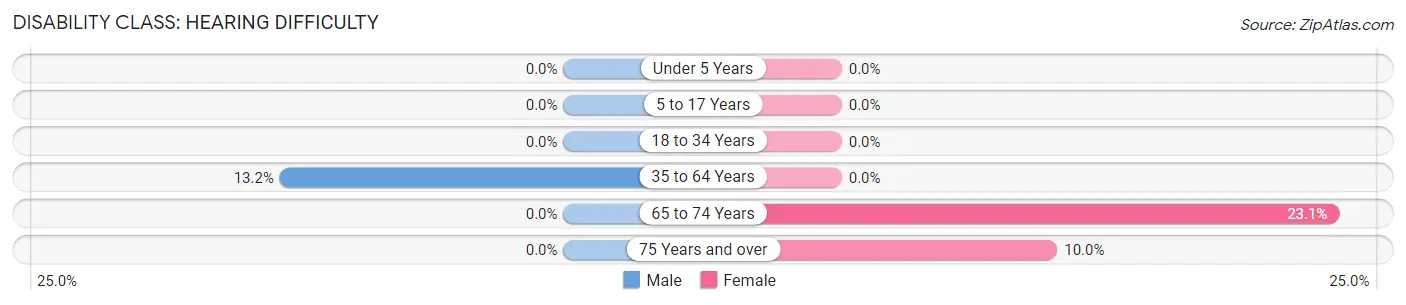
| Age Bracket | Male | Female |
| Under 5 Years | 0 (0.0%) | 0 (0.0%) |
| 5 to 17 Years | 0 (0.0%) | 0 (0.0%) |
| 18 to 34 Years | 0 (0.0%) | 0 (0.0%) |
| 35 to 64 Years | 10 (13.2%) | 0 (0.0%) |
| 65 to 74 Years | 0 (0.0%) | 3 (23.1%) |
| 75 Years and over | 0 (0.0%) | 2 (10.0%) |
Disability Class: Vision Difficulty
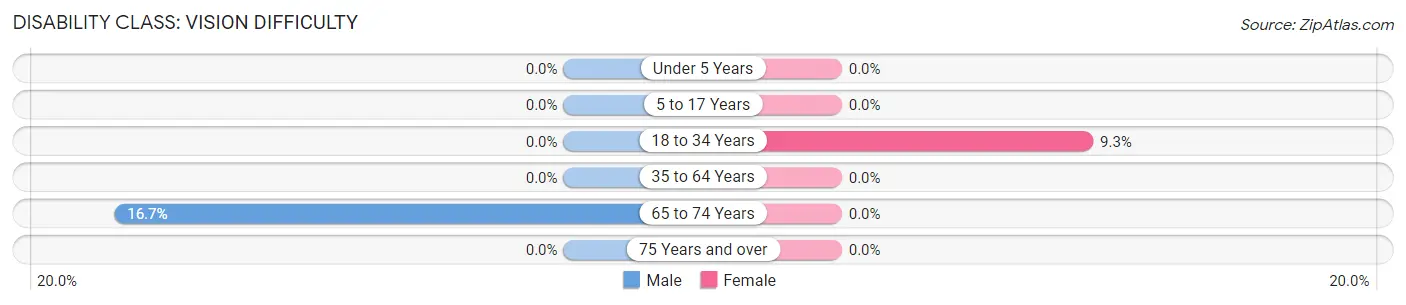
| Age Bracket | Male | Female |
| Under 5 Years | 0 (0.0%) | 0 (0.0%) |
| 5 to 17 Years | 0 (0.0%) | 0 (0.0%) |
| 18 to 34 Years | 0 (0.0%) | 7 (9.3%) |
| 35 to 64 Years | 0 (0.0%) | 0 (0.0%) |
| 65 to 74 Years | 2 (16.7%) | 0 (0.0%) |
| 75 Years and over | 0 (0.0%) | 0 (0.0%) |
Disability Class: Cognitive Difficulty
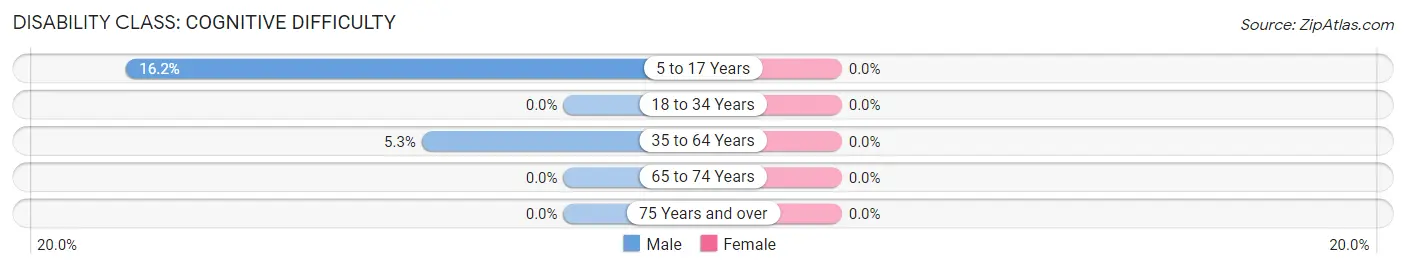
| Age Bracket | Male | Female |
| 5 to 17 Years | 6 (16.2%) | 0 (0.0%) |
| 18 to 34 Years | 0 (0.0%) | 0 (0.0%) |
| 35 to 64 Years | 4 (5.3%) | 0 (0.0%) |
| 65 to 74 Years | 0 (0.0%) | 0 (0.0%) |
| 75 Years and over | 0 (0.0%) | 0 (0.0%) |
Disability Class: Ambulatory Difficulty
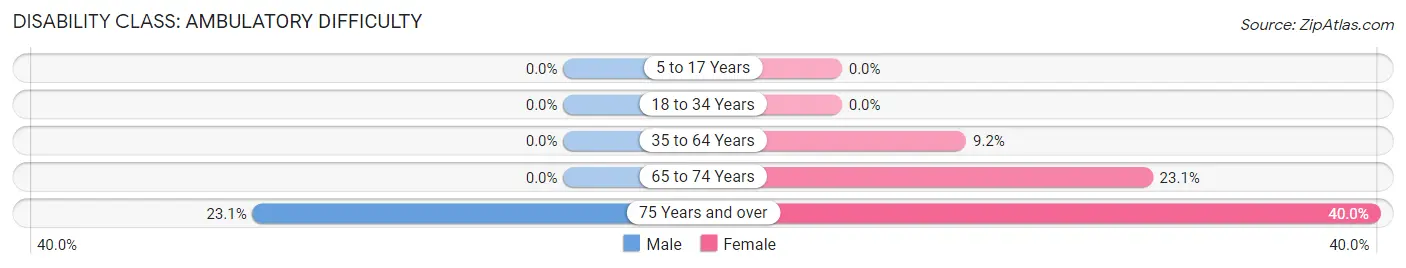
| Age Bracket | Male | Female |
| 5 to 17 Years | 0 (0.0%) | 0 (0.0%) |
| 18 to 34 Years | 0 (0.0%) | 0 (0.0%) |
| 35 to 64 Years | 0 (0.0%) | 6 (9.2%) |
| 65 to 74 Years | 0 (0.0%) | 3 (23.1%) |
| 75 Years and over | 3 (23.1%) | 8 (40.0%) |
Disability Class: Self-Care Difficulty
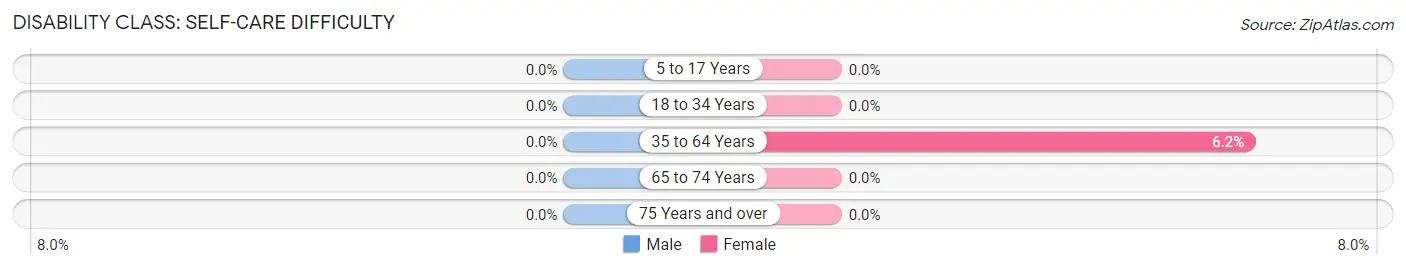
| Age Bracket | Male | Female |
| 5 to 17 Years | 0 (0.0%) | 0 (0.0%) |
| 18 to 34 Years | 0 (0.0%) | 0 (0.0%) |
| 35 to 64 Years | 0 (0.0%) | 4 (6.1%) |
| 65 to 74 Years | 0 (0.0%) | 0 (0.0%) |
| 75 Years and over | 0 (0.0%) | 0 (0.0%) |
Technology Access in White
Computing Device Access in White
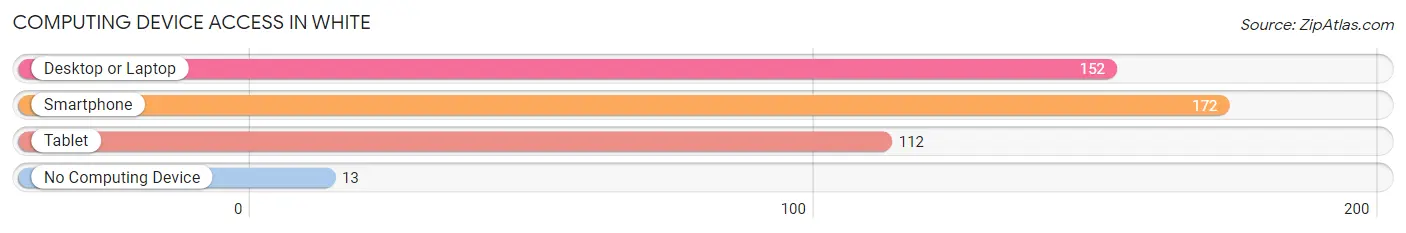
| Device Type | # Households | % Households |
| Desktop or Laptop | 152 | 75.6% |
| Smartphone | 172 | 85.6% |
| Tablet | 112 | 55.7% |
| No Computing Device | 13 | 6.5% |
| Total | 201 | 100.0% |
Internet Access in White
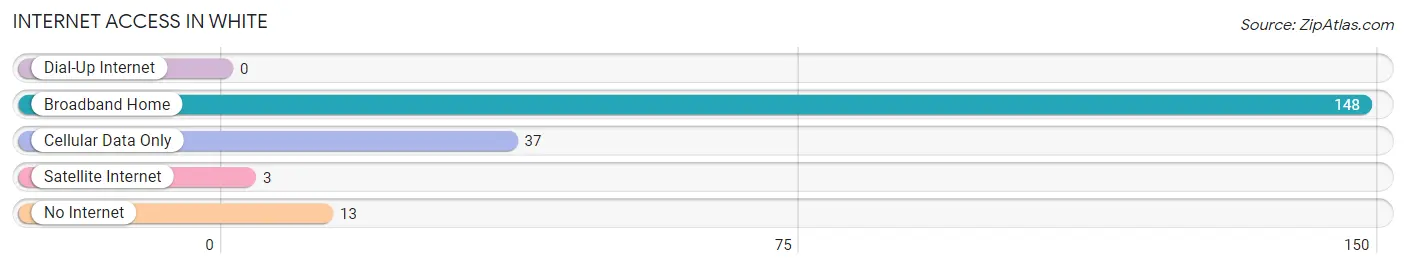
| Internet Type | # Households | % Households |
| Dial-Up Internet | 0 | 0.0% |
| Broadband Home | 148 | 73.6% |
| Cellular Data Only | 37 | 18.4% |
| Satellite Internet | 3 | 1.5% |
| No Internet | 13 | 6.5% |
| Total | 201 | 100.0% |
White Summary
White is a city located in the state of South Dakota in the United States. It is located in the southeastern part of the state, in the Black Hills region. As of the 2010 census, the population of White was 1,873.
Geography
White is located at 43°51'17" North, 103°37'17" West (43.854722, -103.621389). It is situated in the Black Hills region of South Dakota, in the southeastern part of the state. The city is located in the Black Hills National Forest, and is surrounded by the Black Hills Mountains. The city is located at an elevation of 4,890 feet (1,490 m).
Climate
White has a humid continental climate, with cold winters and warm summers. The average annual temperature is 44.3°F (6.8°C). The average annual precipitation is 17.3 inches (440 mm).
Demographics
As of the 2010 census, there were 1,873 people, 745 households, and 486 families residing in the city. The population density was 1,092.3 people per square mile (421.7/km2). The racial makeup of the city was 95.2% White, 0.3% African American, 0.9% Native American, 0.2% Asian, 0.1% Pacific Islander, 1.2% from other races, and 2.1% from two or more races. Hispanic or Latino of any race were 3.2% of the population.
Economy
White is a small city with a limited economy. The city's main industries are tourism, retail, and services. The city is home to several tourist attractions, including the Black Hills National Forest, Mount Rushmore National Memorial, and Crazy Horse Memorial. The city also has several retail stores, restaurants, and other services.
Education
White is served by the Custer School District. The district operates two elementary schools, one middle school, and one high school. The city also has several private schools, including St. Mary's Catholic School and White Bible Academy.
Transportation
White is served by the Rapid City Regional Airport, located about 40 miles (64 km) away. The city is also served by several highways, including US Route 16, US Route 385, and South Dakota Highway 79.
Conclusion
White is a small city located in the southeastern part of South Dakota. It is situated in the Black Hills region of the state, and is surrounded by the Black Hills Mountains. The city has a population of 1,873, and has a humid continental climate. The city's main industries are tourism, retail, and services. White is served by the Rapid City Regional Airport, and is served by several highways. The city is served by the Custer School District, and has several private schools.
Common Questions
What is Per Capita Income in White?
Per Capita income in White is $33,935.
What is the Median Family Income in White?
Median Family Income in White is $84,250.
What is the Median Household income in White?
Median Household Income in White is $64,226.
What is Income or Wage Gap in White?
Income or Wage Gap in White is 7.8%.
Women in White earn 92.2 cents for every dollar earned by a man.
What is Inequality or Gini Index in White?
Inequality or Gini Index in White is 0.34.
What is the Total Population of White?
Total Population of White is 478.
What is the Total Male Population of White?
Total Male Population of White is 245.
What is the Total Female Population of White?
Total Female Population of White is 233.
What is the Ratio of Males per 100 Females in White?
There are 105.15 Males per 100 Females in White.
What is the Ratio of Females per 100 Males in White?
There are 95.10 Females per 100 Males in White.
What is the Median Population Age in White?
Median Population Age in White is 31.4 Years.
What is the Average Family Size in White
Average Family Size in White is 2.8 People.
What is the Average Household Size in White
Average Household Size in White is 2.4 People.
How Large is the Labor Force in White?
There are 302 People in the Labor Forcein in White.
What is the Percentage of People in the Labor Force in White?
78.6% of People are in the Labor Force in White.
What is the Unemployment Rate in White?
Unemployment Rate in White is 2.3%.