Hill City, SD Map & Demographics
Hill City Map
Hill City Overview
$29,923
PER CAPITA INCOME
$89,250
AVG FAMILY INCOME
$76,500
AVG HOUSEHOLD INCOME
35.8%
WAGE / INCOME GAP [ % ]
64.2¢/ $1
WAGE / INCOME GAP [ $ ]
0.34
INEQUALITY / GINI INDEX
630
TOTAL POPULATION
355
MALE POPULATION
275
FEMALE POPULATION
129.09
MALES / 100 FEMALES
77.46
FEMALES / 100 MALES
40.0
MEDIAN AGE
3.4
AVG FAMILY SIZE
2.8
AVG HOUSEHOLD SIZE
373
LABOR FORCE [ PEOPLE ]
76.3%
PERCENT IN LABOR FORCE
Hill City Zip Codes
Hill City Area Codes
Income in Hill City
Income Overview in Hill City
Per Capita Income in Hill City is $29,923, while median incomes of families and households are $89,250 and $76,500 respectively.
| Characteristic | Number | Measure |
| Per Capita Income | 630 | $29,923 |
| Median Family Income | 157 | $89,250 |
| Mean Family Income | 157 | $94,304 |
| Median Household Income | 220 | $76,500 |
| Mean Household Income | 220 | $81,886 |
| Income Deficit | 157 | $0 |
| Wage / Income Gap (%) | 630 | 35.75% |
| Wage / Income Gap ($) | 630 | 64.25¢ per $1 |
| Gini / Inequality Index | 630 | 0.34 |
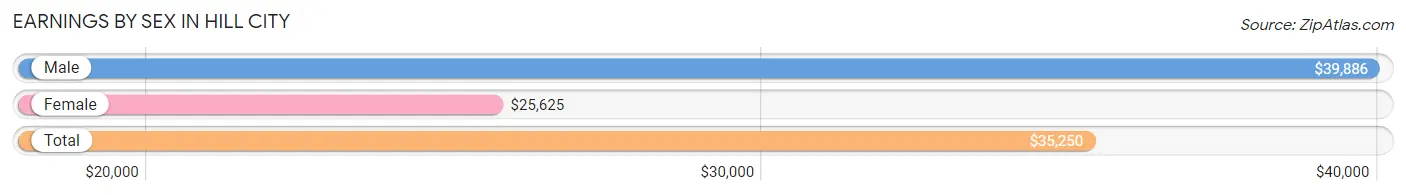
Earnings by Sex in Hill City
Average Earnings in Hill City are $35,250, $39,886 for men and $25,625 for women, a difference of 35.7%.
| Sex | Number | Average Earnings |
| Male | 219 (57.9%) | $39,886 |
| Female | 159 (42.1%) | $25,625 |
| Total | 378 (100.0%) | $35,250 |
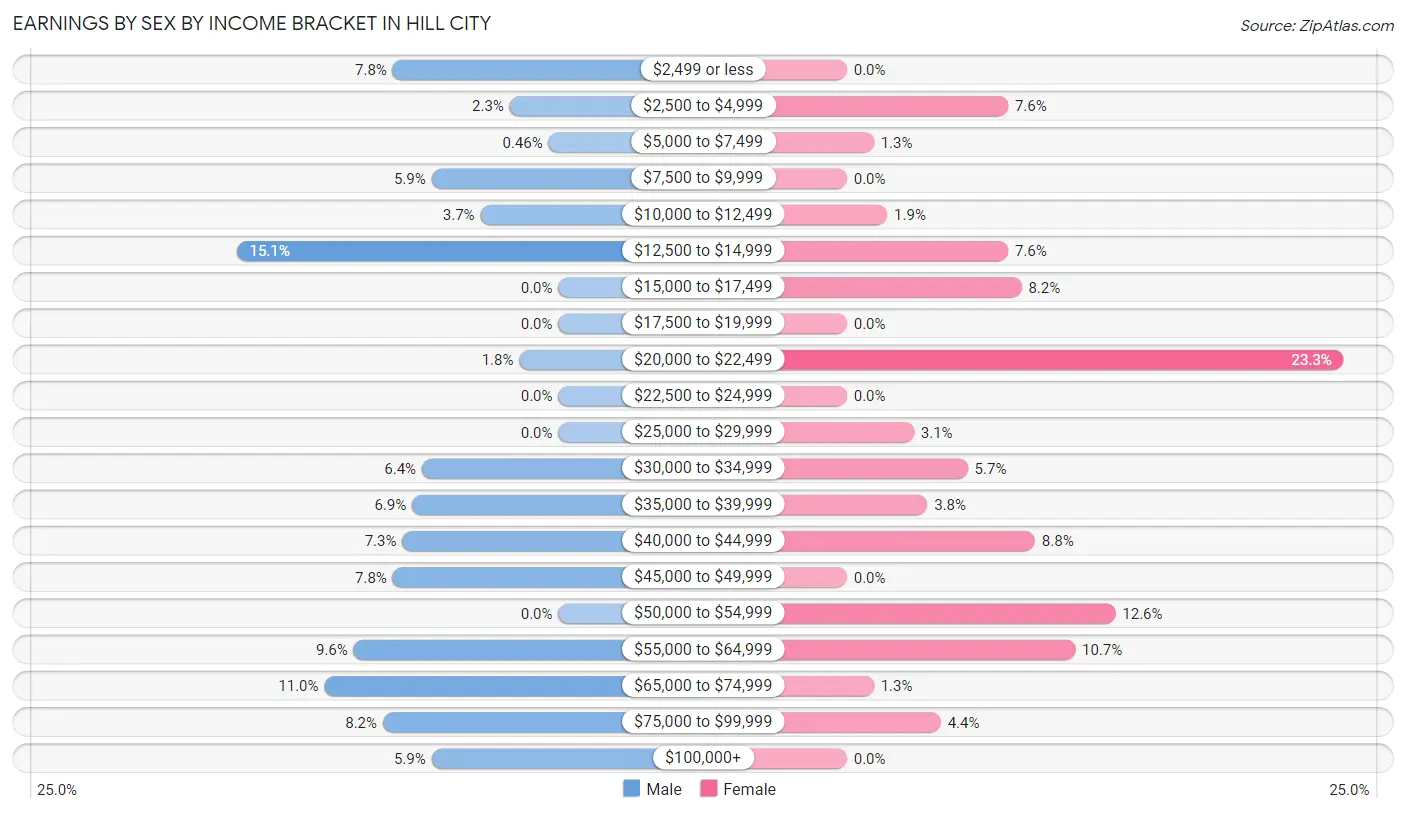
Earnings by Sex by Income Bracket in Hill City
The most common earnings brackets in Hill City are $12,500 to $14,999 for men (33 | 15.1%) and $20,000 to $22,499 for women (37 | 23.3%).
| Income | Male | Female |
| $2,499 or less | 17 (7.8%) | 0 (0.0%) |
| $2,500 to $4,999 | 5 (2.3%) | 12 (7.5%) |
| $5,000 to $7,499 | 1 (0.5%) | 2 (1.3%) |
| $7,500 to $9,999 | 13 (5.9%) | 0 (0.0%) |
| $10,000 to $12,499 | 8 (3.6%) | 3 (1.9%) |
| $12,500 to $14,999 | 33 (15.1%) | 12 (7.5%) |
| $15,000 to $17,499 | 0 (0.0%) | 13 (8.2%) |
| $17,500 to $19,999 | 0 (0.0%) | 0 (0.0%) |
| $20,000 to $22,499 | 4 (1.8%) | 37 (23.3%) |
| $22,500 to $24,999 | 0 (0.0%) | 0 (0.0%) |
| $25,000 to $29,999 | 0 (0.0%) | 5 (3.1%) |
| $30,000 to $34,999 | 14 (6.4%) | 9 (5.7%) |
| $35,000 to $39,999 | 15 (6.9%) | 6 (3.8%) |
| $40,000 to $44,999 | 16 (7.3%) | 14 (8.8%) |
| $45,000 to $49,999 | 17 (7.8%) | 0 (0.0%) |
| $50,000 to $54,999 | 0 (0.0%) | 20 (12.6%) |
| $55,000 to $64,999 | 21 (9.6%) | 17 (10.7%) |
| $65,000 to $74,999 | 24 (11.0%) | 2 (1.3%) |
| $75,000 to $99,999 | 18 (8.2%) | 7 (4.4%) |
| $100,000+ | 13 (5.9%) | 0 (0.0%) |
| Total | 219 (100.0%) | 159 (100.0%) |
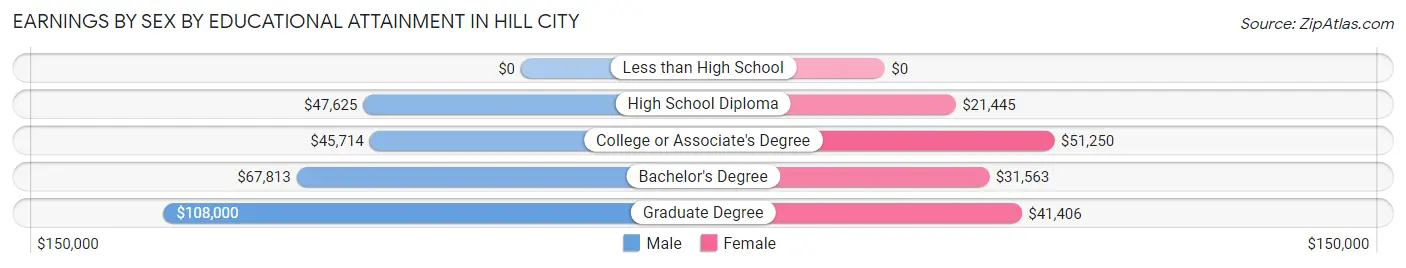
Earnings by Sex by Educational Attainment in Hill City
Average earnings in Hill City are $55,208 for men and $31,250 for women, a difference of 43.4%. Men with an educational attainment of graduate degree enjoy the highest average annual earnings of $108,000, while those with college or associate's degree education earn the least with $45,714. Women with an educational attainment of college or associate's degree earn the most with the average annual earnings of $51,250, while those with high school diploma education have the smallest earnings of $21,445.
| Educational Attainment | Male Income | Female Income |
| Less than High School | - | - |
| High School Diploma | $47,625 | $21,445 |
| College or Associate's Degree | $45,714 | $51,250 |
| Bachelor's Degree | $67,813 | $31,563 |
| Graduate Degree | $108,000 | $41,406 |
| Total | $55,208 | $31,250 |
Family Income in Hill City
Family Income Brackets in Hill City
According to the Hill City family income data, there are 47 families falling into the $75,000 to $99,999 income range, which is the most common income bracket and makes up 29.9% of all families.
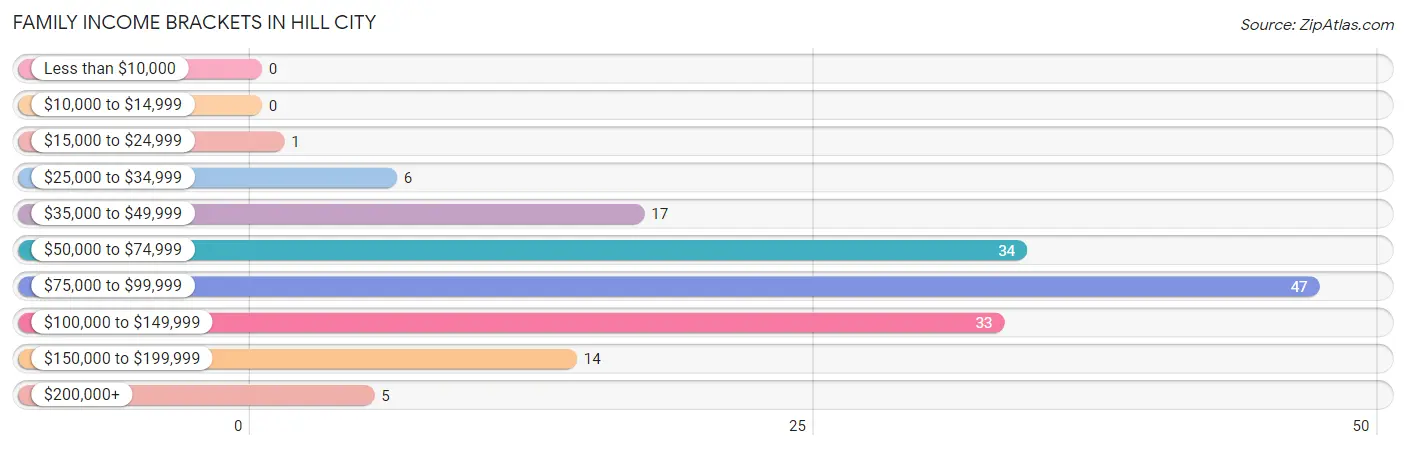
| Income Bracket | # Families | % Families |
| Less than $10,000 | 0 | 0.0% |
| $10,000 to $14,999 | 0 | 0.0% |
| $15,000 to $24,999 | 1 | 0.6% |
| $25,000 to $34,999 | 6 | 3.8% |
| $35,000 to $49,999 | 17 | 10.8% |
| $50,000 to $74,999 | 34 | 21.7% |
| $75,000 to $99,999 | 47 | 29.9% |
| $100,000 to $149,999 | 33 | 21.0% |
| $150,000 to $199,999 | 14 | 8.9% |
| $200,000+ | 5 | 3.2% |
Family Income by Famaliy Size in Hill City
5-person families (24 | 15.3%) account for the highest median family income in Hill City with $106,667 per family, while 3-person families (18 | 11.5%) have the highest median income of $31,190 per family member.
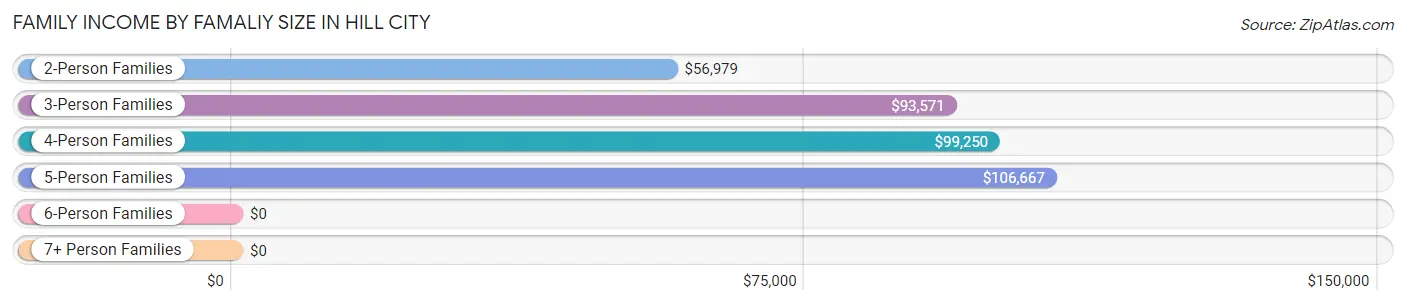
| Income Bracket | # Families | Median Income |
| 2-Person Families | 81 (51.6%) | $56,979 |
| 3-Person Families | 18 (11.5%) | $93,571 |
| 4-Person Families | 25 (15.9%) | $99,250 |
| 5-Person Families | 24 (15.3%) | $106,667 |
| 6-Person Families | 7 (4.5%) | $0 |
| 7+ Person Families | 2 (1.3%) | $0 |
| Total | 157 (100.0%) | $89,250 |
Family Income by Number of Earners in Hill City
The median family income in Hill City is $89,250, with families comprising 3+ earners (33) having the highest median family income of $99,750, while families with 1 earner (39) have the lowest median family income of $56,250, accounting for 21.0% and 24.8% of families, respectively.
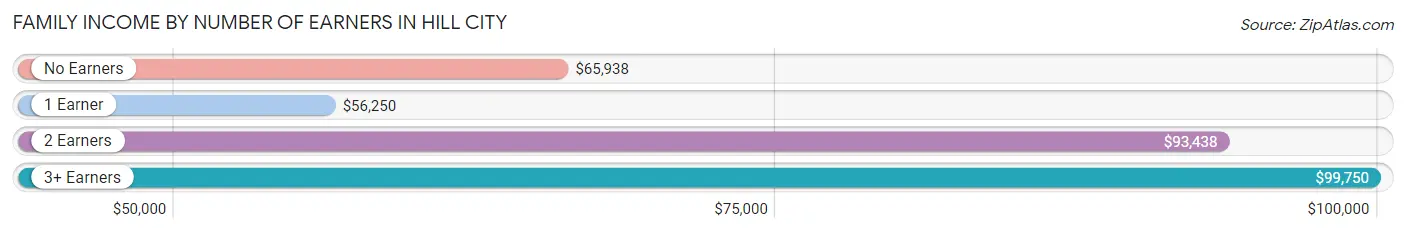
| Number of Earners | # Families | Median Income |
| No Earners | 24 (15.3%) | $65,938 |
| 1 Earner | 39 (24.8%) | $56,250 |
| 2 Earners | 61 (38.9%) | $93,438 |
| 3+ Earners | 33 (21.0%) | $99,750 |
| Total | 157 (100.0%) | $89,250 |
Household Income in Hill City
Household Income Brackets in Hill City
With 56 households falling in the category, the $75,000 to $99,999 income range is the most frequent in Hill City, accounting for 25.5% of all households. In contrast, only 5 households (2.3%) fall into the less than $10,000 income bracket, making it the least populous group.
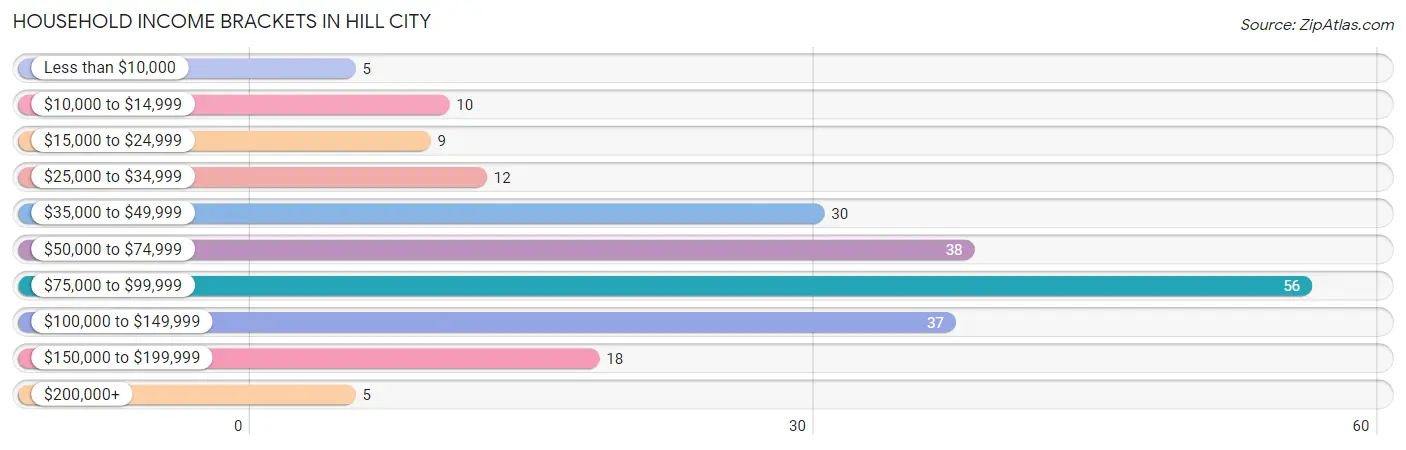
| Income Bracket | # Households | % Households |
| Less than $10,000 | 5 | 2.3% |
| $10,000 to $14,999 | 10 | 4.5% |
| $15,000 to $24,999 | 9 | 4.1% |
| $25,000 to $34,999 | 12 | 5.5% |
| $35,000 to $49,999 | 30 | 13.6% |
| $50,000 to $74,999 | 38 | 17.3% |
| $75,000 to $99,999 | 56 | 25.5% |
| $100,000 to $149,999 | 37 | 16.8% |
| $150,000 to $199,999 | 18 | 8.2% |
| $200,000+ | 5 | 2.3% |
Household Income by Householder Age in Hill City
The median household income in Hill City is $76,500, with the highest median household income of $96,389 found in the 25 to 44 years age bracket for the primary householder. A total of 64 households (29.1%) fall into this category.
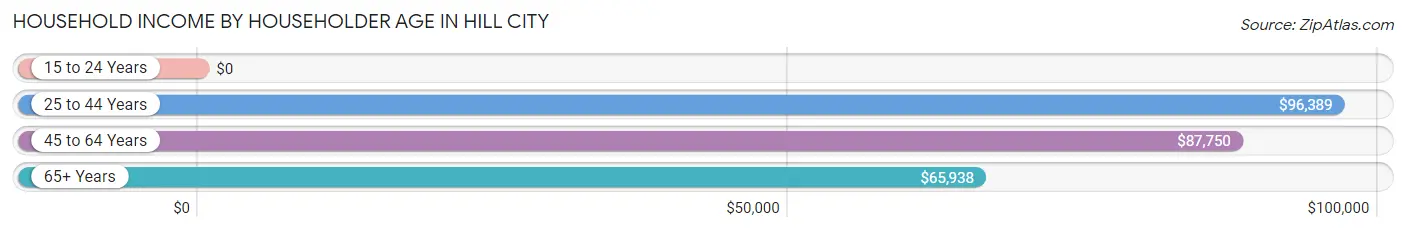
| Income Bracket | # Households | Median Income |
| 15 to 24 Years | 0 (0.0%) | $0 |
| 25 to 44 Years | 64 (29.1%) | $96,389 |
| 45 to 64 Years | 108 (49.1%) | $87,750 |
| 65+ Years | 48 (21.8%) | $65,938 |
| Total | 220 (100.0%) | $76,500 |
Poverty in Hill City
Income Below Poverty by Sex and Age in Hill City
With 2.5% poverty level for males and 7.3% for females among the residents of Hill City, 65 to 74 year old males and 75 year old and over females are the most vulnerable to poverty, with 4 males (10.8%) and 5 females (55.6%) in their respective age groups living below the poverty level.
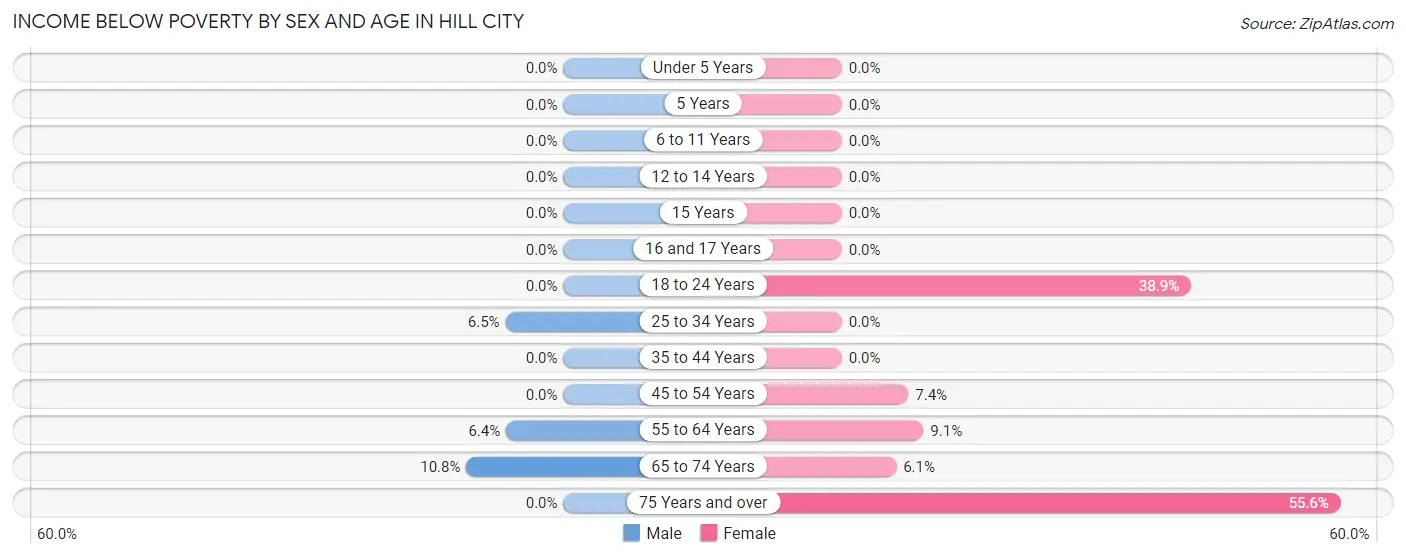
| Age Bracket | Male | Female |
| Under 5 Years | 0 (0.0%) | 0 (0.0%) |
| 5 Years | 0 (0.0%) | 0 (0.0%) |
| 6 to 11 Years | 0 (0.0%) | 0 (0.0%) |
| 12 to 14 Years | 0 (0.0%) | 0 (0.0%) |
| 15 Years | 0 (0.0%) | 0 (0.0%) |
| 16 and 17 Years | 0 (0.0%) | 0 (0.0%) |
| 18 to 24 Years | 0 (0.0%) | 7 (38.9%) |
| 25 to 34 Years | 2 (6.5%) | 0 (0.0%) |
| 35 to 44 Years | 0 (0.0%) | 0 (0.0%) |
| 45 to 54 Years | 0 (0.0%) | 2 (7.4%) |
| 55 to 64 Years | 3 (6.4%) | 4 (9.1%) |
| 65 to 74 Years | 4 (10.8%) | 2 (6.1%) |
| 75 Years and over | 0 (0.0%) | 5 (55.6%) |
| Total | 9 (2.5%) | 20 (7.3%) |
Income Above Poverty by Sex and Age in Hill City
According to the poverty statistics in Hill City, males aged under 5 years and females aged under 5 years are the age groups that are most secure financially, with 100.0% of males and 100.0% of females in these age groups living above the poverty line.
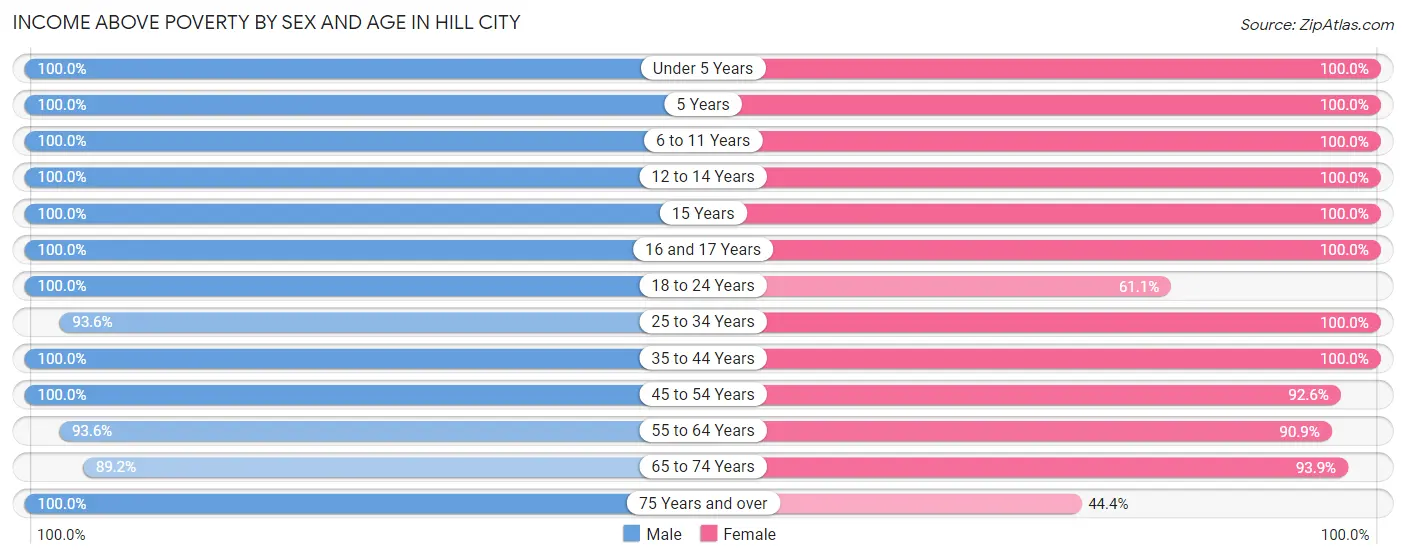
| Age Bracket | Male | Female |
| Under 5 Years | 30 (100.0%) | 10 (100.0%) |
| 5 Years | 2 (100.0%) | 8 (100.0%) |
| 6 to 11 Years | 32 (100.0%) | 23 (100.0%) |
| 12 to 14 Years | 13 (100.0%) | 9 (100.0%) |
| 15 Years | 8 (100.0%) | 6 (100.0%) |
| 16 and 17 Years | 22 (100.0%) | 6 (100.0%) |
| 18 to 24 Years | 46 (100.0%) | 11 (61.1%) |
| 25 to 34 Years | 29 (93.5%) | 32 (100.0%) |
| 35 to 44 Years | 25 (100.0%) | 50 (100.0%) |
| 45 to 54 Years | 55 (100.0%) | 25 (92.6%) |
| 55 to 64 Years | 44 (93.6%) | 40 (90.9%) |
| 65 to 74 Years | 33 (89.2%) | 31 (93.9%) |
| 75 Years and over | 7 (100.0%) | 4 (44.4%) |
| Total | 346 (97.5%) | 255 (92.7%) |
Income Below Poverty Among Married-Couple Families in Hill City
The poverty statistics for married-couple families in Hill City show that 0.8% or 1 of the total 125 families live below the poverty line. Families with no children have the highest poverty rate of 1.5%, comprising of 1 families. On the other hand, families with 1 or 2 children have the lowest poverty rate of 0.0%, which includes 0 families.
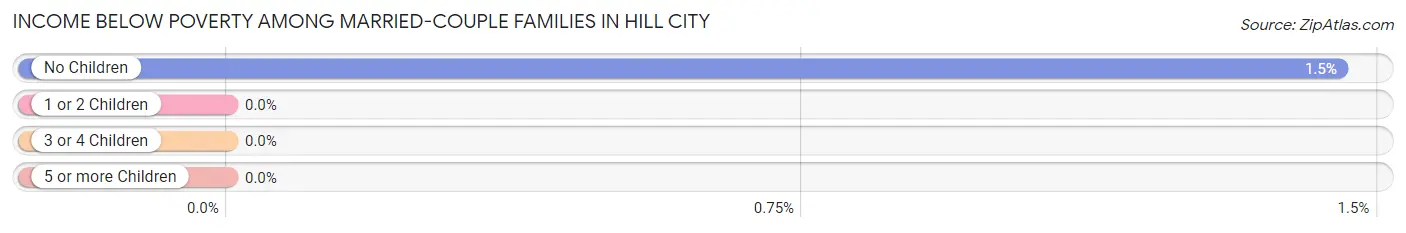
| Children | Above Poverty | Below Poverty |
| No Children | 68 (98.6%) | 1 (1.5%) |
| 1 or 2 Children | 37 (100.0%) | 0 (0.0%) |
| 3 or 4 Children | 17 (100.0%) | 0 (0.0%) |
| 5 or more Children | 2 (100.0%) | 0 (0.0%) |
| Total | 124 (99.2%) | 1 (0.8%) |
Income Below Poverty Among Single-Parent Households in Hill City
| Children | Single Father | Single Mother |
| No Children | 0 (0.0%) | 0 (0.0%) |
| 1 or 2 Children | 0 (0.0%) | 0 (0.0%) |
| 3 or 4 Children | 0 (0.0%) | 0 (0.0%) |
| 5 or more Children | 0 (0.0%) | 0 (0.0%) |
| Total | 0 (0.0%) | 0 (0.0%) |
Income Below Poverty Among Married-Couple vs Single-Parent Households in Hill City
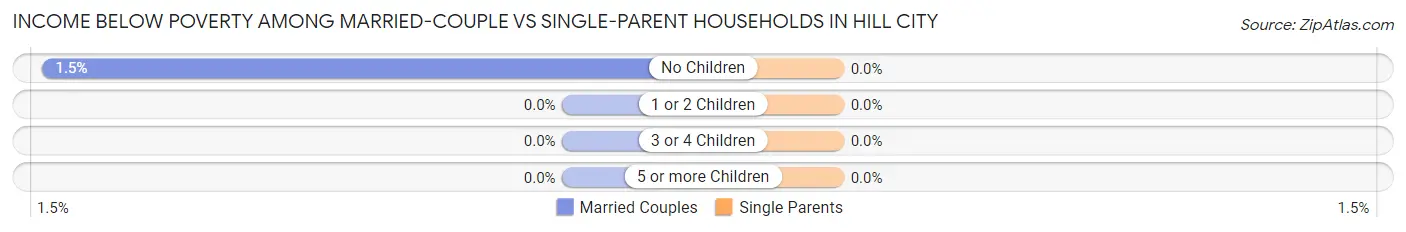
| Children | Married-Couple Families | Single-Parent Households |
| No Children | 1 (1.5%) | 0 (0.0%) |
| 1 or 2 Children | 0 (0.0%) | 0 (0.0%) |
| 3 or 4 Children | 0 (0.0%) | 0 (0.0%) |
| 5 or more Children | 0 (0.0%) | 0 (0.0%) |
| Total | 1 (0.8%) | 0 (0.0%) |
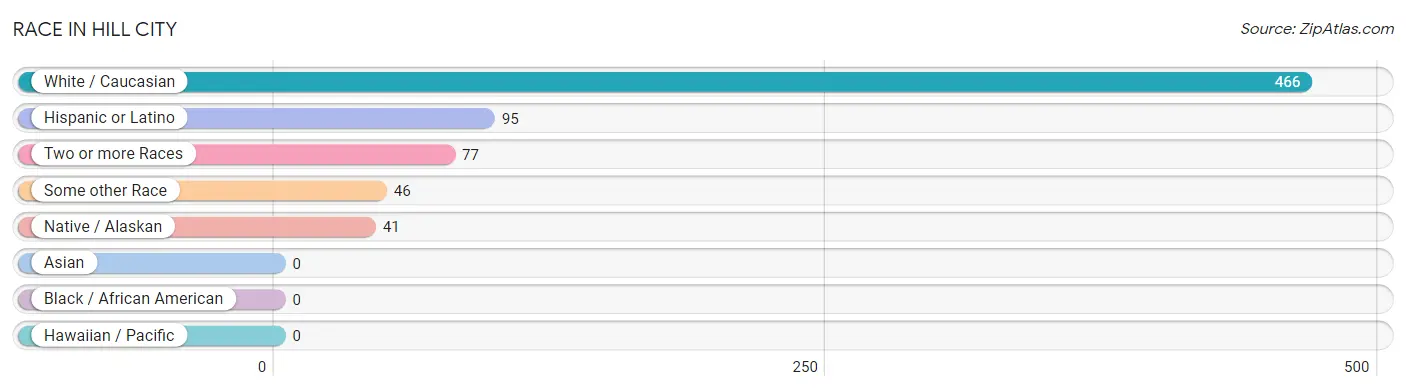
Race in Hill City
The most populous races in Hill City are White / Caucasian (466 | 74.0%), Hispanic or Latino (95 | 15.1%), and Two or more Races (77 | 12.2%).
| Race | # Population | % Population |
| Asian | 0 | 0.0% |
| Black / African American | 0 | 0.0% |
| Hawaiian / Pacific | 0 | 0.0% |
| Hispanic or Latino | 95 | 15.1% |
| Native / Alaskan | 41 | 6.5% |
| White / Caucasian | 466 | 74.0% |
| Two or more Races | 77 | 12.2% |
| Some other Race | 46 | 7.3% |
| Total | 630 | 100.0% |
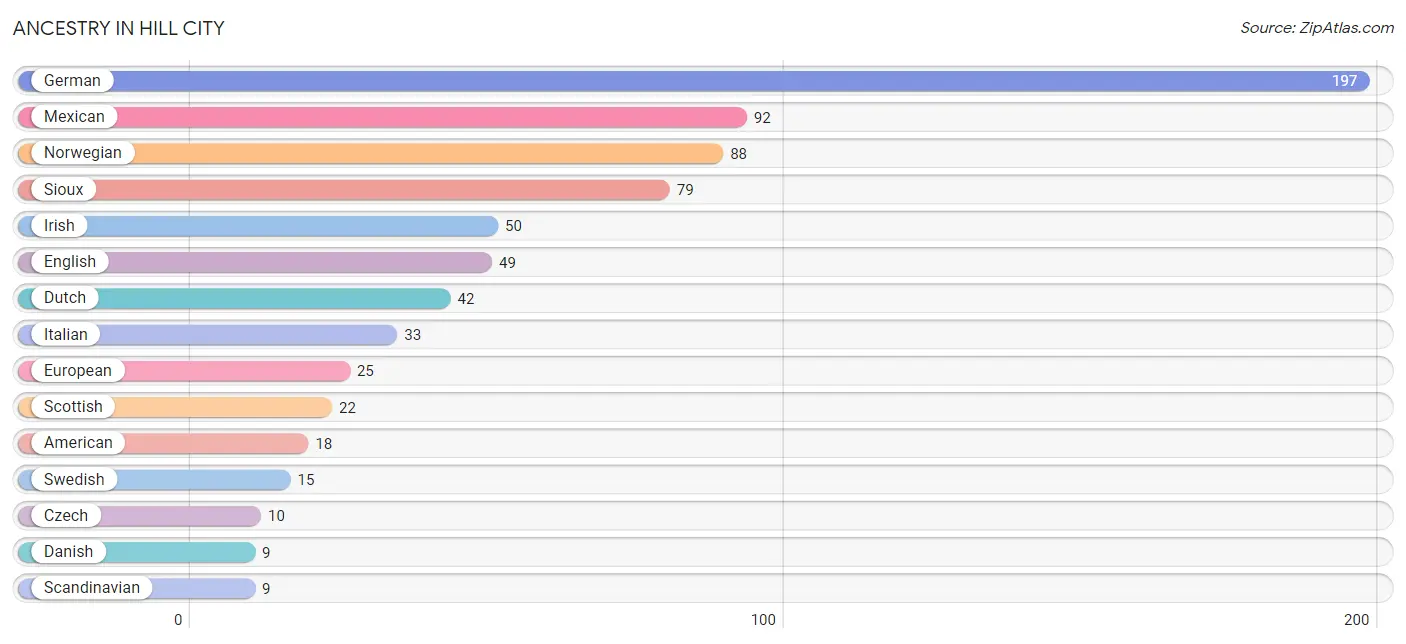
Ancestry in Hill City
The most populous ancestries reported in Hill City are German (197 | 31.3%), Mexican (92 | 14.6%), Norwegian (88 | 14.0%), Sioux (79 | 12.5%), and Irish (50 | 7.9%), together accounting for 80.3% of all Hill City residents.
| Ancestry | # Population | % Population |
| American | 18 | 2.9% |
| Austrian | 2 | 0.3% |
| Czech | 10 | 1.6% |
| Danish | 9 | 1.4% |
| Dutch | 42 | 6.7% |
| English | 49 | 7.8% |
| European | 25 | 4.0% |
| French | 7 | 1.1% |
| German | 197 | 31.3% |
| Irish | 50 | 7.9% |
| Italian | 33 | 5.2% |
| Mexican | 92 | 14.6% |
| Norwegian | 88 | 14.0% |
| Polish | 3 | 0.5% |
| Portuguese | 2 | 0.3% |
| Puerto Rican | 3 | 0.5% |
| Russian | 2 | 0.3% |
| Scandinavian | 9 | 1.4% |
| Scotch-Irish | 8 | 1.3% |
| Scottish | 22 | 3.5% |
| Sioux | 79 | 12.5% |
| Swedish | 15 | 2.4% |
| Swiss | 2 | 0.3% |
| Welsh | 8 | 1.3% | View All 24 Rows |
Immigrants in Hill City
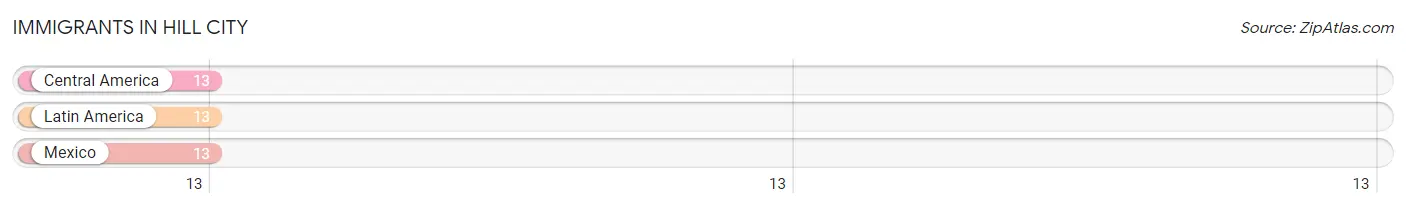
The most numerous immigrant groups reported in Hill City came from Central America (13 | 2.1%), Latin America (13 | 2.1%), and Mexico (13 | 2.1%), together accounting for 6.2% of all Hill City residents.
| Immigration Origin | # Population | % Population |
| Central America | 13 | 2.1% |
| Latin America | 13 | 2.1% |
| Mexico | 13 | 2.1% | View All 3 Rows |
Sex and Age in Hill City
Sex and Age in Hill City
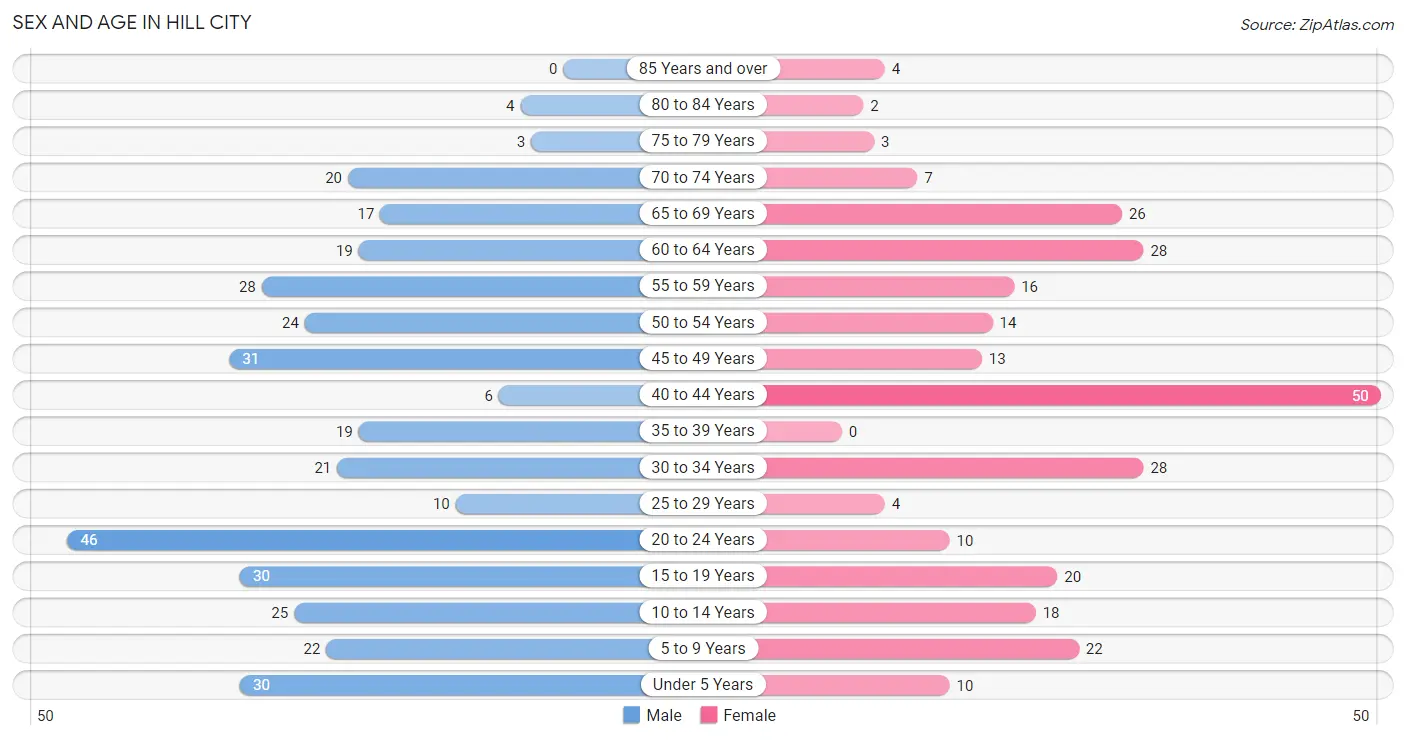
The most populous age groups in Hill City are 20 to 24 Years (46 | 13.0%) for men and 40 to 44 Years (50 | 18.2%) for women.
| Age Bracket | Male | Female |
| Under 5 Years | 30 (8.5%) | 10 (3.6%) |
| 5 to 9 Years | 22 (6.2%) | 22 (8.0%) |
| 10 to 14 Years | 25 (7.0%) | 18 (6.6%) |
| 15 to 19 Years | 30 (8.5%) | 20 (7.3%) |
| 20 to 24 Years | 46 (13.0%) | 10 (3.6%) |
| 25 to 29 Years | 10 (2.8%) | 4 (1.5%) |
| 30 to 34 Years | 21 (5.9%) | 28 (10.2%) |
| 35 to 39 Years | 19 (5.3%) | 0 (0.0%) |
| 40 to 44 Years | 6 (1.7%) | 50 (18.2%) |
| 45 to 49 Years | 31 (8.7%) | 13 (4.7%) |
| 50 to 54 Years | 24 (6.8%) | 14 (5.1%) |
| 55 to 59 Years | 28 (7.9%) | 16 (5.8%) |
| 60 to 64 Years | 19 (5.3%) | 28 (10.2%) |
| 65 to 69 Years | 17 (4.8%) | 26 (9.5%) |
| 70 to 74 Years | 20 (5.6%) | 7 (2.5%) |
| 75 to 79 Years | 3 (0.9%) | 3 (1.1%) |
| 80 to 84 Years | 4 (1.1%) | 2 (0.7%) |
| 85 Years and over | 0 (0.0%) | 4 (1.5%) |
| Total | 355 (100.0%) | 275 (100.0%) |
Families and Households in Hill City
Median Family Size in Hill City
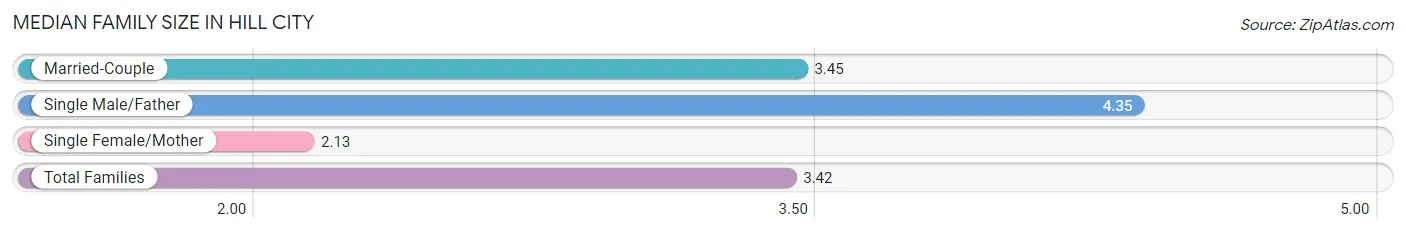
The median family size in Hill City is 3.42 persons per family, with single male/father families (17 | 10.8%) accounting for the largest median family size of 4.35 persons per family. On the other hand, single female/mother families (15 | 9.6%) represent the smallest median family size with 2.13 persons per family.
| Family Type | # Families | Family Size |
| Married-Couple | 125 (79.6%) | 3.45 |
| Single Male/Father | 17 (10.8%) | 4.35 |
| Single Female/Mother | 15 (9.6%) | 2.13 |
| Total Families | 157 (100.0%) | 3.42 |
Median Household Size in Hill City
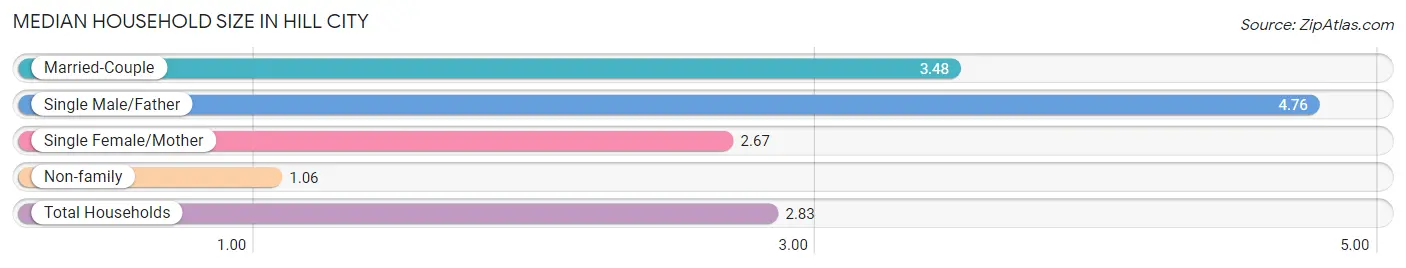
The median household size in Hill City is 2.83 persons per household, with single male/father households (17 | 7.7%) accounting for the largest median household size of 4.76 persons per household. non-family households (63 | 28.6%) represent the smallest median household size with 1.06 persons per household.
| Household Type | # Households | Household Size |
| Married-Couple | 125 (56.8%) | 3.48 |
| Single Male/Father | 17 (7.7%) | 4.76 |
| Single Female/Mother | 15 (6.8%) | 2.67 |
| Non-family | 63 (28.6%) | 1.06 |
| Total Households | 220 (100.0%) | 2.83 |
Household Size by Marriage Status in Hill City
Out of a total of 220 households in Hill City, 157 (71.4%) are family households, while 63 (28.6%) are nonfamily households. The most numerous type of family households are 2-person households, comprising 68, and the most common type of nonfamily households are 1-person households, comprising 62.
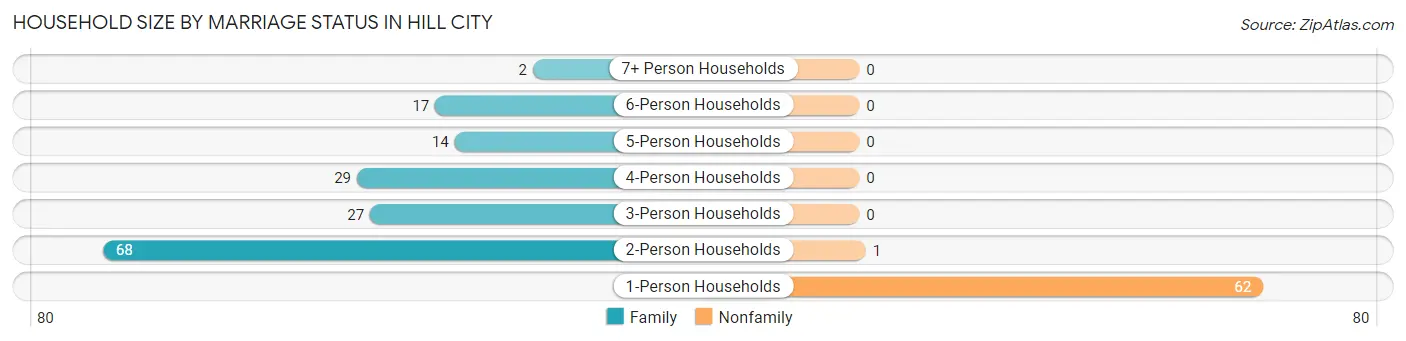
| Household Size | Family Households | Nonfamily Households |
| 1-Person Households | - | 62 (28.2%) |
| 2-Person Households | 68 (30.9%) | 1 (0.4%) |
| 3-Person Households | 27 (12.3%) | 0 (0.0%) |
| 4-Person Households | 29 (13.2%) | 0 (0.0%) |
| 5-Person Households | 14 (6.4%) | 0 (0.0%) |
| 6-Person Households | 17 (7.7%) | 0 (0.0%) |
| 7+ Person Households | 2 (0.9%) | 0 (0.0%) |
| Total | 157 (71.4%) | 63 (28.6%) |
Female Fertility in Hill City
Fertility by Age in Hill City
Average fertility rate in Hill City is 80.0 births per 1,000 women. Women in the age bracket of 20 to 34 years have the highest fertility rate with 167.0 births per 1,000 women. Women in the age bracket of 20 to 34 years acount for 70.0% of all women with births.
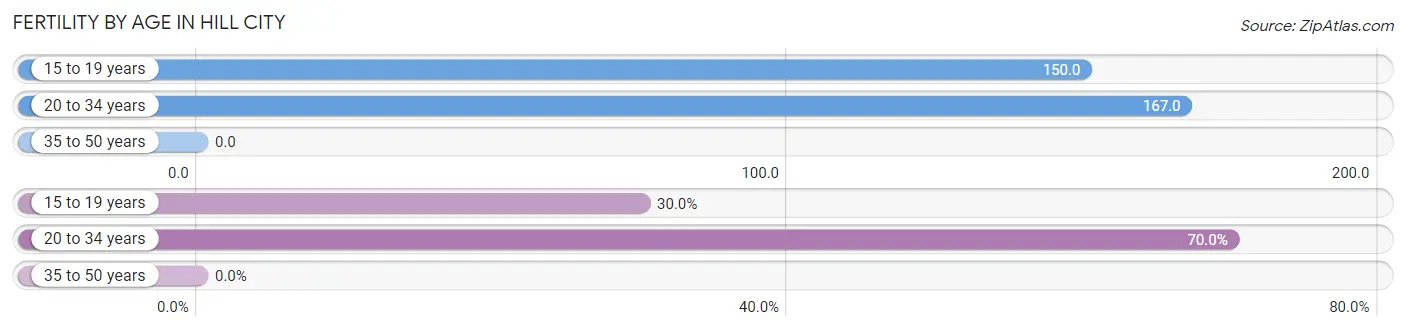
| Age Bracket | Women with Births | Births / 1,000 Women |
| 15 to 19 years | 3 (30.0%) | 150.0 |
| 20 to 34 years | 7 (70.0%) | 167.0 |
| 35 to 50 years | 0 (0.0%) | 0.0 |
| Total | 10 (100.0%) | 80.0 |
Fertility by Age by Marriage Status in Hill City
70.0% of women with births (10) in Hill City are married. The highest percentage of unmarried women with births falls into 15 to 19 years age bracket with 100.0% of them unmarried at the time of birth, while the lowest percentage of unmarried women with births belong to 20 to 34 years age bracket with 0.0% of them unmarried.
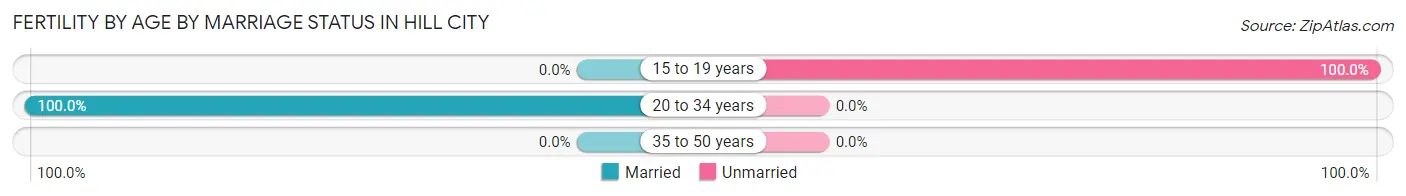
| Age Bracket | Married | Unmarried |
| 15 to 19 years | 0 (0.0%) | 3 (100.0%) |
| 20 to 34 years | 7 (100.0%) | 0 (0.0%) |
| 35 to 50 years | 0 (0.0%) | 0 (0.0%) |
| Total | 7 (70.0%) | 3 (30.0%) |
Fertility by Education in Hill City
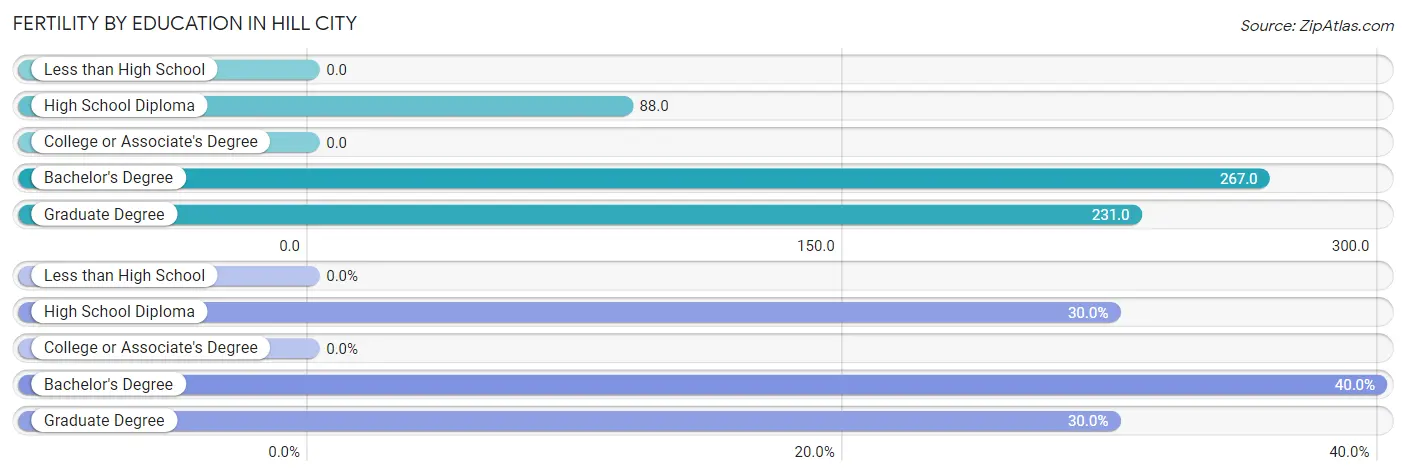
| Educational Attainment | Women with Births | Births / 1,000 Women |
| Less than High School | 0 (0.0%) | 0.0 |
| High School Diploma | 3 (30.0%) | 88.0 |
| College or Associate's Degree | 0 (0.0%) | 0.0 |
| Bachelor's Degree | 4 (40.0%) | 267.0 |
| Graduate Degree | 3 (30.0%) | 231.0 |
| Total | 10 (100.0%) | 80.0 |
Fertility by Education by Marriage Status in Hill City
30.0% of women with births in Hill City are unmarried. Women with the educational attainment of bachelor's degree are most likely to be married with 100.0% of them married at childbirth, while women with the educational attainment of high school diploma are least likely to be married with 100.0% of them unmarried at childbirth.
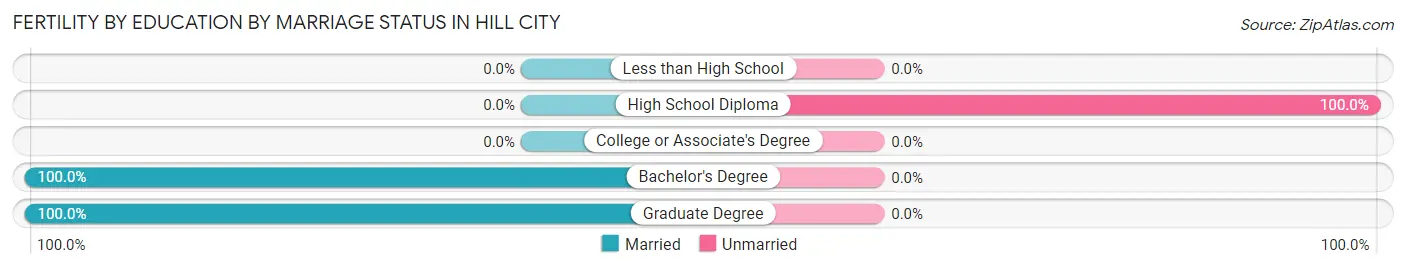
| Educational Attainment | Married | Unmarried |
| Less than High School | 0 (0.0%) | 0 (0.0%) |
| High School Diploma | 0 (0.0%) | 3 (100.0%) |
| College or Associate's Degree | 0 (0.0%) | 0 (0.0%) |
| Bachelor's Degree | 4 (100.0%) | 0 (0.0%) |
| Graduate Degree | 3 (100.0%) | 0 (0.0%) |
| Total | 7 (70.0%) | 3 (30.0%) |
Employment Characteristics in Hill City
Employment by Class of Employer in Hill City
Among the 361 employed individuals in Hill City, private company employees (222 | 61.5%), not-for-profit organizations (37 | 10.2%), and self-employed (incorporated) (31 | 8.6%) make up the most common classes of employment.
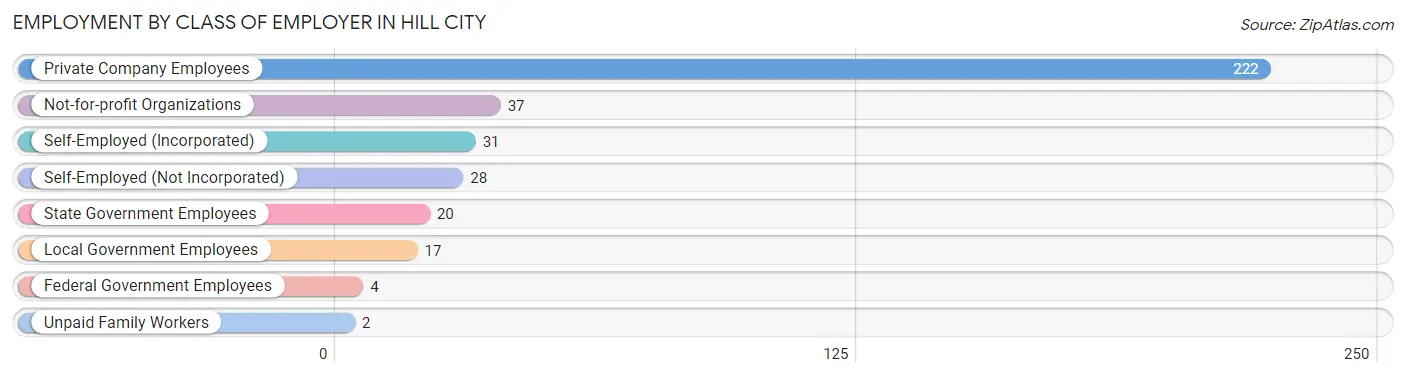
| Employer Class | # Employees | % Employees |
| Private Company Employees | 222 | 61.5% |
| Self-Employed (Incorporated) | 31 | 8.6% |
| Self-Employed (Not Incorporated) | 28 | 7.8% |
| Not-for-profit Organizations | 37 | 10.2% |
| Local Government Employees | 17 | 4.7% |
| State Government Employees | 20 | 5.5% |
| Federal Government Employees | 4 | 1.1% |
| Unpaid Family Workers | 2 | 0.5% |
| Total | 361 | 100.0% |
Employment Status by Age in Hill City
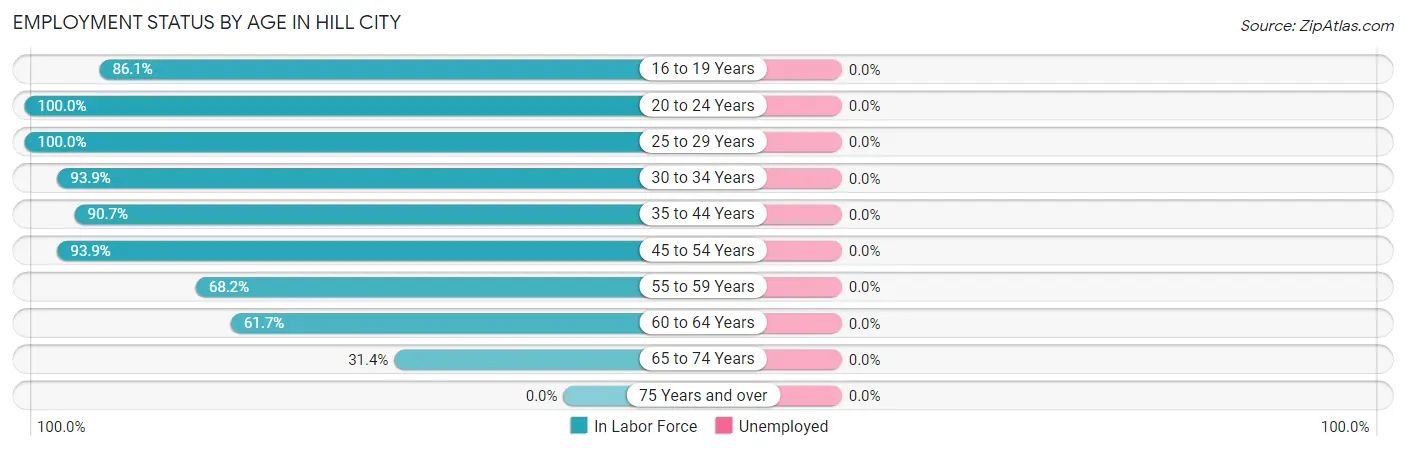
| Age Bracket | In Labor Force | Unemployed |
| 16 to 19 Years | 31 (86.1%) | 0 (0.0%) |
| 20 to 24 Years | 56 (100.0%) | 0 (0.0%) |
| 25 to 29 Years | 14 (100.0%) | 0 (0.0%) |
| 30 to 34 Years | 46 (93.9%) | 0 (0.0%) |
| 35 to 44 Years | 68 (90.7%) | 0 (0.0%) |
| 45 to 54 Years | 77 (93.9%) | 0 (0.0%) |
| 55 to 59 Years | 30 (68.2%) | 0 (0.0%) |
| 60 to 64 Years | 29 (61.7%) | 0 (0.0%) |
| 65 to 74 Years | 22 (31.4%) | 0 (0.0%) |
| 75 Years and over | 0 (0.0%) | 0 (0.0%) |
| Total | 373 (76.3%) | 0 (0.0%) |
Employment Status by Educational Attainment in Hill City
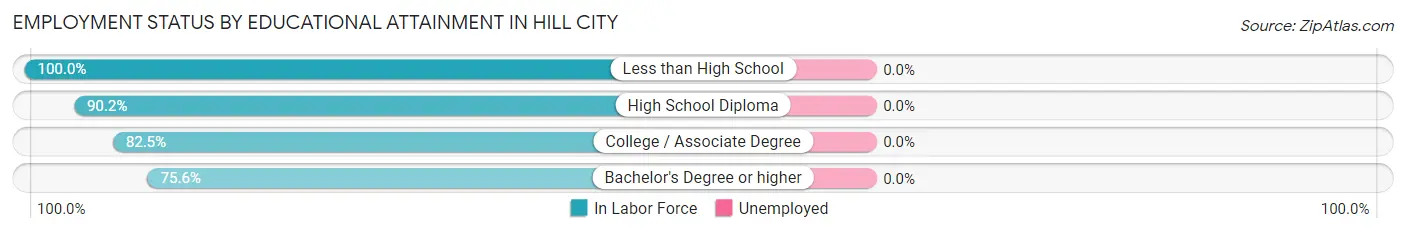
| Educational Attainment | In Labor Force | Unemployed |
| Less than High School | 16 (100.0%) | 0 (0.0%) |
| High School Diploma | 120 (90.2%) | 0 (0.0%) |
| College / Associate Degree | 66 (82.5%) | 0 (0.0%) |
| Bachelor's Degree or higher | 62 (75.6%) | 0 (0.0%) |
| Total | 264 (84.9%) | 0 (0.0%) |
Employment Occupations by Sex in Hill City
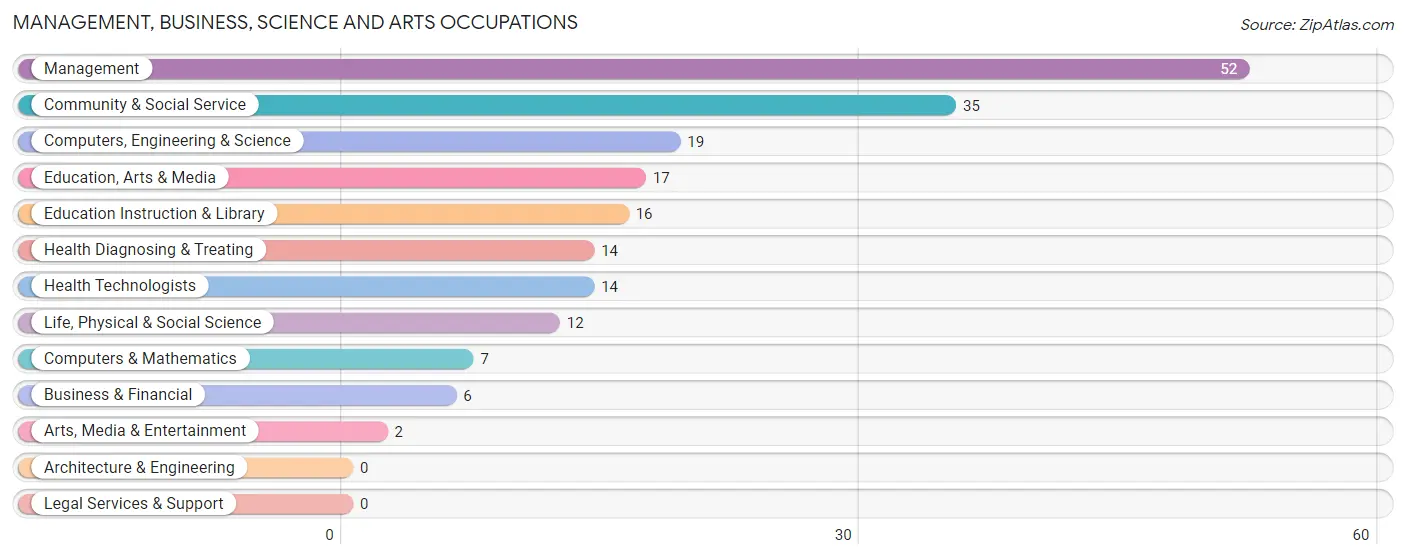
Management, Business, Science and Arts Occupations
The most common Management, Business, Science and Arts occupations in Hill City are Management (52 | 13.9%), Community & Social Service (35 | 9.4%), Computers, Engineering & Science (19 | 5.1%), Education, Arts & Media (17 | 4.6%), and Education Instruction & Library (16 | 4.3%).
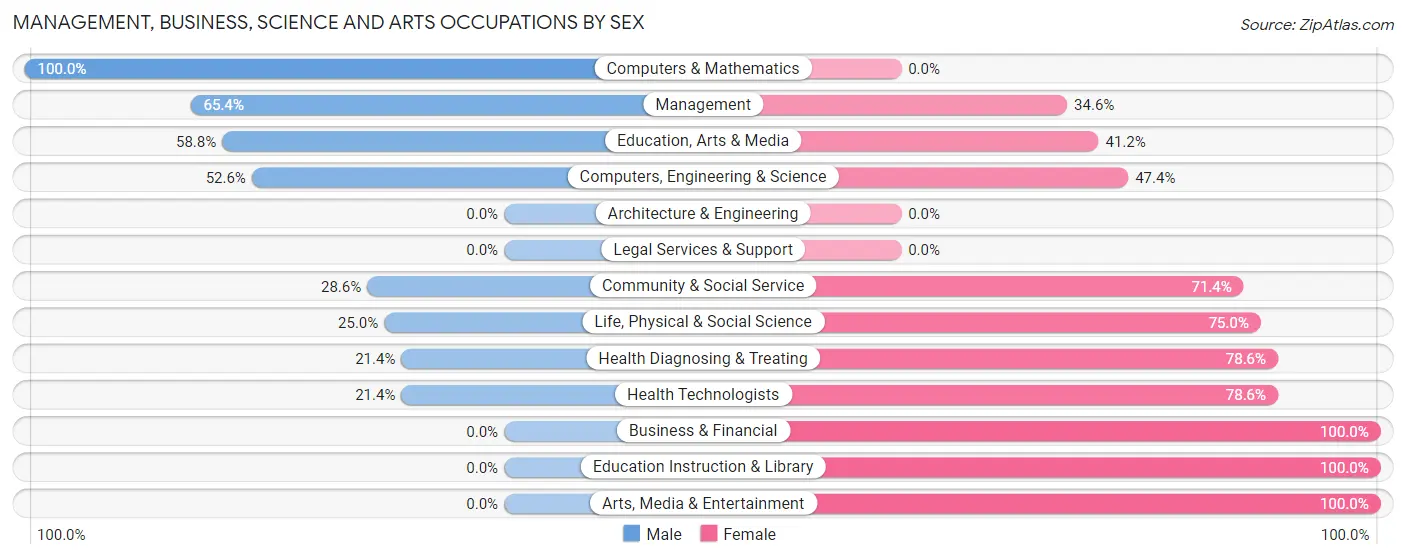
Management, Business, Science and Arts Occupations by Sex
Within the Management, Business, Science and Arts occupations in Hill City, the most male-oriented occupations are Computers & Mathematics (100.0%), Management (65.4%), and Education, Arts & Media (58.8%), while the most female-oriented occupations are Business & Financial (100.0%), Education Instruction & Library (100.0%), and Arts, Media & Entertainment (100.0%).
| Occupation | Male | Female |
| Management | 34 (65.4%) | 18 (34.6%) |
| Business & Financial | 0 (0.0%) | 6 (100.0%) |
| Computers, Engineering & Science | 10 (52.6%) | 9 (47.4%) |
| Computers & Mathematics | 7 (100.0%) | 0 (0.0%) |
| Architecture & Engineering | 0 (0.0%) | 0 (0.0%) |
| Life, Physical & Social Science | 3 (25.0%) | 9 (75.0%) |
| Community & Social Service | 10 (28.6%) | 25 (71.4%) |
| Education, Arts & Media | 10 (58.8%) | 7 (41.2%) |
| Legal Services & Support | 0 (0.0%) | 0 (0.0%) |
| Education Instruction & Library | 0 (0.0%) | 16 (100.0%) |
| Arts, Media & Entertainment | 0 (0.0%) | 2 (100.0%) |
| Health Diagnosing & Treating | 3 (21.4%) | 11 (78.6%) |
| Health Technologists | 3 (21.4%) | 11 (78.6%) |
| Total (Category) | 57 (45.2%) | 69 (54.8%) |
| Total (Overall) | 216 (57.9%) | 157 (42.1%) |
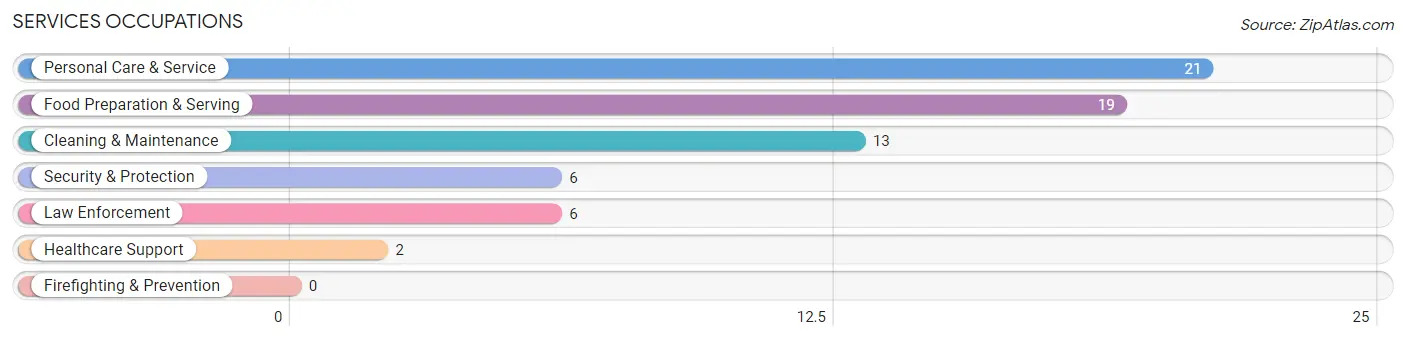
Services Occupations
The most common Services occupations in Hill City are Personal Care & Service (21 | 5.6%), Food Preparation & Serving (19 | 5.1%), Cleaning & Maintenance (13 | 3.5%), Security & Protection (6 | 1.6%), and Law Enforcement (6 | 1.6%).
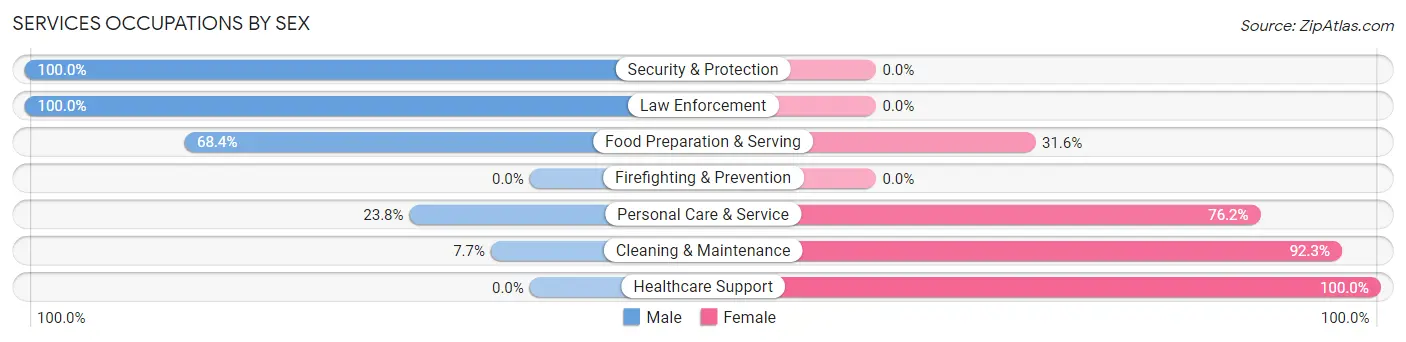
Services Occupations by Sex
Within the Services occupations in Hill City, the most male-oriented occupations are Security & Protection (100.0%), Law Enforcement (100.0%), and Food Preparation & Serving (68.4%), while the most female-oriented occupations are Healthcare Support (100.0%), Cleaning & Maintenance (92.3%), and Personal Care & Service (76.2%).
| Occupation | Male | Female |
| Healthcare Support | 0 (0.0%) | 2 (100.0%) |
| Security & Protection | 6 (100.0%) | 0 (0.0%) |
| Firefighting & Prevention | 0 (0.0%) | 0 (0.0%) |
| Law Enforcement | 6 (100.0%) | 0 (0.0%) |
| Food Preparation & Serving | 13 (68.4%) | 6 (31.6%) |
| Cleaning & Maintenance | 1 (7.7%) | 12 (92.3%) |
| Personal Care & Service | 5 (23.8%) | 16 (76.2%) |
| Total (Category) | 25 (41.0%) | 36 (59.0%) |
| Total (Overall) | 216 (57.9%) | 157 (42.1%) |
Sales and Office Occupations
The most common Sales and Office occupations in Hill City are Office & Administration (46 | 12.3%), and Sales & Related (41 | 11.0%).
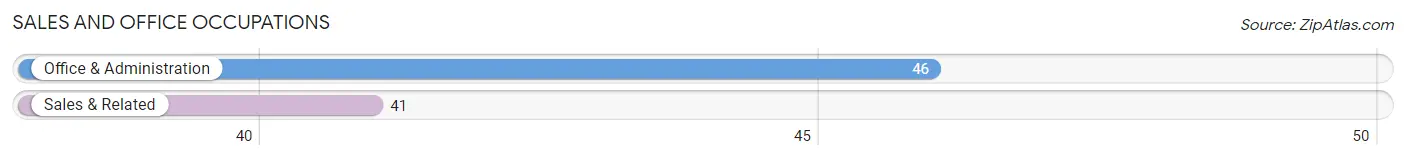
Sales and Office Occupations by Sex

| Occupation | Male | Female |
| Sales & Related | 41 (100.0%) | 0 (0.0%) |
| Office & Administration | 0 (0.0%) | 46 (100.0%) |
| Total (Category) | 41 (47.1%) | 46 (52.9%) |
| Total (Overall) | 216 (57.9%) | 157 (42.1%) |
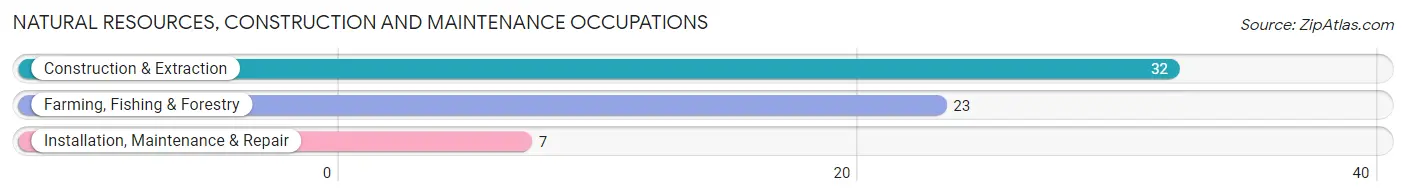
Natural Resources, Construction and Maintenance Occupations
The most common Natural Resources, Construction and Maintenance occupations in Hill City are Construction & Extraction (32 | 8.6%), Farming, Fishing & Forestry (23 | 6.2%), and Installation, Maintenance & Repair (7 | 1.9%).
Natural Resources, Construction and Maintenance Occupations by Sex
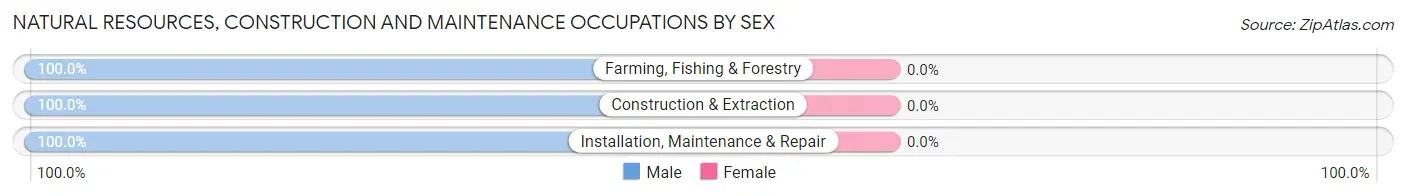
| Occupation | Male | Female |
| Farming, Fishing & Forestry | 23 (100.0%) | 0 (0.0%) |
| Construction & Extraction | 32 (100.0%) | 0 (0.0%) |
| Installation, Maintenance & Repair | 7 (100.0%) | 0 (0.0%) |
| Total (Category) | 62 (100.0%) | 0 (0.0%) |
| Total (Overall) | 216 (57.9%) | 157 (42.1%) |
Production, Transportation and Moving Occupations
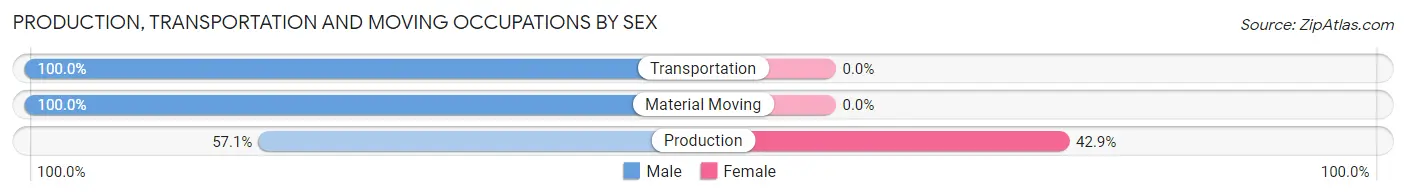
The most common Production, Transportation and Moving occupations in Hill City are Production (14 | 3.7%), Material Moving (14 | 3.7%), and Transportation (9 | 2.4%).
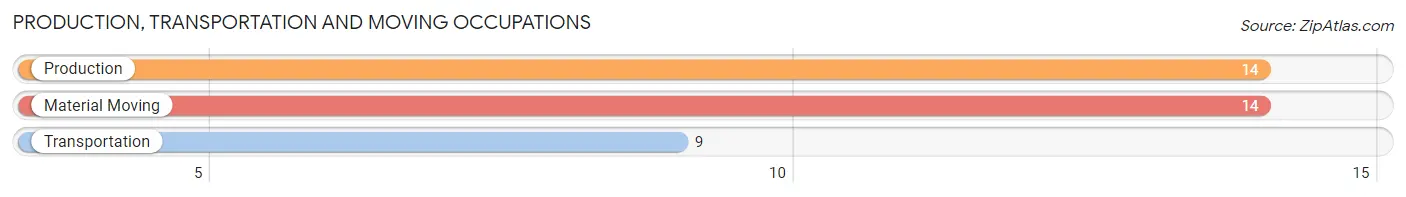
Production, Transportation and Moving Occupations by Sex
| Occupation | Male | Female |
| Production | 8 (57.1%) | 6 (42.9%) |
| Transportation | 9 (100.0%) | 0 (0.0%) |
| Material Moving | 14 (100.0%) | 0 (0.0%) |
| Total (Category) | 31 (83.8%) | 6 (16.2%) |
| Total (Overall) | 216 (57.9%) | 157 (42.1%) |
Employment Industries by Sex in Hill City
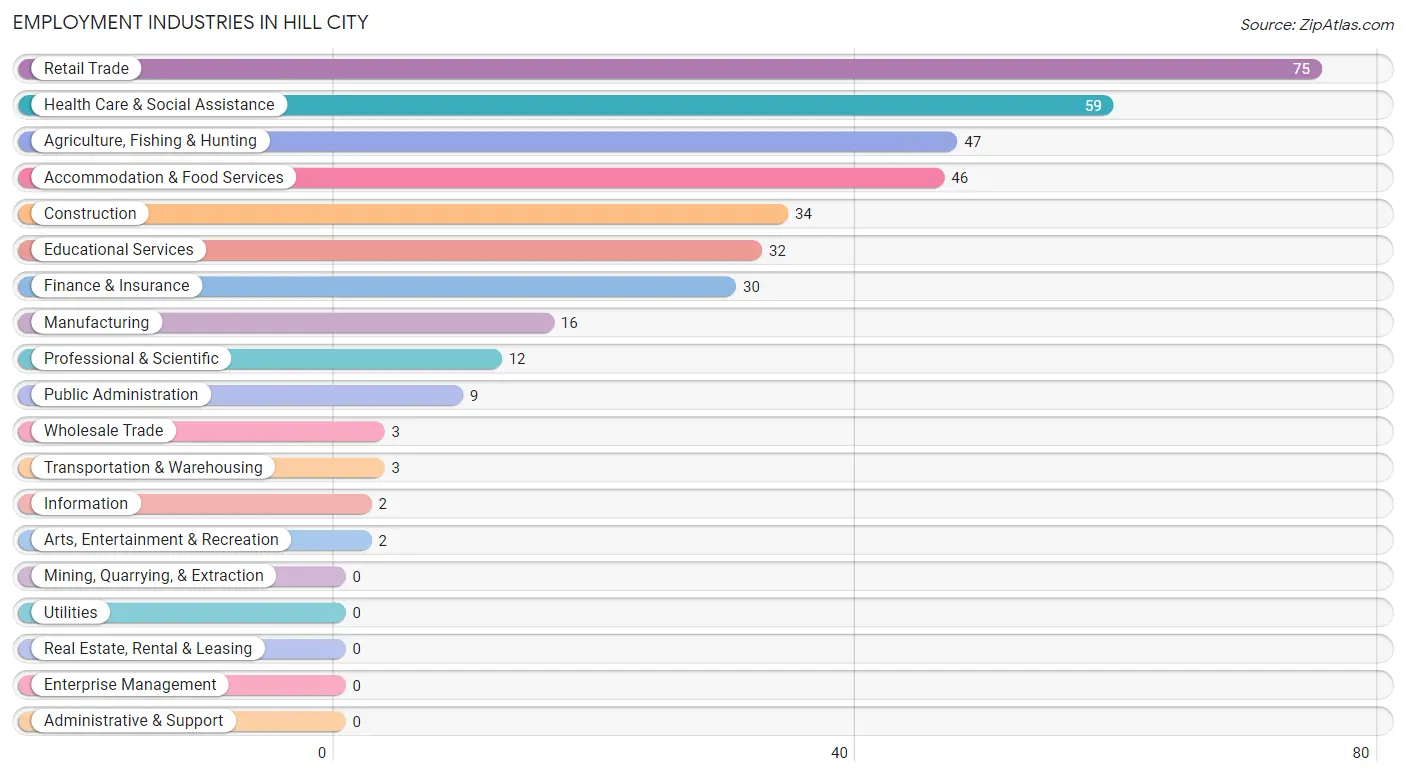
Employment Industries in Hill City
The major employment industries in Hill City include Retail Trade (75 | 20.1%), Health Care & Social Assistance (59 | 15.8%), Agriculture, Fishing & Hunting (47 | 12.6%), Accommodation & Food Services (46 | 12.3%), and Construction (34 | 9.1%).
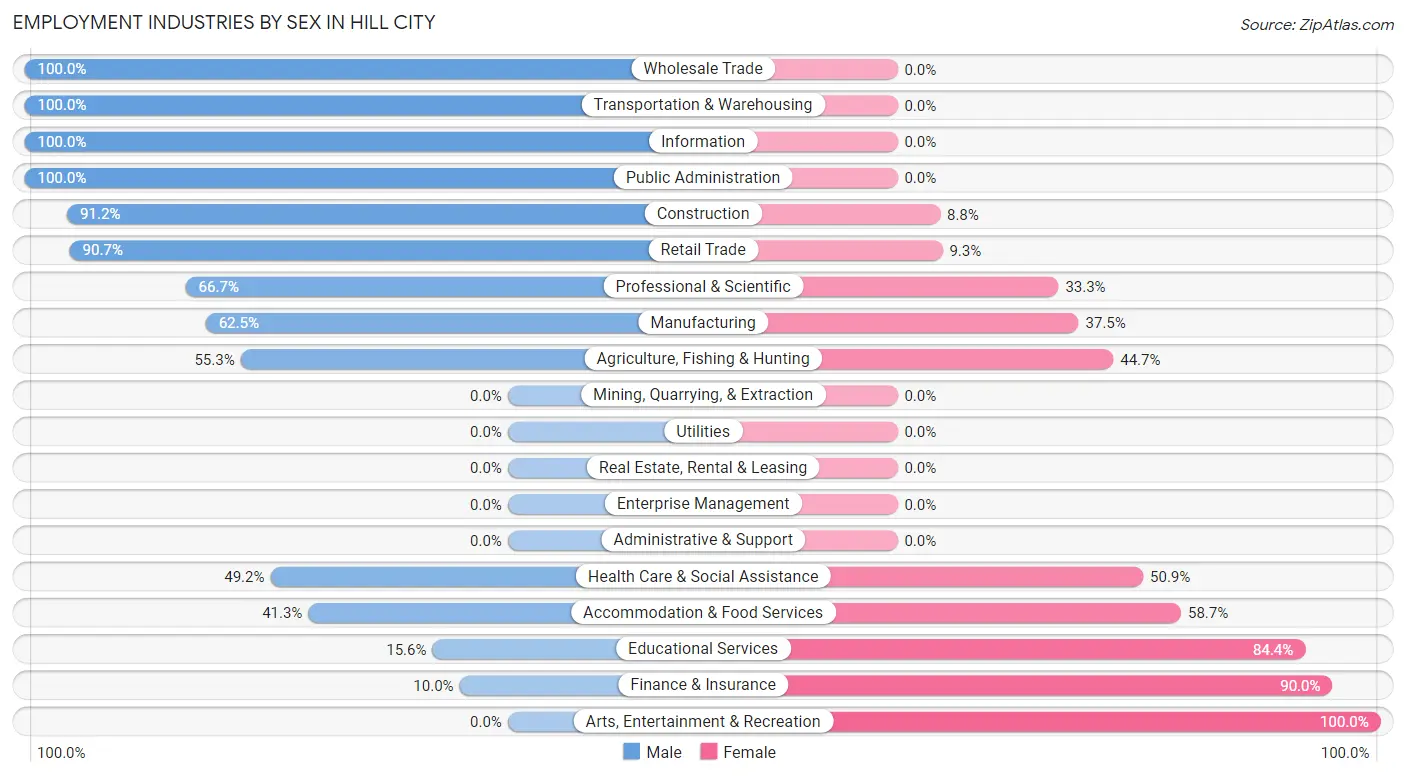
Employment Industries by Sex in Hill City
The Hill City industries that see more men than women are Wholesale Trade (100.0%), Transportation & Warehousing (100.0%), and Information (100.0%), whereas the industries that tend to have a higher number of women are Arts, Entertainment & Recreation (100.0%), Finance & Insurance (90.0%), and Educational Services (84.4%).
| Industry | Male | Female |
| Agriculture, Fishing & Hunting | 26 (55.3%) | 21 (44.7%) |
| Mining, Quarrying, & Extraction | 0 (0.0%) | 0 (0.0%) |
| Construction | 31 (91.2%) | 3 (8.8%) |
| Manufacturing | 10 (62.5%) | 6 (37.5%) |
| Wholesale Trade | 3 (100.0%) | 0 (0.0%) |
| Retail Trade | 68 (90.7%) | 7 (9.3%) |
| Transportation & Warehousing | 3 (100.0%) | 0 (0.0%) |
| Utilities | 0 (0.0%) | 0 (0.0%) |
| Information | 2 (100.0%) | 0 (0.0%) |
| Finance & Insurance | 3 (10.0%) | 27 (90.0%) |
| Real Estate, Rental & Leasing | 0 (0.0%) | 0 (0.0%) |
| Professional & Scientific | 8 (66.7%) | 4 (33.3%) |
| Enterprise Management | 0 (0.0%) | 0 (0.0%) |
| Administrative & Support | 0 (0.0%) | 0 (0.0%) |
| Educational Services | 5 (15.6%) | 27 (84.4%) |
| Health Care & Social Assistance | 29 (49.1%) | 30 (50.8%) |
| Arts, Entertainment & Recreation | 0 (0.0%) | 2 (100.0%) |
| Accommodation & Food Services | 19 (41.3%) | 27 (58.7%) |
| Public Administration | 9 (100.0%) | 0 (0.0%) |
| Total | 216 (57.9%) | 157 (42.1%) |
Education in Hill City
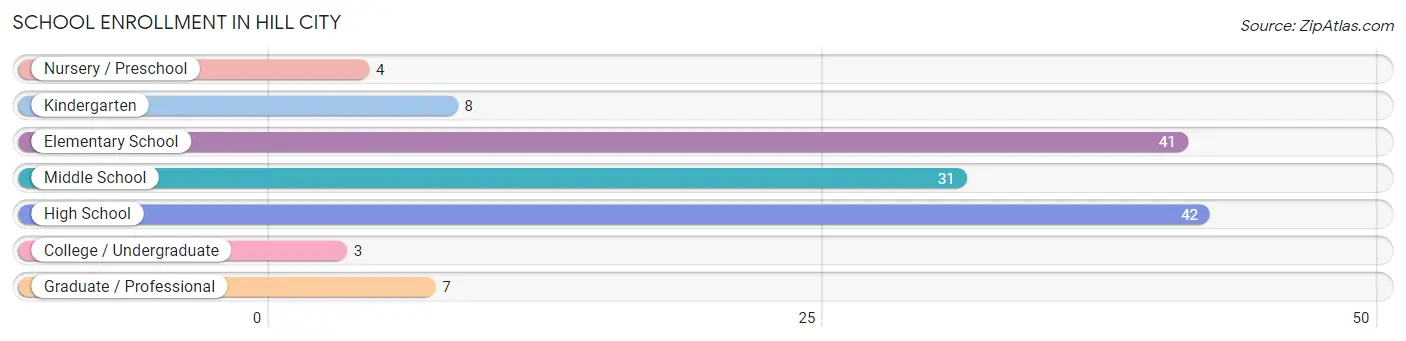
School Enrollment in Hill City
The most common levels of schooling among the 136 students in Hill City are high school (42 | 30.9%), elementary school (41 | 30.1%), and middle school (31 | 22.8%).
| School Level | # Students | % Students |
| Nursery / Preschool | 4 | 2.9% |
| Kindergarten | 8 | 5.9% |
| Elementary School | 41 | 30.1% |
| Middle School | 31 | 22.8% |
| High School | 42 | 30.9% |
| College / Undergraduate | 3 | 2.2% |
| Graduate / Professional | 7 | 5.1% |
| Total | 136 | 100.0% |
School Enrollment by Age by Funding Source in Hill City
Out of a total of 136 students who are enrolled in schools in Hill City, 14 (10.3%) attend a private institution, while the remaining 122 (89.7%) are enrolled in public schools. The age group of 15 to 17 year olds has the highest likelihood of being enrolled in private schools, with 14 (33.3% in the age bracket) enrolled. Conversely, the age group of 3 to 4 year olds has the lowest likelihood of being enrolled in a private school, with 2 (100.0% in the age bracket) attending a public institution.
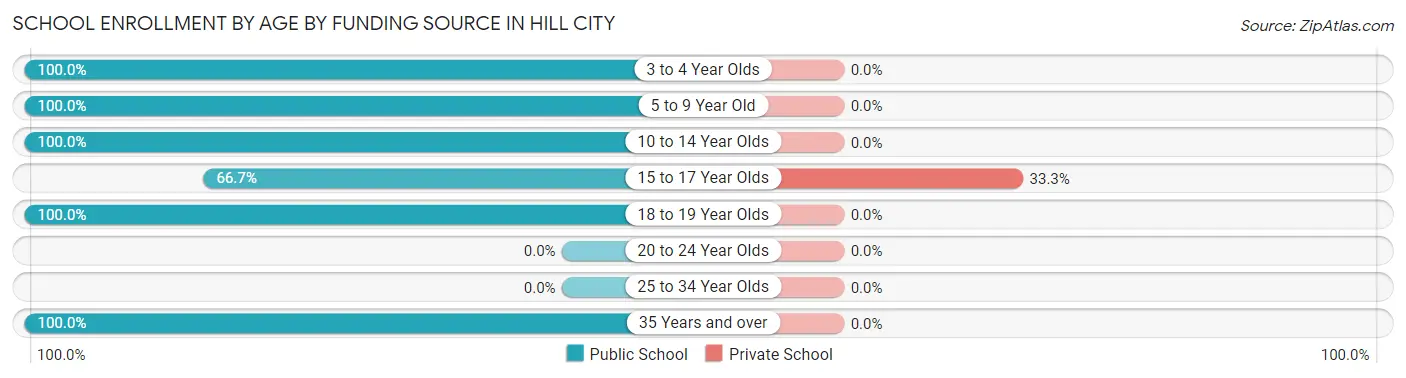
| Age Bracket | Public School | Private School |
| 3 to 4 Year Olds | 2 (100.0%) | 0 (0.0%) |
| 5 to 9 Year Old | 39 (100.0%) | 0 (0.0%) |
| 10 to 14 Year Olds | 43 (100.0%) | 0 (0.0%) |
| 15 to 17 Year Olds | 28 (66.7%) | 14 (33.3%) |
| 18 to 19 Year Olds | 3 (100.0%) | 0 (0.0%) |
| 20 to 24 Year Olds | 0 (0.0%) | 0 (0.0%) |
| 25 to 34 Year Olds | 0 (0.0%) | 0 (0.0%) |
| 35 Years and over | 7 (100.0%) | 0 (0.0%) |
| Total | 122 (89.7%) | 14 (10.3%) |
Educational Attainment by Field of Study in Hill City
Education (29 | 23.6%), science & technology (25 | 20.3%), bio, nature & agricultural (19 | 15.4%), psychology (11 | 8.9%), and literature & languages (9 | 7.3%) are the most common fields of study among 123 individuals in Hill City who have obtained a bachelor's degree or higher.
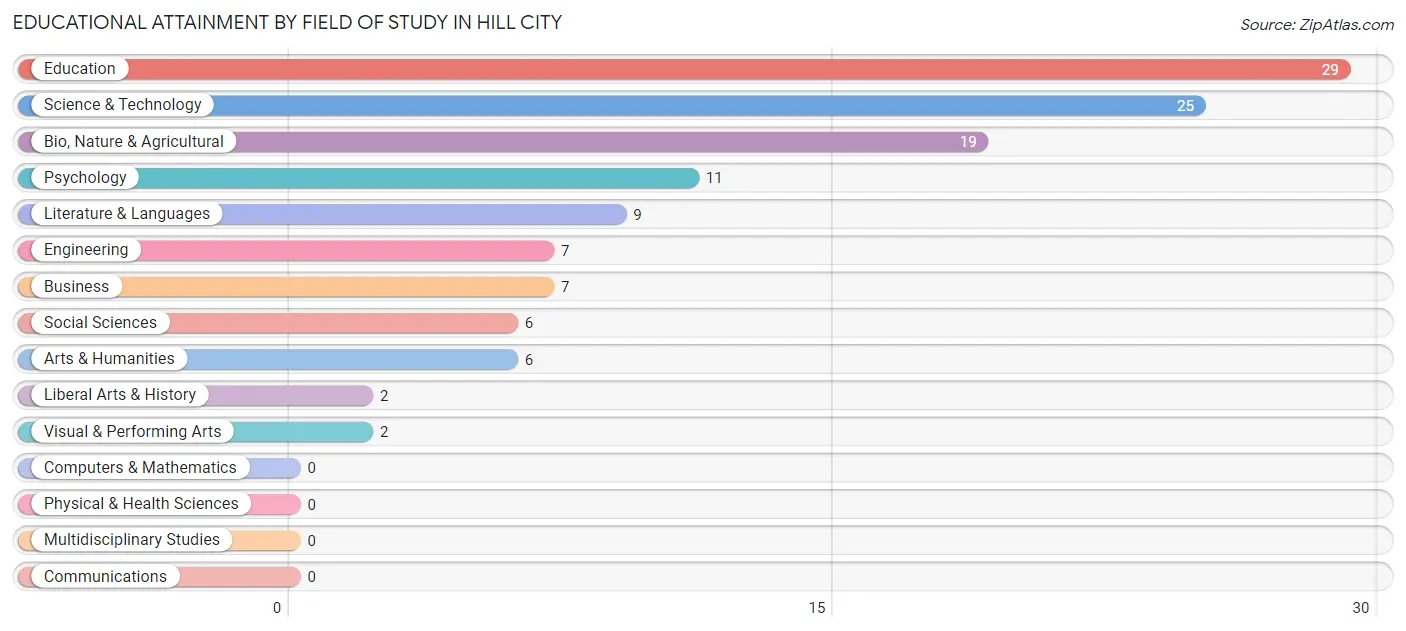
| Field of Study | # Graduates | % Graduates |
| Computers & Mathematics | 0 | 0.0% |
| Bio, Nature & Agricultural | 19 | 15.4% |
| Physical & Health Sciences | 0 | 0.0% |
| Psychology | 11 | 8.9% |
| Social Sciences | 6 | 4.9% |
| Engineering | 7 | 5.7% |
| Multidisciplinary Studies | 0 | 0.0% |
| Science & Technology | 25 | 20.3% |
| Business | 7 | 5.7% |
| Education | 29 | 23.6% |
| Literature & Languages | 9 | 7.3% |
| Liberal Arts & History | 2 | 1.6% |
| Visual & Performing Arts | 2 | 1.6% |
| Communications | 0 | 0.0% |
| Arts & Humanities | 6 | 4.9% |
| Total | 123 | 100.0% |
Transportation & Commute in Hill City
Vehicle Availability by Sex in Hill City
The most prevalent vehicle ownership categories in Hill City are males with 4 vehicles (86, accounting for 41.1%) and females with 4 vehicles (49, making up 58.5%).
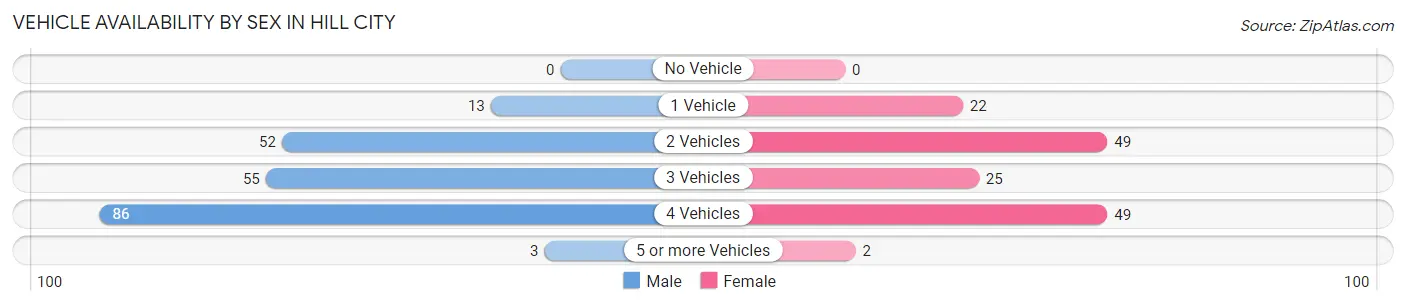
| Vehicles Available | Male | Female |
| No Vehicle | 0 (0.0%) | 0 (0.0%) |
| 1 Vehicle | 13 (6.2%) | 22 (15.0%) |
| 2 Vehicles | 52 (24.9%) | 49 (33.3%) |
| 3 Vehicles | 55 (26.3%) | 25 (17.0%) |
| 4 Vehicles | 86 (41.1%) | 49 (33.3%) |
| 5 or more Vehicles | 3 (1.4%) | 2 (1.4%) |
| Total | 209 (100.0%) | 147 (100.0%) |
Commute Time in Hill City
The most frequently occuring commute durations in Hill City are 5 to 9 minutes (106 commuters, 33.2%), 30 to 34 minutes (48 commuters, 15.0%), and 20 to 24 minutes (42 commuters, 13.2%).
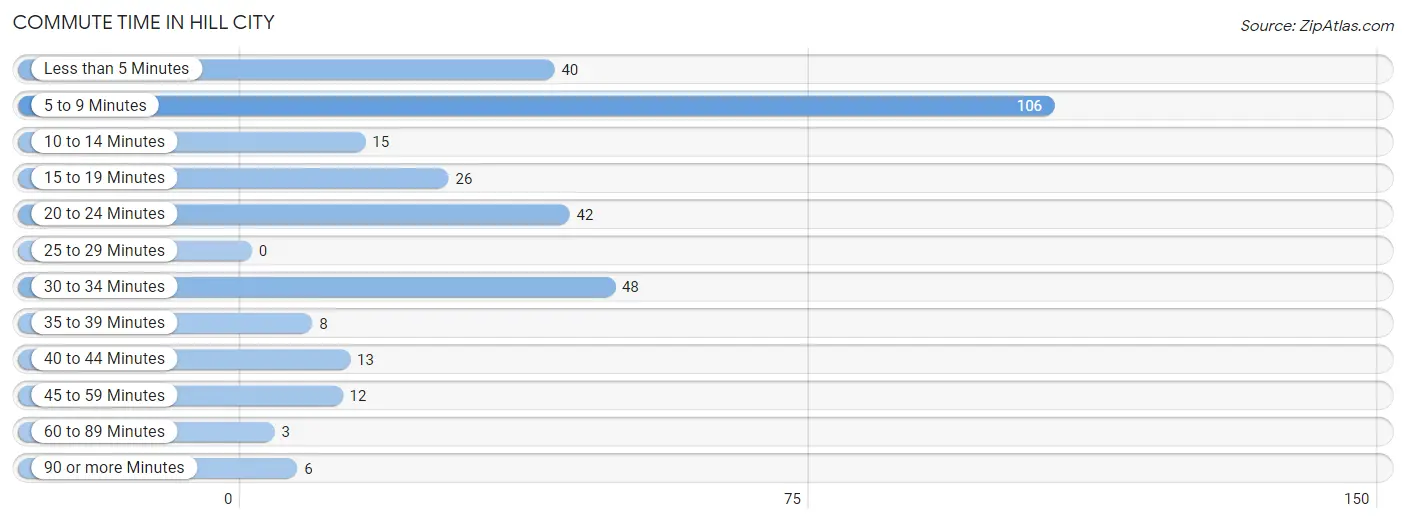
| Commute Time | # Commuters | % Commuters |
| Less than 5 Minutes | 40 | 12.5% |
| 5 to 9 Minutes | 106 | 33.2% |
| 10 to 14 Minutes | 15 | 4.7% |
| 15 to 19 Minutes | 26 | 8.2% |
| 20 to 24 Minutes | 42 | 13.2% |
| 25 to 29 Minutes | 0 | 0.0% |
| 30 to 34 Minutes | 48 | 15.0% |
| 35 to 39 Minutes | 8 | 2.5% |
| 40 to 44 Minutes | 13 | 4.1% |
| 45 to 59 Minutes | 12 | 3.8% |
| 60 to 89 Minutes | 3 | 0.9% |
| 90 or more Minutes | 6 | 1.9% |
Commute Time by Sex in Hill City
The most common commute times in Hill City are 5 to 9 minutes (64 commuters, 32.0%) for males and 5 to 9 minutes (42 commuters, 35.3%) for females.
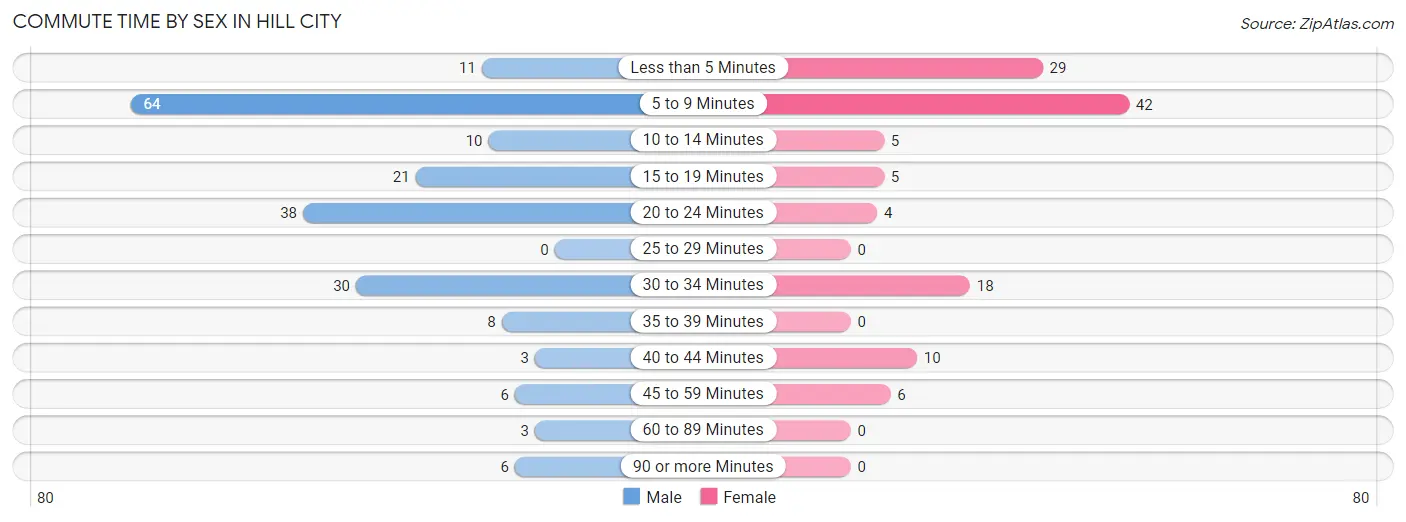
| Commute Time | Male | Female |
| Less than 5 Minutes | 11 (5.5%) | 29 (24.4%) |
| 5 to 9 Minutes | 64 (32.0%) | 42 (35.3%) |
| 10 to 14 Minutes | 10 (5.0%) | 5 (4.2%) |
| 15 to 19 Minutes | 21 (10.5%) | 5 (4.2%) |
| 20 to 24 Minutes | 38 (19.0%) | 4 (3.4%) |
| 25 to 29 Minutes | 0 (0.0%) | 0 (0.0%) |
| 30 to 34 Minutes | 30 (15.0%) | 18 (15.1%) |
| 35 to 39 Minutes | 8 (4.0%) | 0 (0.0%) |
| 40 to 44 Minutes | 3 (1.5%) | 10 (8.4%) |
| 45 to 59 Minutes | 6 (3.0%) | 6 (5.0%) |
| 60 to 89 Minutes | 3 (1.5%) | 0 (0.0%) |
| 90 or more Minutes | 6 (3.0%) | 0 (0.0%) |
Time of Departure to Work by Sex in Hill City
The most frequent times of departure to work in Hill City are 8:00 AM to 8:29 AM (51, 25.5%) for males and 7:00 AM to 7:29 AM (41, 34.4%) for females.
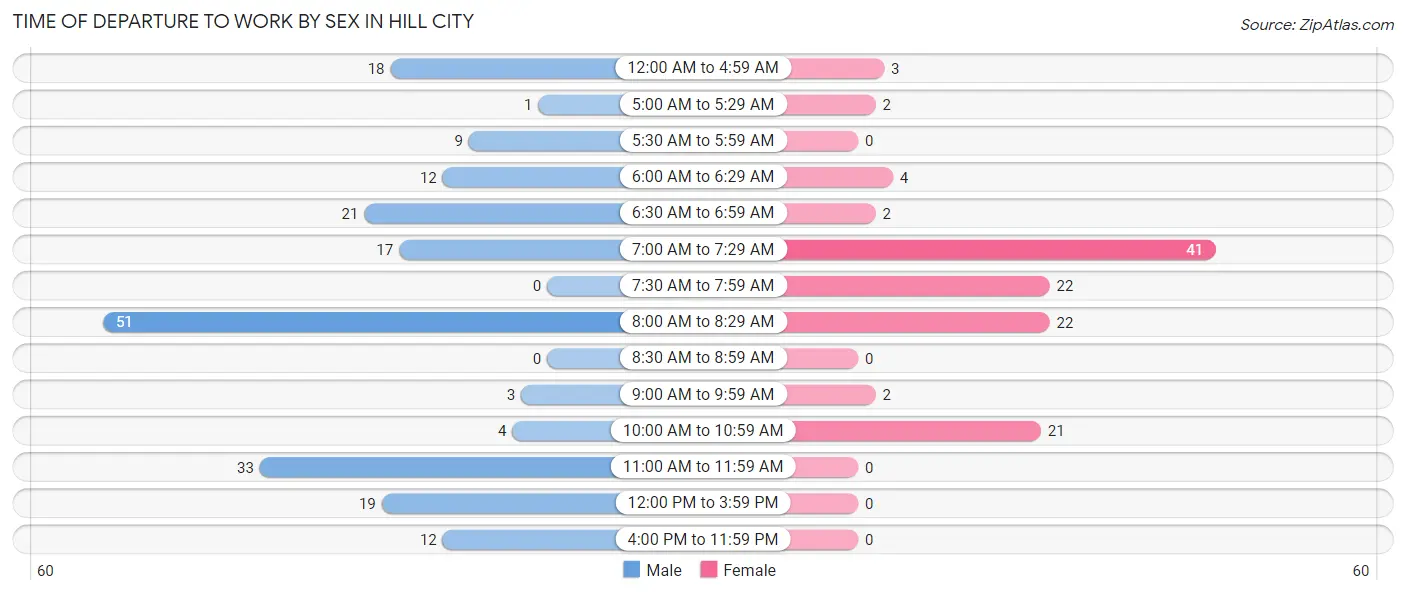
| Time of Departure | Male | Female |
| 12:00 AM to 4:59 AM | 18 (9.0%) | 3 (2.5%) |
| 5:00 AM to 5:29 AM | 1 (0.5%) | 2 (1.7%) |
| 5:30 AM to 5:59 AM | 9 (4.5%) | 0 (0.0%) |
| 6:00 AM to 6:29 AM | 12 (6.0%) | 4 (3.4%) |
| 6:30 AM to 6:59 AM | 21 (10.5%) | 2 (1.7%) |
| 7:00 AM to 7:29 AM | 17 (8.5%) | 41 (34.4%) |
| 7:30 AM to 7:59 AM | 0 (0.0%) | 22 (18.5%) |
| 8:00 AM to 8:29 AM | 51 (25.5%) | 22 (18.5%) |
| 8:30 AM to 8:59 AM | 0 (0.0%) | 0 (0.0%) |
| 9:00 AM to 9:59 AM | 3 (1.5%) | 2 (1.7%) |
| 10:00 AM to 10:59 AM | 4 (2.0%) | 21 (17.6%) |
| 11:00 AM to 11:59 AM | 33 (16.5%) | 0 (0.0%) |
| 12:00 PM to 3:59 PM | 19 (9.5%) | 0 (0.0%) |
| 4:00 PM to 11:59 PM | 12 (6.0%) | 0 (0.0%) |
| Total | 200 (100.0%) | 119 (100.0%) |
Housing Occupancy in Hill City
Occupancy by Ownership in Hill City
Of the total 220 dwellings in Hill City, owner-occupied units account for 181 (82.3%), while renter-occupied units make up 39 (17.7%).
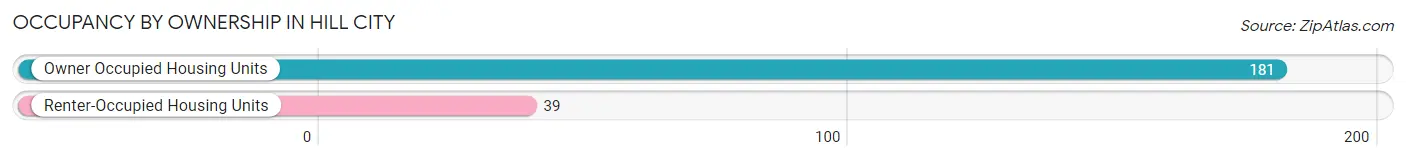
| Occupancy | # Housing Units | % Housing Units |
| Owner Occupied Housing Units | 181 | 82.3% |
| Renter-Occupied Housing Units | 39 | 17.7% |
| Total Occupied Housing Units | 220 | 100.0% |
Occupancy by Household Size in Hill City
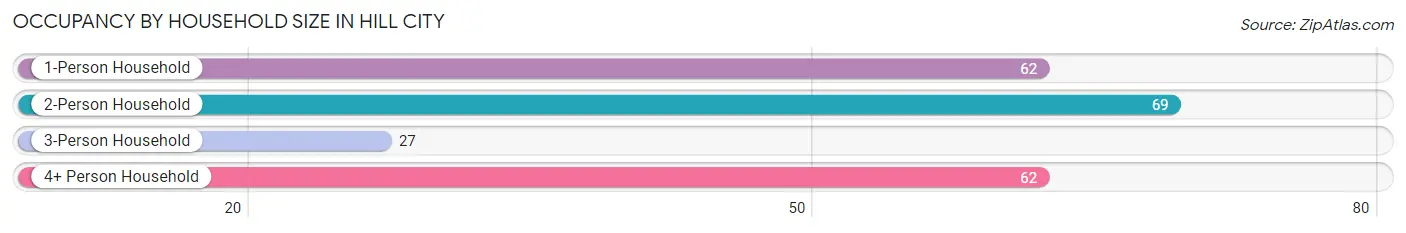
| Household Size | # Housing Units | % Housing Units |
| 1-Person Household | 62 | 28.2% |
| 2-Person Household | 69 | 31.4% |
| 3-Person Household | 27 | 12.3% |
| 4+ Person Household | 62 | 28.2% |
| Total Housing Units | 220 | 100.0% |
Occupancy by Ownership by Household Size in Hill City
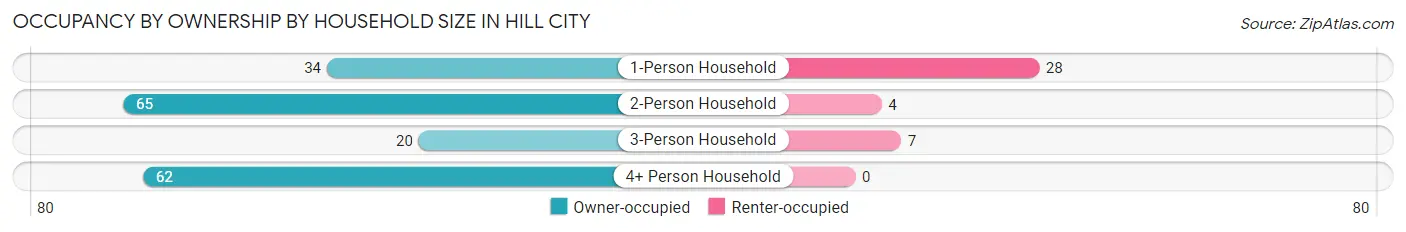
| Household Size | Owner-occupied | Renter-occupied |
| 1-Person Household | 34 (54.8%) | 28 (45.2%) |
| 2-Person Household | 65 (94.2%) | 4 (5.8%) |
| 3-Person Household | 20 (74.1%) | 7 (25.9%) |
| 4+ Person Household | 62 (100.0%) | 0 (0.0%) |
| Total Housing Units | 181 (82.3%) | 39 (17.7%) |
Occupancy by Educational Attainment in Hill City
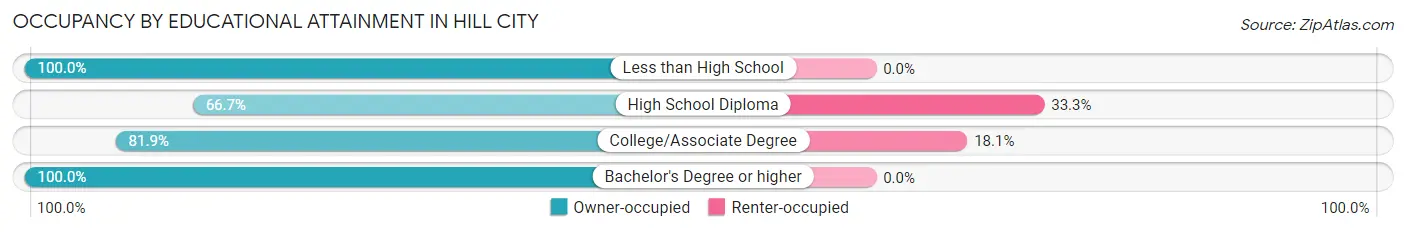
| Household Size | Owner-occupied | Renter-occupied |
| Less than High School | 13 (100.0%) | 0 (0.0%) |
| High School Diploma | 52 (66.7%) | 26 (33.3%) |
| College/Associate Degree | 59 (81.9%) | 13 (18.1%) |
| Bachelor's Degree or higher | 57 (100.0%) | 0 (0.0%) |
Occupancy by Age of Householder in Hill City
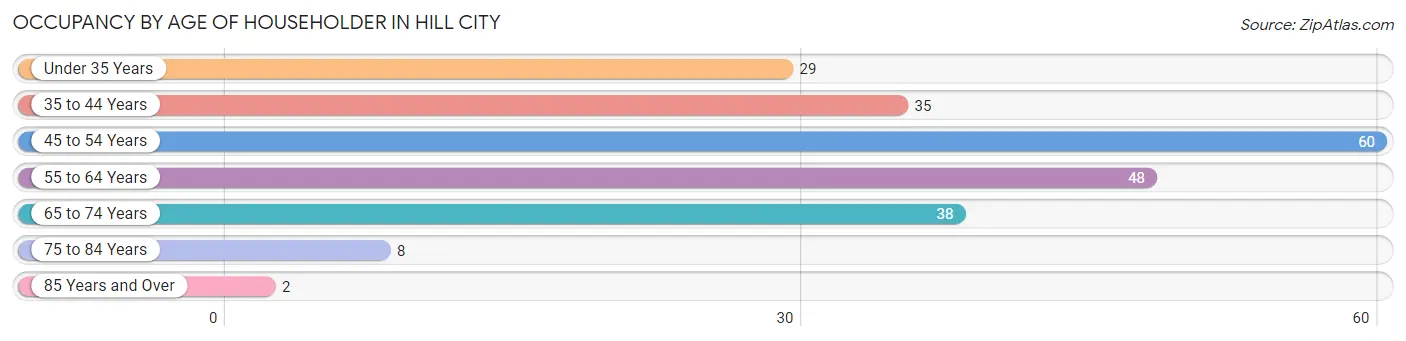
| Age Bracket | # Households | % Households |
| Under 35 Years | 29 | 13.2% |
| 35 to 44 Years | 35 | 15.9% |
| 45 to 54 Years | 60 | 27.3% |
| 55 to 64 Years | 48 | 21.8% |
| 65 to 74 Years | 38 | 17.3% |
| 75 to 84 Years | 8 | 3.6% |
| 85 Years and Over | 2 | 0.9% |
| Total | 220 | 100.0% |
Housing Finances in Hill City
Median Income by Occupancy in Hill City
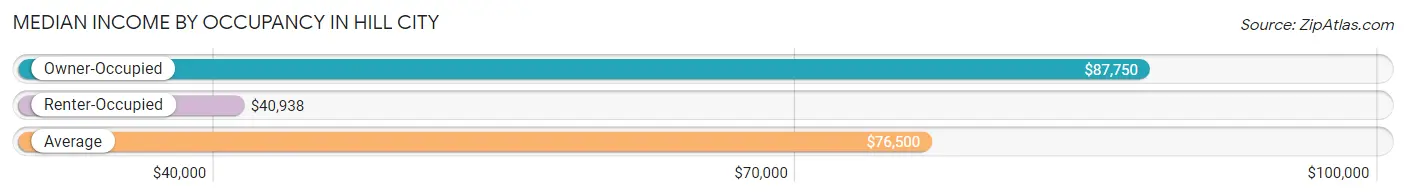
| Occupancy Type | # Households | Median Income |
| Owner-Occupied | 181 (82.3%) | $87,750 |
| Renter-Occupied | 39 (17.7%) | $40,938 |
| Average | 220 (100.0%) | $76,500 |
Occupancy by Householder Income Bracket in Hill City
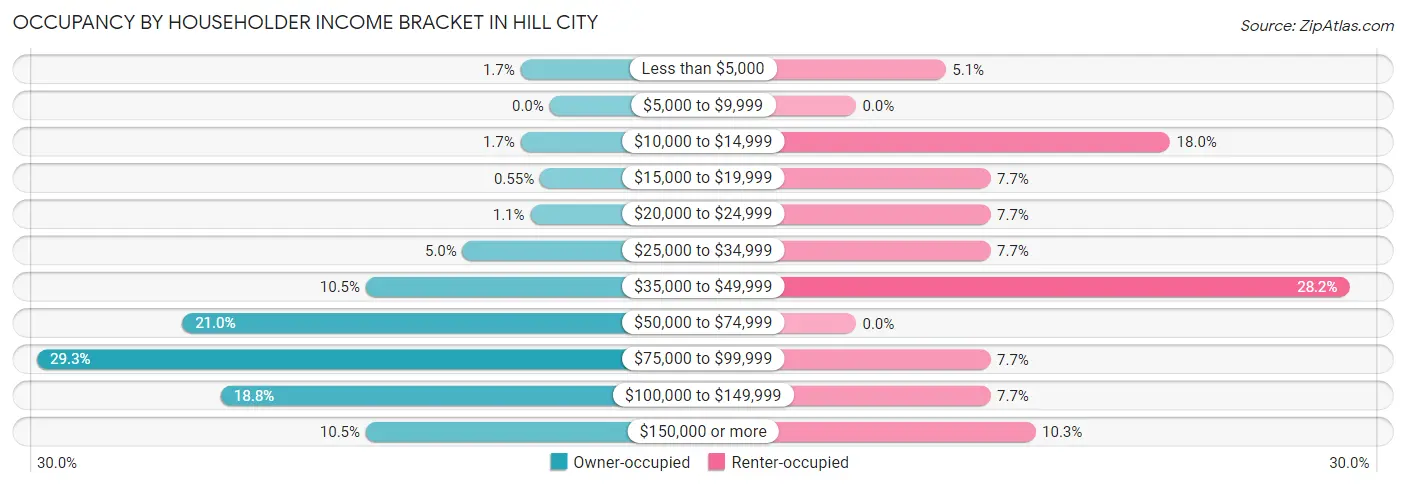
| Income Bracket | Owner-occupied | Renter-occupied |
| Less than $5,000 | 3 (1.7%) | 2 (5.1%) |
| $5,000 to $9,999 | 0 (0.0%) | 0 (0.0%) |
| $10,000 to $14,999 | 3 (1.7%) | 7 (17.9%) |
| $15,000 to $19,999 | 1 (0.5%) | 3 (7.7%) |
| $20,000 to $24,999 | 2 (1.1%) | 3 (7.7%) |
| $25,000 to $34,999 | 9 (5.0%) | 3 (7.7%) |
| $35,000 to $49,999 | 19 (10.5%) | 11 (28.2%) |
| $50,000 to $74,999 | 38 (21.0%) | 0 (0.0%) |
| $75,000 to $99,999 | 53 (29.3%) | 3 (7.7%) |
| $100,000 to $149,999 | 34 (18.8%) | 3 (7.7%) |
| $150,000 or more | 19 (10.5%) | 4 (10.3%) |
| Total | 181 (100.0%) | 39 (100.0%) |
Monthly Housing Cost Tiers in Hill City
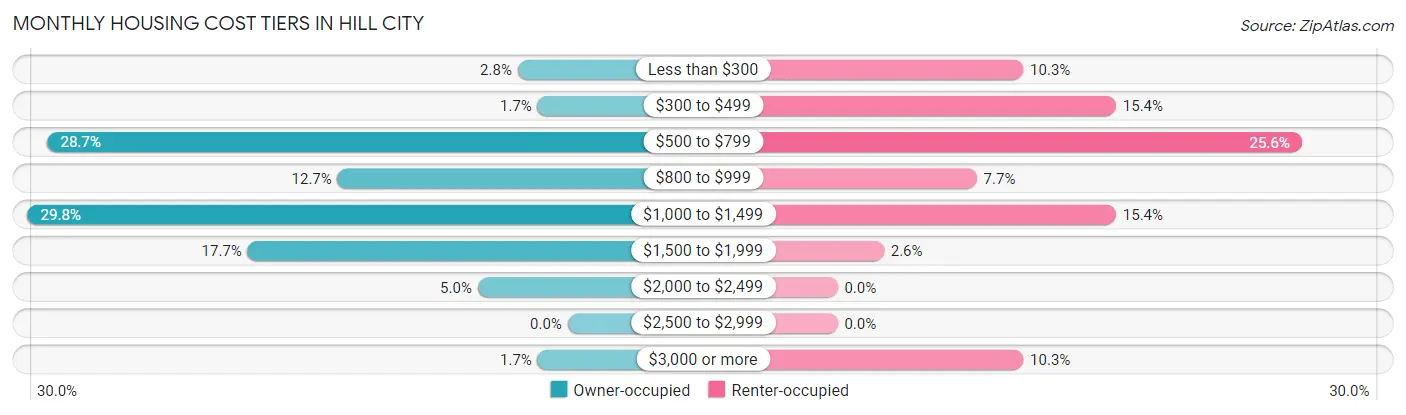
| Monthly Cost | Owner-occupied | Renter-occupied |
| Less than $300 | 5 (2.8%) | 4 (10.3%) |
| $300 to $499 | 3 (1.7%) | 6 (15.4%) |
| $500 to $799 | 52 (28.7%) | 10 (25.6%) |
| $800 to $999 | 23 (12.7%) | 3 (7.7%) |
| $1,000 to $1,499 | 54 (29.8%) | 6 (15.4%) |
| $1,500 to $1,999 | 32 (17.7%) | 1 (2.6%) |
| $2,000 to $2,499 | 9 (5.0%) | 0 (0.0%) |
| $2,500 to $2,999 | 0 (0.0%) | 0 (0.0%) |
| $3,000 or more | 3 (1.7%) | 4 (10.3%) |
| Total | 181 (100.0%) | 39 (100.0%) |
Physical Housing Characteristics in Hill City
Housing Structures in Hill City
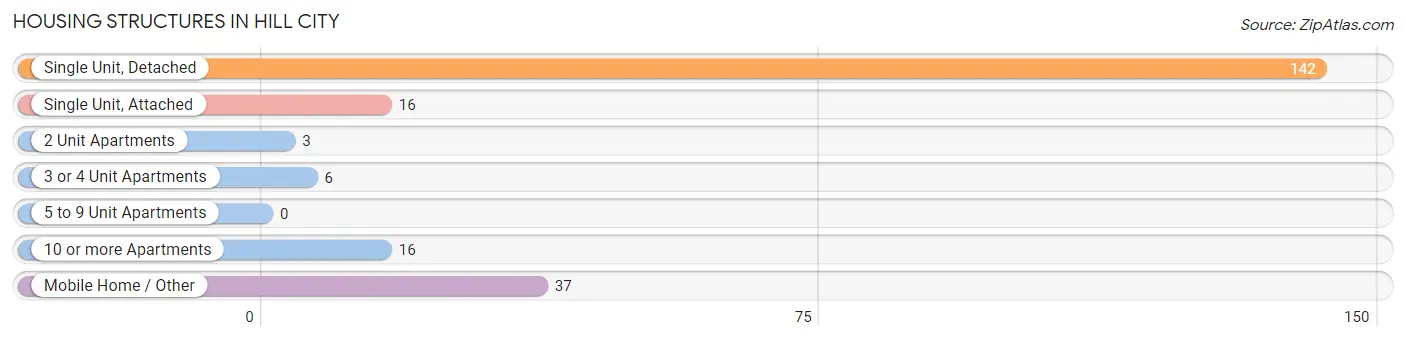
| Structure Type | # Housing Units | % Housing Units |
| Single Unit, Detached | 142 | 64.5% |
| Single Unit, Attached | 16 | 7.3% |
| 2 Unit Apartments | 3 | 1.4% |
| 3 or 4 Unit Apartments | 6 | 2.7% |
| 5 to 9 Unit Apartments | 0 | 0.0% |
| 10 or more Apartments | 16 | 7.3% |
| Mobile Home / Other | 37 | 16.8% |
| Total | 220 | 100.0% |
Housing Structures by Occupancy in Hill City
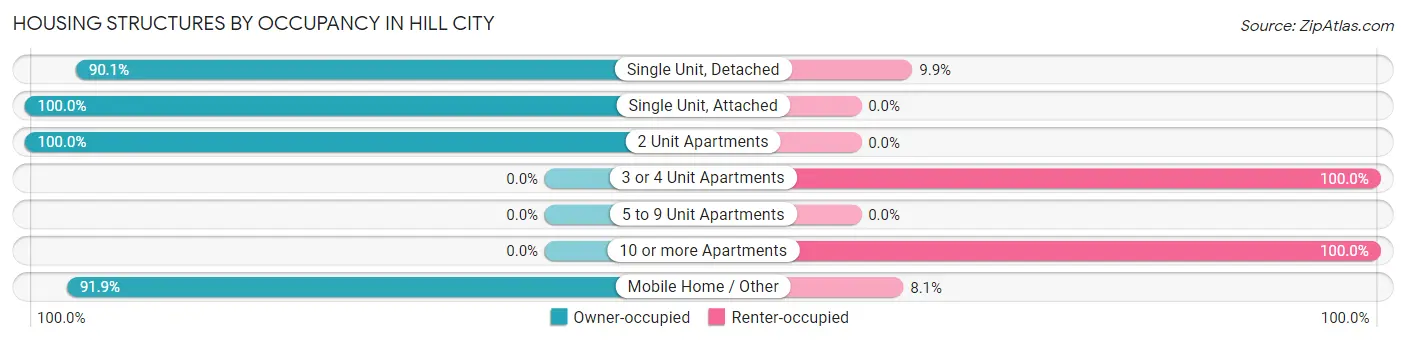
| Structure Type | Owner-occupied | Renter-occupied |
| Single Unit, Detached | 128 (90.1%) | 14 (9.9%) |
| Single Unit, Attached | 16 (100.0%) | 0 (0.0%) |
| 2 Unit Apartments | 3 (100.0%) | 0 (0.0%) |
| 3 or 4 Unit Apartments | 0 (0.0%) | 6 (100.0%) |
| 5 to 9 Unit Apartments | 0 (0.0%) | 0 (0.0%) |
| 10 or more Apartments | 0 (0.0%) | 16 (100.0%) |
| Mobile Home / Other | 34 (91.9%) | 3 (8.1%) |
| Total | 181 (82.3%) | 39 (17.7%) |
Housing Structures by Number of Rooms in Hill City
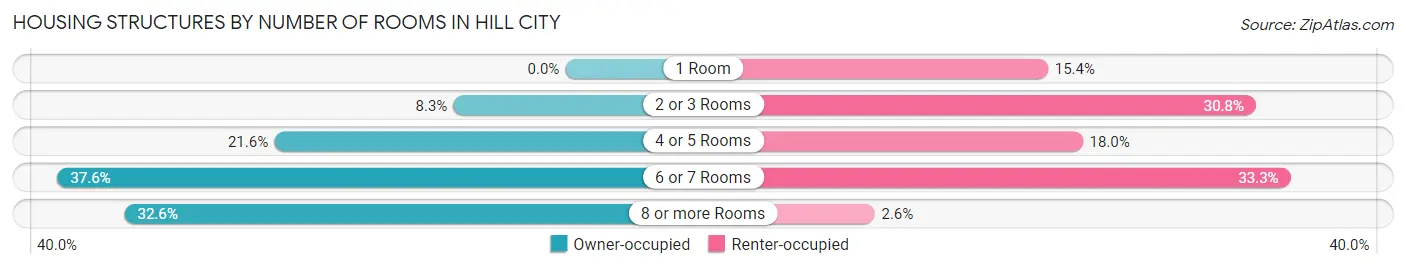
| Number of Rooms | Owner-occupied | Renter-occupied |
| 1 Room | 0 (0.0%) | 6 (15.4%) |
| 2 or 3 Rooms | 15 (8.3%) | 12 (30.8%) |
| 4 or 5 Rooms | 39 (21.5%) | 7 (17.9%) |
| 6 or 7 Rooms | 68 (37.6%) | 13 (33.3%) |
| 8 or more Rooms | 59 (32.6%) | 1 (2.6%) |
| Total | 181 (100.0%) | 39 (100.0%) |
Housing Structure by Heating Type in Hill City
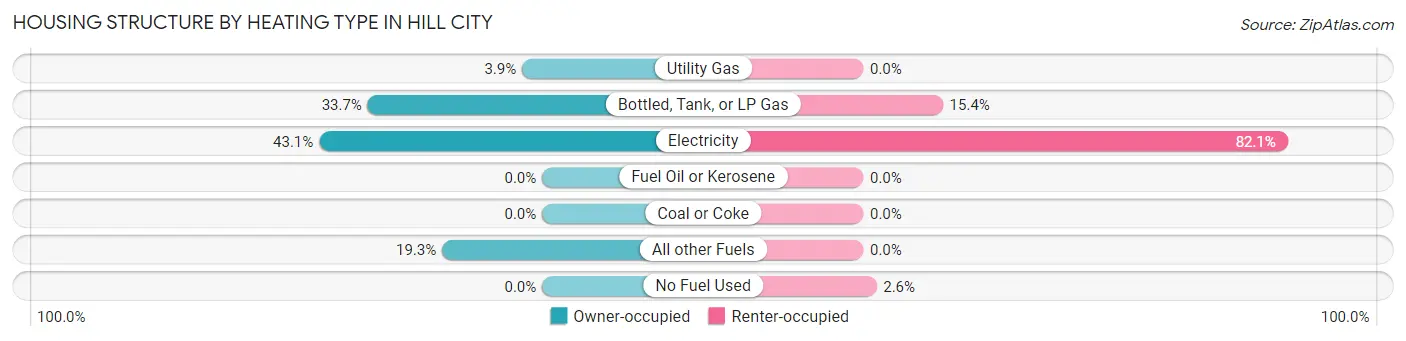
| Heating Type | Owner-occupied | Renter-occupied |
| Utility Gas | 7 (3.9%) | 0 (0.0%) |
| Bottled, Tank, or LP Gas | 61 (33.7%) | 6 (15.4%) |
| Electricity | 78 (43.1%) | 32 (82.1%) |
| Fuel Oil or Kerosene | 0 (0.0%) | 0 (0.0%) |
| Coal or Coke | 0 (0.0%) | 0 (0.0%) |
| All other Fuels | 35 (19.3%) | 0 (0.0%) |
| No Fuel Used | 0 (0.0%) | 1 (2.6%) |
| Total | 181 (100.0%) | 39 (100.0%) |
Household Vehicle Usage in Hill City
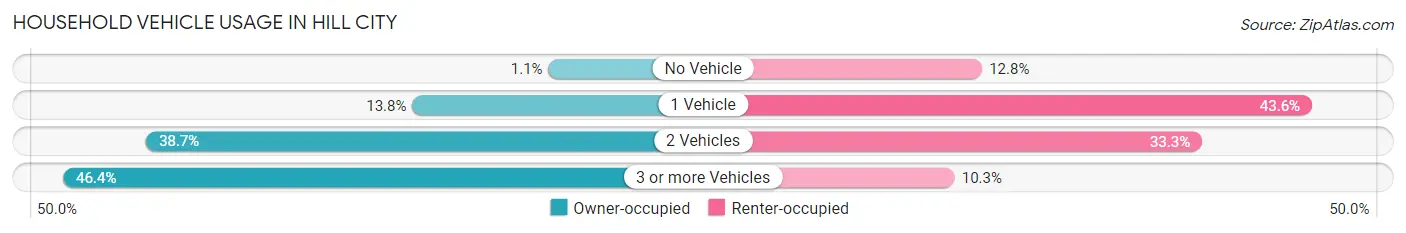
| Vehicles per Household | Owner-occupied | Renter-occupied |
| No Vehicle | 2 (1.1%) | 5 (12.8%) |
| 1 Vehicle | 25 (13.8%) | 17 (43.6%) |
| 2 Vehicles | 70 (38.7%) | 13 (33.3%) |
| 3 or more Vehicles | 84 (46.4%) | 4 (10.3%) |
| Total | 181 (100.0%) | 39 (100.0%) |
Real Estate & Mortgages in Hill City
Real Estate and Mortgage Overview in Hill City
| Characteristic | Without Mortgage | With Mortgage |
| Housing Units | 86 | 95 |
| Median Property Value | $244,100 | $215,500 |
| Median Household Income | $75,313 | $16 |
| Monthly Housing Costs | $689 | $3 |
| Real Estate Taxes | $3,523 | $0 |
Property Value by Mortgage Status in Hill City
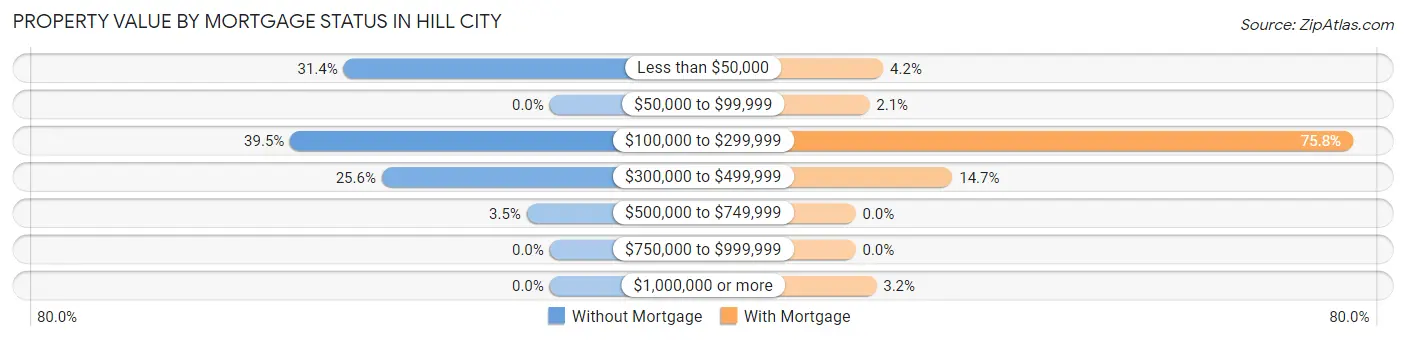
| Property Value | Without Mortgage | With Mortgage |
| Less than $50,000 | 27 (31.4%) | 4 (4.2%) |
| $50,000 to $99,999 | 0 (0.0%) | 2 (2.1%) |
| $100,000 to $299,999 | 34 (39.5%) | 72 (75.8%) |
| $300,000 to $499,999 | 22 (25.6%) | 14 (14.7%) |
| $500,000 to $749,999 | 3 (3.5%) | 0 (0.0%) |
| $750,000 to $999,999 | 0 (0.0%) | 0 (0.0%) |
| $1,000,000 or more | 0 (0.0%) | 3 (3.2%) |
| Total | 86 (100.0%) | 95 (100.0%) |
Household Income by Mortgage Status in Hill City
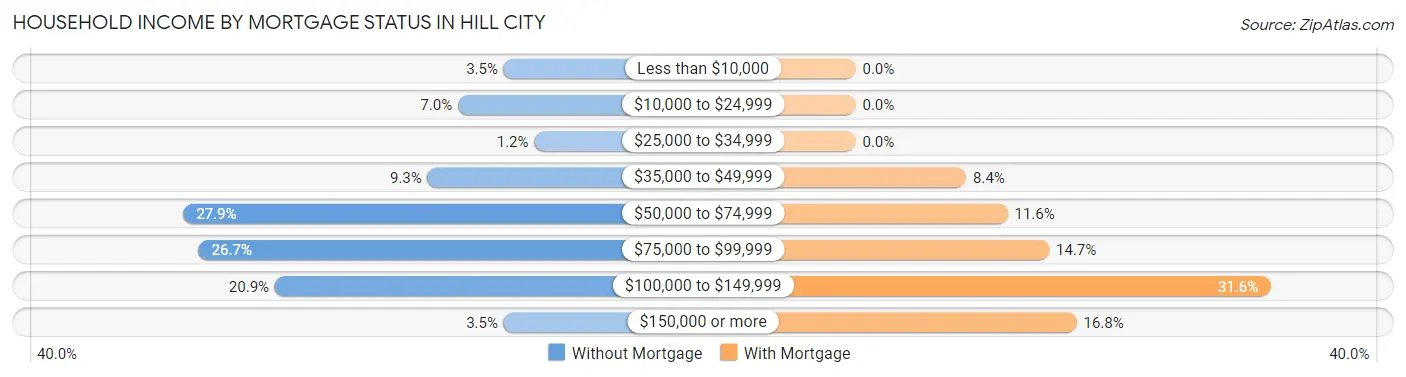
| Household Income | Without Mortgage | With Mortgage |
| Less than $10,000 | 3 (3.5%) | 0 (0.0%) |
| $10,000 to $24,999 | 6 (7.0%) | 0 (0.0%) |
| $25,000 to $34,999 | 1 (1.2%) | 0 (0.0%) |
| $35,000 to $49,999 | 8 (9.3%) | 8 (8.4%) |
| $50,000 to $74,999 | 24 (27.9%) | 11 (11.6%) |
| $75,000 to $99,999 | 23 (26.7%) | 14 (14.7%) |
| $100,000 to $149,999 | 18 (20.9%) | 30 (31.6%) |
| $150,000 or more | 3 (3.5%) | 16 (16.8%) |
| Total | 86 (100.0%) | 95 (100.0%) |
Property Value to Household Income Ratio in Hill City
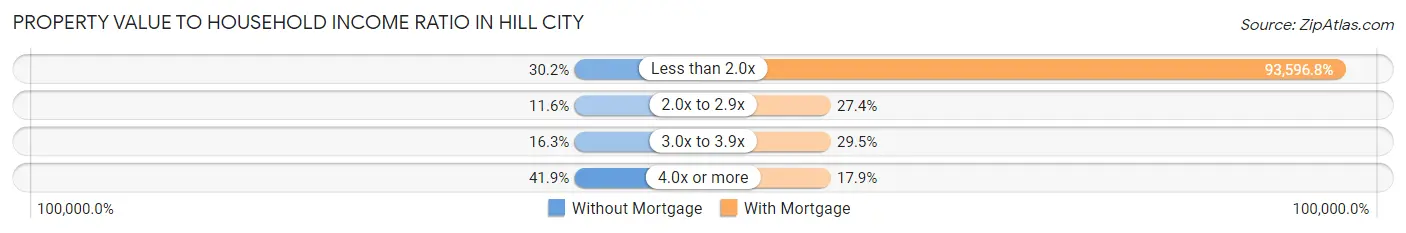
| Value-to-Income Ratio | Without Mortgage | With Mortgage |
| Less than 2.0x | 26 (30.2%) | 88,917 (93,596.8%) |
| 2.0x to 2.9x | 10 (11.6%) | 26 (27.4%) |
| 3.0x to 3.9x | 14 (16.3%) | 28 (29.5%) |
| 4.0x or more | 36 (41.9%) | 17 (17.9%) |
| Total | 86 (100.0%) | 95 (100.0%) |
Real Estate Taxes by Mortgage Status in Hill City
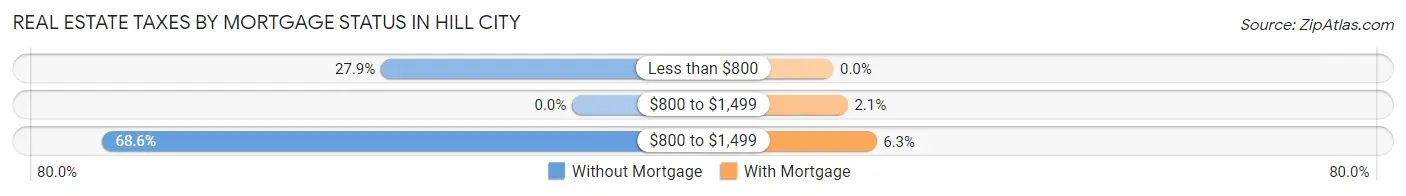
| Property Taxes | Without Mortgage | With Mortgage |
| Less than $800 | 24 (27.9%) | 0 (0.0%) |
| $800 to $1,499 | 0 (0.0%) | 2 (2.1%) |
| $800 to $1,499 | 59 (68.6%) | 6 (6.3%) |
| Total | 86 (100.0%) | 95 (100.0%) |
Health & Disability in Hill City
Health Insurance Coverage by Age in Hill City
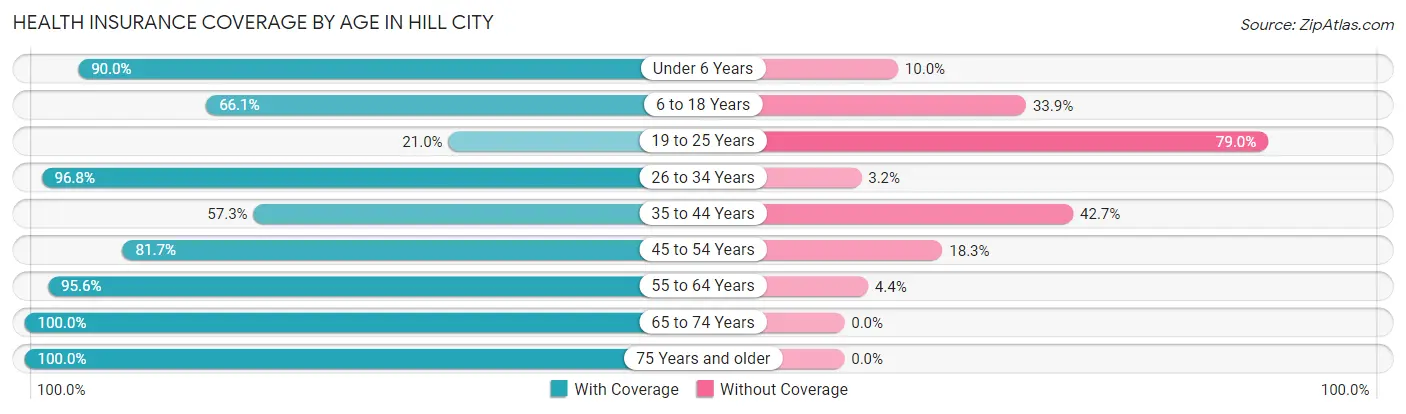
| Age Bracket | With Coverage | Without Coverage |
| Under 6 Years | 45 (90.0%) | 5 (10.0%) |
| 6 to 18 Years | 80 (66.1%) | 41 (33.9%) |
| 19 to 25 Years | 13 (21.0%) | 49 (79.0%) |
| 26 to 34 Years | 61 (96.8%) | 2 (3.2%) |
| 35 to 44 Years | 43 (57.3%) | 32 (42.7%) |
| 45 to 54 Years | 67 (81.7%) | 15 (18.3%) |
| 55 to 64 Years | 87 (95.6%) | 4 (4.4%) |
| 65 to 74 Years | 70 (100.0%) | 0 (0.0%) |
| 75 Years and older | 16 (100.0%) | 0 (0.0%) |
| Total | 482 (76.5%) | 148 (23.5%) |
Health Insurance Coverage by Citizenship Status in Hill City
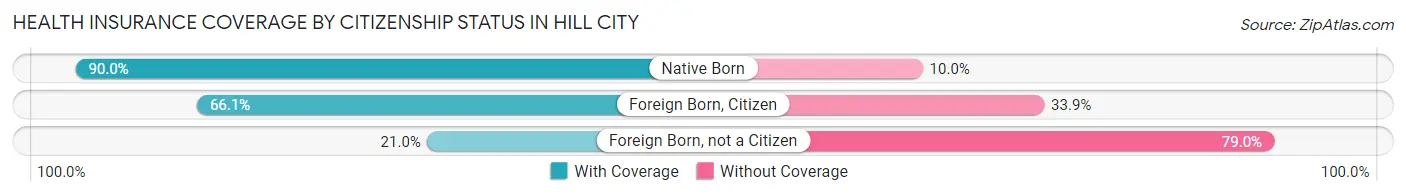
| Citizenship Status | With Coverage | Without Coverage |
| Native Born | 45 (90.0%) | 5 (10.0%) |
| Foreign Born, Citizen | 80 (66.1%) | 41 (33.9%) |
| Foreign Born, not a Citizen | 13 (21.0%) | 49 (79.0%) |
Health Insurance Coverage by Household Income in Hill City
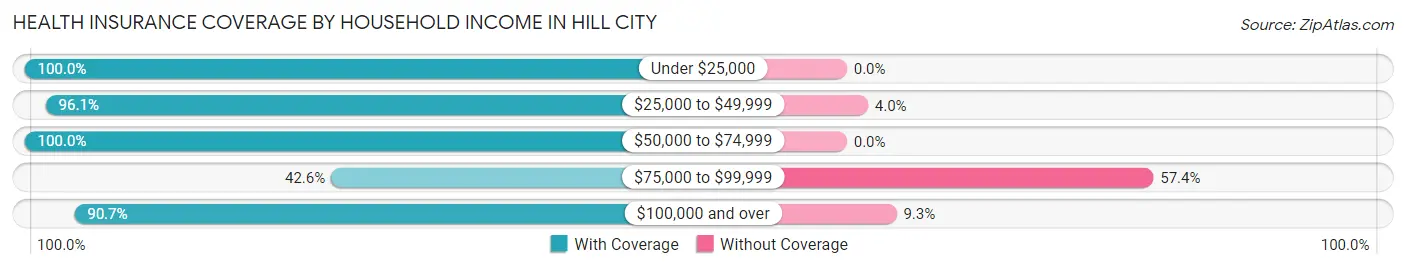
| Household Income | With Coverage | Without Coverage |
| Under $25,000 | 26 (100.0%) | 0 (0.0%) |
| $25,000 to $49,999 | 73 (96.1%) | 3 (4.0%) |
| $50,000 to $74,999 | 65 (100.0%) | 0 (0.0%) |
| $75,000 to $99,999 | 89 (42.6%) | 120 (57.4%) |
| $100,000 and over | 224 (90.7%) | 23 (9.3%) |
Public vs Private Health Insurance Coverage by Age in Hill City
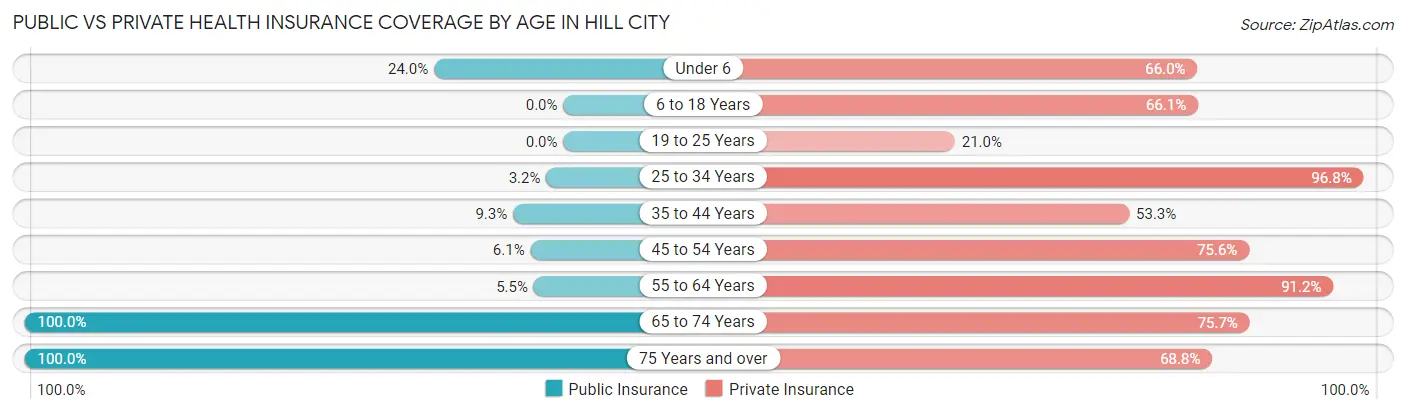
| Age Bracket | Public Insurance | Private Insurance |
| Under 6 | 12 (24.0%) | 33 (66.0%) |
| 6 to 18 Years | 0 (0.0%) | 80 (66.1%) |
| 19 to 25 Years | 0 (0.0%) | 13 (21.0%) |
| 25 to 34 Years | 2 (3.2%) | 61 (96.8%) |
| 35 to 44 Years | 7 (9.3%) | 40 (53.3%) |
| 45 to 54 Years | 5 (6.1%) | 62 (75.6%) |
| 55 to 64 Years | 5 (5.5%) | 83 (91.2%) |
| 65 to 74 Years | 70 (100.0%) | 53 (75.7%) |
| 75 Years and over | 16 (100.0%) | 11 (68.8%) |
| Total | 117 (18.6%) | 436 (69.2%) |
Disability Status by Sex by Age in Hill City
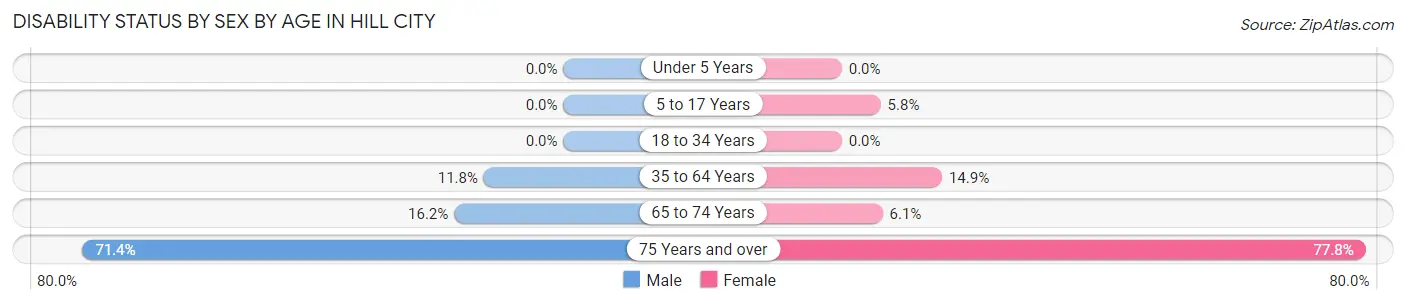
| Age Bracket | Male | Female |
| Under 5 Years | 0 (0.0%) | 0 (0.0%) |
| 5 to 17 Years | 0 (0.0%) | 3 (5.8%) |
| 18 to 34 Years | 0 (0.0%) | 0 (0.0%) |
| 35 to 64 Years | 15 (11.8%) | 18 (14.9%) |
| 65 to 74 Years | 6 (16.2%) | 2 (6.1%) |
| 75 Years and over | 5 (71.4%) | 7 (77.8%) |
Disability Class by Sex by Age in Hill City
Disability Class: Hearing Difficulty
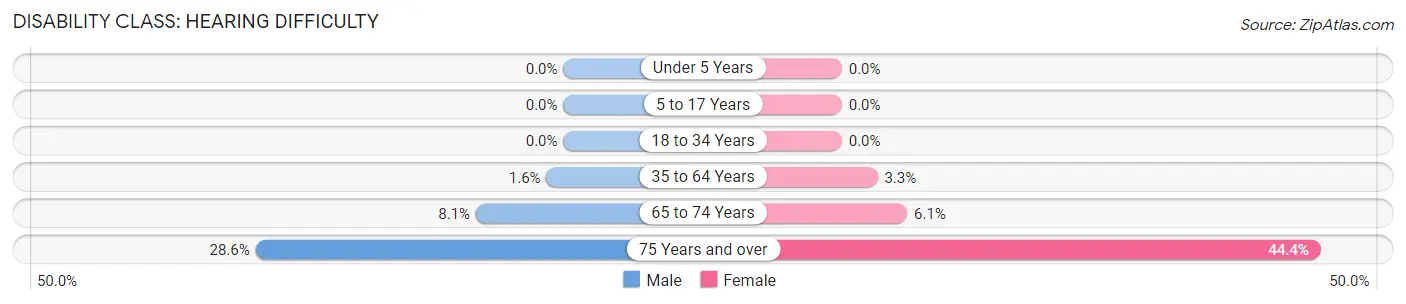
| Age Bracket | Male | Female |
| Under 5 Years | 0 (0.0%) | 0 (0.0%) |
| 5 to 17 Years | 0 (0.0%) | 0 (0.0%) |
| 18 to 34 Years | 0 (0.0%) | 0 (0.0%) |
| 35 to 64 Years | 2 (1.6%) | 4 (3.3%) |
| 65 to 74 Years | 3 (8.1%) | 2 (6.1%) |
| 75 Years and over | 2 (28.6%) | 4 (44.4%) |
Disability Class: Vision Difficulty
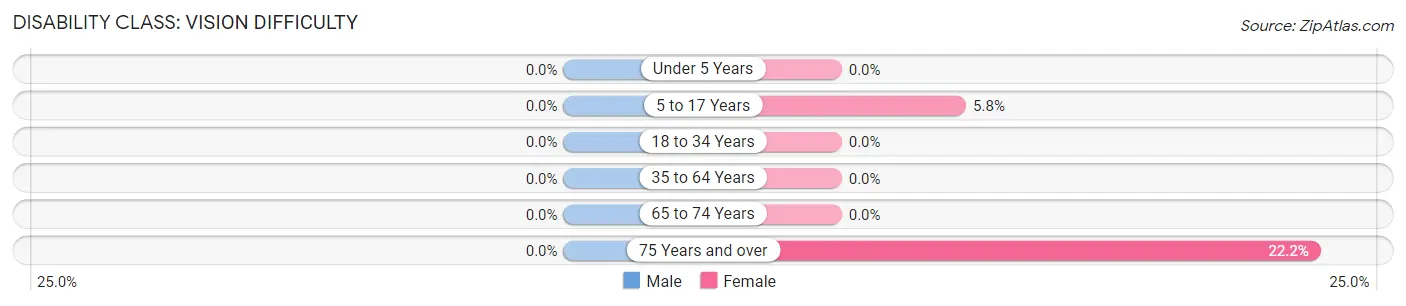
| Age Bracket | Male | Female |
| Under 5 Years | 0 (0.0%) | 0 (0.0%) |
| 5 to 17 Years | 0 (0.0%) | 3 (5.8%) |
| 18 to 34 Years | 0 (0.0%) | 0 (0.0%) |
| 35 to 64 Years | 0 (0.0%) | 0 (0.0%) |
| 65 to 74 Years | 0 (0.0%) | 0 (0.0%) |
| 75 Years and over | 0 (0.0%) | 2 (22.2%) |
Disability Class: Cognitive Difficulty
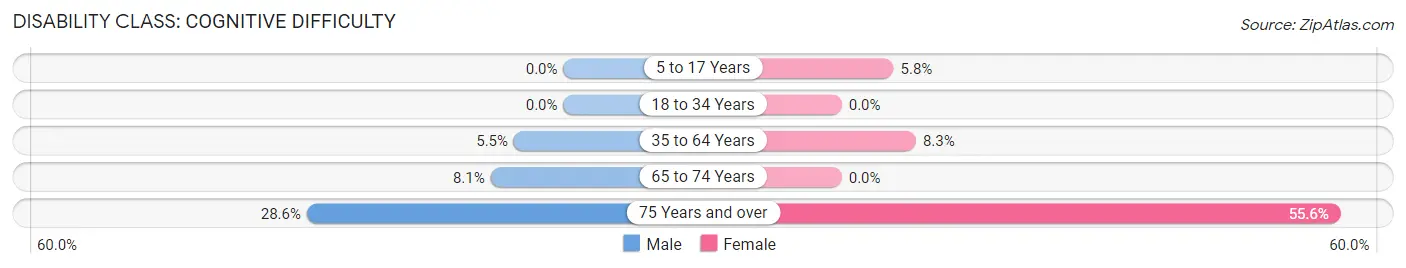
| Age Bracket | Male | Female |
| 5 to 17 Years | 0 (0.0%) | 3 (5.8%) |
| 18 to 34 Years | 0 (0.0%) | 0 (0.0%) |
| 35 to 64 Years | 7 (5.5%) | 10 (8.3%) |
| 65 to 74 Years | 3 (8.1%) | 0 (0.0%) |
| 75 Years and over | 2 (28.6%) | 5 (55.6%) |
Disability Class: Ambulatory Difficulty
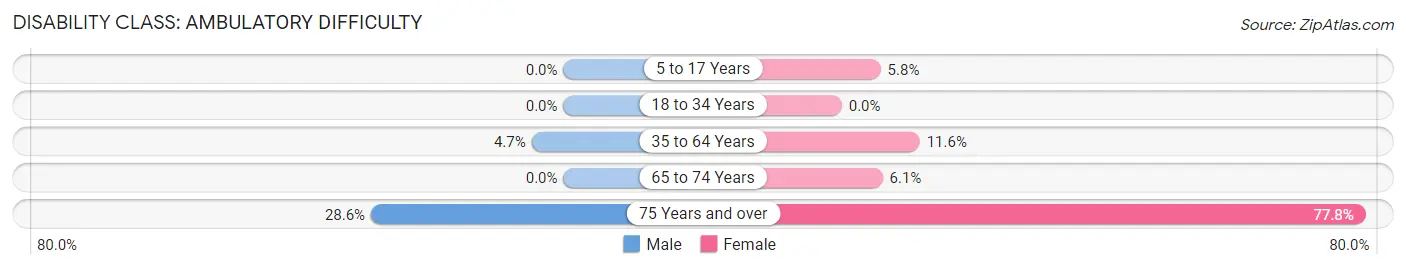
| Age Bracket | Male | Female |
| 5 to 17 Years | 0 (0.0%) | 3 (5.8%) |
| 18 to 34 Years | 0 (0.0%) | 0 (0.0%) |
| 35 to 64 Years | 6 (4.7%) | 14 (11.6%) |
| 65 to 74 Years | 0 (0.0%) | 2 (6.1%) |
| 75 Years and over | 2 (28.6%) | 7 (77.8%) |
Disability Class: Self-Care Difficulty
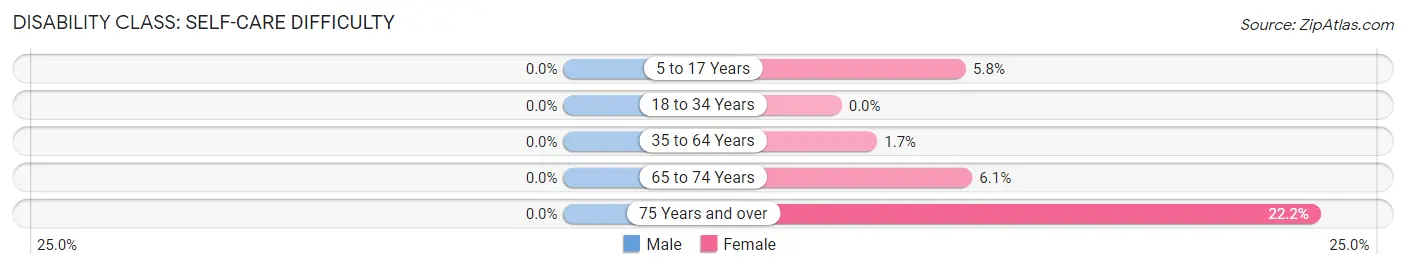
| Age Bracket | Male | Female |
| 5 to 17 Years | 0 (0.0%) | 3 (5.8%) |
| 18 to 34 Years | 0 (0.0%) | 0 (0.0%) |
| 35 to 64 Years | 0 (0.0%) | 2 (1.7%) |
| 65 to 74 Years | 0 (0.0%) | 2 (6.1%) |
| 75 Years and over | 0 (0.0%) | 2 (22.2%) |
Technology Access in Hill City
Computing Device Access in Hill City
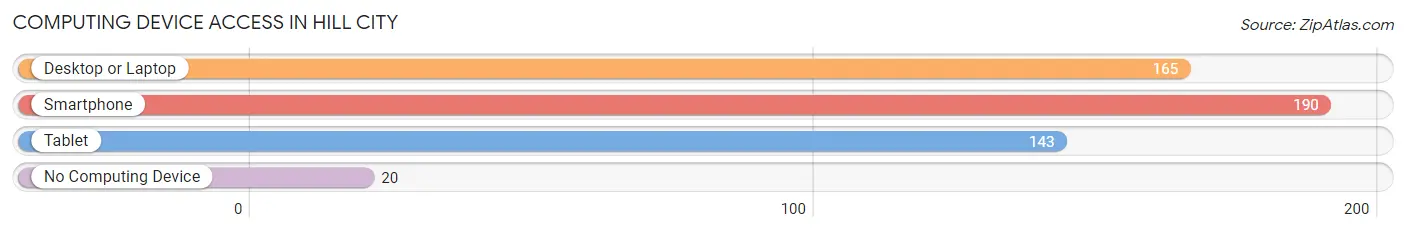
| Device Type | # Households | % Households |
| Desktop or Laptop | 165 | 75.0% |
| Smartphone | 190 | 86.4% |
| Tablet | 143 | 65.0% |
| No Computing Device | 20 | 9.1% |
| Total | 220 | 100.0% |
Internet Access in Hill City
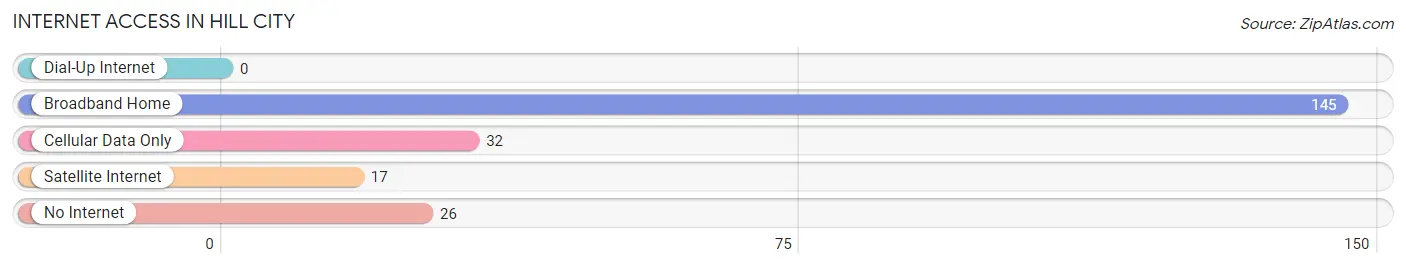
| Internet Type | # Households | % Households |
| Dial-Up Internet | 0 | 0.0% |
| Broadband Home | 145 | 65.9% |
| Cellular Data Only | 32 | 14.5% |
| Satellite Internet | 17 | 7.7% |
| No Internet | 26 | 11.8% |
| Total | 220 | 100.0% |
Hill City Summary
Hill City, South Dakota is a small town located in the Black Hills of South Dakota. It is the county seat of Pennington County and is located about 25 miles southwest of Rapid City. The town was founded in 1876 and is the oldest continuously inhabited town in the Black Hills. The population of Hill City was 1,621 at the 2010 census.
Geography
Hill City is located at 44°3′17″N 103°30′17″W (44.054722, -103.504722). According to the United States Census Bureau, the town has a total area of 0.9 square miles (2.3 km2), all of it land.
The town is located in the Black Hills of South Dakota, a mountain range that is part of the Great Plains. The Black Hills are home to many species of wildlife, including bighorn sheep, elk, deer, and mountain lions. The area is also known for its abundance of pine trees and other vegetation.
Economy
Hill City is a small town with a population of just over 1,600 people. The town is home to several businesses, including restaurants, hotels, and retail stores. The town is also home to several tourist attractions, including the 1880 Train, a historic steam locomotive that runs between Hill City and Keystone.
The town is also home to several manufacturing companies, including a furniture manufacturer, a woodworking company, and a metal fabrication company. The town is also home to several service-based businesses, including a law firm, a real estate agency, and a financial services company.
Demographics
As of the 2010 census, Hill City had a population of 1,621. The racial makeup of the town was 95.2% White, 0.2% African American, 0.7% Native American, 0.3% Asian, 0.1% Pacific Islander, 1.2% from other races, and 2.4% from two or more races. Hispanic or Latino of any race were 3.2% of the population.
The median income for a household in Hill City was $37,917, and the median income for a family was $45,625. Males had a median income of $30,938 versus $21,250 for females. The per capita income for the town was $18,945. About 8.2% of families and 10.3% of the population were below the poverty line, including 14.2% of those under age 18 and 8.3% of those age 65 or over.
Conclusion
Hill City, South Dakota is a small town located in the Black Hills of South Dakota. It is the county seat of Pennington County and is located about 25 miles southwest of Rapid City. The town was founded in 1876 and is the oldest continuously inhabited town in the Black Hills. The population of Hill City was 1,621 at the 2010 census. The town is home to several businesses, including restaurants, hotels, and retail stores. The town is also home to several tourist attractions, including the 1880 Train, a historic steam locomotive that runs between Hill City and Keystone. The racial makeup of the town was 95.2% White, 0.2% African American, 0.7% Native American, 0.3% Asian, 0.1% Pacific Islander, 1.2% from other races, and 2.4% from two or more races. The median income for a household in Hill City was $37,917, and the median income for a family was $45,625. Hill City is a small town with a rich history and a vibrant economy.
Common Questions
What is Per Capita Income in Hill City?
Per Capita income in Hill City is $29,923.
What is the Median Family Income in Hill City?
Median Family Income in Hill City is $89,250.
What is the Median Household income in Hill City?
Median Household Income in Hill City is $76,500.
What is Income or Wage Gap in Hill City?
Income or Wage Gap in Hill City is 35.8%.
Women in Hill City earn 64.2 cents for every dollar earned by a man.
What is Inequality or Gini Index in Hill City?
Inequality or Gini Index in Hill City is 0.34.
What is the Total Population of Hill City?
Total Population of Hill City is 630.
What is the Total Male Population of Hill City?
Total Male Population of Hill City is 355.
What is the Total Female Population of Hill City?
Total Female Population of Hill City is 275.
What is the Ratio of Males per 100 Females in Hill City?
There are 129.09 Males per 100 Females in Hill City.
What is the Ratio of Females per 100 Males in Hill City?
There are 77.46 Females per 100 Males in Hill City.
What is the Median Population Age in Hill City?
Median Population Age in Hill City is 40.0 Years.
What is the Average Family Size in Hill City
Average Family Size in Hill City is 3.4 People.
What is the Average Household Size in Hill City
Average Household Size in Hill City is 2.8 People.
How Large is the Labor Force in Hill City?
There are 373 People in the Labor Forcein in Hill City.
What is the Percentage of People in the Labor Force in Hill City?
76.3% of People are in the Labor Force in Hill City.