Crooks, SD Map & Demographics
Crooks Map
Crooks Overview
$57,934
PER CAPITA INCOME
$117,609
AVG FAMILY INCOME
$113,917
AVG HOUSEHOLD INCOME
29.9%
WAGE / INCOME GAP [ % ]
70.1¢/ $1
WAGE / INCOME GAP [ $ ]
0.42
INEQUALITY / GINI INDEX
1,463
TOTAL POPULATION
759
MALE POPULATION
704
FEMALE POPULATION
107.81
MALES / 100 FEMALES
92.75
FEMALES / 100 MALES
39.5
MEDIAN AGE
3.1
AVG FAMILY SIZE
2.9
AVG HOUSEHOLD SIZE
977
LABOR FORCE [ PEOPLE ]
84.8%
PERCENT IN LABOR FORCE
2.0%
UNEMPLOYMENT RATE
Crooks Zip Codes
Crooks Area Codes
Income in Crooks
Income Overview in Crooks
Per Capita Income in Crooks is $57,934, while median incomes of families and households are $117,609 and $113,917 respectively.
| Characteristic | Number | Measure |
| Per Capita Income | 1,463 | $57,934 |
| Median Family Income | 404 | $117,609 |
| Mean Family Income | 404 | $123,337 |
| Median Household Income | 503 | $113,917 |
| Mean Household Income | 503 | $148,714 |
| Income Deficit | 404 | $0 |
| Wage / Income Gap (%) | 1,463 | 29.87% |
| Wage / Income Gap ($) | 1,463 | 70.13¢ per $1 |
| Gini / Inequality Index | 1,463 | 0.42 |
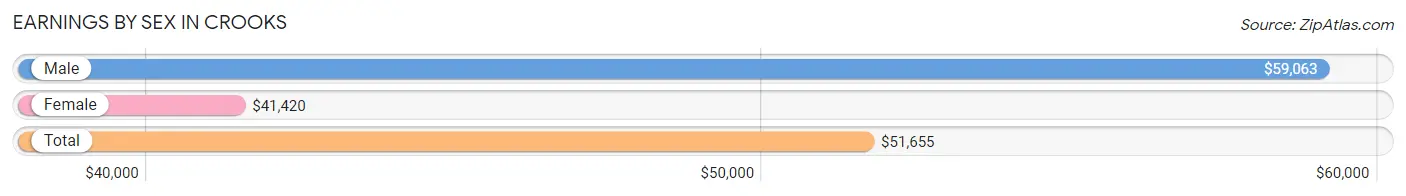
Earnings by Sex in Crooks
Average Earnings in Crooks are $51,655, $59,063 for men and $41,420 for women, a difference of 29.9%.
| Sex | Number | Average Earnings |
| Male | 554 (55.7%) | $59,063 |
| Female | 441 (44.3%) | $41,420 |
| Total | 995 (100.0%) | $51,655 |
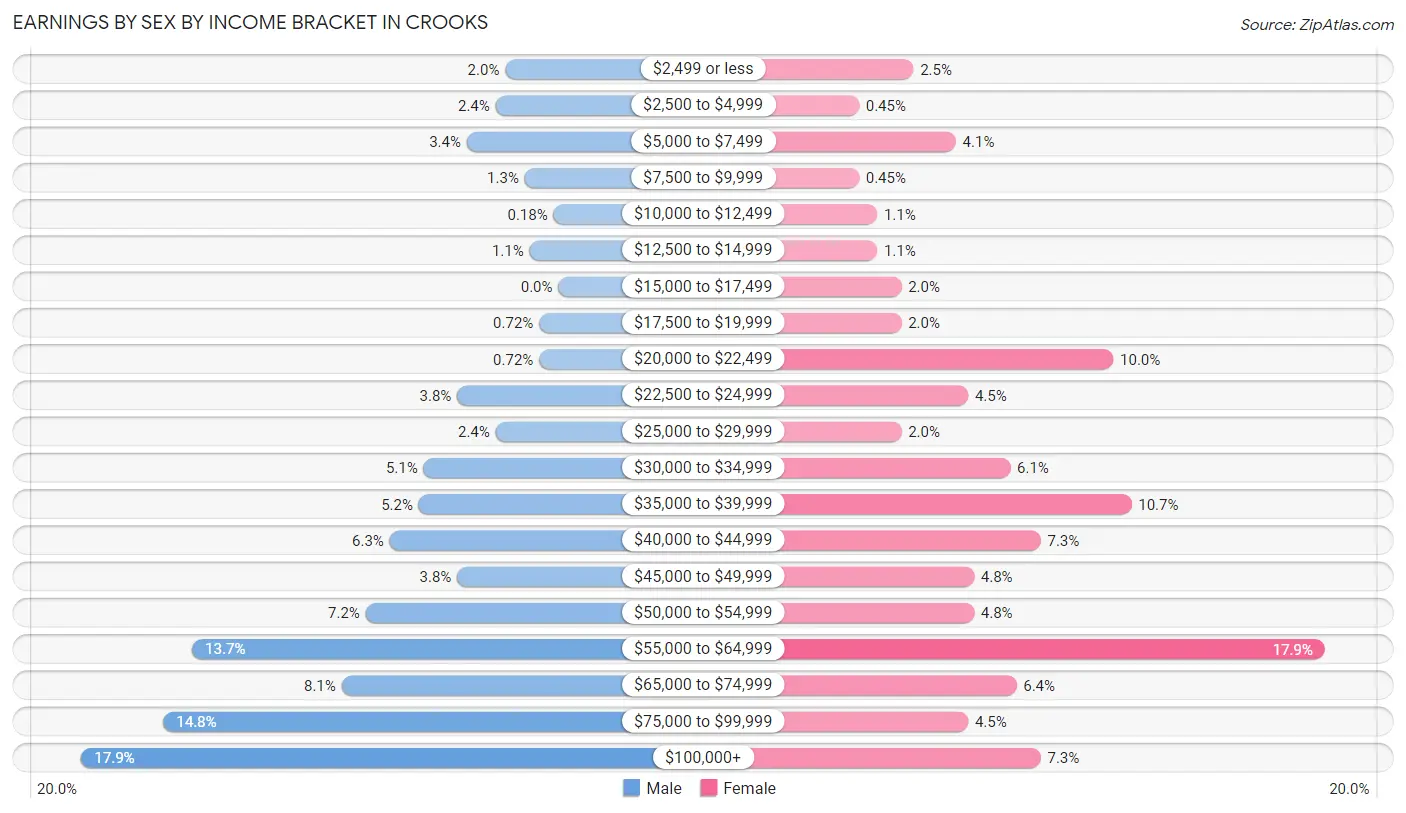
Earnings by Sex by Income Bracket in Crooks
The most common earnings brackets in Crooks are $100,000+ for men (99 | 17.9%) and $55,000 to $64,999 for women (79 | 17.9%).
| Income | Male | Female |
| $2,499 or less | 11 (2.0%) | 11 (2.5%) |
| $2,500 to $4,999 | 13 (2.4%) | 2 (0.4%) |
| $5,000 to $7,499 | 19 (3.4%) | 18 (4.1%) |
| $7,500 to $9,999 | 7 (1.3%) | 2 (0.4%) |
| $10,000 to $12,499 | 1 (0.2%) | 5 (1.1%) |
| $12,500 to $14,999 | 6 (1.1%) | 5 (1.1%) |
| $15,000 to $17,499 | 0 (0.0%) | 9 (2.0%) |
| $17,500 to $19,999 | 4 (0.7%) | 9 (2.0%) |
| $20,000 to $22,499 | 4 (0.7%) | 44 (10.0%) |
| $22,500 to $24,999 | 21 (3.8%) | 20 (4.5%) |
| $25,000 to $29,999 | 13 (2.4%) | 9 (2.0%) |
| $30,000 to $34,999 | 28 (5.1%) | 27 (6.1%) |
| $35,000 to $39,999 | 29 (5.2%) | 47 (10.7%) |
| $40,000 to $44,999 | 35 (6.3%) | 32 (7.3%) |
| $45,000 to $49,999 | 21 (3.8%) | 21 (4.8%) |
| $50,000 to $54,999 | 40 (7.2%) | 21 (4.8%) |
| $55,000 to $64,999 | 76 (13.7%) | 79 (17.9%) |
| $65,000 to $74,999 | 45 (8.1%) | 28 (6.4%) |
| $75,000 to $99,999 | 82 (14.8%) | 20 (4.5%) |
| $100,000+ | 99 (17.9%) | 32 (7.3%) |
| Total | 554 (100.0%) | 441 (100.0%) |
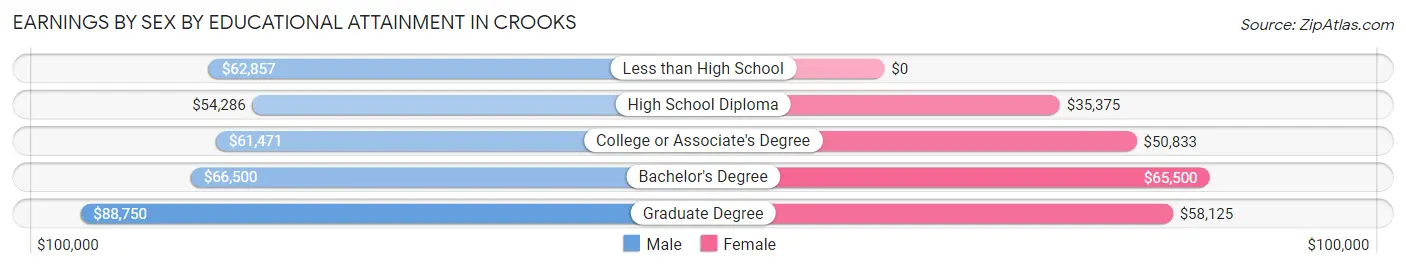
Earnings by Sex by Educational Attainment in Crooks
Average earnings in Crooks are $63,333 for men and $43,125 for women, a difference of 31.9%. Men with an educational attainment of graduate degree enjoy the highest average annual earnings of $88,750, while those with high school diploma education earn the least with $54,286. Women with an educational attainment of bachelor's degree earn the most with the average annual earnings of $65,500, while those with high school diploma education have the smallest earnings of $35,375.
| Educational Attainment | Male Income | Female Income |
| Less than High School | $62,857 | $0 |
| High School Diploma | $54,286 | $35,375 |
| College or Associate's Degree | $61,471 | $50,833 |
| Bachelor's Degree | $66,500 | $65,500 |
| Graduate Degree | $88,750 | $58,125 |
| Total | $63,333 | $43,125 |
Family Income in Crooks
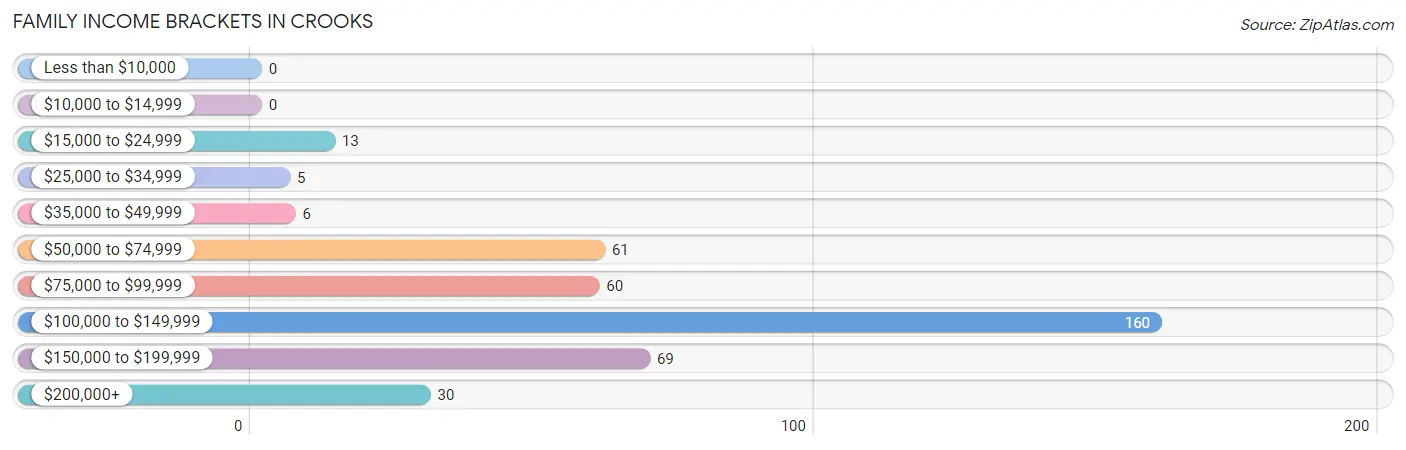
Family Income Brackets in Crooks
According to the Crooks family income data, there are 160 families falling into the $100,000 to $149,999 income range, which is the most common income bracket and makes up 39.6% of all families.
| Income Bracket | # Families | % Families |
| Less than $10,000 | 0 | 0.0% |
| $10,000 to $14,999 | 0 | 0.0% |
| $15,000 to $24,999 | 13 | 3.2% |
| $25,000 to $34,999 | 5 | 1.2% |
| $35,000 to $49,999 | 6 | 1.5% |
| $50,000 to $74,999 | 61 | 15.1% |
| $75,000 to $99,999 | 60 | 14.9% |
| $100,000 to $149,999 | 160 | 39.6% |
| $150,000 to $199,999 | 69 | 17.1% |
| $200,000+ | 30 | 7.4% |
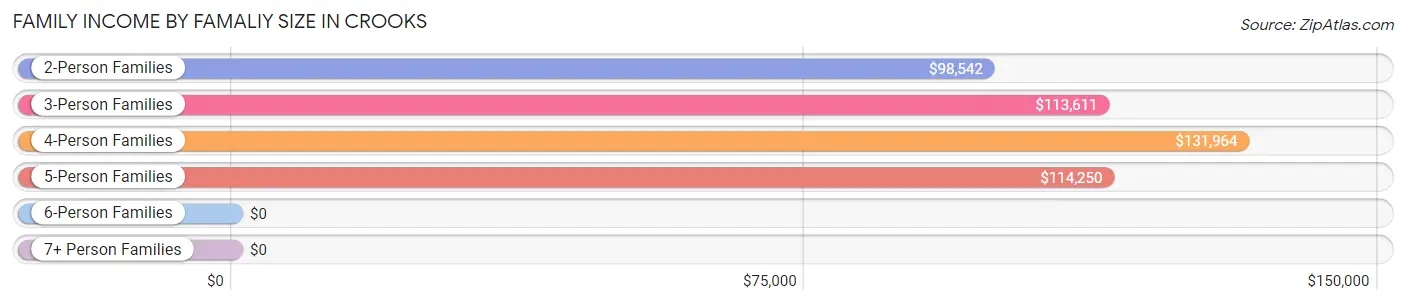
Family Income by Famaliy Size in Crooks
4-person families (96 | 23.8%) account for the highest median family income in Crooks with $131,964 per family, while 2-person families (188 | 46.5%) have the highest median income of $49,271 per family member.
| Income Bracket | # Families | Median Income |
| 2-Person Families | 188 (46.5%) | $98,542 |
| 3-Person Families | 58 (14.4%) | $113,611 |
| 4-Person Families | 96 (23.8%) | $131,964 |
| 5-Person Families | 45 (11.1%) | $114,250 |
| 6-Person Families | 15 (3.7%) | $0 |
| 7+ Person Families | 2 (0.5%) | $0 |
| Total | 404 (100.0%) | $117,609 |
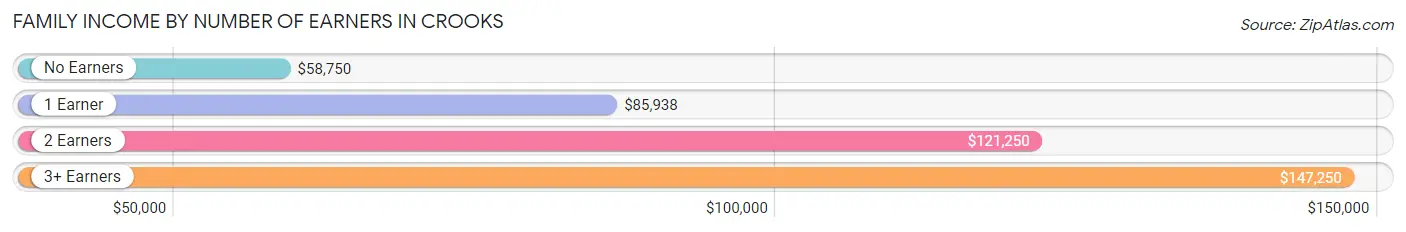
Family Income by Number of Earners in Crooks
The median family income in Crooks is $117,609, with families comprising 3+ earners (73) having the highest median family income of $147,250, while families with no earners (22) have the lowest median family income of $58,750, accounting for 18.1% and 5.4% of families, respectively.
| Number of Earners | # Families | Median Income |
| No Earners | 22 (5.4%) | $58,750 |
| 1 Earner | 81 (20.1%) | $85,938 |
| 2 Earners | 228 (56.4%) | $121,250 |
| 3+ Earners | 73 (18.1%) | $147,250 |
| Total | 404 (100.0%) | $117,609 |
Household Income in Crooks
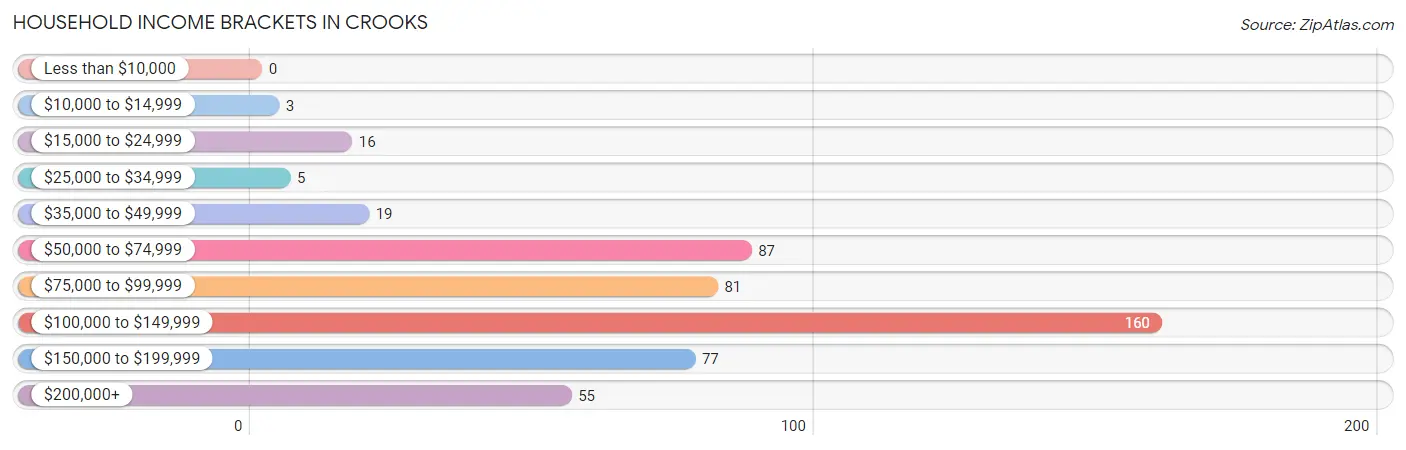
Household Income Brackets in Crooks
With 160 households falling in the category, the $100,000 to $149,999 income range is the most frequent in Crooks, accounting for 31.8% of all households.
| Income Bracket | # Households | % Households |
| Less than $10,000 | 0 | 0.0% |
| $10,000 to $14,999 | 3 | 0.6% |
| $15,000 to $24,999 | 16 | 3.2% |
| $25,000 to $34,999 | 5 | 1.0% |
| $35,000 to $49,999 | 19 | 3.8% |
| $50,000 to $74,999 | 87 | 17.3% |
| $75,000 to $99,999 | 81 | 16.1% |
| $100,000 to $149,999 | 160 | 31.8% |
| $150,000 to $199,999 | 77 | 15.3% |
| $200,000+ | 55 | 10.9% |
Household Income by Householder Age in Crooks
The median household income in Crooks is $113,917, with the highest median household income of $122,361 found in the 25 to 44 years age bracket for the primary householder. A total of 207 households (41.1%) fall into this category. Meanwhile, the 15 to 24 years age bracket for the primary householder has the lowest median household income of $0, with 4 households (0.8%) in this group.
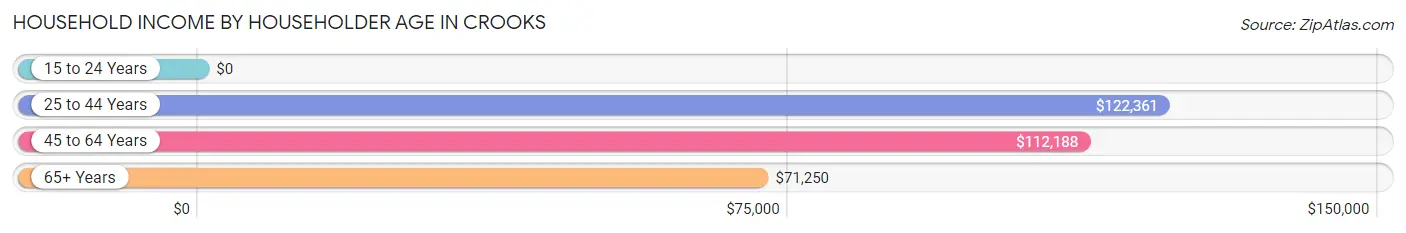
| Income Bracket | # Households | Median Income |
| 15 to 24 Years | 4 (0.8%) | $0 |
| 25 to 44 Years | 207 (41.1%) | $122,361 |
| 45 to 64 Years | 235 (46.7%) | $112,188 |
| 65+ Years | 57 (11.3%) | $71,250 |
| Total | 503 (100.0%) | $113,917 |
Poverty in Crooks
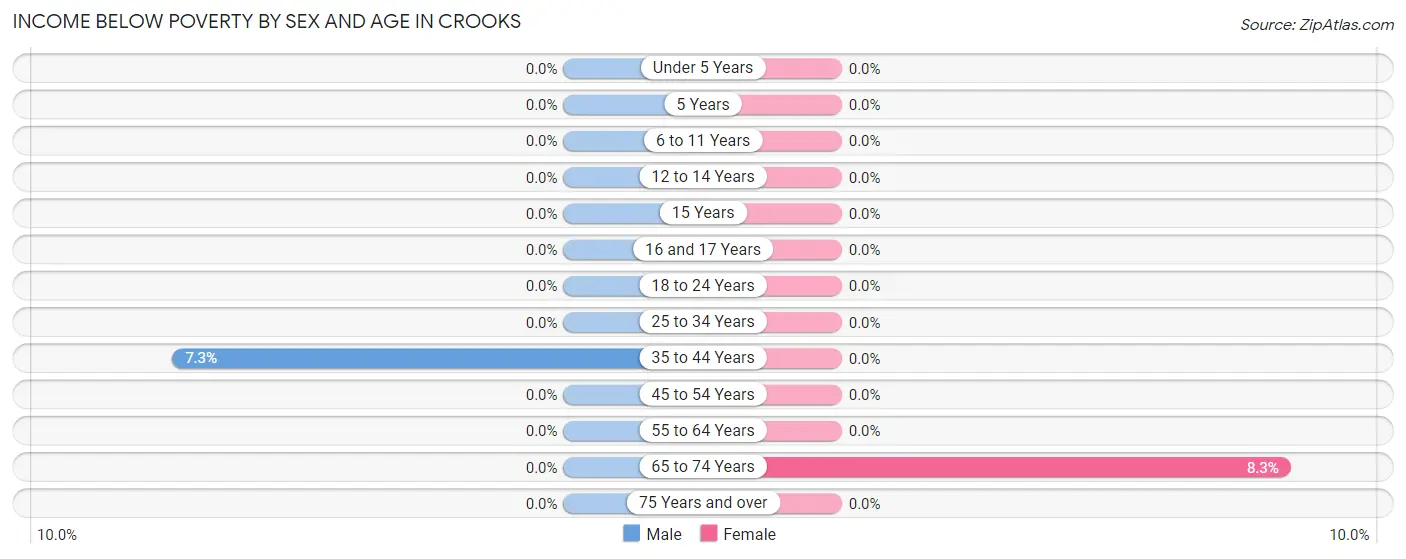
Income Below Poverty by Sex and Age in Crooks
With 1.2% poverty level for males and 0.4% for females among the residents of Crooks, 35 to 44 year old males and 65 to 74 year old females are the most vulnerable to poverty, with 9 males (7.3%) and 3 females (8.3%) in their respective age groups living below the poverty level.
| Age Bracket | Male | Female |
| Under 5 Years | 0 (0.0%) | 0 (0.0%) |
| 5 Years | 0 (0.0%) | 0 (0.0%) |
| 6 to 11 Years | 0 (0.0%) | 0 (0.0%) |
| 12 to 14 Years | 0 (0.0%) | 0 (0.0%) |
| 15 Years | 0 (0.0%) | 0 (0.0%) |
| 16 and 17 Years | 0 (0.0%) | 0 (0.0%) |
| 18 to 24 Years | 0 (0.0%) | 0 (0.0%) |
| 25 to 34 Years | 0 (0.0%) | 0 (0.0%) |
| 35 to 44 Years | 9 (7.3%) | 0 (0.0%) |
| 45 to 54 Years | 0 (0.0%) | 0 (0.0%) |
| 55 to 64 Years | 0 (0.0%) | 0 (0.0%) |
| 65 to 74 Years | 0 (0.0%) | 3 (8.3%) |
| 75 Years and over | 0 (0.0%) | 0 (0.0%) |
| Total | 9 (1.2%) | 3 (0.4%) |
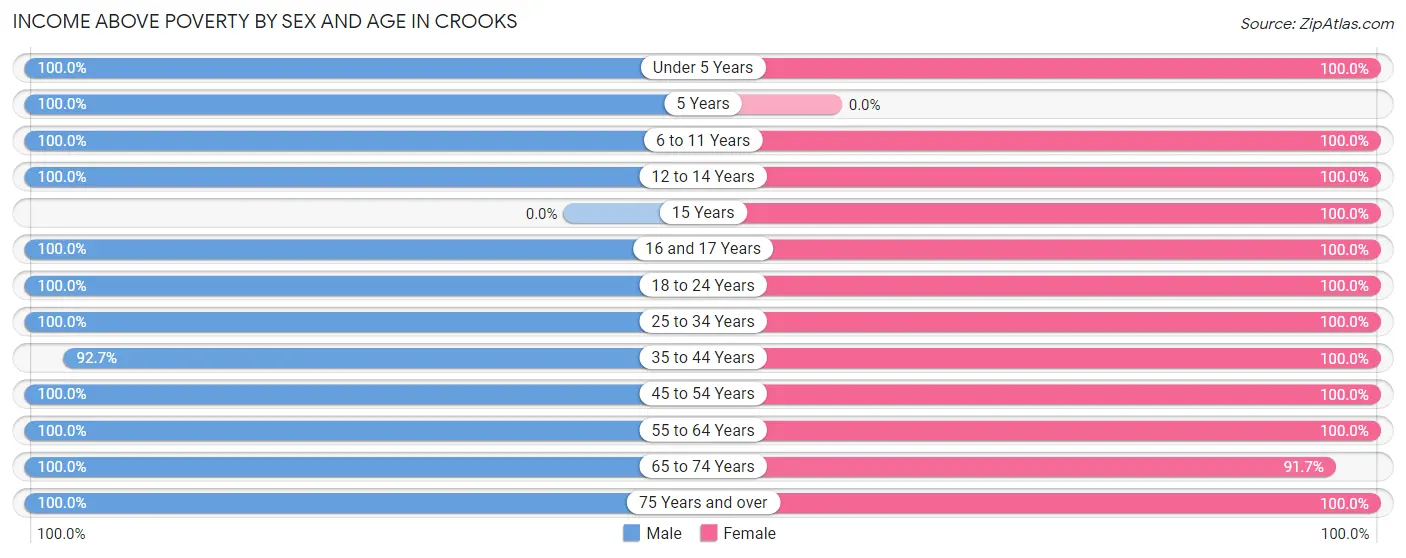
Income Above Poverty by Sex and Age in Crooks
According to the poverty statistics in Crooks, males aged under 5 years and females aged under 5 years are the age groups that are most secure financially, with 100.0% of males and 100.0% of females in these age groups living above the poverty line.
| Age Bracket | Male | Female |
| Under 5 Years | 44 (100.0%) | 66 (100.0%) |
| 5 Years | 7 (100.0%) | 0 (0.0%) |
| 6 to 11 Years | 64 (100.0%) | 42 (100.0%) |
| 12 to 14 Years | 43 (100.0%) | 38 (100.0%) |
| 15 Years | 0 (0.0%) | 7 (100.0%) |
| 16 and 17 Years | 18 (100.0%) | 18 (100.0%) |
| 18 to 24 Years | 67 (100.0%) | 45 (100.0%) |
| 25 to 34 Years | 101 (100.0%) | 88 (100.0%) |
| 35 to 44 Years | 115 (92.7%) | 118 (100.0%) |
| 45 to 54 Years | 100 (100.0%) | 101 (100.0%) |
| 55 to 64 Years | 146 (100.0%) | 134 (100.0%) |
| 65 to 74 Years | 34 (100.0%) | 33 (91.7%) |
| 75 Years and over | 11 (100.0%) | 11 (100.0%) |
| Total | 750 (98.8%) | 701 (99.6%) |
Income Below Poverty Among Married-Couple Families in Crooks
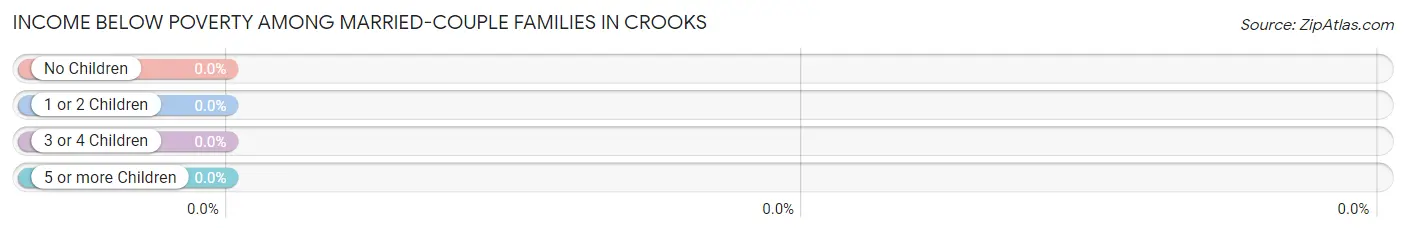
| Children | Above Poverty | Below Poverty |
| No Children | 211 (100.0%) | 0 (0.0%) |
| 1 or 2 Children | 128 (100.0%) | 0 (0.0%) |
| 3 or 4 Children | 21 (100.0%) | 0 (0.0%) |
| 5 or more Children | 2 (100.0%) | 0 (0.0%) |
| Total | 362 (100.0%) | 0 (0.0%) |
Income Below Poverty Among Single-Parent Households in Crooks
| Children | Single Father | Single Mother |
| No Children | 0 (0.0%) | 0 (0.0%) |
| 1 or 2 Children | 0 (0.0%) | 0 (0.0%) |
| 3 or 4 Children | 0 (0.0%) | 0 (0.0%) |
| 5 or more Children | 0 (0.0%) | 0 (0.0%) |
| Total | 0 (0.0%) | 0 (0.0%) |
Income Below Poverty Among Married-Couple vs Single-Parent Households in Crooks
| Children | Married-Couple Families | Single-Parent Households |
| No Children | 0 (0.0%) | 0 (0.0%) |
| 1 or 2 Children | 0 (0.0%) | 0 (0.0%) |
| 3 or 4 Children | 0 (0.0%) | 0 (0.0%) |
| 5 or more Children | 0 (0.0%) | 0 (0.0%) |
| Total | 0 (0.0%) | 0 (0.0%) |
Race in Crooks
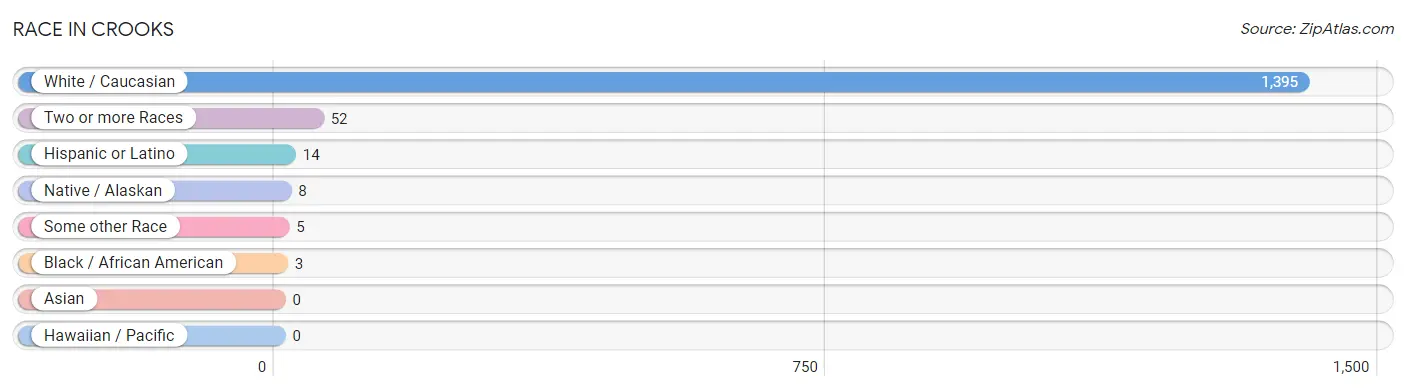
The most populous races in Crooks are White / Caucasian (1,395 | 95.4%), Two or more Races (52 | 3.5%), and Hispanic or Latino (14 | 1.0%).
| Race | # Population | % Population |
| Asian | 0 | 0.0% |
| Black / African American | 3 | 0.2% |
| Hawaiian / Pacific | 0 | 0.0% |
| Hispanic or Latino | 14 | 1.0% |
| Native / Alaskan | 8 | 0.5% |
| White / Caucasian | 1,395 | 95.4% |
| Two or more Races | 52 | 3.5% |
| Some other Race | 5 | 0.3% |
| Total | 1,463 | 100.0% |
Ancestry in Crooks
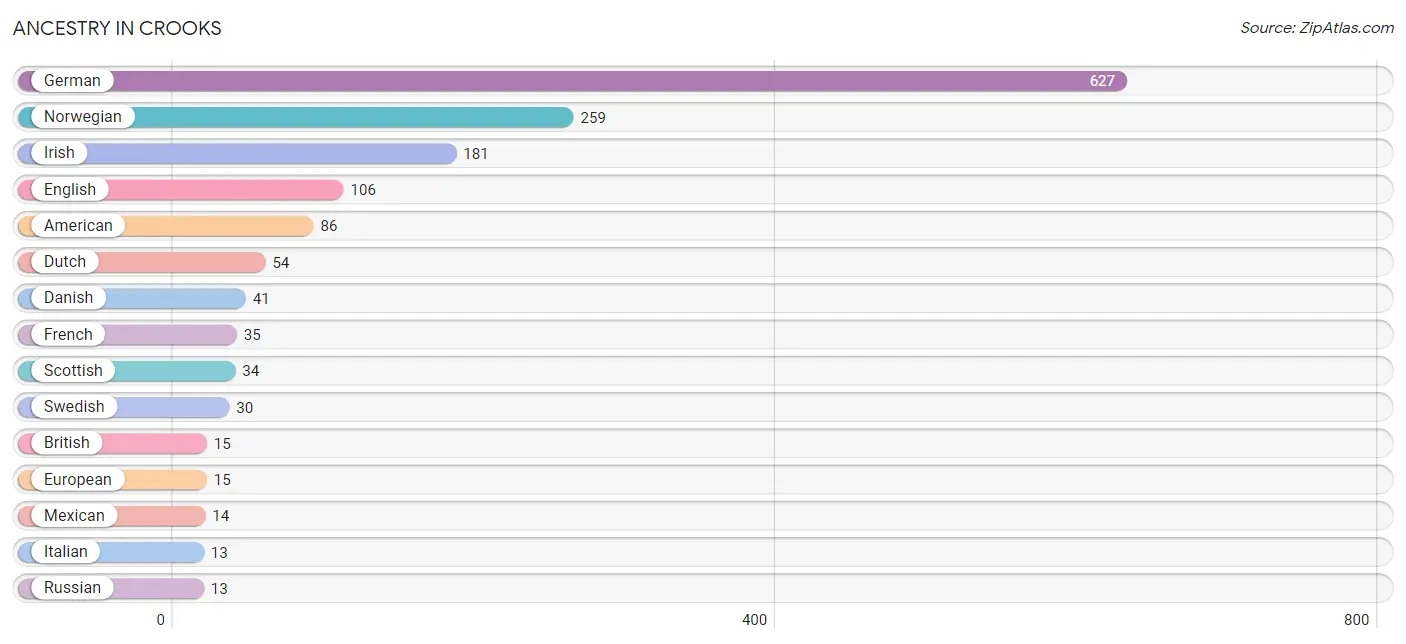
The most populous ancestries reported in Crooks are German (627 | 42.9%), Norwegian (259 | 17.7%), Irish (181 | 12.4%), English (106 | 7.2%), and American (86 | 5.9%), together accounting for 86.1% of all Crooks residents.
| Ancestry | # Population | % Population |
| Alaska Native | 9 | 0.6% |
| American | 86 | 5.9% |
| Blackfeet | 1 | 0.1% |
| British | 15 | 1.0% |
| Danish | 41 | 2.8% |
| Dutch | 54 | 3.7% |
| English | 106 | 7.2% |
| European | 15 | 1.0% |
| French | 35 | 2.4% |
| German | 627 | 42.9% |
| Hungarian | 4 | 0.3% |
| Irish | 181 | 12.4% |
| Italian | 13 | 0.9% |
| Luxembourger | 3 | 0.2% |
| Maltese | 4 | 0.3% |
| Mexican | 14 | 1.0% |
| Norwegian | 259 | 17.7% |
| Polish | 4 | 0.3% |
| Russian | 13 | 0.9% |
| Scandinavian | 8 | 0.5% |
| Scotch-Irish | 8 | 0.5% |
| Scottish | 34 | 2.3% |
| Sioux | 8 | 0.5% |
| Swedish | 30 | 2.1% |
| Swiss | 7 | 0.5% |
| Welsh | 6 | 0.4% | View All 26 Rows |
Immigrants in Crooks
The most numerous immigrant groups reported in Crooks came from , and Canada (4 | 0.3%), together accounting for 0.3% of all Crooks residents.

| Immigration Origin | # Population | % Population |
| Canada | 4 | 0.3% | View All 1 Rows |
Sex and Age in Crooks
Sex and Age in Crooks
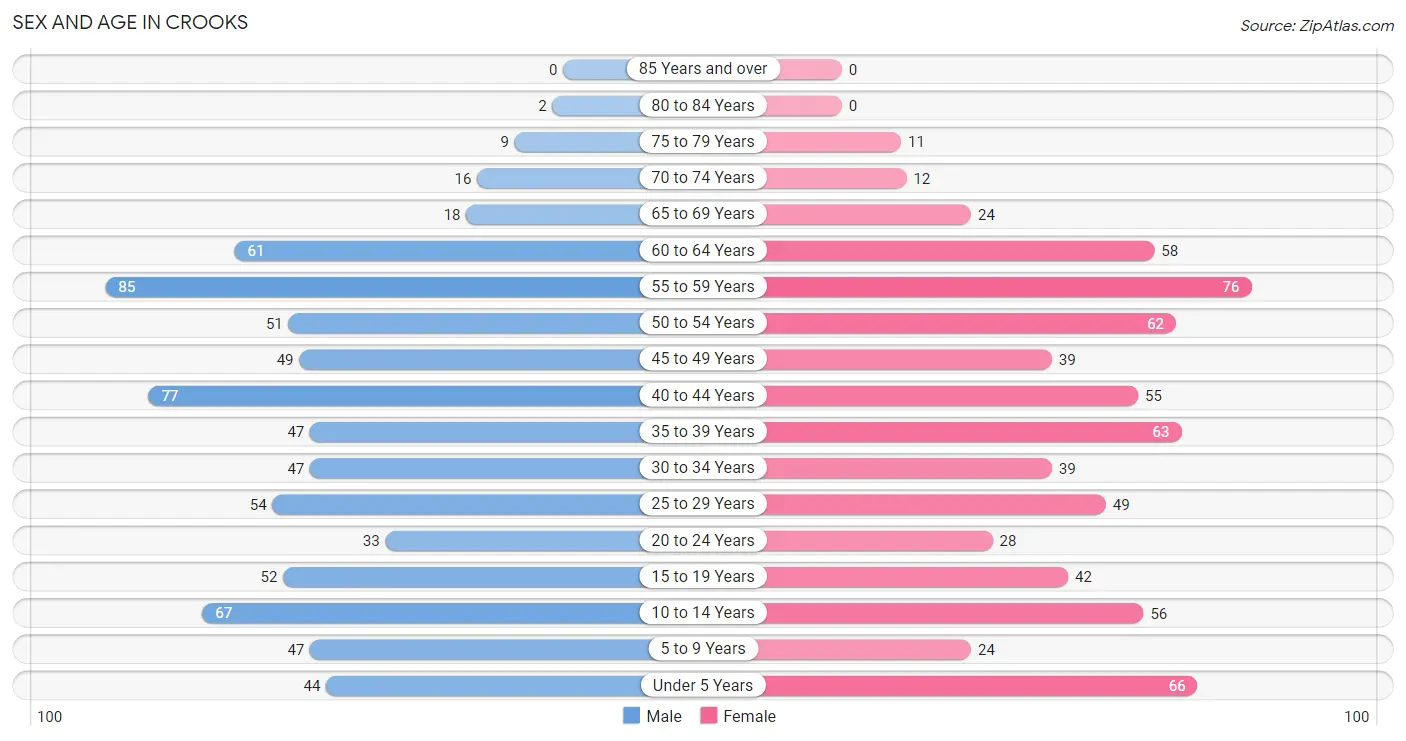
The most populous age groups in Crooks are 55 to 59 Years (85 | 11.2%) for men and 55 to 59 Years (76 | 10.8%) for women.
| Age Bracket | Male | Female |
| Under 5 Years | 44 (5.8%) | 66 (9.4%) |
| 5 to 9 Years | 47 (6.2%) | 24 (3.4%) |
| 10 to 14 Years | 67 (8.8%) | 56 (8.0%) |
| 15 to 19 Years | 52 (6.9%) | 42 (6.0%) |
| 20 to 24 Years | 33 (4.3%) | 28 (4.0%) |
| 25 to 29 Years | 54 (7.1%) | 49 (7.0%) |
| 30 to 34 Years | 47 (6.2%) | 39 (5.5%) |
| 35 to 39 Years | 47 (6.2%) | 63 (8.9%) |
| 40 to 44 Years | 77 (10.1%) | 55 (7.8%) |
| 45 to 49 Years | 49 (6.5%) | 39 (5.5%) |
| 50 to 54 Years | 51 (6.7%) | 62 (8.8%) |
| 55 to 59 Years | 85 (11.2%) | 76 (10.8%) |
| 60 to 64 Years | 61 (8.0%) | 58 (8.2%) |
| 65 to 69 Years | 18 (2.4%) | 24 (3.4%) |
| 70 to 74 Years | 16 (2.1%) | 12 (1.7%) |
| 75 to 79 Years | 9 (1.2%) | 11 (1.6%) |
| 80 to 84 Years | 2 (0.3%) | 0 (0.0%) |
| 85 Years and over | 0 (0.0%) | 0 (0.0%) |
| Total | 759 (100.0%) | 704 (100.0%) |
Families and Households in Crooks
Median Family Size in Crooks
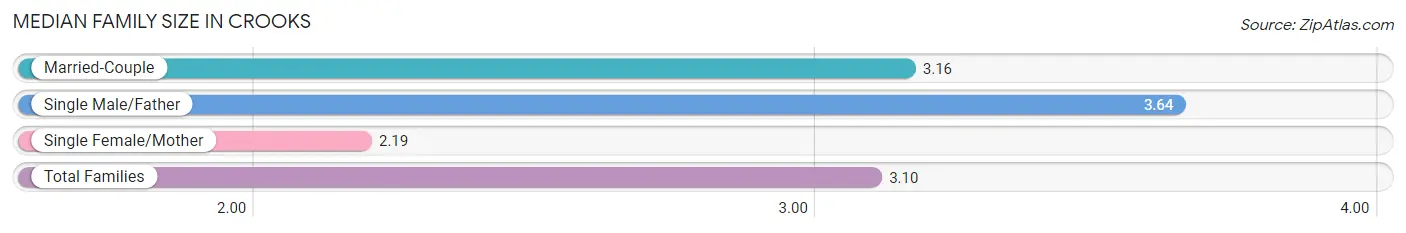
The median family size in Crooks is 3.10 persons per family, with single male/father families (11 | 2.7%) accounting for the largest median family size of 3.64 persons per family. On the other hand, single female/mother families (31 | 7.7%) represent the smallest median family size with 2.19 persons per family.
| Family Type | # Families | Family Size |
| Married-Couple | 362 (89.6%) | 3.16 |
| Single Male/Father | 11 (2.7%) | 3.64 |
| Single Female/Mother | 31 (7.7%) | 2.19 |
| Total Families | 404 (100.0%) | 3.10 |
Median Household Size in Crooks
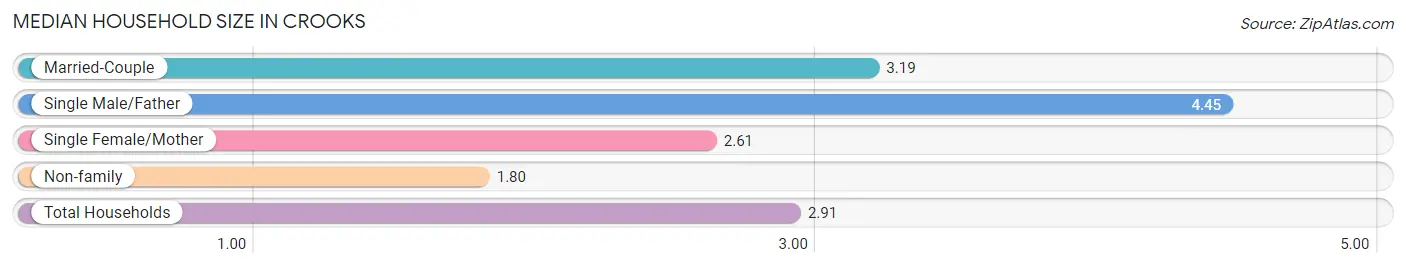
The median household size in Crooks is 2.91 persons per household, with single male/father households (11 | 2.2%) accounting for the largest median household size of 4.45 persons per household. non-family households (99 | 19.7%) represent the smallest median household size with 1.80 persons per household.
| Household Type | # Households | Household Size |
| Married-Couple | 362 (72.0%) | 3.19 |
| Single Male/Father | 11 (2.2%) | 4.45 |
| Single Female/Mother | 31 (6.2%) | 2.61 |
| Non-family | 99 (19.7%) | 1.80 |
| Total Households | 503 (100.0%) | 2.91 |
Household Size by Marriage Status in Crooks
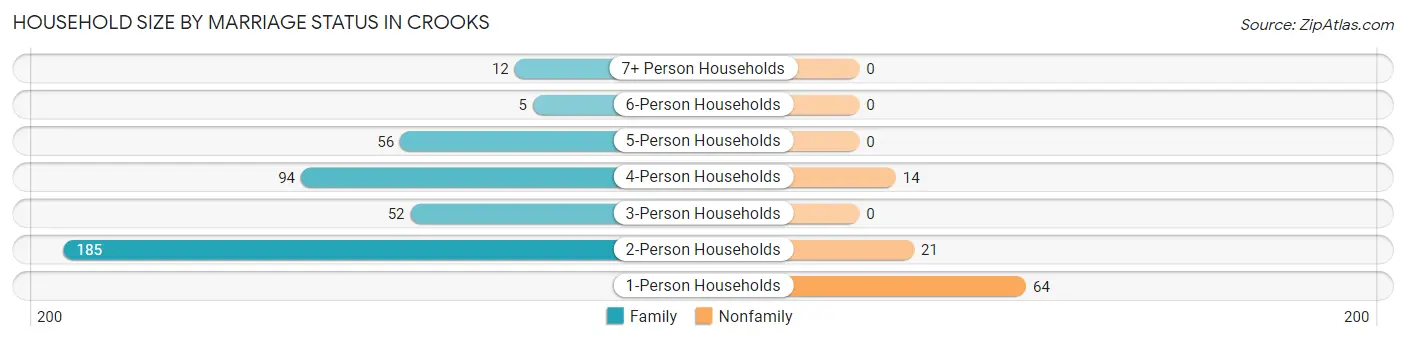
Out of a total of 503 households in Crooks, 404 (80.3%) are family households, while 99 (19.7%) are nonfamily households. The most numerous type of family households are 2-person households, comprising 185, and the most common type of nonfamily households are 1-person households, comprising 64.
| Household Size | Family Households | Nonfamily Households |
| 1-Person Households | - | 64 (12.7%) |
| 2-Person Households | 185 (36.8%) | 21 (4.2%) |
| 3-Person Households | 52 (10.3%) | 0 (0.0%) |
| 4-Person Households | 94 (18.7%) | 14 (2.8%) |
| 5-Person Households | 56 (11.1%) | 0 (0.0%) |
| 6-Person Households | 5 (1.0%) | 0 (0.0%) |
| 7+ Person Households | 12 (2.4%) | 0 (0.0%) |
| Total | 404 (80.3%) | 99 (19.7%) |
Female Fertility in Crooks
Fertility by Age in Crooks
Average fertility rate in Crooks is 31.0 births per 1,000 women. Women in the age bracket of 20 to 34 years have the highest fertility rate with 86.0 births per 1,000 women. Women in the age bracket of 20 to 34 years acount for 100.0% of all women with births.
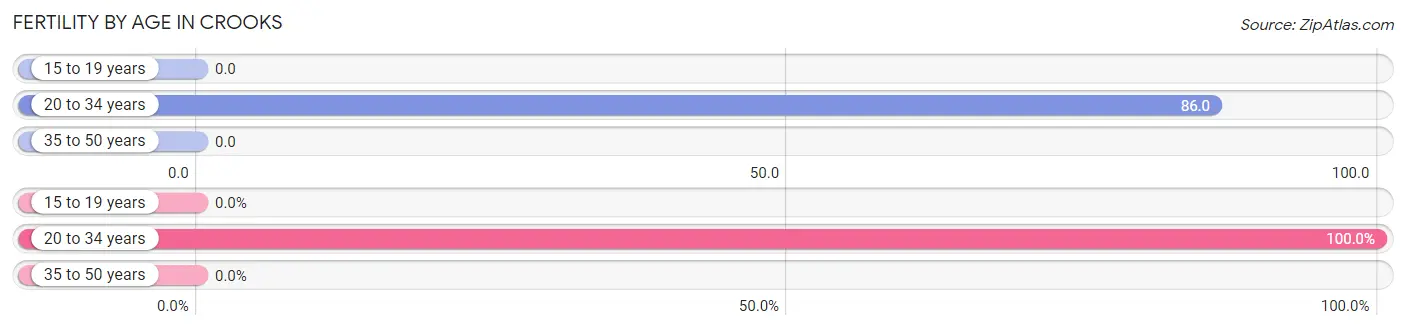
| Age Bracket | Women with Births | Births / 1,000 Women |
| 15 to 19 years | 0 (0.0%) | 0.0 |
| 20 to 34 years | 10 (100.0%) | 86.0 |
| 35 to 50 years | 0 (0.0%) | 0.0 |
| Total | 10 (100.0%) | 31.0 |
Fertility by Age by Marriage Status in Crooks
30.0% of women with births (10) in Crooks are married. The highest percentage of unmarried women with births falls into 20 to 34 years age bracket with 70.0% of them unmarried at the time of birth, while the lowest percentage of unmarried women with births belong to 20 to 34 years age bracket with 70.0% of them unmarried.
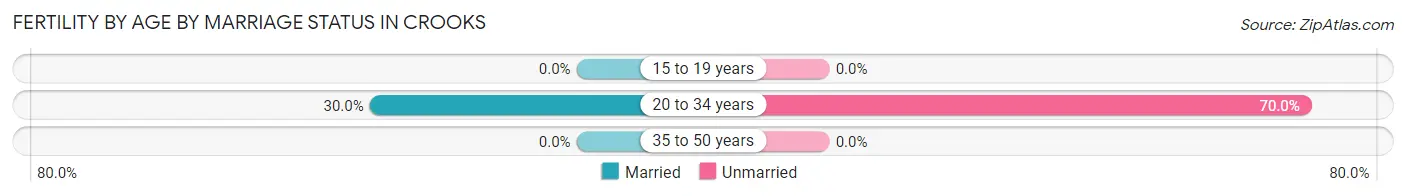
| Age Bracket | Married | Unmarried |
| 15 to 19 years | 0 (0.0%) | 0 (0.0%) |
| 20 to 34 years | 3 (30.0%) | 7 (70.0%) |
| 35 to 50 years | 0 (0.0%) | 0 (0.0%) |
| Total | 3 (30.0%) | 7 (70.0%) |
Fertility by Education in Crooks
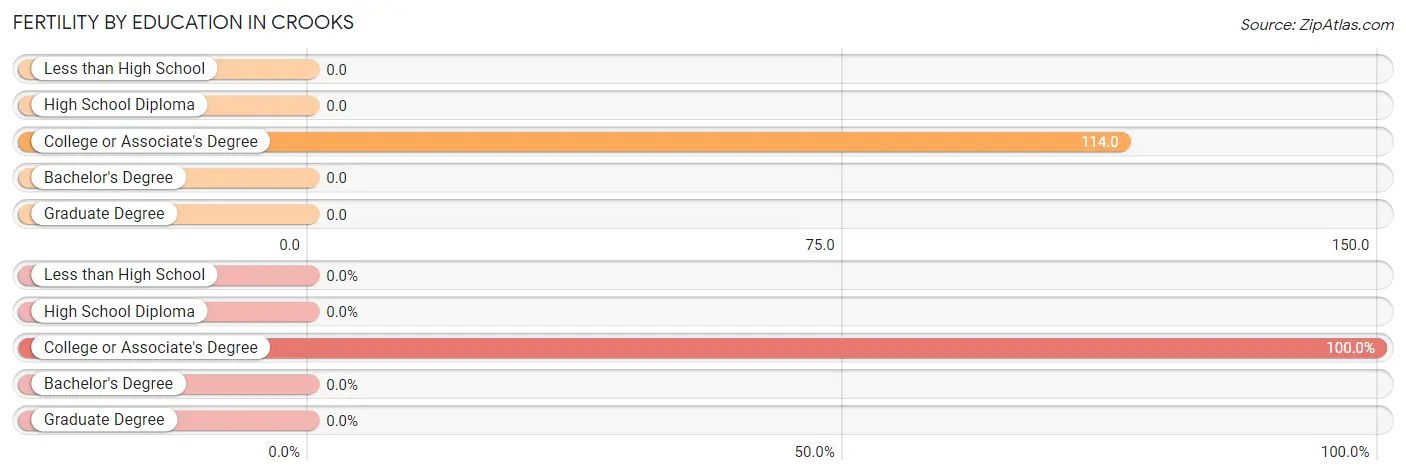
| Educational Attainment | Women with Births | Births / 1,000 Women |
| Less than High School | 0 (0.0%) | 0.0 |
| High School Diploma | 0 (0.0%) | 0.0 |
| College or Associate's Degree | 10 (100.0%) | 114.0 |
| Bachelor's Degree | 0 (0.0%) | 0.0 |
| Graduate Degree | 0 (0.0%) | 0.0 |
| Total | 10 (100.0%) | 31.0 |
Fertility by Education by Marriage Status in Crooks
70.0% of women with births in Crooks are unmarried. Women with the educational attainment of college or associate's degree are most likely to be married with 30.0% of them married at childbirth, while women with the educational attainment of college or associate's degree are least likely to be married with 70.0% of them unmarried at childbirth.
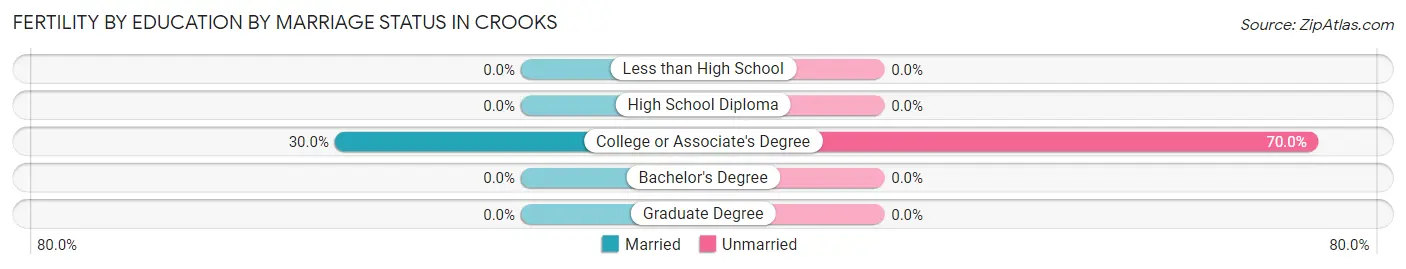
| Educational Attainment | Married | Unmarried |
| Less than High School | 0 (0.0%) | 0 (0.0%) |
| High School Diploma | 0 (0.0%) | 0 (0.0%) |
| College or Associate's Degree | 3 (30.0%) | 7 (70.0%) |
| Bachelor's Degree | 0 (0.0%) | 0 (0.0%) |
| Graduate Degree | 0 (0.0%) | 0 (0.0%) |
| Total | 3 (30.0%) | 7 (70.0%) |
Employment Characteristics in Crooks
Employment by Class of Employer in Crooks
Among the 940 employed individuals in Crooks, private company employees (686 | 73.0%), not-for-profit organizations (138 | 14.7%), and local government employees (45 | 4.8%) make up the most common classes of employment.
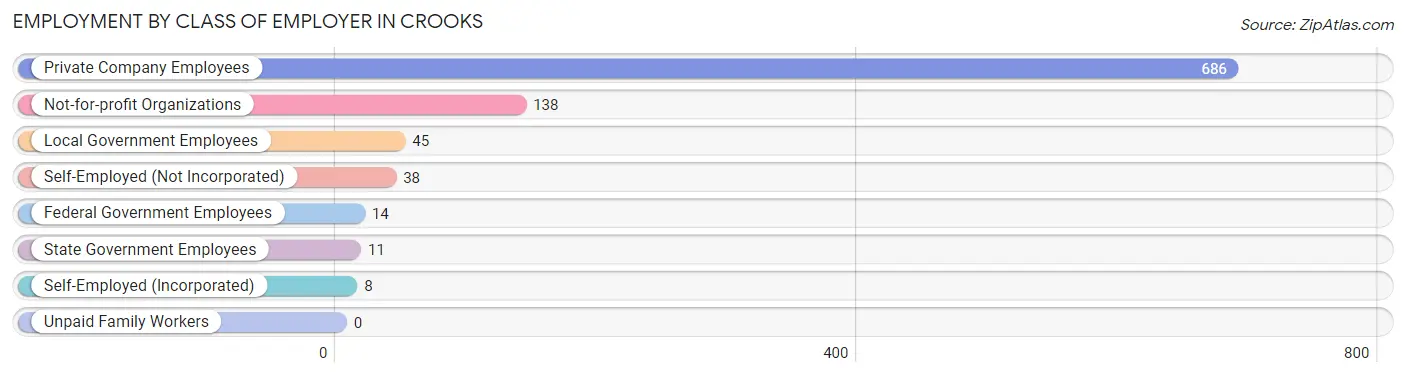
| Employer Class | # Employees | % Employees |
| Private Company Employees | 686 | 73.0% |
| Self-Employed (Incorporated) | 8 | 0.9% |
| Self-Employed (Not Incorporated) | 38 | 4.0% |
| Not-for-profit Organizations | 138 | 14.7% |
| Local Government Employees | 45 | 4.8% |
| State Government Employees | 11 | 1.2% |
| Federal Government Employees | 14 | 1.5% |
| Unpaid Family Workers | 0 | 0.0% |
| Total | 940 | 100.0% |
Employment Status by Age in Crooks
According to the labor force statistics for Crooks, out of the total population over 16 years of age (1,152), 84.8% or 977 individuals are in the labor force, with 2.0% or 20 of them unemployed. The age group with the highest labor force participation rate is 20 to 24 years, with 100.0% or 61 individuals in the labor force. Within the labor force, the 65 to 74 years age range has the highest percentage of unemployed individuals, with 19.6% or 9 of them being unemployed.
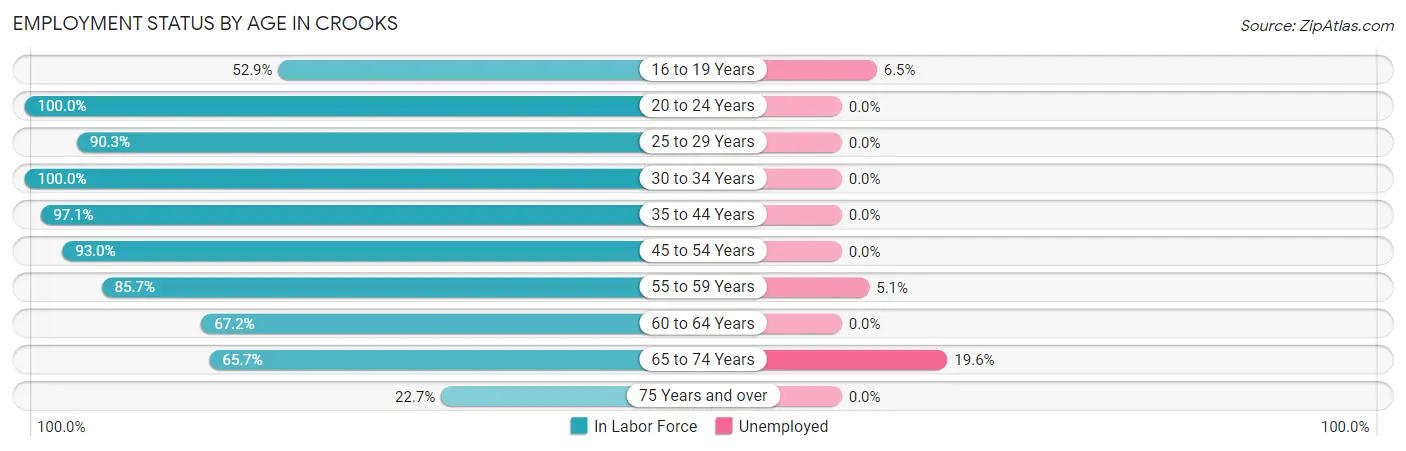
| Age Bracket | In Labor Force | Unemployed |
| 16 to 19 Years | 46 (52.9%) | 3 (6.5%) |
| 20 to 24 Years | 61 (100.0%) | 0 (0.0%) |
| 25 to 29 Years | 93 (90.3%) | 0 (0.0%) |
| 30 to 34 Years | 86 (100.0%) | 0 (0.0%) |
| 35 to 44 Years | 235 (97.1%) | 0 (0.0%) |
| 45 to 54 Years | 187 (93.0%) | 0 (0.0%) |
| 55 to 59 Years | 138 (85.7%) | 7 (5.1%) |
| 60 to 64 Years | 80 (67.2%) | 0 (0.0%) |
| 65 to 74 Years | 46 (65.7%) | 9 (19.6%) |
| 75 Years and over | 5 (22.7%) | 0 (0.0%) |
| Total | 977 (84.8%) | 20 (2.0%) |
Employment Status by Educational Attainment in Crooks
According to labor force statistics for Crooks, 89.8% of individuals (819) out of the total population between 25 and 64 years of age (912) are in the labor force, with 0.9% or 7 of them being unemployed. The group with the highest labor force participation rate are those with the educational attainment of bachelor's degree or higher, with 94.9% or 281 individuals in the labor force. Within the labor force, individuals with college / associate degree education have the highest percentage of unemployment, with 2.5% or 7 of them being unemployed.
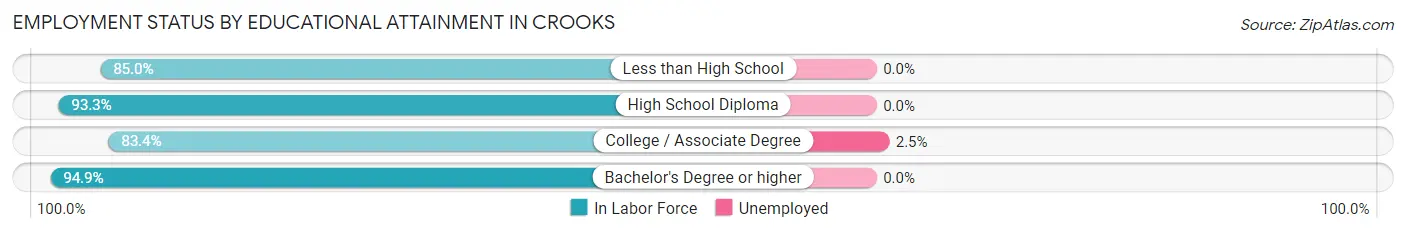
| Educational Attainment | In Labor Force | Unemployed |
| Less than High School | 34 (85.0%) | 0 (0.0%) |
| High School Diploma | 223 (93.3%) | 0 (0.0%) |
| College / Associate Degree | 281 (83.4%) | 8 (2.5%) |
| Bachelor's Degree or higher | 281 (94.9%) | 0 (0.0%) |
| Total | 819 (89.8%) | 8 (0.9%) |
Employment Occupations by Sex in Crooks
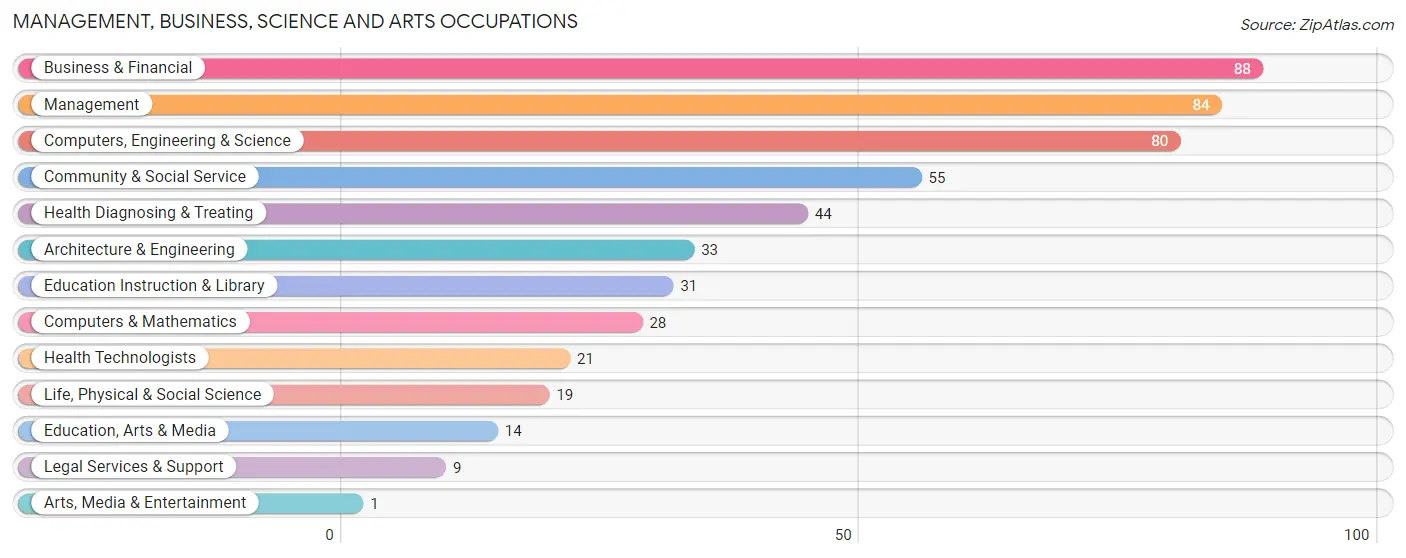
Management, Business, Science and Arts Occupations
The most common Management, Business, Science and Arts occupations in Crooks are Business & Financial (88 | 9.2%), Management (84 | 8.8%), Computers, Engineering & Science (80 | 8.4%), Community & Social Service (55 | 5.8%), and Health Diagnosing & Treating (44 | 4.6%).
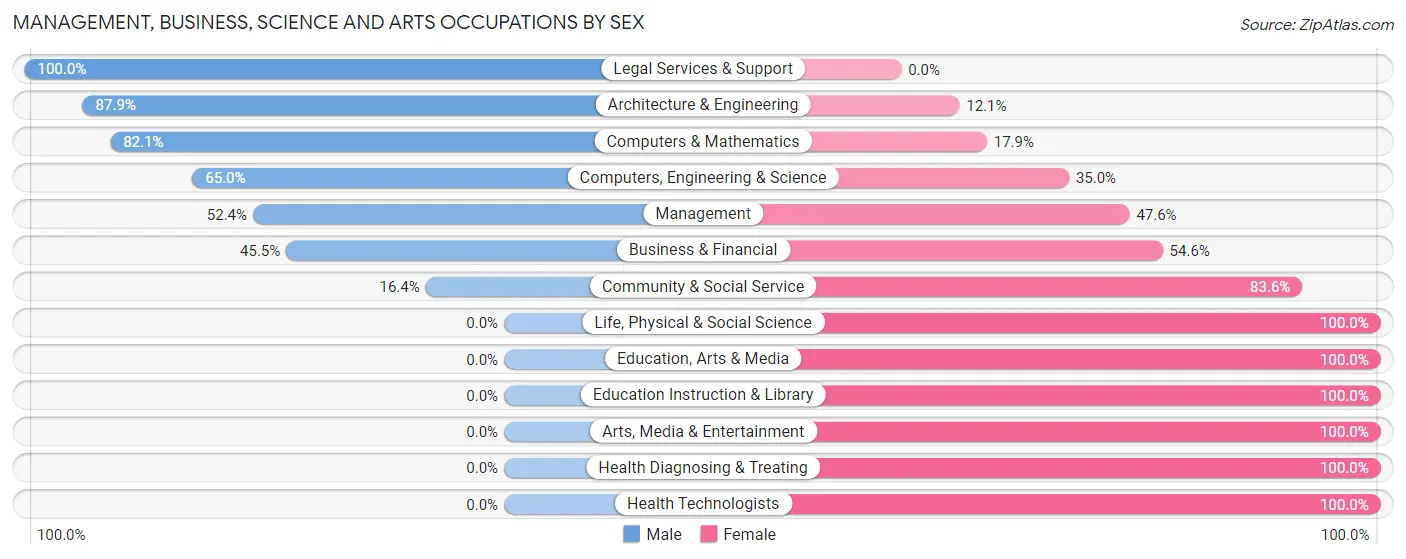
Management, Business, Science and Arts Occupations by Sex
Within the Management, Business, Science and Arts occupations in Crooks, the most male-oriented occupations are Legal Services & Support (100.0%), Architecture & Engineering (87.9%), and Computers & Mathematics (82.1%), while the most female-oriented occupations are Life, Physical & Social Science (100.0%), Education, Arts & Media (100.0%), and Education Instruction & Library (100.0%).
| Occupation | Male | Female |
| Management | 44 (52.4%) | 40 (47.6%) |
| Business & Financial | 40 (45.5%) | 48 (54.5%) |
| Computers, Engineering & Science | 52 (65.0%) | 28 (35.0%) |
| Computers & Mathematics | 23 (82.1%) | 5 (17.9%) |
| Architecture & Engineering | 29 (87.9%) | 4 (12.1%) |
| Life, Physical & Social Science | 0 (0.0%) | 19 (100.0%) |
| Community & Social Service | 9 (16.4%) | 46 (83.6%) |
| Education, Arts & Media | 0 (0.0%) | 14 (100.0%) |
| Legal Services & Support | 9 (100.0%) | 0 (0.0%) |
| Education Instruction & Library | 0 (0.0%) | 31 (100.0%) |
| Arts, Media & Entertainment | 0 (0.0%) | 1 (100.0%) |
| Health Diagnosing & Treating | 0 (0.0%) | 44 (100.0%) |
| Health Technologists | 0 (0.0%) | 21 (100.0%) |
| Total (Category) | 145 (41.3%) | 206 (58.7%) |
| Total (Overall) | 529 (55.4%) | 425 (44.6%) |
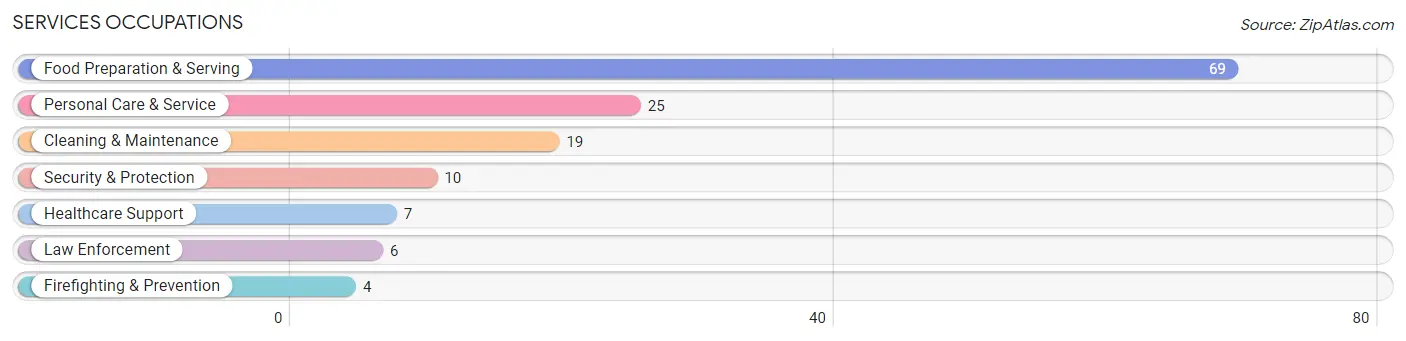
Services Occupations
The most common Services occupations in Crooks are Food Preparation & Serving (69 | 7.2%), Personal Care & Service (25 | 2.6%), Cleaning & Maintenance (19 | 2.0%), Security & Protection (10 | 1.1%), and Healthcare Support (7 | 0.7%).
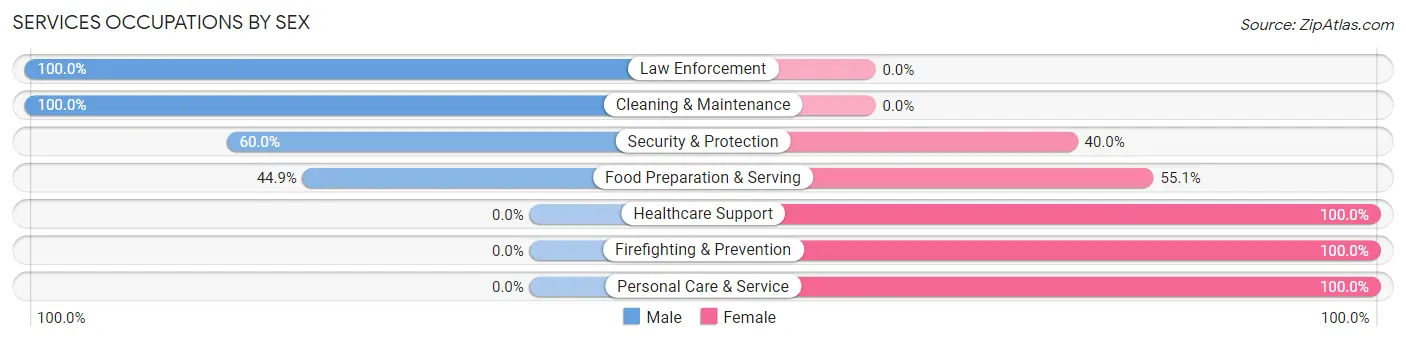
Services Occupations by Sex
Within the Services occupations in Crooks, the most male-oriented occupations are Law Enforcement (100.0%), Cleaning & Maintenance (100.0%), and Security & Protection (60.0%), while the most female-oriented occupations are Healthcare Support (100.0%), Firefighting & Prevention (100.0%), and Personal Care & Service (100.0%).
| Occupation | Male | Female |
| Healthcare Support | 0 (0.0%) | 7 (100.0%) |
| Security & Protection | 6 (60.0%) | 4 (40.0%) |
| Firefighting & Prevention | 0 (0.0%) | 4 (100.0%) |
| Law Enforcement | 6 (100.0%) | 0 (0.0%) |
| Food Preparation & Serving | 31 (44.9%) | 38 (55.1%) |
| Cleaning & Maintenance | 19 (100.0%) | 0 (0.0%) |
| Personal Care & Service | 0 (0.0%) | 25 (100.0%) |
| Total (Category) | 56 (43.1%) | 74 (56.9%) |
| Total (Overall) | 529 (55.4%) | 425 (44.6%) |
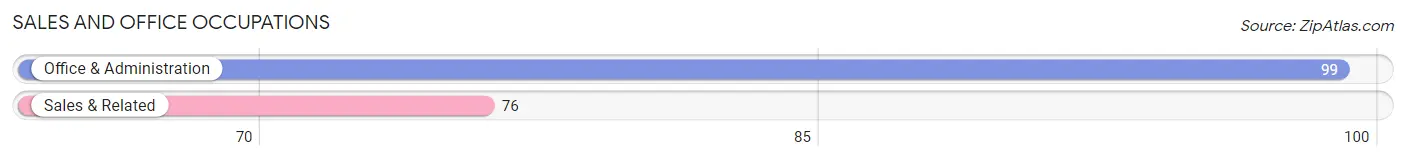
Sales and Office Occupations
The most common Sales and Office occupations in Crooks are Office & Administration (99 | 10.4%), and Sales & Related (76 | 8.0%).
Sales and Office Occupations by Sex
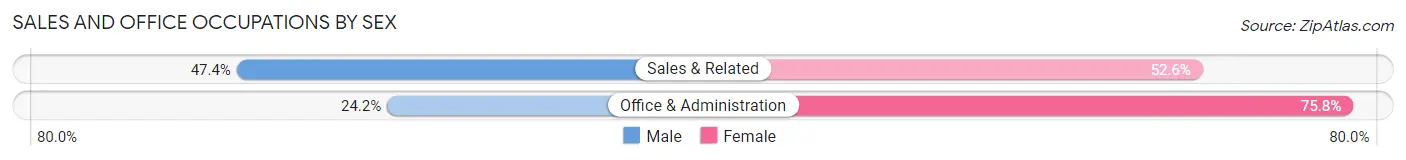
| Occupation | Male | Female |
| Sales & Related | 36 (47.4%) | 40 (52.6%) |
| Office & Administration | 24 (24.2%) | 75 (75.8%) |
| Total (Category) | 60 (34.3%) | 115 (65.7%) |
| Total (Overall) | 529 (55.4%) | 425 (44.6%) |
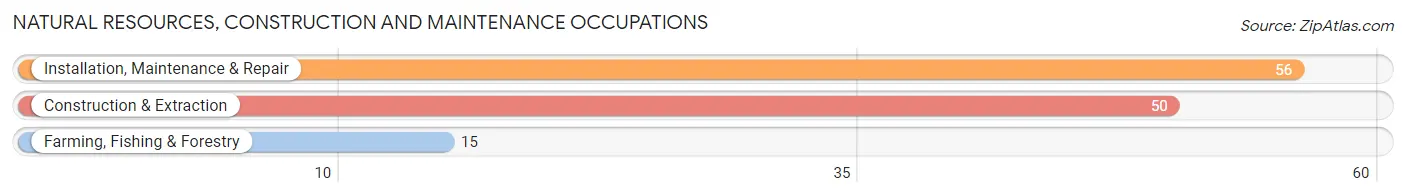
Natural Resources, Construction and Maintenance Occupations
The most common Natural Resources, Construction and Maintenance occupations in Crooks are Installation, Maintenance & Repair (56 | 5.9%), Construction & Extraction (50 | 5.2%), and Farming, Fishing & Forestry (15 | 1.6%).
Natural Resources, Construction and Maintenance Occupations by Sex
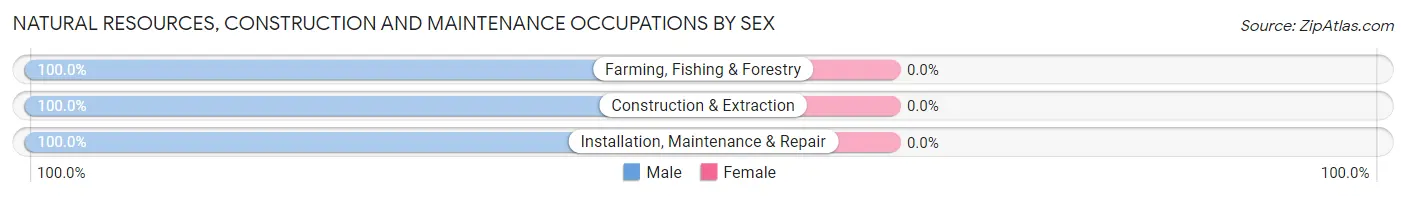
| Occupation | Male | Female |
| Farming, Fishing & Forestry | 15 (100.0%) | 0 (0.0%) |
| Construction & Extraction | 50 (100.0%) | 0 (0.0%) |
| Installation, Maintenance & Repair | 56 (100.0%) | 0 (0.0%) |
| Total (Category) | 121 (100.0%) | 0 (0.0%) |
| Total (Overall) | 529 (55.4%) | 425 (44.6%) |
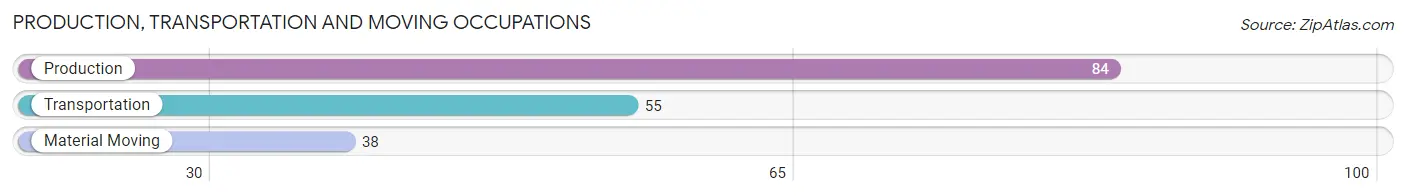
Production, Transportation and Moving Occupations
The most common Production, Transportation and Moving occupations in Crooks are Production (84 | 8.8%), Transportation (55 | 5.8%), and Material Moving (38 | 4.0%).
Production, Transportation and Moving Occupations by Sex
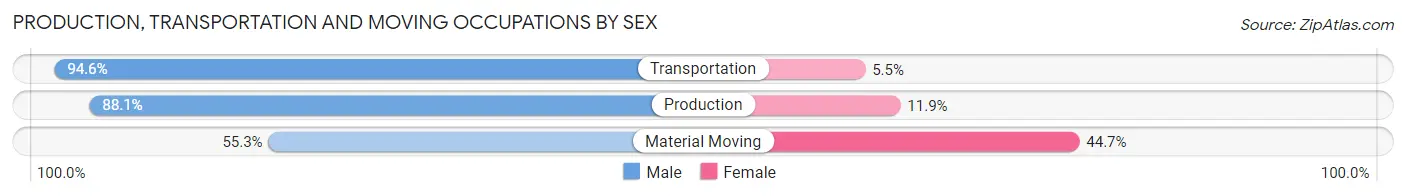
| Occupation | Male | Female |
| Production | 74 (88.1%) | 10 (11.9%) |
| Transportation | 52 (94.6%) | 3 (5.4%) |
| Material Moving | 21 (55.3%) | 17 (44.7%) |
| Total (Category) | 147 (83.1%) | 30 (17.0%) |
| Total (Overall) | 529 (55.4%) | 425 (44.6%) |
Employment Industries by Sex in Crooks
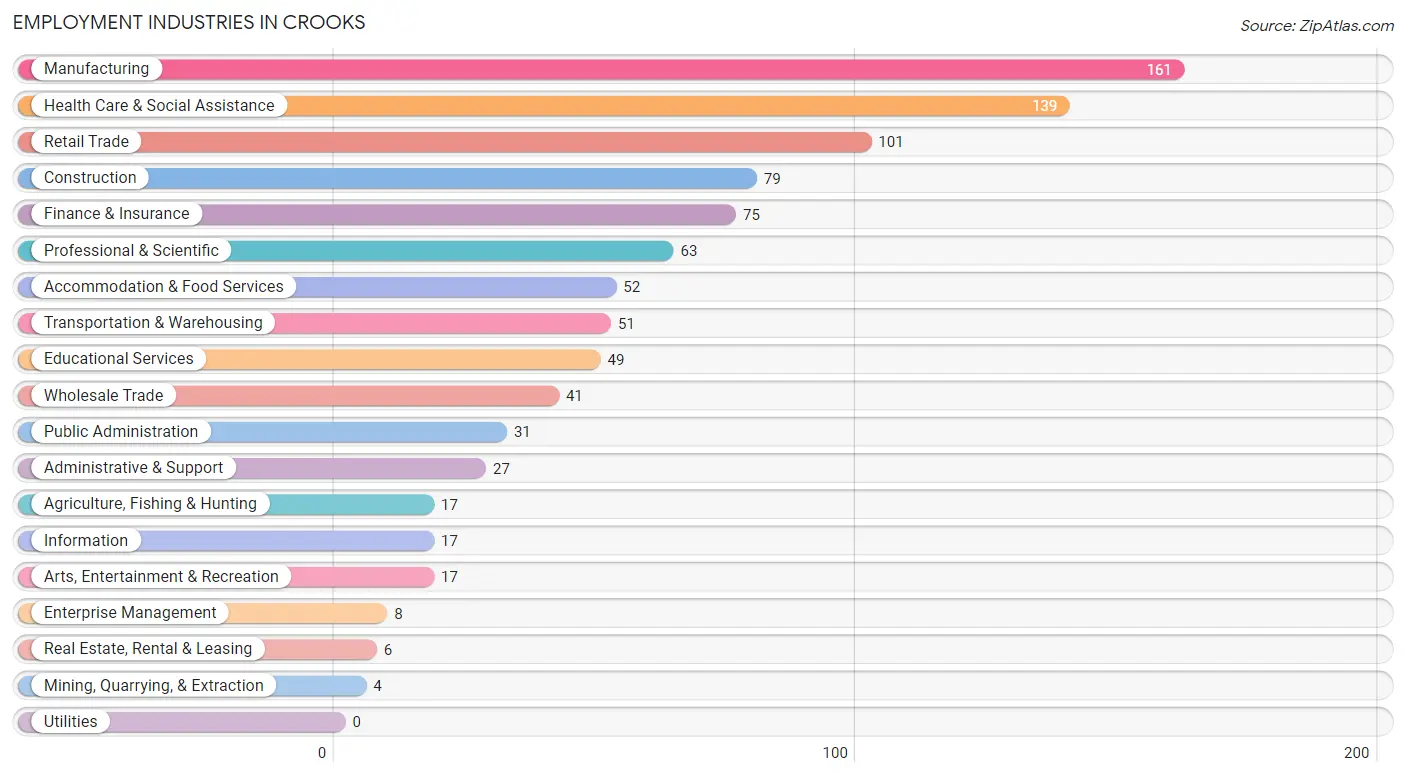
Employment Industries in Crooks
The major employment industries in Crooks include Manufacturing (161 | 16.9%), Health Care & Social Assistance (139 | 14.6%), Retail Trade (101 | 10.6%), Construction (79 | 8.3%), and Finance & Insurance (75 | 7.9%).
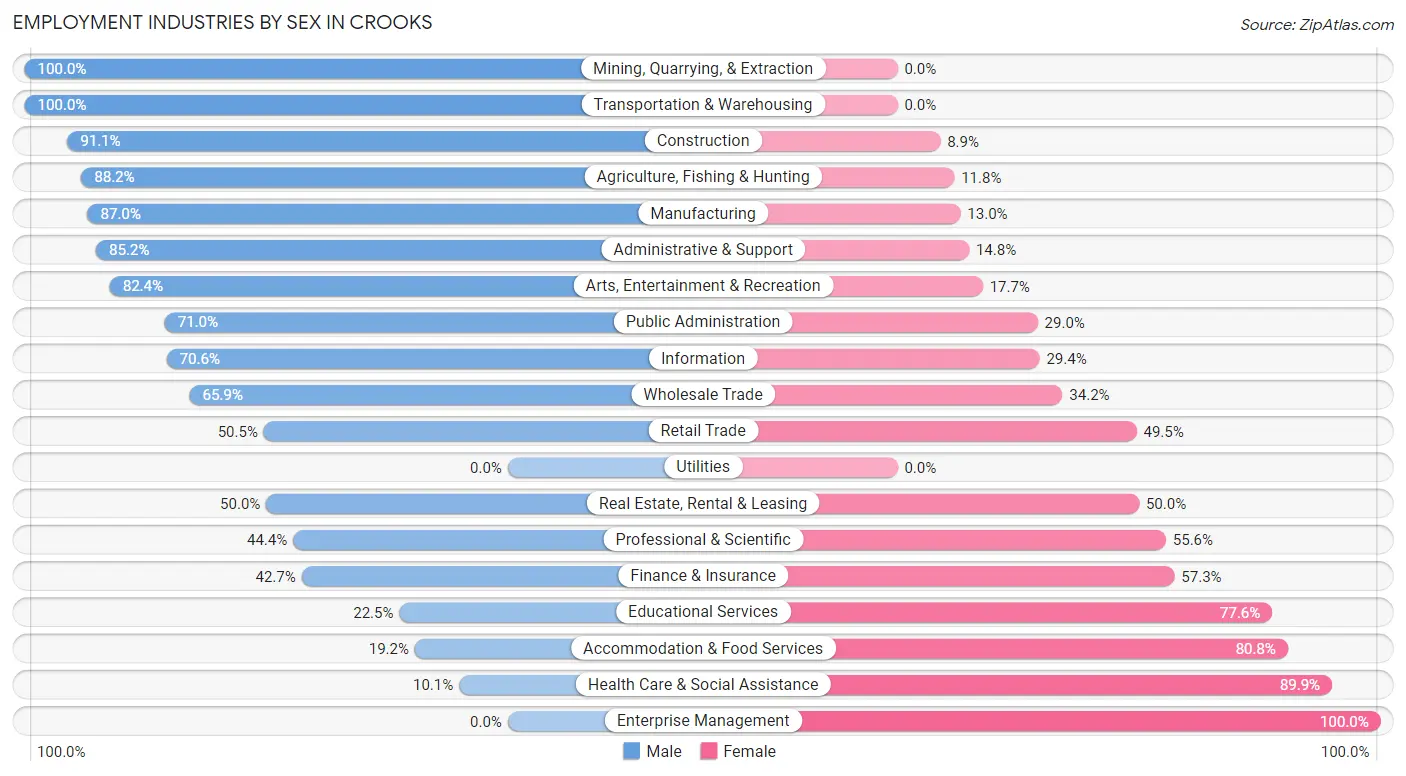
Employment Industries by Sex in Crooks
The Crooks industries that see more men than women are Mining, Quarrying, & Extraction (100.0%), Transportation & Warehousing (100.0%), and Construction (91.1%), whereas the industries that tend to have a higher number of women are Enterprise Management (100.0%), Health Care & Social Assistance (89.9%), and Accommodation & Food Services (80.8%).
| Industry | Male | Female |
| Agriculture, Fishing & Hunting | 15 (88.2%) | 2 (11.8%) |
| Mining, Quarrying, & Extraction | 4 (100.0%) | 0 (0.0%) |
| Construction | 72 (91.1%) | 7 (8.9%) |
| Manufacturing | 140 (87.0%) | 21 (13.0%) |
| Wholesale Trade | 27 (65.8%) | 14 (34.2%) |
| Retail Trade | 51 (50.5%) | 50 (49.5%) |
| Transportation & Warehousing | 51 (100.0%) | 0 (0.0%) |
| Utilities | 0 (0.0%) | 0 (0.0%) |
| Information | 12 (70.6%) | 5 (29.4%) |
| Finance & Insurance | 32 (42.7%) | 43 (57.3%) |
| Real Estate, Rental & Leasing | 3 (50.0%) | 3 (50.0%) |
| Professional & Scientific | 28 (44.4%) | 35 (55.6%) |
| Enterprise Management | 0 (0.0%) | 8 (100.0%) |
| Administrative & Support | 23 (85.2%) | 4 (14.8%) |
| Educational Services | 11 (22.5%) | 38 (77.5%) |
| Health Care & Social Assistance | 14 (10.1%) | 125 (89.9%) |
| Arts, Entertainment & Recreation | 14 (82.4%) | 3 (17.6%) |
| Accommodation & Food Services | 10 (19.2%) | 42 (80.8%) |
| Public Administration | 22 (71.0%) | 9 (29.0%) |
| Total | 529 (55.4%) | 425 (44.6%) |
Education in Crooks
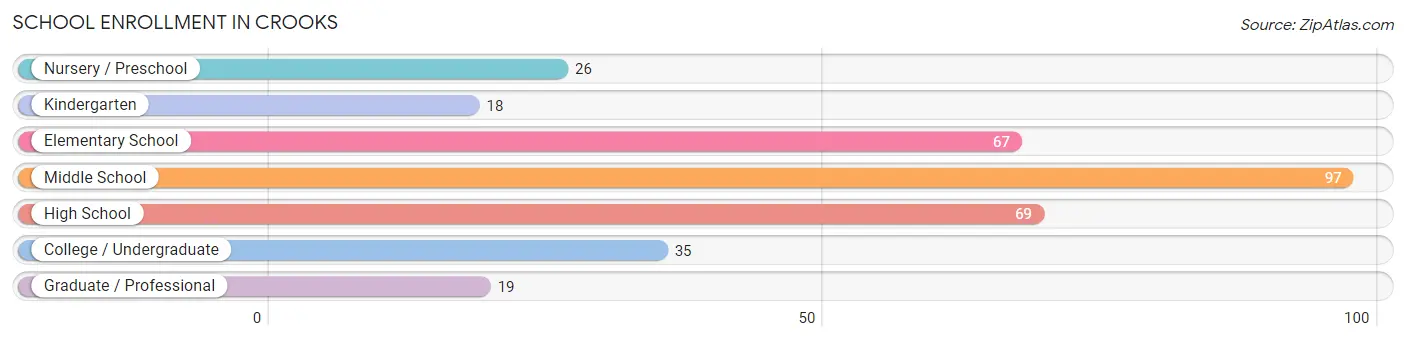
School Enrollment in Crooks
The most common levels of schooling among the 331 students in Crooks are middle school (97 | 29.3%), high school (69 | 20.8%), and elementary school (67 | 20.2%).
| School Level | # Students | % Students |
| Nursery / Preschool | 26 | 7.9% |
| Kindergarten | 18 | 5.4% |
| Elementary School | 67 | 20.2% |
| Middle School | 97 | 29.3% |
| High School | 69 | 20.8% |
| College / Undergraduate | 35 | 10.6% |
| Graduate / Professional | 19 | 5.7% |
| Total | 331 | 100.0% |
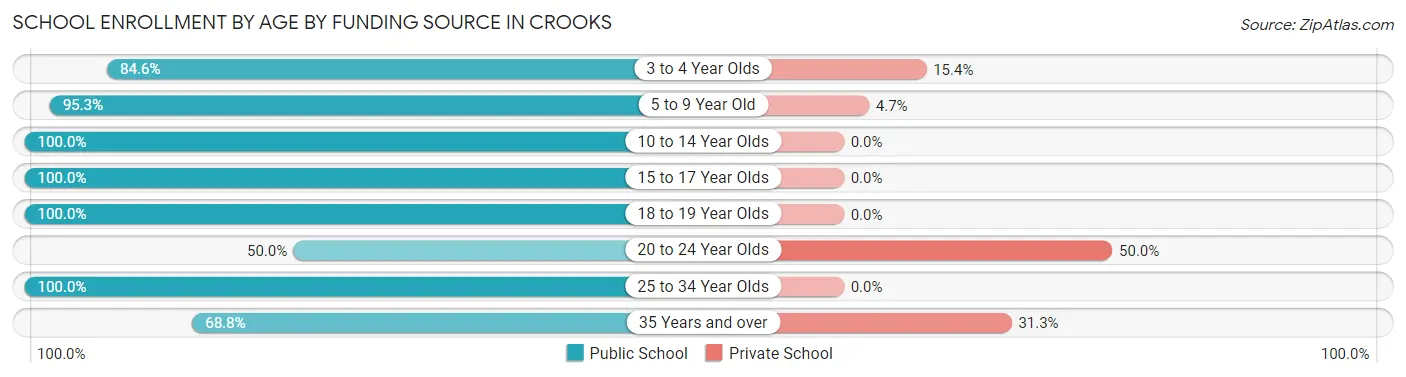
School Enrollment by Age by Funding Source in Crooks
Out of a total of 331 students who are enrolled in schools in Crooks, 17 (5.1%) attend a private institution, while the remaining 314 (94.9%) are enrolled in public schools. The age group of 20 to 24 year olds has the highest likelihood of being enrolled in private schools, with 5 (50.0% in the age bracket) enrolled. Conversely, the age group of 10 to 14 year olds has the lowest likelihood of being enrolled in a private school, with 123 (100.0% in the age bracket) attending a public institution.
| Age Bracket | Public School | Private School |
| 3 to 4 Year Olds | 22 (84.6%) | 4 (15.4%) |
| 5 to 9 Year Old | 61 (95.3%) | 3 (4.7%) |
| 10 to 14 Year Olds | 123 (100.0%) | 0 (0.0%) |
| 15 to 17 Year Olds | 43 (100.0%) | 0 (0.0%) |
| 18 to 19 Year Olds | 45 (100.0%) | 0 (0.0%) |
| 20 to 24 Year Olds | 5 (50.0%) | 5 (50.0%) |
| 25 to 34 Year Olds | 4 (100.0%) | 0 (0.0%) |
| 35 Years and over | 11 (68.8%) | 5 (31.2%) |
| Total | 314 (94.9%) | 17 (5.1%) |
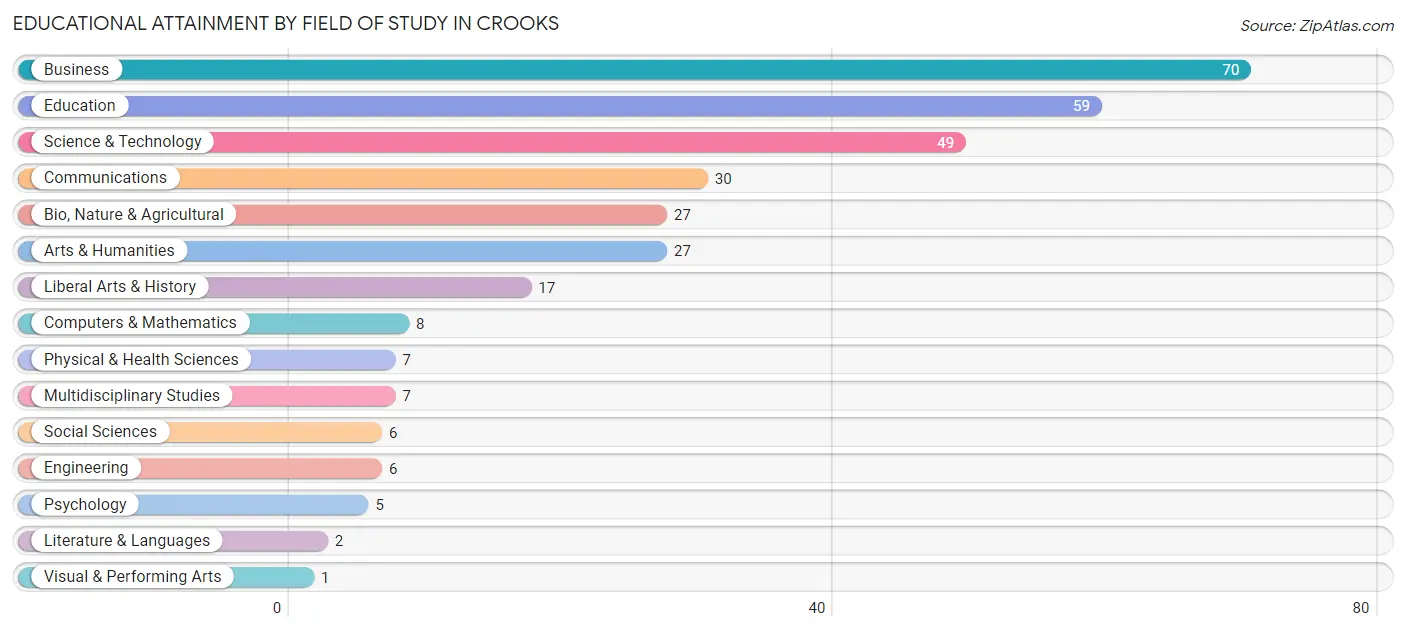
Educational Attainment by Field of Study in Crooks
Business (70 | 21.8%), education (59 | 18.4%), science & technology (49 | 15.3%), communications (30 | 9.3%), and bio, nature & agricultural (27 | 8.4%) are the most common fields of study among 321 individuals in Crooks who have obtained a bachelor's degree or higher.
| Field of Study | # Graduates | % Graduates |
| Computers & Mathematics | 8 | 2.5% |
| Bio, Nature & Agricultural | 27 | 8.4% |
| Physical & Health Sciences | 7 | 2.2% |
| Psychology | 5 | 1.6% |
| Social Sciences | 6 | 1.9% |
| Engineering | 6 | 1.9% |
| Multidisciplinary Studies | 7 | 2.2% |
| Science & Technology | 49 | 15.3% |
| Business | 70 | 21.8% |
| Education | 59 | 18.4% |
| Literature & Languages | 2 | 0.6% |
| Liberal Arts & History | 17 | 5.3% |
| Visual & Performing Arts | 1 | 0.3% |
| Communications | 30 | 9.3% |
| Arts & Humanities | 27 | 8.4% |
| Total | 321 | 100.0% |
Transportation & Commute in Crooks
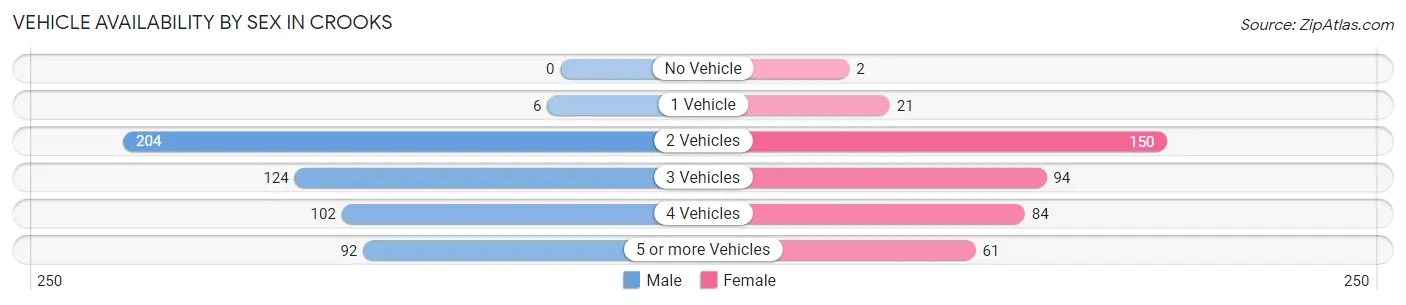
Vehicle Availability by Sex in Crooks
The most prevalent vehicle ownership categories in Crooks are males with 2 vehicles (204, accounting for 38.6%) and females with 2 vehicles (150, making up 49.5%).
| Vehicles Available | Male | Female |
| No Vehicle | 0 (0.0%) | 2 (0.5%) |
| 1 Vehicle | 6 (1.1%) | 21 (5.1%) |
| 2 Vehicles | 204 (38.6%) | 150 (36.4%) |
| 3 Vehicles | 124 (23.5%) | 94 (22.8%) |
| 4 Vehicles | 102 (19.3%) | 84 (20.4%) |
| 5 or more Vehicles | 92 (17.4%) | 61 (14.8%) |
| Total | 528 (100.0%) | 412 (100.0%) |
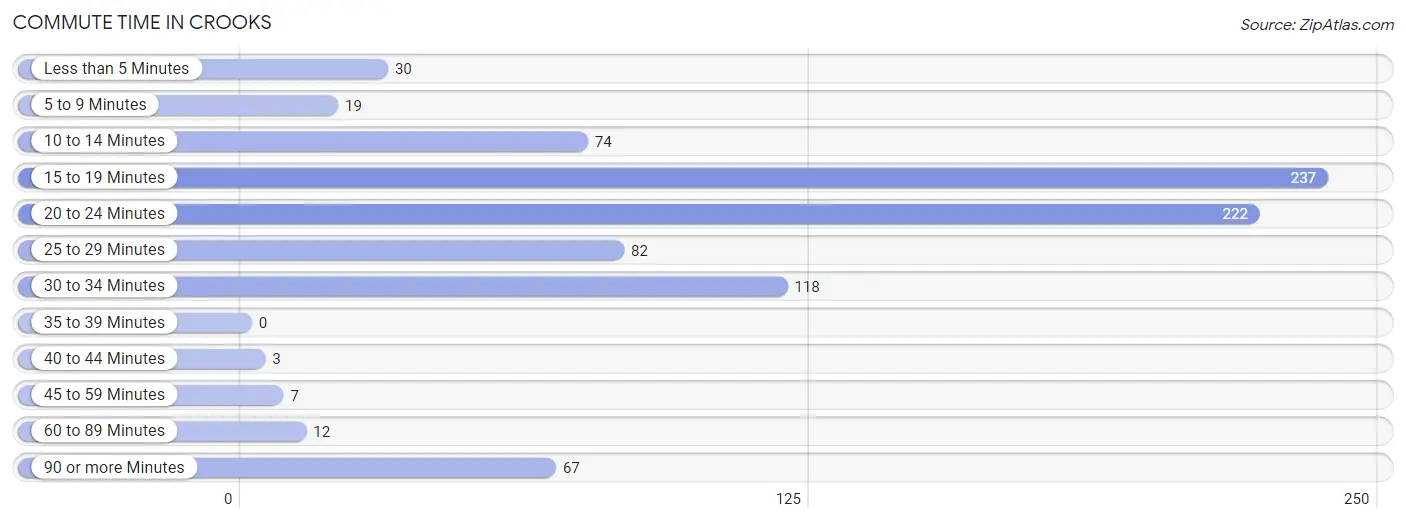
Commute Time in Crooks
The most frequently occuring commute durations in Crooks are 15 to 19 minutes (237 commuters, 27.2%), 20 to 24 minutes (222 commuters, 25.5%), and 30 to 34 minutes (118 commuters, 13.6%).
| Commute Time | # Commuters | % Commuters |
| Less than 5 Minutes | 30 | 3.4% |
| 5 to 9 Minutes | 19 | 2.2% |
| 10 to 14 Minutes | 74 | 8.5% |
| 15 to 19 Minutes | 237 | 27.2% |
| 20 to 24 Minutes | 222 | 25.5% |
| 25 to 29 Minutes | 82 | 9.4% |
| 30 to 34 Minutes | 118 | 13.6% |
| 35 to 39 Minutes | 0 | 0.0% |
| 40 to 44 Minutes | 3 | 0.3% |
| 45 to 59 Minutes | 7 | 0.8% |
| 60 to 89 Minutes | 12 | 1.4% |
| 90 or more Minutes | 67 | 7.7% |
Commute Time by Sex in Crooks
The most common commute times in Crooks are 20 to 24 minutes (157 commuters, 31.0%) for males and 15 to 19 minutes (111 commuters, 30.4%) for females.
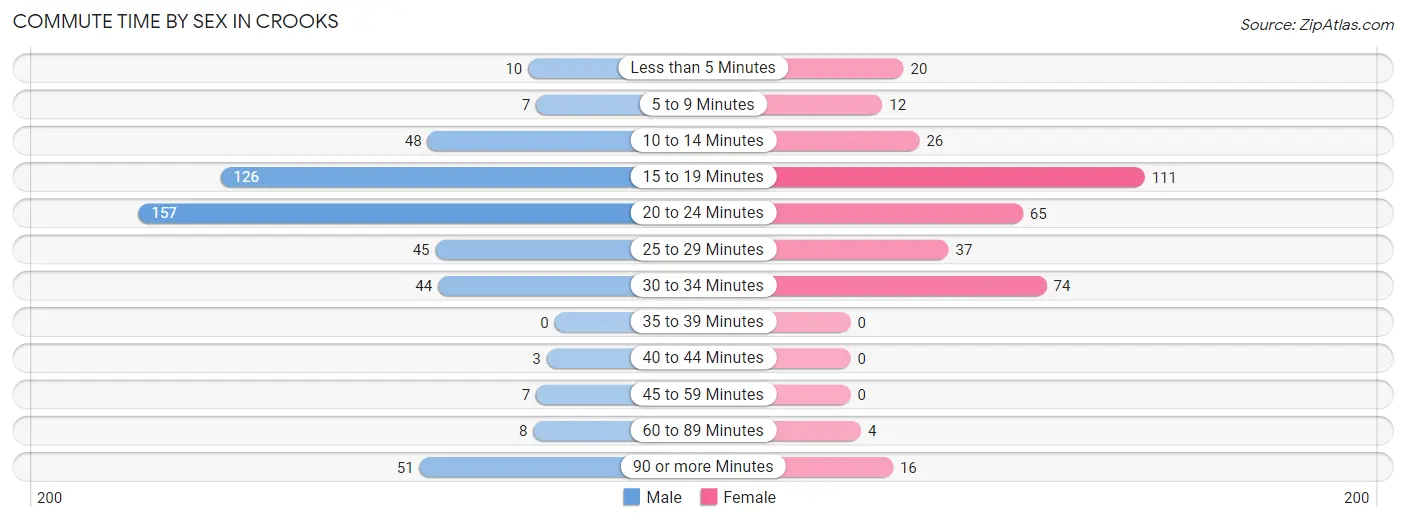
| Commute Time | Male | Female |
| Less than 5 Minutes | 10 (2.0%) | 20 (5.5%) |
| 5 to 9 Minutes | 7 (1.4%) | 12 (3.3%) |
| 10 to 14 Minutes | 48 (9.5%) | 26 (7.1%) |
| 15 to 19 Minutes | 126 (24.9%) | 111 (30.4%) |
| 20 to 24 Minutes | 157 (31.0%) | 65 (17.8%) |
| 25 to 29 Minutes | 45 (8.9%) | 37 (10.1%) |
| 30 to 34 Minutes | 44 (8.7%) | 74 (20.3%) |
| 35 to 39 Minutes | 0 (0.0%) | 0 (0.0%) |
| 40 to 44 Minutes | 3 (0.6%) | 0 (0.0%) |
| 45 to 59 Minutes | 7 (1.4%) | 0 (0.0%) |
| 60 to 89 Minutes | 8 (1.6%) | 4 (1.1%) |
| 90 or more Minutes | 51 (10.1%) | 16 (4.4%) |
Time of Departure to Work by Sex in Crooks
The most frequent times of departure to work in Crooks are 7:30 AM to 7:59 AM (77, 15.2%) for males and 7:30 AM to 7:59 AM (123, 33.7%) for females.
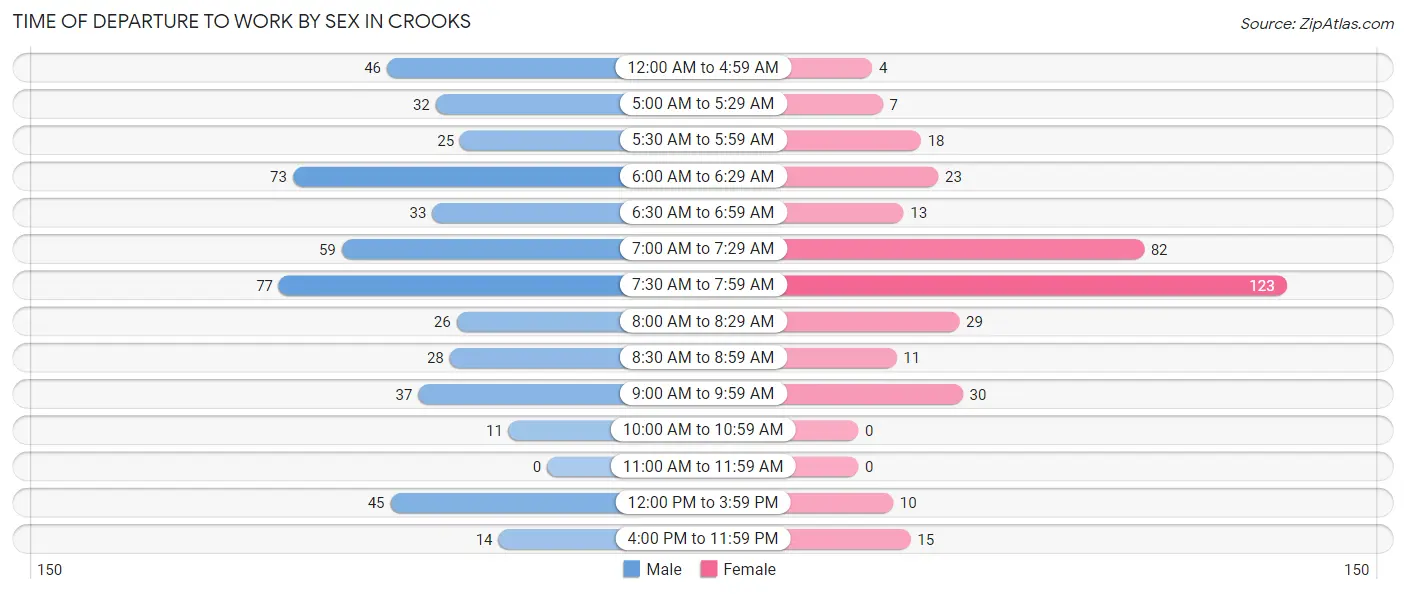
| Time of Departure | Male | Female |
| 12:00 AM to 4:59 AM | 46 (9.1%) | 4 (1.1%) |
| 5:00 AM to 5:29 AM | 32 (6.3%) | 7 (1.9%) |
| 5:30 AM to 5:59 AM | 25 (4.9%) | 18 (4.9%) |
| 6:00 AM to 6:29 AM | 73 (14.4%) | 23 (6.3%) |
| 6:30 AM to 6:59 AM | 33 (6.5%) | 13 (3.6%) |
| 7:00 AM to 7:29 AM | 59 (11.7%) | 82 (22.5%) |
| 7:30 AM to 7:59 AM | 77 (15.2%) | 123 (33.7%) |
| 8:00 AM to 8:29 AM | 26 (5.1%) | 29 (8.0%) |
| 8:30 AM to 8:59 AM | 28 (5.5%) | 11 (3.0%) |
| 9:00 AM to 9:59 AM | 37 (7.3%) | 30 (8.2%) |
| 10:00 AM to 10:59 AM | 11 (2.2%) | 0 (0.0%) |
| 11:00 AM to 11:59 AM | 0 (0.0%) | 0 (0.0%) |
| 12:00 PM to 3:59 PM | 45 (8.9%) | 10 (2.7%) |
| 4:00 PM to 11:59 PM | 14 (2.8%) | 15 (4.1%) |
| Total | 506 (100.0%) | 365 (100.0%) |
Housing Occupancy in Crooks
Occupancy by Ownership in Crooks
Of the total 503 dwellings in Crooks, owner-occupied units account for 455 (90.5%), while renter-occupied units make up 48 (9.5%).
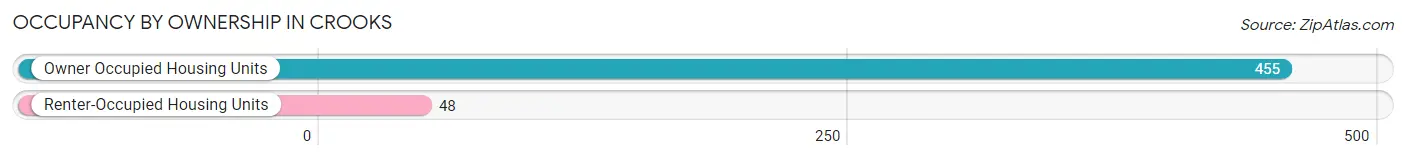
| Occupancy | # Housing Units | % Housing Units |
| Owner Occupied Housing Units | 455 | 90.5% |
| Renter-Occupied Housing Units | 48 | 9.5% |
| Total Occupied Housing Units | 503 | 100.0% |
Occupancy by Household Size in Crooks
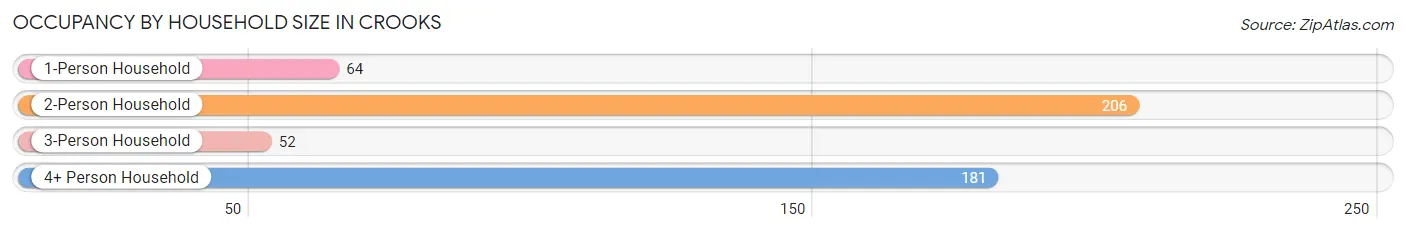
| Household Size | # Housing Units | % Housing Units |
| 1-Person Household | 64 | 12.7% |
| 2-Person Household | 206 | 40.9% |
| 3-Person Household | 52 | 10.3% |
| 4+ Person Household | 181 | 36.0% |
| Total Housing Units | 503 | 100.0% |
Occupancy by Ownership by Household Size in Crooks
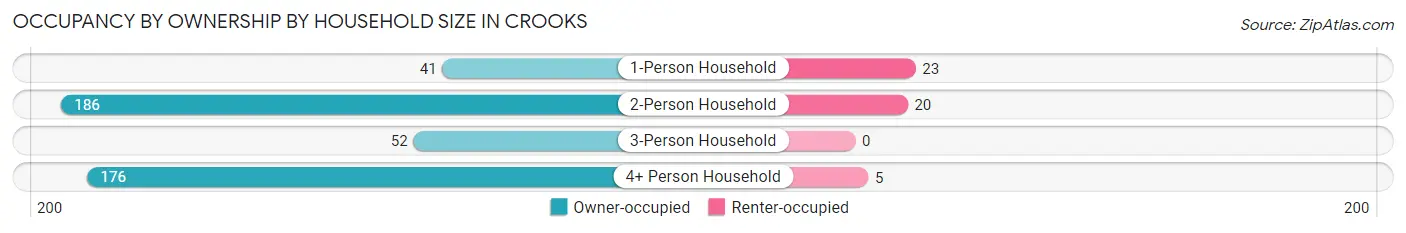
| Household Size | Owner-occupied | Renter-occupied |
| 1-Person Household | 41 (64.1%) | 23 (35.9%) |
| 2-Person Household | 186 (90.3%) | 20 (9.7%) |
| 3-Person Household | 52 (100.0%) | 0 (0.0%) |
| 4+ Person Household | 176 (97.2%) | 5 (2.8%) |
| Total Housing Units | 455 (90.5%) | 48 (9.5%) |
Occupancy by Educational Attainment in Crooks
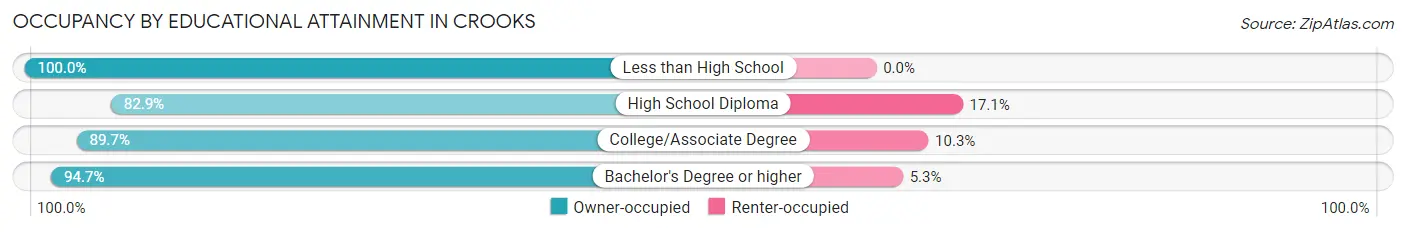
| Household Size | Owner-occupied | Renter-occupied |
| Less than High School | 27 (100.0%) | 0 (0.0%) |
| High School Diploma | 92 (82.9%) | 19 (17.1%) |
| College/Associate Degree | 174 (89.7%) | 20 (10.3%) |
| Bachelor's Degree or higher | 162 (94.7%) | 9 (5.3%) |
Occupancy by Age of Householder in Crooks
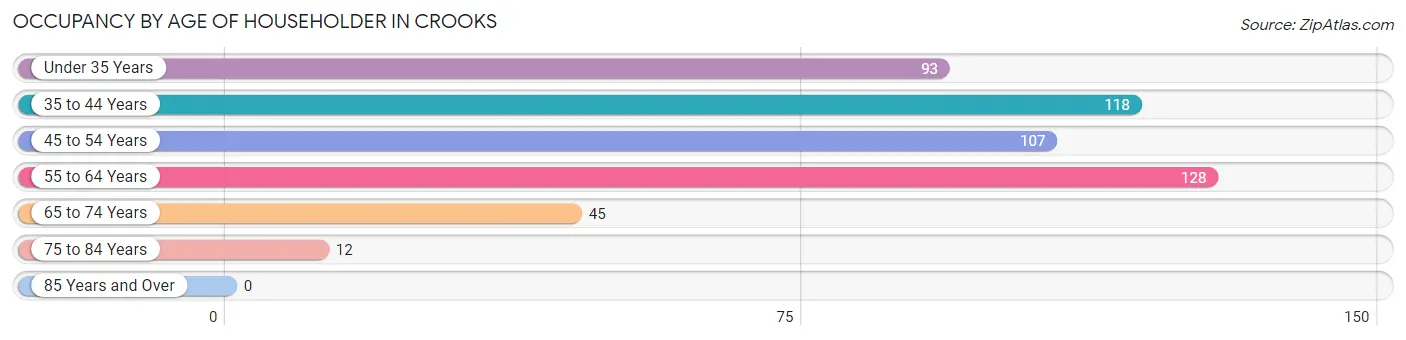
| Age Bracket | # Households | % Households |
| Under 35 Years | 93 | 18.5% |
| 35 to 44 Years | 118 | 23.5% |
| 45 to 54 Years | 107 | 21.3% |
| 55 to 64 Years | 128 | 25.5% |
| 65 to 74 Years | 45 | 8.9% |
| 75 to 84 Years | 12 | 2.4% |
| 85 Years and Over | 0 | 0.0% |
| Total | 503 | 100.0% |
Housing Finances in Crooks
Median Income by Occupancy in Crooks
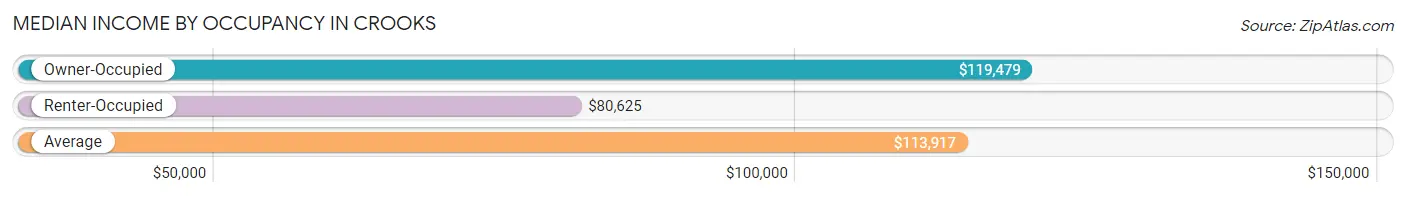
| Occupancy Type | # Households | Median Income |
| Owner-Occupied | 455 (90.5%) | $119,479 |
| Renter-Occupied | 48 (9.5%) | $80,625 |
| Average | 503 (100.0%) | $113,917 |
Occupancy by Householder Income Bracket in Crooks
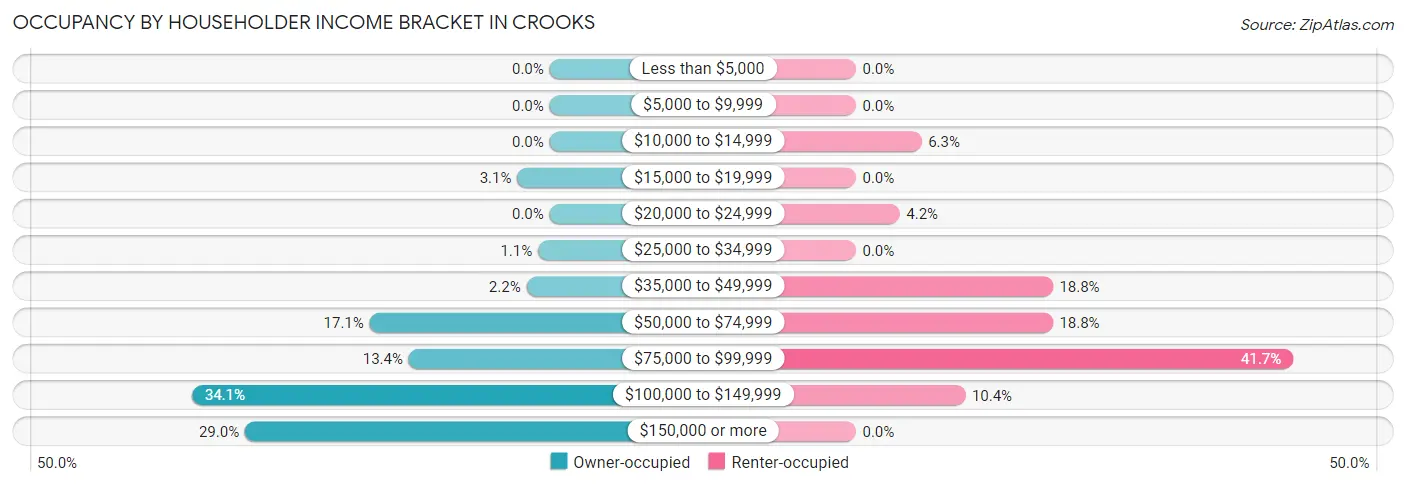
| Income Bracket | Owner-occupied | Renter-occupied |
| Less than $5,000 | 0 (0.0%) | 0 (0.0%) |
| $5,000 to $9,999 | 0 (0.0%) | 0 (0.0%) |
| $10,000 to $14,999 | 0 (0.0%) | 3 (6.2%) |
| $15,000 to $19,999 | 14 (3.1%) | 0 (0.0%) |
| $20,000 to $24,999 | 0 (0.0%) | 2 (4.2%) |
| $25,000 to $34,999 | 5 (1.1%) | 0 (0.0%) |
| $35,000 to $49,999 | 10 (2.2%) | 9 (18.8%) |
| $50,000 to $74,999 | 78 (17.1%) | 9 (18.8%) |
| $75,000 to $99,999 | 61 (13.4%) | 20 (41.7%) |
| $100,000 to $149,999 | 155 (34.1%) | 5 (10.4%) |
| $150,000 or more | 132 (29.0%) | 0 (0.0%) |
| Total | 455 (100.0%) | 48 (100.0%) |
Monthly Housing Cost Tiers in Crooks
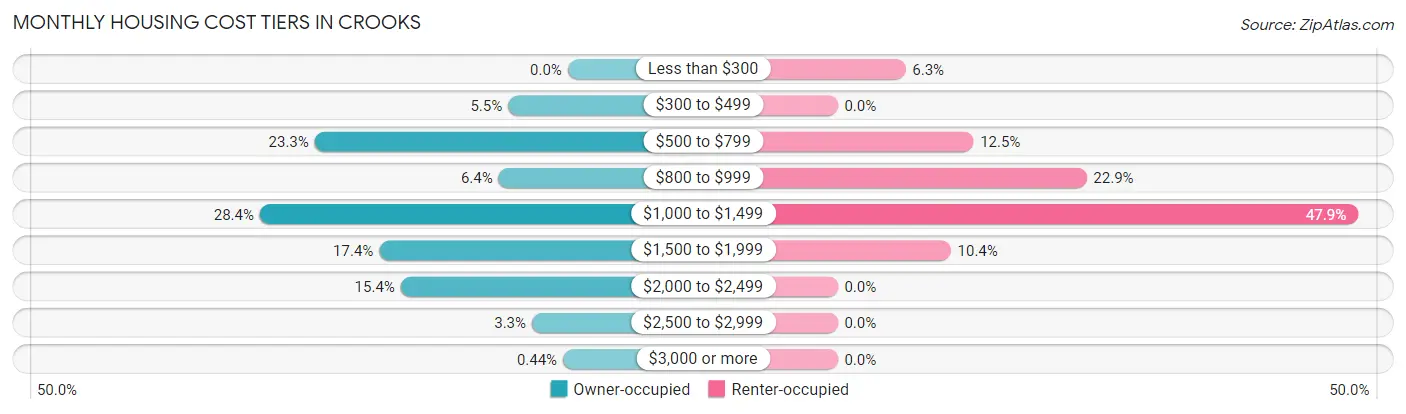
| Monthly Cost | Owner-occupied | Renter-occupied |
| Less than $300 | 0 (0.0%) | 3 (6.2%) |
| $300 to $499 | 25 (5.5%) | 0 (0.0%) |
| $500 to $799 | 106 (23.3%) | 6 (12.5%) |
| $800 to $999 | 29 (6.4%) | 11 (22.9%) |
| $1,000 to $1,499 | 129 (28.3%) | 23 (47.9%) |
| $1,500 to $1,999 | 79 (17.4%) | 5 (10.4%) |
| $2,000 to $2,499 | 70 (15.4%) | 0 (0.0%) |
| $2,500 to $2,999 | 15 (3.3%) | 0 (0.0%) |
| $3,000 or more | 2 (0.4%) | 0 (0.0%) |
| Total | 455 (100.0%) | 48 (100.0%) |
Physical Housing Characteristics in Crooks
Housing Structures in Crooks
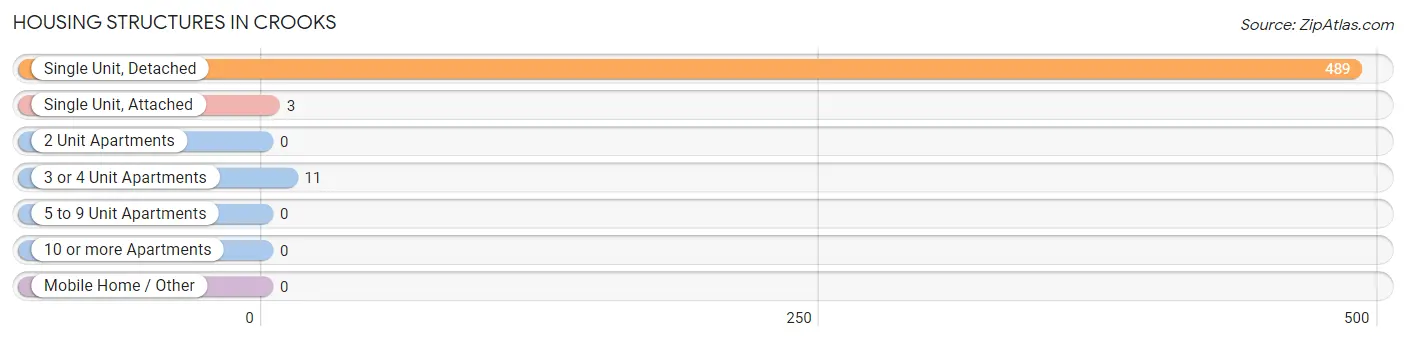
| Structure Type | # Housing Units | % Housing Units |
| Single Unit, Detached | 489 | 97.2% |
| Single Unit, Attached | 3 | 0.6% |
| 2 Unit Apartments | 0 | 0.0% |
| 3 or 4 Unit Apartments | 11 | 2.2% |
| 5 to 9 Unit Apartments | 0 | 0.0% |
| 10 or more Apartments | 0 | 0.0% |
| Mobile Home / Other | 0 | 0.0% |
| Total | 503 | 100.0% |
Housing Structures by Occupancy in Crooks
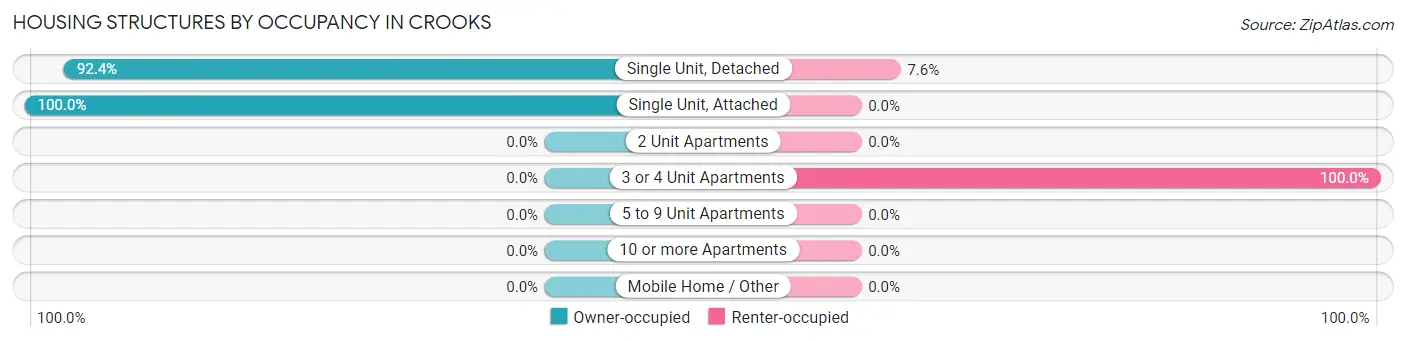
| Structure Type | Owner-occupied | Renter-occupied |
| Single Unit, Detached | 452 (92.4%) | 37 (7.6%) |
| Single Unit, Attached | 3 (100.0%) | 0 (0.0%) |
| 2 Unit Apartments | 0 (0.0%) | 0 (0.0%) |
| 3 or 4 Unit Apartments | 0 (0.0%) | 11 (100.0%) |
| 5 to 9 Unit Apartments | 0 (0.0%) | 0 (0.0%) |
| 10 or more Apartments | 0 (0.0%) | 0 (0.0%) |
| Mobile Home / Other | 0 (0.0%) | 0 (0.0%) |
| Total | 455 (90.5%) | 48 (9.5%) |
Housing Structures by Number of Rooms in Crooks
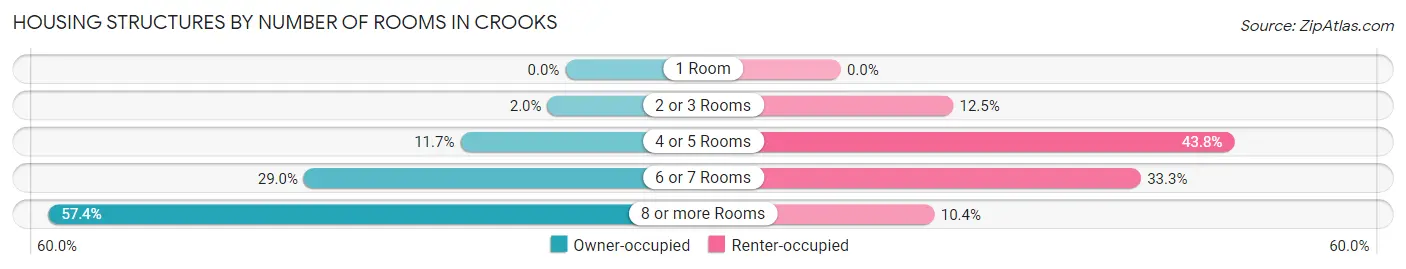
| Number of Rooms | Owner-occupied | Renter-occupied |
| 1 Room | 0 (0.0%) | 0 (0.0%) |
| 2 or 3 Rooms | 9 (2.0%) | 6 (12.5%) |
| 4 or 5 Rooms | 53 (11.7%) | 21 (43.8%) |
| 6 or 7 Rooms | 132 (29.0%) | 16 (33.3%) |
| 8 or more Rooms | 261 (57.4%) | 5 (10.4%) |
| Total | 455 (100.0%) | 48 (100.0%) |
Housing Structure by Heating Type in Crooks
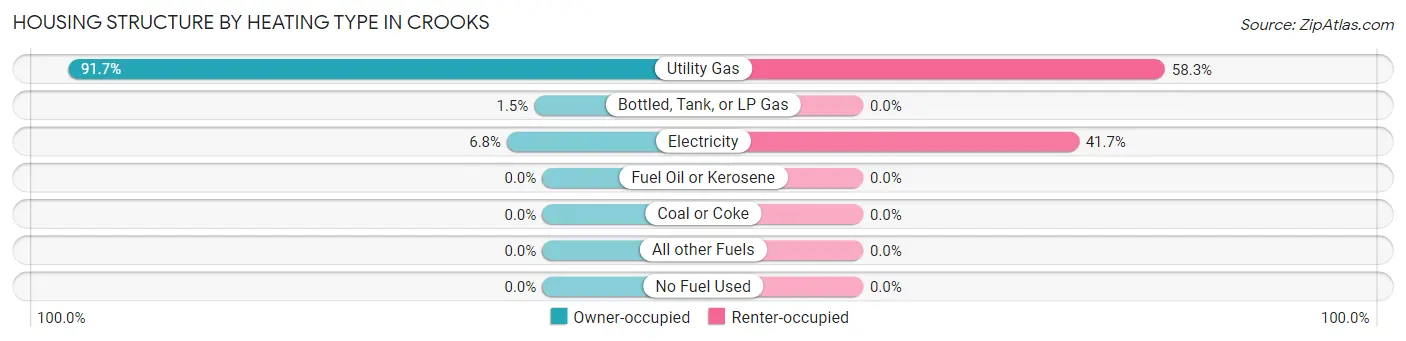
| Heating Type | Owner-occupied | Renter-occupied |
| Utility Gas | 417 (91.6%) | 28 (58.3%) |
| Bottled, Tank, or LP Gas | 7 (1.5%) | 0 (0.0%) |
| Electricity | 31 (6.8%) | 20 (41.7%) |
| Fuel Oil or Kerosene | 0 (0.0%) | 0 (0.0%) |
| Coal or Coke | 0 (0.0%) | 0 (0.0%) |
| All other Fuels | 0 (0.0%) | 0 (0.0%) |
| No Fuel Used | 0 (0.0%) | 0 (0.0%) |
| Total | 455 (100.0%) | 48 (100.0%) |
Household Vehicle Usage in Crooks
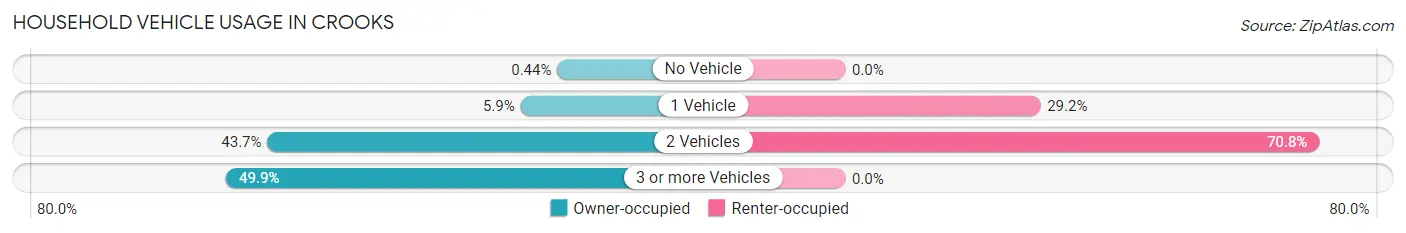
| Vehicles per Household | Owner-occupied | Renter-occupied |
| No Vehicle | 2 (0.4%) | 0 (0.0%) |
| 1 Vehicle | 27 (5.9%) | 14 (29.2%) |
| 2 Vehicles | 199 (43.7%) | 34 (70.8%) |
| 3 or more Vehicles | 227 (49.9%) | 0 (0.0%) |
| Total | 455 (100.0%) | 48 (100.0%) |
Real Estate & Mortgages in Crooks
Real Estate and Mortgage Overview in Crooks
| Characteristic | Without Mortgage | With Mortgage |
| Housing Units | 140 | 315 |
| Median Property Value | $274,400 | $229,600 |
| Median Household Income | $114,643 | $88 |
| Monthly Housing Costs | $658 | $2 |
| Real Estate Taxes | $2,811 | $9 |
Property Value by Mortgage Status in Crooks
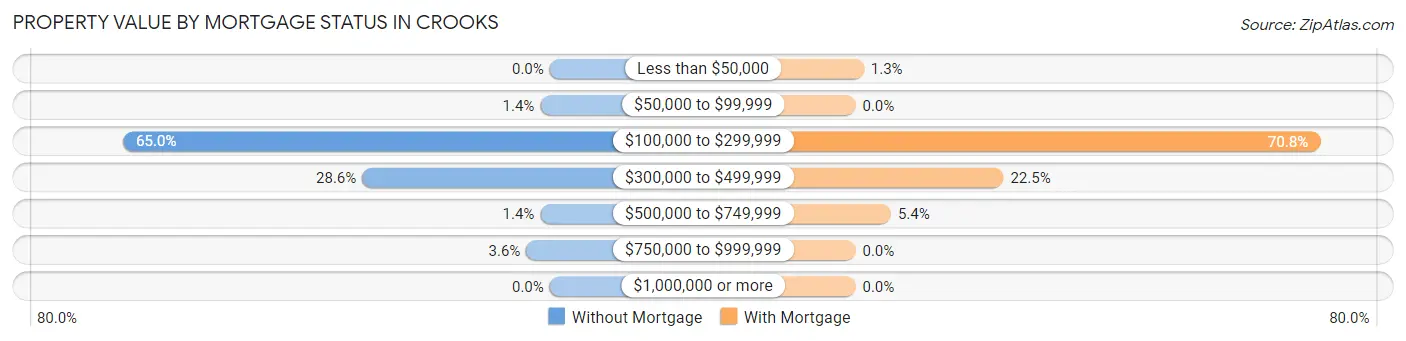
| Property Value | Without Mortgage | With Mortgage |
| Less than $50,000 | 0 (0.0%) | 4 (1.3%) |
| $50,000 to $99,999 | 2 (1.4%) | 0 (0.0%) |
| $100,000 to $299,999 | 91 (65.0%) | 223 (70.8%) |
| $300,000 to $499,999 | 40 (28.6%) | 71 (22.5%) |
| $500,000 to $749,999 | 2 (1.4%) | 17 (5.4%) |
| $750,000 to $999,999 | 5 (3.6%) | 0 (0.0%) |
| $1,000,000 or more | 0 (0.0%) | 0 (0.0%) |
| Total | 140 (100.0%) | 315 (100.0%) |
Household Income by Mortgage Status in Crooks
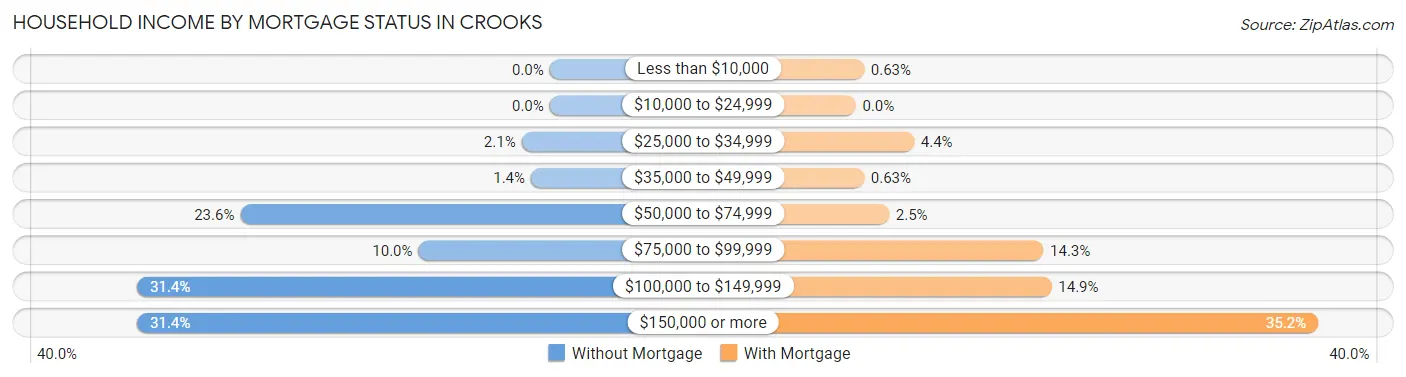
| Household Income | Without Mortgage | With Mortgage |
| Less than $10,000 | 0 (0.0%) | 2 (0.6%) |
| $10,000 to $24,999 | 0 (0.0%) | 0 (0.0%) |
| $25,000 to $34,999 | 3 (2.1%) | 14 (4.4%) |
| $35,000 to $49,999 | 2 (1.4%) | 2 (0.6%) |
| $50,000 to $74,999 | 33 (23.6%) | 8 (2.5%) |
| $75,000 to $99,999 | 14 (10.0%) | 45 (14.3%) |
| $100,000 to $149,999 | 44 (31.4%) | 47 (14.9%) |
| $150,000 or more | 44 (31.4%) | 111 (35.2%) |
| Total | 140 (100.0%) | 315 (100.0%) |
Property Value to Household Income Ratio in Crooks
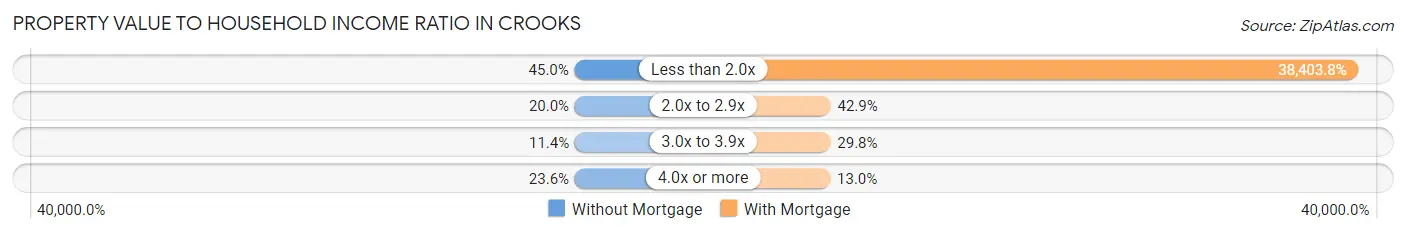
| Value-to-Income Ratio | Without Mortgage | With Mortgage |
| Less than 2.0x | 63 (45.0%) | 120,972 (38,403.8%) |
| 2.0x to 2.9x | 28 (20.0%) | 135 (42.9%) |
| 3.0x to 3.9x | 16 (11.4%) | 94 (29.8%) |
| 4.0x or more | 33 (23.6%) | 41 (13.0%) |
| Total | 140 (100.0%) | 315 (100.0%) |
Real Estate Taxes by Mortgage Status in Crooks
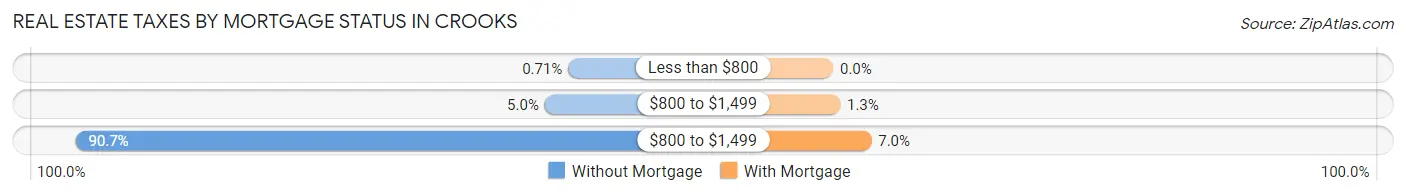
| Property Taxes | Without Mortgage | With Mortgage |
| Less than $800 | 1 (0.7%) | 0 (0.0%) |
| $800 to $1,499 | 7 (5.0%) | 4 (1.3%) |
| $800 to $1,499 | 127 (90.7%) | 22 (7.0%) |
| Total | 140 (100.0%) | 315 (100.0%) |
Health & Disability in Crooks
Health Insurance Coverage by Age in Crooks
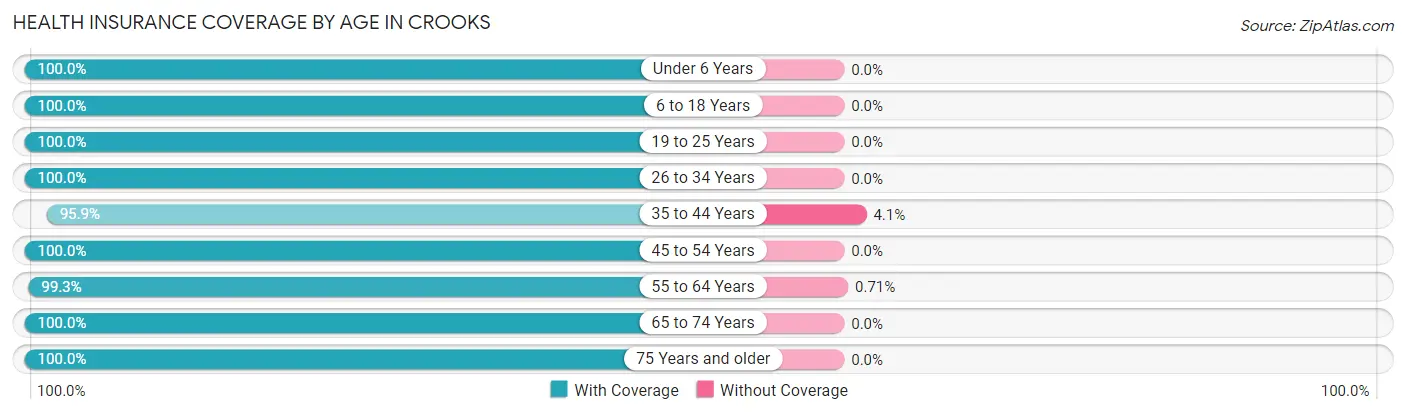
| Age Bracket | With Coverage | Without Coverage |
| Under 6 Years | 117 (100.0%) | 0 (0.0%) |
| 6 to 18 Years | 255 (100.0%) | 0 (0.0%) |
| 19 to 25 Years | 105 (100.0%) | 0 (0.0%) |
| 26 to 34 Years | 167 (100.0%) | 0 (0.0%) |
| 35 to 44 Years | 232 (95.9%) | 10 (4.1%) |
| 45 to 54 Years | 201 (100.0%) | 0 (0.0%) |
| 55 to 64 Years | 278 (99.3%) | 2 (0.7%) |
| 65 to 74 Years | 70 (100.0%) | 0 (0.0%) |
| 75 Years and older | 22 (100.0%) | 0 (0.0%) |
| Total | 1,447 (99.2%) | 12 (0.8%) |
Health Insurance Coverage by Citizenship Status in Crooks
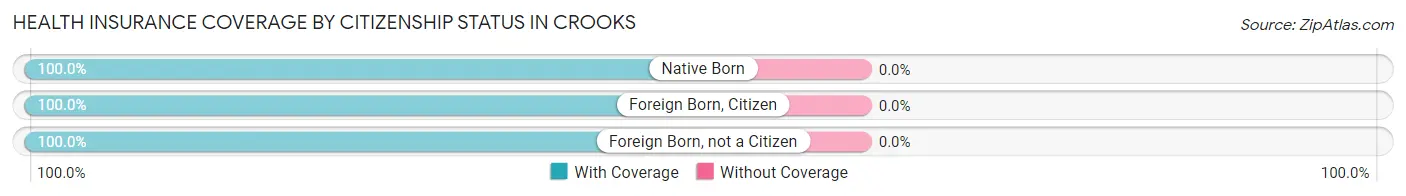
| Citizenship Status | With Coverage | Without Coverage |
| Native Born | 117 (100.0%) | 0 (0.0%) |
| Foreign Born, Citizen | 255 (100.0%) | 0 (0.0%) |
| Foreign Born, not a Citizen | 105 (100.0%) | 0 (0.0%) |
Health Insurance Coverage by Household Income in Crooks
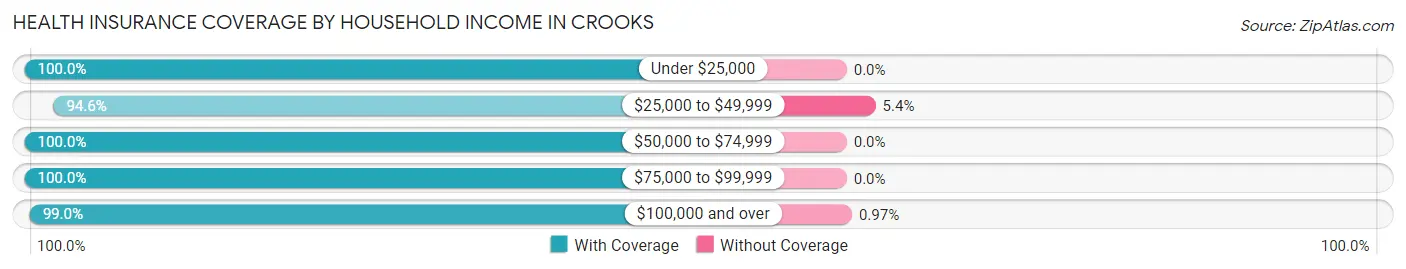
| Household Income | With Coverage | Without Coverage |
| Under $25,000 | 28 (100.0%) | 0 (0.0%) |
| $25,000 to $49,999 | 35 (94.6%) | 2 (5.4%) |
| $50,000 to $74,999 | 164 (100.0%) | 0 (0.0%) |
| $75,000 to $99,999 | 199 (100.0%) | 0 (0.0%) |
| $100,000 and over | 1,021 (99.0%) | 10 (1.0%) |
Public vs Private Health Insurance Coverage by Age in Crooks
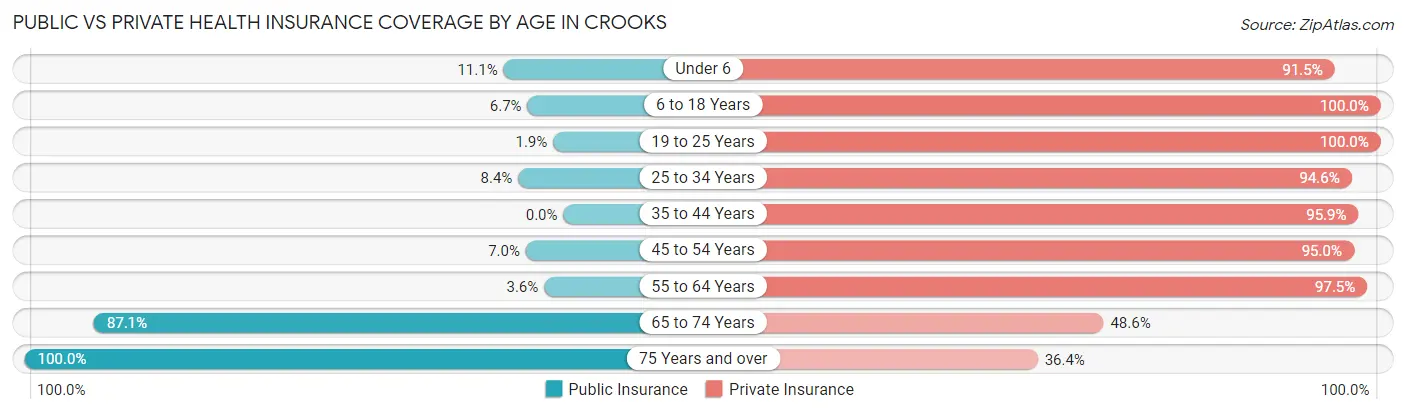
| Age Bracket | Public Insurance | Private Insurance |
| Under 6 | 13 (11.1%) | 107 (91.4%) |
| 6 to 18 Years | 17 (6.7%) | 255 (100.0%) |
| 19 to 25 Years | 2 (1.9%) | 105 (100.0%) |
| 25 to 34 Years | 14 (8.4%) | 158 (94.6%) |
| 35 to 44 Years | 0 (0.0%) | 232 (95.9%) |
| 45 to 54 Years | 14 (7.0%) | 191 (95.0%) |
| 55 to 64 Years | 10 (3.6%) | 273 (97.5%) |
| 65 to 74 Years | 61 (87.1%) | 34 (48.6%) |
| 75 Years and over | 22 (100.0%) | 8 (36.4%) |
| Total | 153 (10.5%) | 1,363 (93.4%) |
Disability Status by Sex by Age in Crooks
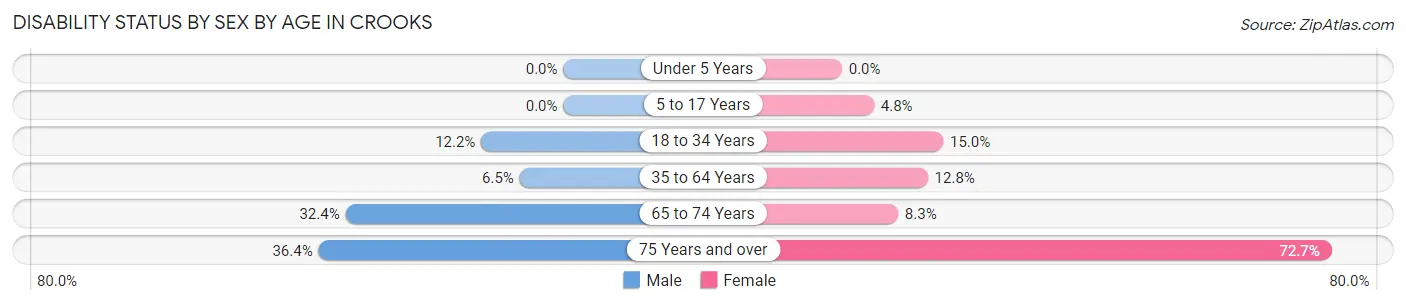
| Age Bracket | Male | Female |
| Under 5 Years | 0 (0.0%) | 0 (0.0%) |
| 5 to 17 Years | 0 (0.0%) | 5 (4.8%) |
| 18 to 34 Years | 20 (12.2%) | 20 (15.0%) |
| 35 to 64 Years | 24 (6.5%) | 45 (12.8%) |
| 65 to 74 Years | 11 (32.4%) | 3 (8.3%) |
| 75 Years and over | 4 (36.4%) | 8 (72.7%) |
Disability Class by Sex by Age in Crooks
Disability Class: Hearing Difficulty
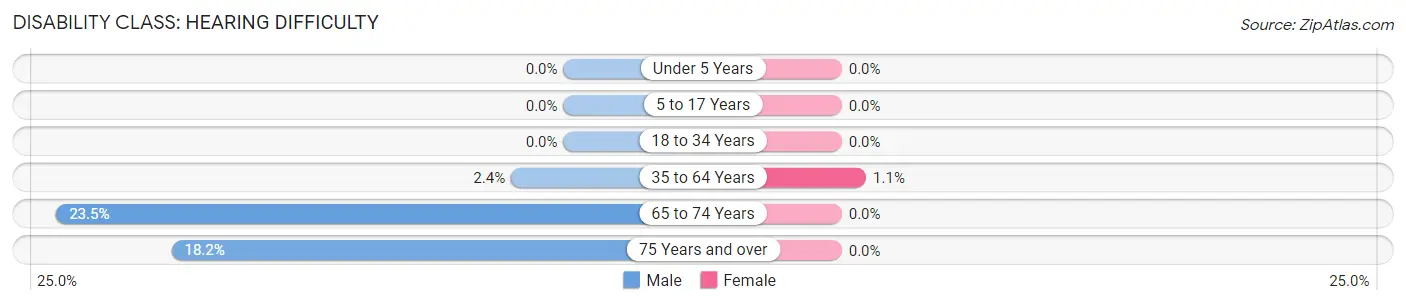
| Age Bracket | Male | Female |
| Under 5 Years | 0 (0.0%) | 0 (0.0%) |
| 5 to 17 Years | 0 (0.0%) | 0 (0.0%) |
| 18 to 34 Years | 0 (0.0%) | 0 (0.0%) |
| 35 to 64 Years | 9 (2.4%) | 4 (1.1%) |
| 65 to 74 Years | 8 (23.5%) | 0 (0.0%) |
| 75 Years and over | 2 (18.2%) | 0 (0.0%) |
Disability Class: Vision Difficulty
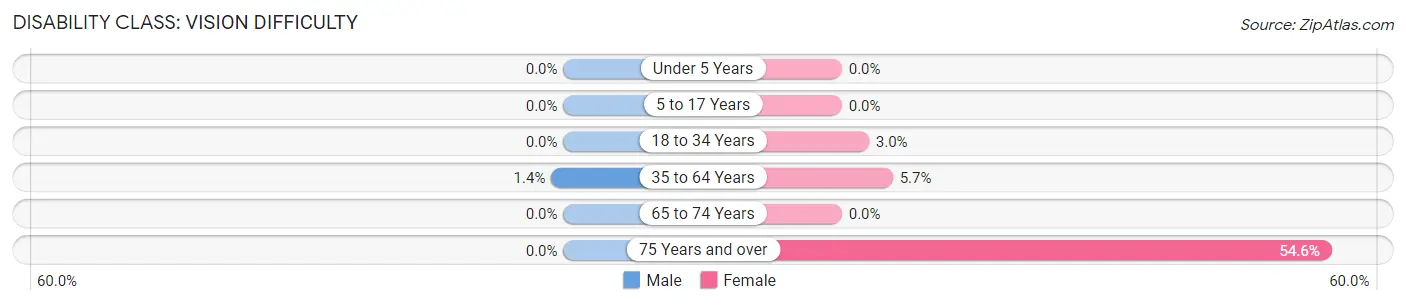
| Age Bracket | Male | Female |
| Under 5 Years | 0 (0.0%) | 0 (0.0%) |
| 5 to 17 Years | 0 (0.0%) | 0 (0.0%) |
| 18 to 34 Years | 0 (0.0%) | 4 (3.0%) |
| 35 to 64 Years | 5 (1.3%) | 20 (5.7%) |
| 65 to 74 Years | 0 (0.0%) | 0 (0.0%) |
| 75 Years and over | 0 (0.0%) | 6 (54.5%) |
Disability Class: Cognitive Difficulty
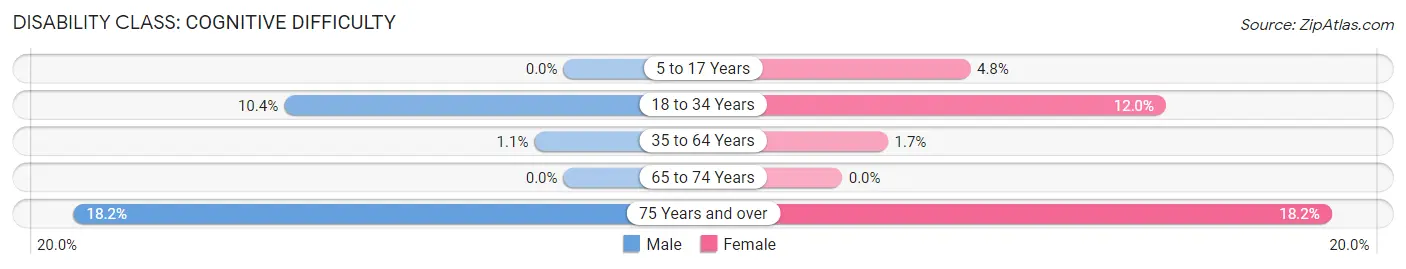
| Age Bracket | Male | Female |
| 5 to 17 Years | 0 (0.0%) | 5 (4.8%) |
| 18 to 34 Years | 17 (10.4%) | 16 (12.0%) |
| 35 to 64 Years | 4 (1.1%) | 6 (1.7%) |
| 65 to 74 Years | 0 (0.0%) | 0 (0.0%) |
| 75 Years and over | 2 (18.2%) | 2 (18.2%) |
Disability Class: Ambulatory Difficulty
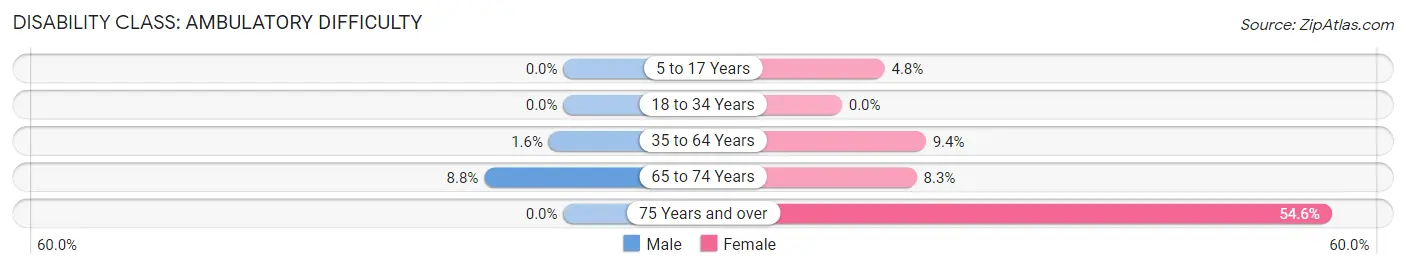
| Age Bracket | Male | Female |
| 5 to 17 Years | 0 (0.0%) | 5 (4.8%) |
| 18 to 34 Years | 0 (0.0%) | 0 (0.0%) |
| 35 to 64 Years | 6 (1.6%) | 33 (9.3%) |
| 65 to 74 Years | 3 (8.8%) | 3 (8.3%) |
| 75 Years and over | 0 (0.0%) | 6 (54.5%) |
Disability Class: Self-Care Difficulty
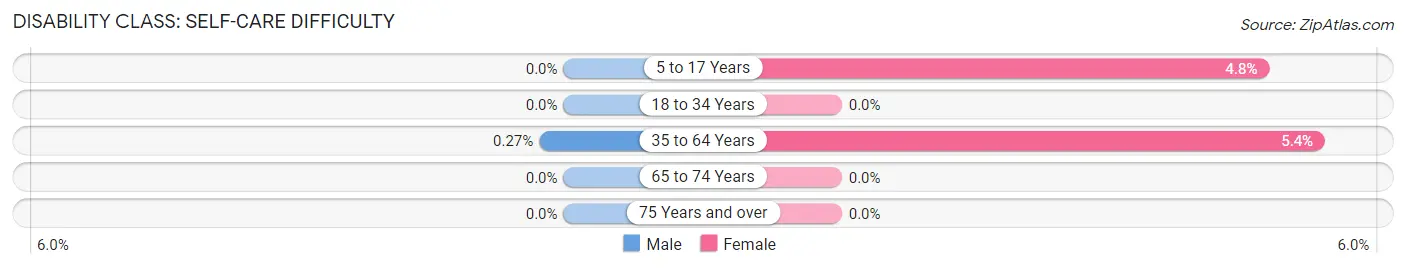
| Age Bracket | Male | Female |
| 5 to 17 Years | 0 (0.0%) | 5 (4.8%) |
| 18 to 34 Years | 0 (0.0%) | 0 (0.0%) |
| 35 to 64 Years | 1 (0.3%) | 19 (5.4%) |
| 65 to 74 Years | 0 (0.0%) | 0 (0.0%) |
| 75 Years and over | 0 (0.0%) | 0 (0.0%) |
Technology Access in Crooks
Computing Device Access in Crooks
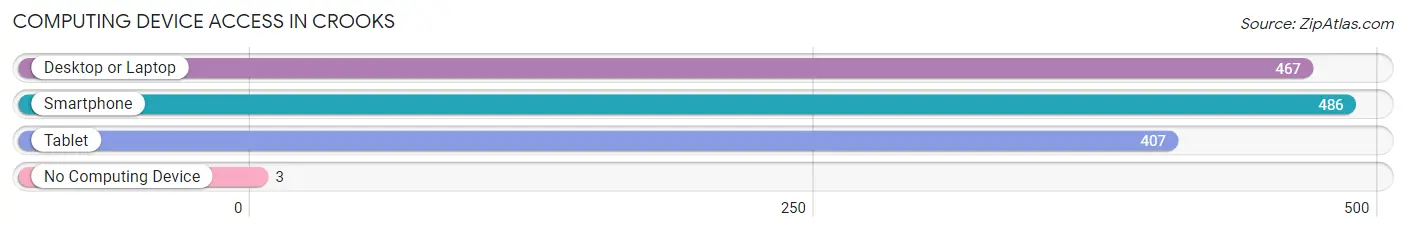
| Device Type | # Households | % Households |
| Desktop or Laptop | 467 | 92.8% |
| Smartphone | 486 | 96.6% |
| Tablet | 407 | 80.9% |
| No Computing Device | 3 | 0.6% |
| Total | 503 | 100.0% |
Internet Access in Crooks
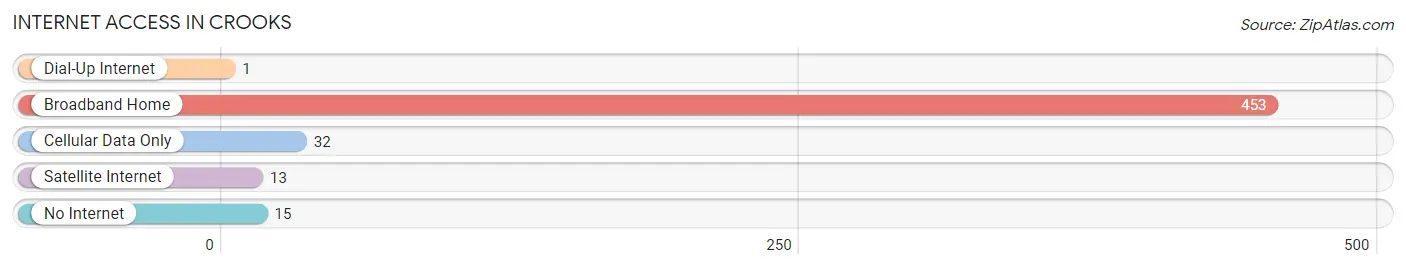
| Internet Type | # Households | % Households |
| Dial-Up Internet | 1 | 0.2% |
| Broadband Home | 453 | 90.1% |
| Cellular Data Only | 32 | 6.4% |
| Satellite Internet | 13 | 2.6% |
| No Internet | 15 | 3.0% |
| Total | 503 | 100.0% |
Crooks Summary
History
Crooks, South Dakota is a small town located in Minnehaha County, just outside of Sioux Falls. The town was founded in 1881 by a group of settlers from Wisconsin, who named the town after one of their own, John Crooks. The town was originally a farming community, and the settlers grew wheat, corn, and oats. As the town grew, so did its economy, and by the early 1900s, Crooks had become a thriving community with a variety of businesses, including a bank, a hotel, a general store, and a post office.
The town continued to grow throughout the 20th century, and by the 1950s, it had become a popular destination for tourists. The town was home to a variety of attractions, including a golf course, a swimming pool, and a movie theater. In the late 1960s, the town was incorporated, and in the 1970s, it began to experience a population boom. By the 1980s, the town had grown to a population of over 1,000 people.
Today, Crooks is a small but vibrant community. The town is home to a variety of businesses, including a grocery store, a hardware store, and a variety of restaurants. The town also has a number of parks and recreational facilities, including a skate park, a baseball field, and a swimming pool.
Geography
Crooks is located in Minnehaha County, South Dakota, just outside of Sioux Falls. The town is situated on the banks of the Big Sioux River, and is surrounded by rolling hills and farmland. The town is located in the Great Plains region of the United States, and has a humid continental climate, with hot summers and cold winters.
The town covers an area of 1.3 square miles, and has a population of 1,092 people, as of the 2010 census. The town is served by two major highways, Interstate 90 and US Highway 18.
Economy
Crooks is a small but vibrant community, and the town’s economy is largely based on agriculture and tourism. The town is home to a variety of businesses, including a grocery store, a hardware store, and a variety of restaurants. The town also has a number of parks and recreational facilities, including a skate park, a baseball field, and a swimming pool.
The town is also home to a number of manufacturing companies, including a plastics manufacturer, a metal fabrication company, and a printing company. The town is also home to a number of small businesses, including a bakery, a florist, and a variety of other retail stores.
Demographics
As of the 2010 census, the population of Crooks was 1,092 people. The town has a median age of 37.7 years, and a median household income of $50,000. The town is predominantly white, with 92.3% of the population identifying as white. The town also has a small Hispanic population, with 4.2% of the population identifying as Hispanic or Latino. The town also has a small African American population, with 1.2% of the population identifying as African American. The town also has a small Asian population, with 1.2% of the population identifying as Asian.
Common Questions
What is Per Capita Income in Crooks?
Per Capita income in Crooks is $57,934.
What is the Median Family Income in Crooks?
Median Family Income in Crooks is $117,609.
What is the Median Household income in Crooks?
Median Household Income in Crooks is $113,917.
What is Income or Wage Gap in Crooks?
Income or Wage Gap in Crooks is 29.9%.
Women in Crooks earn 70.1 cents for every dollar earned by a man.
What is Inequality or Gini Index in Crooks?
Inequality or Gini Index in Crooks is 0.42.
What is the Total Population of Crooks?
Total Population of Crooks is 1,463.
What is the Total Male Population of Crooks?
Total Male Population of Crooks is 759.
What is the Total Female Population of Crooks?
Total Female Population of Crooks is 704.
What is the Ratio of Males per 100 Females in Crooks?
There are 107.81 Males per 100 Females in Crooks.
What is the Ratio of Females per 100 Males in Crooks?
There are 92.75 Females per 100 Males in Crooks.
What is the Median Population Age in Crooks?
Median Population Age in Crooks is 39.5 Years.
What is the Average Family Size in Crooks
Average Family Size in Crooks is 3.1 People.
What is the Average Household Size in Crooks
Average Household Size in Crooks is 2.9 People.
How Large is the Labor Force in Crooks?
There are 977 People in the Labor Forcein in Crooks.
What is the Percentage of People in the Labor Force in Crooks?
84.8% of People are in the Labor Force in Crooks.
What is the Unemployment Rate in Crooks?
Unemployment Rate in Crooks is 2.0%.