Milbank, SD Map & Demographics
Milbank Map
Milbank Overview
$40,193
PER CAPITA INCOME
$85,118
AVG FAMILY INCOME
$63,269
AVG HOUSEHOLD INCOME
47.9%
WAGE / INCOME GAP [ % ]
52.1¢/ $1
WAGE / INCOME GAP [ $ ]
0.51
INEQUALITY / GINI INDEX
3,506
TOTAL POPULATION
1,596
MALE POPULATION
1,910
FEMALE POPULATION
83.56
MALES / 100 FEMALES
119.67
FEMALES / 100 MALES
42.3
MEDIAN AGE
2.8
AVG FAMILY SIZE
2.3
AVG HOUSEHOLD SIZE
1,739
LABOR FORCE [ PEOPLE ]
61.3%
PERCENT IN LABOR FORCE
4.0%
UNEMPLOYMENT RATE
Milbank Zip Codes
Milbank Area Codes
Income in Milbank
Income Overview in Milbank
Per Capita Income in Milbank is $40,193, while median incomes of families and households are $85,118 and $63,269 respectively.
| Characteristic | Number | Measure |
| Per Capita Income | 3,506 | $40,193 |
| Median Family Income | 971 | $85,118 |
| Mean Family Income | 971 | $114,433 |
| Median Household Income | 1,446 | $63,269 |
| Mean Household Income | 1,446 | $90,445 |
| Income Deficit | 971 | $0 |
| Wage / Income Gap (%) | 3,506 | 47.94% |
| Wage / Income Gap ($) | 3,506 | 52.06¢ per $1 |
| Gini / Inequality Index | 3,506 | 0.51 |
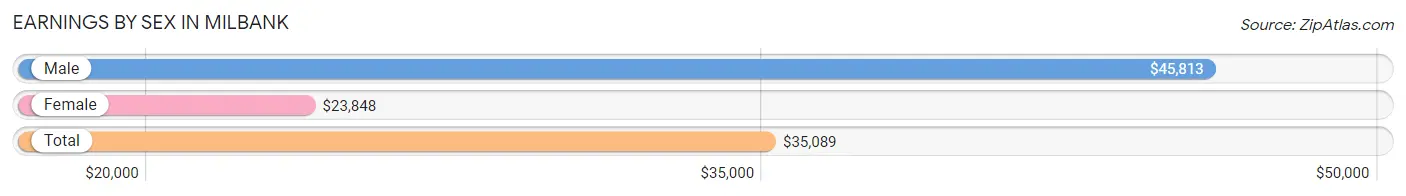
Earnings by Sex in Milbank
Average Earnings in Milbank are $35,089, $45,813 for men and $23,848 for women, a difference of 47.9%.
| Sex | Number | Average Earnings |
| Male | 1,050 (53.5%) | $45,813 |
| Female | 913 (46.5%) | $23,848 |
| Total | 1,963 (100.0%) | $35,089 |
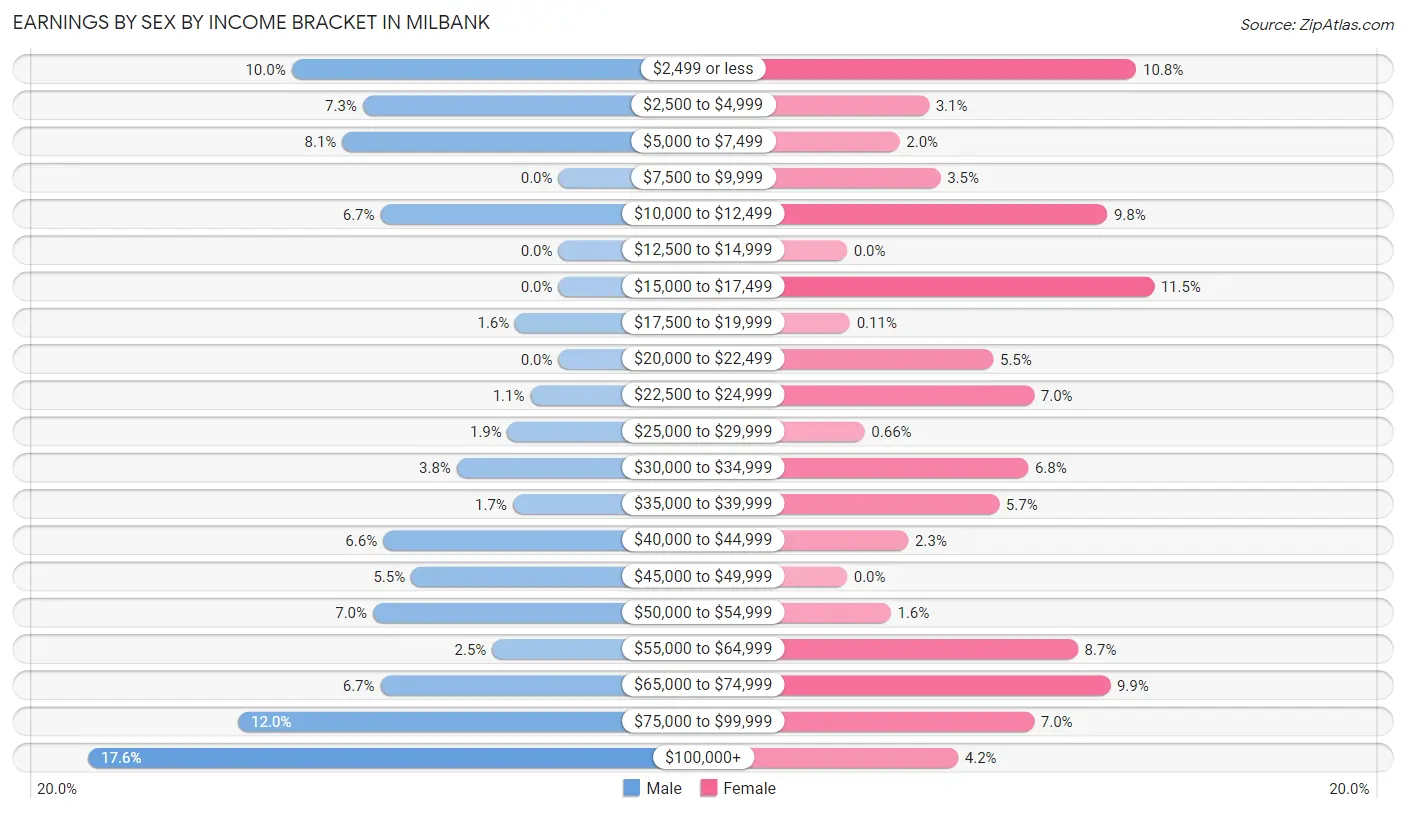
Earnings by Sex by Income Bracket in Milbank
The most common earnings brackets in Milbank are $100,000+ for men (185 | 17.6%) and $15,000 to $17,499 for women (105 | 11.5%).
| Income | Male | Female |
| $2,499 or less | 105 (10.0%) | 99 (10.8%) |
| $2,500 to $4,999 | 77 (7.3%) | 28 (3.1%) |
| $5,000 to $7,499 | 85 (8.1%) | 18 (2.0%) |
| $7,500 to $9,999 | 0 (0.0%) | 32 (3.5%) |
| $10,000 to $12,499 | 70 (6.7%) | 89 (9.8%) |
| $12,500 to $14,999 | 0 (0.0%) | 0 (0.0%) |
| $15,000 to $17,499 | 0 (0.0%) | 105 (11.5%) |
| $17,500 to $19,999 | 17 (1.6%) | 1 (0.1%) |
| $20,000 to $22,499 | 0 (0.0%) | 50 (5.5%) |
| $22,500 to $24,999 | 11 (1.1%) | 64 (7.0%) |
| $25,000 to $29,999 | 20 (1.9%) | 6 (0.7%) |
| $30,000 to $34,999 | 40 (3.8%) | 62 (6.8%) |
| $35,000 to $39,999 | 18 (1.7%) | 52 (5.7%) |
| $40,000 to $44,999 | 69 (6.6%) | 21 (2.3%) |
| $45,000 to $49,999 | 58 (5.5%) | 0 (0.0%) |
| $50,000 to $54,999 | 73 (7.0%) | 15 (1.6%) |
| $55,000 to $64,999 | 26 (2.5%) | 79 (8.6%) |
| $65,000 to $74,999 | 70 (6.7%) | 90 (9.9%) |
| $75,000 to $99,999 | 126 (12.0%) | 64 (7.0%) |
| $100,000+ | 185 (17.6%) | 38 (4.2%) |
| Total | 1,050 (100.0%) | 913 (100.0%) |
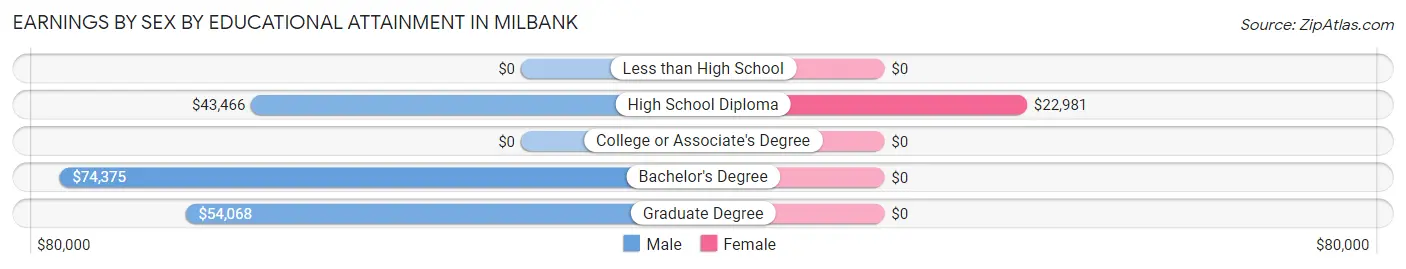
Earnings by Sex by Educational Attainment in Milbank
Average earnings in Milbank are $52,627 for men and $25,417 for women, a difference of 51.7%. Men with an educational attainment of bachelor's degree enjoy the highest average annual earnings of $74,375, while those with high school diploma education earn the least with $43,466. Women with an educational attainment of high school diploma earn the most with the average annual earnings of $22,981, while those with high school diploma education have the smallest earnings of $22,981.
| Educational Attainment | Male Income | Female Income |
| Less than High School | - | - |
| High School Diploma | $43,466 | $22,981 |
| College or Associate's Degree | - | - |
| Bachelor's Degree | $74,375 | $0 |
| Graduate Degree | $54,068 | $0 |
| Total | $52,627 | $25,417 |
Family Income in Milbank
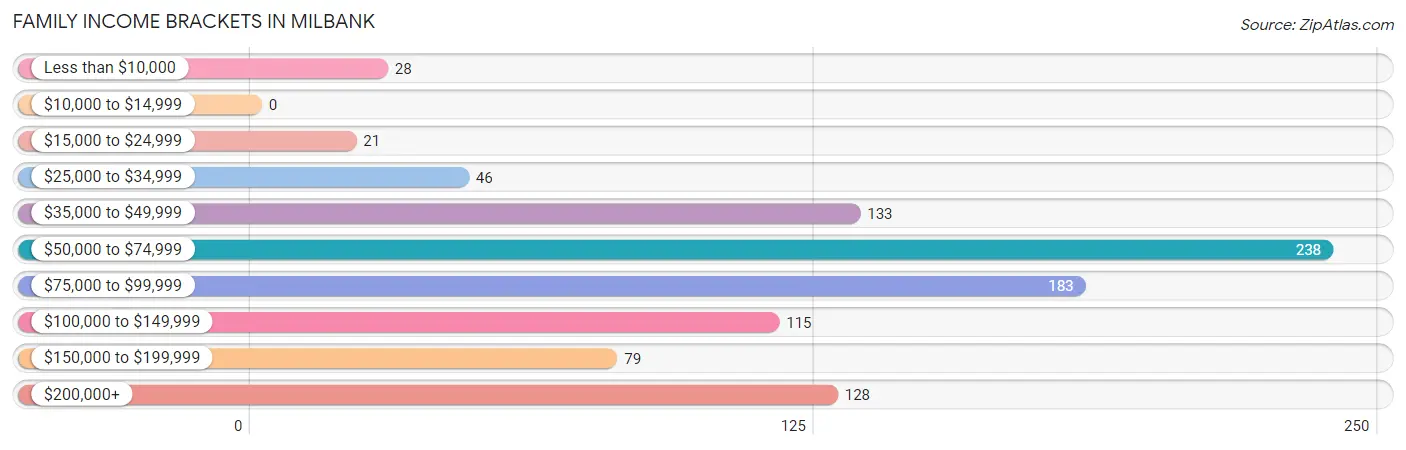
Family Income Brackets in Milbank
According to the Milbank family income data, there are 238 families falling into the $50,000 to $74,999 income range, which is the most common income bracket and makes up 24.5% of all families.
| Income Bracket | # Families | % Families |
| Less than $10,000 | 28 | 2.9% |
| $10,000 to $14,999 | 0 | 0.0% |
| $15,000 to $24,999 | 21 | 2.2% |
| $25,000 to $34,999 | 46 | 4.7% |
| $35,000 to $49,999 | 133 | 13.7% |
| $50,000 to $74,999 | 238 | 24.5% |
| $75,000 to $99,999 | 183 | 18.8% |
| $100,000 to $149,999 | 115 | 11.8% |
| $150,000 to $199,999 | 79 | 8.1% |
| $200,000+ | 128 | 13.2% |
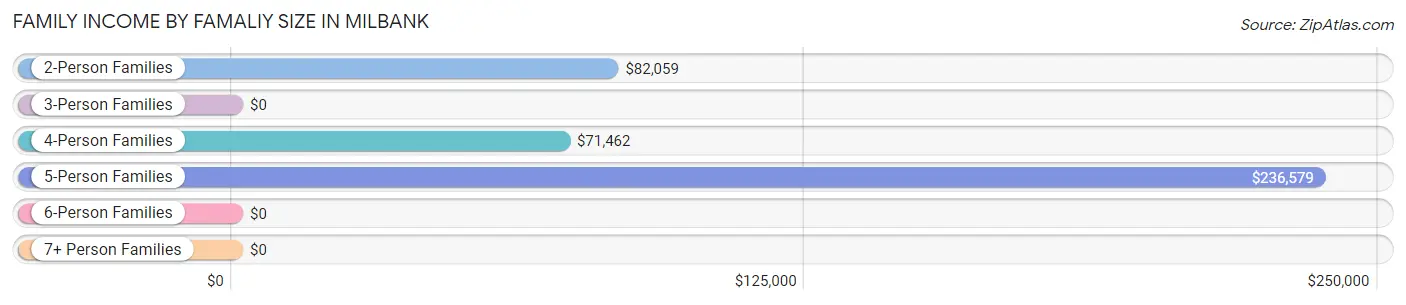
Family Income by Famaliy Size in Milbank
5-person families (76 | 7.8%) account for the highest median family income in Milbank with $236,579 per family, while 5-person families (76 | 7.8%) have the highest median income of $47,316 per family member.
| Income Bracket | # Families | Median Income |
| 2-Person Families | 498 (51.3%) | $82,059 |
| 3-Person Families | 161 (16.6%) | $0 |
| 4-Person Families | 205 (21.1%) | $71,462 |
| 5-Person Families | 76 (7.8%) | $236,579 |
| 6-Person Families | 31 (3.2%) | $0 |
| 7+ Person Families | 0 (0.0%) | $0 |
| Total | 971 (100.0%) | $85,118 |
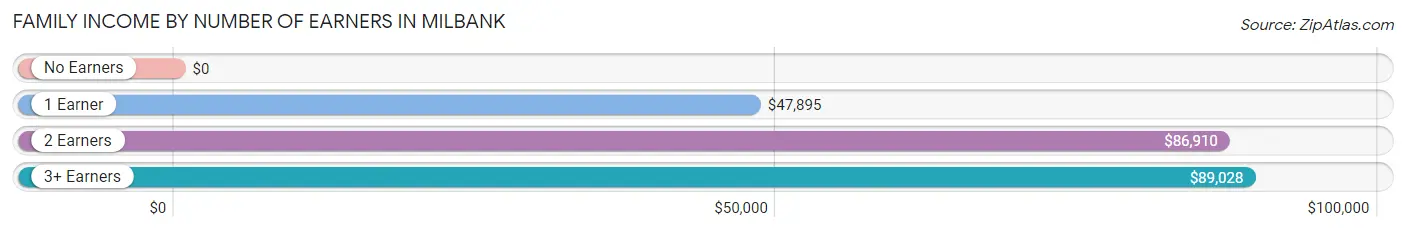
Family Income by Number of Earners in Milbank
| Number of Earners | # Families | Median Income |
| No Earners | 63 (6.5%) | $0 |
| 1 Earner | 286 (29.4%) | $47,895 |
| 2 Earners | 539 (55.5%) | $86,910 |
| 3+ Earners | 83 (8.6%) | $89,028 |
| Total | 971 (100.0%) | $85,118 |
Household Income in Milbank
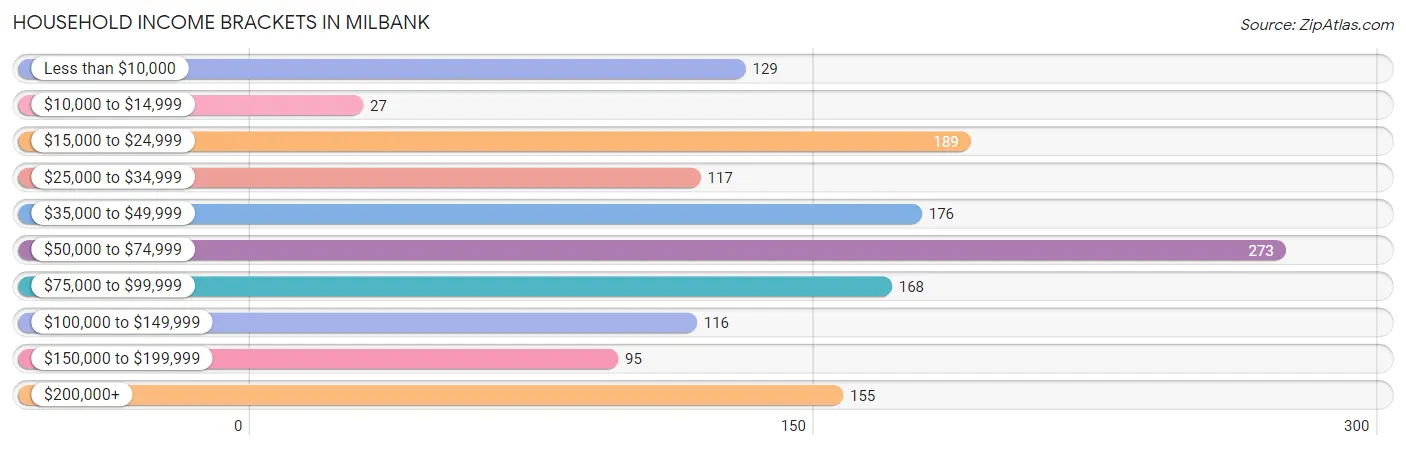
Household Income Brackets in Milbank
With 273 households falling in the category, the $50,000 to $74,999 income range is the most frequent in Milbank, accounting for 18.9% of all households. In contrast, only 27 households (1.9%) fall into the $10,000 to $14,999 income bracket, making it the least populous group.
| Income Bracket | # Households | % Households |
| Less than $10,000 | 129 | 8.9% |
| $10,000 to $14,999 | 27 | 1.9% |
| $15,000 to $24,999 | 189 | 13.1% |
| $25,000 to $34,999 | 117 | 8.1% |
| $35,000 to $49,999 | 176 | 12.2% |
| $50,000 to $74,999 | 273 | 18.9% |
| $75,000 to $99,999 | 168 | 11.6% |
| $100,000 to $149,999 | 116 | 8.0% |
| $150,000 to $199,999 | 95 | 6.6% |
| $200,000+ | 155 | 10.7% |
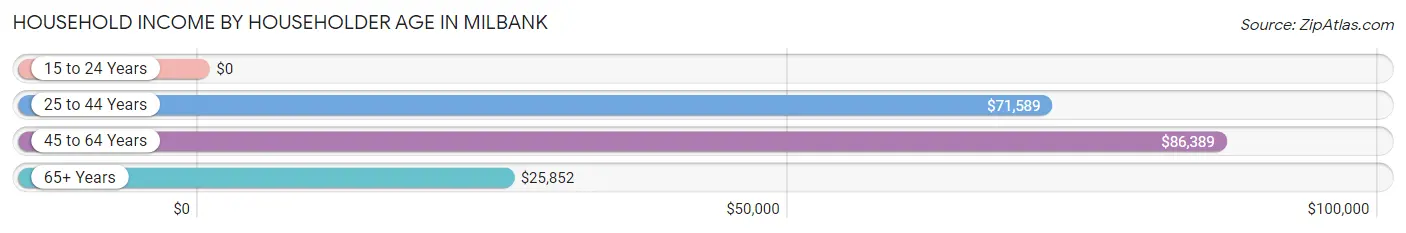
Household Income by Householder Age in Milbank
The median household income in Milbank is $63,269, with the highest median household income of $86,389 found in the 45 to 64 years age bracket for the primary householder. A total of 414 households (28.6%) fall into this category. Meanwhile, the 15 to 24 years age bracket for the primary householder has the lowest median household income of $0, with 50 households (3.5%) in this group.
| Income Bracket | # Households | Median Income |
| 15 to 24 Years | 50 (3.5%) | $0 |
| 25 to 44 Years | 427 (29.5%) | $71,589 |
| 45 to 64 Years | 414 (28.6%) | $86,389 |
| 65+ Years | 555 (38.4%) | $25,852 |
| Total | 1,446 (100.0%) | $63,269 |
Poverty in Milbank
Income Below Poverty by Sex and Age in Milbank
With 9.0% poverty level for males and 13.3% for females among the residents of Milbank, 18 to 24 year old males and 75 year old and over females are the most vulnerable to poverty, with 73 males (59.4%) and 105 females (43.0%) in their respective age groups living below the poverty level.
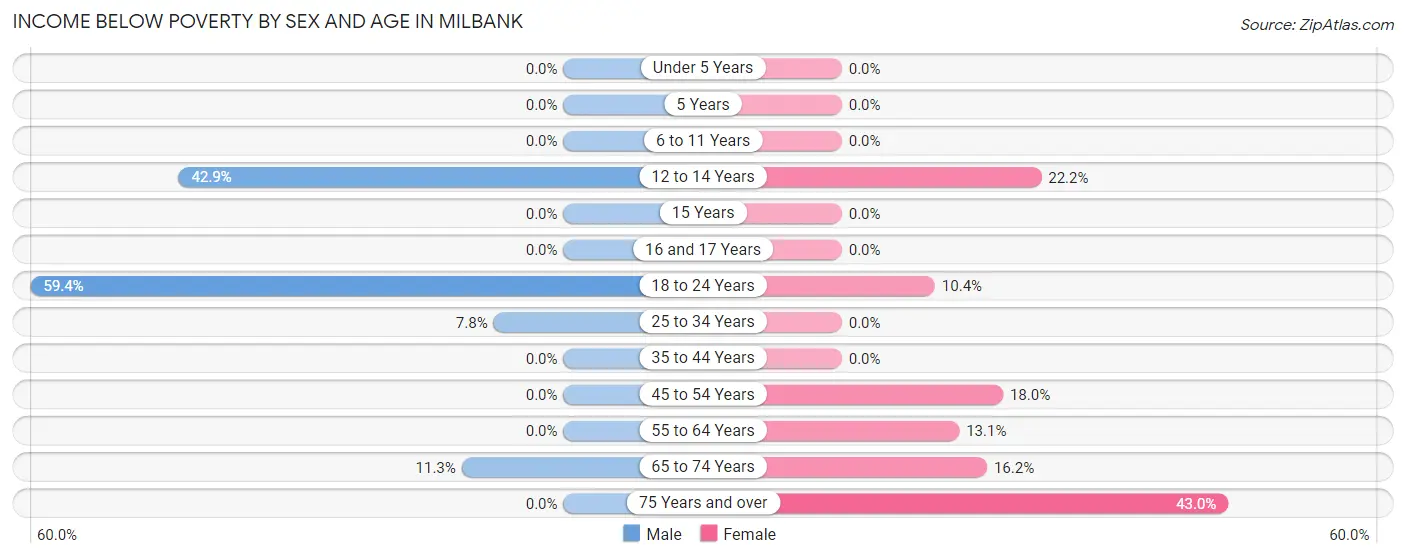
| Age Bracket | Male | Female |
| Under 5 Years | 0 (0.0%) | 0 (0.0%) |
| 5 Years | 0 (0.0%) | 0 (0.0%) |
| 6 to 11 Years | 0 (0.0%) | 0 (0.0%) |
| 12 to 14 Years | 24 (42.9%) | 28 (22.2%) |
| 15 Years | 0 (0.0%) | 0 (0.0%) |
| 16 and 17 Years | 0 (0.0%) | 0 (0.0%) |
| 18 to 24 Years | 73 (59.4%) | 14 (10.4%) |
| 25 to 34 Years | 20 (7.8%) | 0 (0.0%) |
| 35 to 44 Years | 0 (0.0%) | 0 (0.0%) |
| 45 to 54 Years | 0 (0.0%) | 28 (17.9%) |
| 55 to 64 Years | 0 (0.0%) | 34 (13.1%) |
| 65 to 74 Years | 23 (11.3%) | 38 (16.2%) |
| 75 Years and over | 0 (0.0%) | 105 (43.0%) |
| Total | 140 (9.0%) | 247 (13.3%) |
Income Above Poverty by Sex and Age in Milbank
According to the poverty statistics in Milbank, males aged under 5 years and females aged under 5 years are the age groups that are most secure financially, with 100.0% of males and 100.0% of females in these age groups living above the poverty line.
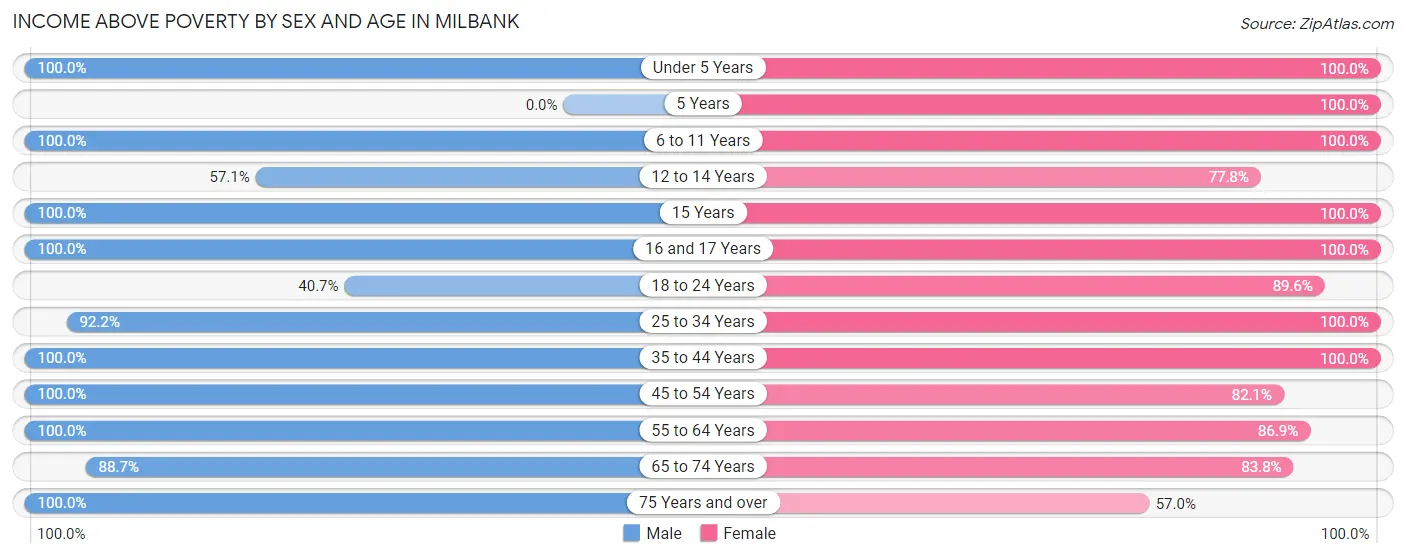
| Age Bracket | Male | Female |
| Under 5 Years | 94 (100.0%) | 111 (100.0%) |
| 5 Years | 0 (0.0%) | 31 (100.0%) |
| 6 to 11 Years | 118 (100.0%) | 78 (100.0%) |
| 12 to 14 Years | 32 (57.1%) | 98 (77.8%) |
| 15 Years | 16 (100.0%) | 39 (100.0%) |
| 16 and 17 Years | 37 (100.0%) | 13 (100.0%) |
| 18 to 24 Years | 50 (40.6%) | 121 (89.6%) |
| 25 to 34 Years | 237 (92.2%) | 238 (100.0%) |
| 35 to 44 Years | 159 (100.0%) | 187 (100.0%) |
| 45 to 54 Years | 109 (100.0%) | 128 (82.1%) |
| 55 to 64 Years | 282 (100.0%) | 226 (86.9%) |
| 65 to 74 Years | 180 (88.7%) | 197 (83.8%) |
| 75 Years and over | 100 (100.0%) | 139 (57.0%) |
| Total | 1,414 (91.0%) | 1,606 (86.7%) |
Income Below Poverty Among Married-Couple Families in Milbank
The poverty statistics for married-couple families in Milbank show that 2.4% or 21 of the total 860 families live below the poverty line. Families with no children have the highest poverty rate of 3.9%, comprising of 21 families. On the other hand, families with 1 or 2 children have the lowest poverty rate of 0.0%, which includes 0 families.
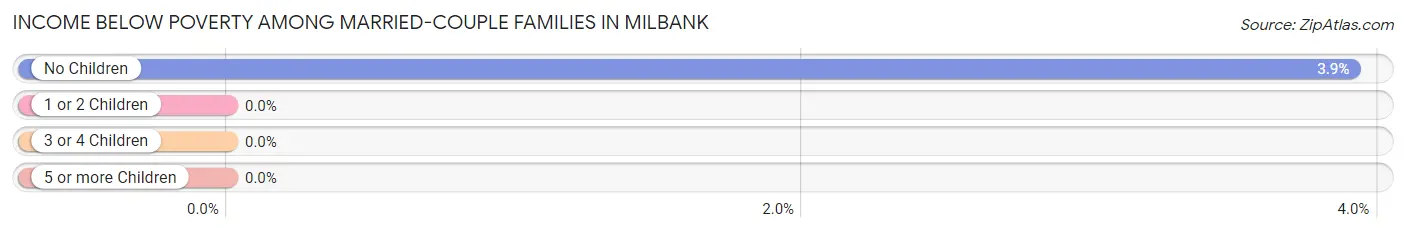
| Children | Above Poverty | Below Poverty |
| No Children | 516 (96.1%) | 21 (3.9%) |
| 1 or 2 Children | 216 (100.0%) | 0 (0.0%) |
| 3 or 4 Children | 107 (100.0%) | 0 (0.0%) |
| 5 or more Children | 0 (0.0%) | 0 (0.0%) |
| Total | 839 (97.6%) | 21 (2.4%) |
Income Below Poverty Among Single-Parent Households in Milbank
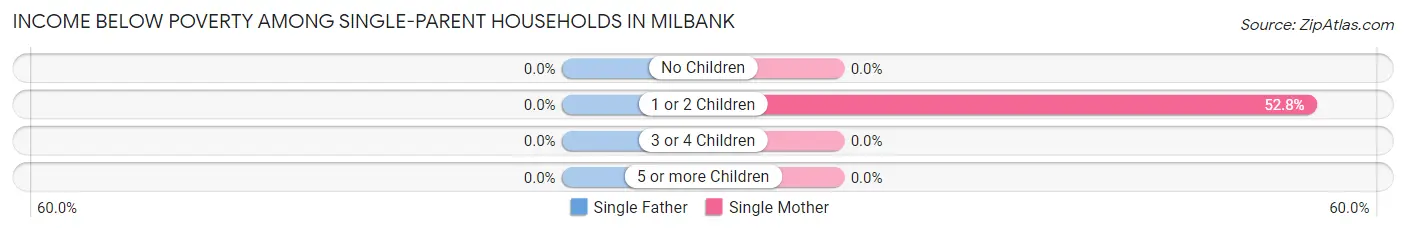
| Children | Single Father | Single Mother |
| No Children | 0 (0.0%) | 0 (0.0%) |
| 1 or 2 Children | 0 (0.0%) | 28 (52.8%) |
| 3 or 4 Children | 0 (0.0%) | 0 (0.0%) |
| 5 or more Children | 0 (0.0%) | 0 (0.0%) |
| Total | 0 (0.0%) | 28 (25.2%) |
Income Below Poverty Among Married-Couple vs Single-Parent Households in Milbank
The poverty data for Milbank shows that 21 of the married-couple family households (2.4%) and 28 of the single-parent households (25.2%) are living below the poverty level. Within the married-couple family households, those with no children have the highest poverty rate, with 21 households (3.9%) falling below the poverty line. Among the single-parent households, those with 1 or 2 children have the highest poverty rate, with 28 household (52.8%) living below poverty.
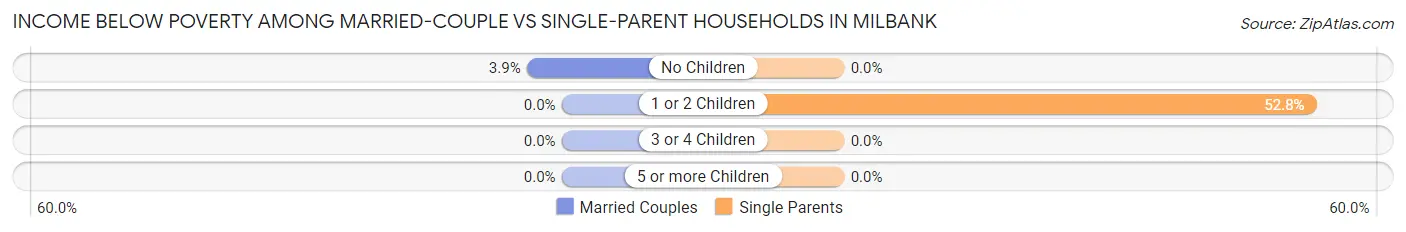
| Children | Married-Couple Families | Single-Parent Households |
| No Children | 21 (3.9%) | 0 (0.0%) |
| 1 or 2 Children | 0 (0.0%) | 28 (52.8%) |
| 3 or 4 Children | 0 (0.0%) | 0 (0.0%) |
| 5 or more Children | 0 (0.0%) | 0 (0.0%) |
| Total | 21 (2.4%) | 28 (25.2%) |
Race in Milbank
The most populous races in Milbank are White / Caucasian (3,160 | 90.1%), Hispanic or Latino (291 | 8.3%), and Some other Race (248 | 7.1%).
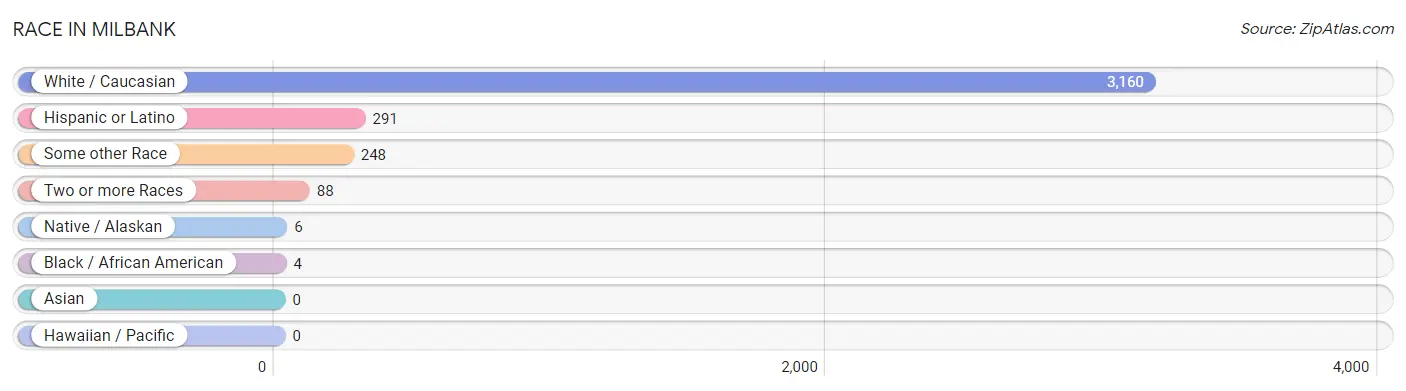
| Race | # Population | % Population |
| Asian | 0 | 0.0% |
| Black / African American | 4 | 0.1% |
| Hawaiian / Pacific | 0 | 0.0% |
| Hispanic or Latino | 291 | 8.3% |
| Native / Alaskan | 6 | 0.2% |
| White / Caucasian | 3,160 | 90.1% |
| Two or more Races | 88 | 2.5% |
| Some other Race | 248 | 7.1% |
| Total | 3,506 | 100.0% |
Ancestry in Milbank
The most populous ancestries reported in Milbank are German (1,626 | 46.4%), Norwegian (547 | 15.6%), Swedish (273 | 7.8%), Mexican (261 | 7.4%), and Irish (241 | 6.9%), together accounting for 84.1% of all Milbank residents.
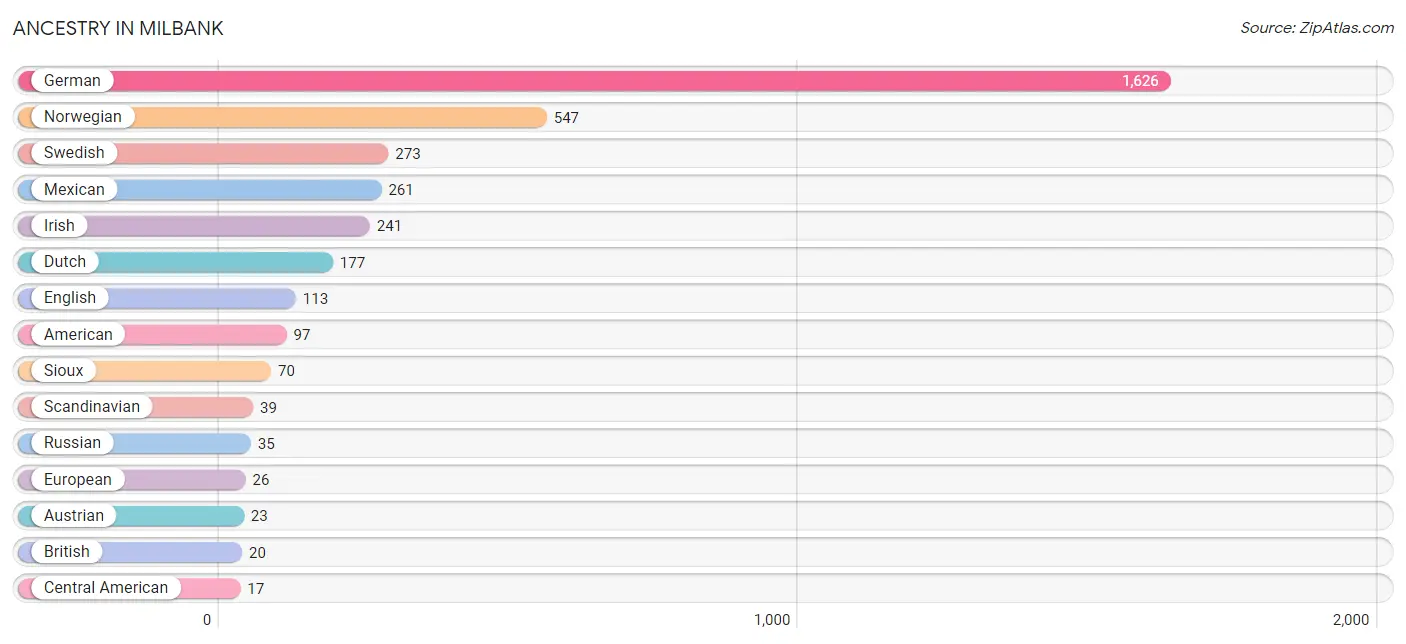
| Ancestry | # Population | % Population |
| American | 97 | 2.8% |
| Austrian | 23 | 0.7% |
| British | 20 | 0.6% |
| Central American | 17 | 0.5% |
| Cherokee | 2 | 0.1% |
| Czech | 15 | 0.4% |
| Czechoslovakian | 13 | 0.4% |
| Danish | 14 | 0.4% |
| Dutch | 177 | 5.1% |
| English | 113 | 3.2% |
| European | 26 | 0.7% |
| French | 14 | 0.4% |
| German | 1,626 | 46.4% |
| Guatemalan | 17 | 0.5% |
| Irish | 241 | 6.9% |
| Mexican | 261 | 7.4% |
| Norwegian | 547 | 15.6% |
| Puerto Rican | 1 | 0.0% |
| Russian | 35 | 1.0% |
| Scandinavian | 39 | 1.1% |
| Scottish | 10 | 0.3% |
| Sioux | 70 | 2.0% |
| Spanish | 12 | 0.3% |
| Subsaharan African | 4 | 0.1% |
| Swedish | 273 | 7.8% |
| Ugandan | 4 | 0.1% | View All 26 Rows |
Immigrants in Milbank
The most numerous immigrant groups reported in Milbank came from Latin America (237 | 6.8%), Central America (217 | 6.2%), Mexico (211 | 6.0%), Brazil (20 | 0.6%), and South America (20 | 0.6%), together accounting for 20.1% of all Milbank residents.
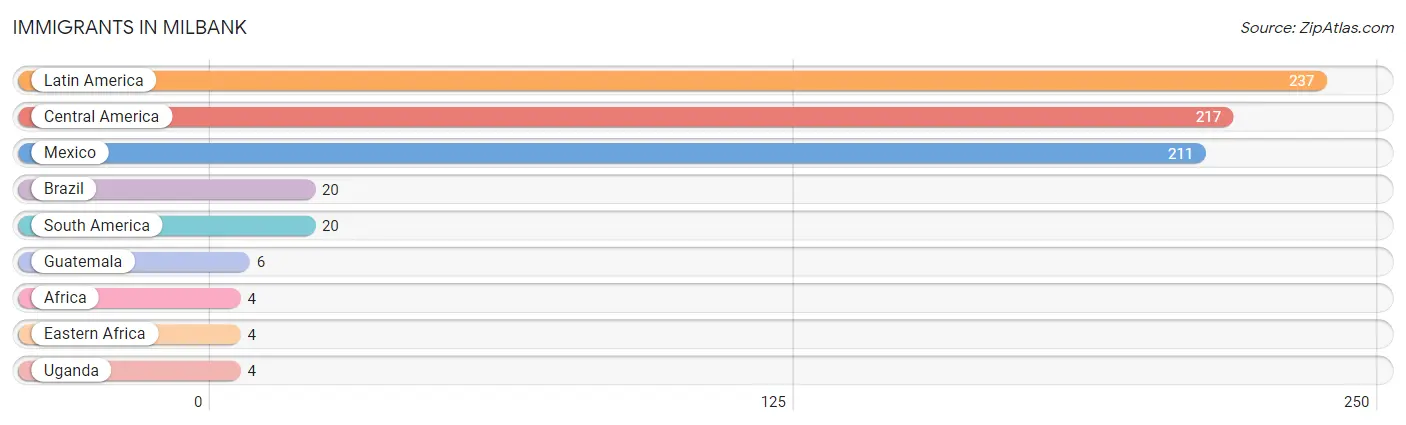
| Immigration Origin | # Population | % Population |
| Africa | 4 | 0.1% |
| Brazil | 20 | 0.6% |
| Central America | 217 | 6.2% |
| Eastern Africa | 4 | 0.1% |
| Guatemala | 6 | 0.2% |
| Latin America | 237 | 6.8% |
| Mexico | 211 | 6.0% |
| South America | 20 | 0.6% |
| Uganda | 4 | 0.1% | View All 9 Rows |
Sex and Age in Milbank
Sex and Age in Milbank
The most populous age groups in Milbank are 30 to 34 Years (150 | 9.4%) for men and 60 to 64 Years (159 | 8.3%) for women.
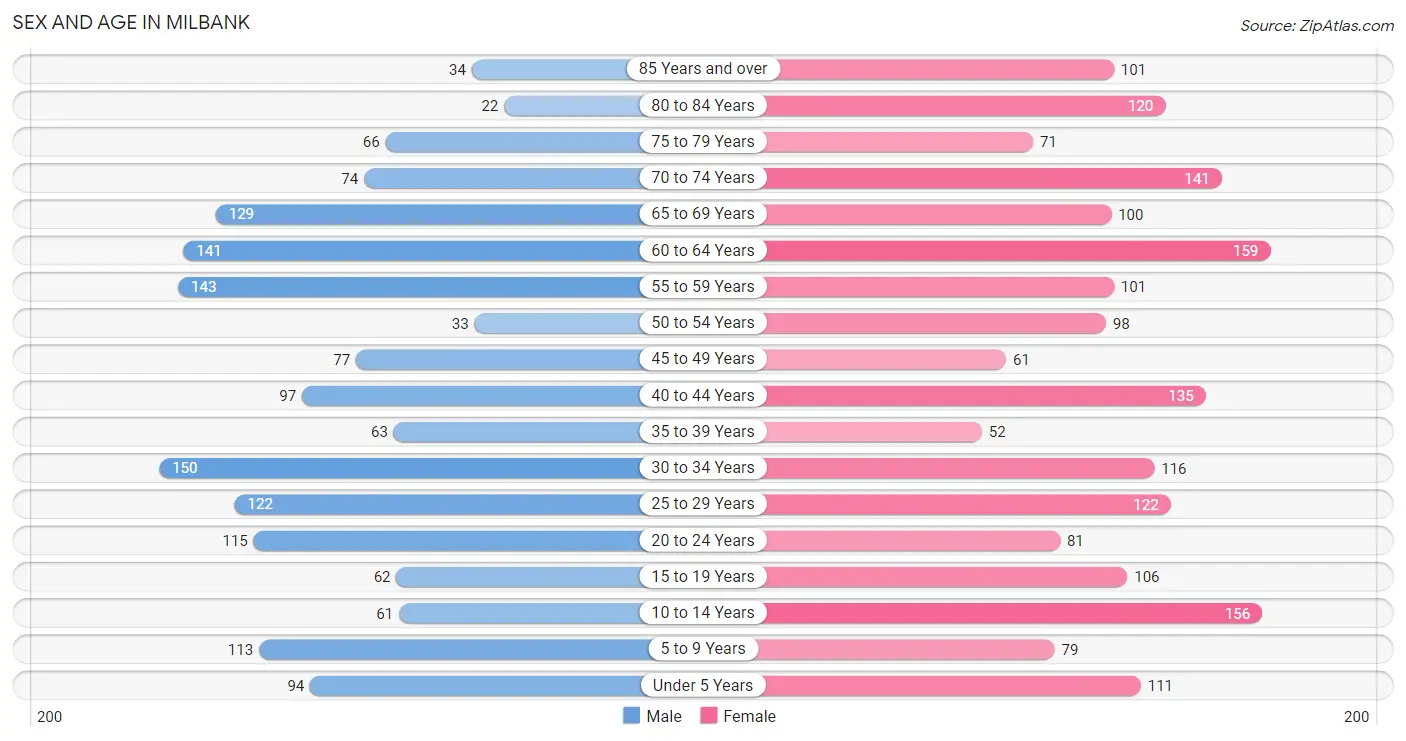
| Age Bracket | Male | Female |
| Under 5 Years | 94 (5.9%) | 111 (5.8%) |
| 5 to 9 Years | 113 (7.1%) | 79 (4.1%) |
| 10 to 14 Years | 61 (3.8%) | 156 (8.2%) |
| 15 to 19 Years | 62 (3.9%) | 106 (5.6%) |
| 20 to 24 Years | 115 (7.2%) | 81 (4.2%) |
| 25 to 29 Years | 122 (7.6%) | 122 (6.4%) |
| 30 to 34 Years | 150 (9.4%) | 116 (6.1%) |
| 35 to 39 Years | 63 (4.0%) | 52 (2.7%) |
| 40 to 44 Years | 97 (6.1%) | 135 (7.1%) |
| 45 to 49 Years | 77 (4.8%) | 61 (3.2%) |
| 50 to 54 Years | 33 (2.1%) | 98 (5.1%) |
| 55 to 59 Years | 143 (9.0%) | 101 (5.3%) |
| 60 to 64 Years | 141 (8.8%) | 159 (8.3%) |
| 65 to 69 Years | 129 (8.1%) | 100 (5.2%) |
| 70 to 74 Years | 74 (4.6%) | 141 (7.4%) |
| 75 to 79 Years | 66 (4.1%) | 71 (3.7%) |
| 80 to 84 Years | 22 (1.4%) | 120 (6.3%) |
| 85 Years and over | 34 (2.1%) | 101 (5.3%) |
| Total | 1,596 (100.0%) | 1,910 (100.0%) |
Families and Households in Milbank
Median Family Size in Milbank
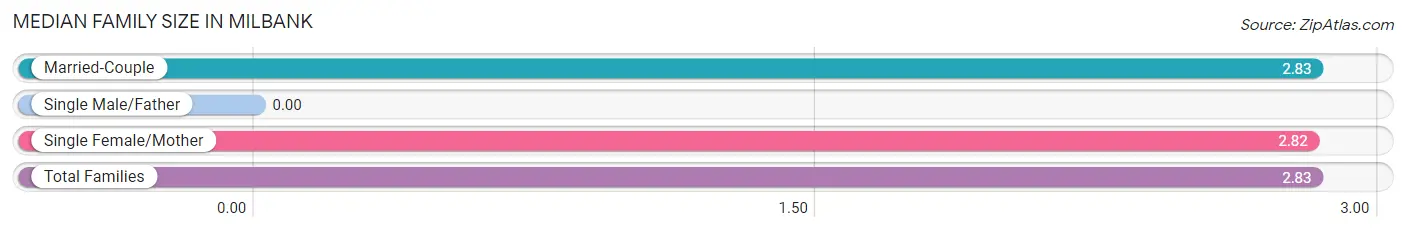
| Family Type | # Families | Family Size |
| Married-Couple | 860 (88.6%) | 2.83 |
| Single Male/Father | 0 (0.0%) | - |
| Single Female/Mother | 111 (11.4%) | 2.82 |
| Total Families | 971 (100.0%) | 2.83 |
Median Household Size in Milbank
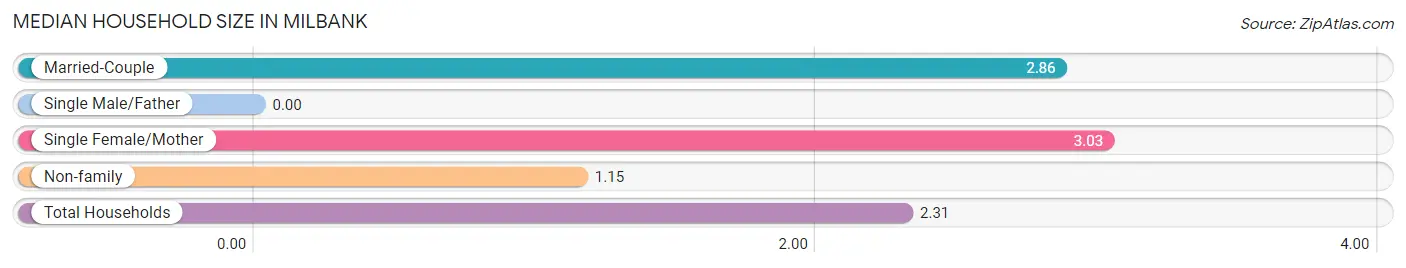
| Household Type | # Households | Household Size |
| Married-Couple | 860 (59.5%) | 2.86 |
| Single Male/Father | 0 (0.0%) | - |
| Single Female/Mother | 111 (7.7%) | 3.03 |
| Non-family | 475 (32.9%) | 1.15 |
| Total Households | 1,446 (100.0%) | 2.31 |
Household Size by Marriage Status in Milbank
Out of a total of 1,446 households in Milbank, 971 (67.1%) are family households, while 475 (32.9%) are nonfamily households. The most numerous type of family households are 2-person households, comprising 481, and the most common type of nonfamily households are 1-person households, comprising 439.
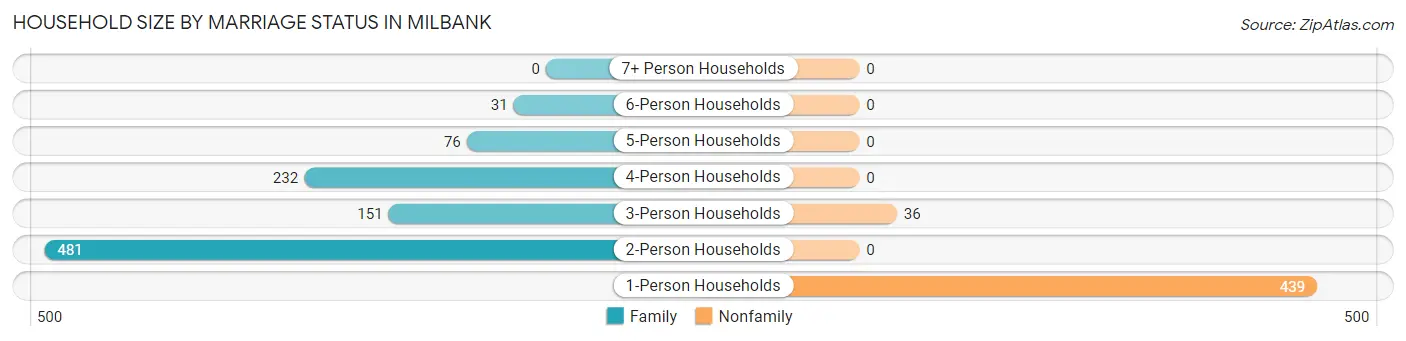
| Household Size | Family Households | Nonfamily Households |
| 1-Person Households | - | 439 (30.4%) |
| 2-Person Households | 481 (33.3%) | 0 (0.0%) |
| 3-Person Households | 151 (10.4%) | 36 (2.5%) |
| 4-Person Households | 232 (16.0%) | 0 (0.0%) |
| 5-Person Households | 76 (5.3%) | 0 (0.0%) |
| 6-Person Households | 31 (2.1%) | 0 (0.0%) |
| 7+ Person Households | 0 (0.0%) | 0 (0.0%) |
| Total | 971 (67.1%) | 475 (32.9%) |
Female Fertility in Milbank
Fertility by Age in Milbank
Average fertility rate in Milbank is 65.0 births per 1,000 women. Women in the age bracket of 20 to 34 years have the highest fertility rate with 141.0 births per 1,000 women. Women in the age bracket of 20 to 34 years acount for 100.0% of all women with births.
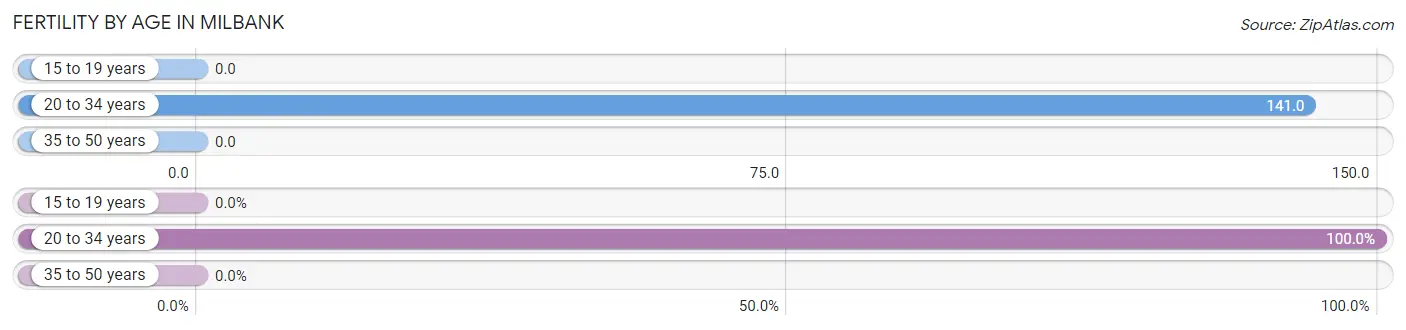
| Age Bracket | Women with Births | Births / 1,000 Women |
| 15 to 19 years | 0 (0.0%) | 0.0 |
| 20 to 34 years | 45 (100.0%) | 141.0 |
| 35 to 50 years | 0 (0.0%) | 0.0 |
| Total | 45 (100.0%) | 65.0 |
Fertility by Age by Marriage Status in Milbank
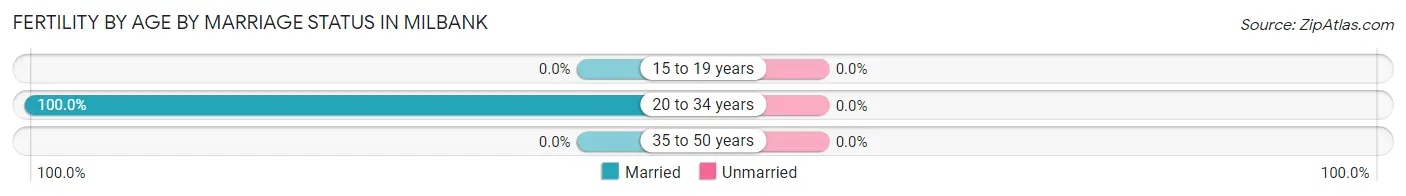
| Age Bracket | Married | Unmarried |
| 15 to 19 years | 0 (0.0%) | 0 (0.0%) |
| 20 to 34 years | 45 (100.0%) | 0 (0.0%) |
| 35 to 50 years | 0 (0.0%) | 0 (0.0%) |
| Total | 45 (100.0%) | 0 (0.0%) |
Fertility by Education in Milbank
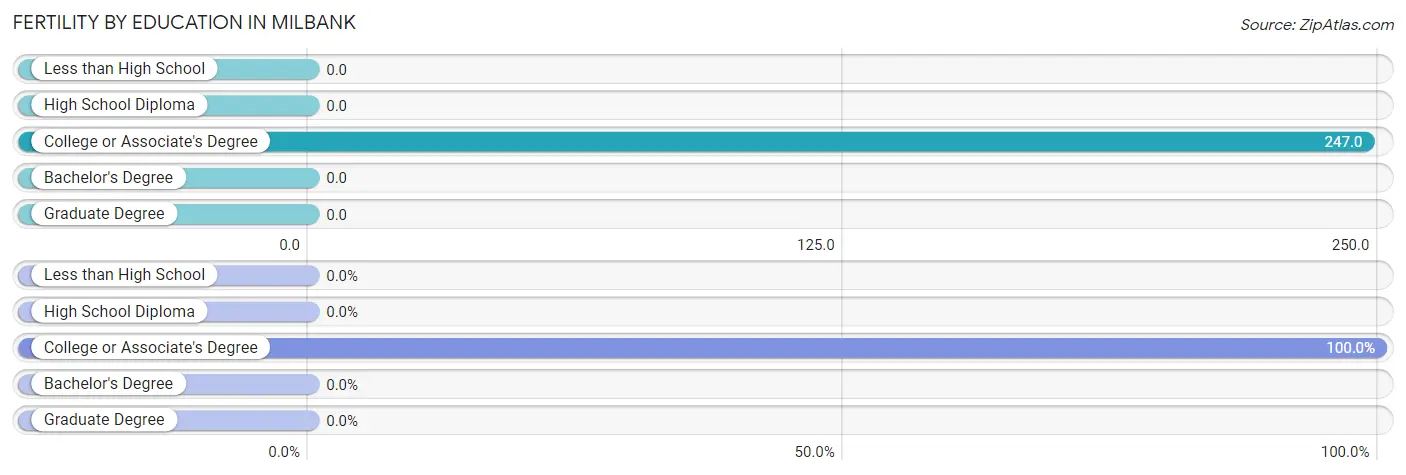
| Educational Attainment | Women with Births | Births / 1,000 Women |
| Less than High School | 0 (0.0%) | 0.0 |
| High School Diploma | 0 (0.0%) | 0.0 |
| College or Associate's Degree | 45 (100.0%) | 247.0 |
| Bachelor's Degree | 0 (0.0%) | 0.0 |
| Graduate Degree | 0 (0.0%) | 0.0 |
| Total | 45 (100.0%) | 65.0 |
Fertility by Education by Marriage Status in Milbank
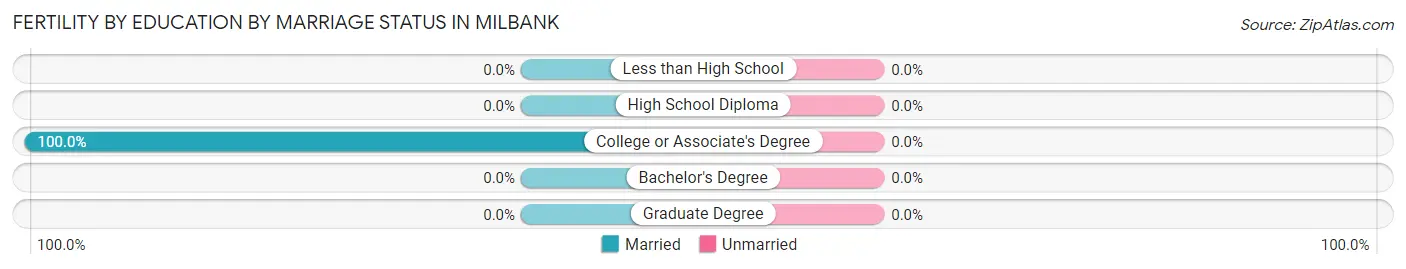
| Educational Attainment | Married | Unmarried |
| Less than High School | 0 (0.0%) | 0 (0.0%) |
| High School Diploma | 0 (0.0%) | 0 (0.0%) |
| College or Associate's Degree | 45 (100.0%) | 0 (0.0%) |
| Bachelor's Degree | 0 (0.0%) | 0 (0.0%) |
| Graduate Degree | 0 (0.0%) | 0 (0.0%) |
| Total | 45 (100.0%) | 0 (0.0%) |
Employment Characteristics in Milbank
Employment by Class of Employer in Milbank
Among the 1,612 employed individuals in Milbank, private company employees (1,058 | 65.6%), not-for-profit organizations (160 | 9.9%), and self-employed (not incorporated) (145 | 9.0%) make up the most common classes of employment.
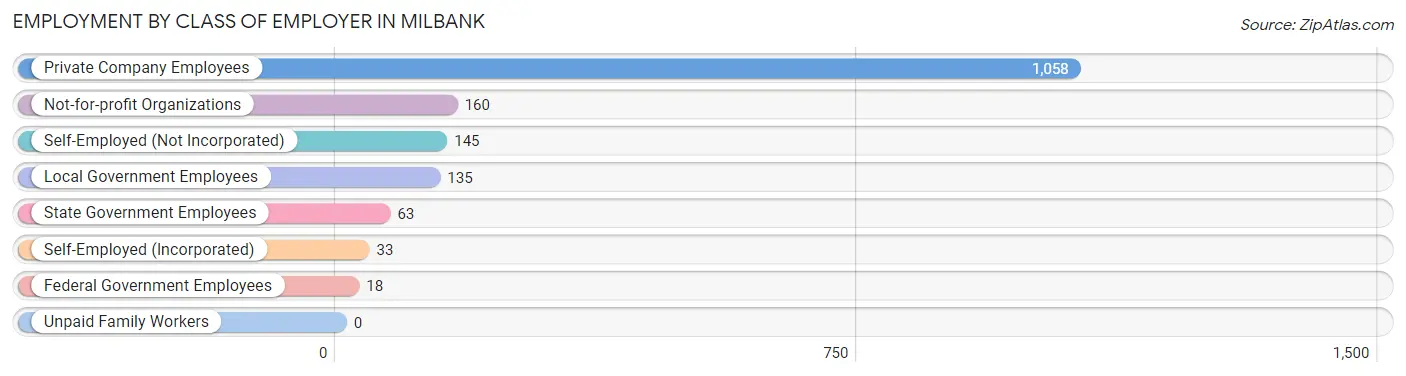
| Employer Class | # Employees | % Employees |
| Private Company Employees | 1,058 | 65.6% |
| Self-Employed (Incorporated) | 33 | 2.1% |
| Self-Employed (Not Incorporated) | 145 | 9.0% |
| Not-for-profit Organizations | 160 | 9.9% |
| Local Government Employees | 135 | 8.4% |
| State Government Employees | 63 | 3.9% |
| Federal Government Employees | 18 | 1.1% |
| Unpaid Family Workers | 0 | 0.0% |
| Total | 1,612 | 100.0% |
Employment Status by Age in Milbank
According to the labor force statistics for Milbank, out of the total population over 16 years of age (2,837), 61.3% or 1,739 individuals are in the labor force, with 4.0% or 70 of them unemployed. The age group with the highest labor force participation rate is 25 to 29 years, with 100.0% or 244 individuals in the labor force. Within the labor force, the 20 to 24 years age range has the highest percentage of unemployed individuals, with 39.2% or 69 of them being unemployed.
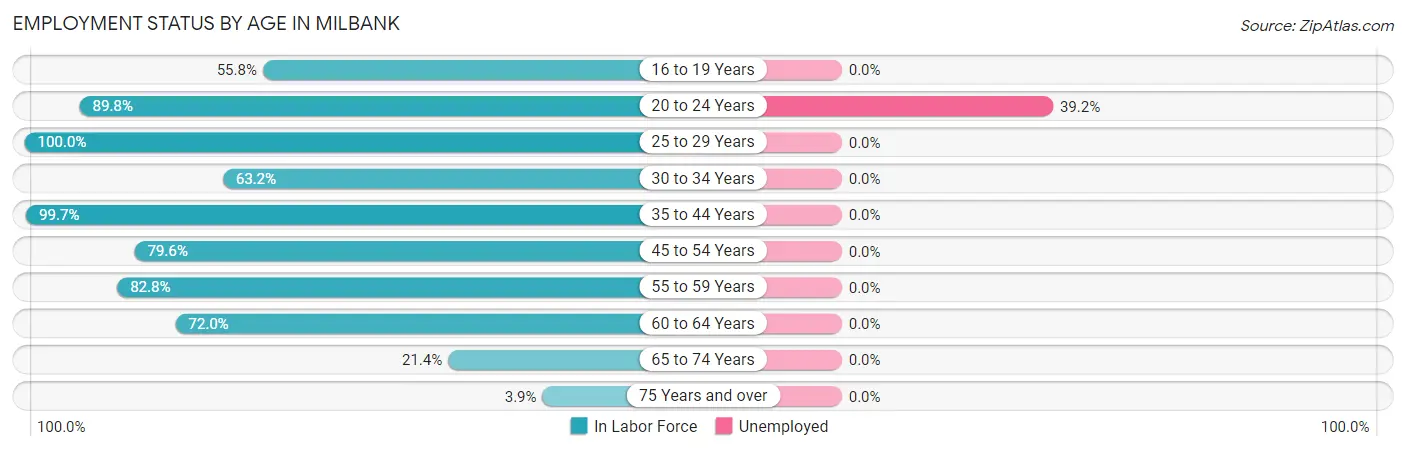
| Age Bracket | In Labor Force | Unemployed |
| 16 to 19 Years | 63 (55.8%) | 0 (0.0%) |
| 20 to 24 Years | 176 (89.8%) | 69 (39.2%) |
| 25 to 29 Years | 244 (100.0%) | 0 (0.0%) |
| 30 to 34 Years | 168 (63.2%) | 0 (0.0%) |
| 35 to 44 Years | 346 (99.7%) | 0 (0.0%) |
| 45 to 54 Years | 214 (79.6%) | 0 (0.0%) |
| 55 to 59 Years | 202 (82.8%) | 0 (0.0%) |
| 60 to 64 Years | 216 (72.0%) | 0 (0.0%) |
| 65 to 74 Years | 95 (21.4%) | 0 (0.0%) |
| 75 Years and over | 16 (3.9%) | 0 (0.0%) |
| Total | 1,739 (61.3%) | 70 (4.0%) |
Employment Status by Educational Attainment in Milbank
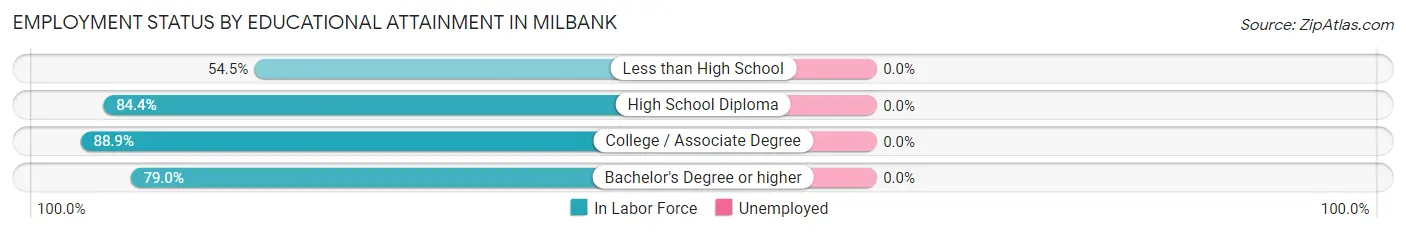
| Educational Attainment | In Labor Force | Unemployed |
| Less than High School | 6 (54.5%) | 0 (0.0%) |
| High School Diploma | 378 (84.4%) | 0 (0.0%) |
| College / Associate Degree | 442 (88.9%) | 0 (0.0%) |
| Bachelor's Degree or higher | 564 (79.0%) | 0 (0.0%) |
| Total | 1,389 (83.2%) | 0 (0.0%) |
Employment Occupations by Sex in Milbank
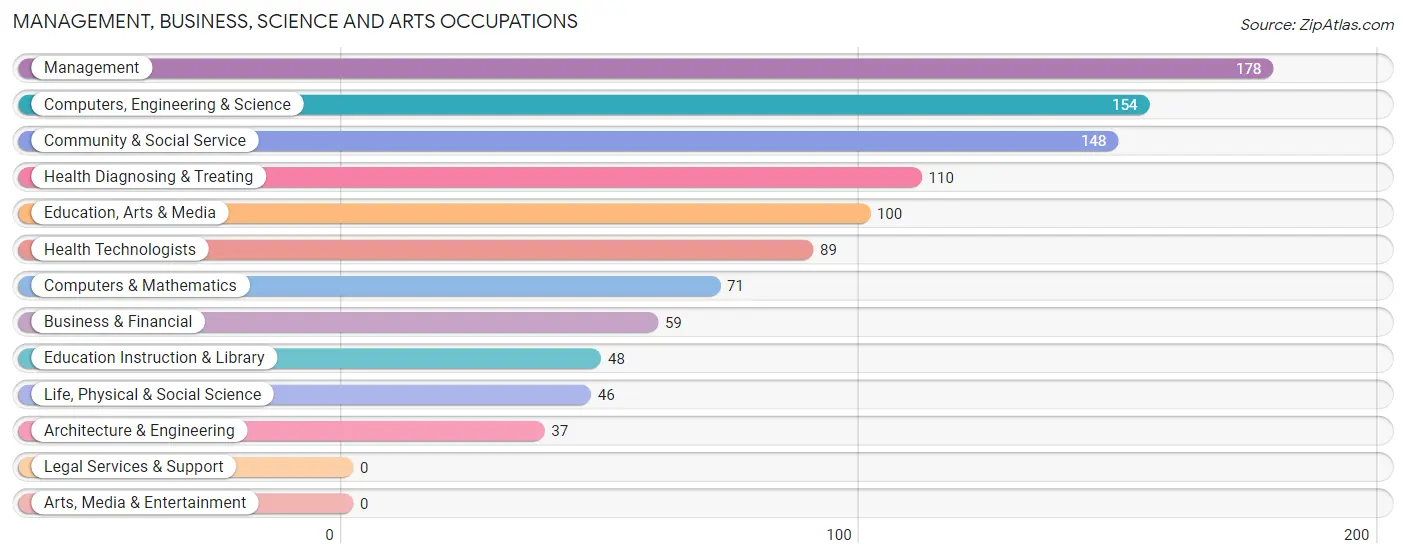
Management, Business, Science and Arts Occupations
The most common Management, Business, Science and Arts occupations in Milbank are Management (178 | 10.6%), Computers, Engineering & Science (154 | 9.2%), Community & Social Service (148 | 8.9%), Health Diagnosing & Treating (110 | 6.6%), and Education, Arts & Media (100 | 6.0%).
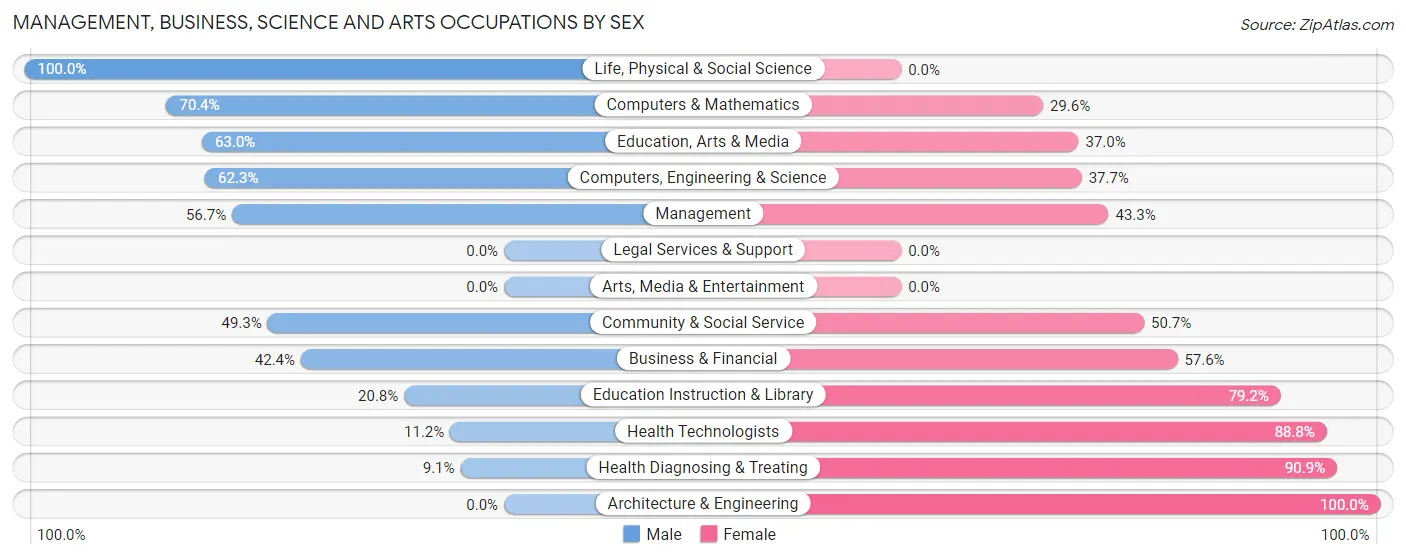
Management, Business, Science and Arts Occupations by Sex
Within the Management, Business, Science and Arts occupations in Milbank, the most male-oriented occupations are Life, Physical & Social Science (100.0%), Computers & Mathematics (70.4%), and Education, Arts & Media (63.0%), while the most female-oriented occupations are Architecture & Engineering (100.0%), Health Diagnosing & Treating (90.9%), and Health Technologists (88.8%).
| Occupation | Male | Female |
| Management | 101 (56.7%) | 77 (43.3%) |
| Business & Financial | 25 (42.4%) | 34 (57.6%) |
| Computers, Engineering & Science | 96 (62.3%) | 58 (37.7%) |
| Computers & Mathematics | 50 (70.4%) | 21 (29.6%) |
| Architecture & Engineering | 0 (0.0%) | 37 (100.0%) |
| Life, Physical & Social Science | 46 (100.0%) | 0 (0.0%) |
| Community & Social Service | 73 (49.3%) | 75 (50.7%) |
| Education, Arts & Media | 63 (63.0%) | 37 (37.0%) |
| Legal Services & Support | 0 (0.0%) | 0 (0.0%) |
| Education Instruction & Library | 10 (20.8%) | 38 (79.2%) |
| Arts, Media & Entertainment | 0 (0.0%) | 0 (0.0%) |
| Health Diagnosing & Treating | 10 (9.1%) | 100 (90.9%) |
| Health Technologists | 10 (11.2%) | 79 (88.8%) |
| Total (Category) | 305 (47.0%) | 344 (53.0%) |
| Total (Overall) | 874 (52.3%) | 797 (47.7%) |
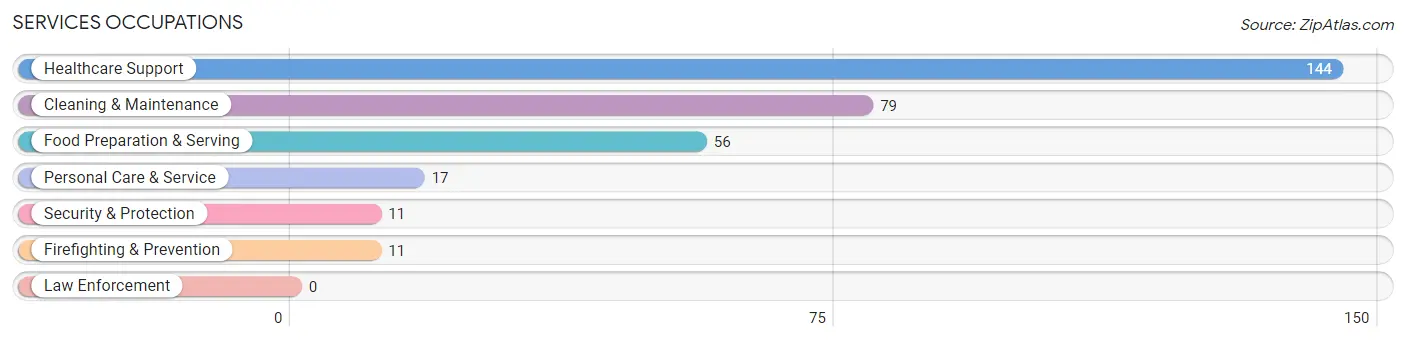
Services Occupations
The most common Services occupations in Milbank are Healthcare Support (144 | 8.6%), Cleaning & Maintenance (79 | 4.7%), Food Preparation & Serving (56 | 3.4%), Personal Care & Service (17 | 1.0%), and Security & Protection (11 | 0.7%).
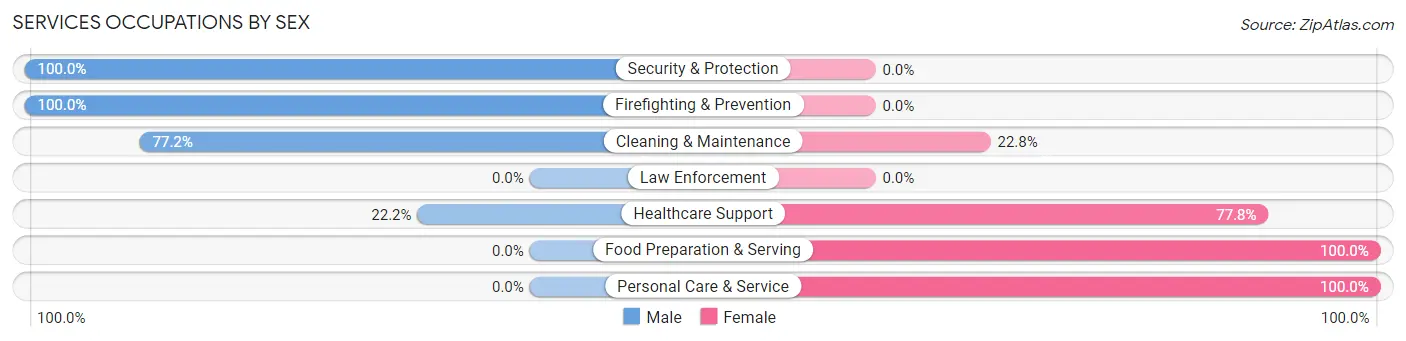
Services Occupations by Sex
Within the Services occupations in Milbank, the most male-oriented occupations are Security & Protection (100.0%), Firefighting & Prevention (100.0%), and Cleaning & Maintenance (77.2%), while the most female-oriented occupations are Food Preparation & Serving (100.0%), Personal Care & Service (100.0%), and Healthcare Support (77.8%).
| Occupation | Male | Female |
| Healthcare Support | 32 (22.2%) | 112 (77.8%) |
| Security & Protection | 11 (100.0%) | 0 (0.0%) |
| Firefighting & Prevention | 11 (100.0%) | 0 (0.0%) |
| Law Enforcement | 0 (0.0%) | 0 (0.0%) |
| Food Preparation & Serving | 0 (0.0%) | 56 (100.0%) |
| Cleaning & Maintenance | 61 (77.2%) | 18 (22.8%) |
| Personal Care & Service | 0 (0.0%) | 17 (100.0%) |
| Total (Category) | 104 (33.9%) | 203 (66.1%) |
| Total (Overall) | 874 (52.3%) | 797 (47.7%) |
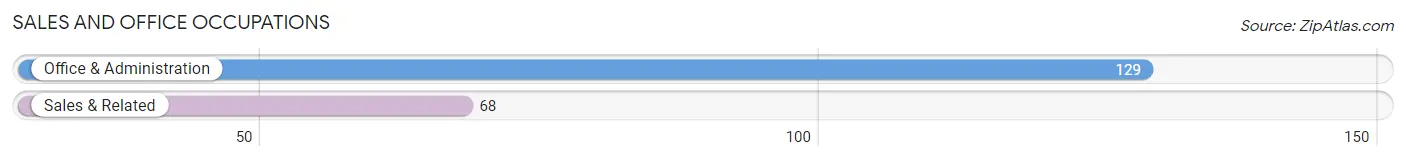
Sales and Office Occupations
The most common Sales and Office occupations in Milbank are Office & Administration (129 | 7.7%), and Sales & Related (68 | 4.1%).
Sales and Office Occupations by Sex
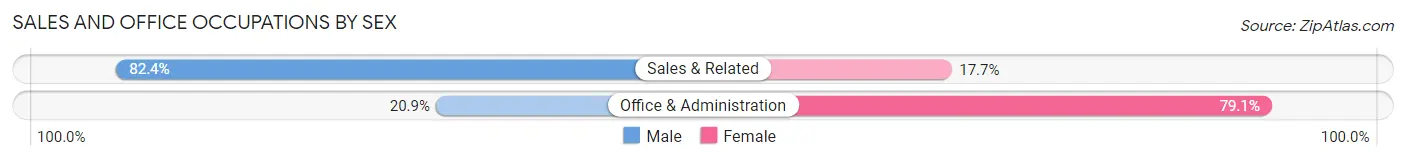
| Occupation | Male | Female |
| Sales & Related | 56 (82.4%) | 12 (17.6%) |
| Office & Administration | 27 (20.9%) | 102 (79.1%) |
| Total (Category) | 83 (42.1%) | 114 (57.9%) |
| Total (Overall) | 874 (52.3%) | 797 (47.7%) |
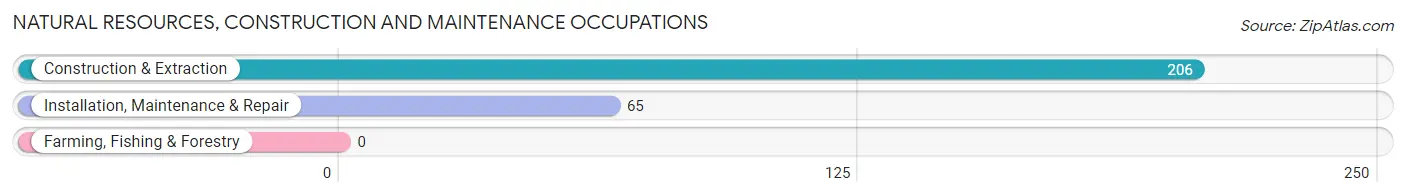
Natural Resources, Construction and Maintenance Occupations
The most common Natural Resources, Construction and Maintenance occupations in Milbank are Construction & Extraction (206 | 12.3%), and Installation, Maintenance & Repair (65 | 3.9%).
Natural Resources, Construction and Maintenance Occupations by Sex
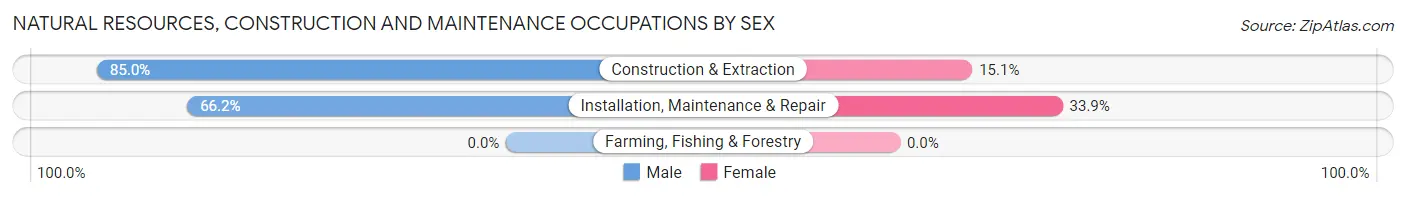
| Occupation | Male | Female |
| Farming, Fishing & Forestry | 0 (0.0%) | 0 (0.0%) |
| Construction & Extraction | 175 (85.0%) | 31 (15.0%) |
| Installation, Maintenance & Repair | 43 (66.1%) | 22 (33.9%) |
| Total (Category) | 218 (80.4%) | 53 (19.6%) |
| Total (Overall) | 874 (52.3%) | 797 (47.7%) |
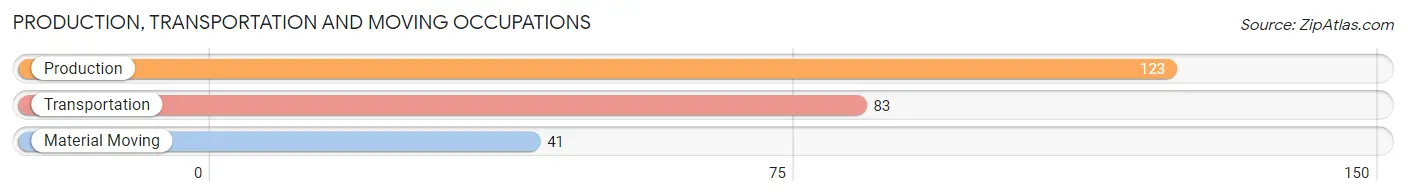
Production, Transportation and Moving Occupations
The most common Production, Transportation and Moving occupations in Milbank are Production (123 | 7.4%), Transportation (83 | 5.0%), and Material Moving (41 | 2.5%).
Production, Transportation and Moving Occupations by Sex
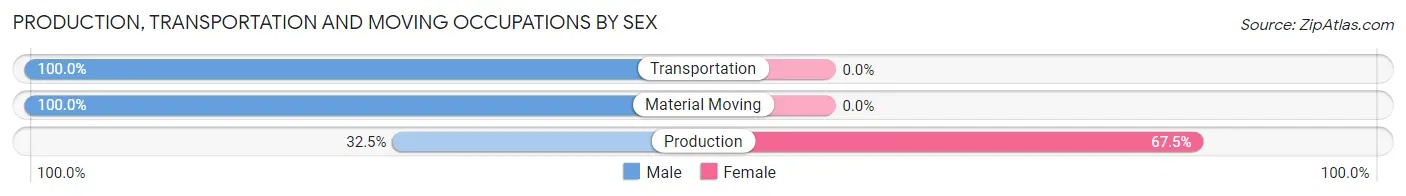
| Occupation | Male | Female |
| Production | 40 (32.5%) | 83 (67.5%) |
| Transportation | 83 (100.0%) | 0 (0.0%) |
| Material Moving | 41 (100.0%) | 0 (0.0%) |
| Total (Category) | 164 (66.4%) | 83 (33.6%) |
| Total (Overall) | 874 (52.3%) | 797 (47.7%) |
Employment Industries by Sex in Milbank
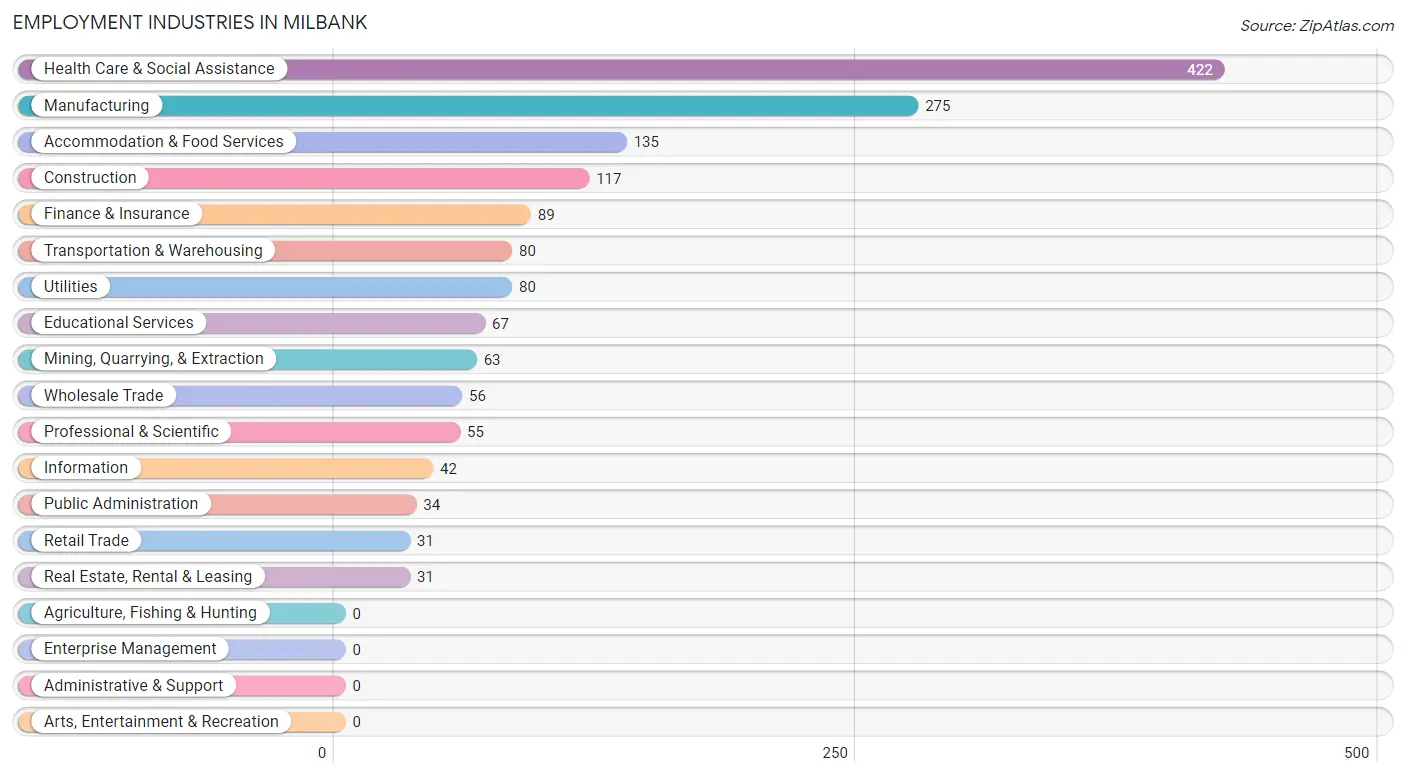
Employment Industries in Milbank
The major employment industries in Milbank include Health Care & Social Assistance (422 | 25.3%), Manufacturing (275 | 16.5%), Accommodation & Food Services (135 | 8.1%), Construction (117 | 7.0%), and Finance & Insurance (89 | 5.3%).
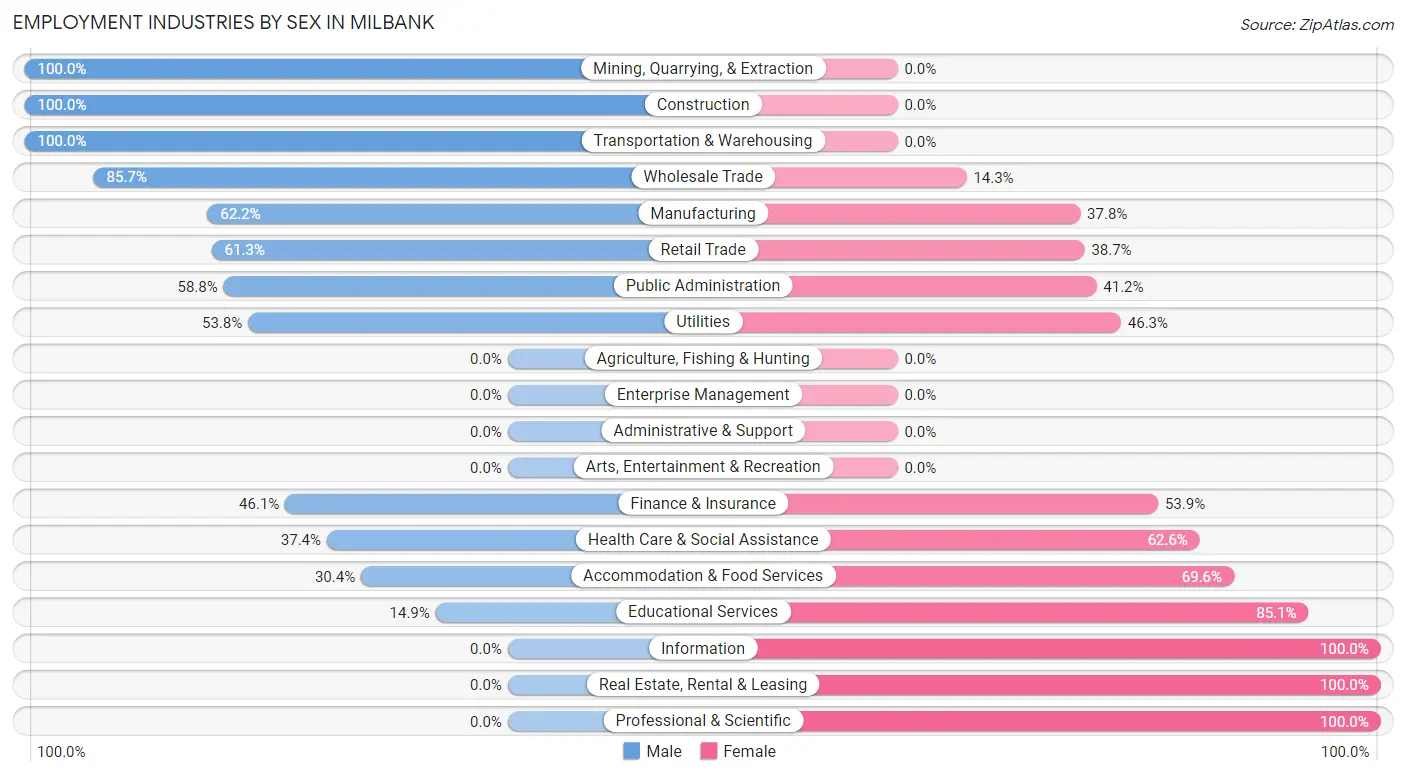
Employment Industries by Sex in Milbank
The Milbank industries that see more men than women are Mining, Quarrying, & Extraction (100.0%), Construction (100.0%), and Transportation & Warehousing (100.0%), whereas the industries that tend to have a higher number of women are Information (100.0%), Real Estate, Rental & Leasing (100.0%), and Professional & Scientific (100.0%).
| Industry | Male | Female |
| Agriculture, Fishing & Hunting | 0 (0.0%) | 0 (0.0%) |
| Mining, Quarrying, & Extraction | 63 (100.0%) | 0 (0.0%) |
| Construction | 117 (100.0%) | 0 (0.0%) |
| Manufacturing | 171 (62.2%) | 104 (37.8%) |
| Wholesale Trade | 48 (85.7%) | 8 (14.3%) |
| Retail Trade | 19 (61.3%) | 12 (38.7%) |
| Transportation & Warehousing | 80 (100.0%) | 0 (0.0%) |
| Utilities | 43 (53.7%) | 37 (46.3%) |
| Information | 0 (0.0%) | 42 (100.0%) |
| Finance & Insurance | 41 (46.1%) | 48 (53.9%) |
| Real Estate, Rental & Leasing | 0 (0.0%) | 31 (100.0%) |
| Professional & Scientific | 0 (0.0%) | 55 (100.0%) |
| Enterprise Management | 0 (0.0%) | 0 (0.0%) |
| Administrative & Support | 0 (0.0%) | 0 (0.0%) |
| Educational Services | 10 (14.9%) | 57 (85.1%) |
| Health Care & Social Assistance | 158 (37.4%) | 264 (62.6%) |
| Arts, Entertainment & Recreation | 0 (0.0%) | 0 (0.0%) |
| Accommodation & Food Services | 41 (30.4%) | 94 (69.6%) |
| Public Administration | 20 (58.8%) | 14 (41.2%) |
| Total | 874 (52.3%) | 797 (47.7%) |
Education in Milbank
School Enrollment in Milbank
The most common levels of schooling among the 582 students in Milbank are middle school (181 | 31.1%), elementary school (170 | 29.2%), and high school (150 | 25.8%).
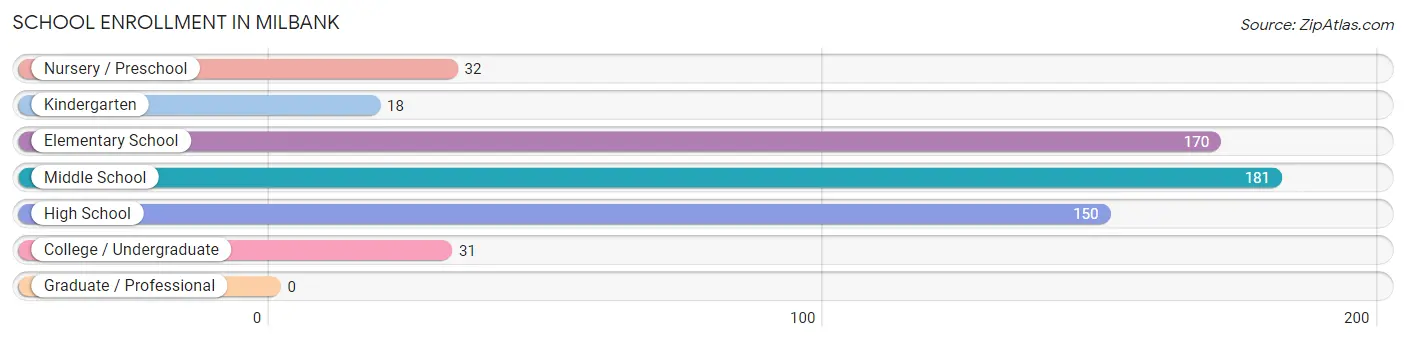
| School Level | # Students | % Students |
| Nursery / Preschool | 32 | 5.5% |
| Kindergarten | 18 | 3.1% |
| Elementary School | 170 | 29.2% |
| Middle School | 181 | 31.1% |
| High School | 150 | 25.8% |
| College / Undergraduate | 31 | 5.3% |
| Graduate / Professional | 0 | 0.0% |
| Total | 582 | 100.0% |
School Enrollment by Age by Funding Source in Milbank
Out of a total of 582 students who are enrolled in schools in Milbank, 58 (10.0%) attend a private institution, while the remaining 524 (90.0%) are enrolled in public schools. The age group of 3 to 4 year olds has the highest likelihood of being enrolled in private schools, with 6 (31.6% in the age bracket) enrolled. Conversely, the age group of 5 to 9 year old has the lowest likelihood of being enrolled in a private school, with 192 (100.0% in the age bracket) attending a public institution.
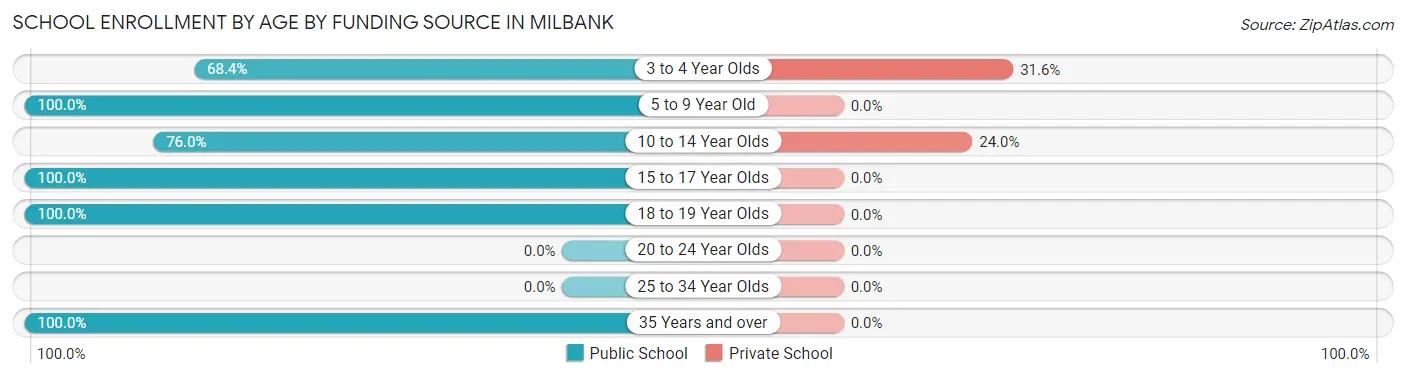
| Age Bracket | Public School | Private School |
| 3 to 4 Year Olds | 13 (68.4%) | 6 (31.6%) |
| 5 to 9 Year Old | 192 (100.0%) | 0 (0.0%) |
| 10 to 14 Year Olds | 165 (76.0%) | 52 (24.0%) |
| 15 to 17 Year Olds | 105 (100.0%) | 0 (0.0%) |
| 18 to 19 Year Olds | 18 (100.0%) | 0 (0.0%) |
| 20 to 24 Year Olds | 0 (0.0%) | 0 (0.0%) |
| 25 to 34 Year Olds | 0 (0.0%) | 0 (0.0%) |
| 35 Years and over | 31 (100.0%) | 0 (0.0%) |
| Total | 524 (90.0%) | 58 (10.0%) |
Educational Attainment by Field of Study in Milbank
Education (229 | 22.6%), engineering (226 | 22.3%), bio, nature & agricultural (134 | 13.2%), psychology (112 | 11.0%), and business (54 | 5.3%) are the most common fields of study among 1,015 individuals in Milbank who have obtained a bachelor's degree or higher.
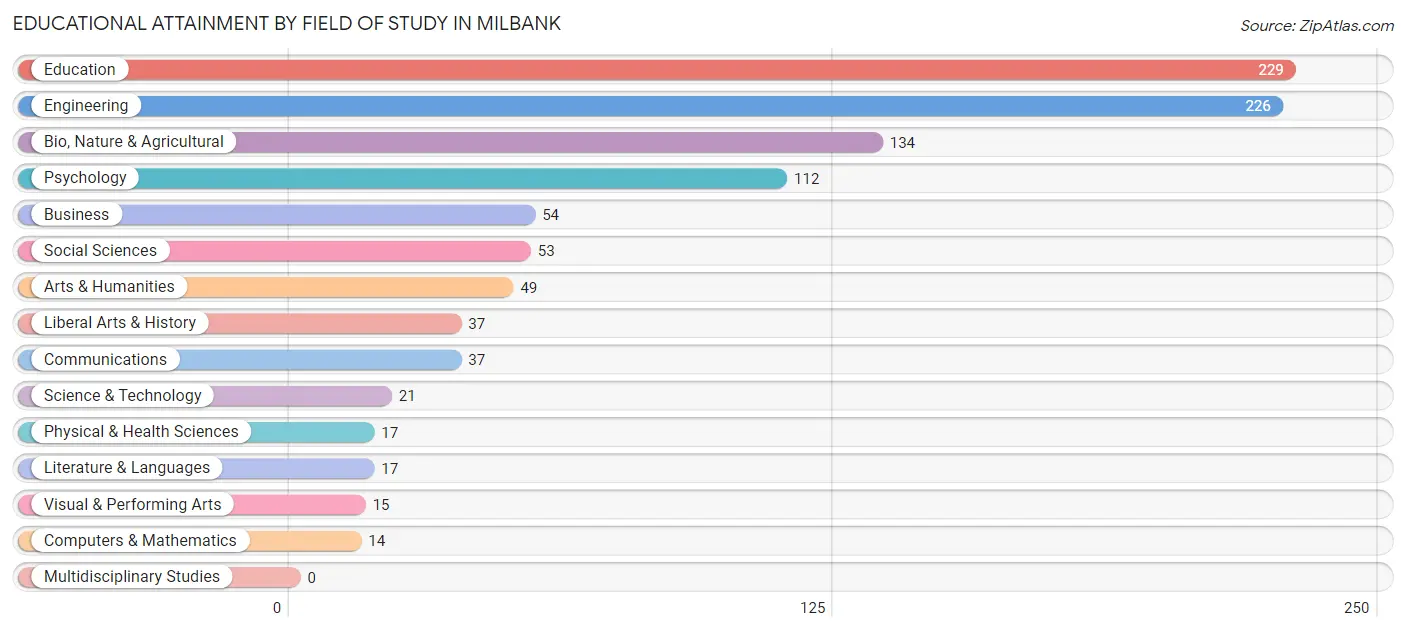
| Field of Study | # Graduates | % Graduates |
| Computers & Mathematics | 14 | 1.4% |
| Bio, Nature & Agricultural | 134 | 13.2% |
| Physical & Health Sciences | 17 | 1.7% |
| Psychology | 112 | 11.0% |
| Social Sciences | 53 | 5.2% |
| Engineering | 226 | 22.3% |
| Multidisciplinary Studies | 0 | 0.0% |
| Science & Technology | 21 | 2.1% |
| Business | 54 | 5.3% |
| Education | 229 | 22.6% |
| Literature & Languages | 17 | 1.7% |
| Liberal Arts & History | 37 | 3.6% |
| Visual & Performing Arts | 15 | 1.5% |
| Communications | 37 | 3.6% |
| Arts & Humanities | 49 | 4.8% |
| Total | 1,015 | 100.0% |
Transportation & Commute in Milbank
Vehicle Availability by Sex in Milbank
The most prevalent vehicle ownership categories in Milbank are males with 2 vehicles (482, accounting for 59.1%) and females with 2 vehicles (459, making up 60.5%).
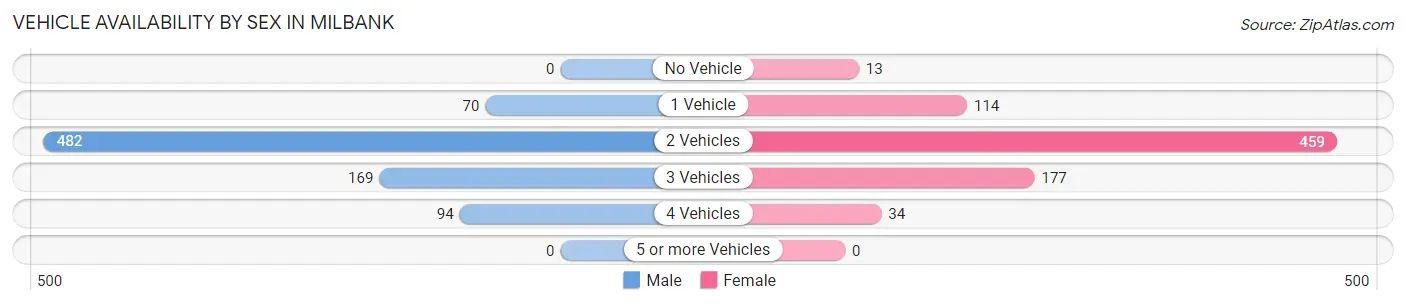
| Vehicles Available | Male | Female |
| No Vehicle | 0 (0.0%) | 13 (1.6%) |
| 1 Vehicle | 70 (8.6%) | 114 (14.3%) |
| 2 Vehicles | 482 (59.1%) | 459 (57.6%) |
| 3 Vehicles | 169 (20.7%) | 177 (22.2%) |
| 4 Vehicles | 94 (11.5%) | 34 (4.3%) |
| 5 or more Vehicles | 0 (0.0%) | 0 (0.0%) |
| Total | 815 (100.0%) | 797 (100.0%) |
Commute Time in Milbank
The most frequently occuring commute durations in Milbank are 5 to 9 minutes (599 commuters, 39.1%), less than 5 minutes (371 commuters, 24.2%), and 10 to 14 minutes (239 commuters, 15.6%).
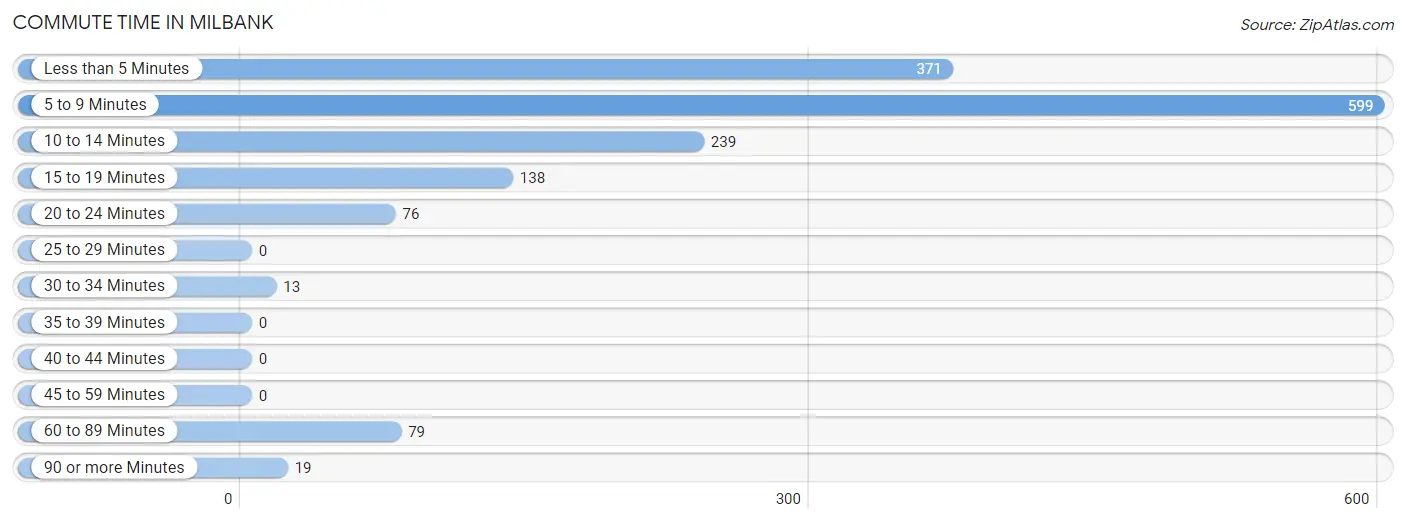
| Commute Time | # Commuters | % Commuters |
| Less than 5 Minutes | 371 | 24.2% |
| 5 to 9 Minutes | 599 | 39.1% |
| 10 to 14 Minutes | 239 | 15.6% |
| 15 to 19 Minutes | 138 | 9.0% |
| 20 to 24 Minutes | 76 | 5.0% |
| 25 to 29 Minutes | 0 | 0.0% |
| 30 to 34 Minutes | 13 | 0.9% |
| 35 to 39 Minutes | 0 | 0.0% |
| 40 to 44 Minutes | 0 | 0.0% |
| 45 to 59 Minutes | 0 | 0.0% |
| 60 to 89 Minutes | 79 | 5.1% |
| 90 or more Minutes | 19 | 1.2% |
Commute Time by Sex in Milbank
The most common commute times in Milbank are 5 to 9 minutes (350 commuters, 42.9%) for males and 5 to 9 minutes (249 commuters, 34.6%) for females.
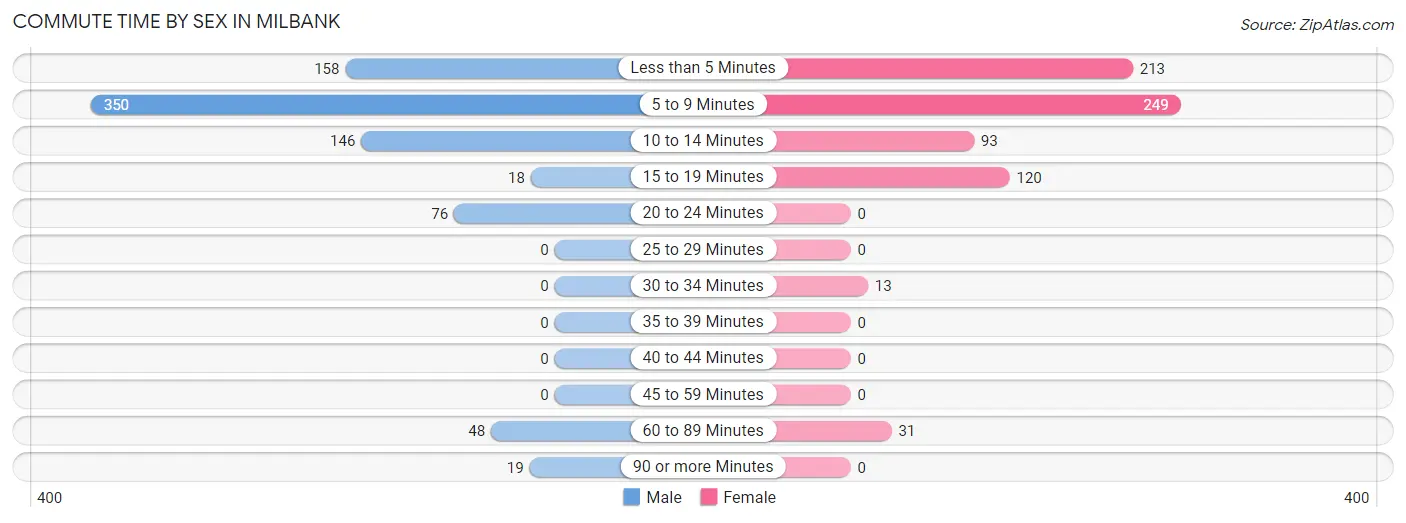
| Commute Time | Male | Female |
| Less than 5 Minutes | 158 (19.4%) | 213 (29.6%) |
| 5 to 9 Minutes | 350 (42.9%) | 249 (34.6%) |
| 10 to 14 Minutes | 146 (17.9%) | 93 (12.9%) |
| 15 to 19 Minutes | 18 (2.2%) | 120 (16.7%) |
| 20 to 24 Minutes | 76 (9.3%) | 0 (0.0%) |
| 25 to 29 Minutes | 0 (0.0%) | 0 (0.0%) |
| 30 to 34 Minutes | 0 (0.0%) | 13 (1.8%) |
| 35 to 39 Minutes | 0 (0.0%) | 0 (0.0%) |
| 40 to 44 Minutes | 0 (0.0%) | 0 (0.0%) |
| 45 to 59 Minutes | 0 (0.0%) | 0 (0.0%) |
| 60 to 89 Minutes | 48 (5.9%) | 31 (4.3%) |
| 90 or more Minutes | 19 (2.3%) | 0 (0.0%) |
Time of Departure to Work by Sex in Milbank
The most frequent times of departure to work in Milbank are 5:00 AM to 5:29 AM (168, 20.6%) for males and 7:30 AM to 7:59 AM (147, 20.4%) for females.
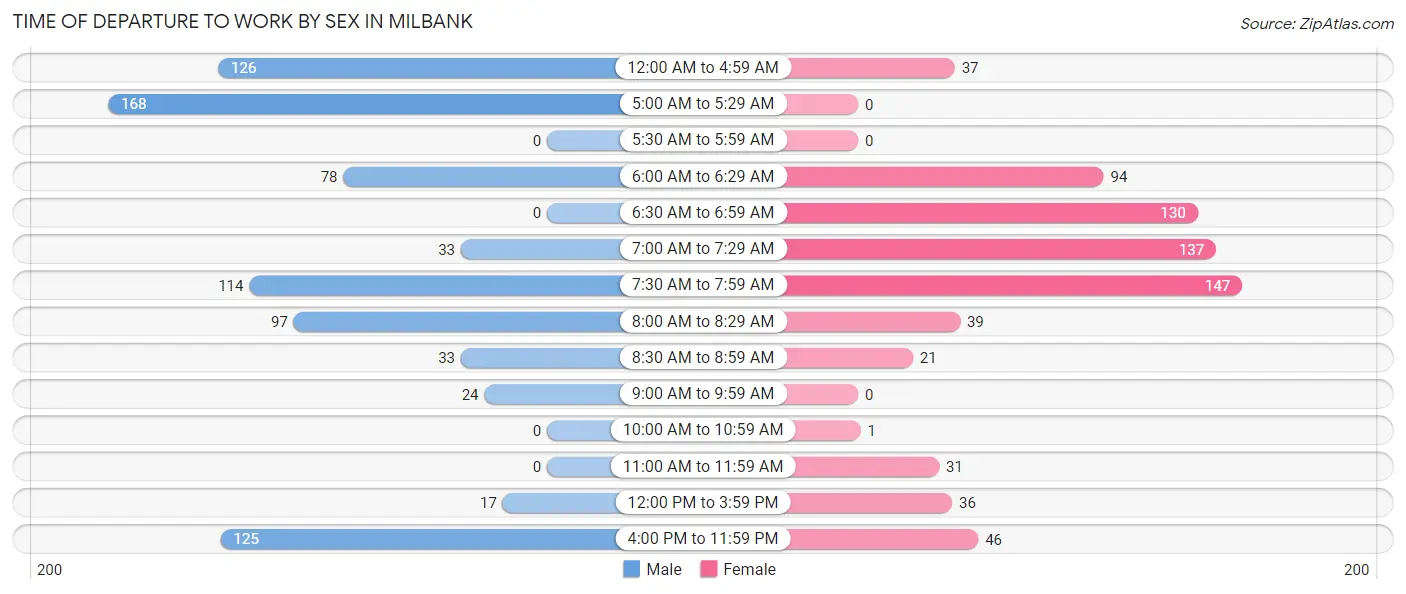
| Time of Departure | Male | Female |
| 12:00 AM to 4:59 AM | 126 (15.5%) | 37 (5.1%) |
| 5:00 AM to 5:29 AM | 168 (20.6%) | 0 (0.0%) |
| 5:30 AM to 5:59 AM | 0 (0.0%) | 0 (0.0%) |
| 6:00 AM to 6:29 AM | 78 (9.6%) | 94 (13.1%) |
| 6:30 AM to 6:59 AM | 0 (0.0%) | 130 (18.1%) |
| 7:00 AM to 7:29 AM | 33 (4.1%) | 137 (19.1%) |
| 7:30 AM to 7:59 AM | 114 (14.0%) | 147 (20.4%) |
| 8:00 AM to 8:29 AM | 97 (11.9%) | 39 (5.4%) |
| 8:30 AM to 8:59 AM | 33 (4.1%) | 21 (2.9%) |
| 9:00 AM to 9:59 AM | 24 (2.9%) | 0 (0.0%) |
| 10:00 AM to 10:59 AM | 0 (0.0%) | 1 (0.1%) |
| 11:00 AM to 11:59 AM | 0 (0.0%) | 31 (4.3%) |
| 12:00 PM to 3:59 PM | 17 (2.1%) | 36 (5.0%) |
| 4:00 PM to 11:59 PM | 125 (15.3%) | 46 (6.4%) |
| Total | 815 (100.0%) | 719 (100.0%) |
Housing Occupancy in Milbank
Occupancy by Ownership in Milbank
Of the total 1,446 dwellings in Milbank, owner-occupied units account for 1,077 (74.5%), while renter-occupied units make up 369 (25.5%).
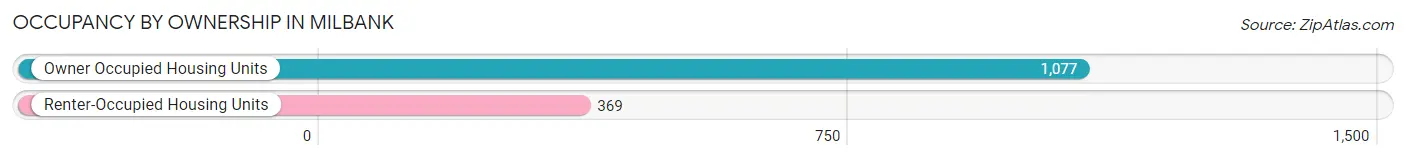
| Occupancy | # Housing Units | % Housing Units |
| Owner Occupied Housing Units | 1,077 | 74.5% |
| Renter-Occupied Housing Units | 369 | 25.5% |
| Total Occupied Housing Units | 1,446 | 100.0% |
Occupancy by Household Size in Milbank
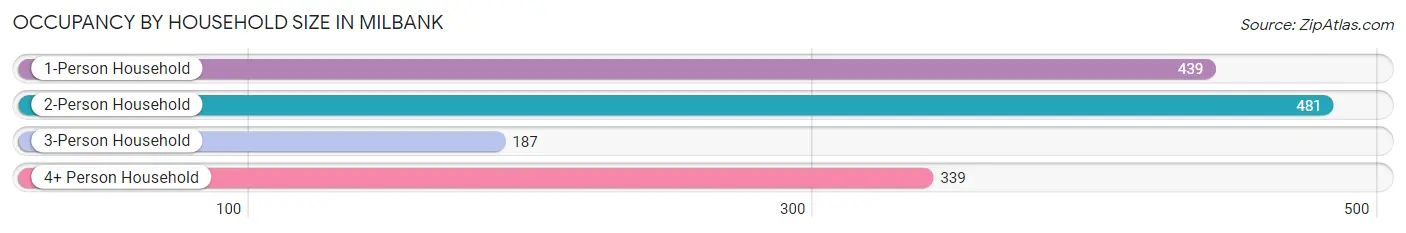
| Household Size | # Housing Units | % Housing Units |
| 1-Person Household | 439 | 30.4% |
| 2-Person Household | 481 | 33.3% |
| 3-Person Household | 187 | 12.9% |
| 4+ Person Household | 339 | 23.4% |
| Total Housing Units | 1,446 | 100.0% |
Occupancy by Ownership by Household Size in Milbank
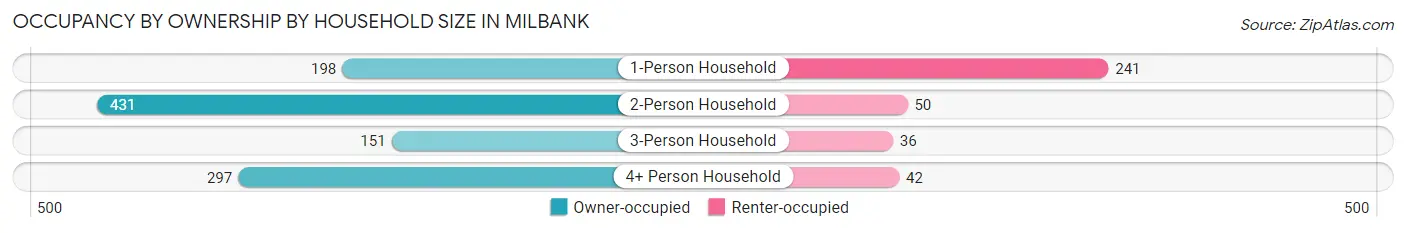
| Household Size | Owner-occupied | Renter-occupied |
| 1-Person Household | 198 (45.1%) | 241 (54.9%) |
| 2-Person Household | 431 (89.6%) | 50 (10.4%) |
| 3-Person Household | 151 (80.7%) | 36 (19.3%) |
| 4+ Person Household | 297 (87.6%) | 42 (12.4%) |
| Total Housing Units | 1,077 (74.5%) | 369 (25.5%) |
Occupancy by Educational Attainment in Milbank
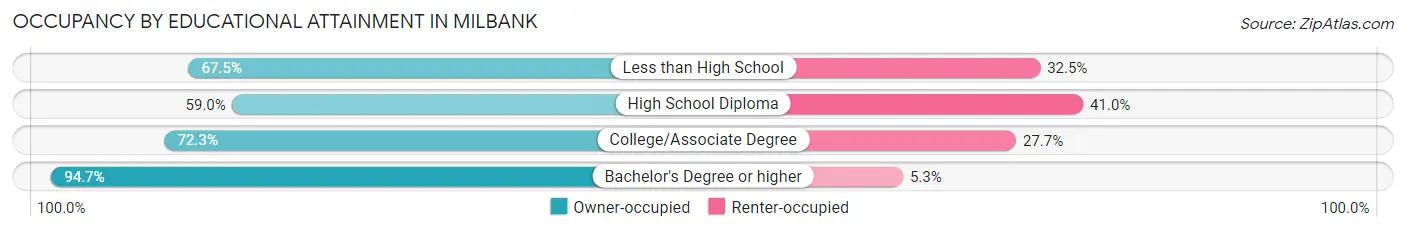
| Household Size | Owner-occupied | Renter-occupied |
| Less than High School | 83 (67.5%) | 40 (32.5%) |
| High School Diploma | 319 (59.0%) | 222 (41.0%) |
| College/Associate Degree | 211 (72.3%) | 81 (27.7%) |
| Bachelor's Degree or higher | 464 (94.7%) | 26 (5.3%) |
Occupancy by Age of Householder in Milbank
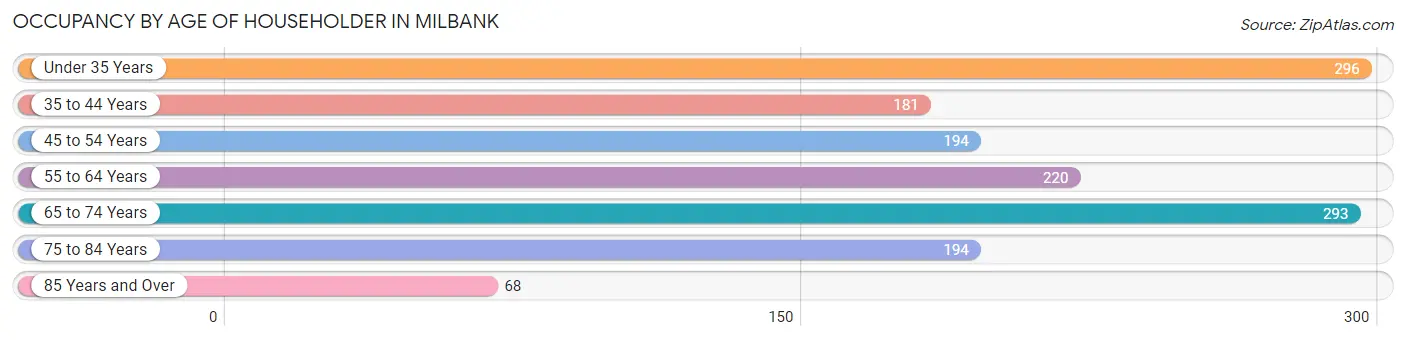
| Age Bracket | # Households | % Households |
| Under 35 Years | 296 | 20.5% |
| 35 to 44 Years | 181 | 12.5% |
| 45 to 54 Years | 194 | 13.4% |
| 55 to 64 Years | 220 | 15.2% |
| 65 to 74 Years | 293 | 20.3% |
| 75 to 84 Years | 194 | 13.4% |
| 85 Years and Over | 68 | 4.7% |
| Total | 1,446 | 100.0% |
Housing Finances in Milbank
Median Income by Occupancy in Milbank
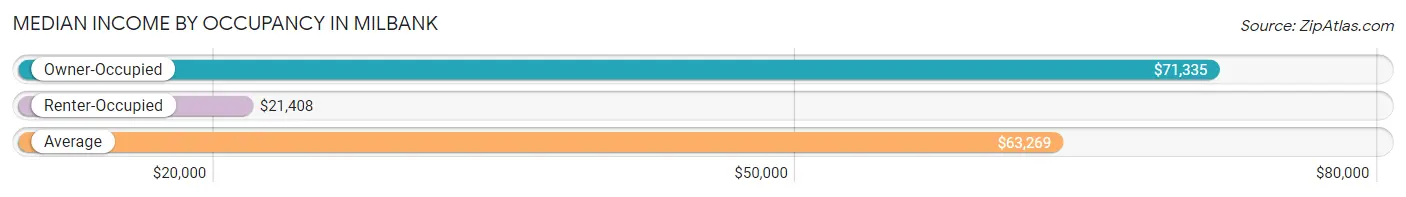
| Occupancy Type | # Households | Median Income |
| Owner-Occupied | 1,077 (74.5%) | $71,335 |
| Renter-Occupied | 369 (25.5%) | $21,408 |
| Average | 1,446 (100.0%) | $63,269 |
Occupancy by Householder Income Bracket in Milbank
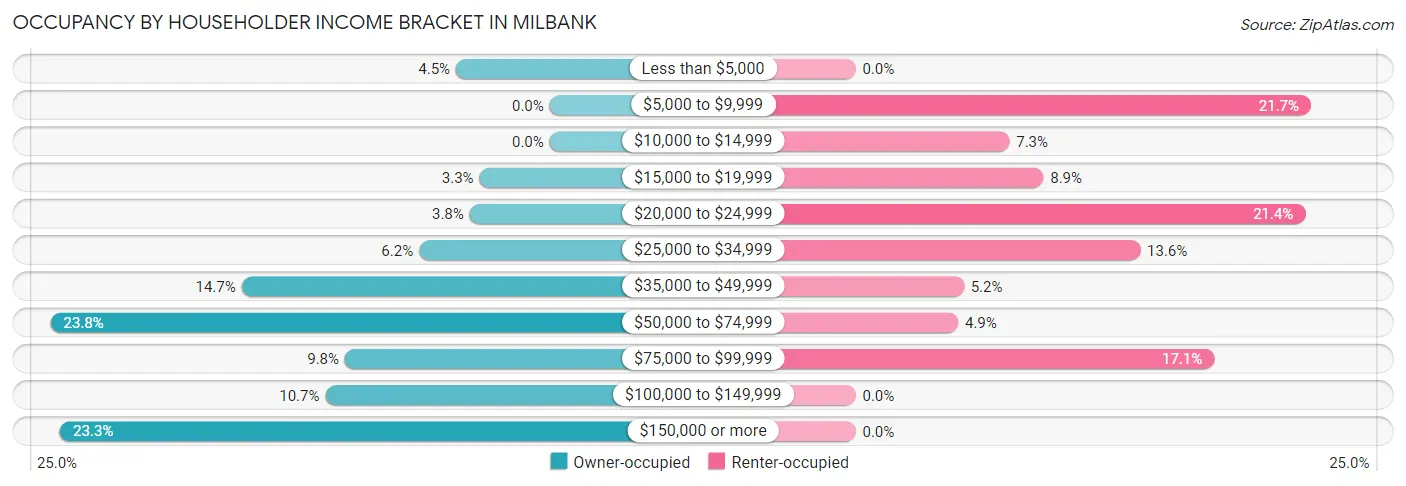
| Income Bracket | Owner-occupied | Renter-occupied |
| Less than $5,000 | 48 (4.5%) | 0 (0.0%) |
| $5,000 to $9,999 | 0 (0.0%) | 80 (21.7%) |
| $10,000 to $14,999 | 0 (0.0%) | 27 (7.3%) |
| $15,000 to $19,999 | 36 (3.3%) | 33 (8.9%) |
| $20,000 to $24,999 | 41 (3.8%) | 79 (21.4%) |
| $25,000 to $34,999 | 67 (6.2%) | 50 (13.6%) |
| $35,000 to $49,999 | 158 (14.7%) | 19 (5.1%) |
| $50,000 to $74,999 | 256 (23.8%) | 18 (4.9%) |
| $75,000 to $99,999 | 105 (9.8%) | 63 (17.1%) |
| $100,000 to $149,999 | 115 (10.7%) | 0 (0.0%) |
| $150,000 or more | 251 (23.3%) | 0 (0.0%) |
| Total | 1,077 (100.0%) | 369 (100.0%) |
Monthly Housing Cost Tiers in Milbank
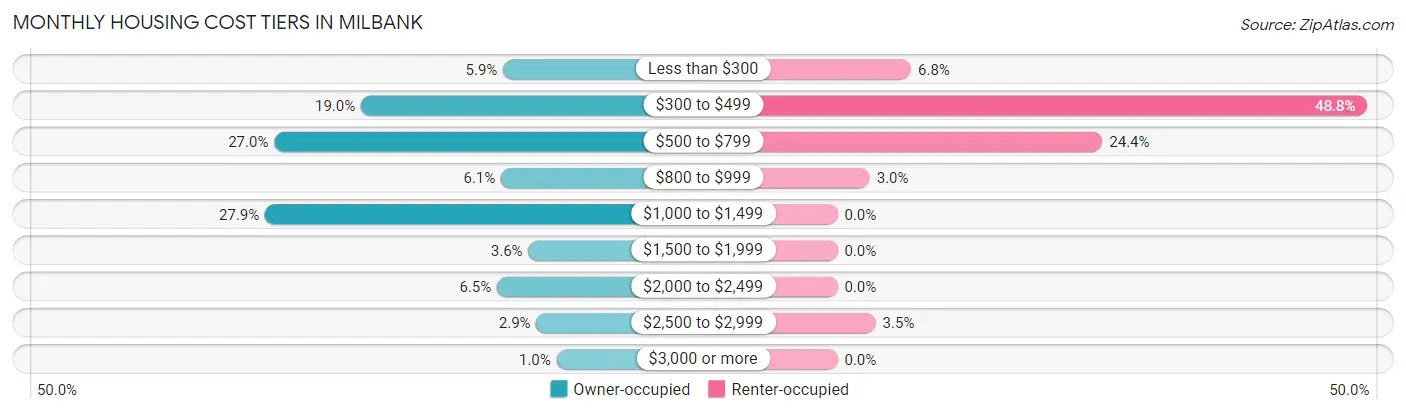
| Monthly Cost | Owner-occupied | Renter-occupied |
| Less than $300 | 64 (5.9%) | 25 (6.8%) |
| $300 to $499 | 205 (19.0%) | 180 (48.8%) |
| $500 to $799 | 291 (27.0%) | 90 (24.4%) |
| $800 to $999 | 66 (6.1%) | 11 (3.0%) |
| $1,000 to $1,499 | 300 (27.9%) | 0 (0.0%) |
| $1,500 to $1,999 | 39 (3.6%) | 0 (0.0%) |
| $2,000 to $2,499 | 70 (6.5%) | 0 (0.0%) |
| $2,500 to $2,999 | 31 (2.9%) | 13 (3.5%) |
| $3,000 or more | 11 (1.0%) | 0 (0.0%) |
| Total | 1,077 (100.0%) | 369 (100.0%) |
Physical Housing Characteristics in Milbank
Housing Structures in Milbank
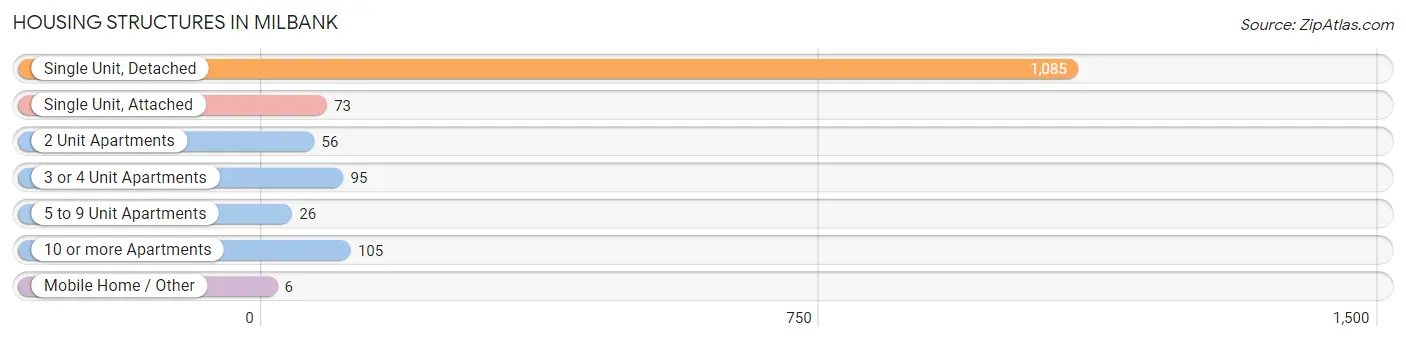
| Structure Type | # Housing Units | % Housing Units |
| Single Unit, Detached | 1,085 | 75.0% |
| Single Unit, Attached | 73 | 5.1% |
| 2 Unit Apartments | 56 | 3.9% |
| 3 or 4 Unit Apartments | 95 | 6.6% |
| 5 to 9 Unit Apartments | 26 | 1.8% |
| 10 or more Apartments | 105 | 7.3% |
| Mobile Home / Other | 6 | 0.4% |
| Total | 1,446 | 100.0% |
Housing Structures by Occupancy in Milbank
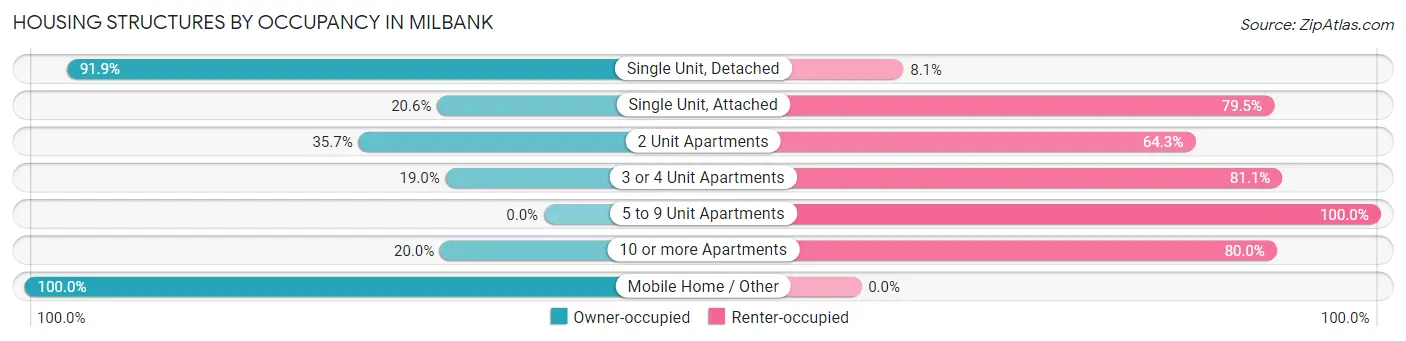
| Structure Type | Owner-occupied | Renter-occupied |
| Single Unit, Detached | 997 (91.9%) | 88 (8.1%) |
| Single Unit, Attached | 15 (20.5%) | 58 (79.4%) |
| 2 Unit Apartments | 20 (35.7%) | 36 (64.3%) |
| 3 or 4 Unit Apartments | 18 (19.0%) | 77 (81.0%) |
| 5 to 9 Unit Apartments | 0 (0.0%) | 26 (100.0%) |
| 10 or more Apartments | 21 (20.0%) | 84 (80.0%) |
| Mobile Home / Other | 6 (100.0%) | 0 (0.0%) |
| Total | 1,077 (74.5%) | 369 (25.5%) |
Housing Structures by Number of Rooms in Milbank
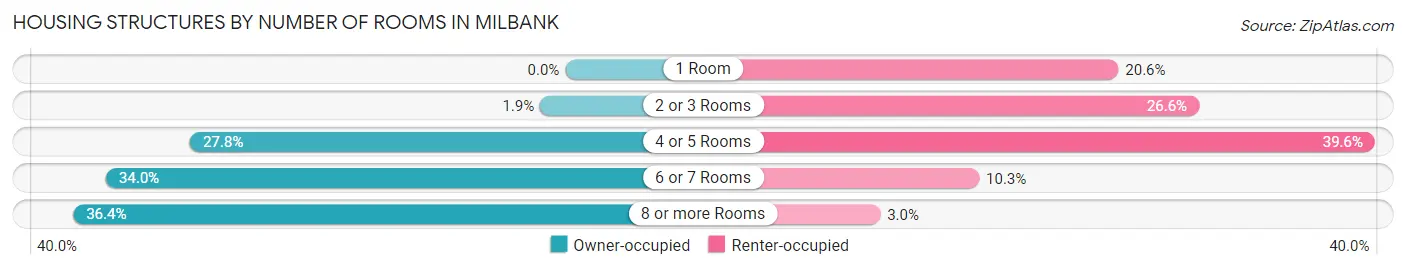
| Number of Rooms | Owner-occupied | Renter-occupied |
| 1 Room | 0 (0.0%) | 76 (20.6%) |
| 2 or 3 Rooms | 20 (1.9%) | 98 (26.6%) |
| 4 or 5 Rooms | 299 (27.8%) | 146 (39.6%) |
| 6 or 7 Rooms | 366 (34.0%) | 38 (10.3%) |
| 8 or more Rooms | 392 (36.4%) | 11 (3.0%) |
| Total | 1,077 (100.0%) | 369 (100.0%) |
Housing Structure by Heating Type in Milbank
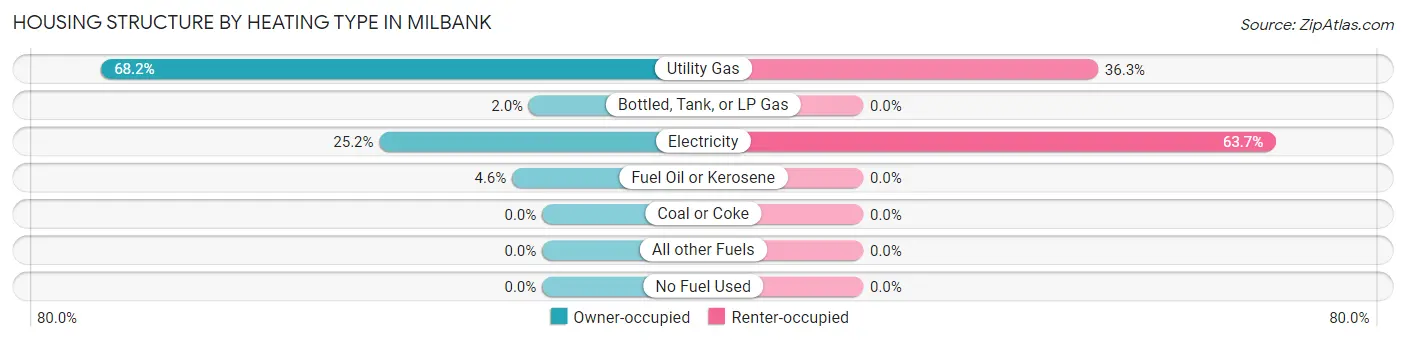
| Heating Type | Owner-occupied | Renter-occupied |
| Utility Gas | 734 (68.1%) | 134 (36.3%) |
| Bottled, Tank, or LP Gas | 22 (2.0%) | 0 (0.0%) |
| Electricity | 271 (25.2%) | 235 (63.7%) |
| Fuel Oil or Kerosene | 50 (4.6%) | 0 (0.0%) |
| Coal or Coke | 0 (0.0%) | 0 (0.0%) |
| All other Fuels | 0 (0.0%) | 0 (0.0%) |
| No Fuel Used | 0 (0.0%) | 0 (0.0%) |
| Total | 1,077 (100.0%) | 369 (100.0%) |
Household Vehicle Usage in Milbank
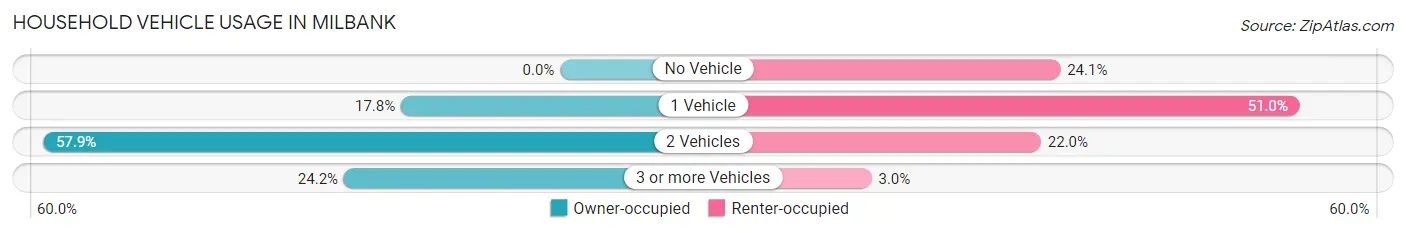
| Vehicles per Household | Owner-occupied | Renter-occupied |
| No Vehicle | 0 (0.0%) | 89 (24.1%) |
| 1 Vehicle | 192 (17.8%) | 188 (50.9%) |
| 2 Vehicles | 624 (57.9%) | 81 (22.0%) |
| 3 or more Vehicles | 261 (24.2%) | 11 (3.0%) |
| Total | 1,077 (100.0%) | 369 (100.0%) |
Real Estate & Mortgages in Milbank
Real Estate and Mortgage Overview in Milbank
| Characteristic | Without Mortgage | With Mortgage |
| Housing Units | 470 | 607 |
| Median Property Value | $164,400 | $161,400 |
| Median Household Income | $74,000 | $160 |
| Monthly Housing Costs | $504 | $0 |
| Real Estate Taxes | $1,769 | $0 |
Property Value by Mortgage Status in Milbank
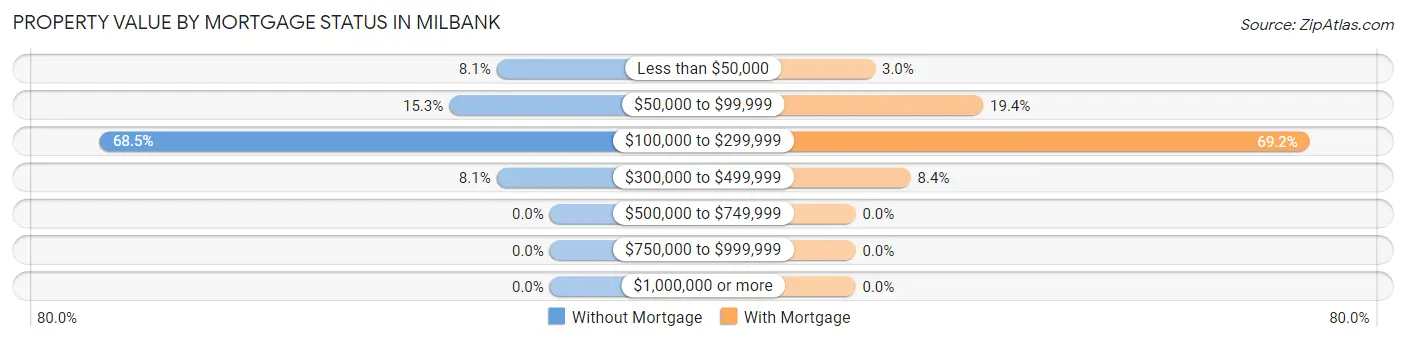
| Property Value | Without Mortgage | With Mortgage |
| Less than $50,000 | 38 (8.1%) | 18 (3.0%) |
| $50,000 to $99,999 | 72 (15.3%) | 118 (19.4%) |
| $100,000 to $299,999 | 322 (68.5%) | 420 (69.2%) |
| $300,000 to $499,999 | 38 (8.1%) | 51 (8.4%) |
| $500,000 to $749,999 | 0 (0.0%) | 0 (0.0%) |
| $750,000 to $999,999 | 0 (0.0%) | 0 (0.0%) |
| $1,000,000 or more | 0 (0.0%) | 0 (0.0%) |
| Total | 470 (100.0%) | 607 (100.0%) |
Household Income by Mortgage Status in Milbank
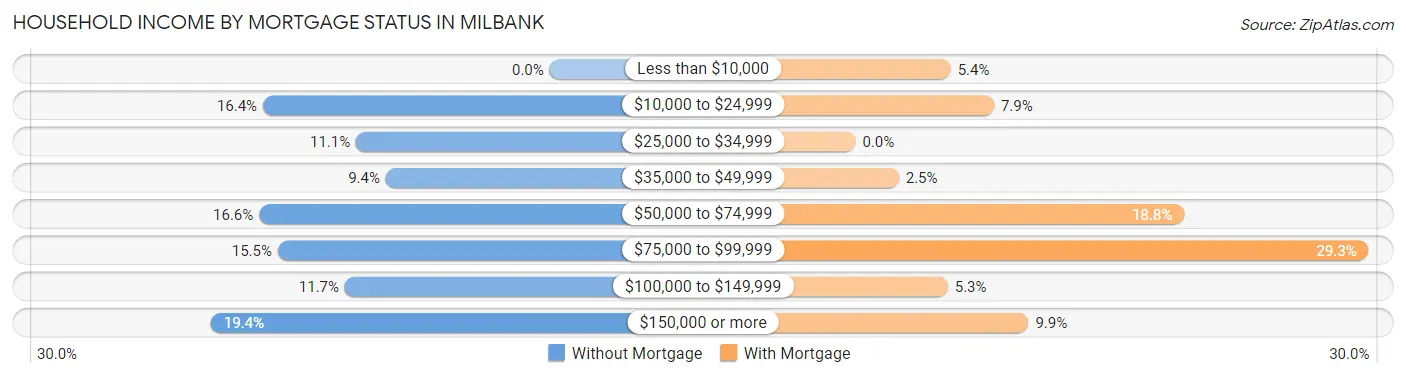
| Household Income | Without Mortgage | With Mortgage |
| Less than $10,000 | 0 (0.0%) | 33 (5.4%) |
| $10,000 to $24,999 | 77 (16.4%) | 48 (7.9%) |
| $25,000 to $34,999 | 52 (11.1%) | 0 (0.0%) |
| $35,000 to $49,999 | 44 (9.4%) | 15 (2.5%) |
| $50,000 to $74,999 | 78 (16.6%) | 114 (18.8%) |
| $75,000 to $99,999 | 73 (15.5%) | 178 (29.3%) |
| $100,000 to $149,999 | 55 (11.7%) | 32 (5.3%) |
| $150,000 or more | 91 (19.4%) | 60 (9.9%) |
| Total | 470 (100.0%) | 607 (100.0%) |
Property Value to Household Income Ratio in Milbank
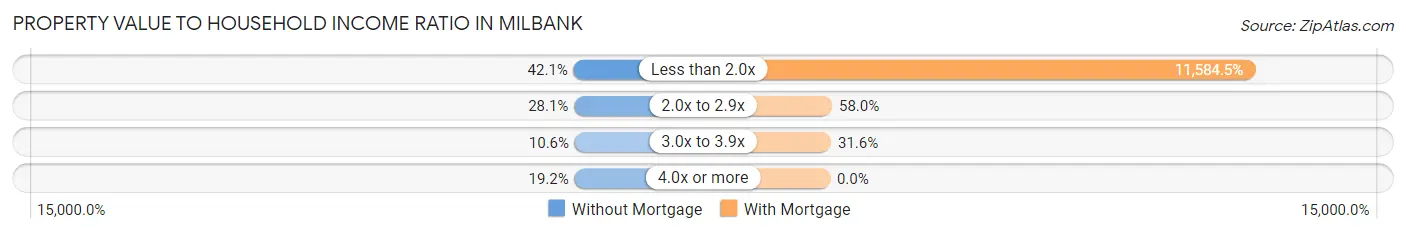
| Value-to-Income Ratio | Without Mortgage | With Mortgage |
| Less than 2.0x | 198 (42.1%) | 70,318 (11,584.5%) |
| 2.0x to 2.9x | 132 (28.1%) | 352 (58.0%) |
| 3.0x to 3.9x | 50 (10.6%) | 192 (31.6%) |
| 4.0x or more | 90 (19.2%) | 0 (0.0%) |
| Total | 470 (100.0%) | 607 (100.0%) |
Real Estate Taxes by Mortgage Status in Milbank
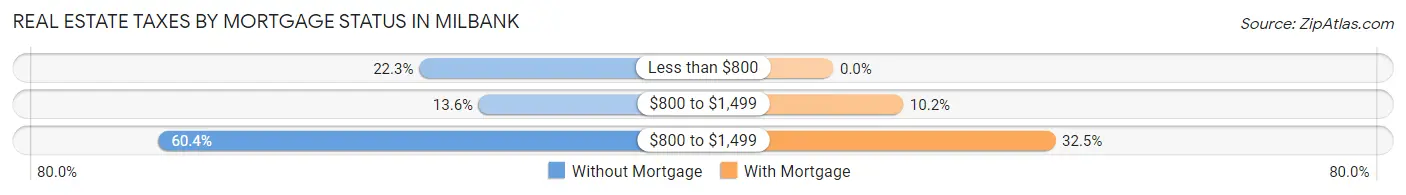
| Property Taxes | Without Mortgage | With Mortgage |
| Less than $800 | 105 (22.3%) | 0 (0.0%) |
| $800 to $1,499 | 64 (13.6%) | 62 (10.2%) |
| $800 to $1,499 | 284 (60.4%) | 197 (32.5%) |
| Total | 470 (100.0%) | 607 (100.0%) |
Health & Disability in Milbank
Health Insurance Coverage by Age in Milbank
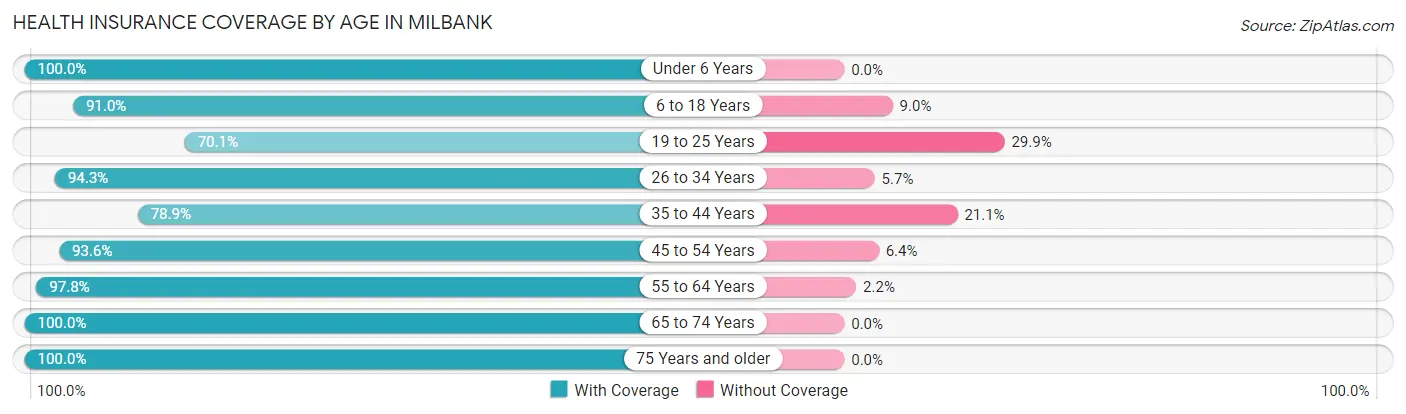
| Age Bracket | With Coverage | Without Coverage |
| Under 6 Years | 236 (100.0%) | 0 (0.0%) |
| 6 to 18 Years | 464 (91.0%) | 46 (9.0%) |
| 19 to 25 Years | 162 (70.1%) | 69 (29.9%) |
| 26 to 34 Years | 467 (94.3%) | 28 (5.7%) |
| 35 to 44 Years | 273 (78.9%) | 73 (21.1%) |
| 45 to 54 Years | 248 (93.6%) | 17 (6.4%) |
| 55 to 64 Years | 530 (97.8%) | 12 (2.2%) |
| 65 to 74 Years | 438 (100.0%) | 0 (0.0%) |
| 75 Years and older | 344 (100.0%) | 0 (0.0%) |
| Total | 3,162 (92.8%) | 245 (7.2%) |
Health Insurance Coverage by Citizenship Status in Milbank
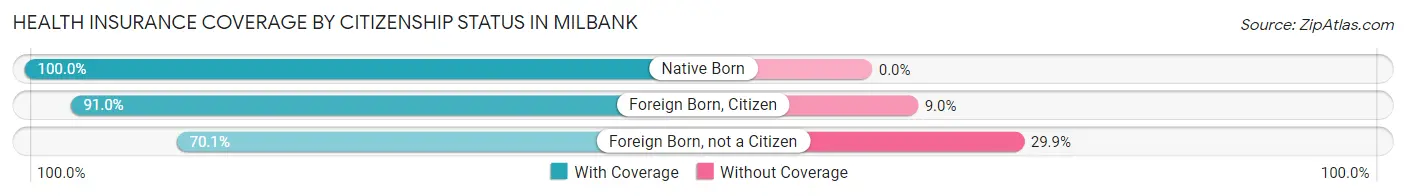
| Citizenship Status | With Coverage | Without Coverage |
| Native Born | 236 (100.0%) | 0 (0.0%) |
| Foreign Born, Citizen | 464 (91.0%) | 46 (9.0%) |
| Foreign Born, not a Citizen | 162 (70.1%) | 69 (29.9%) |
Health Insurance Coverage by Household Income in Milbank
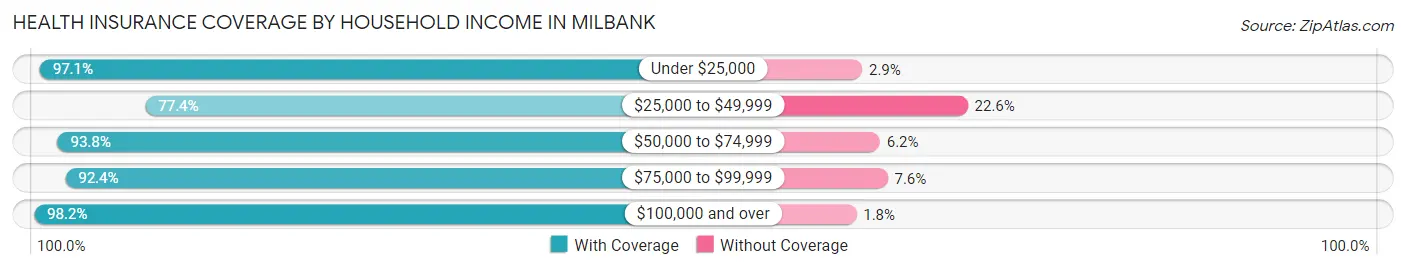
| Household Income | With Coverage | Without Coverage |
| Under $25,000 | 407 (97.1%) | 12 (2.9%) |
| $25,000 to $49,999 | 489 (77.4%) | 143 (22.6%) |
| $50,000 to $74,999 | 592 (93.8%) | 39 (6.2%) |
| $75,000 to $99,999 | 339 (92.4%) | 28 (7.6%) |
| $100,000 and over | 1,268 (98.2%) | 23 (1.8%) |
Public vs Private Health Insurance Coverage by Age in Milbank
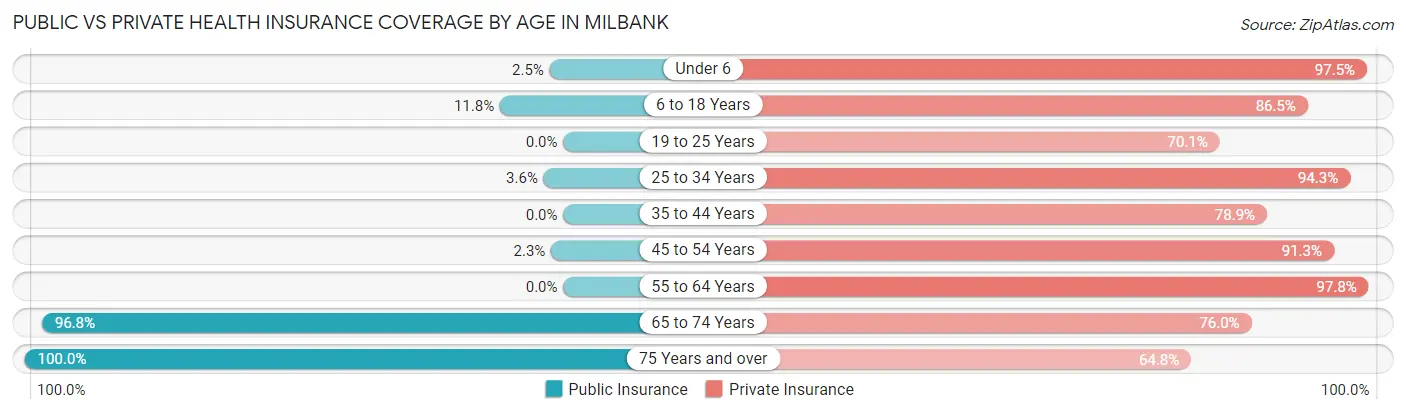
| Age Bracket | Public Insurance | Private Insurance |
| Under 6 | 6 (2.5%) | 230 (97.5%) |
| 6 to 18 Years | 60 (11.8%) | 441 (86.5%) |
| 19 to 25 Years | 0 (0.0%) | 162 (70.1%) |
| 25 to 34 Years | 18 (3.6%) | 467 (94.3%) |
| 35 to 44 Years | 0 (0.0%) | 273 (78.9%) |
| 45 to 54 Years | 6 (2.3%) | 242 (91.3%) |
| 55 to 64 Years | 0 (0.0%) | 530 (97.8%) |
| 65 to 74 Years | 424 (96.8%) | 333 (76.0%) |
| 75 Years and over | 344 (100.0%) | 223 (64.8%) |
| Total | 858 (25.2%) | 2,901 (85.2%) |
Disability Status by Sex by Age in Milbank
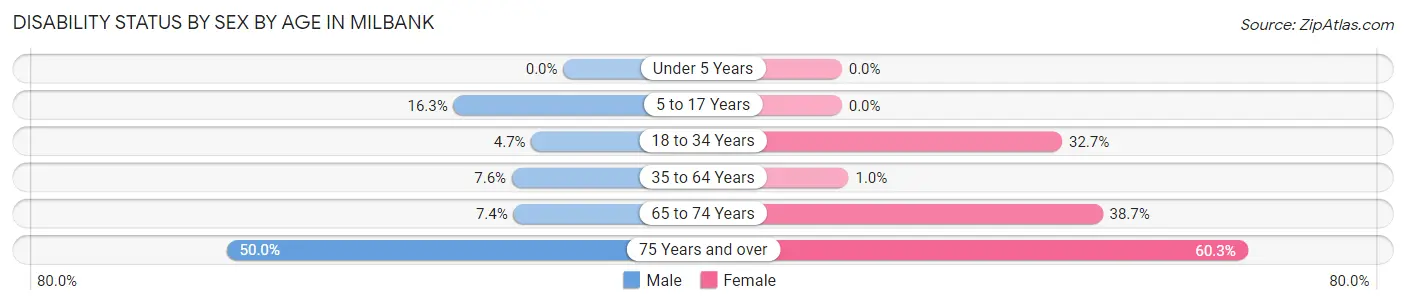
| Age Bracket | Male | Female |
| Under 5 Years | 0 (0.0%) | 0 (0.0%) |
| 5 to 17 Years | 37 (16.3%) | 0 (0.0%) |
| 18 to 34 Years | 18 (4.7%) | 122 (32.7%) |
| 35 to 64 Years | 42 (7.6%) | 6 (1.0%) |
| 65 to 74 Years | 15 (7.4%) | 91 (38.7%) |
| 75 Years and over | 50 (50.0%) | 147 (60.3%) |
Disability Class by Sex by Age in Milbank
Disability Class: Hearing Difficulty
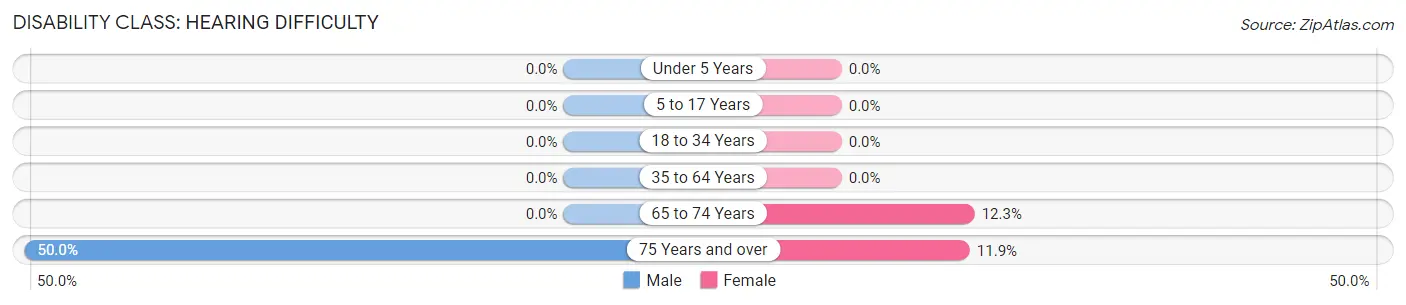
| Age Bracket | Male | Female |
| Under 5 Years | 0 (0.0%) | 0 (0.0%) |
| 5 to 17 Years | 0 (0.0%) | 0 (0.0%) |
| 18 to 34 Years | 0 (0.0%) | 0 (0.0%) |
| 35 to 64 Years | 0 (0.0%) | 0 (0.0%) |
| 65 to 74 Years | 0 (0.0%) | 29 (12.3%) |
| 75 Years and over | 50 (50.0%) | 29 (11.9%) |
Disability Class: Vision Difficulty
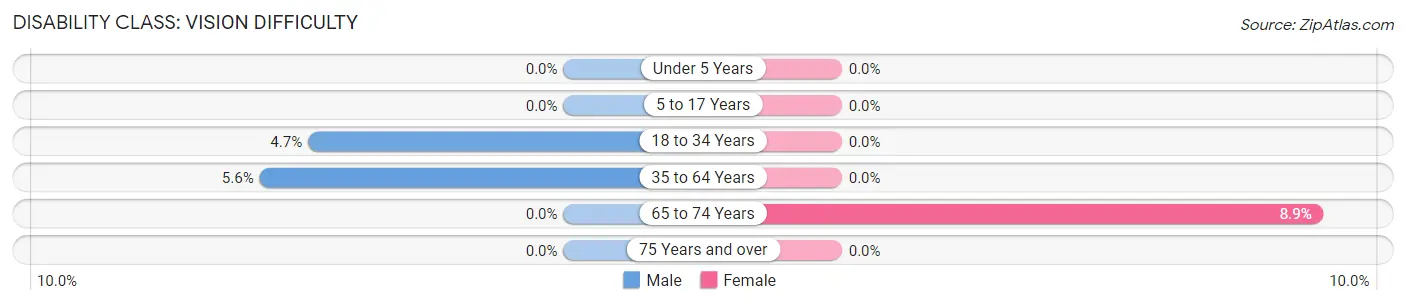
| Age Bracket | Male | Female |
| Under 5 Years | 0 (0.0%) | 0 (0.0%) |
| 5 to 17 Years | 0 (0.0%) | 0 (0.0%) |
| 18 to 34 Years | 18 (4.7%) | 0 (0.0%) |
| 35 to 64 Years | 31 (5.6%) | 0 (0.0%) |
| 65 to 74 Years | 0 (0.0%) | 21 (8.9%) |
| 75 Years and over | 0 (0.0%) | 0 (0.0%) |
Disability Class: Cognitive Difficulty
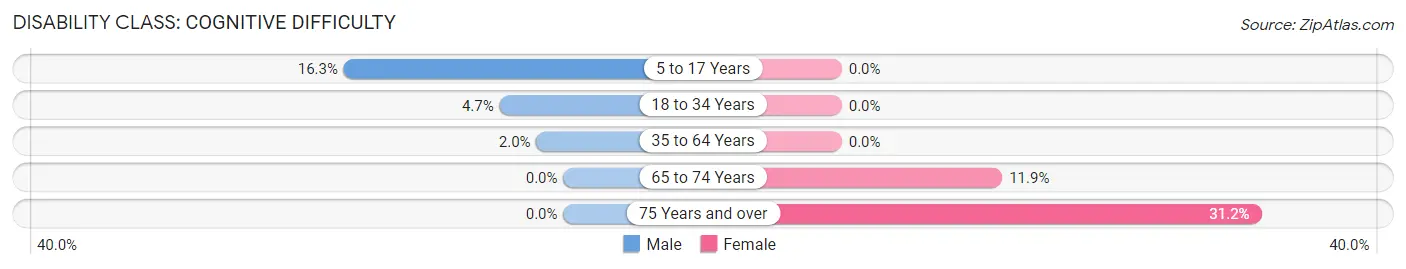
| Age Bracket | Male | Female |
| 5 to 17 Years | 37 (16.3%) | 0 (0.0%) |
| 18 to 34 Years | 18 (4.7%) | 0 (0.0%) |
| 35 to 64 Years | 11 (2.0%) | 0 (0.0%) |
| 65 to 74 Years | 0 (0.0%) | 28 (11.9%) |
| 75 Years and over | 0 (0.0%) | 76 (31.1%) |
Disability Class: Ambulatory Difficulty
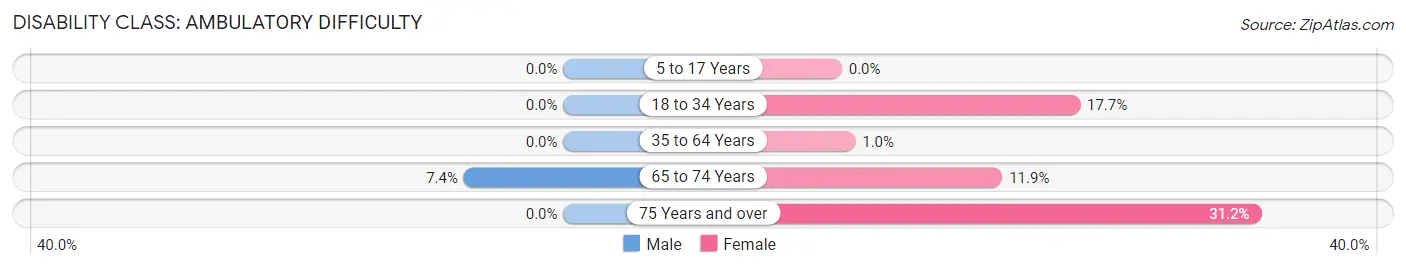
| Age Bracket | Male | Female |
| 5 to 17 Years | 0 (0.0%) | 0 (0.0%) |
| 18 to 34 Years | 0 (0.0%) | 66 (17.7%) |
| 35 to 64 Years | 0 (0.0%) | 6 (1.0%) |
| 65 to 74 Years | 15 (7.4%) | 28 (11.9%) |
| 75 Years and over | 0 (0.0%) | 76 (31.1%) |
Disability Class: Self-Care Difficulty
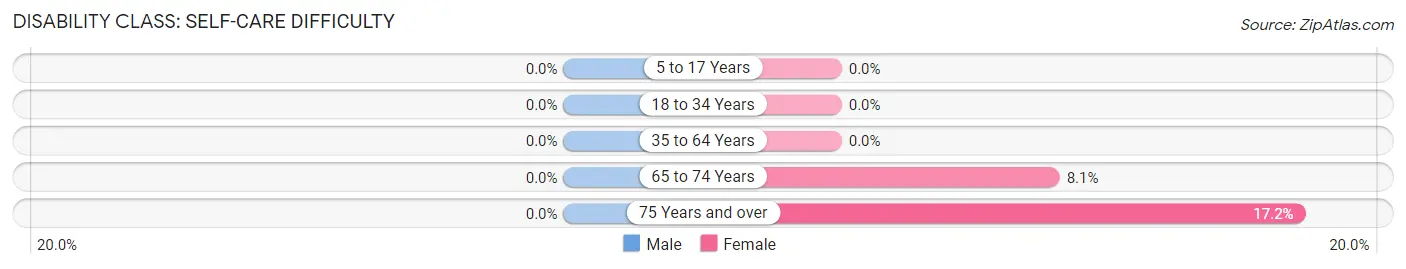
| Age Bracket | Male | Female |
| 5 to 17 Years | 0 (0.0%) | 0 (0.0%) |
| 18 to 34 Years | 0 (0.0%) | 0 (0.0%) |
| 35 to 64 Years | 0 (0.0%) | 0 (0.0%) |
| 65 to 74 Years | 0 (0.0%) | 19 (8.1%) |
| 75 Years and over | 0 (0.0%) | 42 (17.2%) |
Technology Access in Milbank
Computing Device Access in Milbank
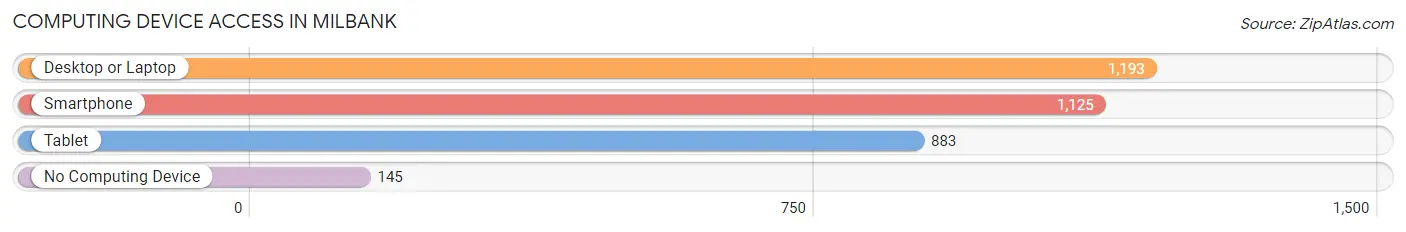
| Device Type | # Households | % Households |
| Desktop or Laptop | 1,193 | 82.5% |
| Smartphone | 1,125 | 77.8% |
| Tablet | 883 | 61.1% |
| No Computing Device | 145 | 10.0% |
| Total | 1,446 | 100.0% |
Internet Access in Milbank
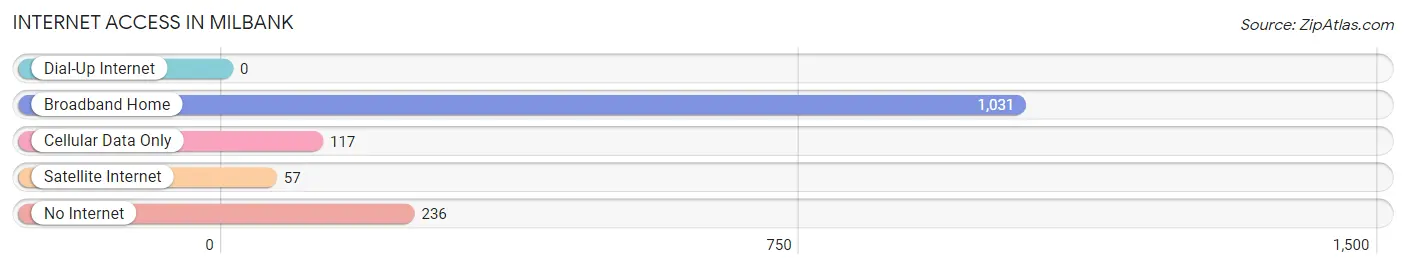
| Internet Type | # Households | % Households |
| Dial-Up Internet | 0 | 0.0% |
| Broadband Home | 1,031 | 71.3% |
| Cellular Data Only | 117 | 8.1% |
| Satellite Internet | 57 | 3.9% |
| No Internet | 236 | 16.3% |
| Total | 1,446 | 100.0% |
Milbank Summary
Milbank, South Dakota is a small city located in Grant County, in the northeastern corner of the state. It is situated on the banks of the Big Stone Lake, which is part of the Minnesota-South Dakota border. The city has a population of approximately 3,000 people and is the county seat of Grant County.
History
The area that is now Milbank was first settled in the late 1800s by settlers from Norway and Germany. The city was officially incorporated in 1883 and was named after the Milbank family, who were prominent in the area. The city was originally a farming community, but in the early 1900s, the economy shifted to focus on the lumber industry. The city was also home to a number of manufacturing plants, including a flour mill, a creamery, and a furniture factory.
In the 1950s, the economy shifted again, this time to focus on tourism. The city was home to a number of resorts and hotels, as well as a number of recreational activities, such as fishing, boating, and swimming. The city also became a popular destination for snowmobilers and ice fishermen.
Geography
Milbank is located in the northeastern corner of South Dakota, on the banks of the Big Stone Lake. The city is situated at an elevation of 1,092 feet above sea level. The city is surrounded by rolling hills and prairies, and is located near the Big Stone National Wildlife Refuge. The city is located approximately 75 miles from the state capital of Pierre.
Economy
The economy of Milbank is largely based on agriculture and tourism. The city is home to a number of farms, which produce a variety of crops, including corn, soybeans, wheat, and hay. The city is also home to a number of manufacturing plants, including a flour mill, a creamery, and a furniture factory.
The city is also a popular tourist destination, with a number of resorts and hotels located in the area. The city is home to a number of recreational activities, such as fishing, boating, and swimming. The city is also a popular destination for snowmobilers and ice fishermen.
Demographics
As of the 2010 census, the population of Milbank was 3,037. The racial makeup of the city was 95.3% White, 0.7% African American, 0.3% Native American, 0.3% Asian, 0.1% Pacific Islander, 1.2% from other races, and 2.3% from two or more races. Hispanic or Latino of any race were 3.2% of the population.
The median income for a household in the city was $37,917, and the median income for a family was $45,938. The per capita income for the city was $18,945. About 11.2% of families and 14.2% of the population were below the poverty line, including 19.2% of those under age 18 and 8.2% of those age 65 or over.
Common Questions
What is Per Capita Income in Milbank?
Per Capita income in Milbank is $40,193.
What is the Median Family Income in Milbank?
Median Family Income in Milbank is $85,118.
What is the Median Household income in Milbank?
Median Household Income in Milbank is $63,269.
What is Income or Wage Gap in Milbank?
Income or Wage Gap in Milbank is 47.9%.
Women in Milbank earn 52.1 cents for every dollar earned by a man.
What is Inequality or Gini Index in Milbank?
Inequality or Gini Index in Milbank is 0.51.
What is the Total Population of Milbank?
Total Population of Milbank is 3,506.
What is the Total Male Population of Milbank?
Total Male Population of Milbank is 1,596.
What is the Total Female Population of Milbank?
Total Female Population of Milbank is 1,910.
What is the Ratio of Males per 100 Females in Milbank?
There are 83.56 Males per 100 Females in Milbank.
What is the Ratio of Females per 100 Males in Milbank?
There are 119.67 Females per 100 Males in Milbank.
What is the Median Population Age in Milbank?
Median Population Age in Milbank is 42.3 Years.
What is the Average Family Size in Milbank
Average Family Size in Milbank is 2.8 People.
What is the Average Household Size in Milbank
Average Household Size in Milbank is 2.3 People.
How Large is the Labor Force in Milbank?
There are 1,739 People in the Labor Forcein in Milbank.
What is the Percentage of People in the Labor Force in Milbank?
61.3% of People are in the Labor Force in Milbank.
What is the Unemployment Rate in Milbank?
Unemployment Rate in Milbank is 4.0%.