Brandon, SD Map & Demographics
Brandon Map
Brandon Overview
$46,599
PER CAPITA INCOME
$119,316
AVG FAMILY INCOME
$101,747
AVG HOUSEHOLD INCOME
39.0%
WAGE / INCOME GAP [ % ]
61.0¢/ $1
WAGE / INCOME GAP [ $ ]
0.39
INEQUALITY / GINI INDEX
10,919
TOTAL POPULATION
5,576
MALE POPULATION
5,343
FEMALE POPULATION
104.36
MALES / 100 FEMALES
95.82
FEMALES / 100 MALES
38.2
MEDIAN AGE
3.2
AVG FAMILY SIZE
2.7
AVG HOUSEHOLD SIZE
6,415
LABOR FORCE [ PEOPLE ]
79.3%
PERCENT IN LABOR FORCE
1.2%
UNEMPLOYMENT RATE
Brandon Zip Codes
Brandon Area Codes
Income in Brandon
Income Overview in Brandon
Per Capita Income in Brandon is $46,599, while median incomes of families and households are $119,316 and $101,747 respectively.
| Characteristic | Number | Measure |
| Per Capita Income | 10,919 | $46,599 |
| Median Family Income | 2,879 | $119,316 |
| Mean Family Income | 2,879 | $143,824 |
| Median Household Income | 4,082 | $101,747 |
| Mean Household Income | 4,082 | $122,682 |
| Income Deficit | 2,879 | $0 |
| Wage / Income Gap (%) | 10,919 | 38.99% |
| Wage / Income Gap ($) | 10,919 | 61.01¢ per $1 |
| Gini / Inequality Index | 10,919 | 0.39 |
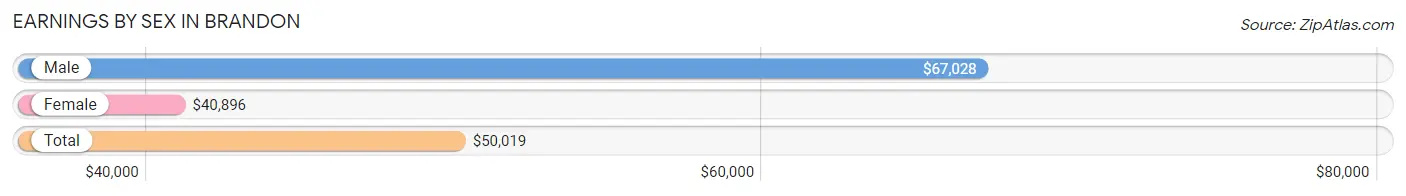
Earnings by Sex in Brandon
Average Earnings in Brandon are $50,019, $67,028 for men and $40,896 for women, a difference of 39.0%.
| Sex | Number | Average Earnings |
| Male | 3,436 (52.1%) | $67,028 |
| Female | 3,159 (47.9%) | $40,896 |
| Total | 6,595 (100.0%) | $50,019 |
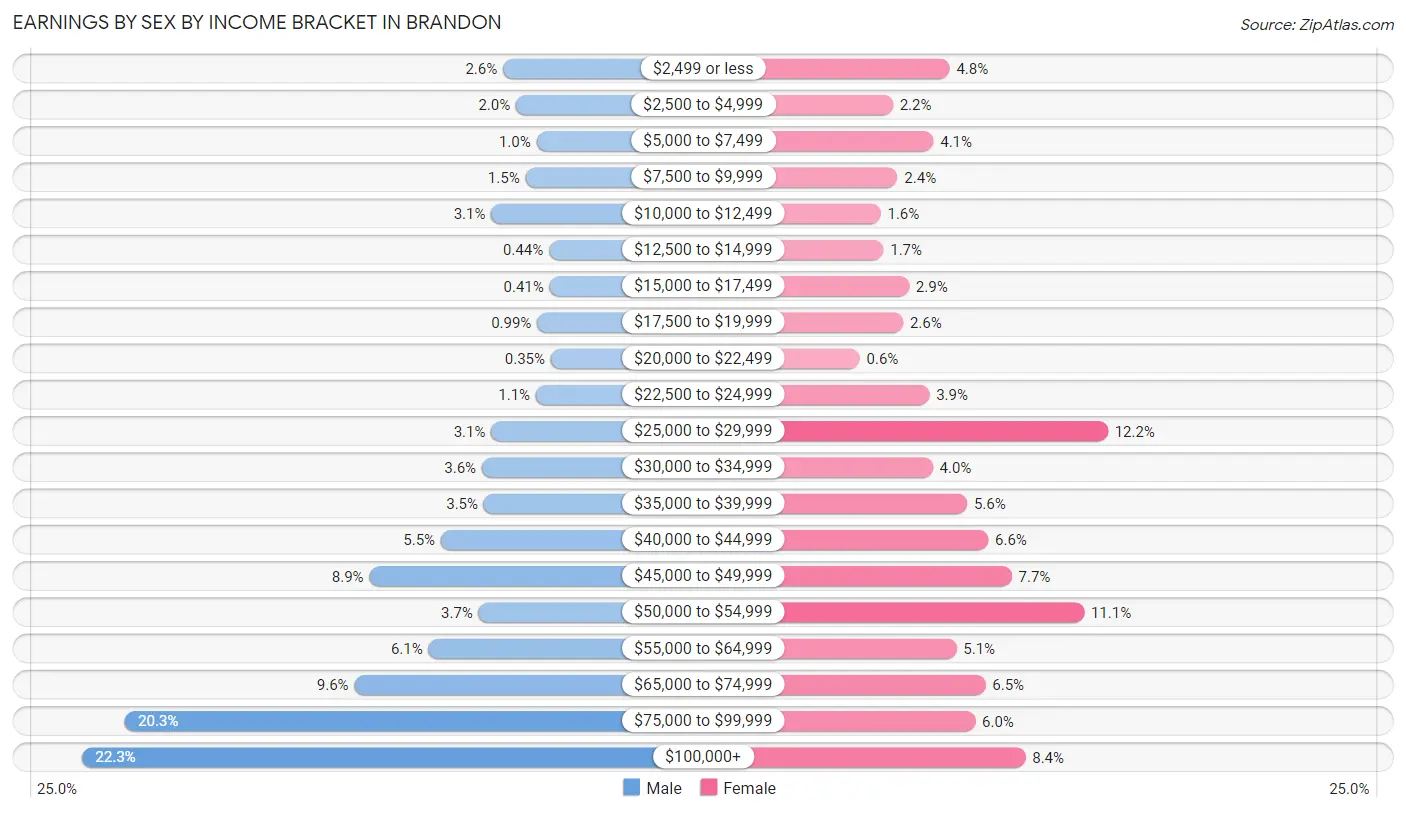
Earnings by Sex by Income Bracket in Brandon
The most common earnings brackets in Brandon are $100,000+ for men (766 | 22.3%) and $25,000 to $29,999 for women (386 | 12.2%).
| Income | Male | Female |
| $2,499 or less | 89 (2.6%) | 152 (4.8%) |
| $2,500 to $4,999 | 68 (2.0%) | 68 (2.1%) |
| $5,000 to $7,499 | 35 (1.0%) | 128 (4.1%) |
| $7,500 to $9,999 | 53 (1.5%) | 75 (2.4%) |
| $10,000 to $12,499 | 108 (3.1%) | 50 (1.6%) |
| $12,500 to $14,999 | 15 (0.4%) | 54 (1.7%) |
| $15,000 to $17,499 | 14 (0.4%) | 92 (2.9%) |
| $17,500 to $19,999 | 34 (1.0%) | 83 (2.6%) |
| $20,000 to $22,499 | 12 (0.4%) | 19 (0.6%) |
| $22,500 to $24,999 | 36 (1.1%) | 122 (3.9%) |
| $25,000 to $29,999 | 108 (3.1%) | 386 (12.2%) |
| $30,000 to $34,999 | 123 (3.6%) | 127 (4.0%) |
| $35,000 to $39,999 | 120 (3.5%) | 178 (5.6%) |
| $40,000 to $44,999 | 189 (5.5%) | 209 (6.6%) |
| $45,000 to $49,999 | 304 (8.8%) | 244 (7.7%) |
| $50,000 to $54,999 | 128 (3.7%) | 351 (11.1%) |
| $55,000 to $64,999 | 209 (6.1%) | 162 (5.1%) |
| $65,000 to $74,999 | 328 (9.6%) | 205 (6.5%) |
| $75,000 to $99,999 | 697 (20.3%) | 190 (6.0%) |
| $100,000+ | 766 (22.3%) | 264 (8.4%) |
| Total | 3,436 (100.0%) | 3,159 (100.0%) |
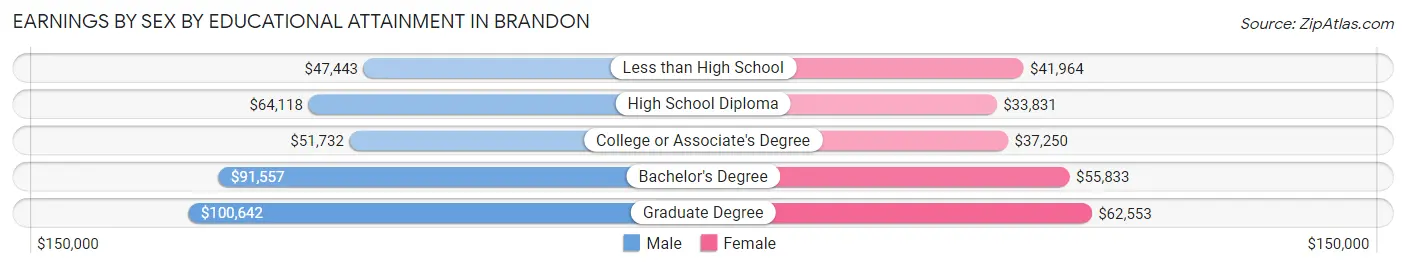
Earnings by Sex by Educational Attainment in Brandon
Average earnings in Brandon are $72,077 for men and $45,094 for women, a difference of 37.4%. Men with an educational attainment of graduate degree enjoy the highest average annual earnings of $100,642, while those with less than high school education earn the least with $47,443. Women with an educational attainment of graduate degree earn the most with the average annual earnings of $62,553, while those with high school diploma education have the smallest earnings of $33,831.
| Educational Attainment | Male Income | Female Income |
| Less than High School | $47,443 | $41,964 |
| High School Diploma | $64,118 | $33,831 |
| College or Associate's Degree | $51,732 | $37,250 |
| Bachelor's Degree | $91,557 | $55,833 |
| Graduate Degree | $100,642 | $62,553 |
| Total | $72,077 | $45,094 |
Family Income in Brandon
Family Income Brackets in Brandon
According to the Brandon family income data, there are 881 families falling into the $100,000 to $149,999 income range, which is the most common income bracket and makes up 30.6% of all families.
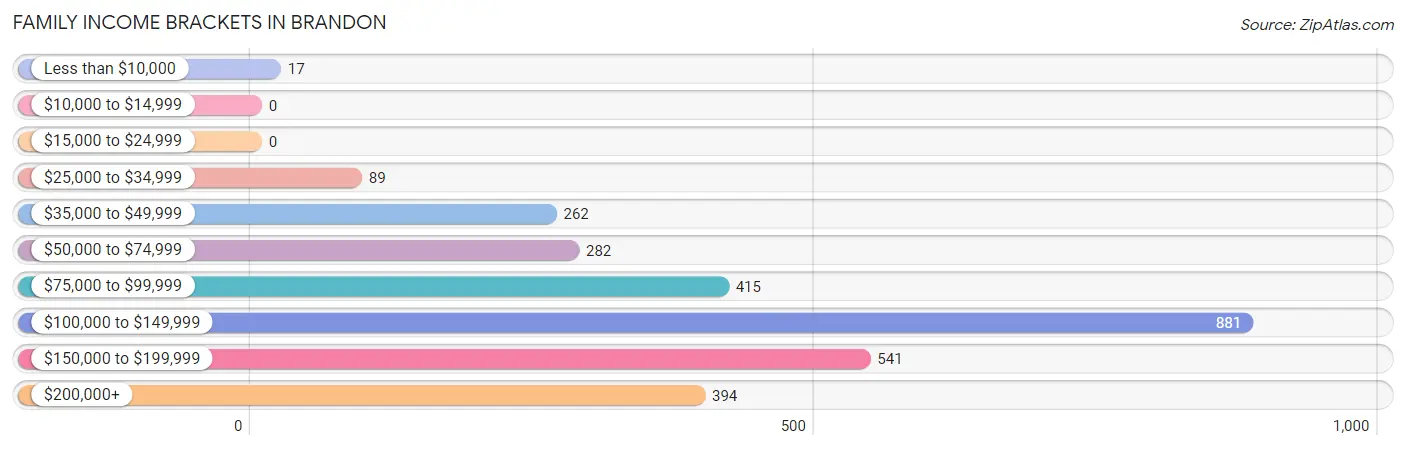
| Income Bracket | # Families | % Families |
| Less than $10,000 | 17 | 0.6% |
| $10,000 to $14,999 | 0 | 0.0% |
| $15,000 to $24,999 | 0 | 0.0% |
| $25,000 to $34,999 | 89 | 3.1% |
| $35,000 to $49,999 | 262 | 9.1% |
| $50,000 to $74,999 | 282 | 9.8% |
| $75,000 to $99,999 | 415 | 14.4% |
| $100,000 to $149,999 | 881 | 30.6% |
| $150,000 to $199,999 | 541 | 18.8% |
| $200,000+ | 394 | 13.7% |
Family Income by Famaliy Size in Brandon
5-person families (391 | 13.6%) account for the highest median family income in Brandon with $151,875 per family, while 2-person families (1,248 | 43.3%) have the highest median income of $45,625 per family member.
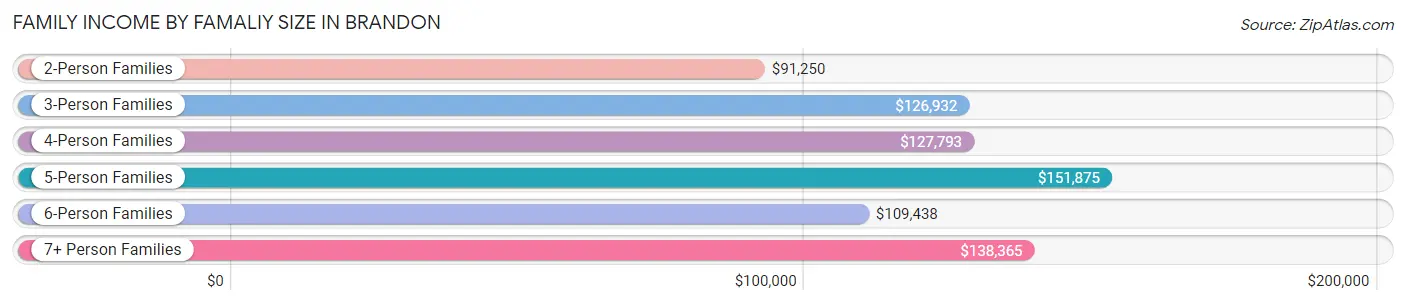
| Income Bracket | # Families | Median Income |
| 2-Person Families | 1,248 (43.3%) | $91,250 |
| 3-Person Families | 522 (18.1%) | $126,932 |
| 4-Person Families | 560 (19.5%) | $127,793 |
| 5-Person Families | 391 (13.6%) | $151,875 |
| 6-Person Families | 109 (3.8%) | $109,438 |
| 7+ Person Families | 49 (1.7%) | $138,365 |
| Total | 2,879 (100.0%) | $119,316 |
Family Income by Number of Earners in Brandon
The median family income in Brandon is $119,316, with families comprising 3+ earners (519) having the highest median family income of $165,573, while families with 1 earner (560) have the lowest median family income of $53,625, accounting for 18.0% and 19.5% of families, respectively.
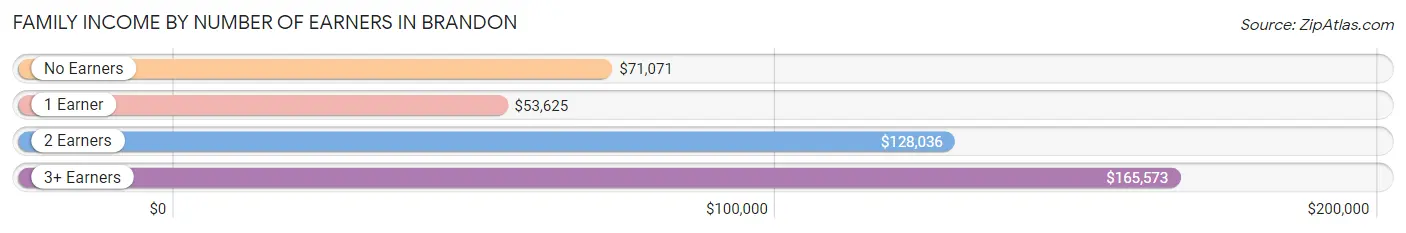
| Number of Earners | # Families | Median Income |
| No Earners | 204 (7.1%) | $71,071 |
| 1 Earner | 560 (19.5%) | $53,625 |
| 2 Earners | 1,596 (55.4%) | $128,036 |
| 3+ Earners | 519 (18.0%) | $165,573 |
| Total | 2,879 (100.0%) | $119,316 |
Household Income in Brandon
Household Income Brackets in Brandon
With 1,049 households falling in the category, the $100,000 to $149,999 income range is the most frequent in Brandon, accounting for 25.7% of all households. In contrast, only 37 households (0.9%) fall into the less than $10,000 income bracket, making it the least populous group.
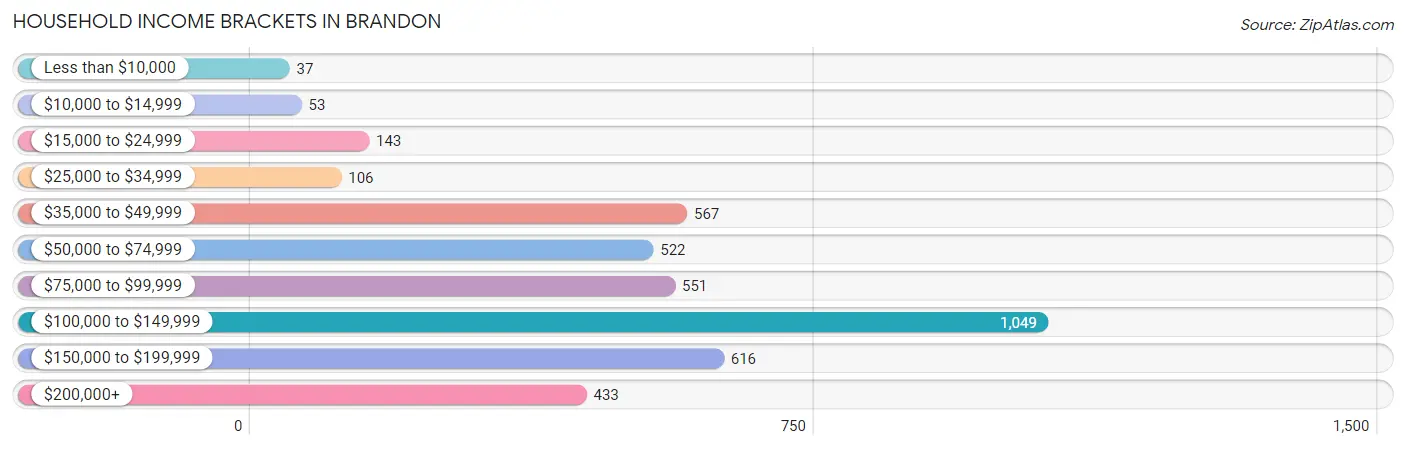
| Income Bracket | # Households | % Households |
| Less than $10,000 | 37 | 0.9% |
| $10,000 to $14,999 | 53 | 1.3% |
| $15,000 to $24,999 | 143 | 3.5% |
| $25,000 to $34,999 | 106 | 2.6% |
| $35,000 to $49,999 | 567 | 13.9% |
| $50,000 to $74,999 | 522 | 12.8% |
| $75,000 to $99,999 | 551 | 13.5% |
| $100,000 to $149,999 | 1,049 | 25.7% |
| $150,000 to $199,999 | 616 | 15.1% |
| $200,000+ | 433 | 10.6% |
Household Income by Householder Age in Brandon
The median household income in Brandon is $101,747, with the highest median household income of $127,485 found in the 45 to 64 years age bracket for the primary householder. A total of 1,553 households (38.1%) fall into this category. Meanwhile, the 15 to 24 years age bracket for the primary householder has the lowest median household income of $0, with 25 households (0.6%) in this group.
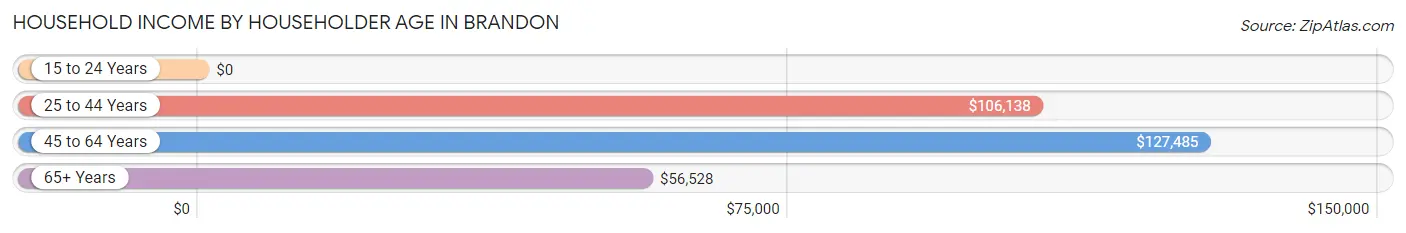
| Income Bracket | # Households | Median Income |
| 15 to 24 Years | 25 (0.6%) | $0 |
| 25 to 44 Years | 1,665 (40.8%) | $106,138 |
| 45 to 64 Years | 1,553 (38.1%) | $127,485 |
| 65+ Years | 839 (20.5%) | $56,528 |
| Total | 4,082 (100.0%) | $101,747 |
Poverty in Brandon
Income Below Poverty by Sex and Age in Brandon
With 2.6% poverty level for males and 2.8% for females among the residents of Brandon, 55 to 64 year old males and 45 to 54 year old females are the most vulnerable to poverty, with 54 males (7.8%) and 62 females (8.3%) in their respective age groups living below the poverty level.
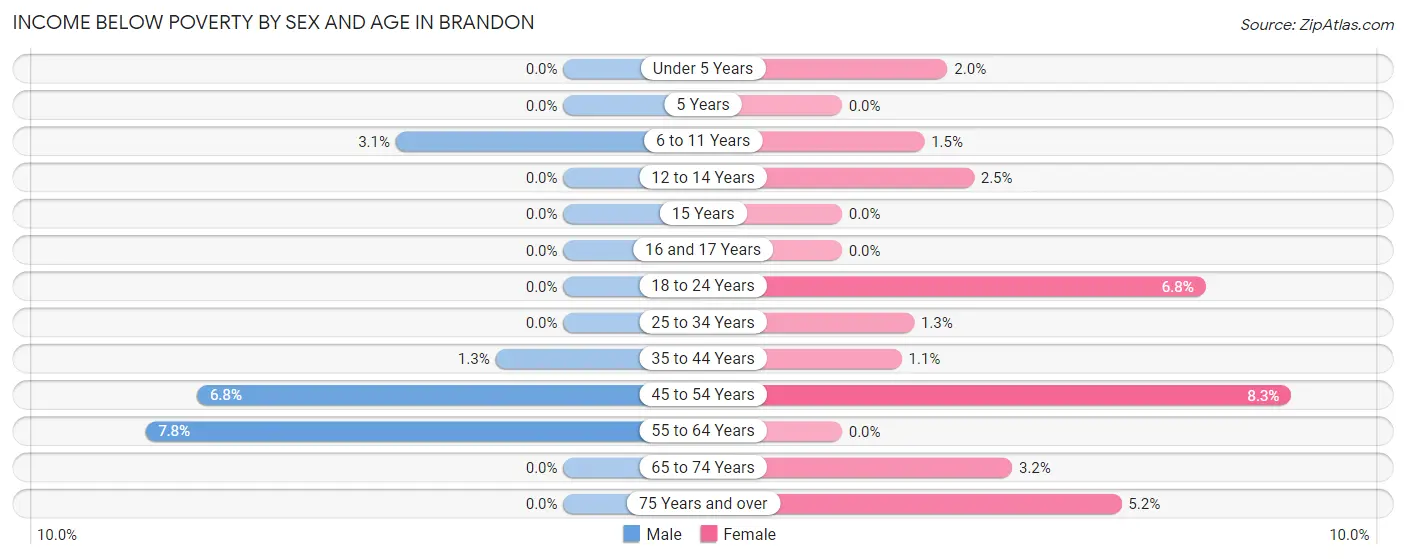
| Age Bracket | Male | Female |
| Under 5 Years | 0 (0.0%) | 6 (2.0%) |
| 5 Years | 0 (0.0%) | 0 (0.0%) |
| 6 to 11 Years | 18 (3.1%) | 7 (1.5%) |
| 12 to 14 Years | 0 (0.0%) | 7 (2.5%) |
| 15 Years | 0 (0.0%) | 0 (0.0%) |
| 16 and 17 Years | 0 (0.0%) | 0 (0.0%) |
| 18 to 24 Years | 0 (0.0%) | 16 (6.8%) |
| 25 to 34 Years | 0 (0.0%) | 9 (1.3%) |
| 35 to 44 Years | 14 (1.3%) | 9 (1.1%) |
| 45 to 54 Years | 56 (6.8%) | 62 (8.3%) |
| 55 to 64 Years | 54 (7.8%) | 0 (0.0%) |
| 65 to 74 Years | 0 (0.0%) | 14 (3.2%) |
| 75 Years and over | 0 (0.0%) | 19 (5.2%) |
| Total | 142 (2.6%) | 149 (2.8%) |
Income Above Poverty by Sex and Age in Brandon
According to the poverty statistics in Brandon, males aged under 5 years and females aged 5 years are the age groups that are most secure financially, with 100.0% of males and 100.0% of females in these age groups living above the poverty line.
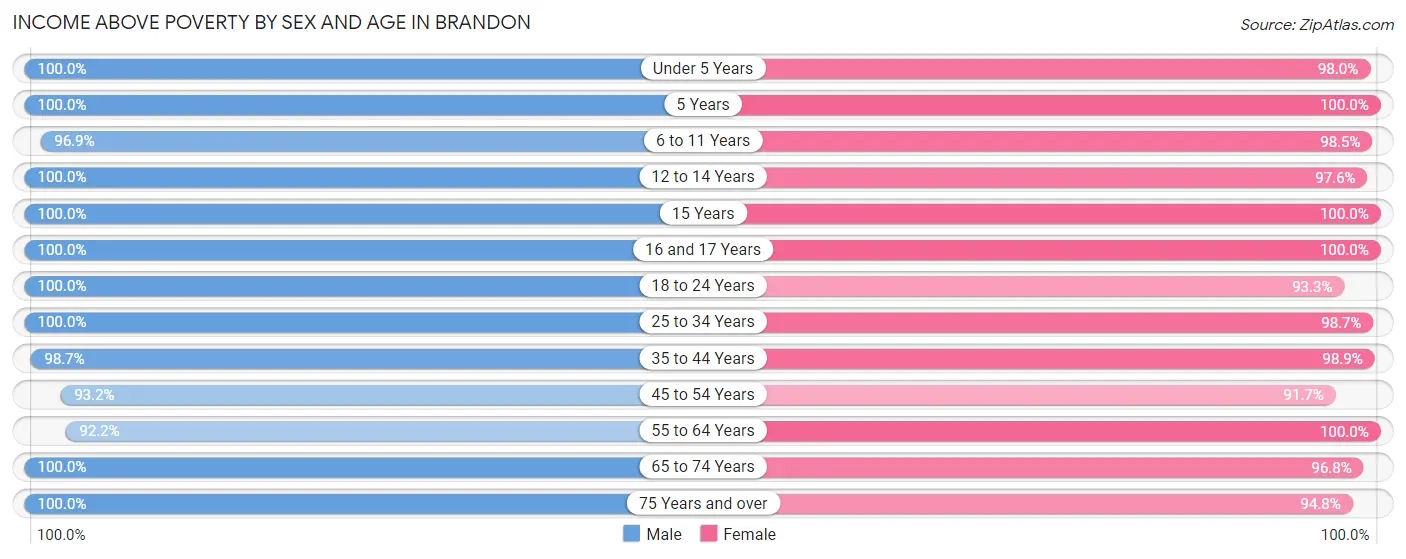
| Age Bracket | Male | Female |
| Under 5 Years | 398 (100.0%) | 300 (98.0%) |
| 5 Years | 150 (100.0%) | 72 (100.0%) |
| 6 to 11 Years | 560 (96.9%) | 451 (98.5%) |
| 12 to 14 Years | 363 (100.0%) | 279 (97.6%) |
| 15 Years | 133 (100.0%) | 60 (100.0%) |
| 16 and 17 Years | 197 (100.0%) | 191 (100.0%) |
| 18 to 24 Years | 145 (100.0%) | 221 (93.2%) |
| 25 to 34 Years | 507 (100.0%) | 665 (98.7%) |
| 35 to 44 Years | 1,097 (98.7%) | 801 (98.9%) |
| 45 to 54 Years | 767 (93.2%) | 681 (91.7%) |
| 55 to 64 Years | 642 (92.2%) | 682 (100.0%) |
| 65 to 74 Years | 330 (100.0%) | 429 (96.8%) |
| 75 Years and over | 124 (100.0%) | 347 (94.8%) |
| Total | 5,413 (97.4%) | 5,179 (97.2%) |
Income Below Poverty Among Married-Couple Families in Brandon
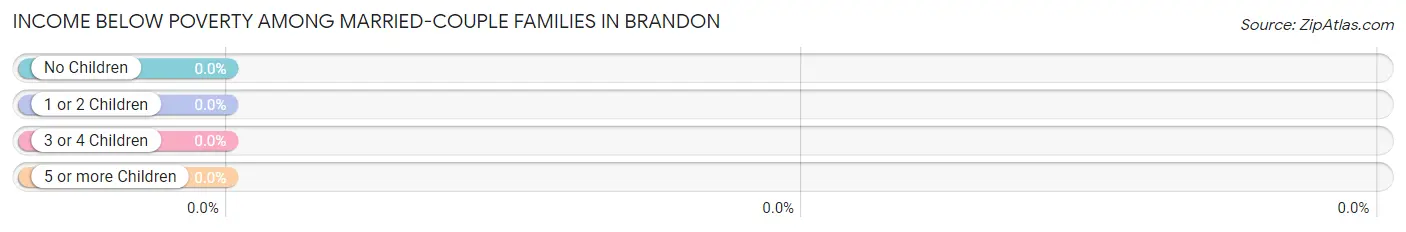
| Children | Above Poverty | Below Poverty |
| No Children | 1,252 (100.0%) | 0 (0.0%) |
| 1 or 2 Children | 826 (100.0%) | 0 (0.0%) |
| 3 or 4 Children | 407 (100.0%) | 0 (0.0%) |
| 5 or more Children | 20 (100.0%) | 0 (0.0%) |
| Total | 2,505 (100.0%) | 0 (0.0%) |
Income Below Poverty Among Single-Parent Households in Brandon
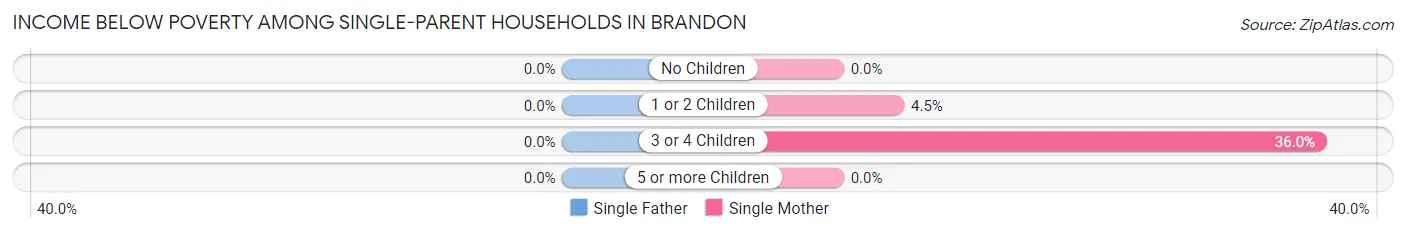
| Children | Single Father | Single Mother |
| No Children | 0 (0.0%) | 0 (0.0%) |
| 1 or 2 Children | 0 (0.0%) | 9 (4.5%) |
| 3 or 4 Children | 0 (0.0%) | 9 (36.0%) |
| 5 or more Children | 0 (0.0%) | 0 (0.0%) |
| Total | 0 (0.0%) | 18 (6.6%) |
Income Below Poverty Among Married-Couple vs Single-Parent Households in Brandon
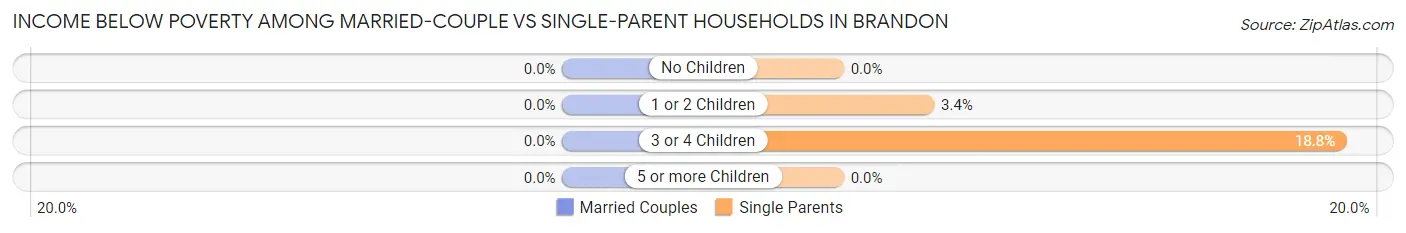
| Children | Married-Couple Families | Single-Parent Households |
| No Children | 0 (0.0%) | 0 (0.0%) |
| 1 or 2 Children | 0 (0.0%) | 9 (3.4%) |
| 3 or 4 Children | 0 (0.0%) | 9 (18.8%) |
| 5 or more Children | 0 (0.0%) | 0 (0.0%) |
| Total | 0 (0.0%) | 18 (4.8%) |
Race in Brandon
The most populous races in Brandon are White / Caucasian (10,214 | 93.5%), Hispanic or Latino (369 | 3.4%), and Black / African American (327 | 3.0%).
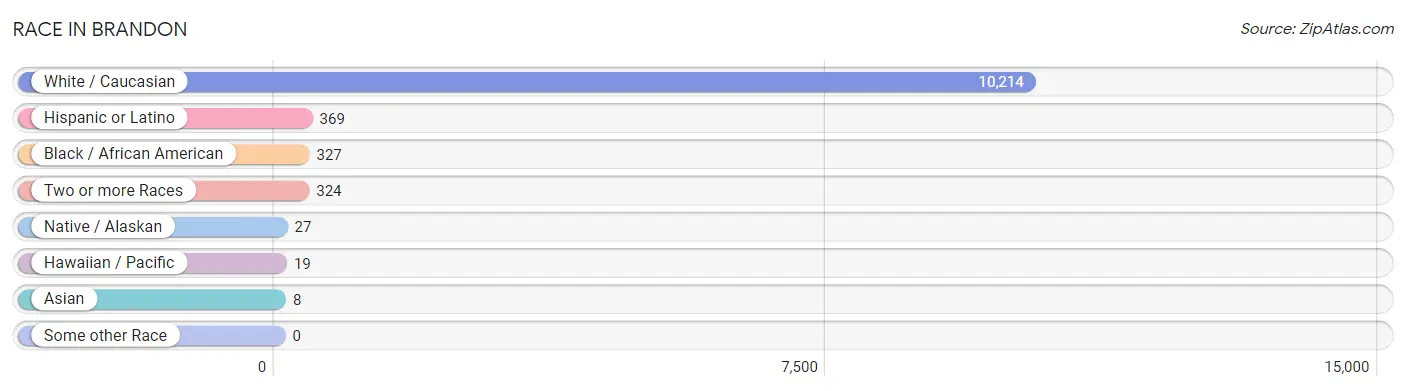
| Race | # Population | % Population |
| Asian | 8 | 0.1% |
| Black / African American | 327 | 3.0% |
| Hawaiian / Pacific | 19 | 0.2% |
| Hispanic or Latino | 369 | 3.4% |
| Native / Alaskan | 27 | 0.3% |
| White / Caucasian | 10,214 | 93.5% |
| Two or more Races | 324 | 3.0% |
| Some other Race | 0 | 0.0% |
| Total | 10,919 | 100.0% |
Ancestry in Brandon
The most populous ancestries reported in Brandon are German (4,489 | 41.1%), Norwegian (1,475 | 13.5%), Irish (1,171 | 10.7%), American (856 | 7.8%), and English (749 | 6.9%), together accounting for 80.0% of all Brandon residents.
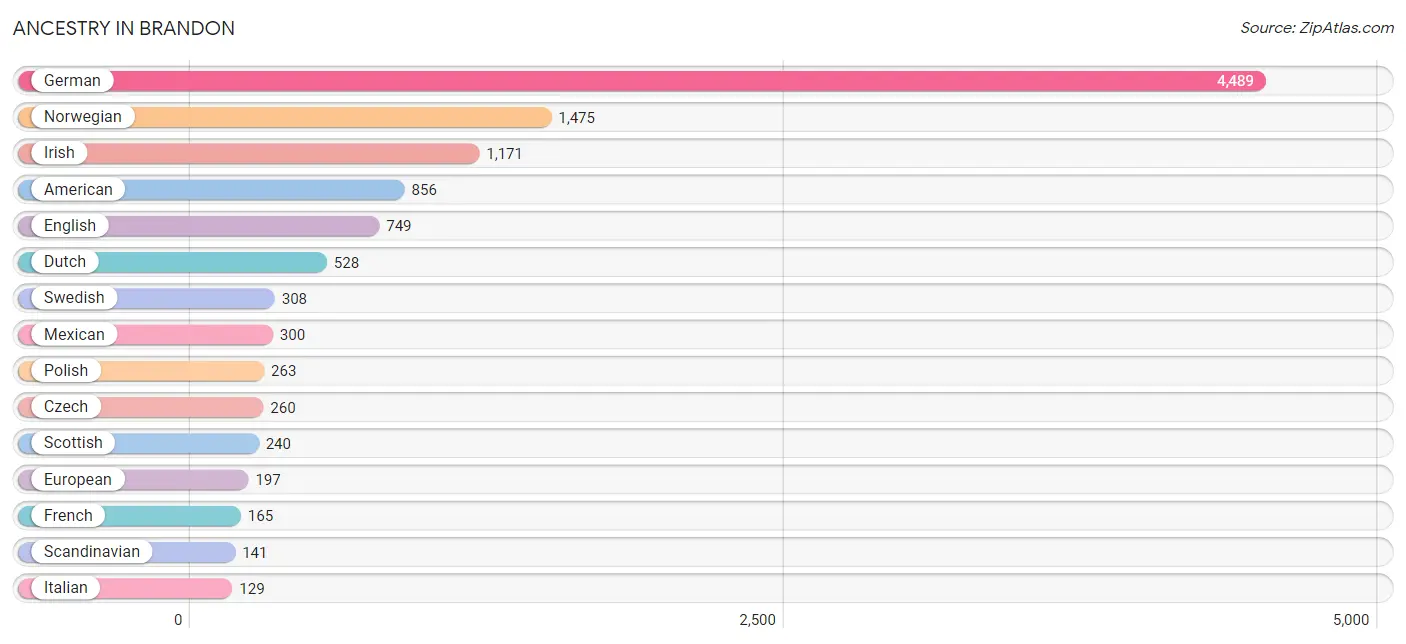
| Ancestry | # Population | % Population |
| American | 856 | 7.8% |
| Arab | 14 | 0.1% |
| Belgian | 19 | 0.2% |
| British | 69 | 0.6% |
| Central American | 39 | 0.4% |
| Croatian | 18 | 0.2% |
| Czech | 260 | 2.4% |
| Czechoslovakian | 9 | 0.1% |
| Danish | 125 | 1.1% |
| Dutch | 528 | 4.8% |
| English | 749 | 6.9% |
| Ethiopian | 40 | 0.4% |
| European | 197 | 1.8% |
| Finnish | 41 | 0.4% |
| French | 165 | 1.5% |
| French Canadian | 17 | 0.2% |
| German | 4,489 | 41.1% |
| Greek | 35 | 0.3% |
| Guatemalan | 39 | 0.4% |
| Hungarian | 9 | 0.1% |
| Irish | 1,171 | 10.7% |
| Italian | 129 | 1.2% |
| Korean | 19 | 0.2% |
| Lebanese | 14 | 0.1% |
| Luxembourger | 10 | 0.1% |
| Malaysian | 29 | 0.3% |
| Mexican | 300 | 2.8% |
| Native Hawaiian | 19 | 0.2% |
| Norwegian | 1,475 | 13.5% |
| Polish | 263 | 2.4% |
| Portuguese | 17 | 0.2% |
| Puerto Rican | 30 | 0.3% |
| Russian | 82 | 0.7% |
| Scandinavian | 141 | 1.3% |
| Scottish | 240 | 2.2% |
| Sioux | 31 | 0.3% |
| Subsaharan African | 112 | 1.0% |
| Swedish | 308 | 2.8% |
| Swiss | 44 | 0.4% |
| West Indian | 61 | 0.6% | View All 40 Rows |
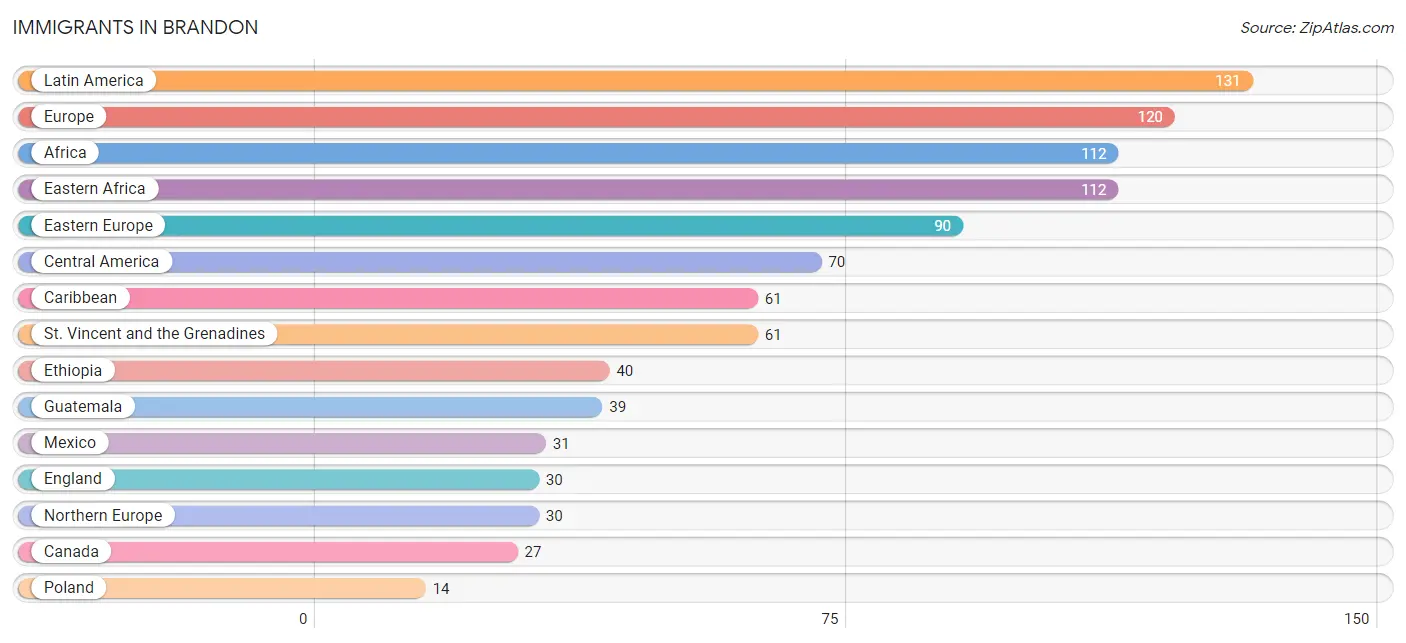
Immigrants in Brandon
The most numerous immigrant groups reported in Brandon came from Latin America (131 | 1.2%), Europe (120 | 1.1%), Africa (112 | 1.0%), Eastern Africa (112 | 1.0%), and Eastern Europe (90 | 0.8%), together accounting for 5.2% of all Brandon residents.
| Immigration Origin | # Population | % Population |
| Africa | 112 | 1.0% |
| Canada | 27 | 0.3% |
| Caribbean | 61 | 0.6% |
| Central America | 70 | 0.6% |
| Eastern Africa | 112 | 1.0% |
| Eastern Europe | 90 | 0.8% |
| England | 30 | 0.3% |
| Ethiopia | 40 | 0.4% |
| Europe | 120 | 1.1% |
| Guatemala | 39 | 0.4% |
| Latin America | 131 | 1.2% |
| Mexico | 31 | 0.3% |
| Northern Europe | 30 | 0.3% |
| Poland | 14 | 0.1% |
| St. Vincent and the Grenadines | 61 | 0.6% | View All 15 Rows |
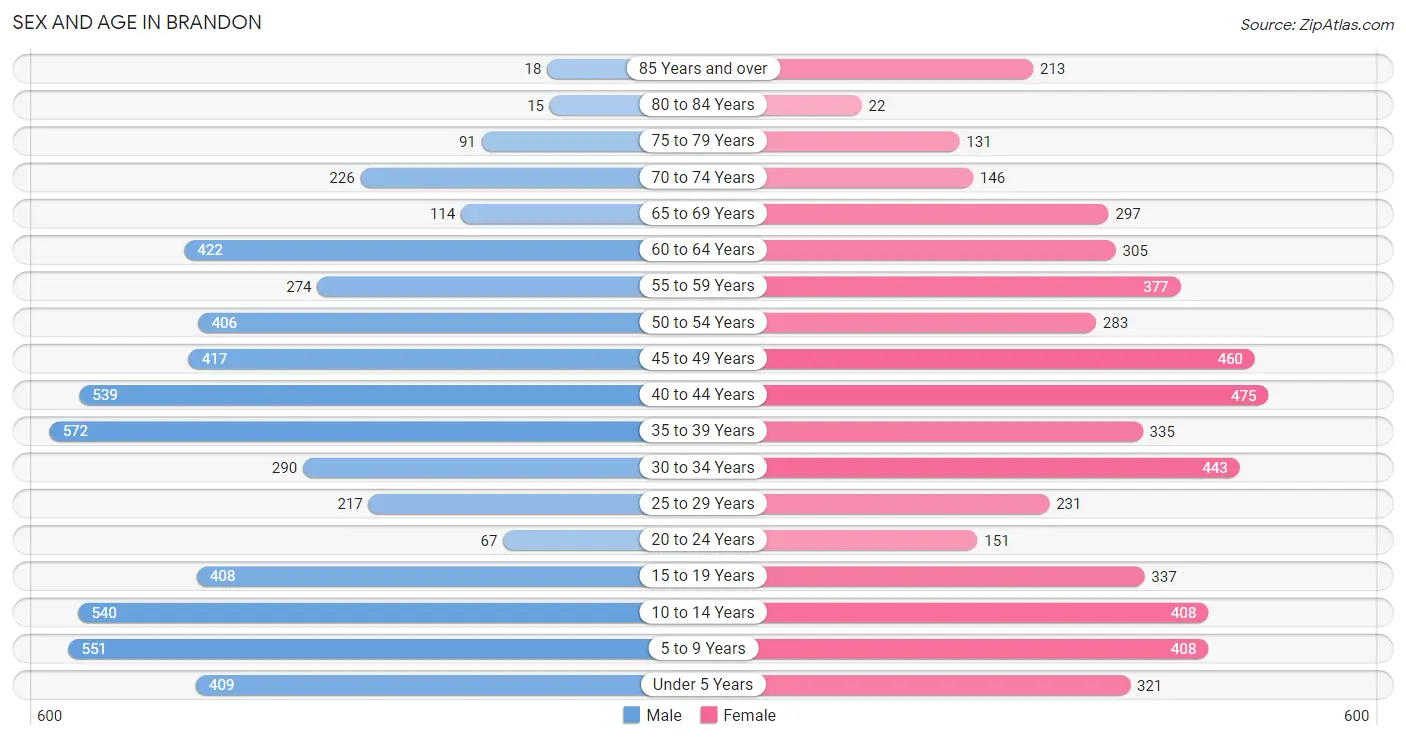
Sex and Age in Brandon
Sex and Age in Brandon
The most populous age groups in Brandon are 35 to 39 Years (572 | 10.3%) for men and 40 to 44 Years (475 | 8.9%) for women.
| Age Bracket | Male | Female |
| Under 5 Years | 409 (7.3%) | 321 (6.0%) |
| 5 to 9 Years | 551 (9.9%) | 408 (7.6%) |
| 10 to 14 Years | 540 (9.7%) | 408 (7.6%) |
| 15 to 19 Years | 408 (7.3%) | 337 (6.3%) |
| 20 to 24 Years | 67 (1.2%) | 151 (2.8%) |
| 25 to 29 Years | 217 (3.9%) | 231 (4.3%) |
| 30 to 34 Years | 290 (5.2%) | 443 (8.3%) |
| 35 to 39 Years | 572 (10.3%) | 335 (6.3%) |
| 40 to 44 Years | 539 (9.7%) | 475 (8.9%) |
| 45 to 49 Years | 417 (7.5%) | 460 (8.6%) |
| 50 to 54 Years | 406 (7.3%) | 283 (5.3%) |
| 55 to 59 Years | 274 (4.9%) | 377 (7.1%) |
| 60 to 64 Years | 422 (7.6%) | 305 (5.7%) |
| 65 to 69 Years | 114 (2.0%) | 297 (5.6%) |
| 70 to 74 Years | 226 (4.1%) | 146 (2.7%) |
| 75 to 79 Years | 91 (1.6%) | 131 (2.5%) |
| 80 to 84 Years | 15 (0.3%) | 22 (0.4%) |
| 85 Years and over | 18 (0.3%) | 213 (4.0%) |
| Total | 5,576 (100.0%) | 5,343 (100.0%) |
Families and Households in Brandon
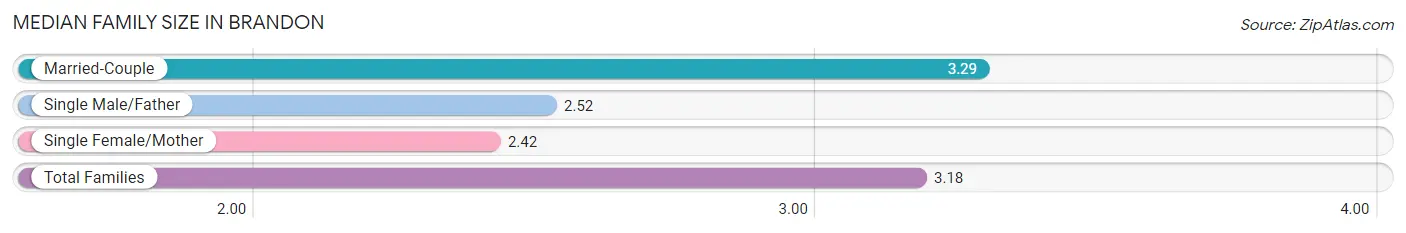
Median Family Size in Brandon
The median family size in Brandon is 3.18 persons per family, with married-couple families (2,505 | 87.0%) accounting for the largest median family size of 3.29 persons per family. On the other hand, single female/mother families (272 | 9.5%) represent the smallest median family size with 2.42 persons per family.
| Family Type | # Families | Family Size |
| Married-Couple | 2,505 (87.0%) | 3.29 |
| Single Male/Father | 102 (3.5%) | 2.52 |
| Single Female/Mother | 272 (9.5%) | 2.42 |
| Total Families | 2,879 (100.0%) | 3.18 |
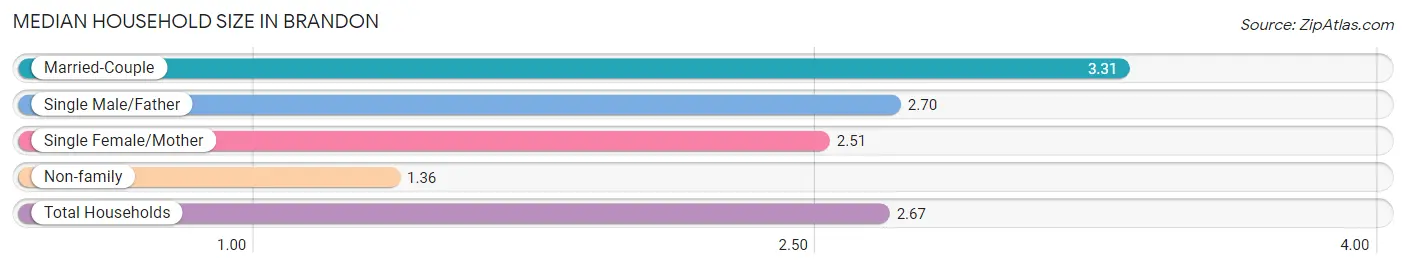
Median Household Size in Brandon
The median household size in Brandon is 2.67 persons per household, with married-couple households (2,505 | 61.4%) accounting for the largest median household size of 3.31 persons per household. non-family households (1,203 | 29.5%) represent the smallest median household size with 1.36 persons per household.
| Household Type | # Households | Household Size |
| Married-Couple | 2,505 (61.4%) | 3.31 |
| Single Male/Father | 102 (2.5%) | 2.70 |
| Single Female/Mother | 272 (6.7%) | 2.51 |
| Non-family | 1,203 (29.5%) | 1.36 |
| Total Households | 4,082 (100.0%) | 2.67 |
Household Size by Marriage Status in Brandon
Out of a total of 4,082 households in Brandon, 2,879 (70.5%) are family households, while 1,203 (29.5%) are nonfamily households. The most numerous type of family households are 2-person households, comprising 1,227, and the most common type of nonfamily households are 1-person households, comprising 884.
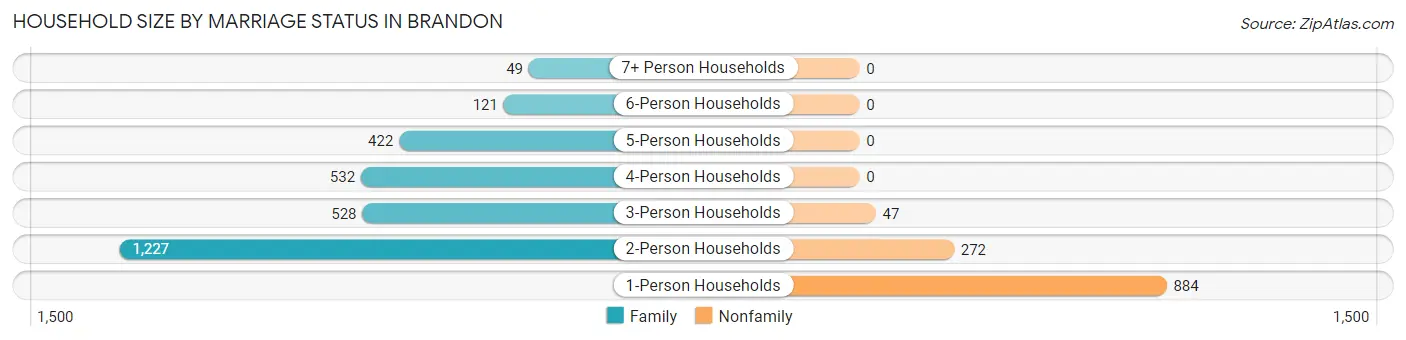
| Household Size | Family Households | Nonfamily Households |
| 1-Person Households | - | 884 (21.7%) |
| 2-Person Households | 1,227 (30.1%) | 272 (6.7%) |
| 3-Person Households | 528 (12.9%) | 47 (1.1%) |
| 4-Person Households | 532 (13.0%) | 0 (0.0%) |
| 5-Person Households | 422 (10.3%) | 0 (0.0%) |
| 6-Person Households | 121 (3.0%) | 0 (0.0%) |
| 7+ Person Households | 49 (1.2%) | 0 (0.0%) |
| Total | 2,879 (70.5%) | 1,203 (29.5%) |
Female Fertility in Brandon
Fertility by Age in Brandon
Average fertility rate in Brandon is 25.0 births per 1,000 women. Women in the age bracket of 20 to 34 years have the highest fertility rate with 65.0 births per 1,000 women. Women in the age bracket of 20 to 34 years acount for 84.4% of all women with births.
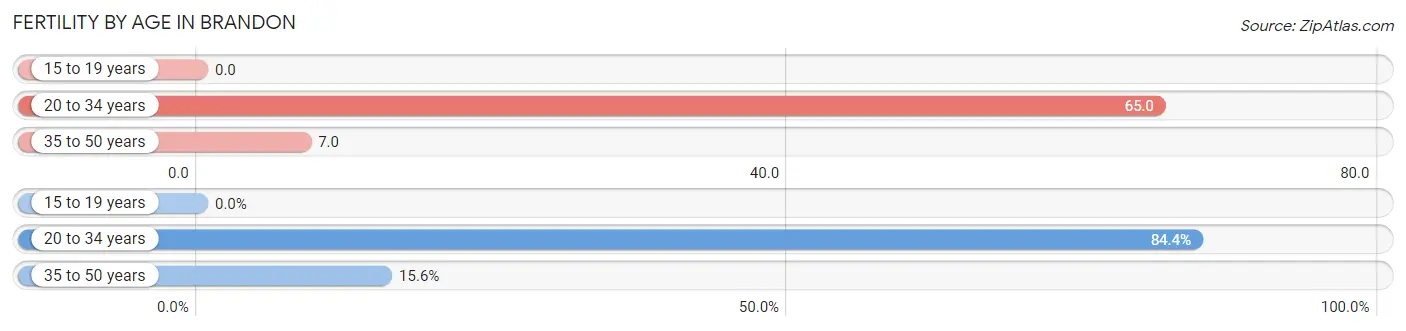
| Age Bracket | Women with Births | Births / 1,000 Women |
| 15 to 19 years | 0 (0.0%) | 0.0 |
| 20 to 34 years | 54 (84.4%) | 65.0 |
| 35 to 50 years | 10 (15.6%) | 7.0 |
| Total | 64 (100.0%) | 25.0 |
Fertility by Age by Marriage Status in Brandon
84.4% of women with births (64) in Brandon are married. The highest percentage of unmarried women with births falls into 20 to 34 years age bracket with 18.5% of them unmarried at the time of birth, while the lowest percentage of unmarried women with births belong to 35 to 50 years age bracket with 0.0% of them unmarried.
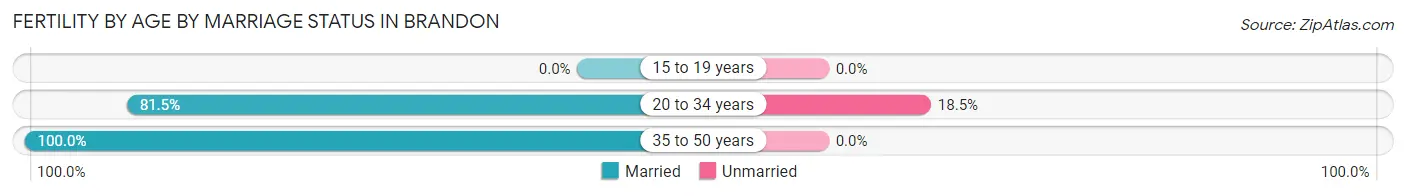
| Age Bracket | Married | Unmarried |
| 15 to 19 years | 0 (0.0%) | 0 (0.0%) |
| 20 to 34 years | 44 (81.5%) | 10 (18.5%) |
| 35 to 50 years | 10 (100.0%) | 0 (0.0%) |
| Total | 54 (84.4%) | 10 (15.6%) |
Fertility by Education in Brandon
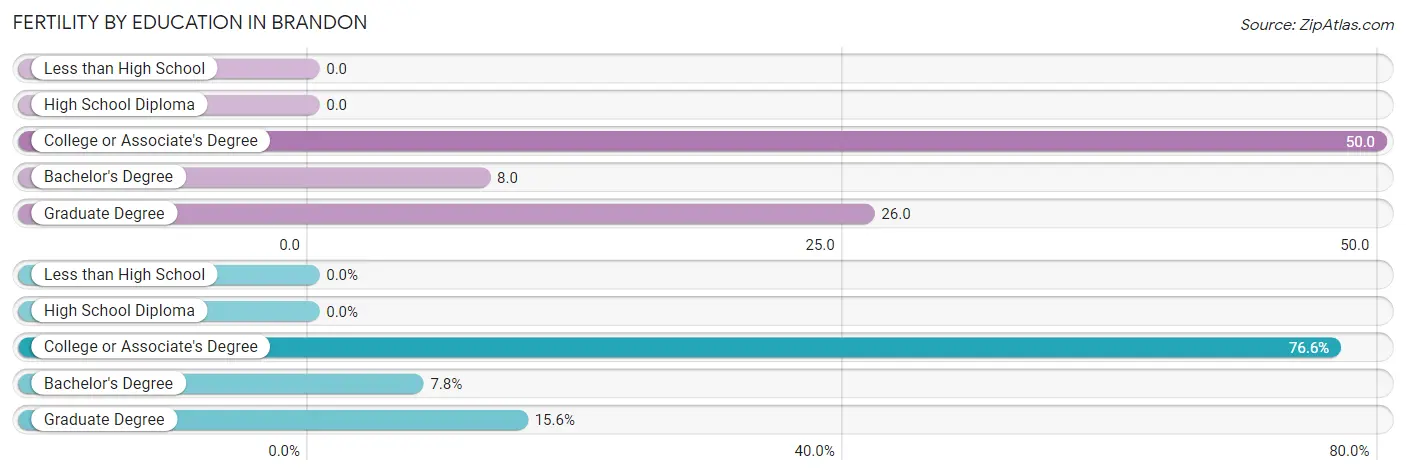
| Educational Attainment | Women with Births | Births / 1,000 Women |
| Less than High School | 0 (0.0%) | 0.0 |
| High School Diploma | 0 (0.0%) | 0.0 |
| College or Associate's Degree | 49 (76.6%) | 50.0 |
| Bachelor's Degree | 5 (7.8%) | 8.0 |
| Graduate Degree | 10 (15.6%) | 26.0 |
| Total | 64 (100.0%) | 25.0 |
Fertility by Education by Marriage Status in Brandon
15.6% of women with births in Brandon are unmarried. Women with the educational attainment of bachelor's degree are most likely to be married with 100.0% of them married at childbirth, while women with the educational attainment of college or associate's degree are least likely to be married with 20.4% of them unmarried at childbirth.
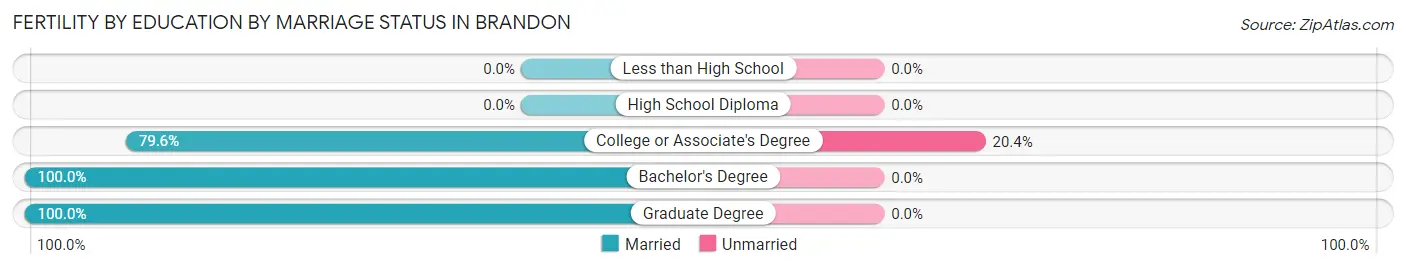
| Educational Attainment | Married | Unmarried |
| Less than High School | 0 (0.0%) | 0 (0.0%) |
| High School Diploma | 0 (0.0%) | 0 (0.0%) |
| College or Associate's Degree | 39 (79.6%) | 10 (20.4%) |
| Bachelor's Degree | 5 (100.0%) | 0 (0.0%) |
| Graduate Degree | 10 (100.0%) | 0 (0.0%) |
| Total | 54 (84.4%) | 10 (15.6%) |
Employment Characteristics in Brandon
Employment by Class of Employer in Brandon
Among the 6,231 employed individuals in Brandon, private company employees (4,146 | 66.5%), not-for-profit organizations (717 | 11.5%), and self-employed (not incorporated) (450 | 7.2%) make up the most common classes of employment.
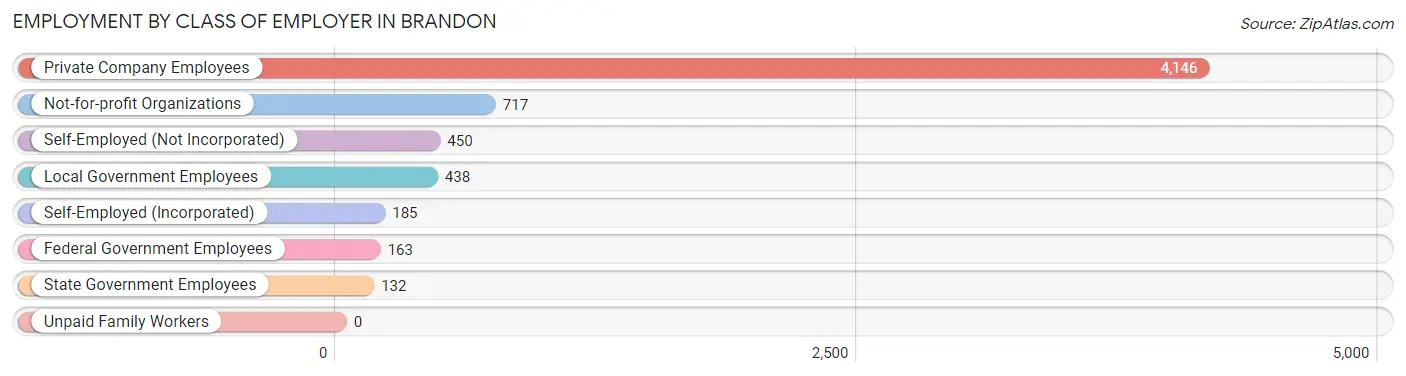
| Employer Class | # Employees | % Employees |
| Private Company Employees | 4,146 | 66.5% |
| Self-Employed (Incorporated) | 185 | 3.0% |
| Self-Employed (Not Incorporated) | 450 | 7.2% |
| Not-for-profit Organizations | 717 | 11.5% |
| Local Government Employees | 438 | 7.0% |
| State Government Employees | 132 | 2.1% |
| Federal Government Employees | 163 | 2.6% |
| Unpaid Family Workers | 0 | 0.0% |
| Total | 6,231 | 100.0% |
Employment Status by Age in Brandon
According to the labor force statistics for Brandon, out of the total population over 16 years of age (8,089), 79.3% or 6,415 individuals are in the labor force, with 1.2% or 77 of them unemployed. The age group with the highest labor force participation rate is 25 to 29 years, with 98.4% or 441 individuals in the labor force. Within the labor force, the 20 to 24 years age range has the highest percentage of unemployed individuals, with 5.1% or 10 of them being unemployed.
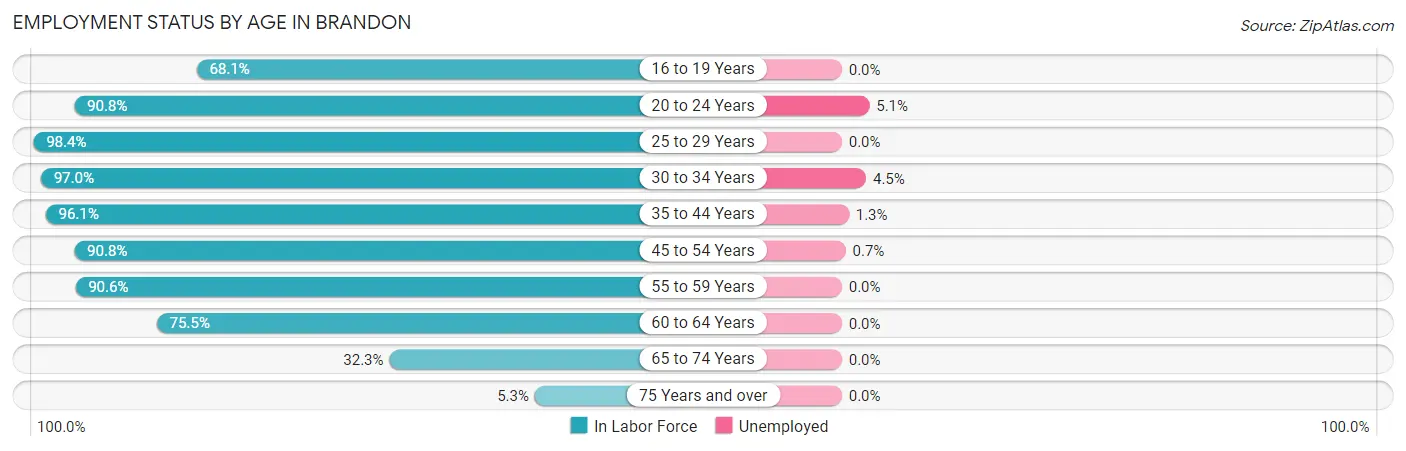
| Age Bracket | In Labor Force | Unemployed |
| 16 to 19 Years | 376 (68.1%) | 0 (0.0%) |
| 20 to 24 Years | 198 (90.8%) | 10 (5.1%) |
| 25 to 29 Years | 441 (98.4%) | 0 (0.0%) |
| 30 to 34 Years | 711 (97.0%) | 32 (4.5%) |
| 35 to 44 Years | 1,846 (96.1%) | 24 (1.3%) |
| 45 to 54 Years | 1,422 (90.8%) | 10 (0.7%) |
| 55 to 59 Years | 590 (90.6%) | 0 (0.0%) |
| 60 to 64 Years | 549 (75.5%) | 0 (0.0%) |
| 65 to 74 Years | 253 (32.3%) | 0 (0.0%) |
| 75 Years and over | 26 (5.3%) | 0 (0.0%) |
| Total | 6,415 (79.3%) | 77 (1.2%) |
Employment Status by Educational Attainment in Brandon
According to labor force statistics for Brandon, 91.9% of individuals (5,556) out of the total population between 25 and 64 years of age (6,046) are in the labor force, with 1.2% or 67 of them being unemployed. The group with the highest labor force participation rate are those with the educational attainment of college / associate degree, with 92.5% or 2,156 individuals in the labor force. Within the labor force, individuals with college / associate degree education have the highest percentage of unemployment, with 1.5% or 32 of them being unemployed.
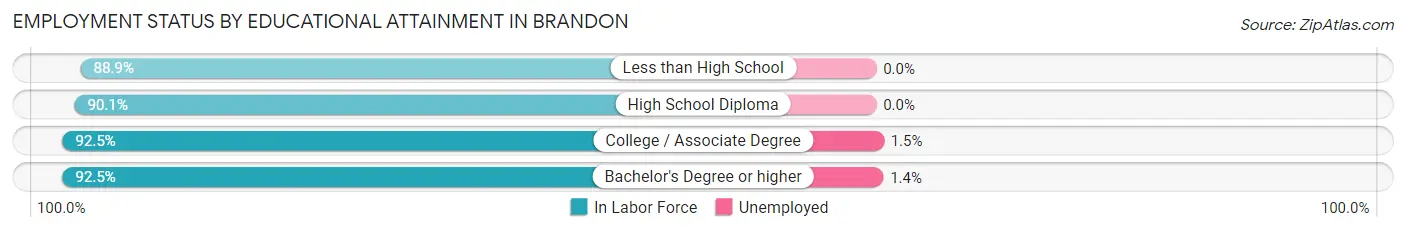
| Educational Attainment | In Labor Force | Unemployed |
| Less than High School | 112 (88.9%) | 0 (0.0%) |
| High School Diploma | 1,069 (90.1%) | 0 (0.0%) |
| College / Associate Degree | 2,156 (92.5%) | 35 (1.5%) |
| Bachelor's Degree or higher | 2,223 (92.5%) | 34 (1.4%) |
| Total | 5,556 (91.9%) | 73 (1.2%) |
Employment Occupations by Sex in Brandon
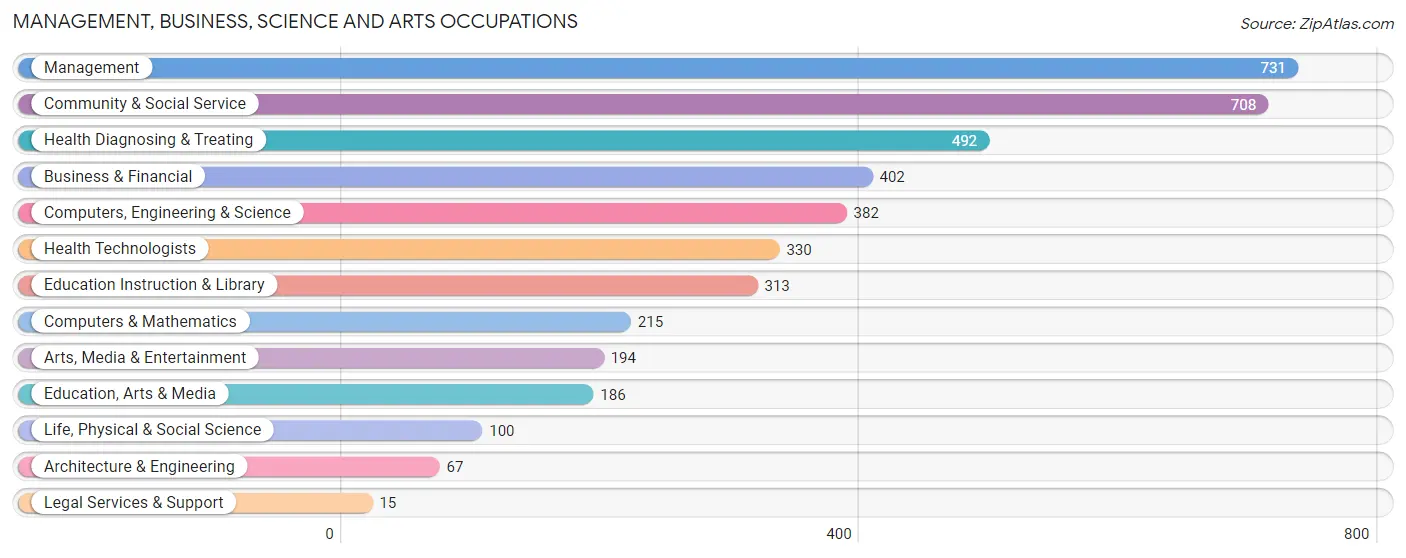
Management, Business, Science and Arts Occupations
The most common Management, Business, Science and Arts occupations in Brandon are Management (731 | 11.6%), Community & Social Service (708 | 11.2%), Health Diagnosing & Treating (492 | 7.8%), Business & Financial (402 | 6.4%), and Computers, Engineering & Science (382 | 6.0%).
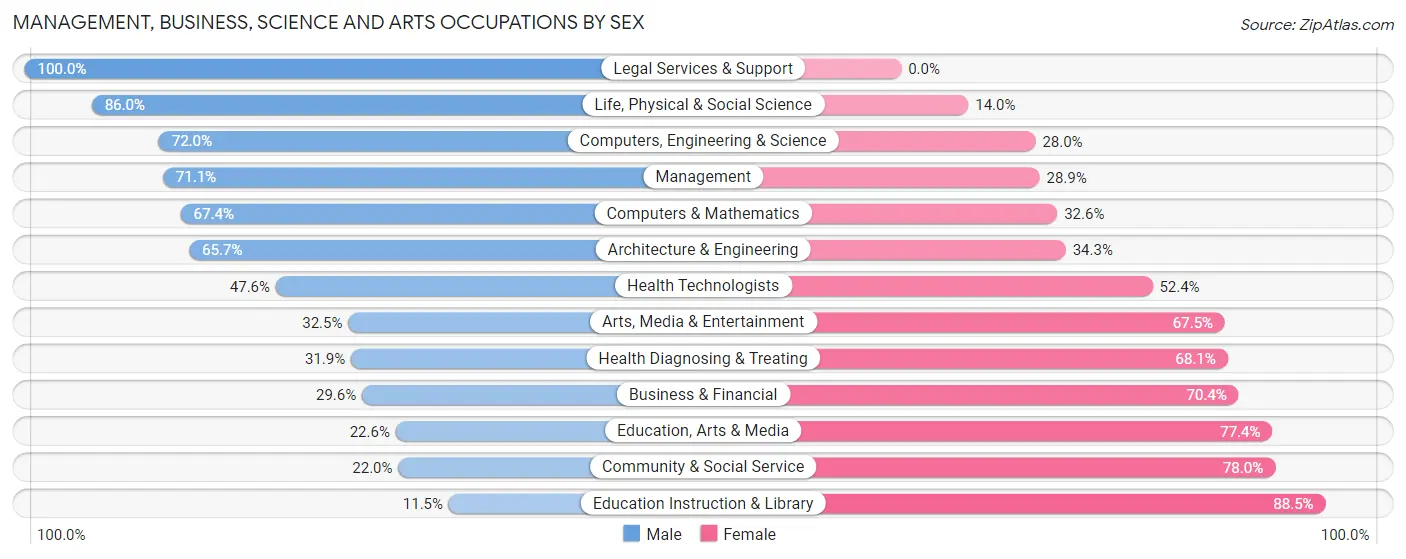
Management, Business, Science and Arts Occupations by Sex
Within the Management, Business, Science and Arts occupations in Brandon, the most male-oriented occupations are Legal Services & Support (100.0%), Life, Physical & Social Science (86.0%), and Computers, Engineering & Science (72.0%), while the most female-oriented occupations are Education Instruction & Library (88.5%), Community & Social Service (78.0%), and Education, Arts & Media (77.4%).
| Occupation | Male | Female |
| Management | 520 (71.1%) | 211 (28.9%) |
| Business & Financial | 119 (29.6%) | 283 (70.4%) |
| Computers, Engineering & Science | 275 (72.0%) | 107 (28.0%) |
| Computers & Mathematics | 145 (67.4%) | 70 (32.6%) |
| Architecture & Engineering | 44 (65.7%) | 23 (34.3%) |
| Life, Physical & Social Science | 86 (86.0%) | 14 (14.0%) |
| Community & Social Service | 156 (22.0%) | 552 (78.0%) |
| Education, Arts & Media | 42 (22.6%) | 144 (77.4%) |
| Legal Services & Support | 15 (100.0%) | 0 (0.0%) |
| Education Instruction & Library | 36 (11.5%) | 277 (88.5%) |
| Arts, Media & Entertainment | 63 (32.5%) | 131 (67.5%) |
| Health Diagnosing & Treating | 157 (31.9%) | 335 (68.1%) |
| Health Technologists | 157 (47.6%) | 173 (52.4%) |
| Total (Category) | 1,227 (45.2%) | 1,488 (54.8%) |
| Total (Overall) | 3,216 (50.9%) | 3,100 (49.1%) |
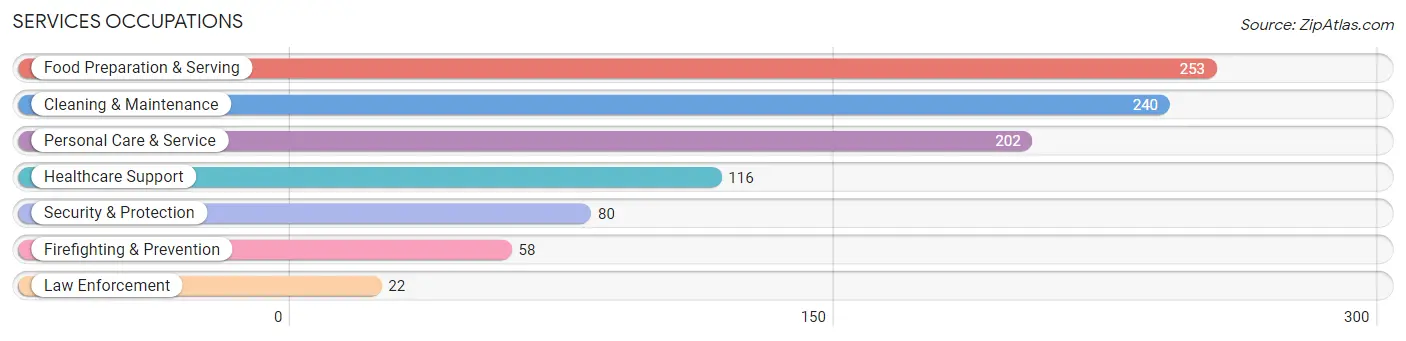
Services Occupations
The most common Services occupations in Brandon are Food Preparation & Serving (253 | 4.0%), Cleaning & Maintenance (240 | 3.8%), Personal Care & Service (202 | 3.2%), Healthcare Support (116 | 1.8%), and Security & Protection (80 | 1.3%).
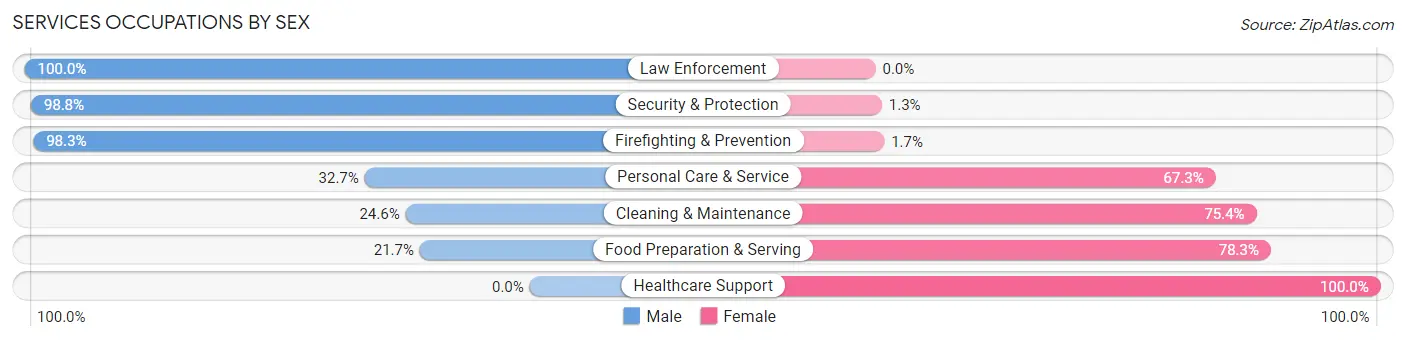
Services Occupations by Sex
Within the Services occupations in Brandon, the most male-oriented occupations are Law Enforcement (100.0%), Security & Protection (98.8%), and Firefighting & Prevention (98.3%), while the most female-oriented occupations are Healthcare Support (100.0%), Food Preparation & Serving (78.3%), and Cleaning & Maintenance (75.4%).
| Occupation | Male | Female |
| Healthcare Support | 0 (0.0%) | 116 (100.0%) |
| Security & Protection | 79 (98.8%) | 1 (1.3%) |
| Firefighting & Prevention | 57 (98.3%) | 1 (1.7%) |
| Law Enforcement | 22 (100.0%) | 0 (0.0%) |
| Food Preparation & Serving | 55 (21.7%) | 198 (78.3%) |
| Cleaning & Maintenance | 59 (24.6%) | 181 (75.4%) |
| Personal Care & Service | 66 (32.7%) | 136 (67.3%) |
| Total (Category) | 259 (29.1%) | 632 (70.9%) |
| Total (Overall) | 3,216 (50.9%) | 3,100 (49.1%) |
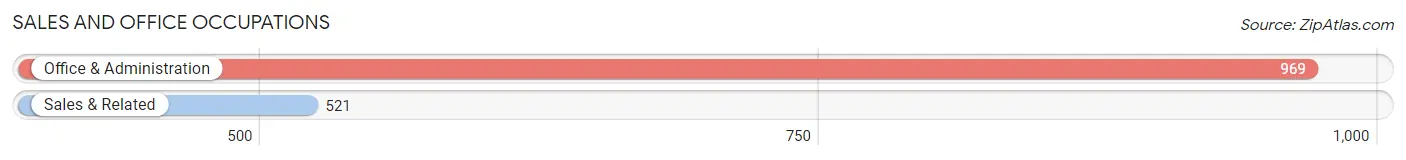
Sales and Office Occupations
The most common Sales and Office occupations in Brandon are Office & Administration (969 | 15.3%), and Sales & Related (521 | 8.3%).
Sales and Office Occupations by Sex
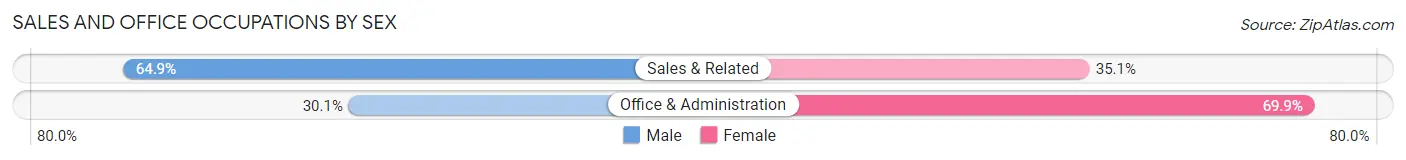
| Occupation | Male | Female |
| Sales & Related | 338 (64.9%) | 183 (35.1%) |
| Office & Administration | 292 (30.1%) | 677 (69.9%) |
| Total (Category) | 630 (42.3%) | 860 (57.7%) |
| Total (Overall) | 3,216 (50.9%) | 3,100 (49.1%) |
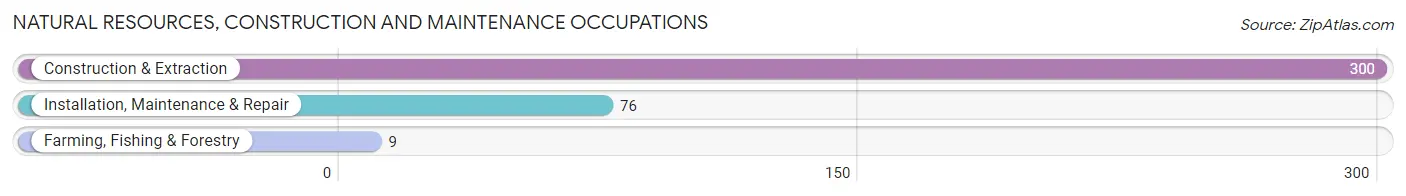
Natural Resources, Construction and Maintenance Occupations
The most common Natural Resources, Construction and Maintenance occupations in Brandon are Construction & Extraction (300 | 4.8%), Installation, Maintenance & Repair (76 | 1.2%), and Farming, Fishing & Forestry (9 | 0.1%).
Natural Resources, Construction and Maintenance Occupations by Sex
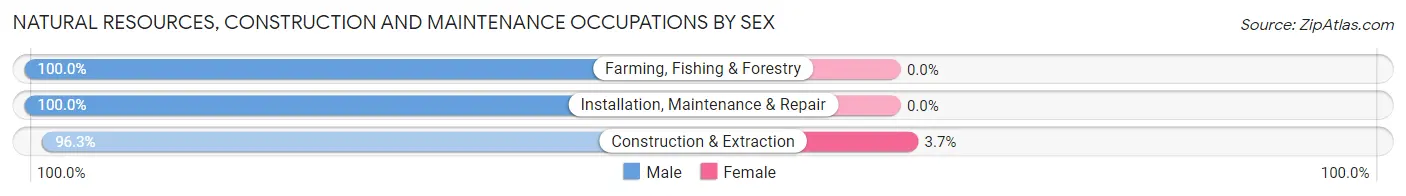
| Occupation | Male | Female |
| Farming, Fishing & Forestry | 9 (100.0%) | 0 (0.0%) |
| Construction & Extraction | 289 (96.3%) | 11 (3.7%) |
| Installation, Maintenance & Repair | 76 (100.0%) | 0 (0.0%) |
| Total (Category) | 374 (97.1%) | 11 (2.9%) |
| Total (Overall) | 3,216 (50.9%) | 3,100 (49.1%) |
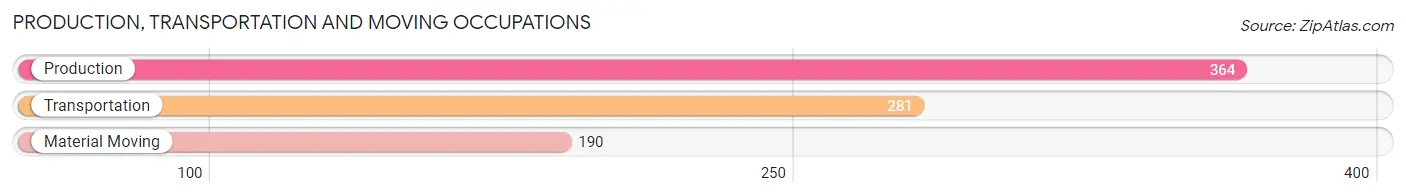
Production, Transportation and Moving Occupations
The most common Production, Transportation and Moving occupations in Brandon are Production (364 | 5.8%), Transportation (281 | 4.4%), and Material Moving (190 | 3.0%).
Production, Transportation and Moving Occupations by Sex
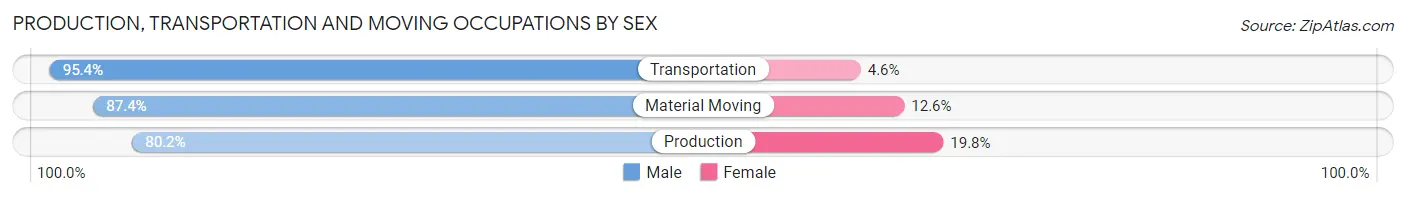
| Occupation | Male | Female |
| Production | 292 (80.2%) | 72 (19.8%) |
| Transportation | 268 (95.4%) | 13 (4.6%) |
| Material Moving | 166 (87.4%) | 24 (12.6%) |
| Total (Category) | 726 (87.0%) | 109 (13.1%) |
| Total (Overall) | 3,216 (50.9%) | 3,100 (49.1%) |
Employment Industries by Sex in Brandon
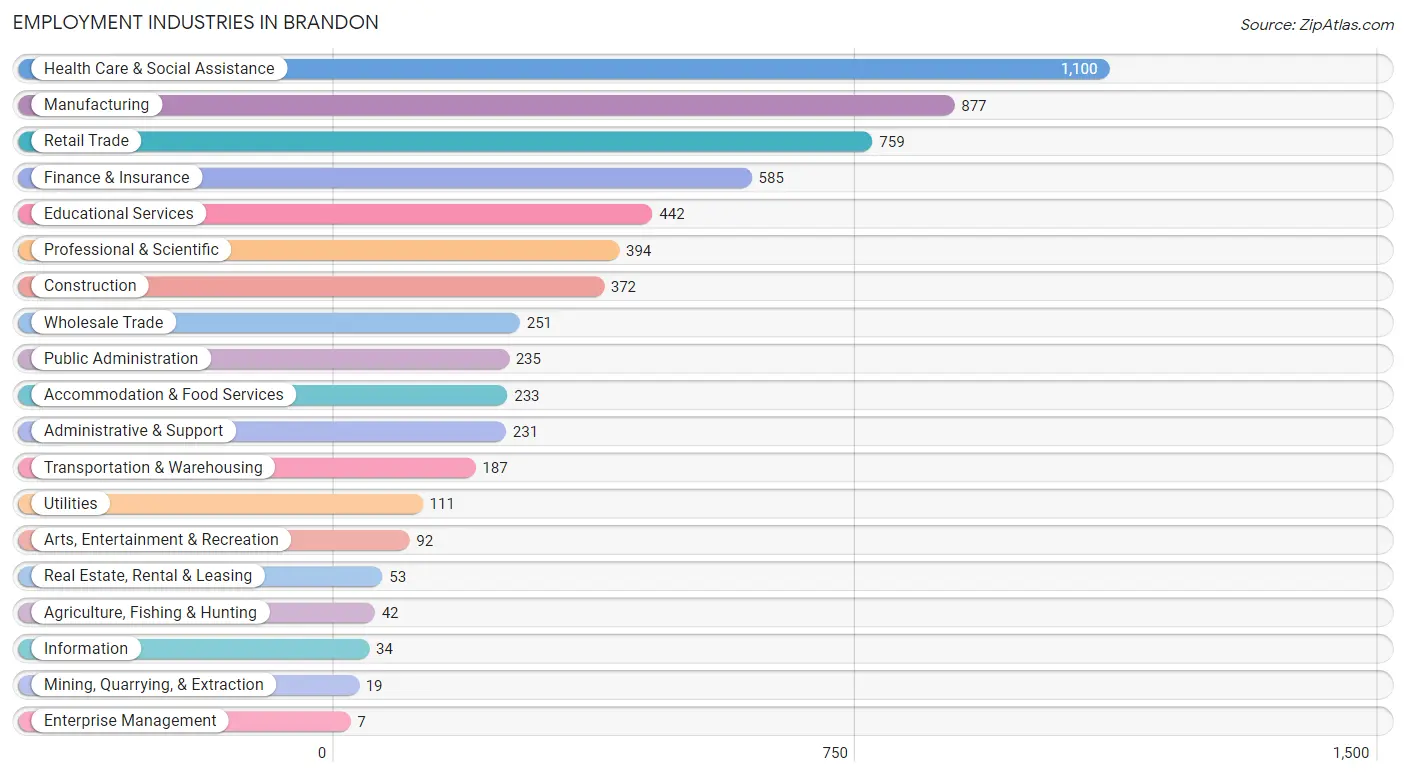
Employment Industries in Brandon
The major employment industries in Brandon include Health Care & Social Assistance (1,100 | 17.4%), Manufacturing (877 | 13.9%), Retail Trade (759 | 12.0%), Finance & Insurance (585 | 9.3%), and Educational Services (442 | 7.0%).
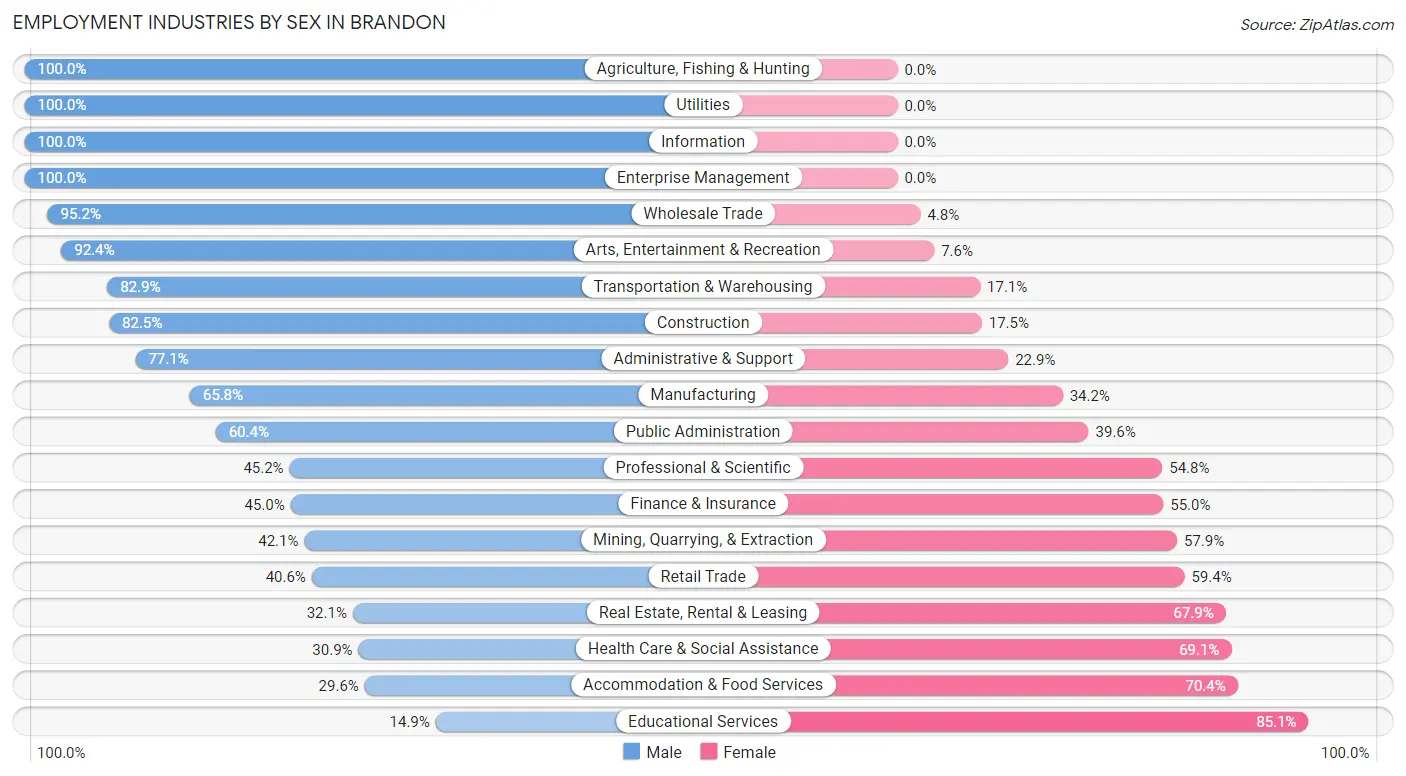
Employment Industries by Sex in Brandon
The Brandon industries that see more men than women are Agriculture, Fishing & Hunting (100.0%), Utilities (100.0%), and Information (100.0%), whereas the industries that tend to have a higher number of women are Educational Services (85.1%), Accommodation & Food Services (70.4%), and Health Care & Social Assistance (69.1%).
| Industry | Male | Female |
| Agriculture, Fishing & Hunting | 42 (100.0%) | 0 (0.0%) |
| Mining, Quarrying, & Extraction | 8 (42.1%) | 11 (57.9%) |
| Construction | 307 (82.5%) | 65 (17.5%) |
| Manufacturing | 577 (65.8%) | 300 (34.2%) |
| Wholesale Trade | 239 (95.2%) | 12 (4.8%) |
| Retail Trade | 308 (40.6%) | 451 (59.4%) |
| Transportation & Warehousing | 155 (82.9%) | 32 (17.1%) |
| Utilities | 111 (100.0%) | 0 (0.0%) |
| Information | 34 (100.0%) | 0 (0.0%) |
| Finance & Insurance | 263 (45.0%) | 322 (55.0%) |
| Real Estate, Rental & Leasing | 17 (32.1%) | 36 (67.9%) |
| Professional & Scientific | 178 (45.2%) | 216 (54.8%) |
| Enterprise Management | 7 (100.0%) | 0 (0.0%) |
| Administrative & Support | 178 (77.1%) | 53 (22.9%) |
| Educational Services | 66 (14.9%) | 376 (85.1%) |
| Health Care & Social Assistance | 340 (30.9%) | 760 (69.1%) |
| Arts, Entertainment & Recreation | 85 (92.4%) | 7 (7.6%) |
| Accommodation & Food Services | 69 (29.6%) | 164 (70.4%) |
| Public Administration | 142 (60.4%) | 93 (39.6%) |
| Total | 3,216 (50.9%) | 3,100 (49.1%) |
Education in Brandon
School Enrollment in Brandon
The most common levels of schooling among the 2,970 students in Brandon are middle school (814 | 27.4%), elementary school (655 | 22.1%), and high school (619 | 20.8%).
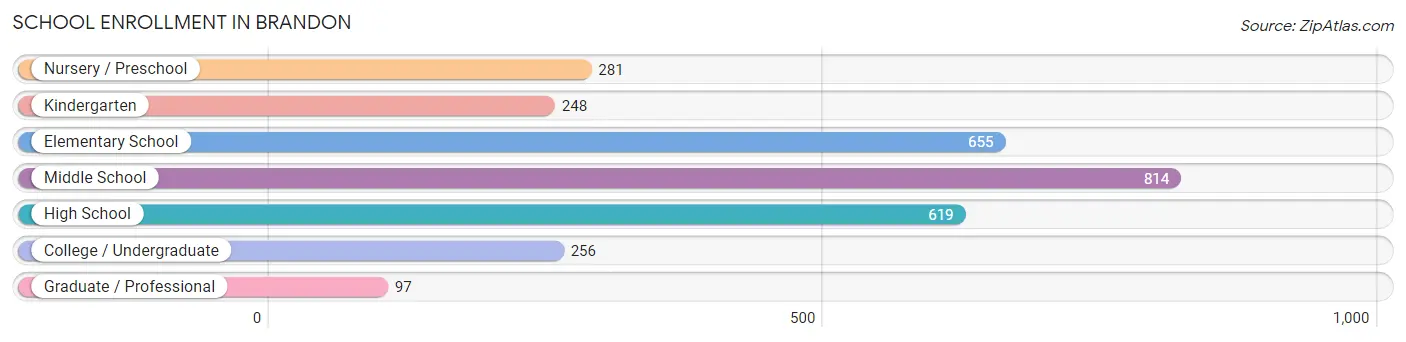
| School Level | # Students | % Students |
| Nursery / Preschool | 281 | 9.5% |
| Kindergarten | 248 | 8.4% |
| Elementary School | 655 | 22.1% |
| Middle School | 814 | 27.4% |
| High School | 619 | 20.8% |
| College / Undergraduate | 256 | 8.6% |
| Graduate / Professional | 97 | 3.3% |
| Total | 2,970 | 100.0% |
School Enrollment by Age by Funding Source in Brandon
Out of a total of 2,970 students who are enrolled in schools in Brandon, 362 (12.2%) attend a private institution, while the remaining 2,608 (87.8%) are enrolled in public schools. The age group of 3 to 4 year olds has the highest likelihood of being enrolled in private schools, with 90 (54.9% in the age bracket) enrolled. Conversely, the age group of 18 to 19 year olds has the lowest likelihood of being enrolled in a private school, with 133 (100.0% in the age bracket) attending a public institution.
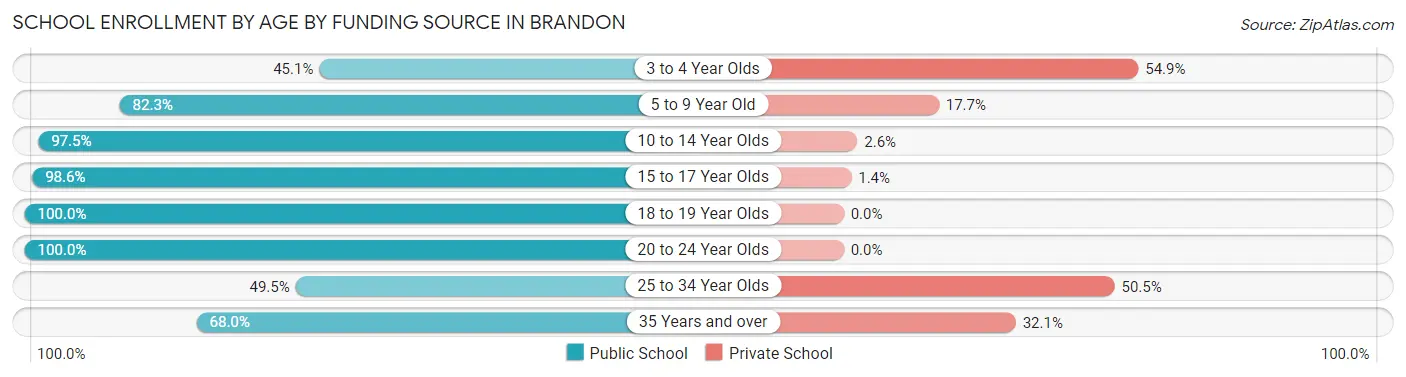
| Age Bracket | Public School | Private School |
| 3 to 4 Year Olds | 74 (45.1%) | 90 (54.9%) |
| 5 to 9 Year Old | 748 (82.3%) | 161 (17.7%) |
| 10 to 14 Year Olds | 918 (97.5%) | 24 (2.5%) |
| 15 to 17 Year Olds | 555 (98.6%) | 8 (1.4%) |
| 18 to 19 Year Olds | 133 (100.0%) | 0 (0.0%) |
| 20 to 24 Year Olds | 72 (100.0%) | 0 (0.0%) |
| 25 to 34 Year Olds | 54 (49.5%) | 55 (50.5%) |
| 35 Years and over | 53 (67.9%) | 25 (32.1%) |
| Total | 2,608 (87.8%) | 362 (12.2%) |
Educational Attainment by Field of Study in Brandon
Business (693 | 24.4%), science & technology (368 | 13.0%), education (357 | 12.6%), social sciences (339 | 11.9%), and arts & humanities (221 | 7.8%) are the most common fields of study among 2,842 individuals in Brandon who have obtained a bachelor's degree or higher.
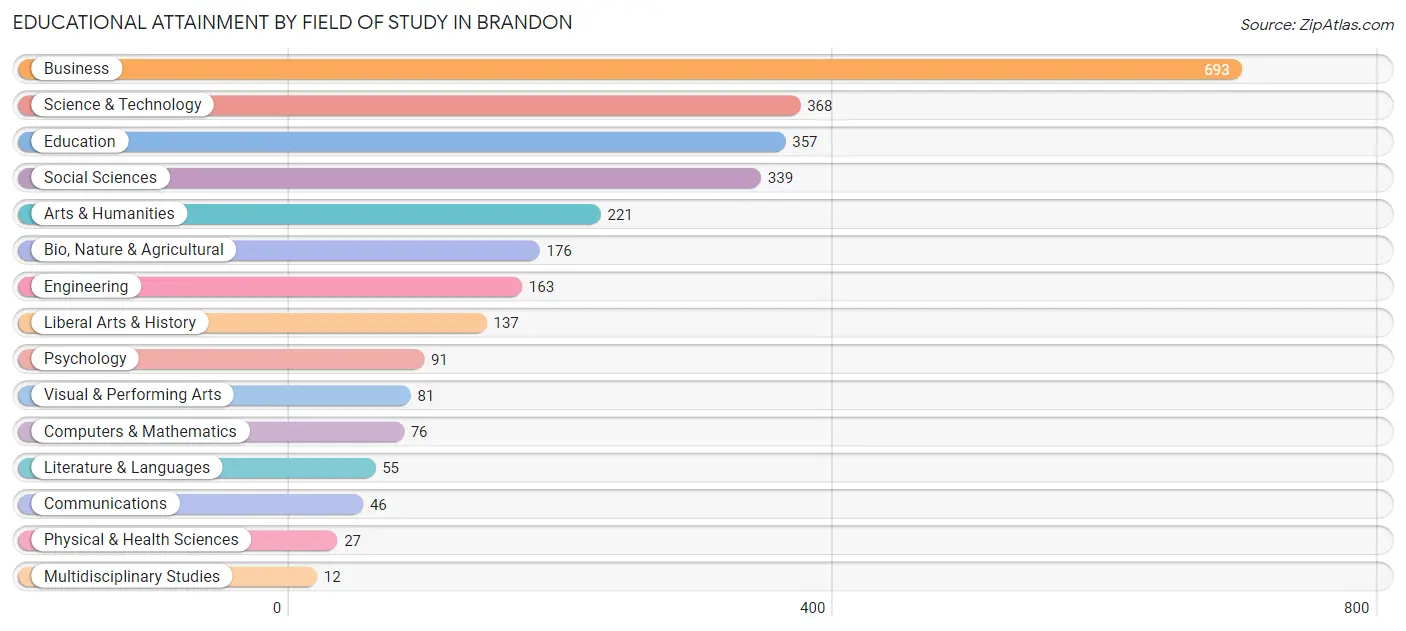
| Field of Study | # Graduates | % Graduates |
| Computers & Mathematics | 76 | 2.7% |
| Bio, Nature & Agricultural | 176 | 6.2% |
| Physical & Health Sciences | 27 | 0.9% |
| Psychology | 91 | 3.2% |
| Social Sciences | 339 | 11.9% |
| Engineering | 163 | 5.7% |
| Multidisciplinary Studies | 12 | 0.4% |
| Science & Technology | 368 | 13.0% |
| Business | 693 | 24.4% |
| Education | 357 | 12.6% |
| Literature & Languages | 55 | 1.9% |
| Liberal Arts & History | 137 | 4.8% |
| Visual & Performing Arts | 81 | 2.9% |
| Communications | 46 | 1.6% |
| Arts & Humanities | 221 | 7.8% |
| Total | 2,842 | 100.0% |
Transportation & Commute in Brandon
Vehicle Availability by Sex in Brandon
The most prevalent vehicle ownership categories in Brandon are males with 2 vehicles (1,578, accounting for 50.1%) and females with 2 vehicles (1,262, making up 51.6%).
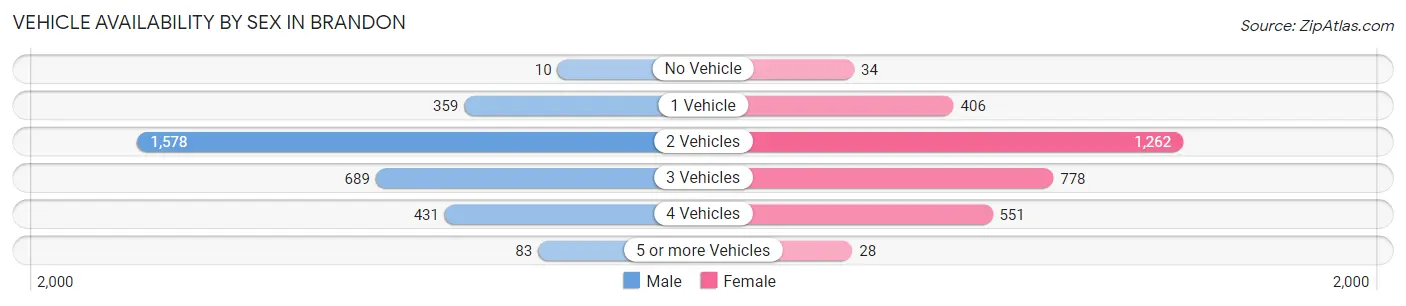
| Vehicles Available | Male | Female |
| No Vehicle | 10 (0.3%) | 34 (1.1%) |
| 1 Vehicle | 359 (11.4%) | 406 (13.3%) |
| 2 Vehicles | 1,578 (50.1%) | 1,262 (41.3%) |
| 3 Vehicles | 689 (21.9%) | 778 (25.4%) |
| 4 Vehicles | 431 (13.7%) | 551 (18.0%) |
| 5 or more Vehicles | 83 (2.6%) | 28 (0.9%) |
| Total | 3,150 (100.0%) | 3,059 (100.0%) |
Commute Time in Brandon
The most frequently occuring commute durations in Brandon are 20 to 24 minutes (1,544 commuters, 29.0%), 15 to 19 minutes (776 commuters, 14.5%), and 5 to 9 minutes (765 commuters, 14.3%).
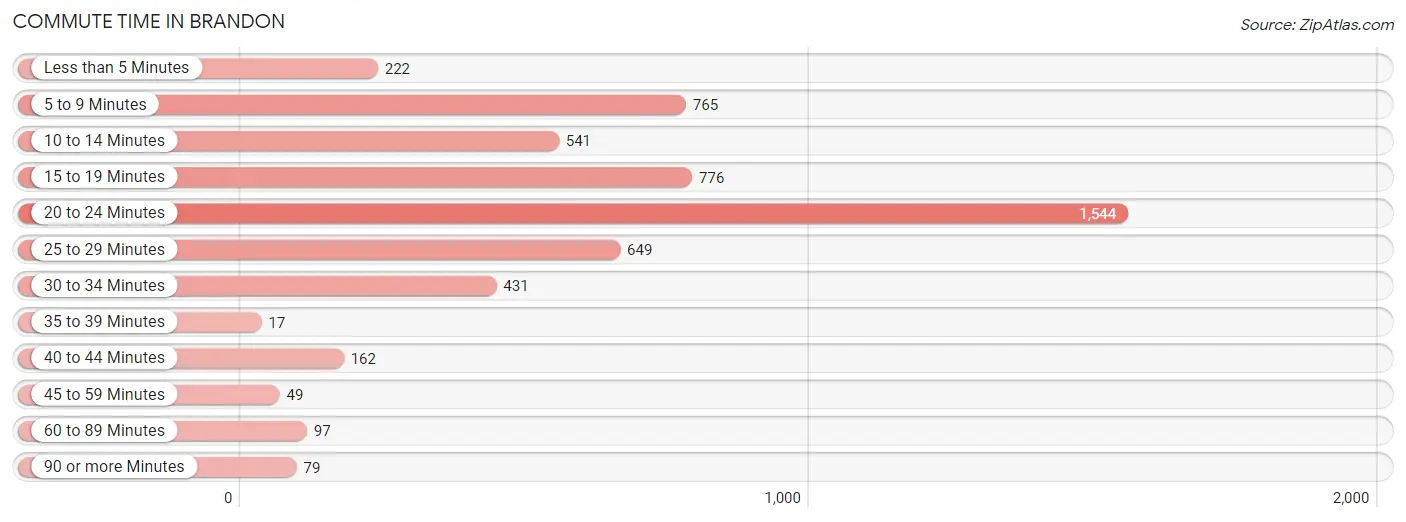
| Commute Time | # Commuters | % Commuters |
| Less than 5 Minutes | 222 | 4.2% |
| 5 to 9 Minutes | 765 | 14.3% |
| 10 to 14 Minutes | 541 | 10.2% |
| 15 to 19 Minutes | 776 | 14.5% |
| 20 to 24 Minutes | 1,544 | 29.0% |
| 25 to 29 Minutes | 649 | 12.2% |
| 30 to 34 Minutes | 431 | 8.1% |
| 35 to 39 Minutes | 17 | 0.3% |
| 40 to 44 Minutes | 162 | 3.0% |
| 45 to 59 Minutes | 49 | 0.9% |
| 60 to 89 Minutes | 97 | 1.8% |
| 90 or more Minutes | 79 | 1.5% |
Commute Time by Sex in Brandon
The most common commute times in Brandon are 20 to 24 minutes (897 commuters, 31.3%) for males and 20 to 24 minutes (647 commuters, 26.2%) for females.
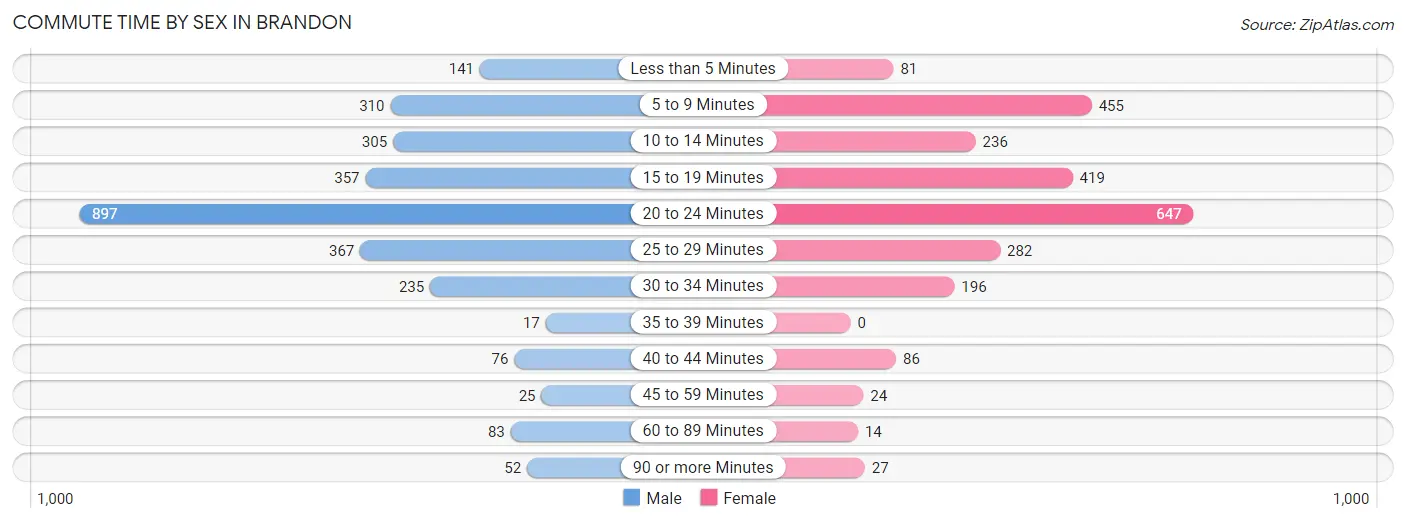
| Commute Time | Male | Female |
| Less than 5 Minutes | 141 (4.9%) | 81 (3.3%) |
| 5 to 9 Minutes | 310 (10.8%) | 455 (18.4%) |
| 10 to 14 Minutes | 305 (10.6%) | 236 (9.6%) |
| 15 to 19 Minutes | 357 (12.5%) | 419 (17.0%) |
| 20 to 24 Minutes | 897 (31.3%) | 647 (26.2%) |
| 25 to 29 Minutes | 367 (12.8%) | 282 (11.4%) |
| 30 to 34 Minutes | 235 (8.2%) | 196 (7.9%) |
| 35 to 39 Minutes | 17 (0.6%) | 0 (0.0%) |
| 40 to 44 Minutes | 76 (2.6%) | 86 (3.5%) |
| 45 to 59 Minutes | 25 (0.9%) | 24 (1.0%) |
| 60 to 89 Minutes | 83 (2.9%) | 14 (0.6%) |
| 90 or more Minutes | 52 (1.8%) | 27 (1.1%) |
Time of Departure to Work by Sex in Brandon
The most frequent times of departure to work in Brandon are 7:30 AM to 7:59 AM (531, 18.5%) for males and 7:30 AM to 7:59 AM (680, 27.6%) for females.
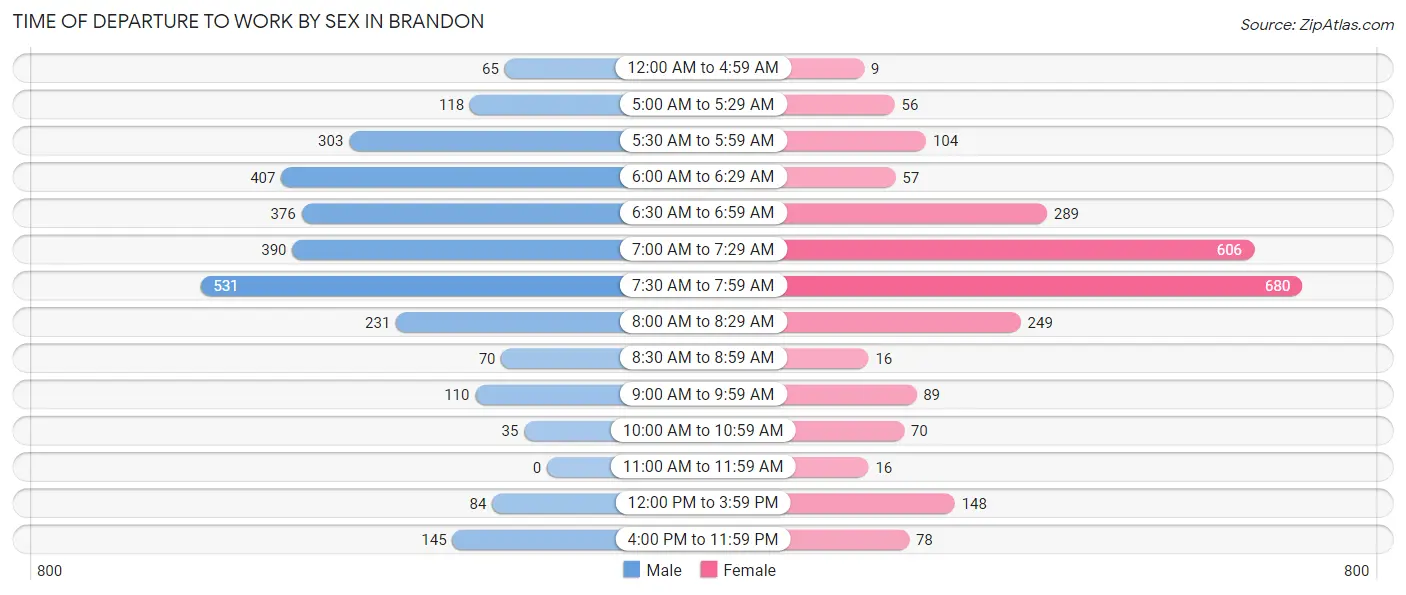
| Time of Departure | Male | Female |
| 12:00 AM to 4:59 AM | 65 (2.3%) | 9 (0.4%) |
| 5:00 AM to 5:29 AM | 118 (4.1%) | 56 (2.3%) |
| 5:30 AM to 5:59 AM | 303 (10.6%) | 104 (4.2%) |
| 6:00 AM to 6:29 AM | 407 (14.2%) | 57 (2.3%) |
| 6:30 AM to 6:59 AM | 376 (13.1%) | 289 (11.7%) |
| 7:00 AM to 7:29 AM | 390 (13.6%) | 606 (24.6%) |
| 7:30 AM to 7:59 AM | 531 (18.5%) | 680 (27.6%) |
| 8:00 AM to 8:29 AM | 231 (8.1%) | 249 (10.1%) |
| 8:30 AM to 8:59 AM | 70 (2.4%) | 16 (0.6%) |
| 9:00 AM to 9:59 AM | 110 (3.8%) | 89 (3.6%) |
| 10:00 AM to 10:59 AM | 35 (1.2%) | 70 (2.8%) |
| 11:00 AM to 11:59 AM | 0 (0.0%) | 16 (0.6%) |
| 12:00 PM to 3:59 PM | 84 (2.9%) | 148 (6.0%) |
| 4:00 PM to 11:59 PM | 145 (5.1%) | 78 (3.2%) |
| Total | 2,865 (100.0%) | 2,467 (100.0%) |
Housing Occupancy in Brandon
Occupancy by Ownership in Brandon
Of the total 4,082 dwellings in Brandon, owner-occupied units account for 3,229 (79.1%), while renter-occupied units make up 853 (20.9%).
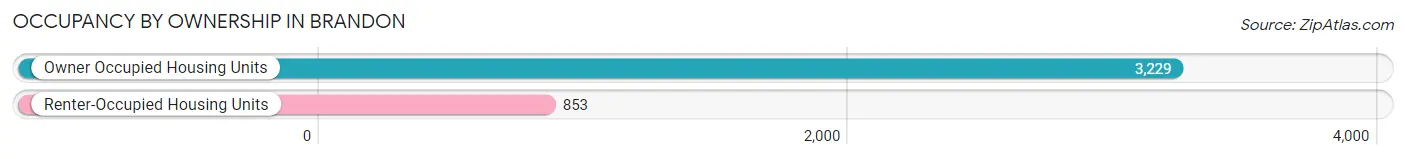
| Occupancy | # Housing Units | % Housing Units |
| Owner Occupied Housing Units | 3,229 | 79.1% |
| Renter-Occupied Housing Units | 853 | 20.9% |
| Total Occupied Housing Units | 4,082 | 100.0% |
Occupancy by Household Size in Brandon
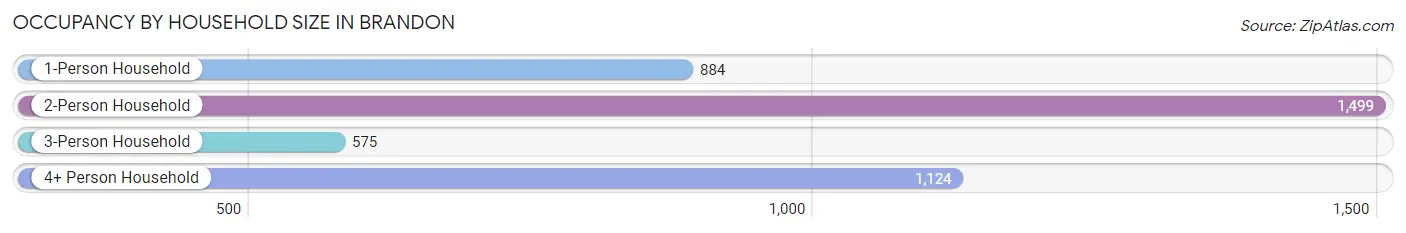
| Household Size | # Housing Units | % Housing Units |
| 1-Person Household | 884 | 21.7% |
| 2-Person Household | 1,499 | 36.7% |
| 3-Person Household | 575 | 14.1% |
| 4+ Person Household | 1,124 | 27.5% |
| Total Housing Units | 4,082 | 100.0% |
Occupancy by Ownership by Household Size in Brandon
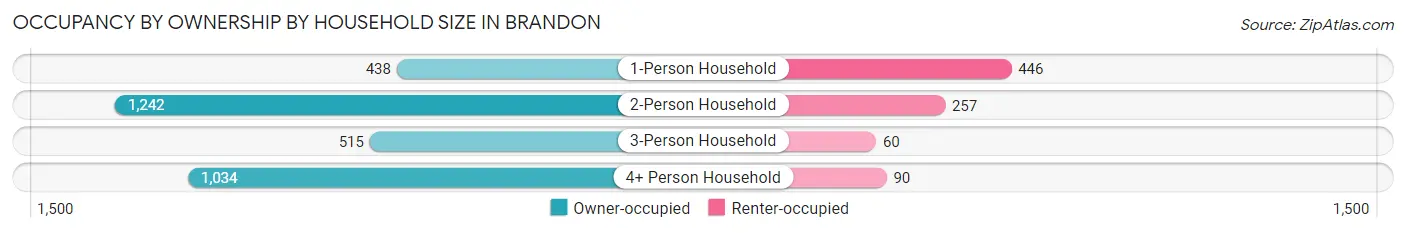
| Household Size | Owner-occupied | Renter-occupied |
| 1-Person Household | 438 (49.5%) | 446 (50.4%) |
| 2-Person Household | 1,242 (82.9%) | 257 (17.1%) |
| 3-Person Household | 515 (89.6%) | 60 (10.4%) |
| 4+ Person Household | 1,034 (92.0%) | 90 (8.0%) |
| Total Housing Units | 3,229 (79.1%) | 853 (20.9%) |
Occupancy by Educational Attainment in Brandon
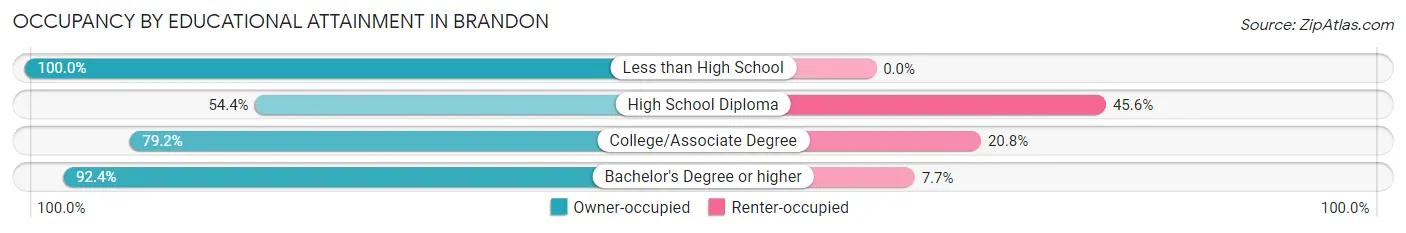
| Household Size | Owner-occupied | Renter-occupied |
| Less than High School | 28 (100.0%) | 0 (0.0%) |
| High School Diploma | 498 (54.4%) | 417 (45.6%) |
| College/Associate Degree | 1,182 (79.2%) | 310 (20.8%) |
| Bachelor's Degree or higher | 1,521 (92.3%) | 126 (7.6%) |
Occupancy by Age of Householder in Brandon
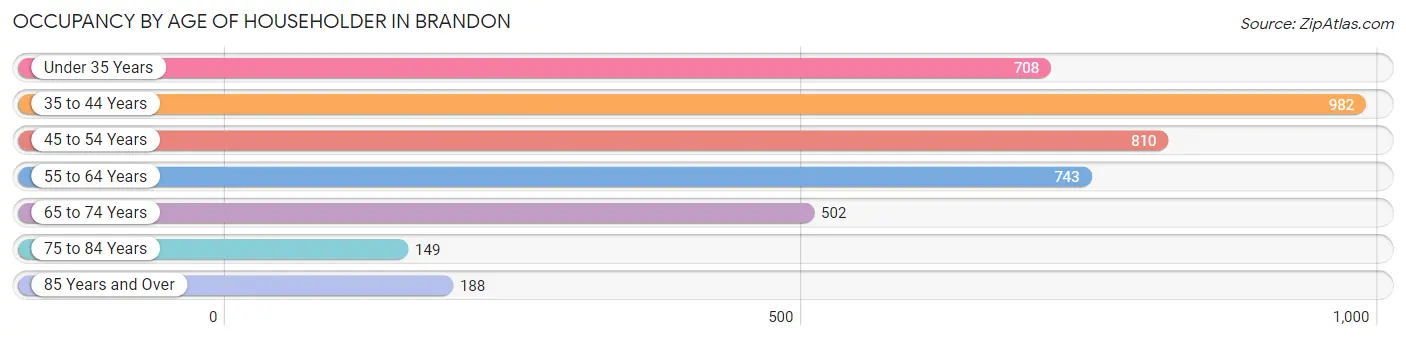
| Age Bracket | # Households | % Households |
| Under 35 Years | 708 | 17.3% |
| 35 to 44 Years | 982 | 24.1% |
| 45 to 54 Years | 810 | 19.8% |
| 55 to 64 Years | 743 | 18.2% |
| 65 to 74 Years | 502 | 12.3% |
| 75 to 84 Years | 149 | 3.6% |
| 85 Years and Over | 188 | 4.6% |
| Total | 4,082 | 100.0% |
Housing Finances in Brandon
Median Income by Occupancy in Brandon
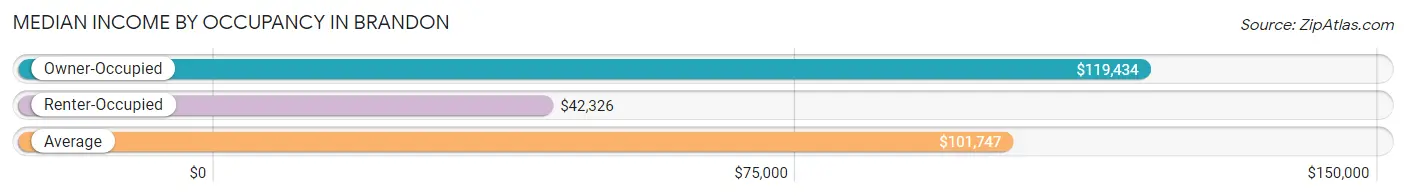
| Occupancy Type | # Households | Median Income |
| Owner-Occupied | 3,229 (79.1%) | $119,434 |
| Renter-Occupied | 853 (20.9%) | $42,326 |
| Average | 4,082 (100.0%) | $101,747 |
Occupancy by Householder Income Bracket in Brandon
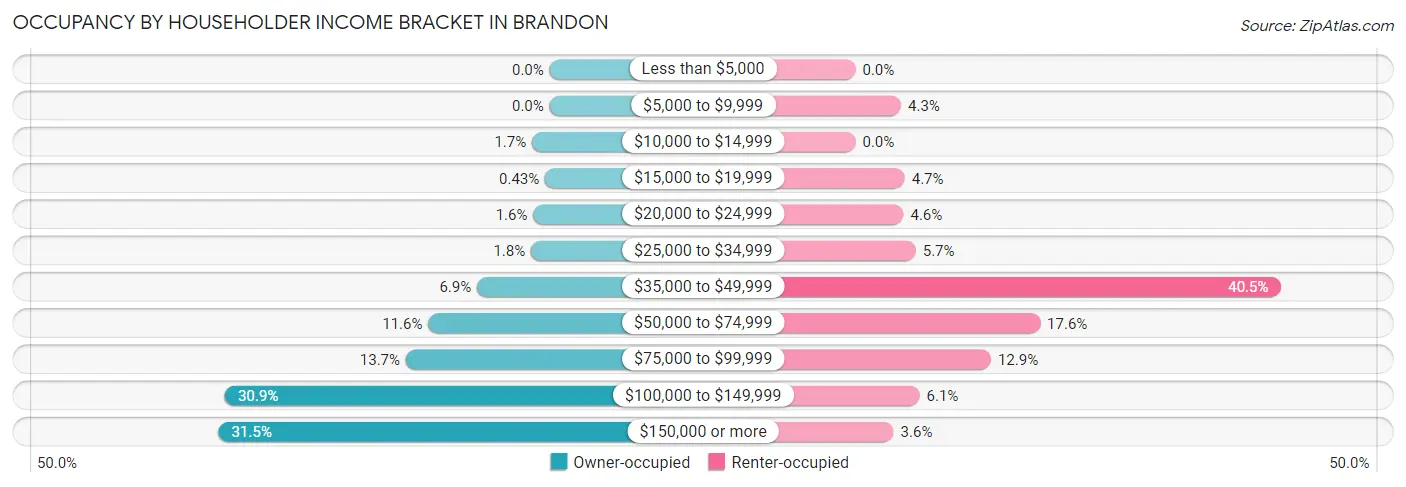
| Income Bracket | Owner-occupied | Renter-occupied |
| Less than $5,000 | 0 (0.0%) | 0 (0.0%) |
| $5,000 to $9,999 | 0 (0.0%) | 37 (4.3%) |
| $10,000 to $14,999 | 54 (1.7%) | 0 (0.0%) |
| $15,000 to $19,999 | 14 (0.4%) | 40 (4.7%) |
| $20,000 to $24,999 | 50 (1.5%) | 39 (4.6%) |
| $25,000 to $34,999 | 57 (1.8%) | 49 (5.7%) |
| $35,000 to $49,999 | 223 (6.9%) | 345 (40.5%) |
| $50,000 to $74,999 | 373 (11.6%) | 150 (17.6%) |
| $75,000 to $99,999 | 442 (13.7%) | 110 (12.9%) |
| $100,000 to $149,999 | 998 (30.9%) | 52 (6.1%) |
| $150,000 or more | 1,018 (31.5%) | 31 (3.6%) |
| Total | 3,229 (100.0%) | 853 (100.0%) |
Monthly Housing Cost Tiers in Brandon
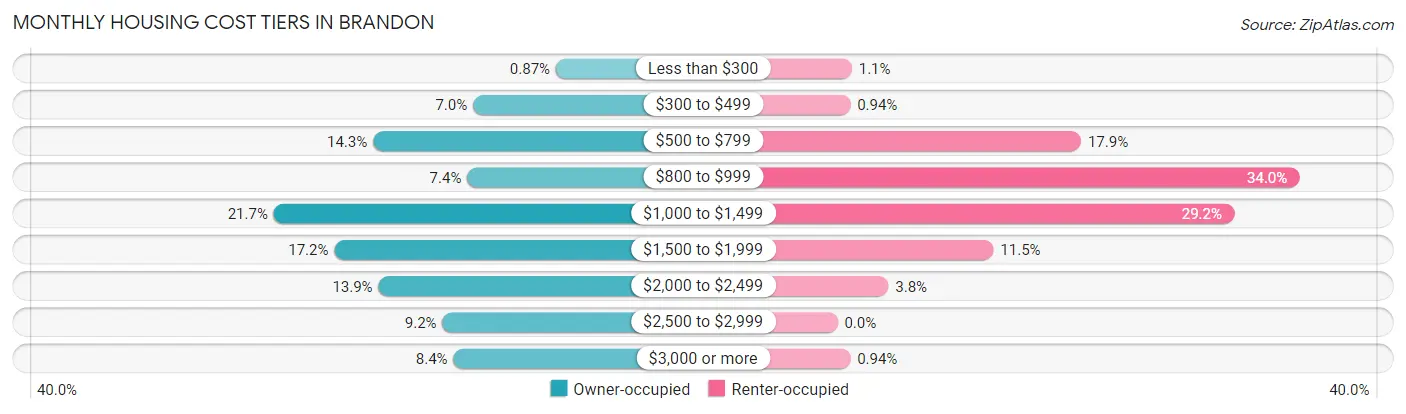
| Monthly Cost | Owner-occupied | Renter-occupied |
| Less than $300 | 28 (0.9%) | 9 (1.1%) |
| $300 to $499 | 225 (7.0%) | 8 (0.9%) |
| $500 to $799 | 463 (14.3%) | 153 (17.9%) |
| $800 to $999 | 239 (7.4%) | 290 (34.0%) |
| $1,000 to $1,499 | 699 (21.6%) | 249 (29.2%) |
| $1,500 to $1,999 | 555 (17.2%) | 98 (11.5%) |
| $2,000 to $2,499 | 450 (13.9%) | 32 (3.7%) |
| $2,500 to $2,999 | 298 (9.2%) | 0 (0.0%) |
| $3,000 or more | 272 (8.4%) | 8 (0.9%) |
| Total | 3,229 (100.0%) | 853 (100.0%) |
Physical Housing Characteristics in Brandon
Housing Structures in Brandon
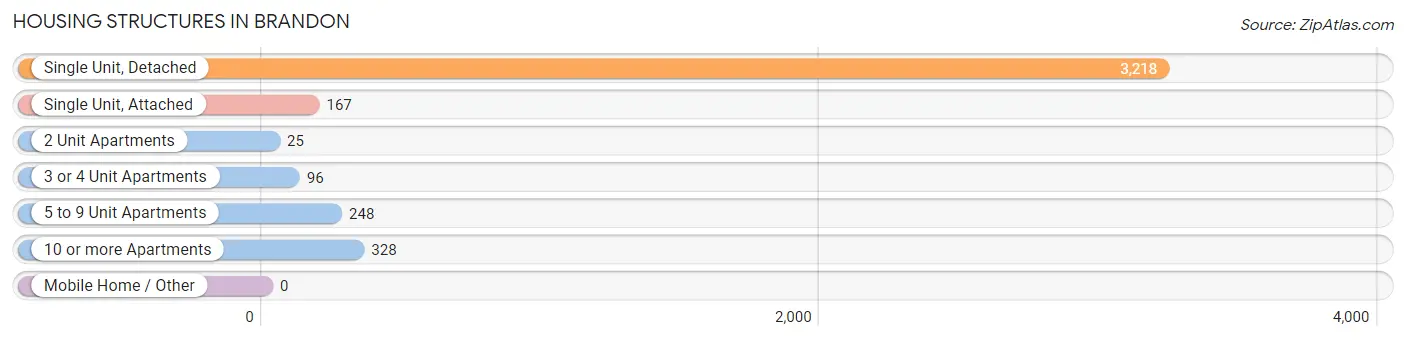
| Structure Type | # Housing Units | % Housing Units |
| Single Unit, Detached | 3,218 | 78.8% |
| Single Unit, Attached | 167 | 4.1% |
| 2 Unit Apartments | 25 | 0.6% |
| 3 or 4 Unit Apartments | 96 | 2.4% |
| 5 to 9 Unit Apartments | 248 | 6.1% |
| 10 or more Apartments | 328 | 8.0% |
| Mobile Home / Other | 0 | 0.0% |
| Total | 4,082 | 100.0% |
Housing Structures by Occupancy in Brandon
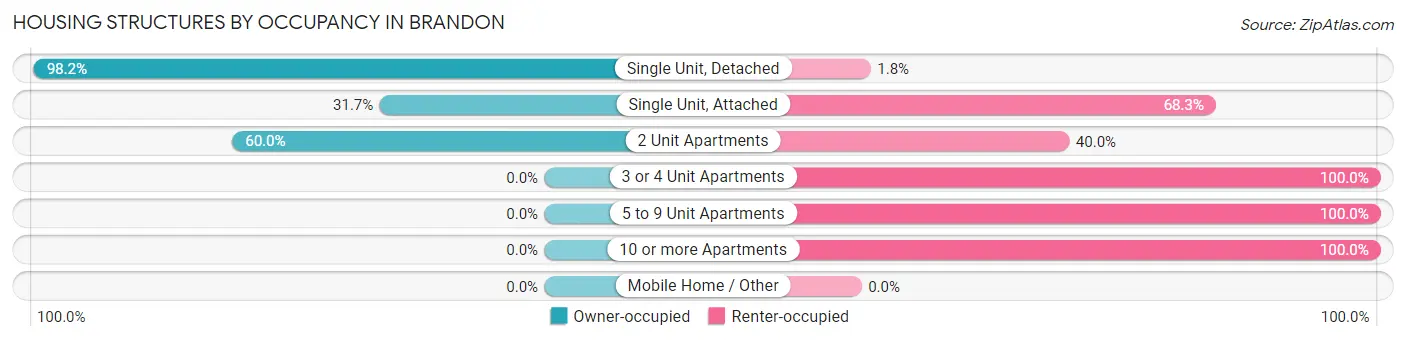
| Structure Type | Owner-occupied | Renter-occupied |
| Single Unit, Detached | 3,161 (98.2%) | 57 (1.8%) |
| Single Unit, Attached | 53 (31.7%) | 114 (68.3%) |
| 2 Unit Apartments | 15 (60.0%) | 10 (40.0%) |
| 3 or 4 Unit Apartments | 0 (0.0%) | 96 (100.0%) |
| 5 to 9 Unit Apartments | 0 (0.0%) | 248 (100.0%) |
| 10 or more Apartments | 0 (0.0%) | 328 (100.0%) |
| Mobile Home / Other | 0 (0.0%) | 0 (0.0%) |
| Total | 3,229 (79.1%) | 853 (20.9%) |
Housing Structures by Number of Rooms in Brandon
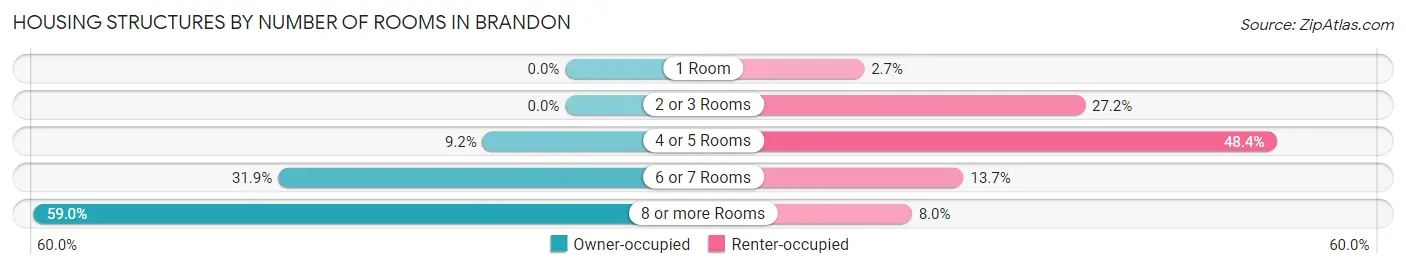
| Number of Rooms | Owner-occupied | Renter-occupied |
| 1 Room | 0 (0.0%) | 23 (2.7%) |
| 2 or 3 Rooms | 0 (0.0%) | 232 (27.2%) |
| 4 or 5 Rooms | 296 (9.2%) | 413 (48.4%) |
| 6 or 7 Rooms | 1,029 (31.9%) | 117 (13.7%) |
| 8 or more Rooms | 1,904 (59.0%) | 68 (8.0%) |
| Total | 3,229 (100.0%) | 853 (100.0%) |
Housing Structure by Heating Type in Brandon
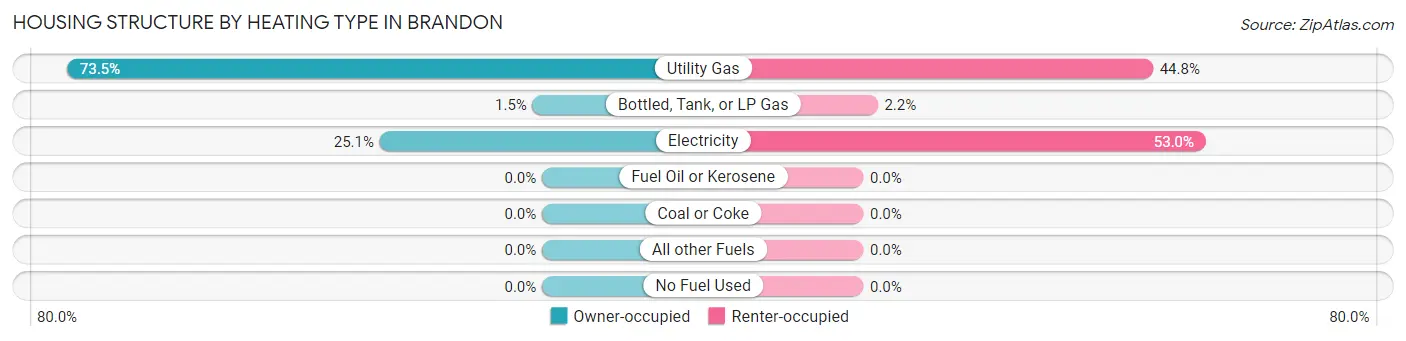
| Heating Type | Owner-occupied | Renter-occupied |
| Utility Gas | 2,372 (73.5%) | 382 (44.8%) |
| Bottled, Tank, or LP Gas | 47 (1.5%) | 19 (2.2%) |
| Electricity | 810 (25.1%) | 452 (53.0%) |
| Fuel Oil or Kerosene | 0 (0.0%) | 0 (0.0%) |
| Coal or Coke | 0 (0.0%) | 0 (0.0%) |
| All other Fuels | 0 (0.0%) | 0 (0.0%) |
| No Fuel Used | 0 (0.0%) | 0 (0.0%) |
| Total | 3,229 (100.0%) | 853 (100.0%) |
Household Vehicle Usage in Brandon
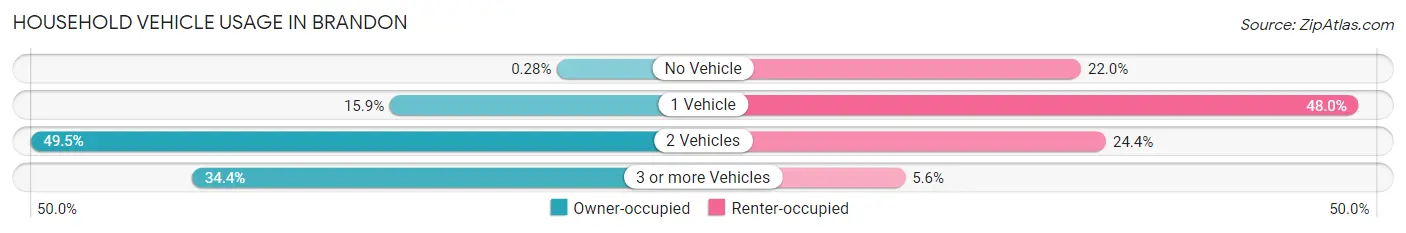
| Vehicles per Household | Owner-occupied | Renter-occupied |
| No Vehicle | 9 (0.3%) | 188 (22.0%) |
| 1 Vehicle | 513 (15.9%) | 409 (47.9%) |
| 2 Vehicles | 1,597 (49.5%) | 208 (24.4%) |
| 3 or more Vehicles | 1,110 (34.4%) | 48 (5.6%) |
| Total | 3,229 (100.0%) | 853 (100.0%) |
Real Estate & Mortgages in Brandon
Real Estate and Mortgage Overview in Brandon
| Characteristic | Without Mortgage | With Mortgage |
| Housing Units | 1,025 | 2,204 |
| Median Property Value | $304,700 | $304,700 |
| Median Household Income | $92,617 | $787 |
| Monthly Housing Costs | $667 | $272 |
| Real Estate Taxes | $4,037 | $58 |
Property Value by Mortgage Status in Brandon
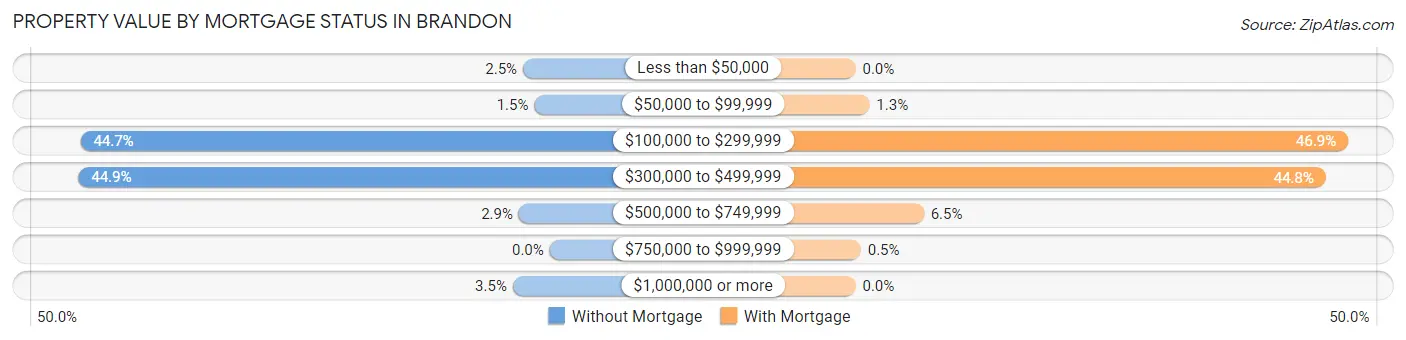
| Property Value | Without Mortgage | With Mortgage |
| Less than $50,000 | 26 (2.5%) | 0 (0.0%) |
| $50,000 to $99,999 | 15 (1.5%) | 29 (1.3%) |
| $100,000 to $299,999 | 458 (44.7%) | 1,034 (46.9%) |
| $300,000 to $499,999 | 460 (44.9%) | 987 (44.8%) |
| $500,000 to $749,999 | 30 (2.9%) | 143 (6.5%) |
| $750,000 to $999,999 | 0 (0.0%) | 11 (0.5%) |
| $1,000,000 or more | 36 (3.5%) | 0 (0.0%) |
| Total | 1,025 (100.0%) | 2,204 (100.0%) |
Household Income by Mortgage Status in Brandon
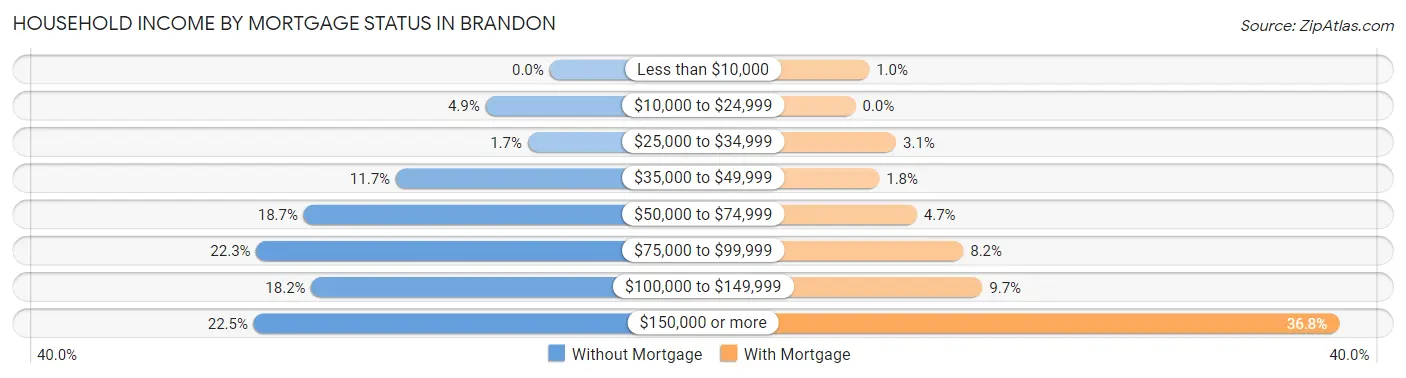
| Household Income | Without Mortgage | With Mortgage |
| Less than $10,000 | 0 (0.0%) | 23 (1.0%) |
| $10,000 to $24,999 | 50 (4.9%) | 0 (0.0%) |
| $25,000 to $34,999 | 17 (1.7%) | 68 (3.1%) |
| $35,000 to $49,999 | 120 (11.7%) | 40 (1.8%) |
| $50,000 to $74,999 | 192 (18.7%) | 103 (4.7%) |
| $75,000 to $99,999 | 229 (22.3%) | 181 (8.2%) |
| $100,000 to $149,999 | 186 (18.1%) | 213 (9.7%) |
| $150,000 or more | 231 (22.5%) | 812 (36.8%) |
| Total | 1,025 (100.0%) | 2,204 (100.0%) |
Property Value to Household Income Ratio in Brandon
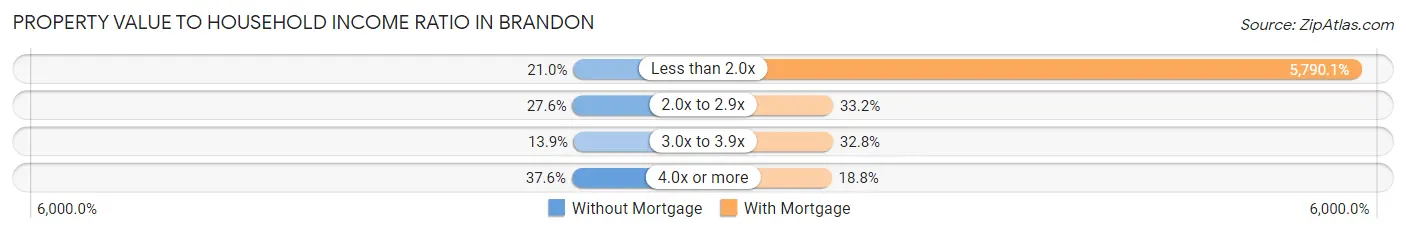
| Value-to-Income Ratio | Without Mortgage | With Mortgage |
| Less than 2.0x | 215 (21.0%) | 127,614 (5,790.1%) |
| 2.0x to 2.9x | 283 (27.6%) | 732 (33.2%) |
| 3.0x to 3.9x | 142 (13.9%) | 722 (32.8%) |
| 4.0x or more | 385 (37.6%) | 414 (18.8%) |
| Total | 1,025 (100.0%) | 2,204 (100.0%) |
Real Estate Taxes by Mortgage Status in Brandon
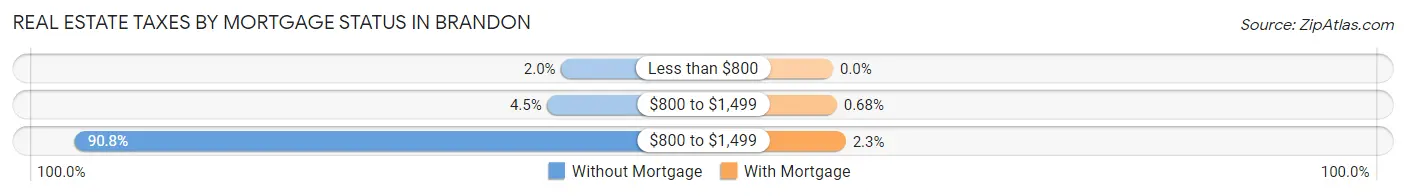
| Property Taxes | Without Mortgage | With Mortgage |
| Less than $800 | 20 (1.9%) | 0 (0.0%) |
| $800 to $1,499 | 46 (4.5%) | 15 (0.7%) |
| $800 to $1,499 | 931 (90.8%) | 51 (2.3%) |
| Total | 1,025 (100.0%) | 2,204 (100.0%) |
Health & Disability in Brandon
Health Insurance Coverage by Age in Brandon
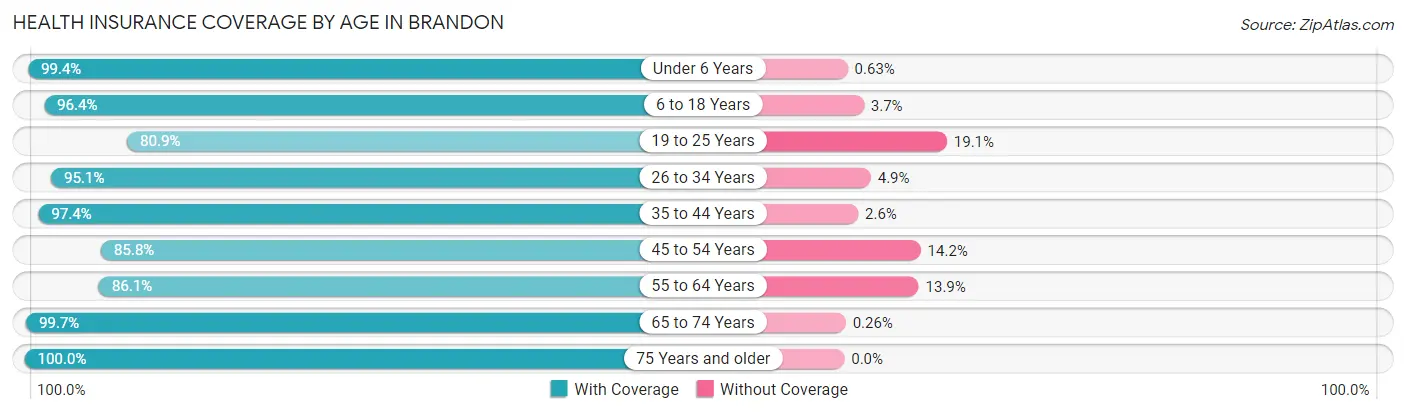
| Age Bracket | With Coverage | Without Coverage |
| Under 6 Years | 946 (99.4%) | 6 (0.6%) |
| 6 to 18 Years | 2,244 (96.4%) | 85 (3.6%) |
| 19 to 25 Years | 296 (80.9%) | 70 (19.1%) |
| 26 to 34 Years | 1,078 (95.1%) | 56 (4.9%) |
| 35 to 44 Years | 1,851 (97.4%) | 49 (2.6%) |
| 45 to 54 Years | 1,343 (85.8%) | 223 (14.2%) |
| 55 to 64 Years | 1,187 (86.1%) | 191 (13.9%) |
| 65 to 74 Years | 771 (99.7%) | 2 (0.3%) |
| 75 Years and older | 490 (100.0%) | 0 (0.0%) |
| Total | 10,206 (93.7%) | 682 (6.3%) |
Health Insurance Coverage by Citizenship Status in Brandon
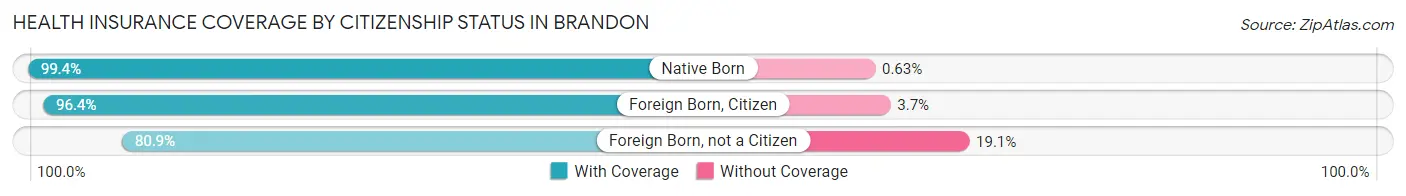
| Citizenship Status | With Coverage | Without Coverage |
| Native Born | 946 (99.4%) | 6 (0.6%) |
| Foreign Born, Citizen | 2,244 (96.4%) | 85 (3.6%) |
| Foreign Born, not a Citizen | 296 (80.9%) | 70 (19.1%) |
Health Insurance Coverage by Household Income in Brandon
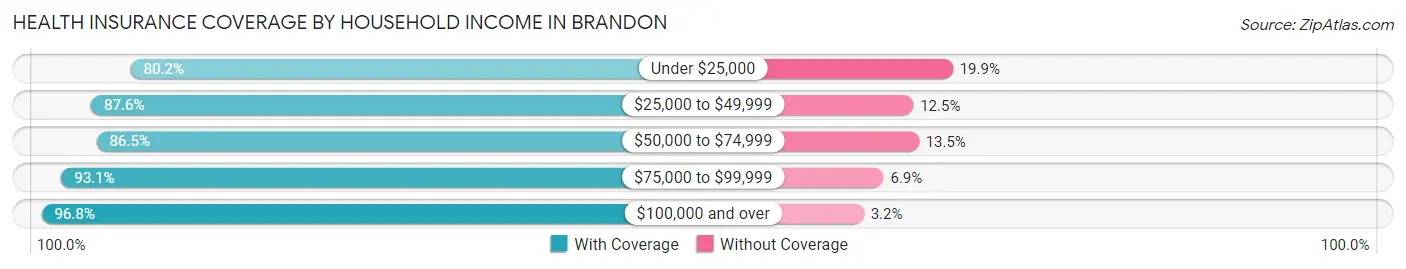
| Household Income | With Coverage | Without Coverage |
| Under $25,000 | 218 (80.1%) | 54 (19.9%) |
| $25,000 to $49,999 | 935 (87.5%) | 133 (12.4%) |
| $50,000 to $74,999 | 925 (86.5%) | 144 (13.5%) |
| $75,000 to $99,999 | 1,529 (93.1%) | 113 (6.9%) |
| $100,000 and over | 6,599 (96.8%) | 216 (3.2%) |
Public vs Private Health Insurance Coverage by Age in Brandon
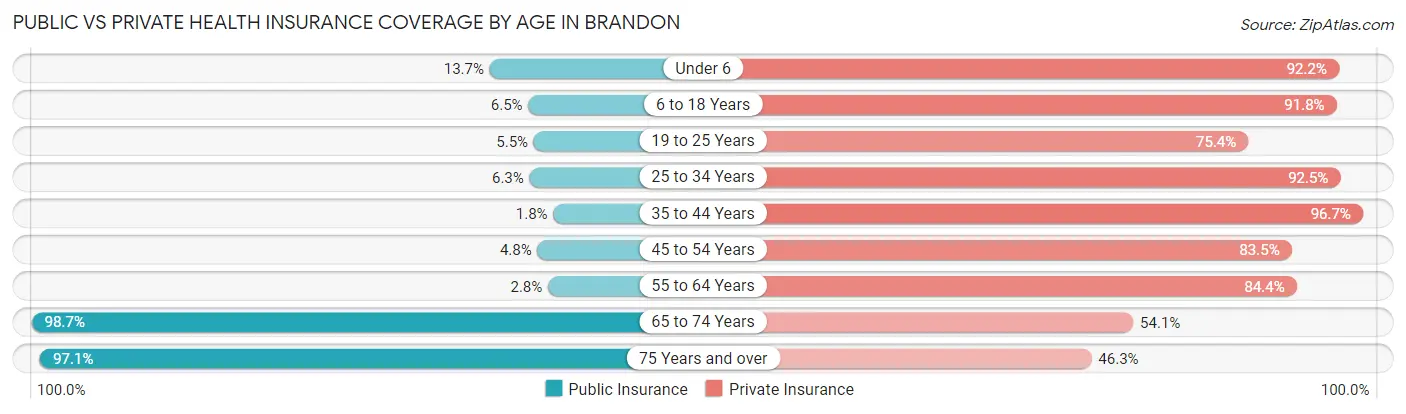
| Age Bracket | Public Insurance | Private Insurance |
| Under 6 | 130 (13.7%) | 878 (92.2%) |
| 6 to 18 Years | 151 (6.5%) | 2,138 (91.8%) |
| 19 to 25 Years | 20 (5.5%) | 276 (75.4%) |
| 25 to 34 Years | 71 (6.3%) | 1,049 (92.5%) |
| 35 to 44 Years | 35 (1.8%) | 1,837 (96.7%) |
| 45 to 54 Years | 75 (4.8%) | 1,307 (83.5%) |
| 55 to 64 Years | 39 (2.8%) | 1,163 (84.4%) |
| 65 to 74 Years | 763 (98.7%) | 418 (54.1%) |
| 75 Years and over | 476 (97.1%) | 227 (46.3%) |
| Total | 1,760 (16.2%) | 9,293 (85.4%) |
Disability Status by Sex by Age in Brandon
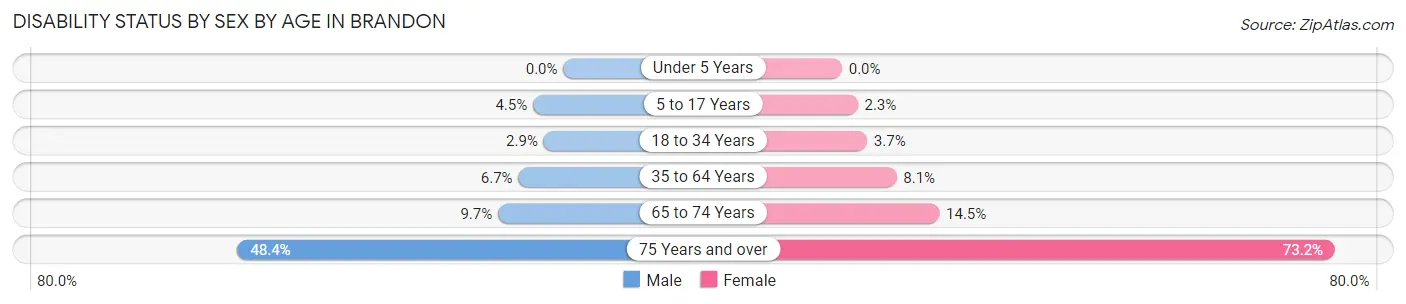
| Age Bracket | Male | Female |
| Under 5 Years | 0 (0.0%) | 0 (0.0%) |
| 5 to 17 Years | 64 (4.5%) | 25 (2.3%) |
| 18 to 34 Years | 19 (2.9%) | 34 (3.7%) |
| 35 to 64 Years | 174 (6.7%) | 181 (8.1%) |
| 65 to 74 Years | 32 (9.7%) | 64 (14.4%) |
| 75 Years and over | 60 (48.4%) | 268 (73.2%) |
Disability Class by Sex by Age in Brandon
Disability Class: Hearing Difficulty
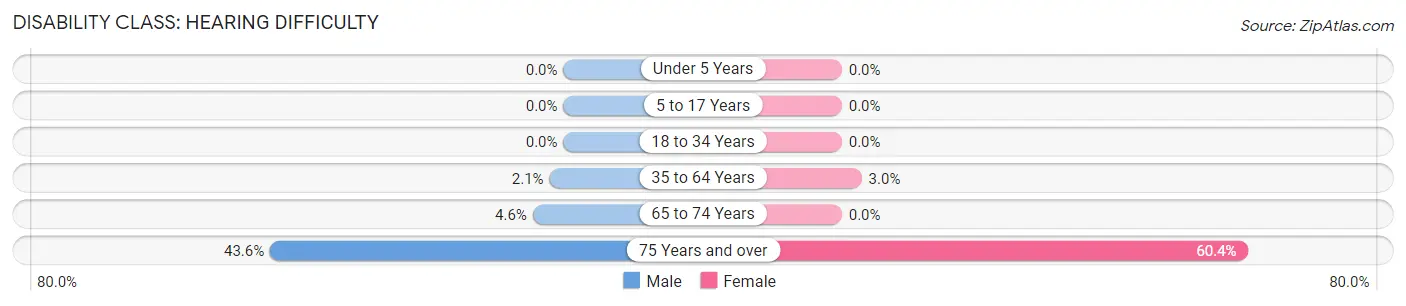
| Age Bracket | Male | Female |
| Under 5 Years | 0 (0.0%) | 0 (0.0%) |
| 5 to 17 Years | 0 (0.0%) | 0 (0.0%) |
| 18 to 34 Years | 0 (0.0%) | 0 (0.0%) |
| 35 to 64 Years | 54 (2.1%) | 66 (2.9%) |
| 65 to 74 Years | 15 (4.5%) | 0 (0.0%) |
| 75 Years and over | 54 (43.5%) | 221 (60.4%) |
Disability Class: Vision Difficulty
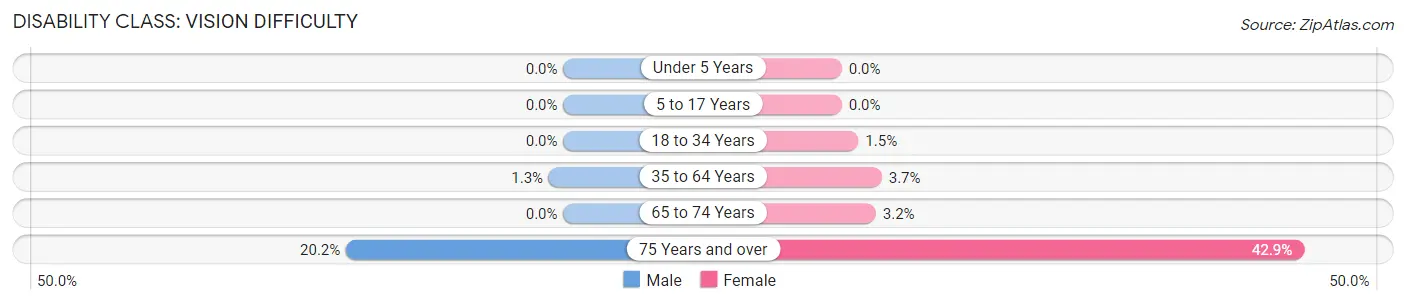
| Age Bracket | Male | Female |
| Under 5 Years | 0 (0.0%) | 0 (0.0%) |
| 5 to 17 Years | 0 (0.0%) | 0 (0.0%) |
| 18 to 34 Years | 0 (0.0%) | 14 (1.5%) |
| 35 to 64 Years | 35 (1.3%) | 83 (3.7%) |
| 65 to 74 Years | 0 (0.0%) | 14 (3.2%) |
| 75 Years and over | 25 (20.2%) | 157 (42.9%) |
Disability Class: Cognitive Difficulty
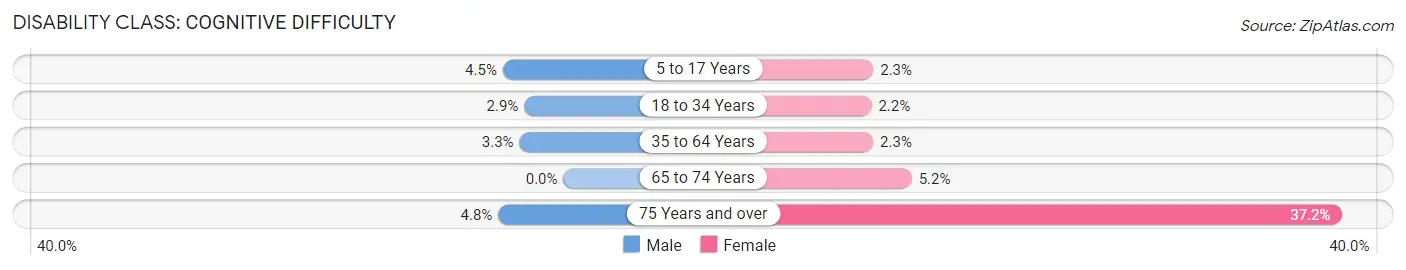
| Age Bracket | Male | Female |
| 5 to 17 Years | 64 (4.5%) | 25 (2.3%) |
| 18 to 34 Years | 19 (2.9%) | 20 (2.2%) |
| 35 to 64 Years | 85 (3.3%) | 52 (2.3%) |
| 65 to 74 Years | 0 (0.0%) | 23 (5.2%) |
| 75 Years and over | 6 (4.8%) | 136 (37.2%) |
Disability Class: Ambulatory Difficulty
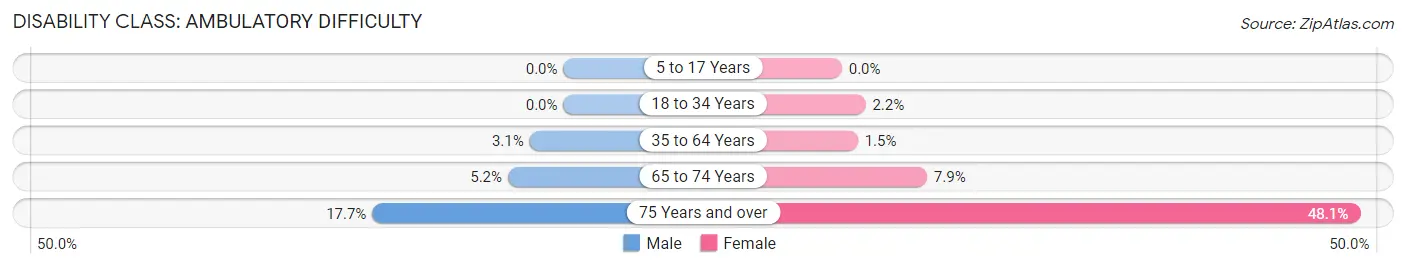
| Age Bracket | Male | Female |
| 5 to 17 Years | 0 (0.0%) | 0 (0.0%) |
| 18 to 34 Years | 0 (0.0%) | 20 (2.2%) |
| 35 to 64 Years | 82 (3.1%) | 33 (1.5%) |
| 65 to 74 Years | 17 (5.1%) | 35 (7.9%) |
| 75 Years and over | 22 (17.7%) | 176 (48.1%) |
Disability Class: Self-Care Difficulty
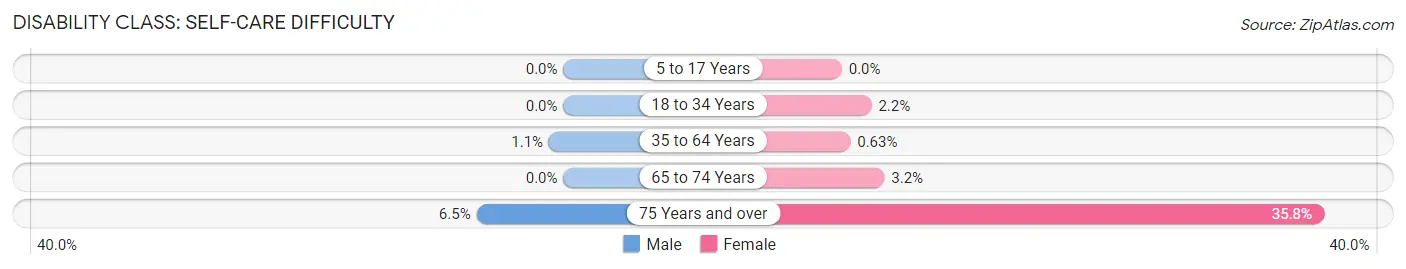
| Age Bracket | Male | Female |
| 5 to 17 Years | 0 (0.0%) | 0 (0.0%) |
| 18 to 34 Years | 0 (0.0%) | 20 (2.2%) |
| 35 to 64 Years | 28 (1.1%) | 14 (0.6%) |
| 65 to 74 Years | 0 (0.0%) | 14 (3.2%) |
| 75 Years and over | 8 (6.5%) | 131 (35.8%) |
Technology Access in Brandon
Computing Device Access in Brandon
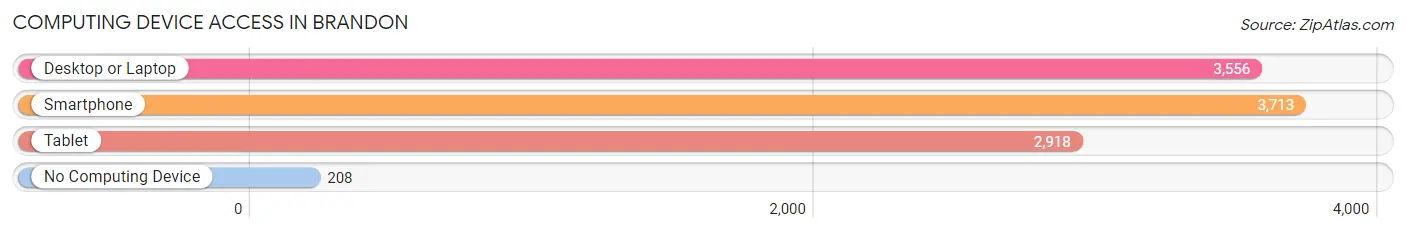
| Device Type | # Households | % Households |
| Desktop or Laptop | 3,556 | 87.1% |
| Smartphone | 3,713 | 91.0% |
| Tablet | 2,918 | 71.5% |
| No Computing Device | 208 | 5.1% |
| Total | 4,082 | 100.0% |
Internet Access in Brandon
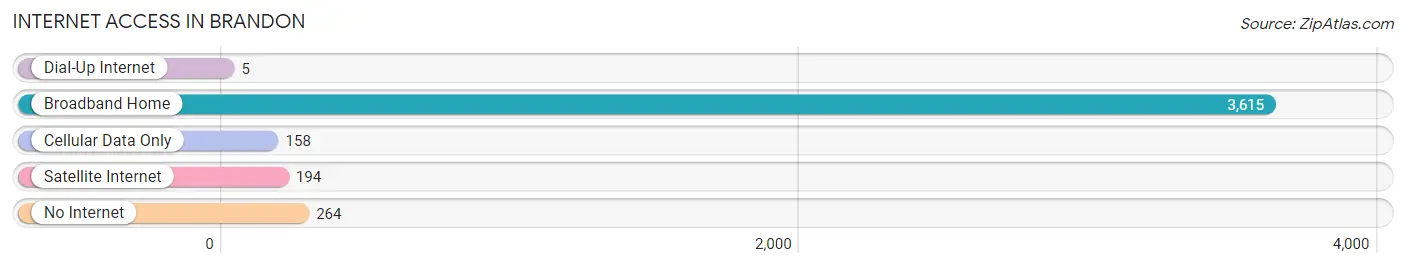
| Internet Type | # Households | % Households |
| Dial-Up Internet | 5 | 0.1% |
| Broadband Home | 3,615 | 88.6% |
| Cellular Data Only | 158 | 3.9% |
| Satellite Internet | 194 | 4.8% |
| No Internet | 264 | 6.5% |
| Total | 4,082 | 100.0% |
Brandon Summary
Brandon, South Dakota is a city located in Minnehaha County, South Dakota, United States. It is the county seat of Minnehaha County and the largest city in the state. The population of Brandon was estimated to be 9,921 in 2019.
History
The area that is now Brandon was first settled in 1856 by a group of settlers from Wisconsin. The town was originally named “Brandonville” after the first settler, William Brandon. The town was officially incorporated in 1883.
In the late 19th century, Brandon was a major stop on the Chicago, Milwaukee, St. Paul and Pacific Railroad. The railroad brought many new settlers to the area and helped to spur the growth of the town.
Geography
Brandon is located in southeastern South Dakota, about 10 miles east of Sioux Falls. The city is situated on the Big Sioux River, which flows through the city. The city is located in the rolling hills of the Great Plains.
The climate in Brandon is classified as humid continental, with hot summers and cold winters. The average annual temperature is 48.3°F (9.1°C). The average annual precipitation is 22.3 inches (56.7 cm).
Economy
The economy of Brandon is largely based on agriculture and manufacturing. The city is home to several large agricultural companies, including Cargill, Inc., and Tyson Foods.
Manufacturing is also an important part of the economy. The city is home to several large manufacturing companies, including 3M, John Deere, and Caterpillar.
Demographics
As of the 2019 census, the population of Brandon was estimated to be 9,921. The racial makeup of the city was 92.3% White, 2.3% African American, 0.7% Native American, 1.2% Asian, 0.1% Pacific Islander, 1.7% from other races, and 2.1% from two or more races. Hispanic or Latino of any race were 4.2% of the population.
The median household income in Brandon was $60,945 in 2019. The median home value was $212,400. The median age of the population was 37.3 years.
Conclusion
Brandon, South Dakota is a city located in Minnehaha County, South Dakota, United States. It is the county seat of Minnehaha County and the largest city in the state. The city was first settled in 1856 and was officially incorporated in 1883. The economy of Brandon is largely based on agriculture and manufacturing. As of the 2019 census, the population of Brandon was estimated to be 9,921. The median household income in Brandon was $60,945 in 2019.
Common Questions
What is Per Capita Income in Brandon?
Per Capita income in Brandon is $46,599.
What is the Median Family Income in Brandon?
Median Family Income in Brandon is $119,316.
What is the Median Household income in Brandon?
Median Household Income in Brandon is $101,747.
What is Income or Wage Gap in Brandon?
Income or Wage Gap in Brandon is 39.0%.
Women in Brandon earn 61.0 cents for every dollar earned by a man.
What is Inequality or Gini Index in Brandon?
Inequality or Gini Index in Brandon is 0.39.
What is the Total Population of Brandon?
Total Population of Brandon is 10,919.
What is the Total Male Population of Brandon?
Total Male Population of Brandon is 5,576.
What is the Total Female Population of Brandon?
Total Female Population of Brandon is 5,343.
What is the Ratio of Males per 100 Females in Brandon?
There are 104.36 Males per 100 Females in Brandon.
What is the Ratio of Females per 100 Males in Brandon?
There are 95.82 Females per 100 Males in Brandon.
What is the Median Population Age in Brandon?
Median Population Age in Brandon is 38.2 Years.
What is the Average Family Size in Brandon
Average Family Size in Brandon is 3.2 People.
What is the Average Household Size in Brandon
Average Household Size in Brandon is 2.7 People.
How Large is the Labor Force in Brandon?
There are 6,415 People in the Labor Forcein in Brandon.
What is the Percentage of People in the Labor Force in Brandon?
79.3% of People are in the Labor Force in Brandon.
What is the Unemployment Rate in Brandon?
Unemployment Rate in Brandon is 1.2%.