Sherman, SD Map & Demographics
Sherman Map
Sherman Overview
$34,537
PER CAPITA INCOME
$121,250
AVG FAMILY INCOME
$50,000
AVG HOUSEHOLD INCOME
3.9%
WAGE / INCOME GAP [ % ]
96.1¢/ $1
WAGE / INCOME GAP [ $ ]
0.41
INEQUALITY / GINI INDEX
51
TOTAL POPULATION
31
MALE POPULATION
20
FEMALE POPULATION
155.00
MALES / 100 FEMALES
64.52
FEMALES / 100 MALES
55.8
MEDIAN AGE
3.3
AVG FAMILY SIZE
2.1
AVG HOUSEHOLD SIZE
28
LABOR FORCE [ PEOPLE ]
63.6%
PERCENT IN LABOR FORCE
Sherman Area Codes
Income in Sherman
Income Overview in Sherman
Per Capita Income in Sherman is $34,537, while median incomes of families and households are $121,250 and $50,000 respectively.
| Characteristic | Number | Measure |
| Per Capita Income | 51 | $34,537 |
| Median Family Income | 11 | $121,250 |
| Mean Family Income | 11 | $111,909 |
| Median Household Income | 24 | $50,000 |
| Mean Household Income | 24 | $71,054 |
| Income Deficit | 11 | $0 |
| Wage / Income Gap (%) | 51 | 3.89% |
| Wage / Income Gap ($) | 51 | 96.11¢ per $1 |
| Gini / Inequality Index | 51 | 0.41 |
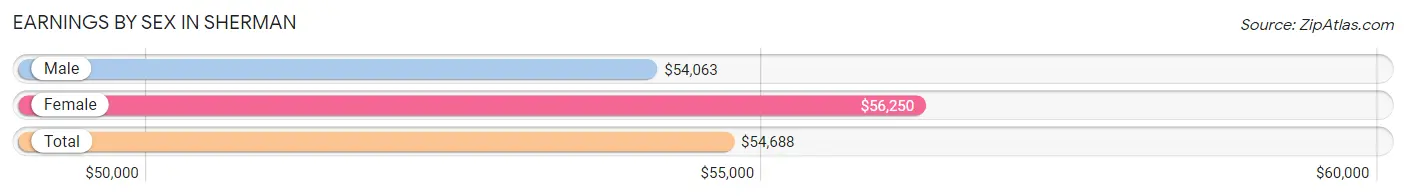
Earnings by Sex in Sherman
Average Earnings in Sherman are $54,688, $54,063 for men and $56,250 for women, a difference of 3.9%.
| Sex | Number | Average Earnings |
| Male | 19 (65.5%) | $54,063 |
| Female | 10 (34.5%) | $56,250 |
| Total | 29 (100.0%) | $54,688 |
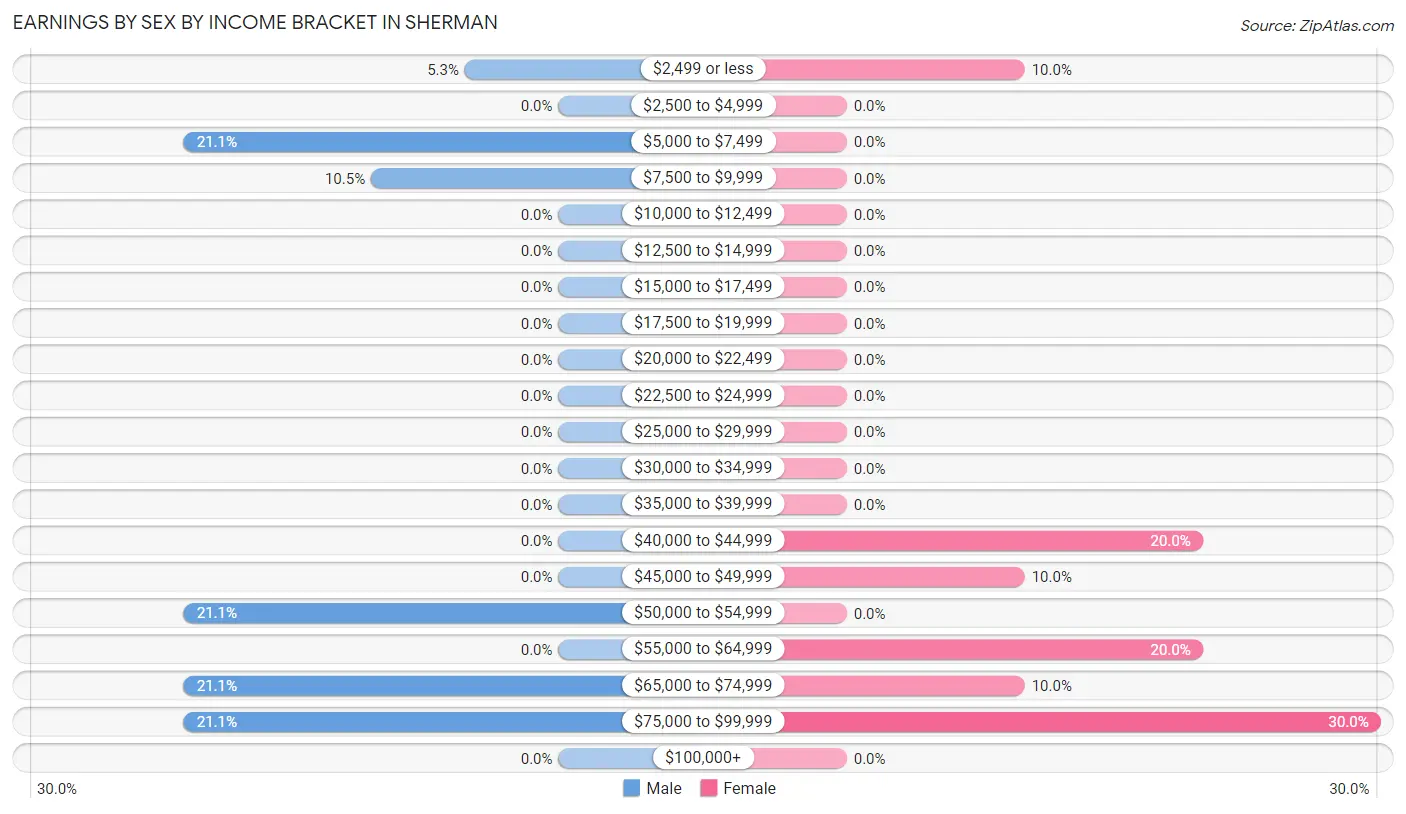
Earnings by Sex by Income Bracket in Sherman
The most common earnings brackets in Sherman are $5,000 to $7,499 for men (4 | 21.0%) and $75,000 to $99,999 for women (3 | 30.0%).
| Income | Male | Female |
| $2,499 or less | 1 (5.3%) | 1 (10.0%) |
| $2,500 to $4,999 | 0 (0.0%) | 0 (0.0%) |
| $5,000 to $7,499 | 4 (21.0%) | 0 (0.0%) |
| $7,500 to $9,999 | 2 (10.5%) | 0 (0.0%) |
| $10,000 to $12,499 | 0 (0.0%) | 0 (0.0%) |
| $12,500 to $14,999 | 0 (0.0%) | 0 (0.0%) |
| $15,000 to $17,499 | 0 (0.0%) | 0 (0.0%) |
| $17,500 to $19,999 | 0 (0.0%) | 0 (0.0%) |
| $20,000 to $22,499 | 0 (0.0%) | 0 (0.0%) |
| $22,500 to $24,999 | 0 (0.0%) | 0 (0.0%) |
| $25,000 to $29,999 | 0 (0.0%) | 0 (0.0%) |
| $30,000 to $34,999 | 0 (0.0%) | 0 (0.0%) |
| $35,000 to $39,999 | 0 (0.0%) | 0 (0.0%) |
| $40,000 to $44,999 | 0 (0.0%) | 2 (20.0%) |
| $45,000 to $49,999 | 0 (0.0%) | 1 (10.0%) |
| $50,000 to $54,999 | 4 (21.0%) | 0 (0.0%) |
| $55,000 to $64,999 | 0 (0.0%) | 2 (20.0%) |
| $65,000 to $74,999 | 4 (21.0%) | 1 (10.0%) |
| $75,000 to $99,999 | 4 (21.0%) | 3 (30.0%) |
| $100,000+ | 0 (0.0%) | 0 (0.0%) |
| Total | 19 (100.0%) | 10 (100.0%) |
Earnings by Sex by Educational Attainment in Sherman
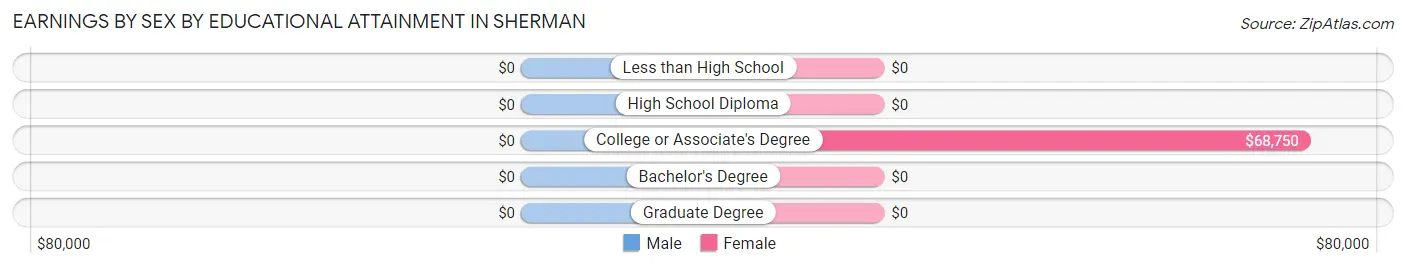
| Educational Attainment | Male Income | Female Income |
| Less than High School | - | - |
| High School Diploma | - | - |
| College or Associate's Degree | - | - |
| Bachelor's Degree | - | - |
| Graduate Degree | - | - |
| Total | $54,063 | $56,250 |
Family Income in Sherman
Family Income Brackets in Sherman
According to the Sherman family income data, there are 4 families falling into the $100,000 to $149,999 income range, which is the most common income bracket and makes up 36.4% of all families.
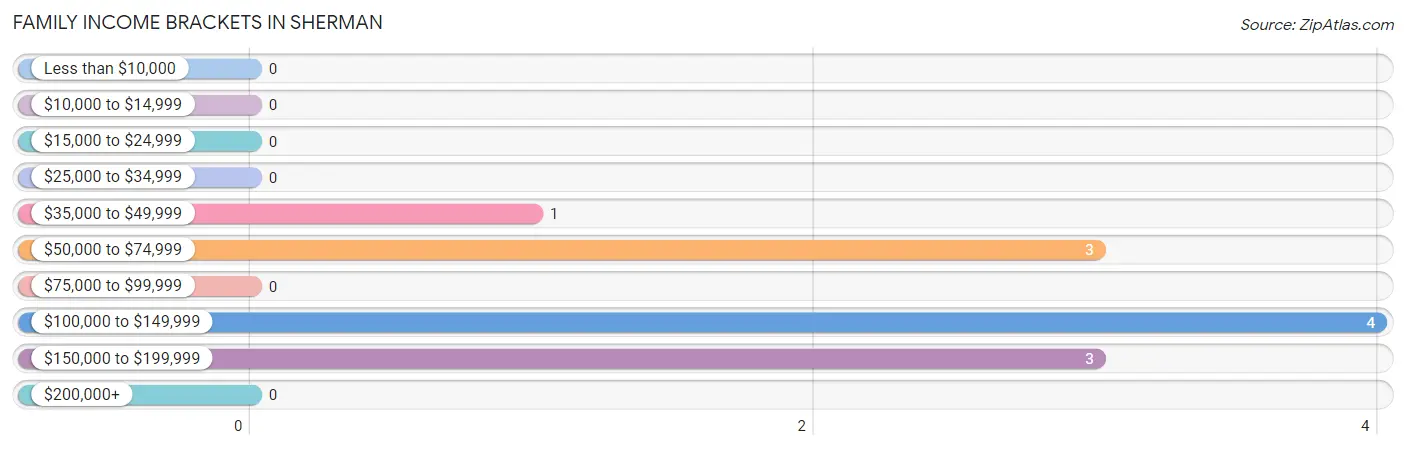
| Income Bracket | # Families | % Families |
| Less than $10,000 | 0 | 0.0% |
| $10,000 to $14,999 | 0 | 0.0% |
| $15,000 to $24,999 | 0 | 0.0% |
| $25,000 to $34,999 | 0 | 0.0% |
| $35,000 to $49,999 | 1 | 9.1% |
| $50,000 to $74,999 | 3 | 27.3% |
| $75,000 to $99,999 | 0 | 0.0% |
| $100,000 to $149,999 | 4 | 36.4% |
| $150,000 to $199,999 | 3 | 27.3% |
| $200,000+ | 0 | 0.0% |
Family Income by Famaliy Size in Sherman
3-person families (5 | 45.5%) account for the highest median family income in Sherman with $120,417 per family, while 3-person families (5 | 45.5%) have the highest median income of $40,139 per family member.
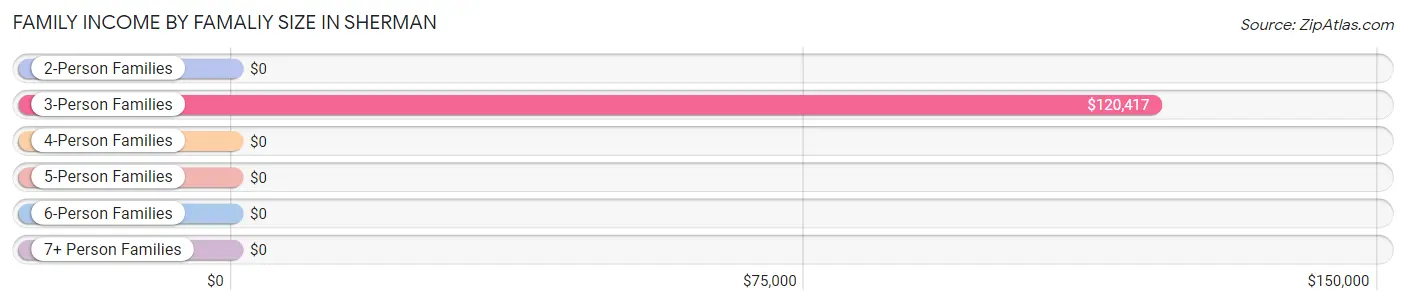
| Income Bracket | # Families | Median Income |
| 2-Person Families | 3 (27.3%) | $0 |
| 3-Person Families | 5 (45.5%) | $120,417 |
| 4-Person Families | 3 (27.3%) | $0 |
| 5-Person Families | 0 (0.0%) | $0 |
| 6-Person Families | 0 (0.0%) | $0 |
| 7+ Person Families | 0 (0.0%) | $0 |
| Total | 11 (100.0%) | $121,250 |
Family Income by Number of Earners in Sherman
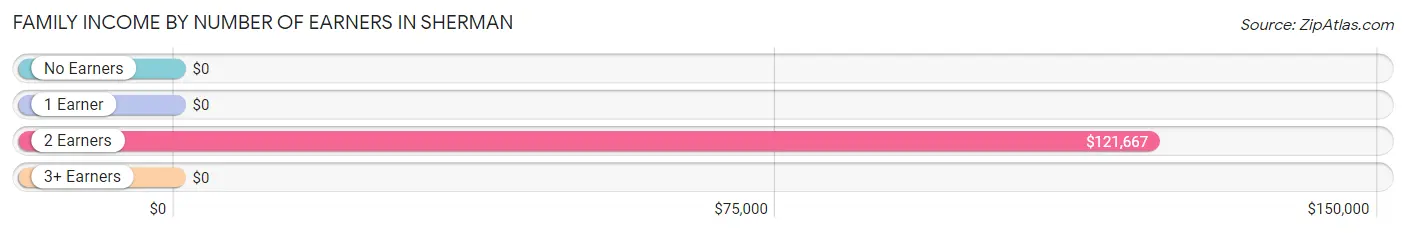
| Number of Earners | # Families | Median Income |
| No Earners | 0 (0.0%) | $0 |
| 1 Earner | 1 (9.1%) | $0 |
| 2 Earners | 10 (90.9%) | $121,667 |
| 3+ Earners | 0 (0.0%) | $0 |
| Total | 11 (100.0%) | $121,250 |
Household Income in Sherman
Household Income Brackets in Sherman
With 5 households falling in the category, the $15,000 to $24,999 income range is the most frequent in Sherman, accounting for 20.8% of all households.
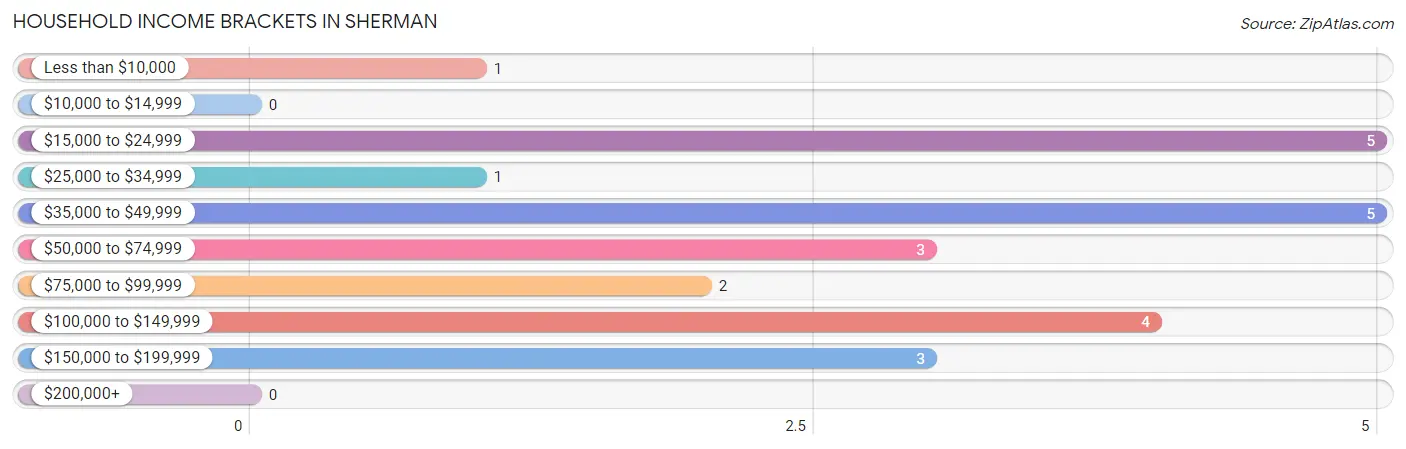
| Income Bracket | # Households | % Households |
| Less than $10,000 | 1 | 4.2% |
| $10,000 to $14,999 | 0 | 0.0% |
| $15,000 to $24,999 | 5 | 20.8% |
| $25,000 to $34,999 | 1 | 4.2% |
| $35,000 to $49,999 | 5 | 20.8% |
| $50,000 to $74,999 | 3 | 12.5% |
| $75,000 to $99,999 | 2 | 8.3% |
| $100,000 to $149,999 | 4 | 16.7% |
| $150,000 to $199,999 | 3 | 12.5% |
| $200,000+ | 0 | 0.0% |
Household Income by Householder Age in Sherman
The median household income in Sherman is $50,000, with the highest median household income of $21,563 found in the 65+ years age bracket for the primary householder. A total of 7 households (29.2%) fall into this category.
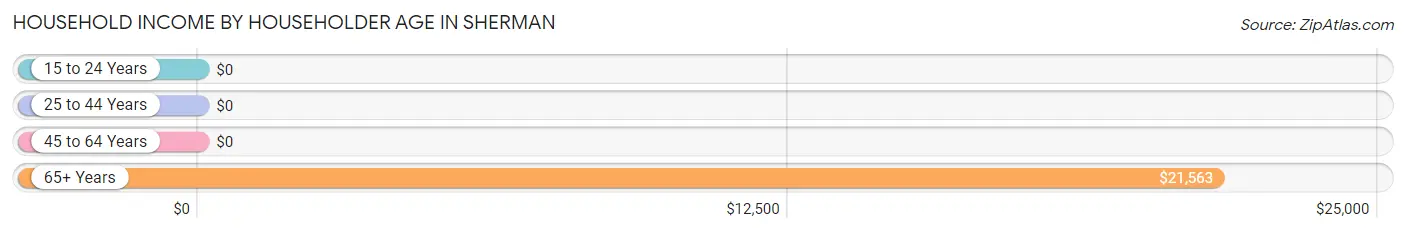
| Income Bracket | # Households | Median Income |
| 15 to 24 Years | 0 (0.0%) | $0 |
| 25 to 44 Years | 3 (12.5%) | $0 |
| 45 to 64 Years | 14 (58.3%) | $0 |
| 65+ Years | 7 (29.2%) | $21,563 |
| Total | 24 (100.0%) | $50,000 |
Poverty in Sherman
Income Below Poverty by Sex and Age in Sherman
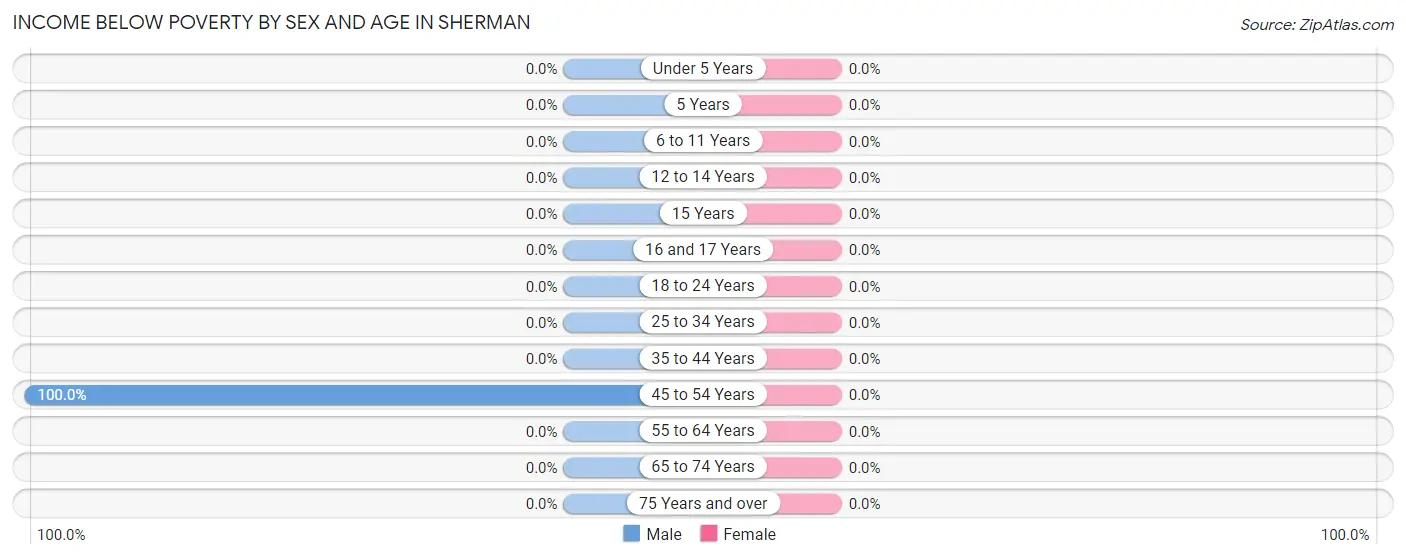
| Age Bracket | Male | Female |
| Under 5 Years | 0 (0.0%) | 0 (0.0%) |
| 5 Years | 0 (0.0%) | 0 (0.0%) |
| 6 to 11 Years | 0 (0.0%) | 0 (0.0%) |
| 12 to 14 Years | 0 (0.0%) | 0 (0.0%) |
| 15 Years | 0 (0.0%) | 0 (0.0%) |
| 16 and 17 Years | 0 (0.0%) | 0 (0.0%) |
| 18 to 24 Years | 0 (0.0%) | 0 (0.0%) |
| 25 to 34 Years | 0 (0.0%) | 0 (0.0%) |
| 35 to 44 Years | 0 (0.0%) | 0 (0.0%) |
| 45 to 54 Years | 1 (100.0%) | 0 (0.0%) |
| 55 to 64 Years | 0 (0.0%) | 0 (0.0%) |
| 65 to 74 Years | 0 (0.0%) | 0 (0.0%) |
| 75 Years and over | 0 (0.0%) | 0 (0.0%) |
| Total | 1 (3.2%) | 0 (0.0%) |
Income Above Poverty by Sex and Age in Sherman
According to the poverty statistics in Sherman, males aged under 5 years and females aged under 5 years are the age groups that are most secure financially, with 100.0% of males and 100.0% of females in these age groups living above the poverty line.
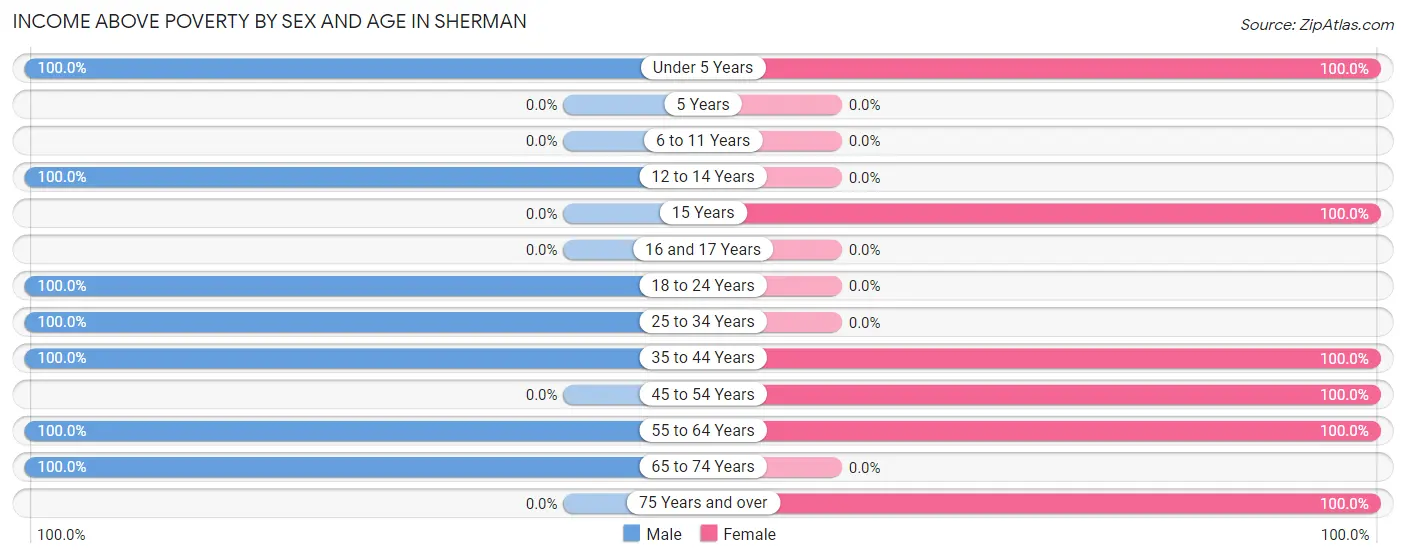
| Age Bracket | Male | Female |
| Under 5 Years | 2 (100.0%) | 2 (100.0%) |
| 5 Years | 0 (0.0%) | 0 (0.0%) |
| 6 to 11 Years | 0 (0.0%) | 0 (0.0%) |
| 12 to 14 Years | 1 (100.0%) | 0 (0.0%) |
| 15 Years | 0 (0.0%) | 2 (100.0%) |
| 16 and 17 Years | 0 (0.0%) | 0 (0.0%) |
| 18 to 24 Years | 4 (100.0%) | 0 (0.0%) |
| 25 to 34 Years | 5 (100.0%) | 0 (0.0%) |
| 35 to 44 Years | 1 (100.0%) | 3 (100.0%) |
| 45 to 54 Years | 0 (0.0%) | 3 (100.0%) |
| 55 to 64 Years | 9 (100.0%) | 9 (100.0%) |
| 65 to 74 Years | 8 (100.0%) | 0 (0.0%) |
| 75 Years and over | 0 (0.0%) | 1 (100.0%) |
| Total | 30 (96.8%) | 20 (100.0%) |
Income Below Poverty Among Married-Couple Families in Sherman
| Children | Above Poverty | Below Poverty |
| No Children | 8 (100.0%) | 0 (0.0%) |
| 1 or 2 Children | 3 (100.0%) | 0 (0.0%) |
| 3 or 4 Children | 0 (0.0%) | 0 (0.0%) |
| 5 or more Children | 0 (0.0%) | 0 (0.0%) |
| Total | 11 (100.0%) | 0 (0.0%) |
Income Below Poverty Among Single-Parent Households in Sherman
| Children | Single Father | Single Mother |
| No Children | 0 (0.0%) | 0 (0.0%) |
| 1 or 2 Children | 0 (0.0%) | 0 (0.0%) |
| 3 or 4 Children | 0 (0.0%) | 0 (0.0%) |
| 5 or more Children | 0 (0.0%) | 0 (0.0%) |
| Total | 0 (0.0%) | 0 (0.0%) |
Income Below Poverty Among Married-Couple vs Single-Parent Households in Sherman
| Children | Married-Couple Families | Single-Parent Households |
| No Children | 0 (0.0%) | 0 (0.0%) |
| 1 or 2 Children | 0 (0.0%) | 0 (0.0%) |
| 3 or 4 Children | 0 (0.0%) | 0 (0.0%) |
| 5 or more Children | 0 (0.0%) | 0 (0.0%) |
| Total | 0 (0.0%) | 0 (0.0%) |
Race in Sherman
The most populous races in Sherman are White / Caucasian (46 | 90.2%), Two or more Races (5 | 9.8%), and Hispanic or Latino (3 | 5.9%).
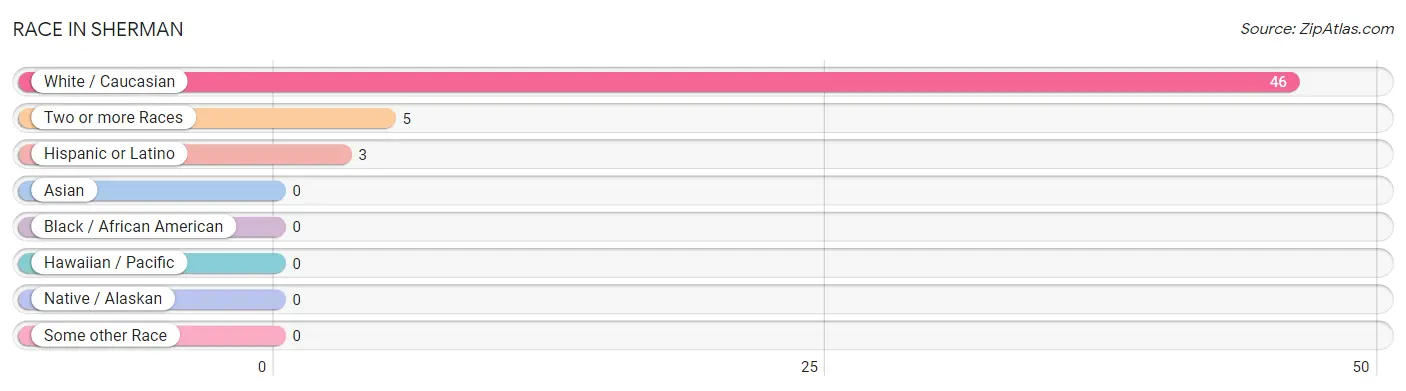
| Race | # Population | % Population |
| Asian | 0 | 0.0% |
| Black / African American | 0 | 0.0% |
| Hawaiian / Pacific | 0 | 0.0% |
| Hispanic or Latino | 3 | 5.9% |
| Native / Alaskan | 0 | 0.0% |
| White / Caucasian | 46 | 90.2% |
| Two or more Races | 5 | 9.8% |
| Some other Race | 0 | 0.0% |
| Total | 51 | 100.0% |
Ancestry in Sherman
The most populous ancestries reported in Sherman are German (26 | 51.0%), Norwegian (9 | 17.6%), Dutch (8 | 15.7%), Irish (7 | 13.7%), and American (3 | 5.9%), together accounting for 103.9% of all Sherman residents.
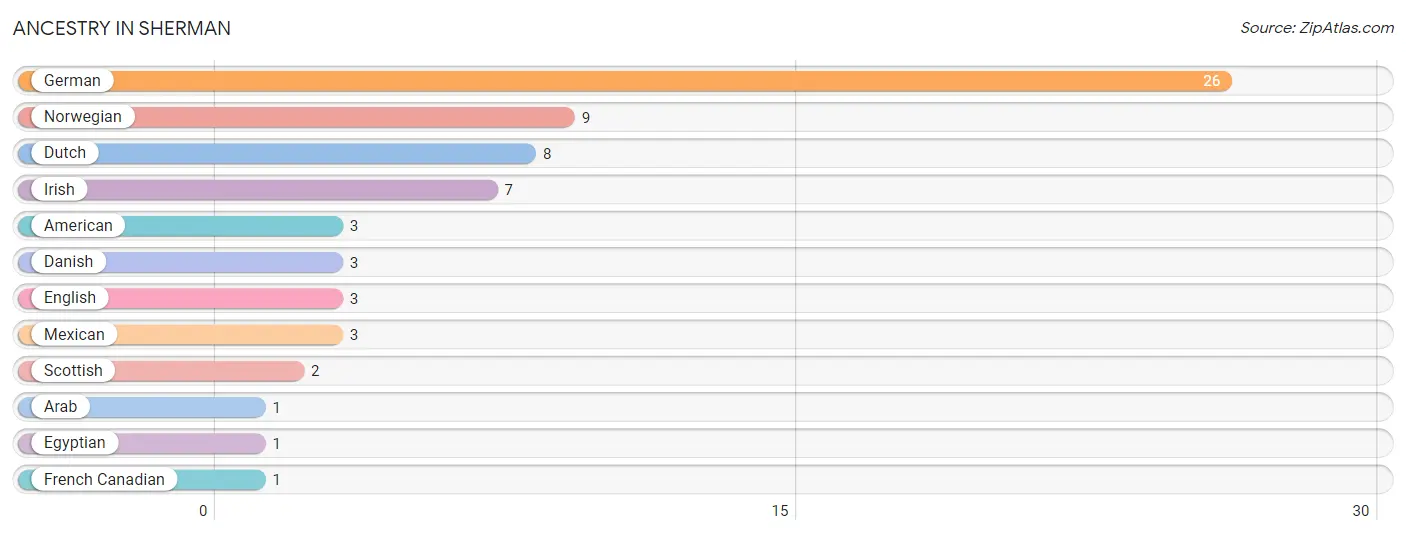
| Ancestry | # Population | % Population |
| American | 3 | 5.9% |
| Arab | 1 | 2.0% |
| Danish | 3 | 5.9% |
| Dutch | 8 | 15.7% |
| Egyptian | 1 | 2.0% |
| English | 3 | 5.9% |
| French Canadian | 1 | 2.0% |
| German | 26 | 51.0% |
| Irish | 7 | 13.7% |
| Mexican | 3 | 5.9% |
| Norwegian | 9 | 17.6% |
| Scottish | 2 | 3.9% | View All 12 Rows |
Immigrants in Sherman

| Immigration Origin | # Population | % Population | View All 0 Rows |
Sex and Age in Sherman
Sex and Age in Sherman
The most populous age groups in Sherman are 55 to 59 Years (7 | 22.6%) for men and 55 to 59 Years (5 | 25.0%) for women.
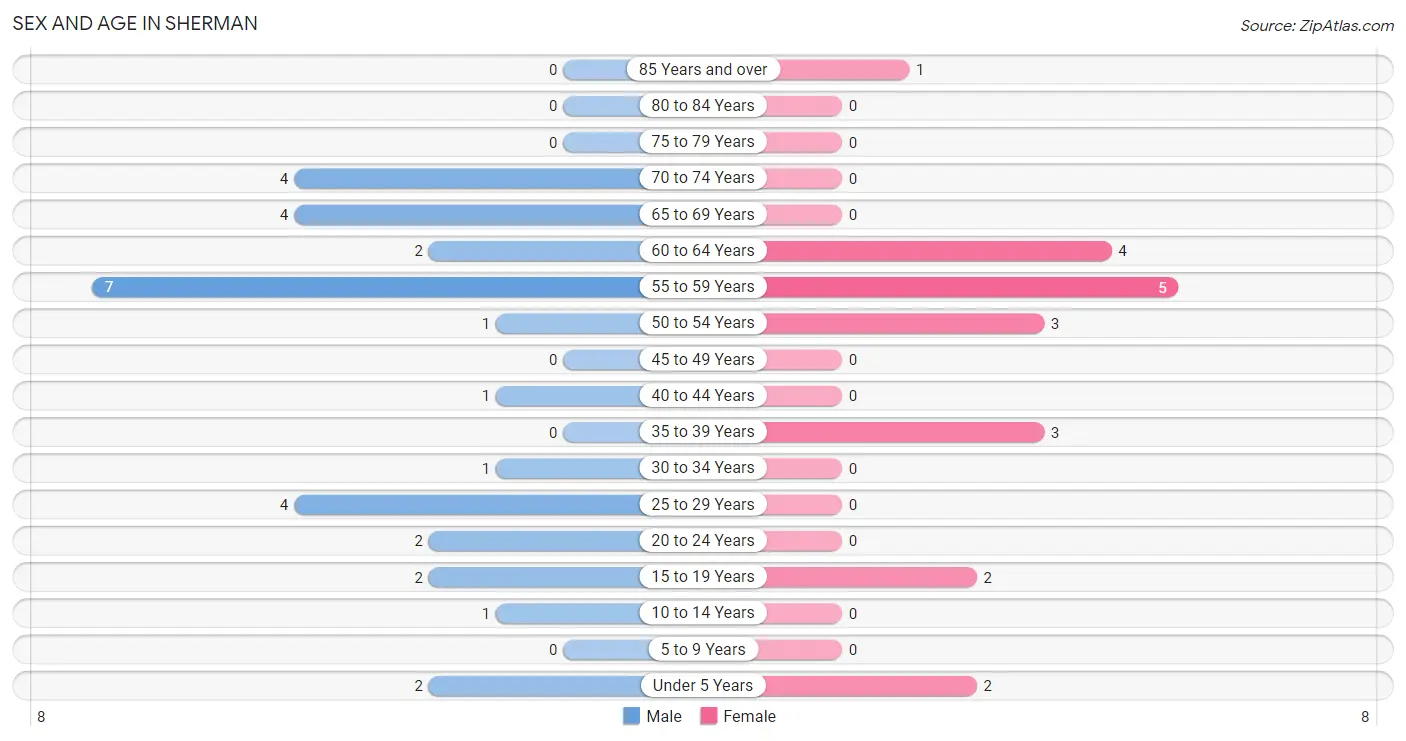
| Age Bracket | Male | Female |
| Under 5 Years | 2 (6.5%) | 2 (10.0%) |
| 5 to 9 Years | 0 (0.0%) | 0 (0.0%) |
| 10 to 14 Years | 1 (3.2%) | 0 (0.0%) |
| 15 to 19 Years | 2 (6.5%) | 2 (10.0%) |
| 20 to 24 Years | 2 (6.5%) | 0 (0.0%) |
| 25 to 29 Years | 4 (12.9%) | 0 (0.0%) |
| 30 to 34 Years | 1 (3.2%) | 0 (0.0%) |
| 35 to 39 Years | 0 (0.0%) | 3 (15.0%) |
| 40 to 44 Years | 1 (3.2%) | 0 (0.0%) |
| 45 to 49 Years | 0 (0.0%) | 0 (0.0%) |
| 50 to 54 Years | 1 (3.2%) | 3 (15.0%) |
| 55 to 59 Years | 7 (22.6%) | 5 (25.0%) |
| 60 to 64 Years | 2 (6.5%) | 4 (20.0%) |
| 65 to 69 Years | 4 (12.9%) | 0 (0.0%) |
| 70 to 74 Years | 4 (12.9%) | 0 (0.0%) |
| 75 to 79 Years | 0 (0.0%) | 0 (0.0%) |
| 80 to 84 Years | 0 (0.0%) | 0 (0.0%) |
| 85 Years and over | 0 (0.0%) | 1 (5.0%) |
| Total | 31 (100.0%) | 20 (100.0%) |
Families and Households in Sherman
Median Family Size in Sherman
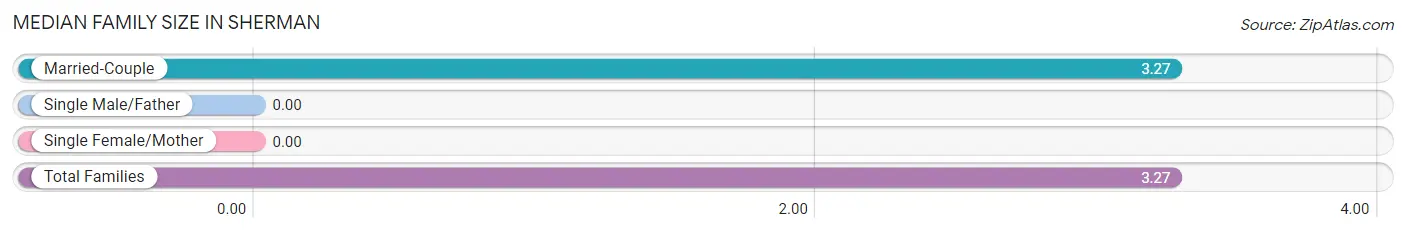
| Family Type | # Families | Family Size |
| Married-Couple | 11 (100.0%) | 3.27 |
| Single Male/Father | 0 (0.0%) | - |
| Single Female/Mother | 0 (0.0%) | - |
| Total Families | 11 (100.0%) | 3.27 |
Median Household Size in Sherman
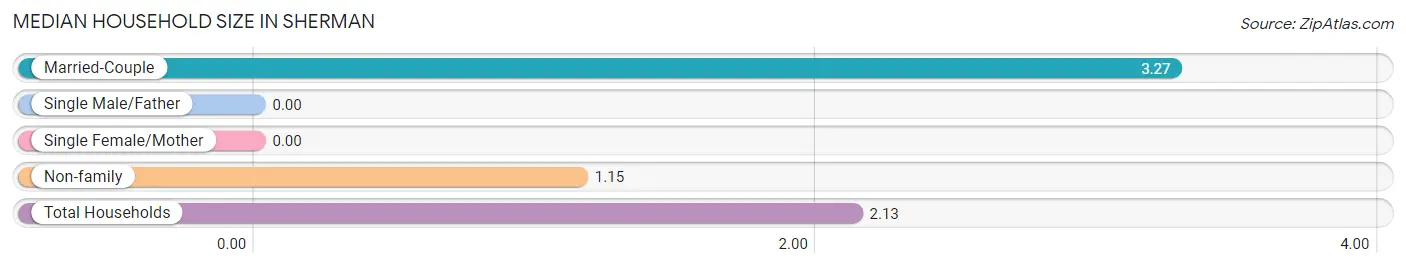
| Household Type | # Households | Household Size |
| Married-Couple | 11 (45.8%) | 3.27 |
| Single Male/Father | 0 (0.0%) | - |
| Single Female/Mother | 0 (0.0%) | - |
| Non-family | 13 (54.2%) | 1.15 |
| Total Households | 24 (100.0%) | 2.13 |
Household Size by Marriage Status in Sherman
Out of a total of 24 households in Sherman, 11 (45.8%) are family households, while 13 (54.2%) are nonfamily households. The most numerous type of family households are 3-person households, comprising 5, and the most common type of nonfamily households are 1-person households, comprising 11.
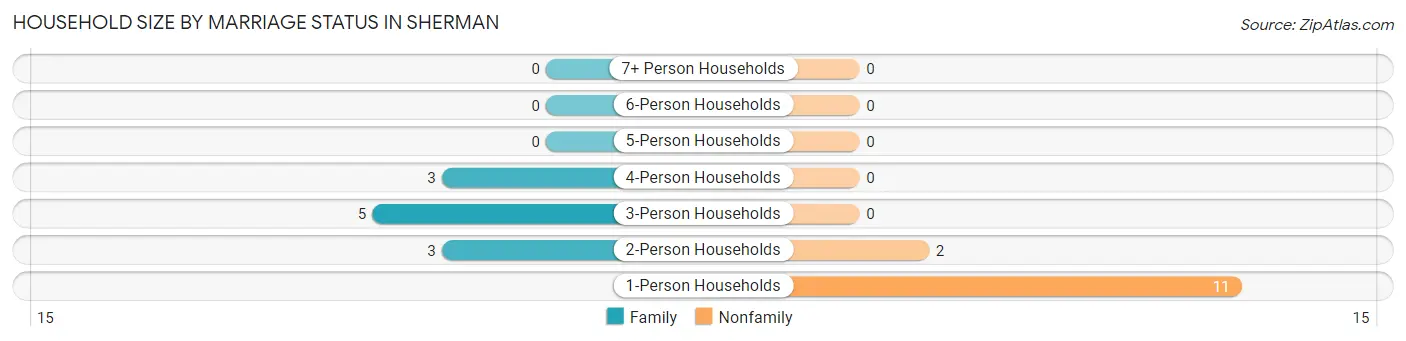
| Household Size | Family Households | Nonfamily Households |
| 1-Person Households | - | 11 (45.8%) |
| 2-Person Households | 3 (12.5%) | 2 (8.3%) |
| 3-Person Households | 5 (20.8%) | 0 (0.0%) |
| 4-Person Households | 3 (12.5%) | 0 (0.0%) |
| 5-Person Households | 0 (0.0%) | 0 (0.0%) |
| 6-Person Households | 0 (0.0%) | 0 (0.0%) |
| 7+ Person Households | 0 (0.0%) | 0 (0.0%) |
| Total | 11 (45.8%) | 13 (54.2%) |
Female Fertility in Sherman
Fertility by Age in Sherman
Average fertility rate in Sherman is 200.0 births per 1,000 women. Women in the age bracket of 35 to 50 years have the highest fertility rate with 333.0 births per 1,000 women. Women in the age bracket of 35 to 50 years acount for 100.0% of all women with births.
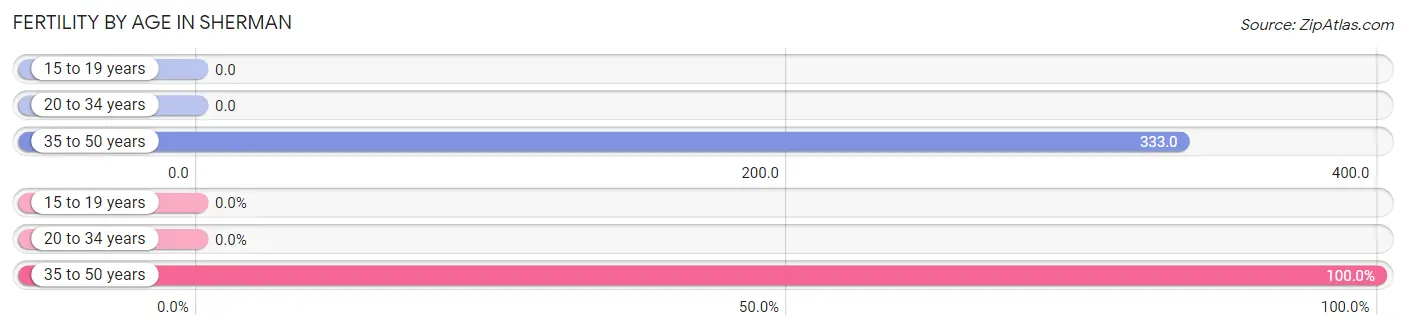
| Age Bracket | Women with Births | Births / 1,000 Women |
| 15 to 19 years | 0 (0.0%) | 0.0 |
| 20 to 34 years | 0 (0.0%) | 0.0 |
| 35 to 50 years | 1 (100.0%) | 333.0 |
| Total | 1 (100.0%) | 200.0 |
Fertility by Age by Marriage Status in Sherman
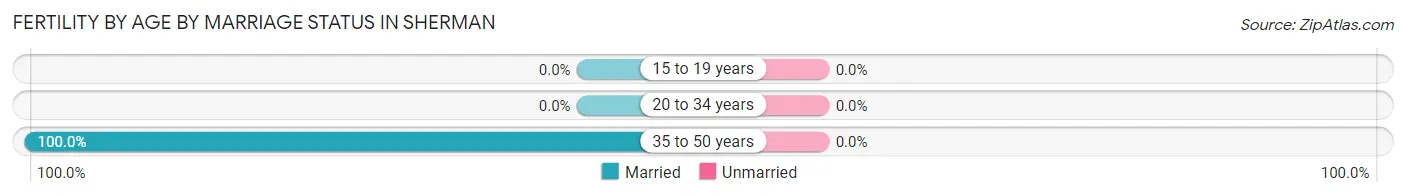
| Age Bracket | Married | Unmarried |
| 15 to 19 years | 0 (0.0%) | 0 (0.0%) |
| 20 to 34 years | 0 (0.0%) | 0 (0.0%) |
| 35 to 50 years | 1 (100.0%) | 0 (0.0%) |
| Total | 1 (100.0%) | 0 (0.0%) |
Fertility by Education in Sherman
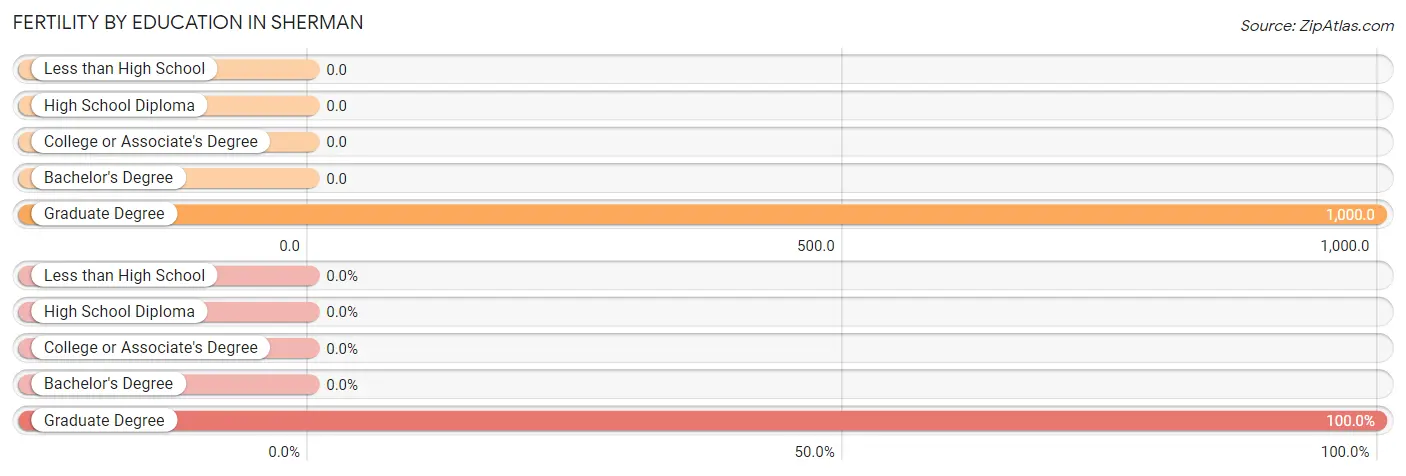
| Educational Attainment | Women with Births | Births / 1,000 Women |
| Less than High School | 0 (0.0%) | 0.0 |
| High School Diploma | 0 (0.0%) | 0.0 |
| College or Associate's Degree | 0 (0.0%) | 0.0 |
| Bachelor's Degree | 0 (0.0%) | 0.0 |
| Graduate Degree | 1 (100.0%) | 1,000.0 |
| Total | 1 (100.0%) | 200.0 |
Fertility by Education by Marriage Status in Sherman
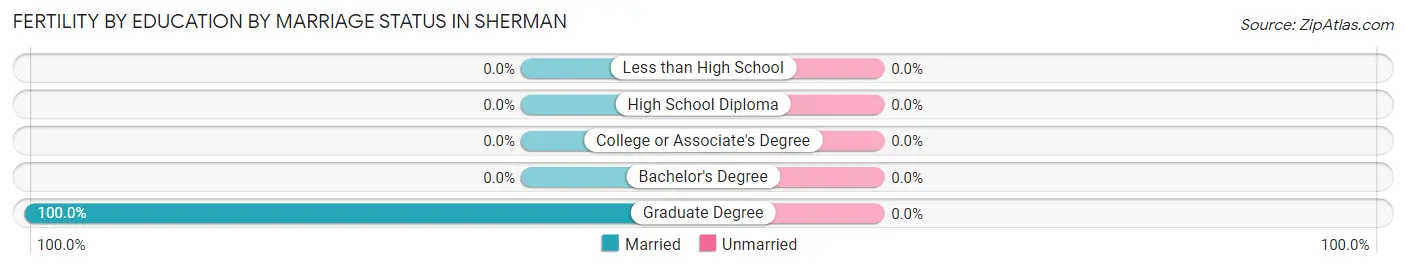
| Educational Attainment | Married | Unmarried |
| Less than High School | 0 (0.0%) | 0 (0.0%) |
| High School Diploma | 0 (0.0%) | 0 (0.0%) |
| College or Associate's Degree | 0 (0.0%) | 0 (0.0%) |
| Bachelor's Degree | 0 (0.0%) | 0 (0.0%) |
| Graduate Degree | 1 (100.0%) | 0 (0.0%) |
| Total | 1 (100.0%) | 0 (0.0%) |
Employment Characteristics in Sherman
Employment by Class of Employer in Sherman
Among the 28 employed individuals in Sherman, private company employees (20 | 71.4%), self-employed (not incorporated) (4 | 14.3%), and self-employed (incorporated) (2 | 7.1%) make up the most common classes of employment.
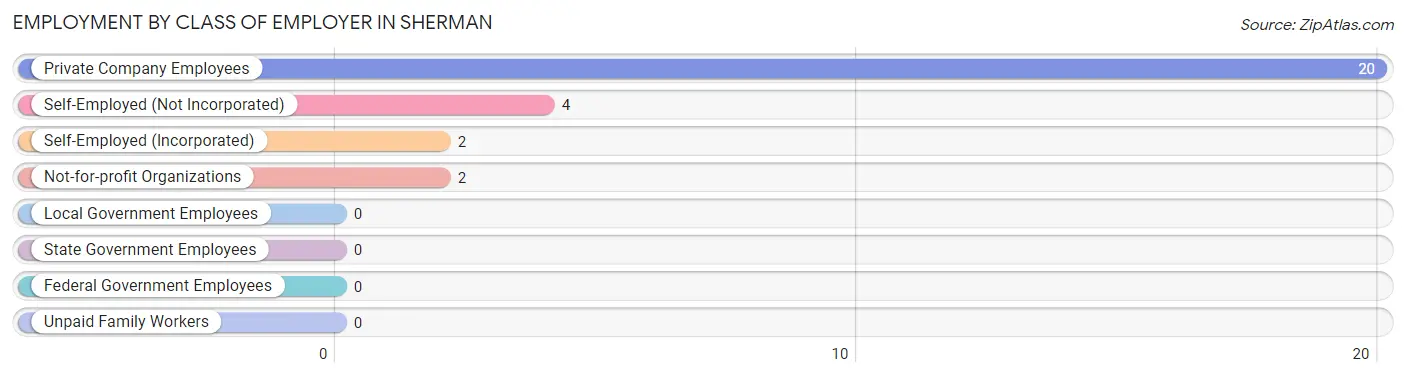
| Employer Class | # Employees | % Employees |
| Private Company Employees | 20 | 71.4% |
| Self-Employed (Incorporated) | 2 | 7.1% |
| Self-Employed (Not Incorporated) | 4 | 14.3% |
| Not-for-profit Organizations | 2 | 7.1% |
| Local Government Employees | 0 | 0.0% |
| State Government Employees | 0 | 0.0% |
| Federal Government Employees | 0 | 0.0% |
| Unpaid Family Workers | 0 | 0.0% |
| Total | 28 | 100.0% |
Employment Status by Age in Sherman
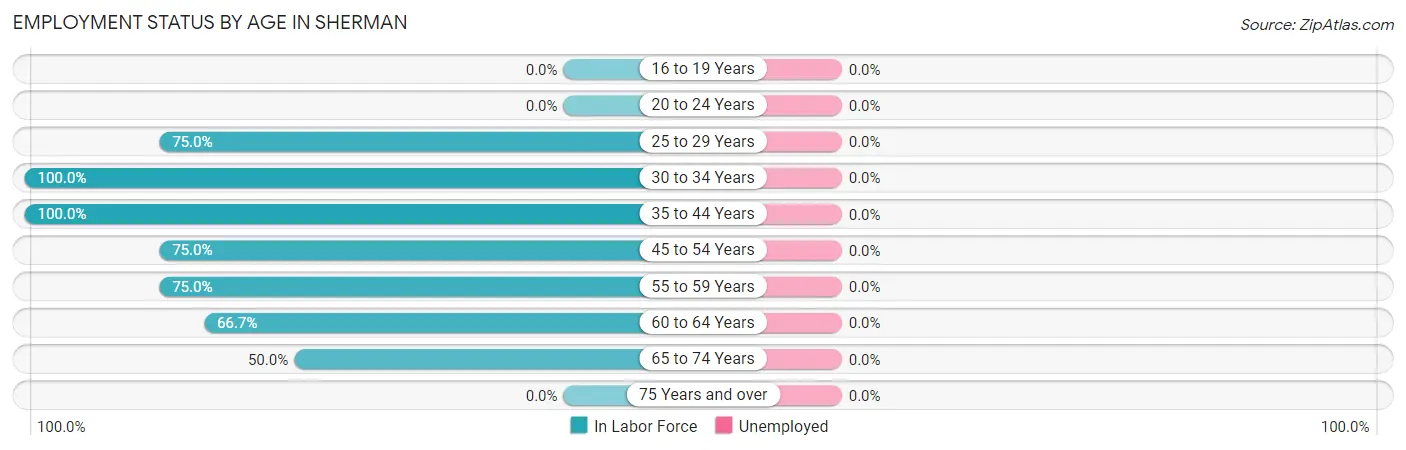
| Age Bracket | In Labor Force | Unemployed |
| 16 to 19 Years | 0 (0.0%) | 0 (0.0%) |
| 20 to 24 Years | 0 (0.0%) | 0 (0.0%) |
| 25 to 29 Years | 3 (75.0%) | 0 (0.0%) |
| 30 to 34 Years | 1 (100.0%) | 0 (0.0%) |
| 35 to 44 Years | 4 (100.0%) | 0 (0.0%) |
| 45 to 54 Years | 3 (75.0%) | 0 (0.0%) |
| 55 to 59 Years | 9 (75.0%) | 0 (0.0%) |
| 60 to 64 Years | 4 (66.7%) | 0 (0.0%) |
| 65 to 74 Years | 4 (50.0%) | 0 (0.0%) |
| 75 Years and over | 0 (0.0%) | 0 (0.0%) |
| Total | 28 (63.6%) | 0 (0.0%) |
Employment Status by Educational Attainment in Sherman
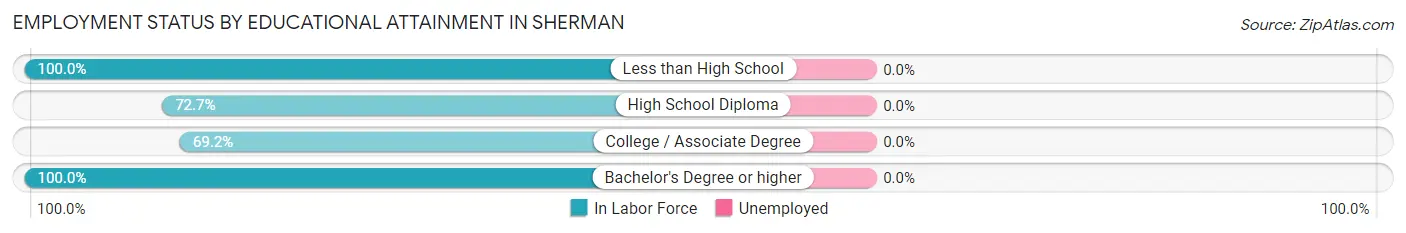
| Educational Attainment | In Labor Force | Unemployed |
| Less than High School | 3 (100.0%) | 0 (0.0%) |
| High School Diploma | 8 (72.7%) | 0 (0.0%) |
| College / Associate Degree | 9 (69.2%) | 0 (0.0%) |
| Bachelor's Degree or higher | 4 (100.0%) | 0 (0.0%) |
| Total | 24 (77.4%) | 0 (0.0%) |
Employment Occupations by Sex in Sherman
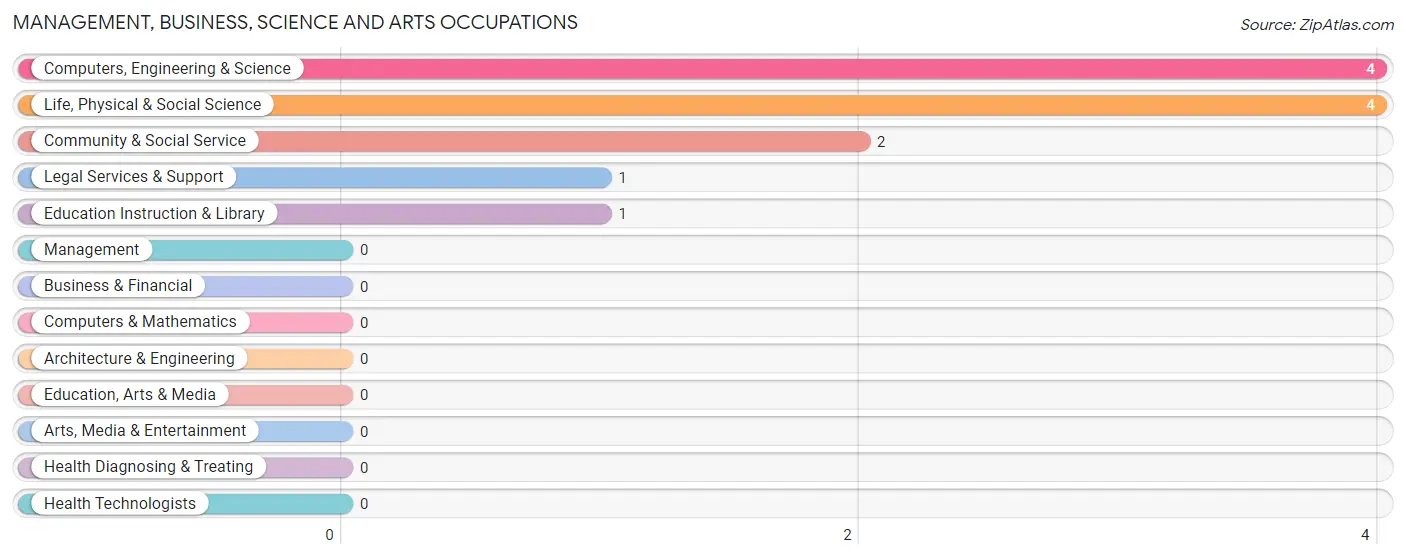
Management, Business, Science and Arts Occupations
The most common Management, Business, Science and Arts occupations in Sherman are Computers, Engineering & Science (4 | 14.3%), Life, Physical & Social Science (4 | 14.3%), Community & Social Service (2 | 7.1%), Legal Services & Support (1 | 3.6%), and Education Instruction & Library (1 | 3.6%).
Management, Business, Science and Arts Occupations by Sex
Within the Management, Business, Science and Arts occupations in Sherman, the most male-oriented occupations are Computers, Engineering & Science (75.0%), and Life, Physical & Social Science (75.0%), while the most female-oriented occupations are Community & Social Service (100.0%), Legal Services & Support (100.0%), and Education Instruction & Library (100.0%).
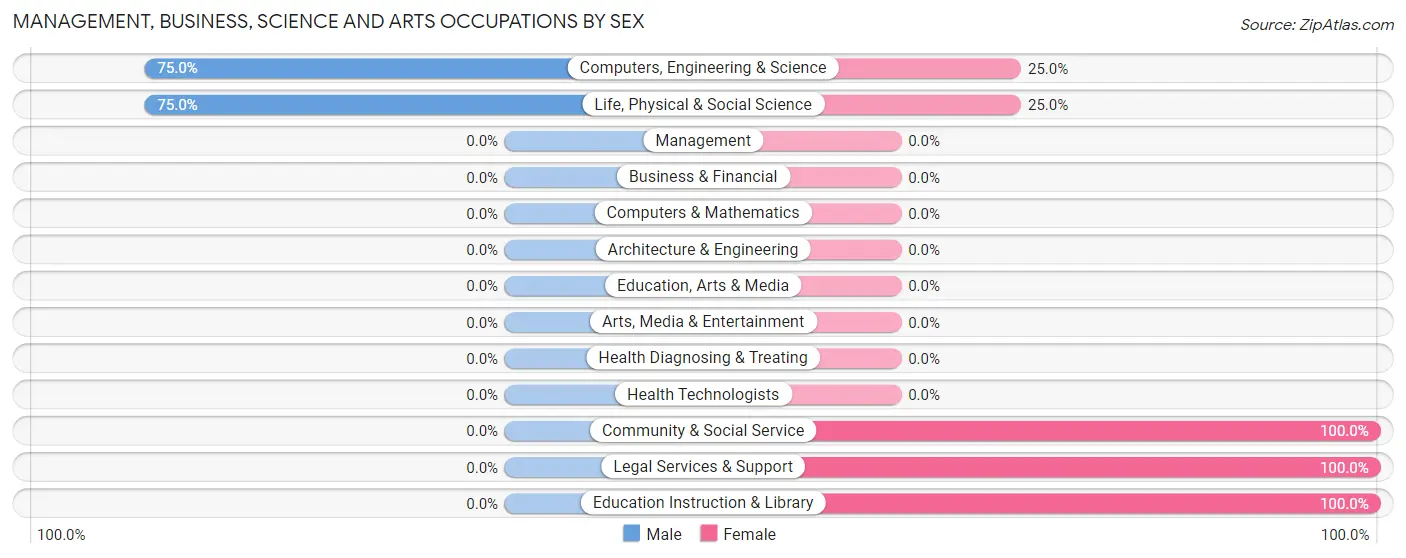
| Occupation | Male | Female |
| Management | 0 (0.0%) | 0 (0.0%) |
| Business & Financial | 0 (0.0%) | 0 (0.0%) |
| Computers, Engineering & Science | 3 (75.0%) | 1 (25.0%) |
| Computers & Mathematics | 0 (0.0%) | 0 (0.0%) |
| Architecture & Engineering | 0 (0.0%) | 0 (0.0%) |
| Life, Physical & Social Science | 3 (75.0%) | 1 (25.0%) |
| Community & Social Service | 0 (0.0%) | 2 (100.0%) |
| Education, Arts & Media | 0 (0.0%) | 0 (0.0%) |
| Legal Services & Support | 0 (0.0%) | 1 (100.0%) |
| Education Instruction & Library | 0 (0.0%) | 1 (100.0%) |
| Arts, Media & Entertainment | 0 (0.0%) | 0 (0.0%) |
| Health Diagnosing & Treating | 0 (0.0%) | 0 (0.0%) |
| Health Technologists | 0 (0.0%) | 0 (0.0%) |
| Total (Category) | 3 (50.0%) | 3 (50.0%) |
| Total (Overall) | 18 (64.3%) | 10 (35.7%) |
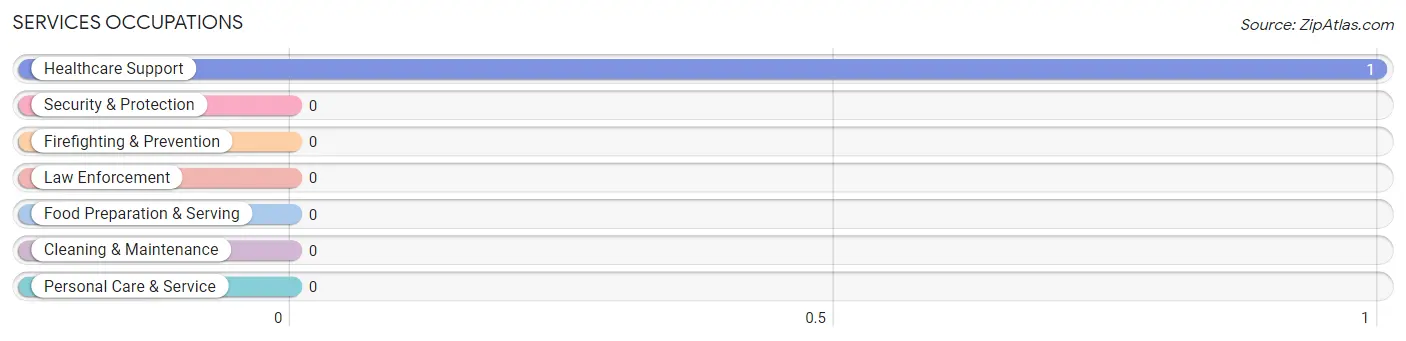
Services Occupations
The most common Services occupations in Sherman are , and Healthcare Support (1 | 3.6%).
Services Occupations by Sex
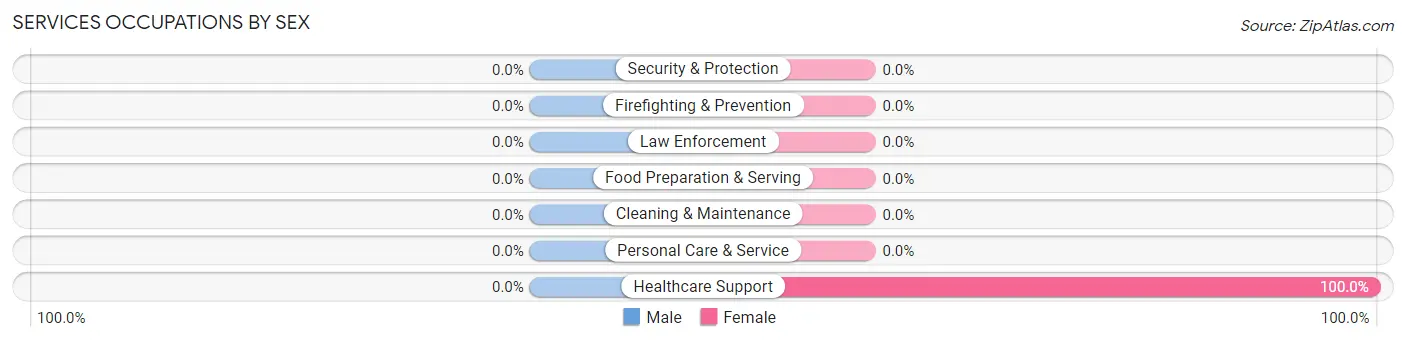
| Occupation | Male | Female |
| Healthcare Support | 0 (0.0%) | 1 (100.0%) |
| Security & Protection | 0 (0.0%) | 0 (0.0%) |
| Firefighting & Prevention | 0 (0.0%) | 0 (0.0%) |
| Law Enforcement | 0 (0.0%) | 0 (0.0%) |
| Food Preparation & Serving | 0 (0.0%) | 0 (0.0%) |
| Cleaning & Maintenance | 0 (0.0%) | 0 (0.0%) |
| Personal Care & Service | 0 (0.0%) | 0 (0.0%) |
| Total (Category) | 0 (0.0%) | 1 (100.0%) |
| Total (Overall) | 18 (64.3%) | 10 (35.7%) |
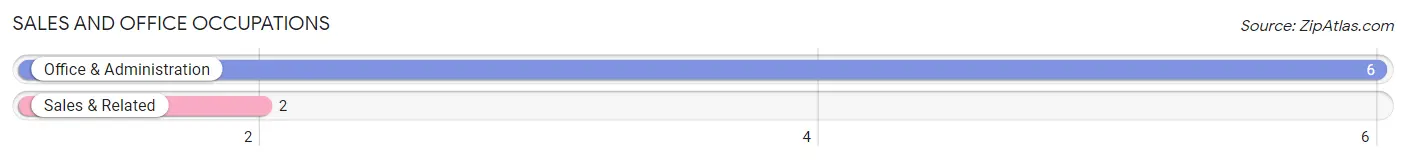
Sales and Office Occupations
The most common Sales and Office occupations in Sherman are Office & Administration (6 | 21.4%), and Sales & Related (2 | 7.1%).
Sales and Office Occupations by Sex

| Occupation | Male | Female |
| Sales & Related | 2 (100.0%) | 0 (0.0%) |
| Office & Administration | 0 (0.0%) | 6 (100.0%) |
| Total (Category) | 2 (25.0%) | 6 (75.0%) |
| Total (Overall) | 18 (64.3%) | 10 (35.7%) |
Natural Resources, Construction and Maintenance Occupations
The most common Natural Resources, Construction and Maintenance occupations in Sherman are , and Installation, Maintenance & Repair (2 | 7.1%).
Natural Resources, Construction and Maintenance Occupations by Sex
| Occupation | Male | Female |
| Farming, Fishing & Forestry | 0 (0.0%) | 0 (0.0%) |
| Construction & Extraction | 0 (0.0%) | 0 (0.0%) |
| Installation, Maintenance & Repair | 2 (100.0%) | 0 (0.0%) |
| Total (Category) | 2 (100.0%) | 0 (0.0%) |
| Total (Overall) | 18 (64.3%) | 10 (35.7%) |
Production, Transportation and Moving Occupations
The most common Production, Transportation and Moving occupations in Sherman are Transportation (7 | 25.0%), Production (3 | 10.7%), and Material Moving (1 | 3.6%).
Production, Transportation and Moving Occupations by Sex
| Occupation | Male | Female |
| Production | 3 (100.0%) | 0 (0.0%) |
| Transportation | 7 (100.0%) | 0 (0.0%) |
| Material Moving | 1 (100.0%) | 0 (0.0%) |
| Total (Category) | 11 (100.0%) | 0 (0.0%) |
| Total (Overall) | 18 (64.3%) | 10 (35.7%) |
Employment Industries by Sex in Sherman
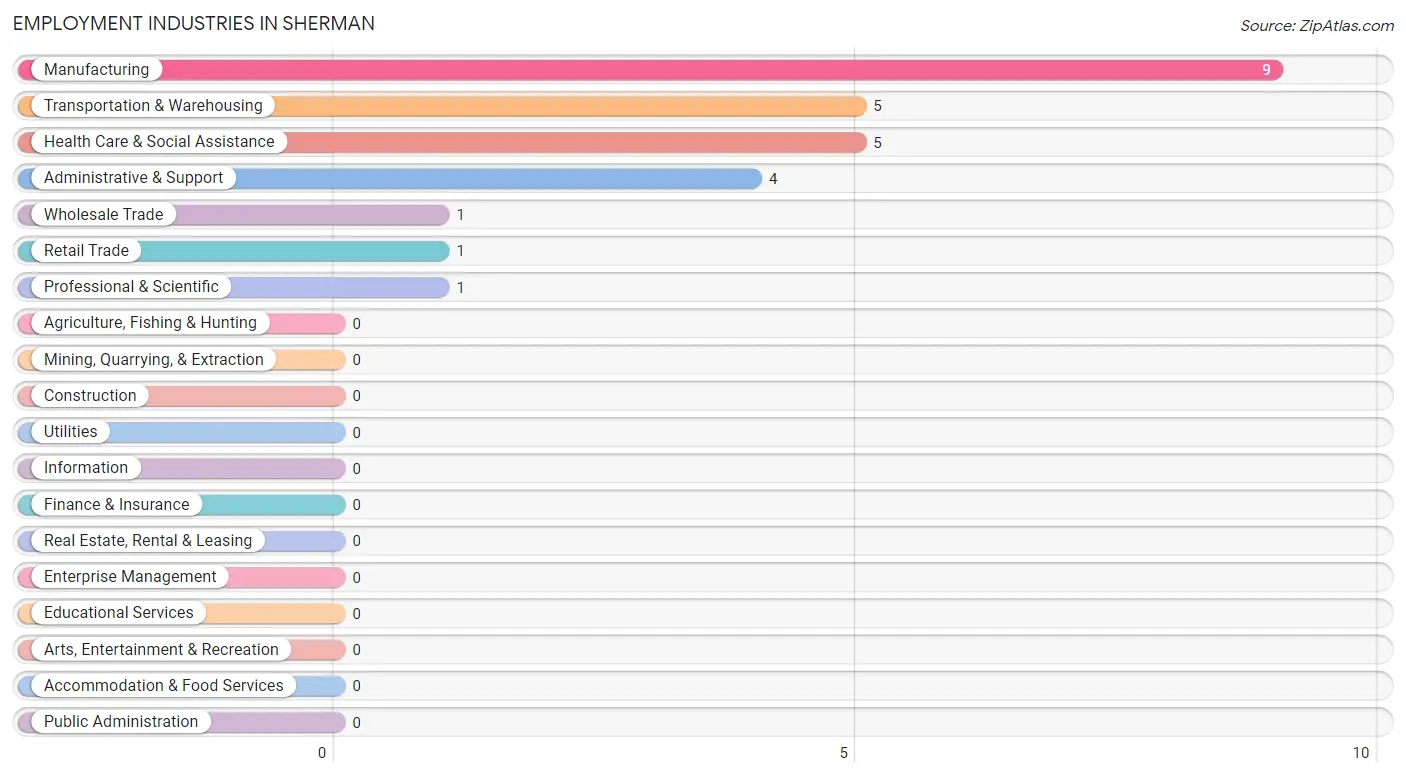
Employment Industries in Sherman
The major employment industries in Sherman include Manufacturing (9 | 32.1%), Transportation & Warehousing (5 | 17.9%), Health Care & Social Assistance (5 | 17.9%), Administrative & Support (4 | 14.3%), and Wholesale Trade (1 | 3.6%).
Employment Industries by Sex in Sherman
The Sherman industries that see more men than women are Manufacturing (100.0%), Wholesale Trade (100.0%), and Transportation & Warehousing (80.0%), whereas the industries that tend to have a higher number of women are Retail Trade (100.0%), Professional & Scientific (100.0%), and Health Care & Social Assistance (100.0%).
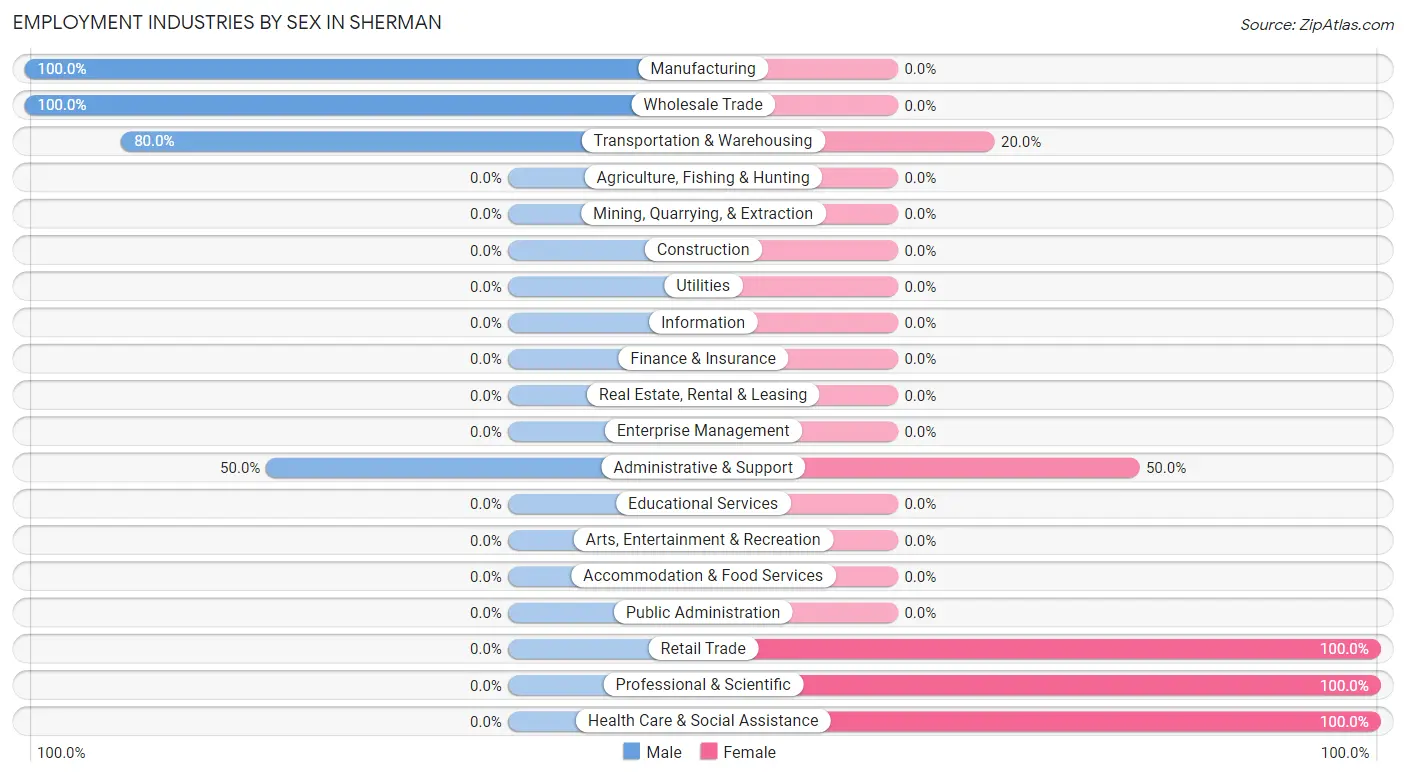
| Industry | Male | Female |
| Agriculture, Fishing & Hunting | 0 (0.0%) | 0 (0.0%) |
| Mining, Quarrying, & Extraction | 0 (0.0%) | 0 (0.0%) |
| Construction | 0 (0.0%) | 0 (0.0%) |
| Manufacturing | 9 (100.0%) | 0 (0.0%) |
| Wholesale Trade | 1 (100.0%) | 0 (0.0%) |
| Retail Trade | 0 (0.0%) | 1 (100.0%) |
| Transportation & Warehousing | 4 (80.0%) | 1 (20.0%) |
| Utilities | 0 (0.0%) | 0 (0.0%) |
| Information | 0 (0.0%) | 0 (0.0%) |
| Finance & Insurance | 0 (0.0%) | 0 (0.0%) |
| Real Estate, Rental & Leasing | 0 (0.0%) | 0 (0.0%) |
| Professional & Scientific | 0 (0.0%) | 1 (100.0%) |
| Enterprise Management | 0 (0.0%) | 0 (0.0%) |
| Administrative & Support | 2 (50.0%) | 2 (50.0%) |
| Educational Services | 0 (0.0%) | 0 (0.0%) |
| Health Care & Social Assistance | 0 (0.0%) | 5 (100.0%) |
| Arts, Entertainment & Recreation | 0 (0.0%) | 0 (0.0%) |
| Accommodation & Food Services | 0 (0.0%) | 0 (0.0%) |
| Public Administration | 0 (0.0%) | 0 (0.0%) |
| Total | 18 (64.3%) | 10 (35.7%) |
Education in Sherman
School Enrollment in Sherman
The most common levels of schooling among the 3 students in Sherman are high school (2 | 66.7%), and middle school (1 | 33.3%).
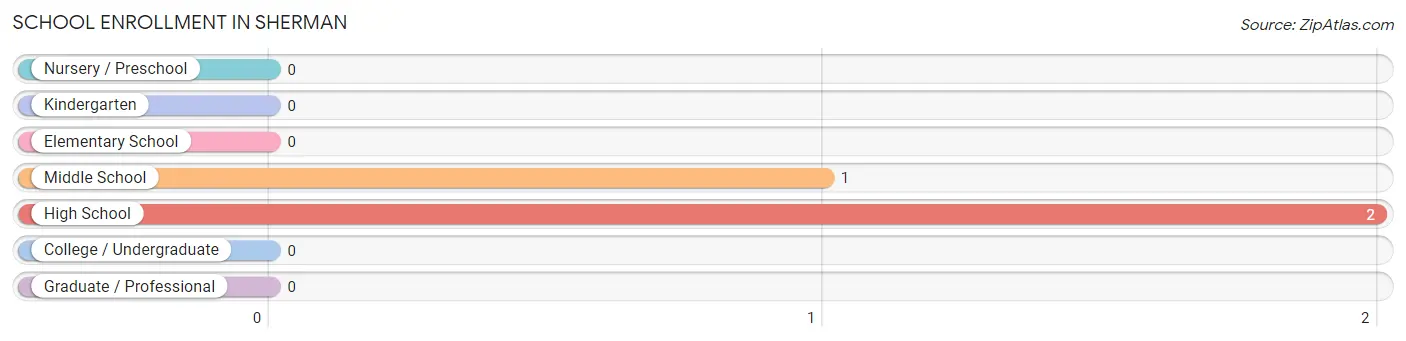
| School Level | # Students | % Students |
| Nursery / Preschool | 0 | 0.0% |
| Kindergarten | 0 | 0.0% |
| Elementary School | 0 | 0.0% |
| Middle School | 1 | 33.3% |
| High School | 2 | 66.7% |
| College / Undergraduate | 0 | 0.0% |
| Graduate / Professional | 0 | 0.0% |
| Total | 3 | 100.0% |
School Enrollment by Age by Funding Source in Sherman
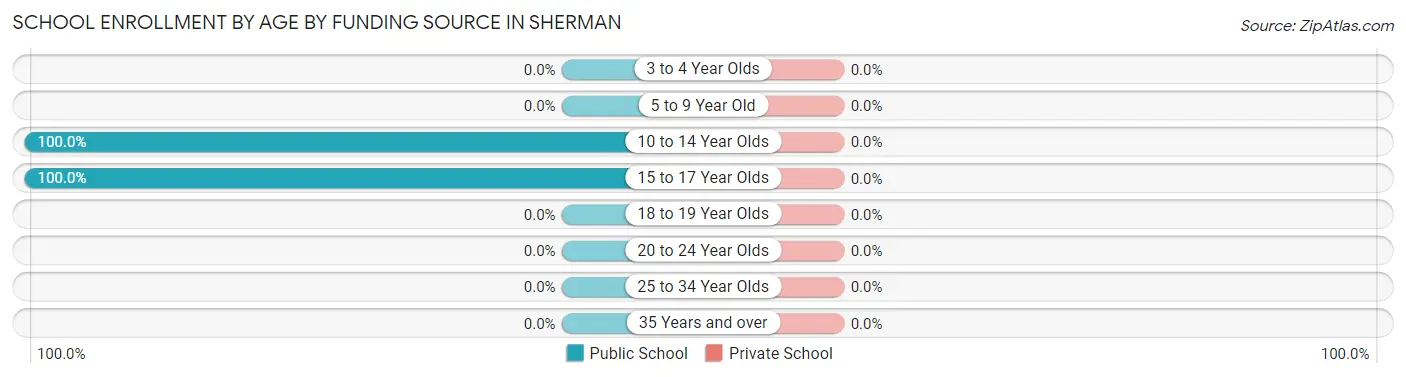
| Age Bracket | Public School | Private School |
| 3 to 4 Year Olds | 0 (0.0%) | 0 (0.0%) |
| 5 to 9 Year Old | 0 (0.0%) | 0 (0.0%) |
| 10 to 14 Year Olds | 1 (100.0%) | 0 (0.0%) |
| 15 to 17 Year Olds | 2 (100.0%) | 0 (0.0%) |
| 18 to 19 Year Olds | 0 (0.0%) | 0 (0.0%) |
| 20 to 24 Year Olds | 0 (0.0%) | 0 (0.0%) |
| 25 to 34 Year Olds | 0 (0.0%) | 0 (0.0%) |
| 35 Years and over | 0 (0.0%) | 0 (0.0%) |
| Total | 3 (100.0%) | 0 (0.0%) |
Educational Attainment by Field of Study in Sherman
Business (3 | 75.0%), and psychology (1 | 25.0%) are the most common fields of study among 4 individuals in Sherman who have obtained a bachelor's degree or higher.
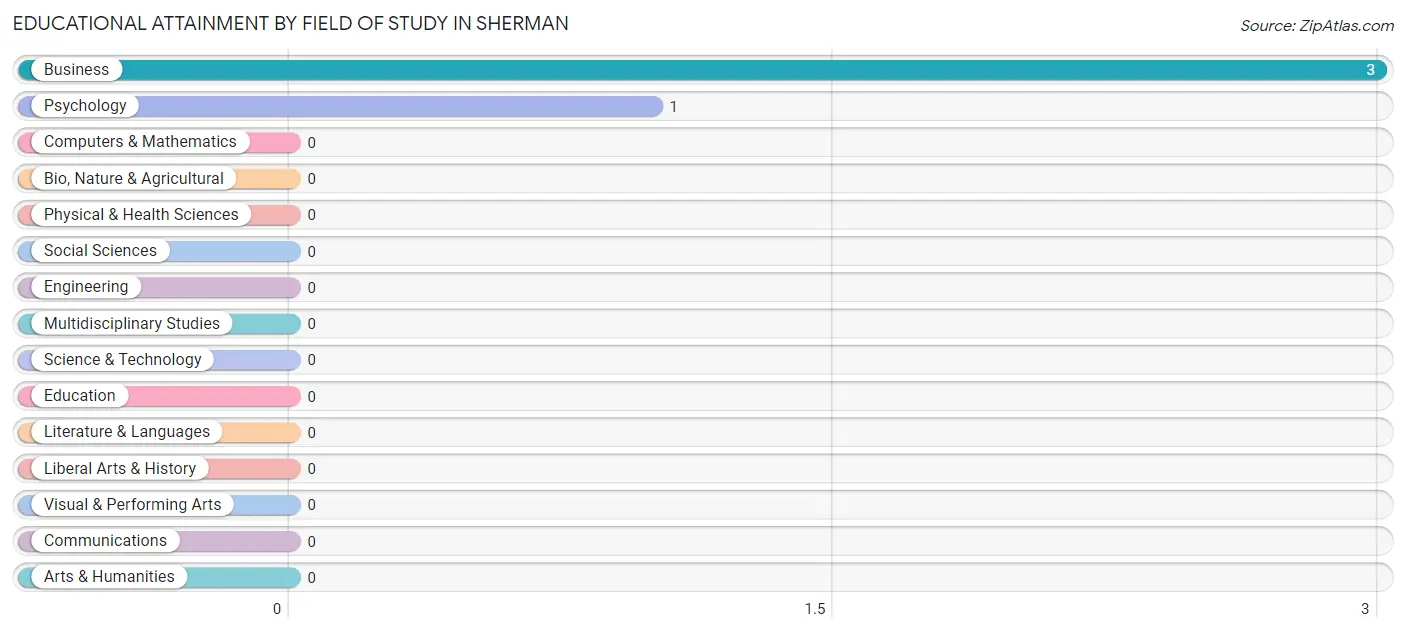
| Field of Study | # Graduates | % Graduates |
| Computers & Mathematics | 0 | 0.0% |
| Bio, Nature & Agricultural | 0 | 0.0% |
| Physical & Health Sciences | 0 | 0.0% |
| Psychology | 1 | 25.0% |
| Social Sciences | 0 | 0.0% |
| Engineering | 0 | 0.0% |
| Multidisciplinary Studies | 0 | 0.0% |
| Science & Technology | 0 | 0.0% |
| Business | 3 | 75.0% |
| Education | 0 | 0.0% |
| Literature & Languages | 0 | 0.0% |
| Liberal Arts & History | 0 | 0.0% |
| Visual & Performing Arts | 0 | 0.0% |
| Communications | 0 | 0.0% |
| Arts & Humanities | 0 | 0.0% |
| Total | 4 | 100.0% |
Transportation & Commute in Sherman
Vehicle Availability by Sex in Sherman
The most prevalent vehicle ownership categories in Sherman are males with 3 vehicles (13, accounting for 72.2%) and females with 3 vehicles (2, making up 130.0%).
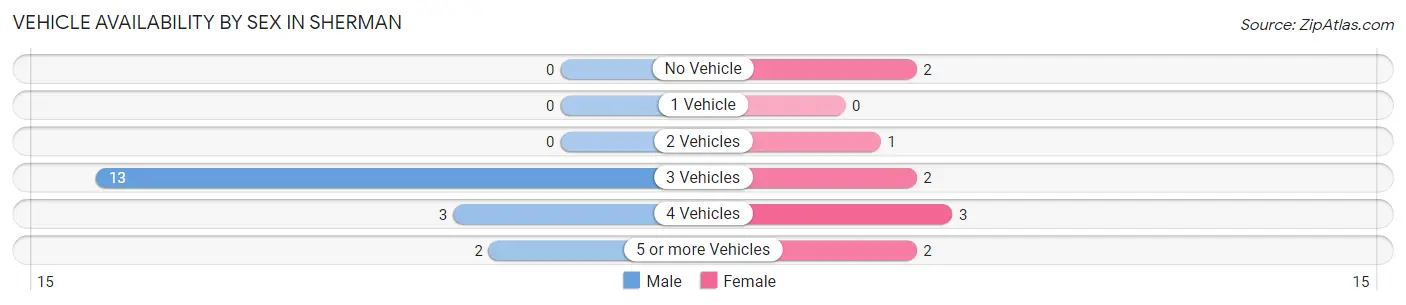
| Vehicles Available | Male | Female |
| No Vehicle | 0 (0.0%) | 2 (20.0%) |
| 1 Vehicle | 0 (0.0%) | 0 (0.0%) |
| 2 Vehicles | 0 (0.0%) | 1 (10.0%) |
| 3 Vehicles | 13 (72.2%) | 2 (20.0%) |
| 4 Vehicles | 3 (16.7%) | 3 (30.0%) |
| 5 or more Vehicles | 2 (11.1%) | 2 (20.0%) |
| Total | 18 (100.0%) | 10 (100.0%) |
Commute Time in Sherman
The most frequently occuring commute durations in Sherman are 30 to 34 minutes (7 commuters, 29.2%), 5 to 9 minutes (4 commuters, 16.7%), and 15 to 19 minutes (4 commuters, 16.7%).
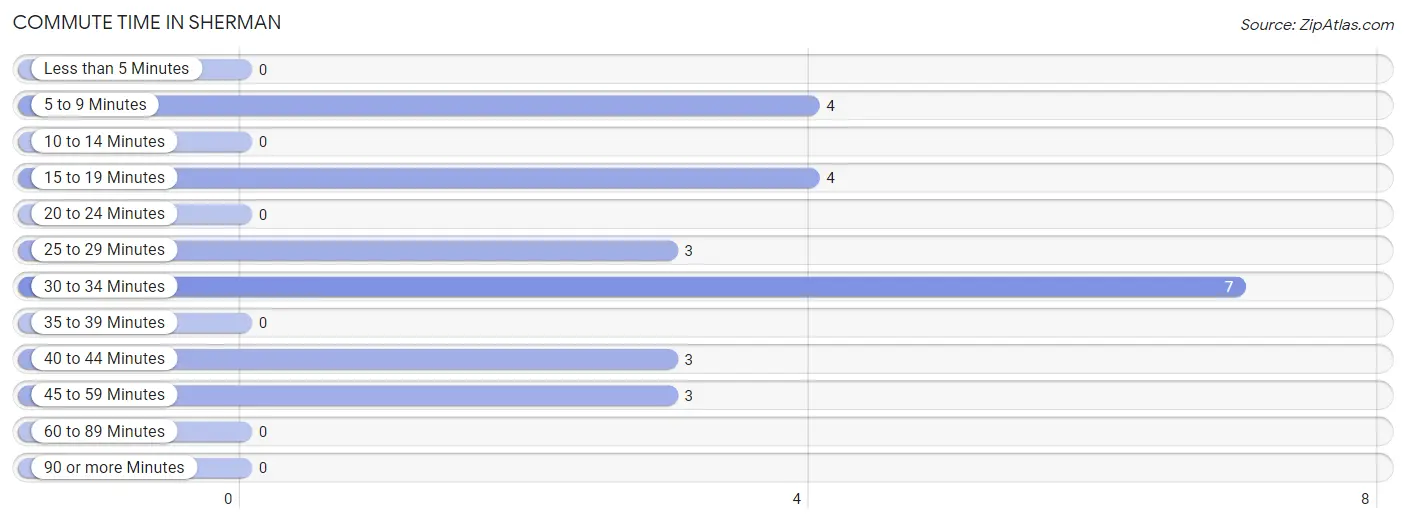
| Commute Time | # Commuters | % Commuters |
| Less than 5 Minutes | 0 | 0.0% |
| 5 to 9 Minutes | 4 | 16.7% |
| 10 to 14 Minutes | 0 | 0.0% |
| 15 to 19 Minutes | 4 | 16.7% |
| 20 to 24 Minutes | 0 | 0.0% |
| 25 to 29 Minutes | 3 | 12.5% |
| 30 to 34 Minutes | 7 | 29.2% |
| 35 to 39 Minutes | 0 | 0.0% |
| 40 to 44 Minutes | 3 | 12.5% |
| 45 to 59 Minutes | 3 | 12.5% |
| 60 to 89 Minutes | 0 | 0.0% |
| 90 or more Minutes | 0 | 0.0% |
Commute Time by Sex in Sherman
The most common commute times in Sherman are 5 to 9 minutes (4 commuters, 22.2%) for males and 30 to 34 minutes (4 commuters, 66.7%) for females.
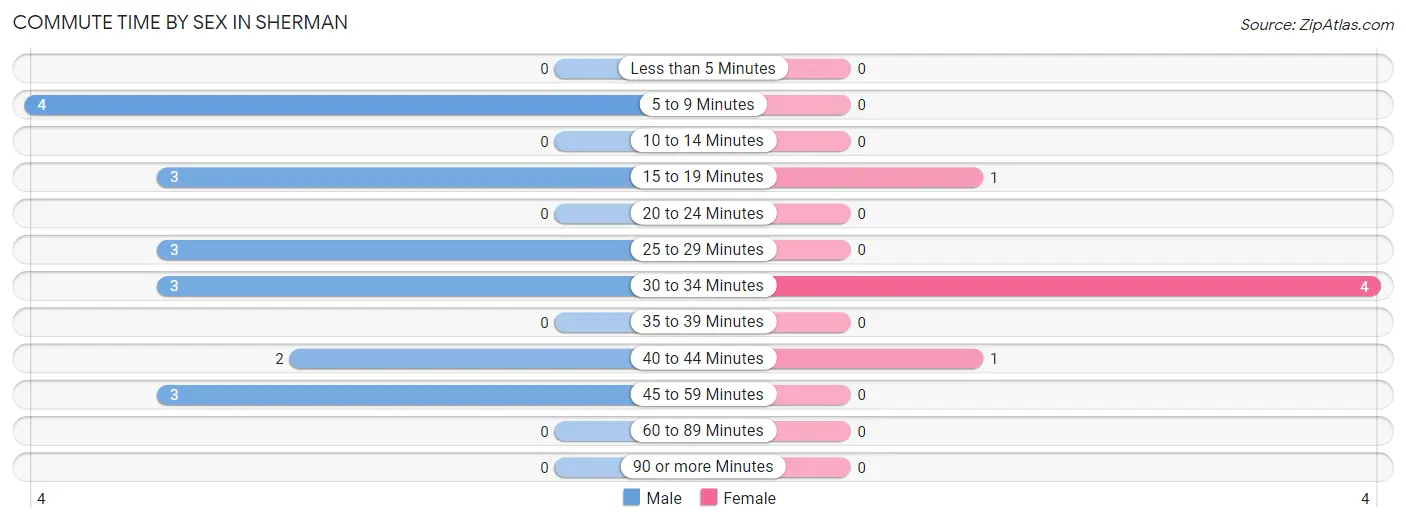
| Commute Time | Male | Female |
| Less than 5 Minutes | 0 (0.0%) | 0 (0.0%) |
| 5 to 9 Minutes | 4 (22.2%) | 0 (0.0%) |
| 10 to 14 Minutes | 0 (0.0%) | 0 (0.0%) |
| 15 to 19 Minutes | 3 (16.7%) | 1 (16.7%) |
| 20 to 24 Minutes | 0 (0.0%) | 0 (0.0%) |
| 25 to 29 Minutes | 3 (16.7%) | 0 (0.0%) |
| 30 to 34 Minutes | 3 (16.7%) | 4 (66.7%) |
| 35 to 39 Minutes | 0 (0.0%) | 0 (0.0%) |
| 40 to 44 Minutes | 2 (11.1%) | 1 (16.7%) |
| 45 to 59 Minutes | 3 (16.7%) | 0 (0.0%) |
| 60 to 89 Minutes | 0 (0.0%) | 0 (0.0%) |
| 90 or more Minutes | 0 (0.0%) | 0 (0.0%) |
Time of Departure to Work by Sex in Sherman
The most frequent times of departure to work in Sherman are 12:00 AM to 4:59 AM (5, 27.8%) for males and 6:30 AM to 6:59 AM (3, 50.0%) for females.
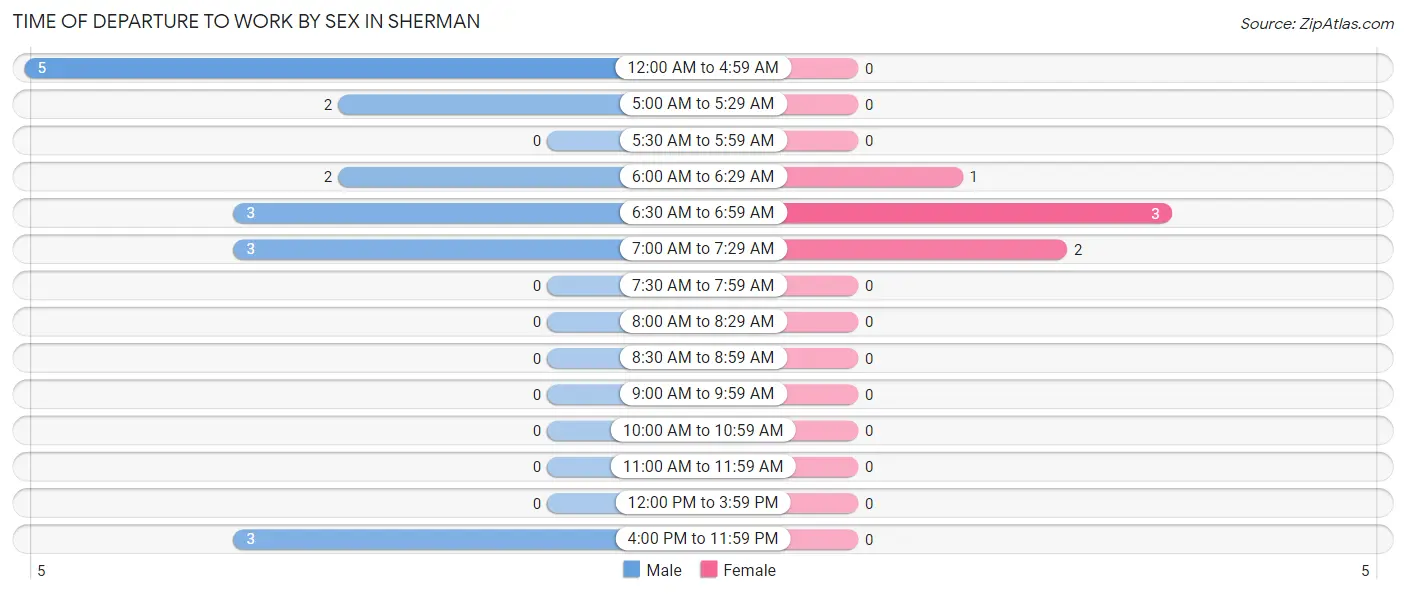
| Time of Departure | Male | Female |
| 12:00 AM to 4:59 AM | 5 (27.8%) | 0 (0.0%) |
| 5:00 AM to 5:29 AM | 2 (11.1%) | 0 (0.0%) |
| 5:30 AM to 5:59 AM | 0 (0.0%) | 0 (0.0%) |
| 6:00 AM to 6:29 AM | 2 (11.1%) | 1 (16.7%) |
| 6:30 AM to 6:59 AM | 3 (16.7%) | 3 (50.0%) |
| 7:00 AM to 7:29 AM | 3 (16.7%) | 2 (33.3%) |
| 7:30 AM to 7:59 AM | 0 (0.0%) | 0 (0.0%) |
| 8:00 AM to 8:29 AM | 0 (0.0%) | 0 (0.0%) |
| 8:30 AM to 8:59 AM | 0 (0.0%) | 0 (0.0%) |
| 9:00 AM to 9:59 AM | 0 (0.0%) | 0 (0.0%) |
| 10:00 AM to 10:59 AM | 0 (0.0%) | 0 (0.0%) |
| 11:00 AM to 11:59 AM | 0 (0.0%) | 0 (0.0%) |
| 12:00 PM to 3:59 PM | 0 (0.0%) | 0 (0.0%) |
| 4:00 PM to 11:59 PM | 3 (16.7%) | 0 (0.0%) |
| Total | 18 (100.0%) | 6 (100.0%) |
Housing Occupancy in Sherman
Occupancy by Ownership in Sherman
Of the total 24 dwellings in Sherman, owner-occupied units account for 20 (83.3%), while renter-occupied units make up 4 (16.7%).
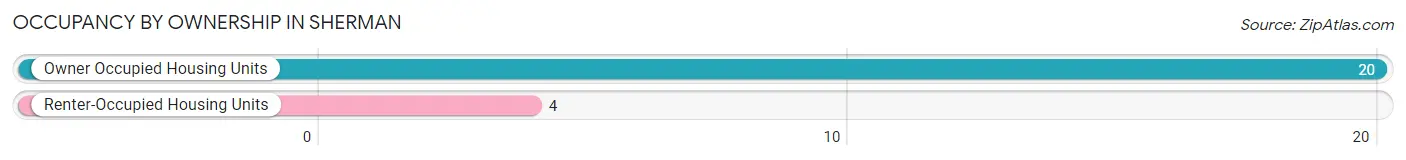
| Occupancy | # Housing Units | % Housing Units |
| Owner Occupied Housing Units | 20 | 83.3% |
| Renter-Occupied Housing Units | 4 | 16.7% |
| Total Occupied Housing Units | 24 | 100.0% |
Occupancy by Household Size in Sherman
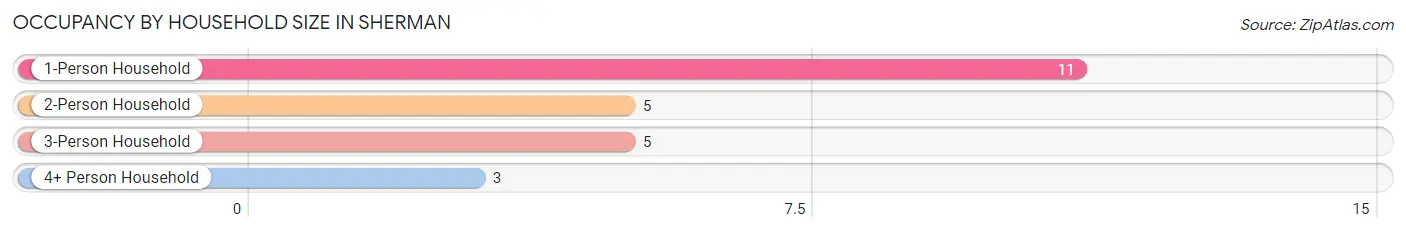
| Household Size | # Housing Units | % Housing Units |
| 1-Person Household | 11 | 45.8% |
| 2-Person Household | 5 | 20.8% |
| 3-Person Household | 5 | 20.8% |
| 4+ Person Household | 3 | 12.5% |
| Total Housing Units | 24 | 100.0% |
Occupancy by Ownership by Household Size in Sherman
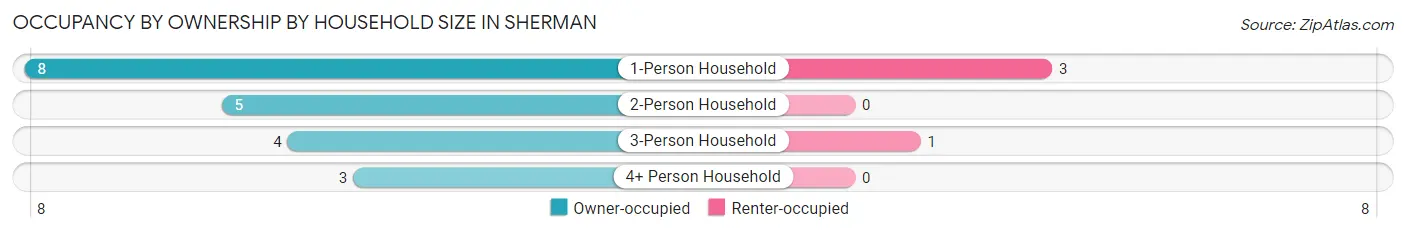
| Household Size | Owner-occupied | Renter-occupied |
| 1-Person Household | 8 (72.7%) | 3 (27.3%) |
| 2-Person Household | 5 (100.0%) | 0 (0.0%) |
| 3-Person Household | 4 (80.0%) | 1 (20.0%) |
| 4+ Person Household | 3 (100.0%) | 0 (0.0%) |
| Total Housing Units | 20 (83.3%) | 4 (16.7%) |
Occupancy by Educational Attainment in Sherman
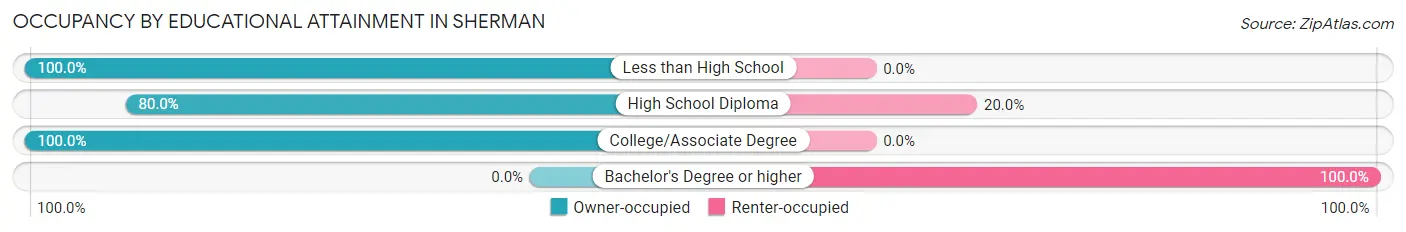
| Household Size | Owner-occupied | Renter-occupied |
| Less than High School | 2 (100.0%) | 0 (0.0%) |
| High School Diploma | 12 (80.0%) | 3 (20.0%) |
| College/Associate Degree | 6 (100.0%) | 0 (0.0%) |
| Bachelor's Degree or higher | 0 (0.0%) | 1 (100.0%) |
Occupancy by Age of Householder in Sherman
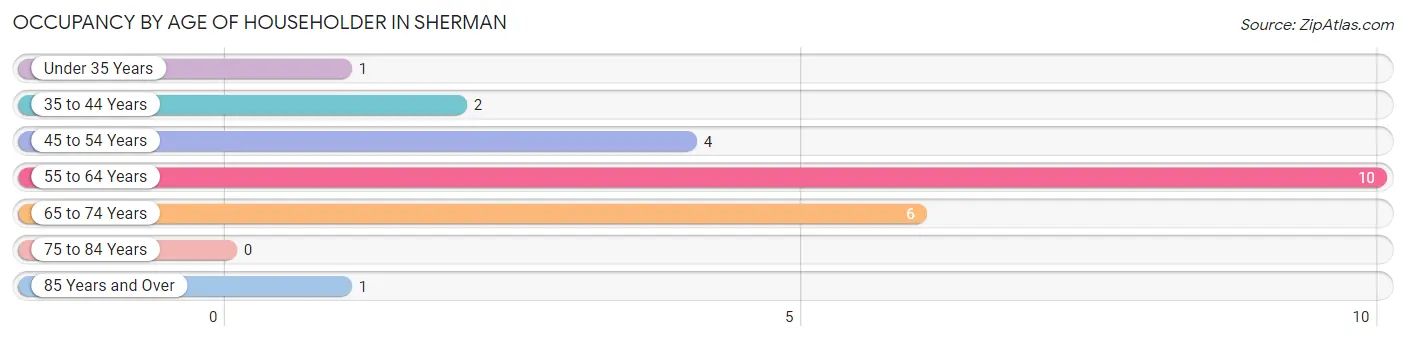
| Age Bracket | # Households | % Households |
| Under 35 Years | 1 | 4.2% |
| 35 to 44 Years | 2 | 8.3% |
| 45 to 54 Years | 4 | 16.7% |
| 55 to 64 Years | 10 | 41.7% |
| 65 to 74 Years | 6 | 25.0% |
| 75 to 84 Years | 0 | 0.0% |
| 85 Years and Over | 1 | 4.2% |
| Total | 24 | 100.0% |
Housing Finances in Sherman
Median Income by Occupancy in Sherman
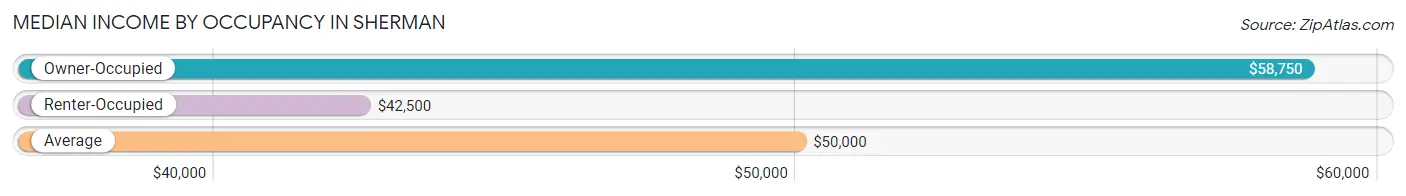
| Occupancy Type | # Households | Median Income |
| Owner-Occupied | 20 (83.3%) | $58,750 |
| Renter-Occupied | 4 (16.7%) | $42,500 |
| Average | 24 (100.0%) | $50,000 |
Occupancy by Householder Income Bracket in Sherman
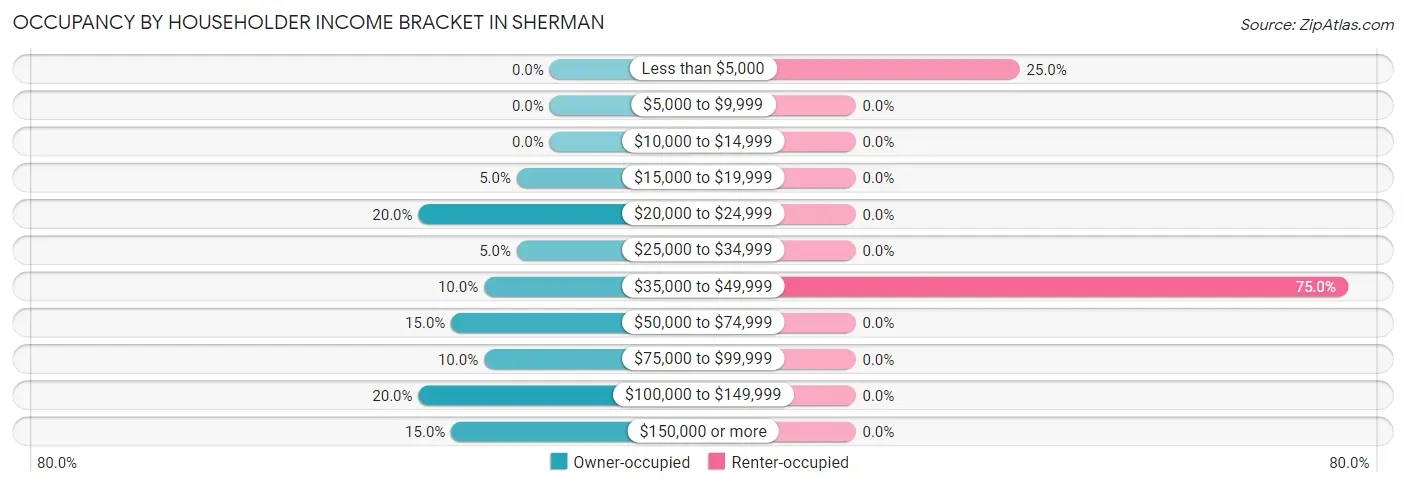
| Income Bracket | Owner-occupied | Renter-occupied |
| Less than $5,000 | 0 (0.0%) | 1 (25.0%) |
| $5,000 to $9,999 | 0 (0.0%) | 0 (0.0%) |
| $10,000 to $14,999 | 0 (0.0%) | 0 (0.0%) |
| $15,000 to $19,999 | 1 (5.0%) | 0 (0.0%) |
| $20,000 to $24,999 | 4 (20.0%) | 0 (0.0%) |
| $25,000 to $34,999 | 1 (5.0%) | 0 (0.0%) |
| $35,000 to $49,999 | 2 (10.0%) | 3 (75.0%) |
| $50,000 to $74,999 | 3 (15.0%) | 0 (0.0%) |
| $75,000 to $99,999 | 2 (10.0%) | 0 (0.0%) |
| $100,000 to $149,999 | 4 (20.0%) | 0 (0.0%) |
| $150,000 or more | 3 (15.0%) | 0 (0.0%) |
| Total | 20 (100.0%) | 4 (100.0%) |
Monthly Housing Cost Tiers in Sherman
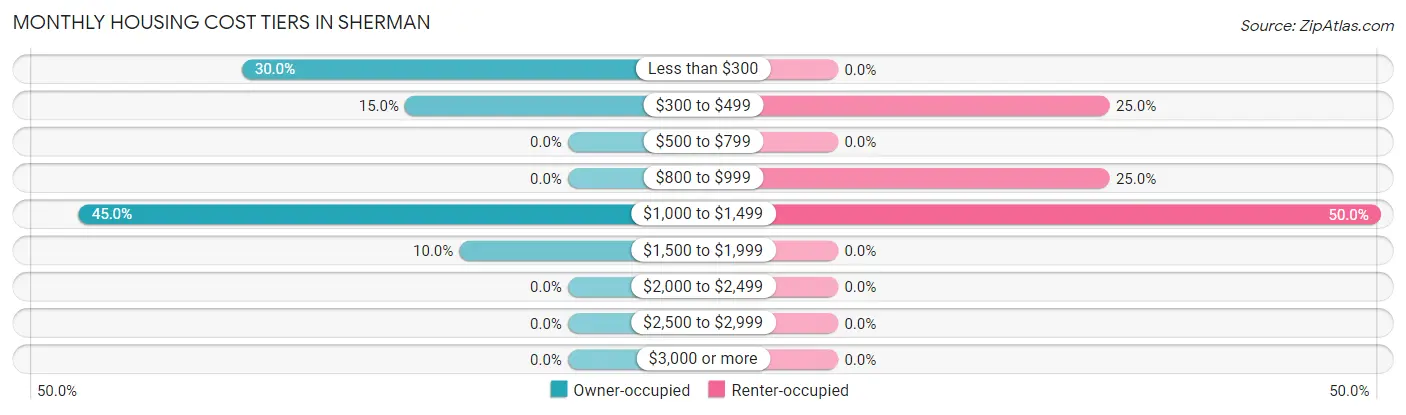
| Monthly Cost | Owner-occupied | Renter-occupied |
| Less than $300 | 6 (30.0%) | 0 (0.0%) |
| $300 to $499 | 3 (15.0%) | 1 (25.0%) |
| $500 to $799 | 0 (0.0%) | 0 (0.0%) |
| $800 to $999 | 0 (0.0%) | 1 (25.0%) |
| $1,000 to $1,499 | 9 (45.0%) | 2 (50.0%) |
| $1,500 to $1,999 | 2 (10.0%) | 0 (0.0%) |
| $2,000 to $2,499 | 0 (0.0%) | 0 (0.0%) |
| $2,500 to $2,999 | 0 (0.0%) | 0 (0.0%) |
| $3,000 or more | 0 (0.0%) | 0 (0.0%) |
| Total | 20 (100.0%) | 4 (100.0%) |
Physical Housing Characteristics in Sherman
Housing Structures in Sherman
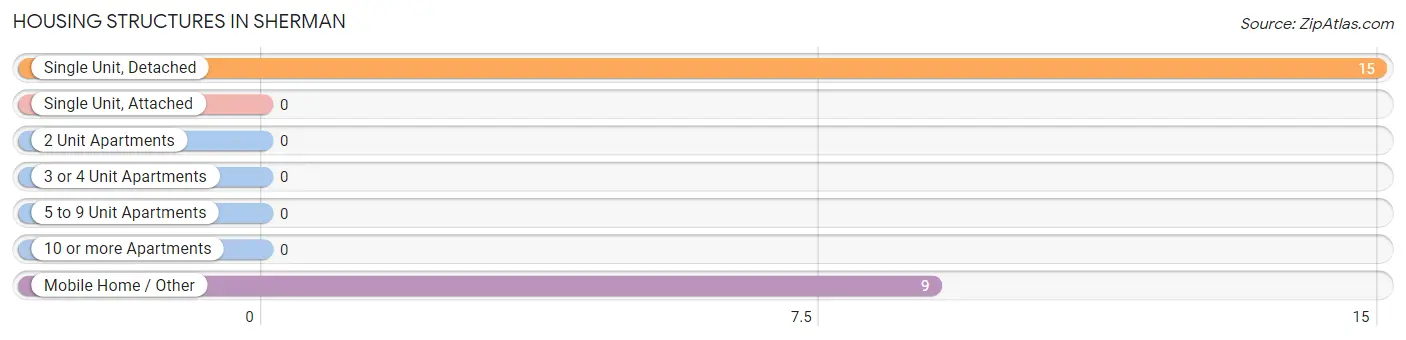
| Structure Type | # Housing Units | % Housing Units |
| Single Unit, Detached | 15 | 62.5% |
| Single Unit, Attached | 0 | 0.0% |
| 2 Unit Apartments | 0 | 0.0% |
| 3 or 4 Unit Apartments | 0 | 0.0% |
| 5 to 9 Unit Apartments | 0 | 0.0% |
| 10 or more Apartments | 0 | 0.0% |
| Mobile Home / Other | 9 | 37.5% |
| Total | 24 | 100.0% |
Housing Structures by Occupancy in Sherman
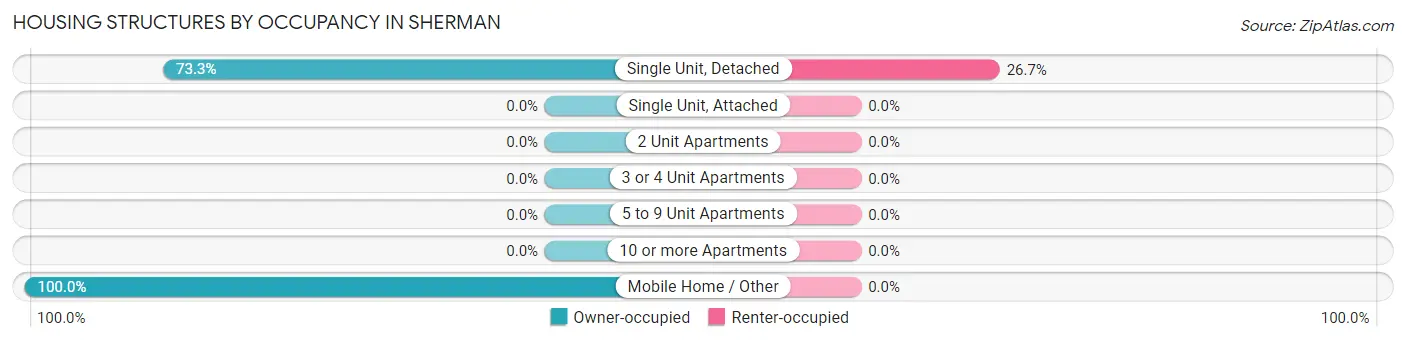
| Structure Type | Owner-occupied | Renter-occupied |
| Single Unit, Detached | 11 (73.3%) | 4 (26.7%) |
| Single Unit, Attached | 0 (0.0%) | 0 (0.0%) |
| 2 Unit Apartments | 0 (0.0%) | 0 (0.0%) |
| 3 or 4 Unit Apartments | 0 (0.0%) | 0 (0.0%) |
| 5 to 9 Unit Apartments | 0 (0.0%) | 0 (0.0%) |
| 10 or more Apartments | 0 (0.0%) | 0 (0.0%) |
| Mobile Home / Other | 9 (100.0%) | 0 (0.0%) |
| Total | 20 (83.3%) | 4 (16.7%) |
Housing Structures by Number of Rooms in Sherman
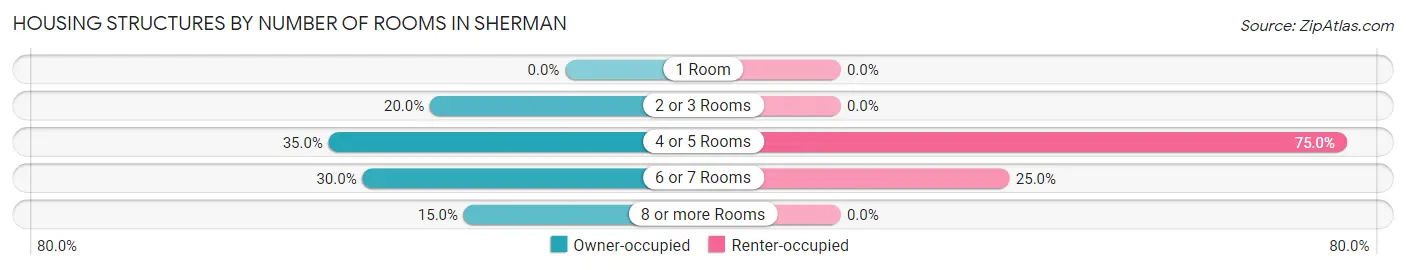
| Number of Rooms | Owner-occupied | Renter-occupied |
| 1 Room | 0 (0.0%) | 0 (0.0%) |
| 2 or 3 Rooms | 4 (20.0%) | 0 (0.0%) |
| 4 or 5 Rooms | 7 (35.0%) | 3 (75.0%) |
| 6 or 7 Rooms | 6 (30.0%) | 1 (25.0%) |
| 8 or more Rooms | 3 (15.0%) | 0 (0.0%) |
| Total | 20 (100.0%) | 4 (100.0%) |
Housing Structure by Heating Type in Sherman
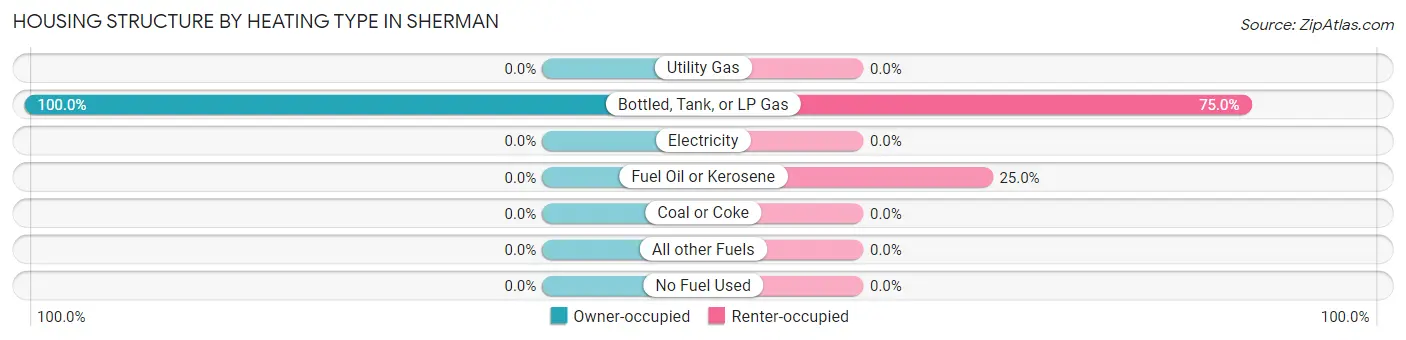
| Heating Type | Owner-occupied | Renter-occupied |
| Utility Gas | 0 (0.0%) | 0 (0.0%) |
| Bottled, Tank, or LP Gas | 20 (100.0%) | 3 (75.0%) |
| Electricity | 0 (0.0%) | 0 (0.0%) |
| Fuel Oil or Kerosene | 0 (0.0%) | 1 (25.0%) |
| Coal or Coke | 0 (0.0%) | 0 (0.0%) |
| All other Fuels | 0 (0.0%) | 0 (0.0%) |
| No Fuel Used | 0 (0.0%) | 0 (0.0%) |
| Total | 20 (100.0%) | 4 (100.0%) |
Household Vehicle Usage in Sherman
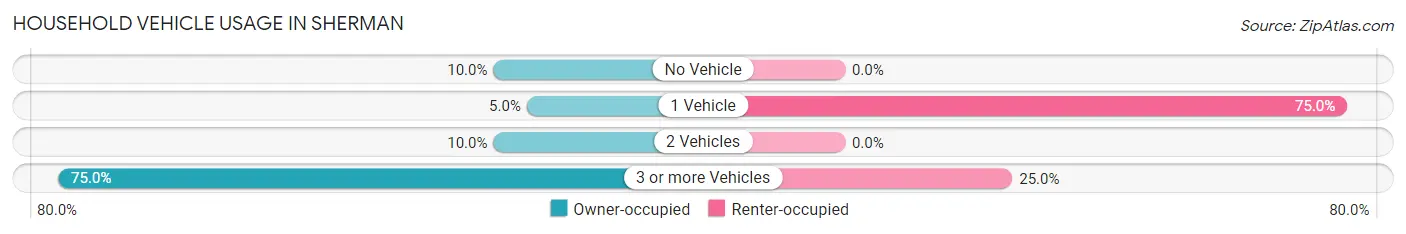
| Vehicles per Household | Owner-occupied | Renter-occupied |
| No Vehicle | 2 (10.0%) | 0 (0.0%) |
| 1 Vehicle | 1 (5.0%) | 3 (75.0%) |
| 2 Vehicles | 2 (10.0%) | 0 (0.0%) |
| 3 or more Vehicles | 15 (75.0%) | 1 (25.0%) |
| Total | 20 (100.0%) | 4 (100.0%) |
Real Estate & Mortgages in Sherman
Real Estate and Mortgage Overview in Sherman
| Characteristic | Without Mortgage | With Mortgage |
| Housing Units | 10 | 10 |
| Median Property Value | - | - |
| Median Household Income | - | - |
| Monthly Housing Costs | - | - |
| Real Estate Taxes | - | - |
Property Value by Mortgage Status in Sherman
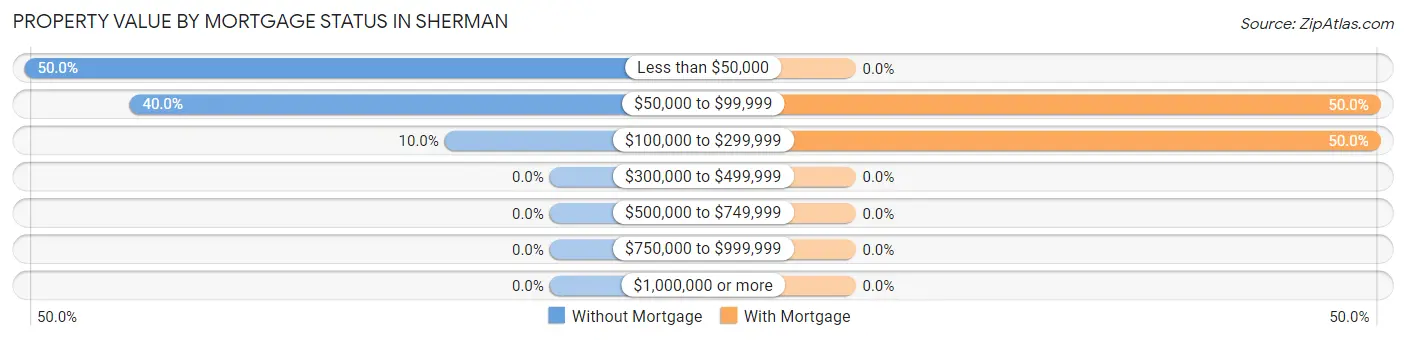
| Property Value | Without Mortgage | With Mortgage |
| Less than $50,000 | 5 (50.0%) | 0 (0.0%) |
| $50,000 to $99,999 | 4 (40.0%) | 5 (50.0%) |
| $100,000 to $299,999 | 1 (10.0%) | 5 (50.0%) |
| $300,000 to $499,999 | 0 (0.0%) | 0 (0.0%) |
| $500,000 to $749,999 | 0 (0.0%) | 0 (0.0%) |
| $750,000 to $999,999 | 0 (0.0%) | 0 (0.0%) |
| $1,000,000 or more | 0 (0.0%) | 0 (0.0%) |
| Total | 10 (100.0%) | 10 (100.0%) |
Household Income by Mortgage Status in Sherman
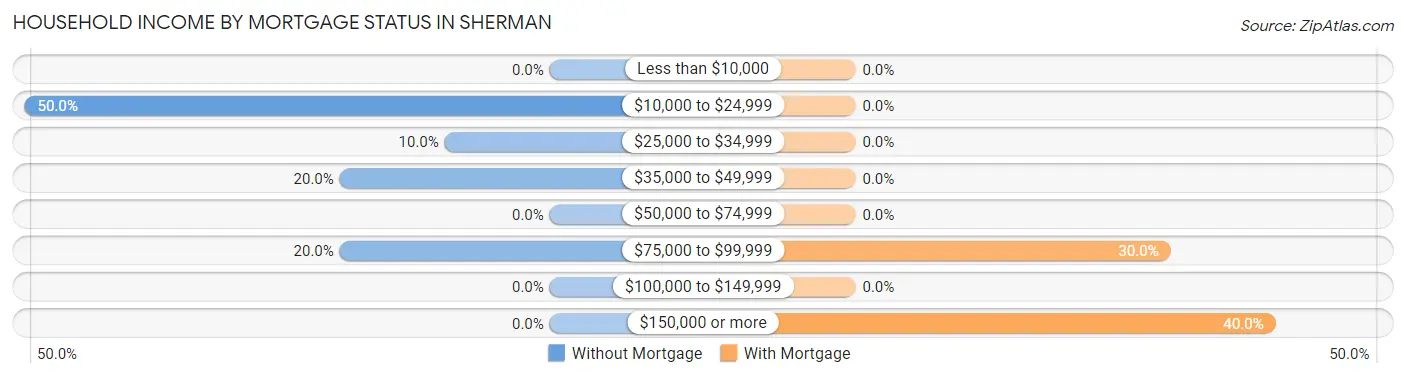
| Household Income | Without Mortgage | With Mortgage |
| Less than $10,000 | 0 (0.0%) | 0 (0.0%) |
| $10,000 to $24,999 | 5 (50.0%) | 0 (0.0%) |
| $25,000 to $34,999 | 1 (10.0%) | 0 (0.0%) |
| $35,000 to $49,999 | 2 (20.0%) | 0 (0.0%) |
| $50,000 to $74,999 | 0 (0.0%) | 0 (0.0%) |
| $75,000 to $99,999 | 2 (20.0%) | 3 (30.0%) |
| $100,000 to $149,999 | 0 (0.0%) | 0 (0.0%) |
| $150,000 or more | 0 (0.0%) | 4 (40.0%) |
| Total | 10 (100.0%) | 10 (100.0%) |
Property Value to Household Income Ratio in Sherman
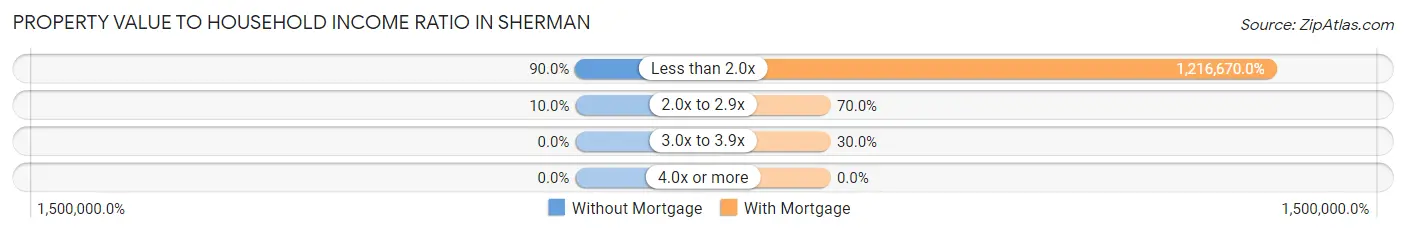
| Value-to-Income Ratio | Without Mortgage | With Mortgage |
| Less than 2.0x | 9 (90.0%) | 121,667 (1,216,670.0%) |
| 2.0x to 2.9x | 1 (10.0%) | 7 (70.0%) |
| 3.0x to 3.9x | 0 (0.0%) | 3 (30.0%) |
| 4.0x or more | 0 (0.0%) | 0 (0.0%) |
| Total | 10 (100.0%) | 10 (100.0%) |
Real Estate Taxes by Mortgage Status in Sherman
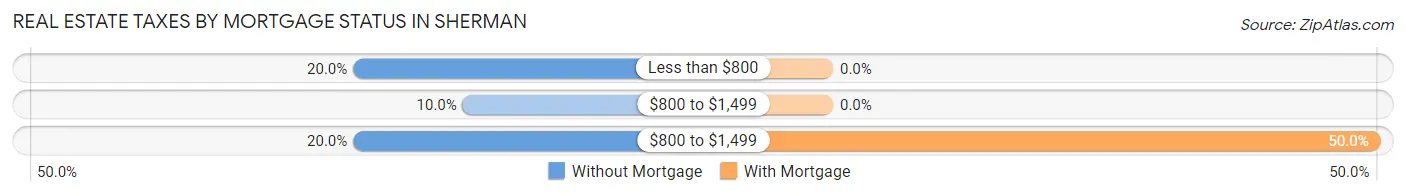
| Property Taxes | Without Mortgage | With Mortgage |
| Less than $800 | 2 (20.0%) | 0 (0.0%) |
| $800 to $1,499 | 1 (10.0%) | 0 (0.0%) |
| $800 to $1,499 | 2 (20.0%) | 5 (50.0%) |
| Total | 10 (100.0%) | 10 (100.0%) |
Health & Disability in Sherman
Health Insurance Coverage by Age in Sherman
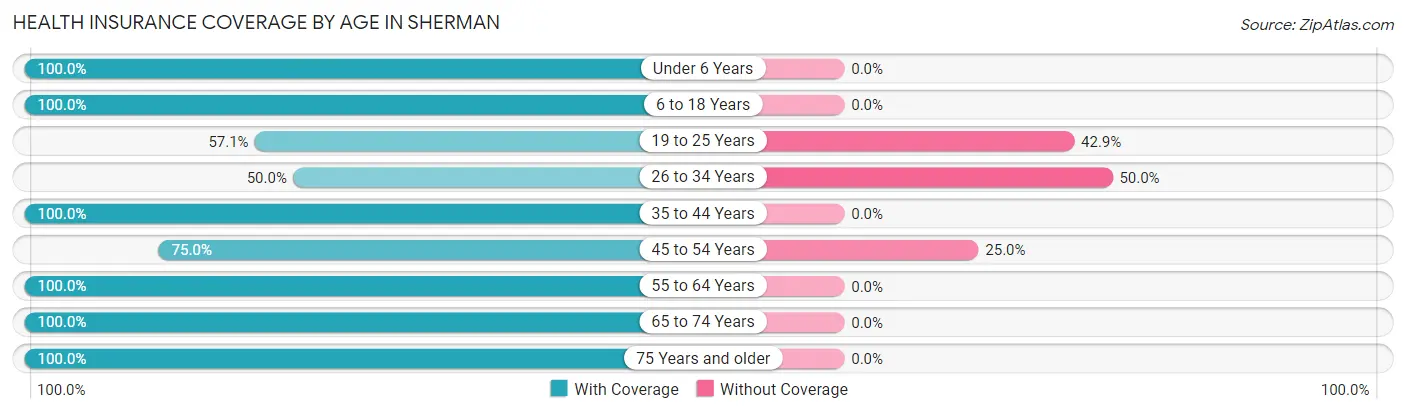
| Age Bracket | With Coverage | Without Coverage |
| Under 6 Years | 4 (100.0%) | 0 (0.0%) |
| 6 to 18 Years | 3 (100.0%) | 0 (0.0%) |
| 19 to 25 Years | 4 (57.1%) | 3 (42.9%) |
| 26 to 34 Years | 1 (50.0%) | 1 (50.0%) |
| 35 to 44 Years | 4 (100.0%) | 0 (0.0%) |
| 45 to 54 Years | 3 (75.0%) | 1 (25.0%) |
| 55 to 64 Years | 18 (100.0%) | 0 (0.0%) |
| 65 to 74 Years | 8 (100.0%) | 0 (0.0%) |
| 75 Years and older | 1 (100.0%) | 0 (0.0%) |
| Total | 46 (90.2%) | 5 (9.8%) |
Health Insurance Coverage by Citizenship Status in Sherman
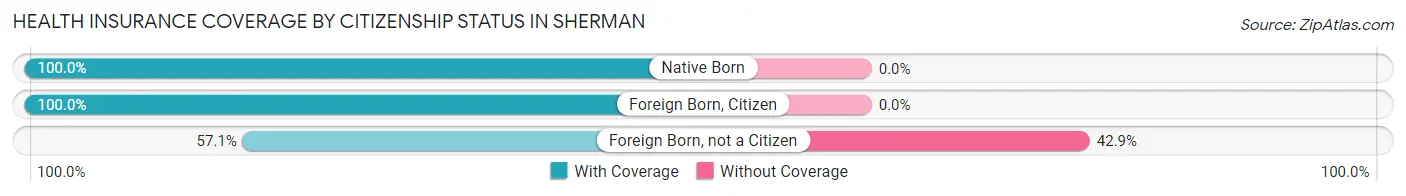
| Citizenship Status | With Coverage | Without Coverage |
| Native Born | 4 (100.0%) | 0 (0.0%) |
| Foreign Born, Citizen | 3 (100.0%) | 0 (0.0%) |
| Foreign Born, not a Citizen | 4 (57.1%) | 3 (42.9%) |
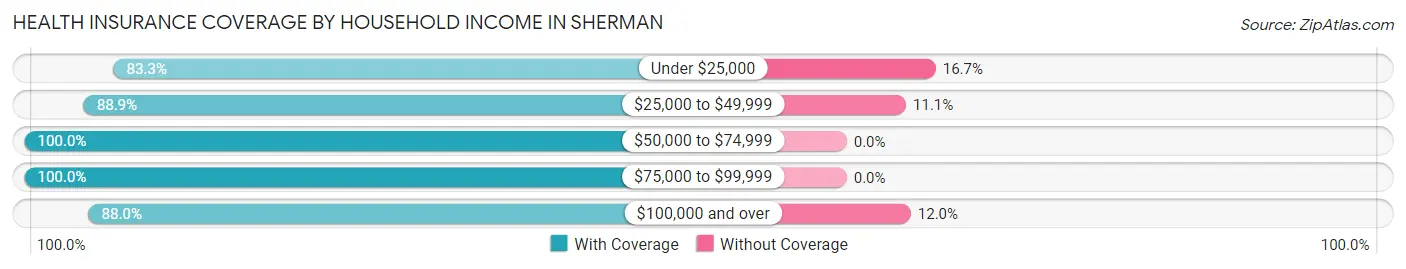
Health Insurance Coverage by Household Income in Sherman
| Household Income | With Coverage | Without Coverage |
| Under $25,000 | 5 (83.3%) | 1 (16.7%) |
| $25,000 to $49,999 | 8 (88.9%) | 1 (11.1%) |
| $50,000 to $74,999 | 7 (100.0%) | 0 (0.0%) |
| $75,000 to $99,999 | 4 (100.0%) | 0 (0.0%) |
| $100,000 and over | 22 (88.0%) | 3 (12.0%) |
Public vs Private Health Insurance Coverage by Age in Sherman
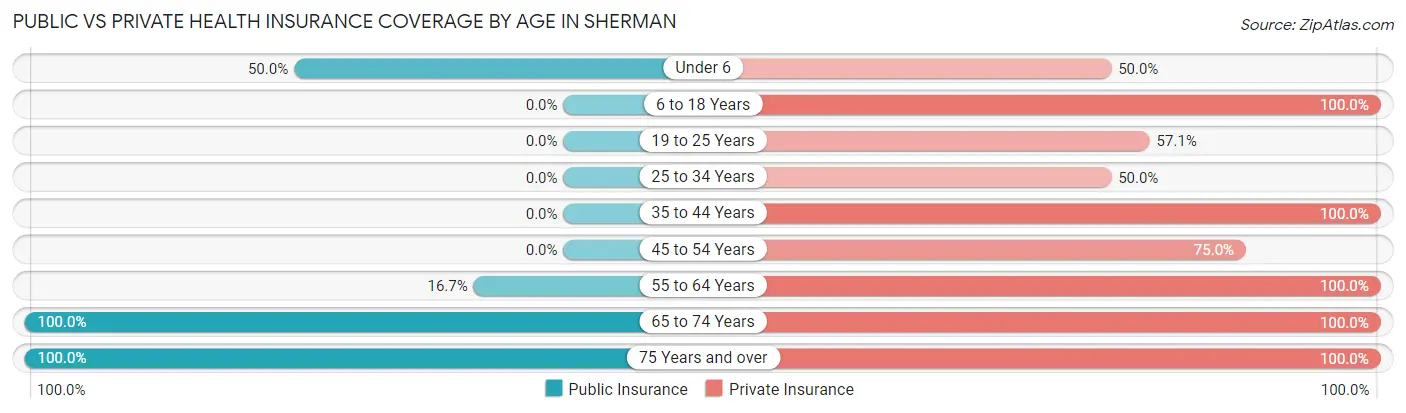
| Age Bracket | Public Insurance | Private Insurance |
| Under 6 | 2 (50.0%) | 2 (50.0%) |
| 6 to 18 Years | 0 (0.0%) | 3 (100.0%) |
| 19 to 25 Years | 0 (0.0%) | 4 (57.1%) |
| 25 to 34 Years | 0 (0.0%) | 1 (50.0%) |
| 35 to 44 Years | 0 (0.0%) | 4 (100.0%) |
| 45 to 54 Years | 0 (0.0%) | 3 (75.0%) |
| 55 to 64 Years | 3 (16.7%) | 18 (100.0%) |
| 65 to 74 Years | 8 (100.0%) | 8 (100.0%) |
| 75 Years and over | 1 (100.0%) | 1 (100.0%) |
| Total | 14 (27.5%) | 44 (86.3%) |
Disability Status by Sex by Age in Sherman
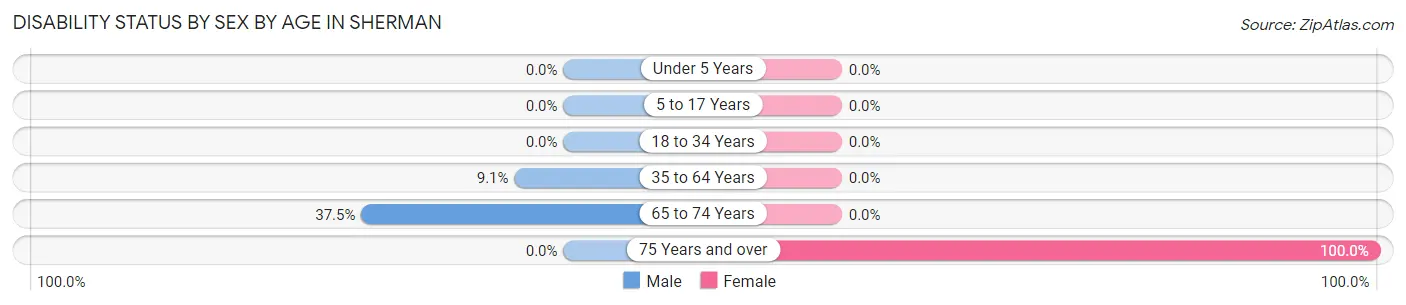
| Age Bracket | Male | Female |
| Under 5 Years | 0 (0.0%) | 0 (0.0%) |
| 5 to 17 Years | 0 (0.0%) | 0 (0.0%) |
| 18 to 34 Years | 0 (0.0%) | 0 (0.0%) |
| 35 to 64 Years | 1 (9.1%) | 0 (0.0%) |
| 65 to 74 Years | 3 (37.5%) | 0 (0.0%) |
| 75 Years and over | 0 (0.0%) | 1 (100.0%) |
Disability Class by Sex by Age in Sherman
Disability Class: Hearing Difficulty
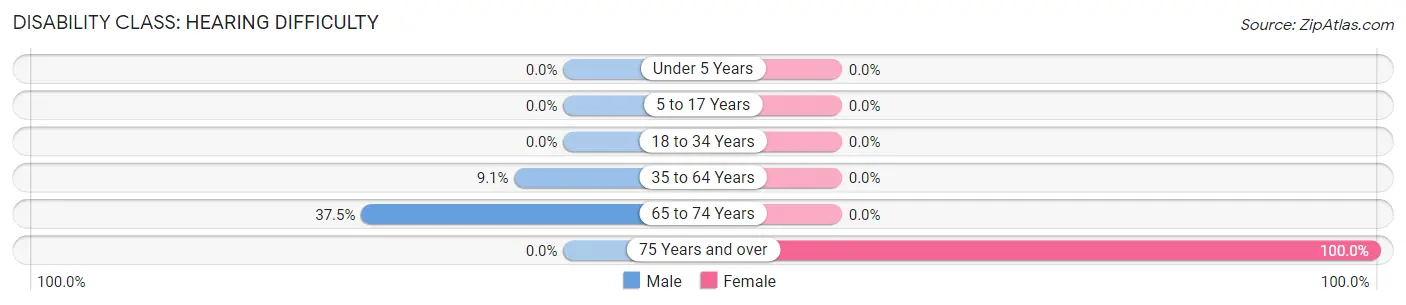
| Age Bracket | Male | Female |
| Under 5 Years | 0 (0.0%) | 0 (0.0%) |
| 5 to 17 Years | 0 (0.0%) | 0 (0.0%) |
| 18 to 34 Years | 0 (0.0%) | 0 (0.0%) |
| 35 to 64 Years | 1 (9.1%) | 0 (0.0%) |
| 65 to 74 Years | 3 (37.5%) | 0 (0.0%) |
| 75 Years and over | 0 (0.0%) | 1 (100.0%) |
Disability Class: Vision Difficulty
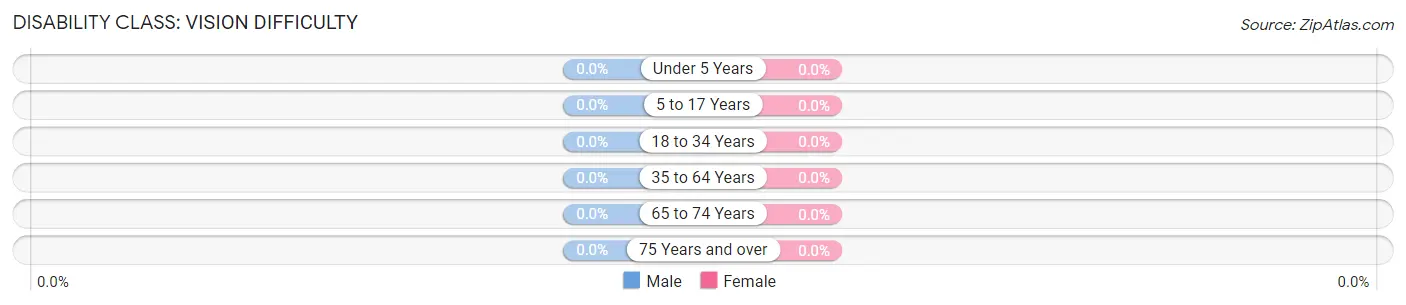
| Age Bracket | Male | Female |
| Under 5 Years | 0 (0.0%) | 0 (0.0%) |
| 5 to 17 Years | 0 (0.0%) | 0 (0.0%) |
| 18 to 34 Years | 0 (0.0%) | 0 (0.0%) |
| 35 to 64 Years | 0 (0.0%) | 0 (0.0%) |
| 65 to 74 Years | 0 (0.0%) | 0 (0.0%) |
| 75 Years and over | 0 (0.0%) | 0 (0.0%) |
Disability Class: Cognitive Difficulty
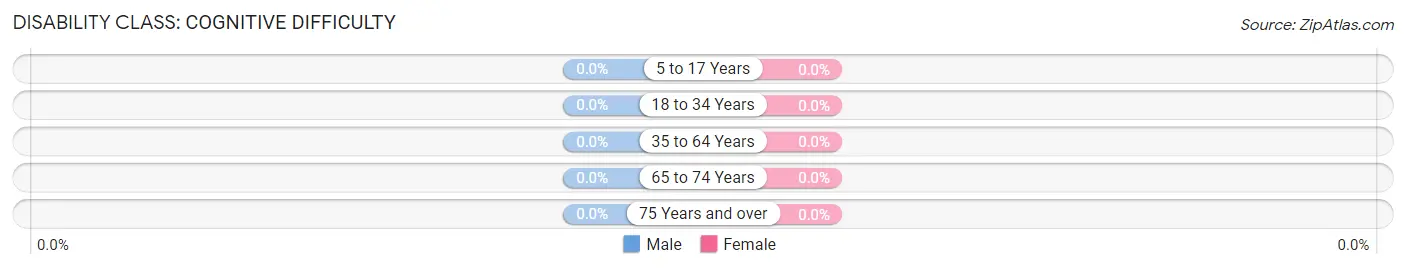
| Age Bracket | Male | Female |
| 5 to 17 Years | 0 (0.0%) | 0 (0.0%) |
| 18 to 34 Years | 0 (0.0%) | 0 (0.0%) |
| 35 to 64 Years | 0 (0.0%) | 0 (0.0%) |
| 65 to 74 Years | 0 (0.0%) | 0 (0.0%) |
| 75 Years and over | 0 (0.0%) | 0 (0.0%) |
Disability Class: Ambulatory Difficulty
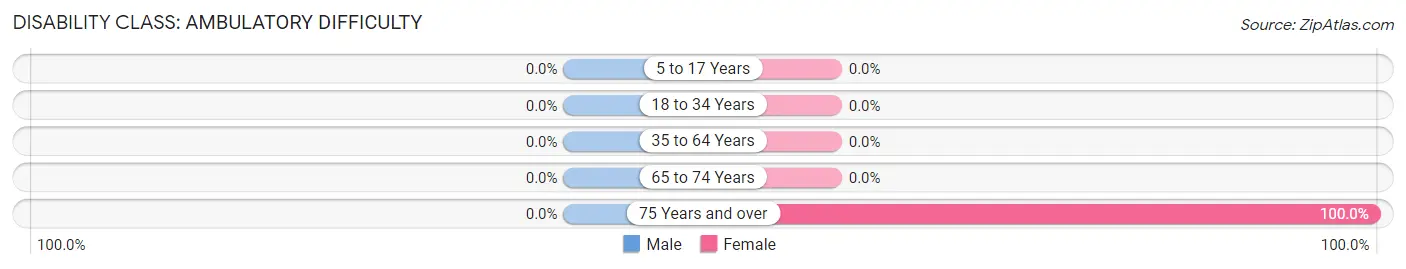
| Age Bracket | Male | Female |
| 5 to 17 Years | 0 (0.0%) | 0 (0.0%) |
| 18 to 34 Years | 0 (0.0%) | 0 (0.0%) |
| 35 to 64 Years | 0 (0.0%) | 0 (0.0%) |
| 65 to 74 Years | 0 (0.0%) | 0 (0.0%) |
| 75 Years and over | 0 (0.0%) | 1 (100.0%) |
Disability Class: Self-Care Difficulty
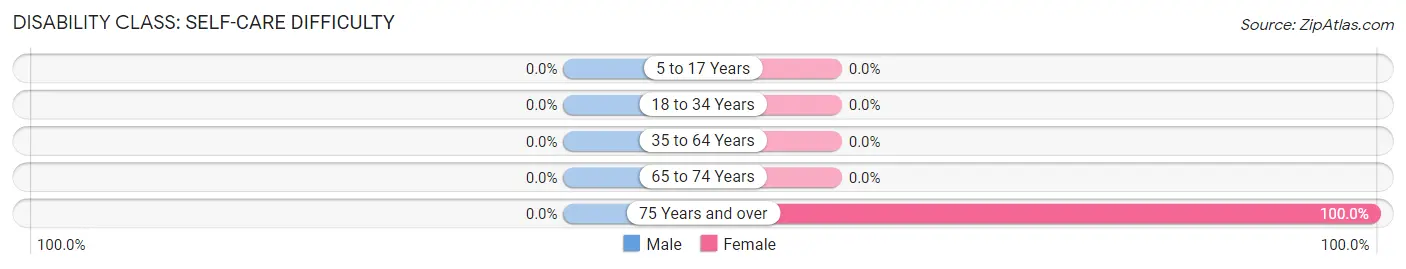
| Age Bracket | Male | Female |
| 5 to 17 Years | 0 (0.0%) | 0 (0.0%) |
| 18 to 34 Years | 0 (0.0%) | 0 (0.0%) |
| 35 to 64 Years | 0 (0.0%) | 0 (0.0%) |
| 65 to 74 Years | 0 (0.0%) | 0 (0.0%) |
| 75 Years and over | 0 (0.0%) | 1 (100.0%) |
Technology Access in Sherman
Computing Device Access in Sherman
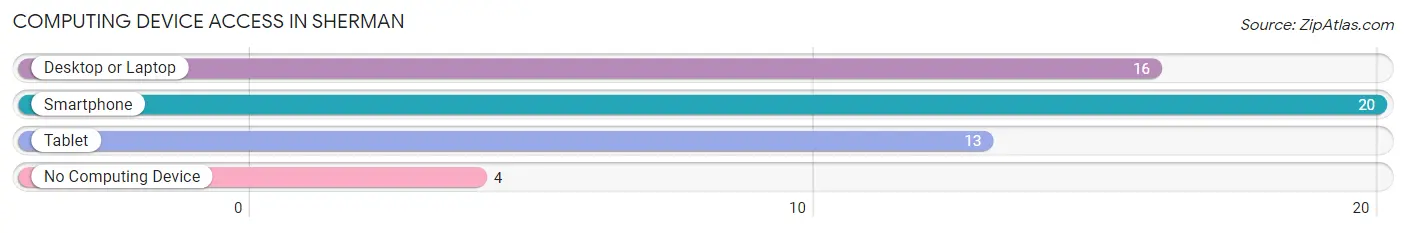
| Device Type | # Households | % Households |
| Desktop or Laptop | 16 | 66.7% |
| Smartphone | 20 | 83.3% |
| Tablet | 13 | 54.2% |
| No Computing Device | 4 | 16.7% |
| Total | 24 | 100.0% |
Internet Access in Sherman
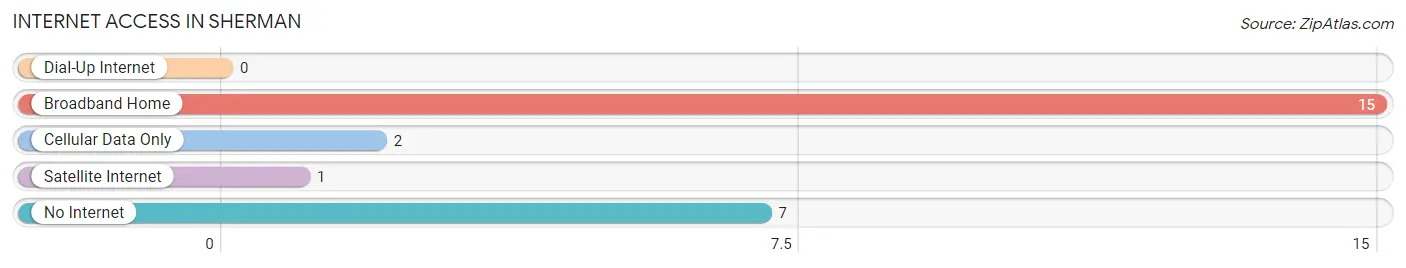
| Internet Type | # Households | % Households |
| Dial-Up Internet | 0 | 0.0% |
| Broadband Home | 15 | 62.5% |
| Cellular Data Only | 2 | 8.3% |
| Satellite Internet | 1 | 4.2% |
| No Internet | 7 | 29.2% |
| Total | 24 | 100.0% |
Sherman Summary
Sherman, South Dakota is a small town located in the southeastern corner of the state. It is situated in the rolling hills of the Missouri River Valley, and is surrounded by the vast prairies of the Great Plains. The town has a population of just over 500 people, and is the county seat of Charles Mix County.
History
The area that is now Sherman was first settled in the late 1800s by homesteaders. The town was officially founded in 1883, and was named after General William Tecumseh Sherman. The town was incorporated in 1887, and the first post office was established in 1888.
In the early 1900s, Sherman was a thriving agricultural community. The town was home to several grain elevators, a creamery, a lumberyard, and a variety of other businesses. The town also had a railroad station, which connected it to the rest of the state.
In the 1950s, the town began to decline as many of its businesses closed. The railroad station was closed in the 1960s, and the town’s population began to decline. In the 1970s, the town began to experience a resurgence as new businesses opened and the population began to grow again.
Geography
Sherman is located in the southeastern corner of South Dakota, in the rolling hills of the Missouri River Valley. The town is situated at an elevation of 1,845 feet above sea level. The town is surrounded by the vast prairies of the Great Plains, and is located about 30 miles from the Nebraska border.
The climate in Sherman is semi-arid, with hot summers and cold winters. The average annual temperature is around 50 degrees Fahrenheit, and the average annual precipitation is around 20 inches.
Economy
The economy of Sherman is largely based on agriculture. The town is home to several grain elevators, and the surrounding area is home to many farms and ranches. The town is also home to several small businesses, including a grocery store, a hardware store, and a variety of other shops.
The town is also home to a few manufacturing companies, including a furniture factory and a plastics factory. The town is also home to a few service-based businesses, including a bank, a post office, and a variety of other services.
Demographics
As of the 2010 census, the population of Sherman was 514 people. The racial makeup of the town was 97.3% White, 0.6% Native American, 0.2% Asian, 0.2% from other races, and 1.7% from two or more races. The median household income was $37,500, and the median family income was $45,000.
The town is home to a variety of religious denominations, including Catholic, Lutheran, and Methodist. The town is also home to a variety of cultural organizations, including a library, a museum, and a theater.
Conclusion
Sherman, South Dakota is a small town located in the southeastern corner of the state. It is situated in the rolling hills of the Missouri River Valley, and is surrounded by the vast prairies of the Great Plains. The town has a population of just over 500 people, and is the county seat of Charles Mix County. The economy of Sherman is largely based on agriculture, and the town is home to several small businesses. The town is also home to a variety of religious denominations, and a variety of cultural organizations.
Common Questions
What is Per Capita Income in Sherman?
Per Capita income in Sherman is $34,537.
What is the Median Family Income in Sherman?
Median Family Income in Sherman is $121,250.
What is the Median Household income in Sherman?
Median Household Income in Sherman is $50,000.
What is Income or Wage Gap in Sherman?
Income or Wage Gap in Sherman is 3.9%.
Women in Sherman earn 96.1 cents for every dollar earned by a man.
What is Inequality or Gini Index in Sherman?
Inequality or Gini Index in Sherman is 0.41.
What is the Total Population of Sherman?
Total Population of Sherman is 51.
What is the Total Male Population of Sherman?
Total Male Population of Sherman is 31.
What is the Total Female Population of Sherman?
Total Female Population of Sherman is 20.
What is the Ratio of Males per 100 Females in Sherman?
There are 155.00 Males per 100 Females in Sherman.
What is the Ratio of Females per 100 Males in Sherman?
There are 64.52 Females per 100 Males in Sherman.
What is the Median Population Age in Sherman?
Median Population Age in Sherman is 55.8 Years.
What is the Average Family Size in Sherman
Average Family Size in Sherman is 3.3 People.
What is the Average Household Size in Sherman
Average Household Size in Sherman is 2.1 People.
How Large is the Labor Force in Sherman?
There are 28 People in the Labor Forcein in Sherman.
What is the Percentage of People in the Labor Force in Sherman?
63.6% of People are in the Labor Force in Sherman.