Canistota, SD Map & Demographics
Canistota Map
Canistota Overview
$30,316
PER CAPITA INCOME
$67,500
AVG FAMILY INCOME
$57,557
AVG HOUSEHOLD INCOME
38.6%
WAGE / INCOME GAP [ % ]
61.4¢/ $1
WAGE / INCOME GAP [ $ ]
0.35
INEQUALITY / GINI INDEX
670
TOTAL POPULATION
340
MALE POPULATION
330
FEMALE POPULATION
103.03
MALES / 100 FEMALES
97.06
FEMALES / 100 MALES
39.0
MEDIAN AGE
2.7
AVG FAMILY SIZE
2.2
AVG HOUSEHOLD SIZE
367
LABOR FORCE [ PEOPLE ]
69.0%
PERCENT IN LABOR FORCE
3.3%
UNEMPLOYMENT RATE
Canistota Zip Codes
Canistota Area Codes
Income in Canistota
Income Overview in Canistota
Per Capita Income in Canistota is $30,316, while median incomes of families and households are $67,500 and $57,557 respectively.
| Characteristic | Number | Measure |
| Per Capita Income | 670 | $30,316 |
| Median Family Income | 174 | $67,500 |
| Mean Family Income | 174 | $82,381 |
| Median Household Income | 285 | $57,557 |
| Mean Household Income | 285 | $69,632 |
| Income Deficit | 174 | $0 |
| Wage / Income Gap (%) | 670 | 38.55% |
| Wage / Income Gap ($) | 670 | 61.45¢ per $1 |
| Gini / Inequality Index | 670 | 0.35 |
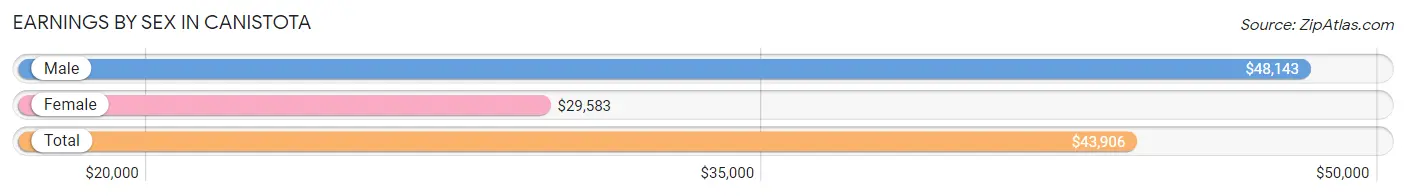
Earnings by Sex in Canistota
Average Earnings in Canistota are $43,906, $48,143 for men and $29,583 for women, a difference of 38.6%.
| Sex | Number | Average Earnings |
| Male | 240 (61.4%) | $48,143 |
| Female | 151 (38.6%) | $29,583 |
| Total | 391 (100.0%) | $43,906 |
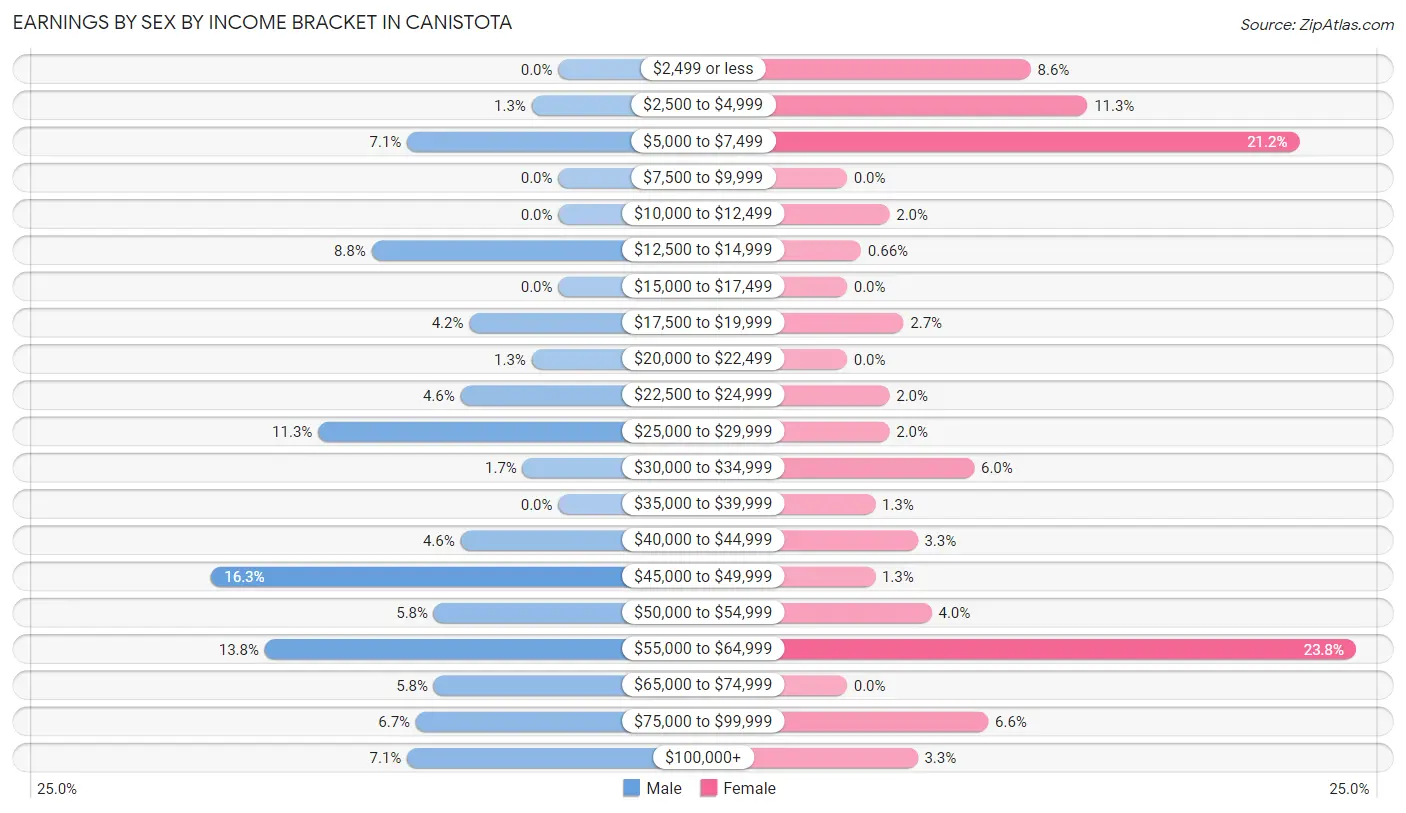
Earnings by Sex by Income Bracket in Canistota
The most common earnings brackets in Canistota are $45,000 to $49,999 for men (39 | 16.3%) and $55,000 to $64,999 for women (36 | 23.8%).
| Income | Male | Female |
| $2,499 or less | 0 (0.0%) | 13 (8.6%) |
| $2,500 to $4,999 | 3 (1.3%) | 17 (11.3%) |
| $5,000 to $7,499 | 17 (7.1%) | 32 (21.2%) |
| $7,500 to $9,999 | 0 (0.0%) | 0 (0.0%) |
| $10,000 to $12,499 | 0 (0.0%) | 3 (2.0%) |
| $12,500 to $14,999 | 21 (8.7%) | 1 (0.7%) |
| $15,000 to $17,499 | 0 (0.0%) | 0 (0.0%) |
| $17,500 to $19,999 | 10 (4.2%) | 4 (2.6%) |
| $20,000 to $22,499 | 3 (1.3%) | 0 (0.0%) |
| $22,500 to $24,999 | 11 (4.6%) | 3 (2.0%) |
| $25,000 to $29,999 | 27 (11.3%) | 3 (2.0%) |
| $30,000 to $34,999 | 4 (1.7%) | 9 (6.0%) |
| $35,000 to $39,999 | 0 (0.0%) | 2 (1.3%) |
| $40,000 to $44,999 | 11 (4.6%) | 5 (3.3%) |
| $45,000 to $49,999 | 39 (16.3%) | 2 (1.3%) |
| $50,000 to $54,999 | 14 (5.8%) | 6 (4.0%) |
| $55,000 to $64,999 | 33 (13.8%) | 36 (23.8%) |
| $65,000 to $74,999 | 14 (5.8%) | 0 (0.0%) |
| $75,000 to $99,999 | 16 (6.7%) | 10 (6.6%) |
| $100,000+ | 17 (7.1%) | 5 (3.3%) |
| Total | 240 (100.0%) | 151 (100.0%) |
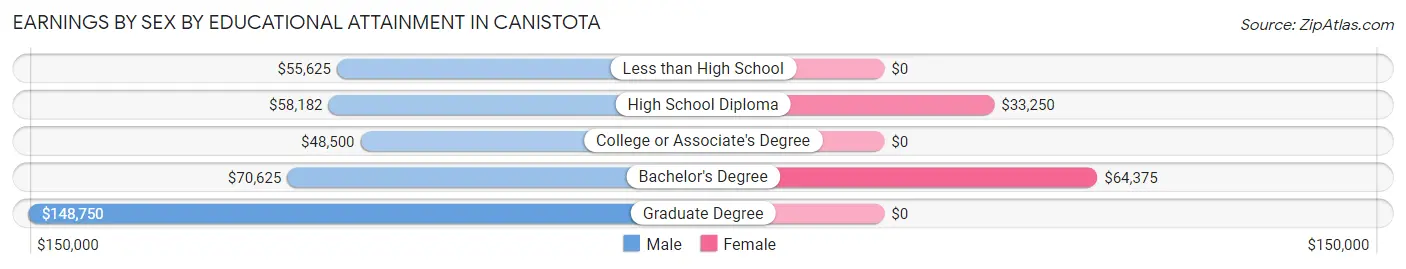
Earnings by Sex by Educational Attainment in Canistota
Average earnings in Canistota are $51,750 for men and $51,875 for women, a difference of 0.2%. Men with an educational attainment of graduate degree enjoy the highest average annual earnings of $148,750, while those with college or associate's degree education earn the least with $48,500. Women with an educational attainment of bachelor's degree earn the most with the average annual earnings of $64,375, while those with high school diploma education have the smallest earnings of $33,250.
| Educational Attainment | Male Income | Female Income |
| Less than High School | $55,625 | $0 |
| High School Diploma | $58,182 | $33,250 |
| College or Associate's Degree | $48,500 | $0 |
| Bachelor's Degree | $70,625 | $64,375 |
| Graduate Degree | $148,750 | $0 |
| Total | $51,750 | $51,875 |
Family Income in Canistota
Family Income Brackets in Canistota
According to the Canistota family income data, there are 62 families falling into the $50,000 to $74,999 income range, which is the most common income bracket and makes up 35.6% of all families.
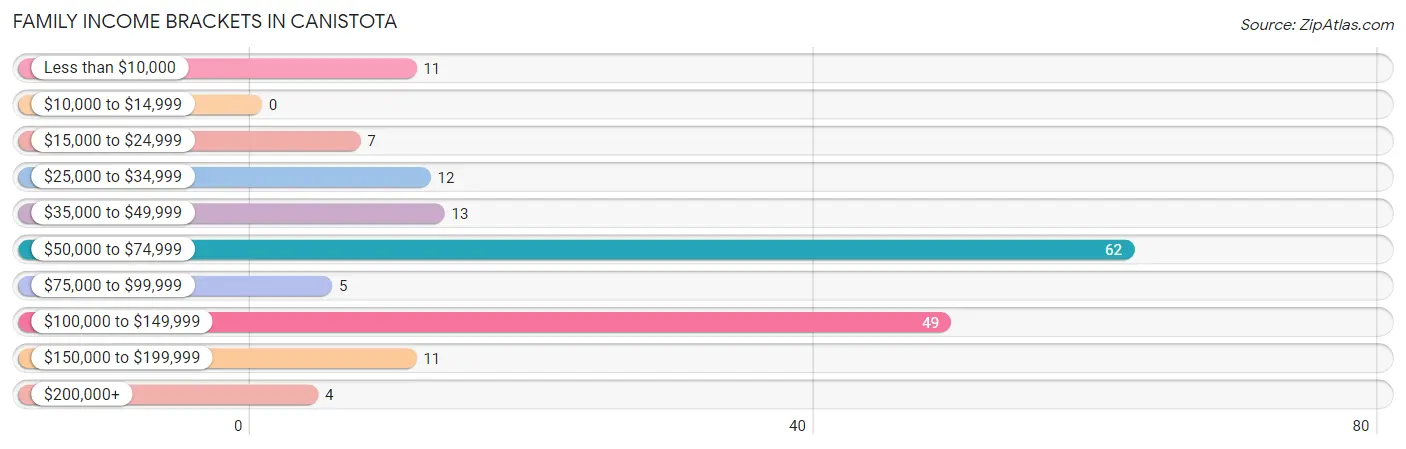
| Income Bracket | # Families | % Families |
| Less than $10,000 | 11 | 6.3% |
| $10,000 to $14,999 | 0 | 0.0% |
| $15,000 to $24,999 | 7 | 4.0% |
| $25,000 to $34,999 | 12 | 6.9% |
| $35,000 to $49,999 | 13 | 7.5% |
| $50,000 to $74,999 | 62 | 35.6% |
| $75,000 to $99,999 | 5 | 2.9% |
| $100,000 to $149,999 | 49 | 28.2% |
| $150,000 to $199,999 | 11 | 6.3% |
| $200,000+ | 4 | 2.3% |
Family Income by Famaliy Size in Canistota
4-person families (19 | 10.9%) account for the highest median family income in Canistota with $112,188 per family, while 2-person families (114 | 65.5%) have the highest median income of $29,853 per family member.
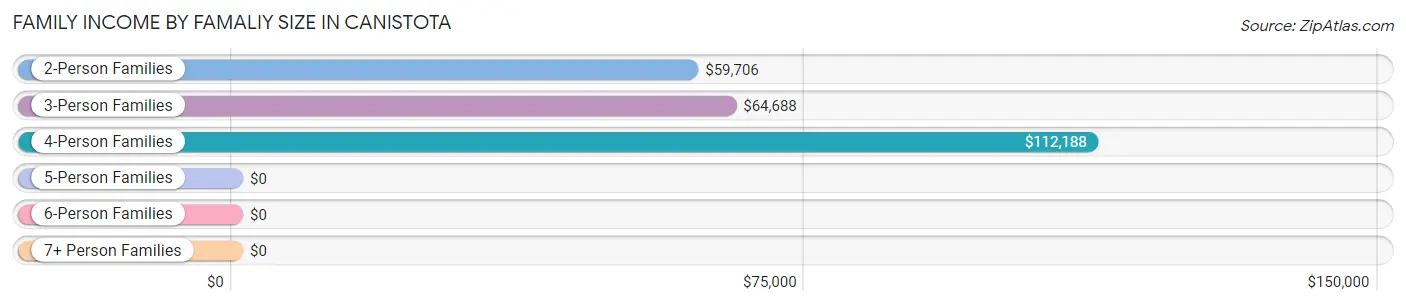
| Income Bracket | # Families | Median Income |
| 2-Person Families | 114 (65.5%) | $59,706 |
| 3-Person Families | 13 (7.5%) | $64,688 |
| 4-Person Families | 19 (10.9%) | $112,188 |
| 5-Person Families | 8 (4.6%) | $0 |
| 6-Person Families | 5 (2.9%) | $0 |
| 7+ Person Families | 15 (8.6%) | $0 |
| Total | 174 (100.0%) | $67,500 |
Family Income by Number of Earners in Canistota
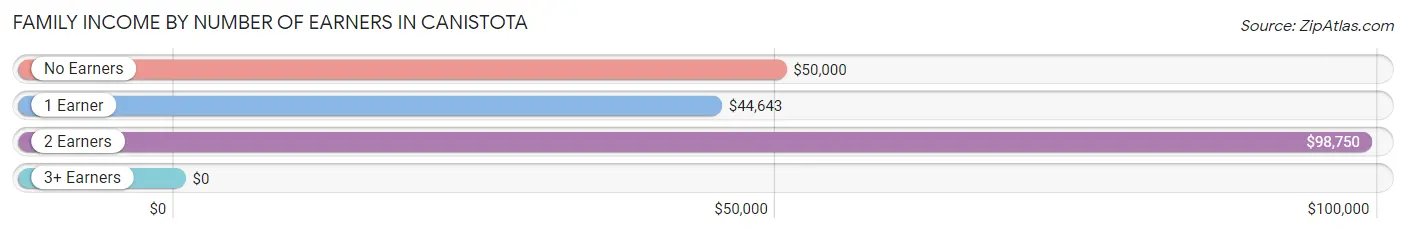
| Number of Earners | # Families | Median Income |
| No Earners | 18 (10.3%) | $50,000 |
| 1 Earner | 40 (23.0%) | $44,643 |
| 2 Earners | 114 (65.5%) | $98,750 |
| 3+ Earners | 2 (1.1%) | $0 |
| Total | 174 (100.0%) | $67,500 |
Household Income in Canistota
Household Income Brackets in Canistota
With 94 households falling in the category, the $50,000 to $74,999 income range is the most frequent in Canistota, accounting for 33.0% of all households.
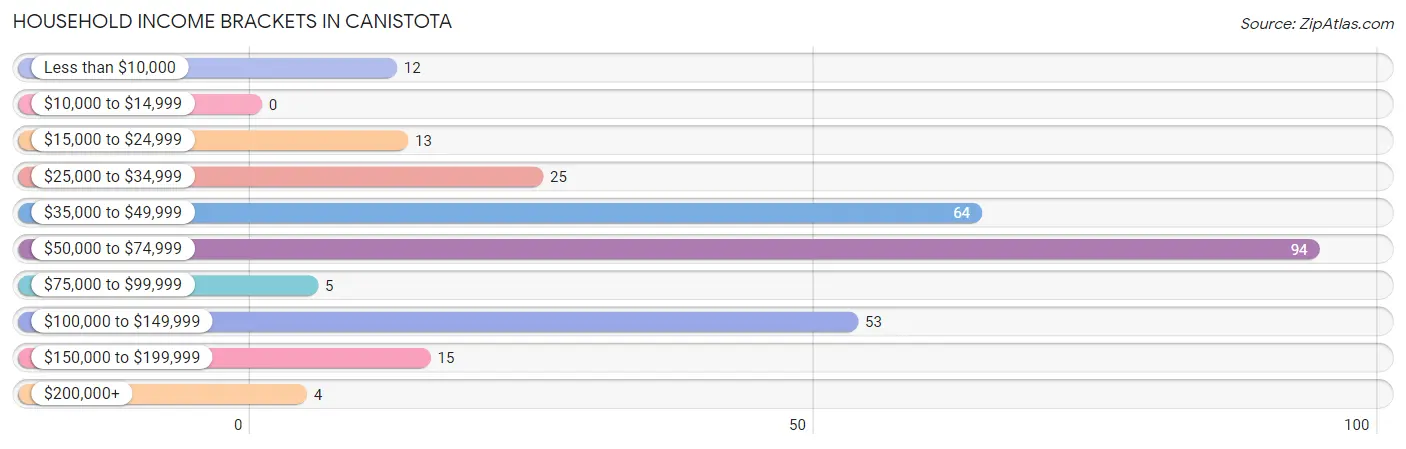
| Income Bracket | # Households | % Households |
| Less than $10,000 | 12 | 4.2% |
| $10,000 to $14,999 | 0 | 0.0% |
| $15,000 to $24,999 | 13 | 4.6% |
| $25,000 to $34,999 | 25 | 8.8% |
| $35,000 to $49,999 | 64 | 22.5% |
| $50,000 to $74,999 | 94 | 33.0% |
| $75,000 to $99,999 | 5 | 1.8% |
| $100,000 to $149,999 | 53 | 18.6% |
| $150,000 to $199,999 | 15 | 5.3% |
| $200,000+ | 4 | 1.4% |
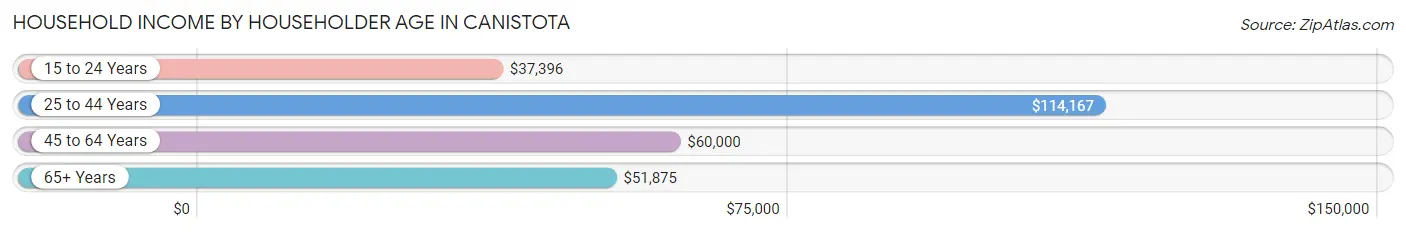
Household Income by Householder Age in Canistota
The median household income in Canistota is $57,557, with the highest median household income of $114,167 found in the 25 to 44 years age bracket for the primary householder. A total of 52 households (18.2%) fall into this category. Meanwhile, the 15 to 24 years age bracket for the primary householder has the lowest median household income of $37,396, with 68 households (23.9%) in this group.
| Income Bracket | # Households | Median Income |
| 15 to 24 Years | 68 (23.9%) | $37,396 |
| 25 to 44 Years | 52 (18.2%) | $114,167 |
| 45 to 64 Years | 128 (44.9%) | $60,000 |
| 65+ Years | 37 (13.0%) | $51,875 |
| Total | 285 (100.0%) | $57,557 |
Poverty in Canistota
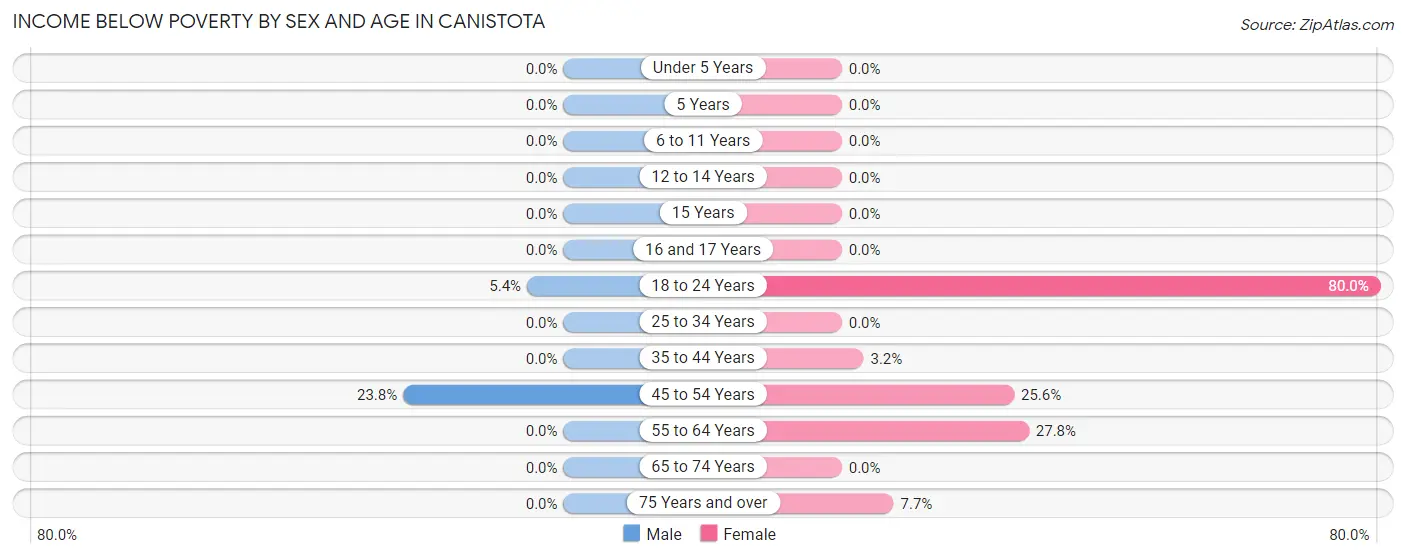
Income Below Poverty by Sex and Age in Canistota
With 4.4% poverty level for males and 15.7% for females among the residents of Canistota, 45 to 54 year old males and 18 to 24 year old females are the most vulnerable to poverty, with 10 males (23.8%) and 24 females (80.0%) in their respective age groups living below the poverty level.
| Age Bracket | Male | Female |
| Under 5 Years | 0 (0.0%) | 0 (0.0%) |
| 5 Years | 0 (0.0%) | 0 (0.0%) |
| 6 to 11 Years | 0 (0.0%) | 0 (0.0%) |
| 12 to 14 Years | 0 (0.0%) | 0 (0.0%) |
| 15 Years | 0 (0.0%) | 0 (0.0%) |
| 16 and 17 Years | 0 (0.0%) | 0 (0.0%) |
| 18 to 24 Years | 4 (5.4%) | 24 (80.0%) |
| 25 to 34 Years | 0 (0.0%) | 0 (0.0%) |
| 35 to 44 Years | 0 (0.0%) | 1 (3.2%) |
| 45 to 54 Years | 10 (23.8%) | 11 (25.6%) |
| 55 to 64 Years | 0 (0.0%) | 10 (27.8%) |
| 65 to 74 Years | 0 (0.0%) | 0 (0.0%) |
| 75 Years and over | 0 (0.0%) | 1 (7.7%) |
| Total | 14 (4.4%) | 47 (15.7%) |
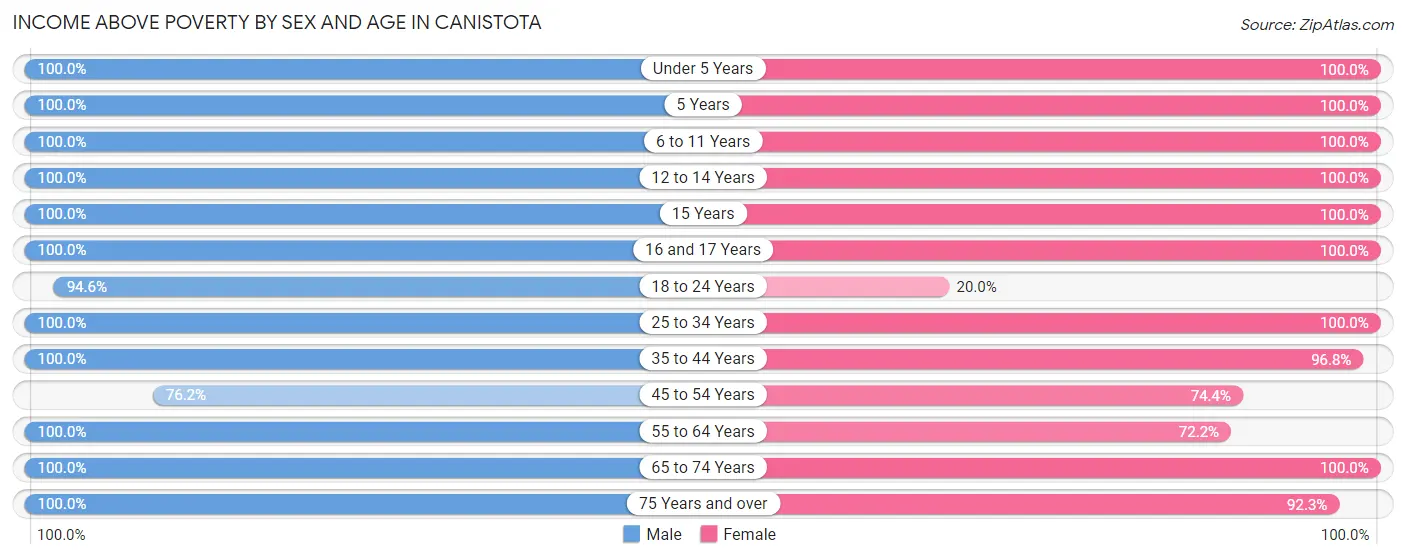
Income Above Poverty by Sex and Age in Canistota
According to the poverty statistics in Canistota, males aged under 5 years and females aged under 5 years are the age groups that are most secure financially, with 100.0% of males and 100.0% of females in these age groups living above the poverty line.
| Age Bracket | Male | Female |
| Under 5 Years | 18 (100.0%) | 43 (100.0%) |
| 5 Years | 7 (100.0%) | 2 (100.0%) |
| 6 to 11 Years | 16 (100.0%) | 19 (100.0%) |
| 12 to 14 Years | 8 (100.0%) | 18 (100.0%) |
| 15 Years | 6 (100.0%) | 1 (100.0%) |
| 16 and 17 Years | 3 (100.0%) | 10 (100.0%) |
| 18 to 24 Years | 70 (94.6%) | 6 (20.0%) |
| 25 to 34 Years | 21 (100.0%) | 30 (100.0%) |
| 35 to 44 Years | 32 (100.0%) | 30 (96.8%) |
| 45 to 54 Years | 32 (76.2%) | 32 (74.4%) |
| 55 to 64 Years | 66 (100.0%) | 26 (72.2%) |
| 65 to 74 Years | 19 (100.0%) | 23 (100.0%) |
| 75 Years and over | 4 (100.0%) | 12 (92.3%) |
| Total | 302 (95.6%) | 252 (84.3%) |
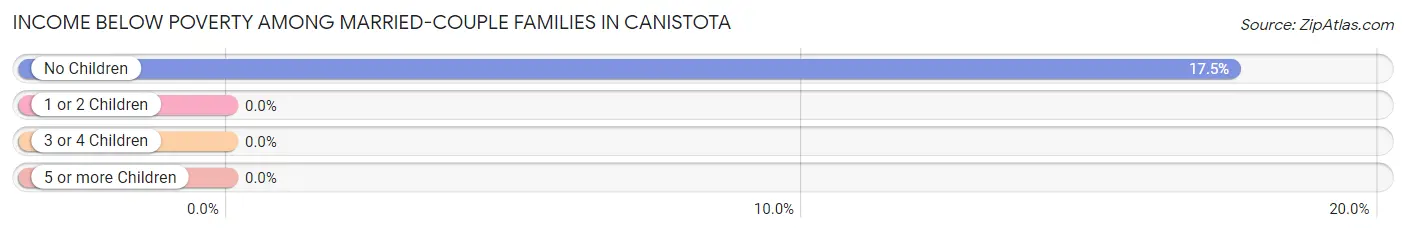
Income Below Poverty Among Married-Couple Families in Canistota
The poverty statistics for married-couple families in Canistota show that 9.8% or 11 of the total 112 families live below the poverty line. Families with no children have the highest poverty rate of 17.5%, comprising of 11 families. On the other hand, families with 1 or 2 children have the lowest poverty rate of 0.0%, which includes 0 families.
| Children | Above Poverty | Below Poverty |
| No Children | 52 (82.5%) | 11 (17.5%) |
| 1 or 2 Children | 21 (100.0%) | 0 (0.0%) |
| 3 or 4 Children | 13 (100.0%) | 0 (0.0%) |
| 5 or more Children | 15 (100.0%) | 0 (0.0%) |
| Total | 101 (90.2%) | 11 (9.8%) |
Income Below Poverty Among Single-Parent Households in Canistota
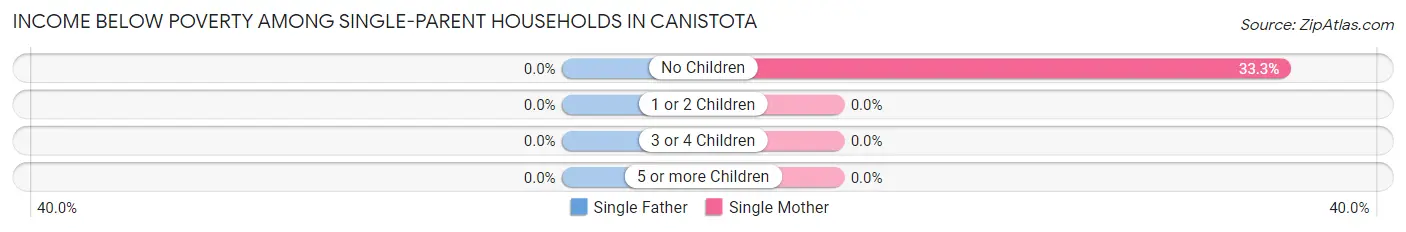
| Children | Single Father | Single Mother |
| No Children | 0 (0.0%) | 7 (33.3%) |
| 1 or 2 Children | 0 (0.0%) | 0 (0.0%) |
| 3 or 4 Children | 0 (0.0%) | 0 (0.0%) |
| 5 or more Children | 0 (0.0%) | 0 (0.0%) |
| Total | 0 (0.0%) | 7 (28.0%) |
Income Below Poverty Among Married-Couple vs Single-Parent Households in Canistota
The poverty data for Canistota shows that 11 of the married-couple family households (9.8%) and 7 of the single-parent households (11.3%) are living below the poverty level. Within the married-couple family households, those with no children have the highest poverty rate, with 11 households (17.5%) falling below the poverty line. Among the single-parent households, those with no children have the highest poverty rate, with 7 household (17.5%) living below poverty.
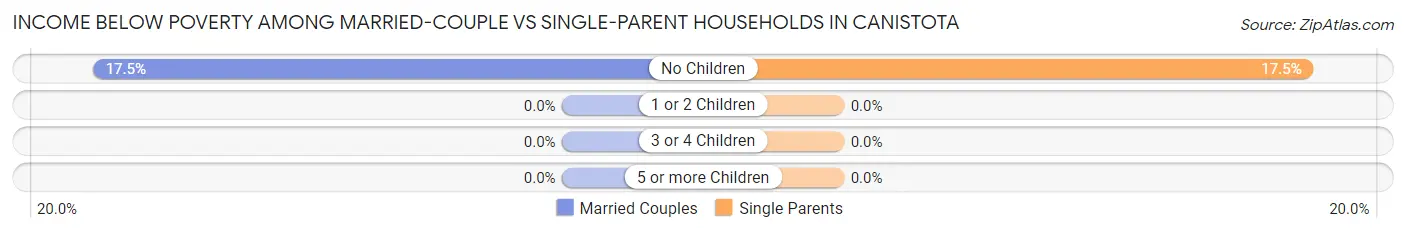
| Children | Married-Couple Families | Single-Parent Households |
| No Children | 11 (17.5%) | 7 (17.5%) |
| 1 or 2 Children | 0 (0.0%) | 0 (0.0%) |
| 3 or 4 Children | 0 (0.0%) | 0 (0.0%) |
| 5 or more Children | 0 (0.0%) | 0 (0.0%) |
| Total | 11 (9.8%) | 7 (11.3%) |
Race in Canistota
The most populous races in Canistota are White / Caucasian (614 | 91.6%), Hispanic or Latino (81 | 12.1%), and Two or more Races (44 | 6.6%).
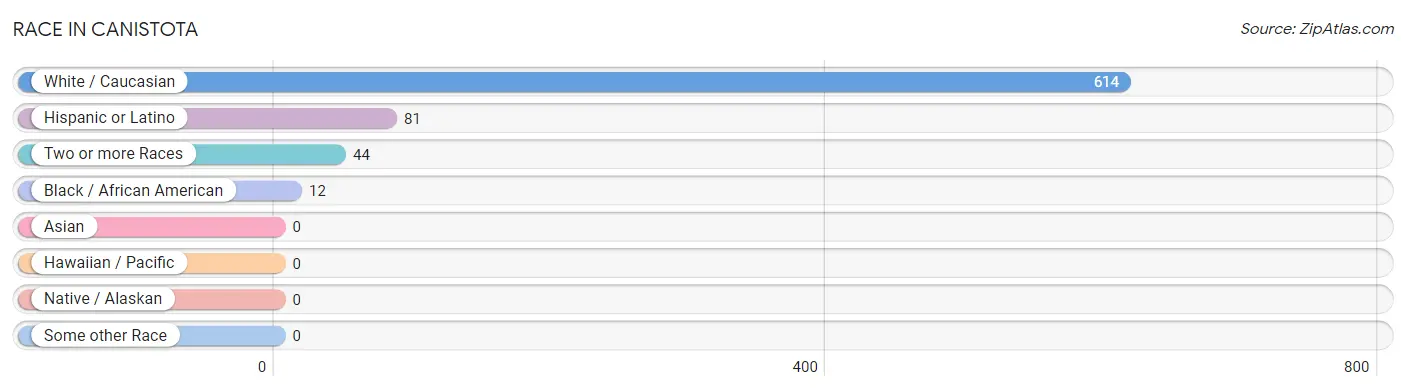
| Race | # Population | % Population |
| Asian | 0 | 0.0% |
| Black / African American | 12 | 1.8% |
| Hawaiian / Pacific | 0 | 0.0% |
| Hispanic or Latino | 81 | 12.1% |
| Native / Alaskan | 0 | 0.0% |
| White / Caucasian | 614 | 91.6% |
| Two or more Races | 44 | 6.6% |
| Some other Race | 0 | 0.0% |
| Total | 670 | 100.0% |
Ancestry in Canistota
The most populous ancestries reported in Canistota are German (257 | 38.4%), Irish (90 | 13.4%), Dutch (64 | 9.6%), Norwegian (52 | 7.8%), and English (41 | 6.1%), together accounting for 75.2% of all Canistota residents.
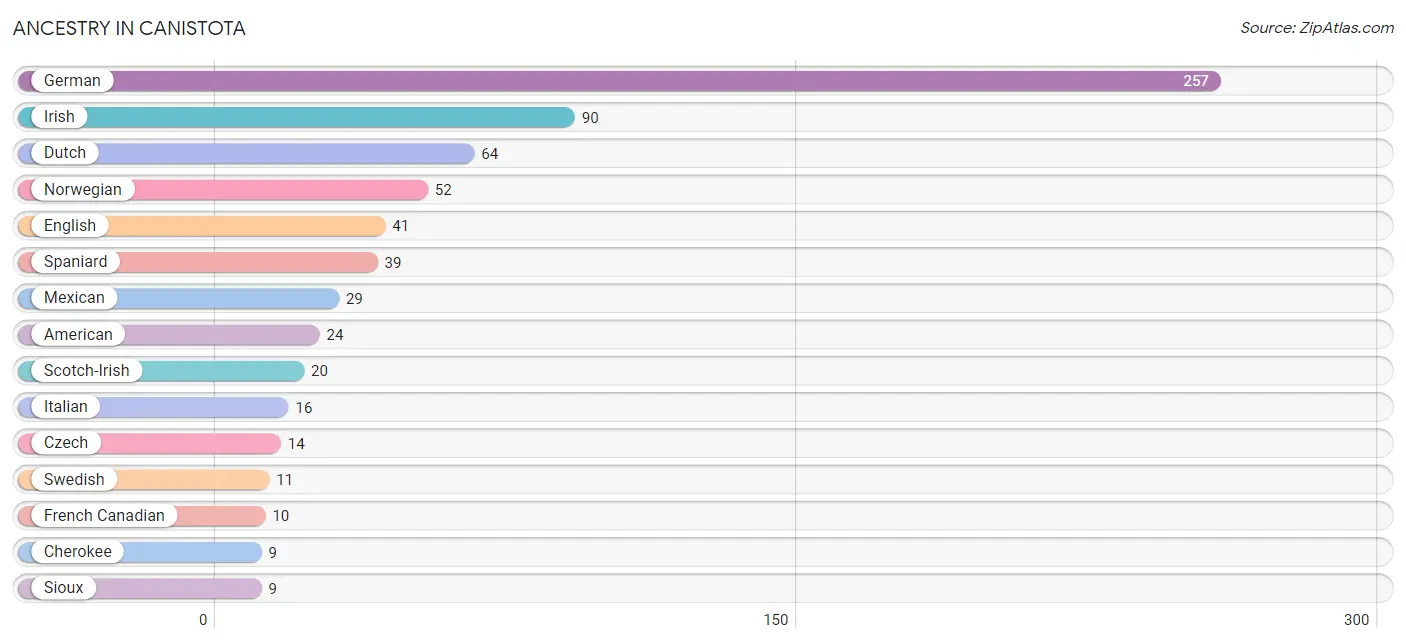
| Ancestry | # Population | % Population |
| American | 24 | 3.6% |
| Cherokee | 9 | 1.3% |
| Czech | 14 | 2.1% |
| Danish | 8 | 1.2% |
| Dutch | 64 | 9.6% |
| English | 41 | 6.1% |
| French | 7 | 1.0% |
| French Canadian | 10 | 1.5% |
| German | 257 | 38.4% |
| Indian (Asian) | 3 | 0.4% |
| Irish | 90 | 13.4% |
| Italian | 16 | 2.4% |
| Mexican | 29 | 4.3% |
| Norwegian | 52 | 7.8% |
| Polish | 2 | 0.3% |
| Scotch-Irish | 20 | 3.0% |
| Scottish | 2 | 0.3% |
| Sioux | 9 | 1.3% |
| Spaniard | 39 | 5.8% |
| Swedish | 11 | 1.6% | View All 20 Rows |
Immigrants in Canistota
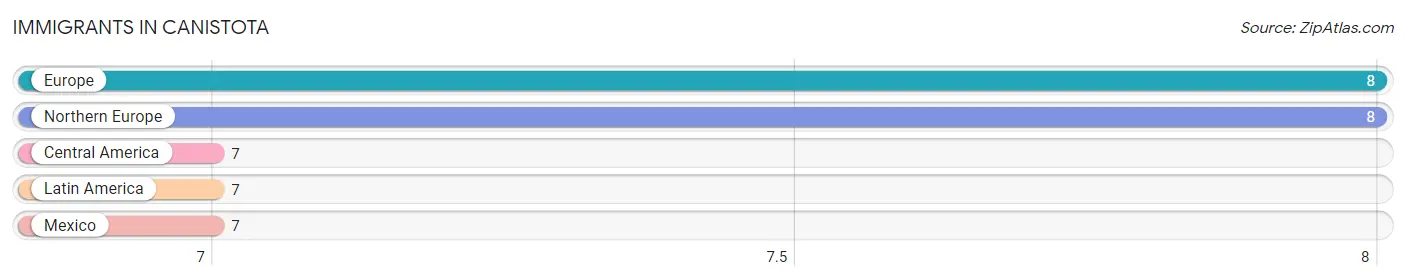
The most numerous immigrant groups reported in Canistota came from Europe (8 | 1.2%), Northern Europe (8 | 1.2%), Central America (7 | 1.0%), Latin America (7 | 1.0%), and Mexico (7 | 1.0%), together accounting for 5.5% of all Canistota residents.
| Immigration Origin | # Population | % Population |
| Central America | 7 | 1.0% |
| Europe | 8 | 1.2% |
| Latin America | 7 | 1.0% |
| Mexico | 7 | 1.0% |
| Northern Europe | 8 | 1.2% | View All 5 Rows |
Sex and Age in Canistota
Sex and Age in Canistota
The most populous age groups in Canistota are 20 to 24 Years (68 | 20.0%) for men and Under 5 Years (43 | 13.0%) for women.
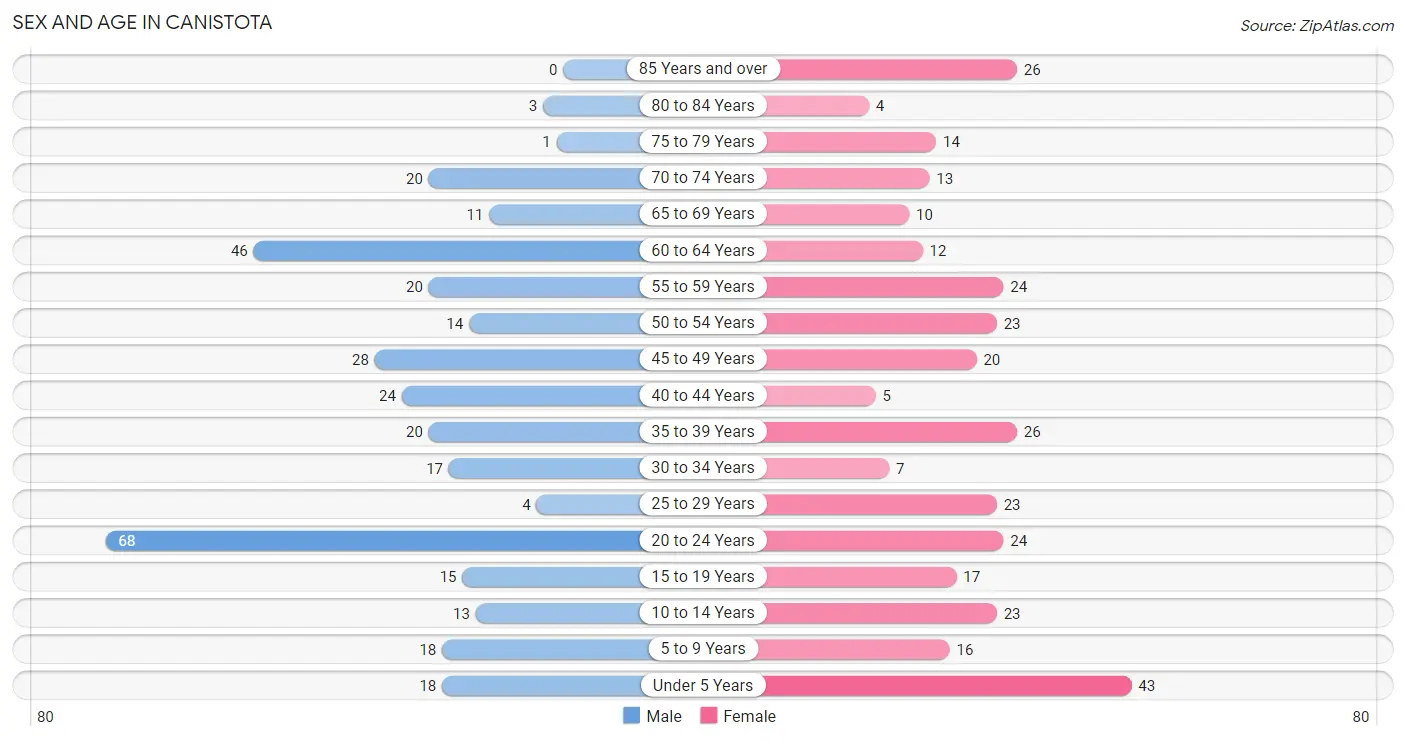
| Age Bracket | Male | Female |
| Under 5 Years | 18 (5.3%) | 43 (13.0%) |
| 5 to 9 Years | 18 (5.3%) | 16 (4.9%) |
| 10 to 14 Years | 13 (3.8%) | 23 (7.0%) |
| 15 to 19 Years | 15 (4.4%) | 17 (5.1%) |
| 20 to 24 Years | 68 (20.0%) | 24 (7.3%) |
| 25 to 29 Years | 4 (1.2%) | 23 (7.0%) |
| 30 to 34 Years | 17 (5.0%) | 7 (2.1%) |
| 35 to 39 Years | 20 (5.9%) | 26 (7.9%) |
| 40 to 44 Years | 24 (7.1%) | 5 (1.5%) |
| 45 to 49 Years | 28 (8.2%) | 20 (6.1%) |
| 50 to 54 Years | 14 (4.1%) | 23 (7.0%) |
| 55 to 59 Years | 20 (5.9%) | 24 (7.3%) |
| 60 to 64 Years | 46 (13.5%) | 12 (3.6%) |
| 65 to 69 Years | 11 (3.2%) | 10 (3.0%) |
| 70 to 74 Years | 20 (5.9%) | 13 (3.9%) |
| 75 to 79 Years | 1 (0.3%) | 14 (4.2%) |
| 80 to 84 Years | 3 (0.9%) | 4 (1.2%) |
| 85 Years and over | 0 (0.0%) | 26 (7.9%) |
| Total | 340 (100.0%) | 330 (100.0%) |
Families and Households in Canistota
Median Family Size in Canistota
The median family size in Canistota is 2.71 persons per family, with married-couple families (112 | 64.4%) accounting for the largest median family size of 3.27 persons per family. On the other hand, single female/mother families (25 | 14.4%) represent the smallest median family size with 1.64 persons per family.
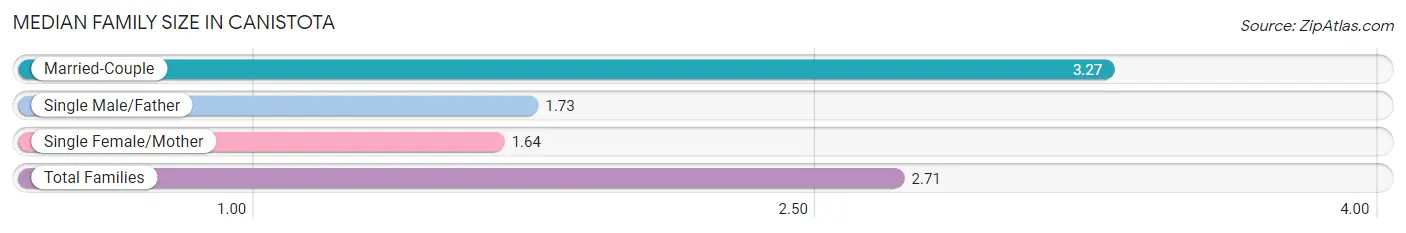
| Family Type | # Families | Family Size |
| Married-Couple | 112 (64.4%) | 3.27 |
| Single Male/Father | 37 (21.3%) | 1.73 |
| Single Female/Mother | 25 (14.4%) | 1.64 |
| Total Families | 174 (100.0%) | 2.71 |
Median Household Size in Canistota
The median household size in Canistota is 2.16 persons per household, with married-couple households (112 | 39.3%) accounting for the largest median household size of 3.27 persons per household. non-family households (111 | 39.0%) represent the smallest median household size with 1.23 persons per household.
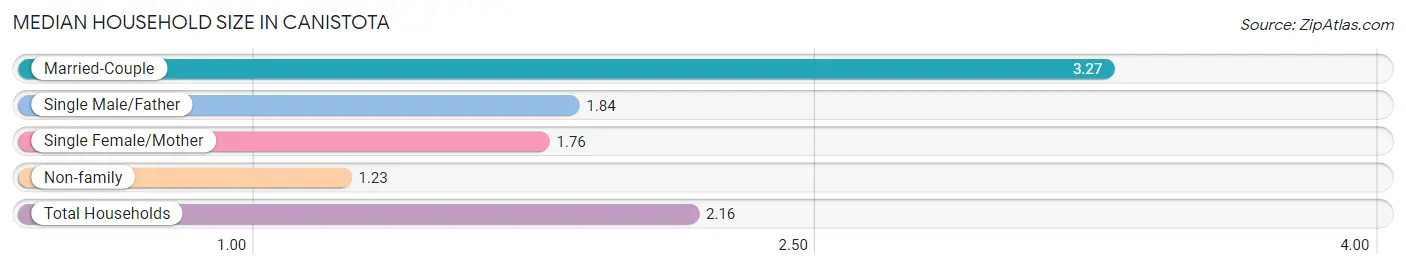
| Household Type | # Households | Household Size |
| Married-Couple | 112 (39.3%) | 3.27 |
| Single Male/Father | 37 (13.0%) | 1.84 |
| Single Female/Mother | 25 (8.8%) | 1.76 |
| Non-family | 111 (39.0%) | 1.23 |
| Total Households | 285 (100.0%) | 2.16 |
Household Size by Marriage Status in Canistota
Out of a total of 285 households in Canistota, 174 (61.1%) are family households, while 111 (39.0%) are nonfamily households. The most numerous type of family households are 2-person households, comprising 112, and the most common type of nonfamily households are 1-person households, comprising 73.
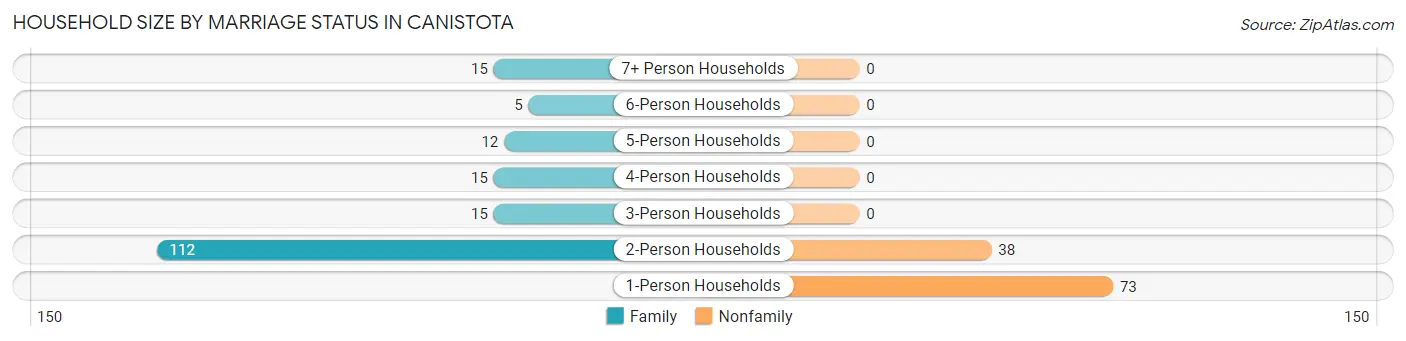
| Household Size | Family Households | Nonfamily Households |
| 1-Person Households | - | 73 (25.6%) |
| 2-Person Households | 112 (39.3%) | 38 (13.3%) |
| 3-Person Households | 15 (5.3%) | 0 (0.0%) |
| 4-Person Households | 15 (5.3%) | 0 (0.0%) |
| 5-Person Households | 12 (4.2%) | 0 (0.0%) |
| 6-Person Households | 5 (1.8%) | 0 (0.0%) |
| 7+ Person Households | 15 (5.3%) | 0 (0.0%) |
| Total | 174 (61.1%) | 111 (39.0%) |
Female Fertility in Canistota
Fertility by Age in Canistota
Average fertility rate in Canistota is 303.0 births per 1,000 women. Women in the age bracket of 20 to 34 years have the highest fertility rate with 593.0 births per 1,000 women. Women in the age bracket of 20 to 34 years acount for 86.5% of all women with births.
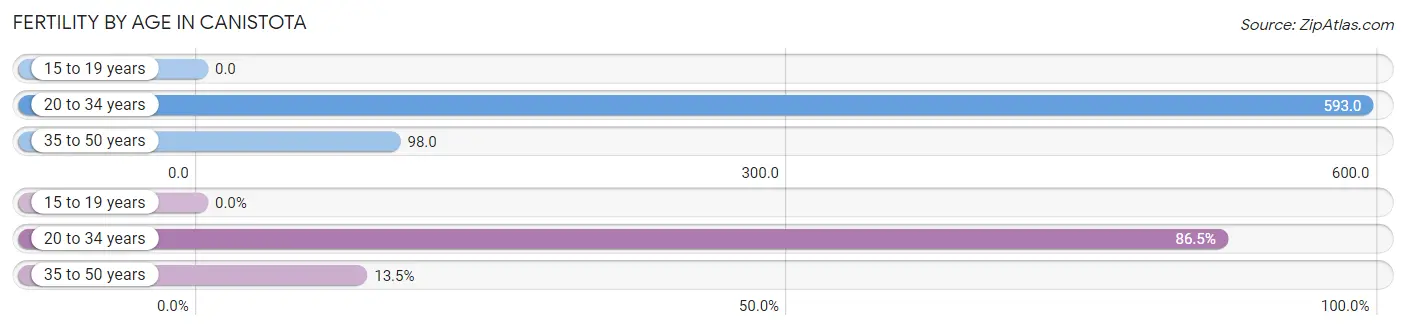
| Age Bracket | Women with Births | Births / 1,000 Women |
| 15 to 19 years | 0 (0.0%) | 0.0 |
| 20 to 34 years | 32 (86.5%) | 593.0 |
| 35 to 50 years | 5 (13.5%) | 98.0 |
| Total | 37 (100.0%) | 303.0 |
Fertility by Age by Marriage Status in Canistota
35.1% of women with births (37) in Canistota are married. The highest percentage of unmarried women with births falls into 20 to 34 years age bracket with 75.0% of them unmarried at the time of birth, while the lowest percentage of unmarried women with births belong to 35 to 50 years age bracket with 0.0% of them unmarried.
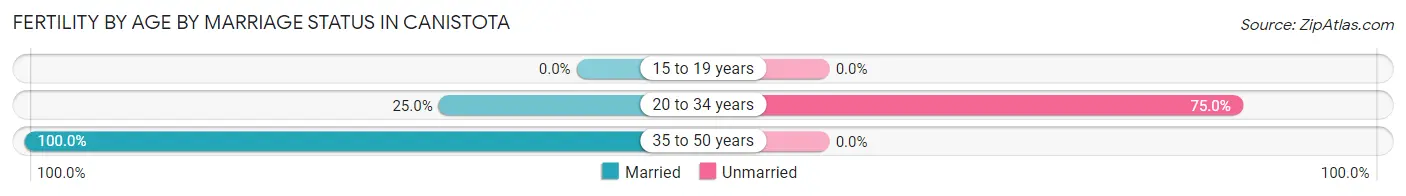
| Age Bracket | Married | Unmarried |
| 15 to 19 years | 0 (0.0%) | 0 (0.0%) |
| 20 to 34 years | 8 (25.0%) | 24 (75.0%) |
| 35 to 50 years | 5 (100.0%) | 0 (0.0%) |
| Total | 13 (35.1%) | 24 (64.9%) |
Fertility by Education in Canistota
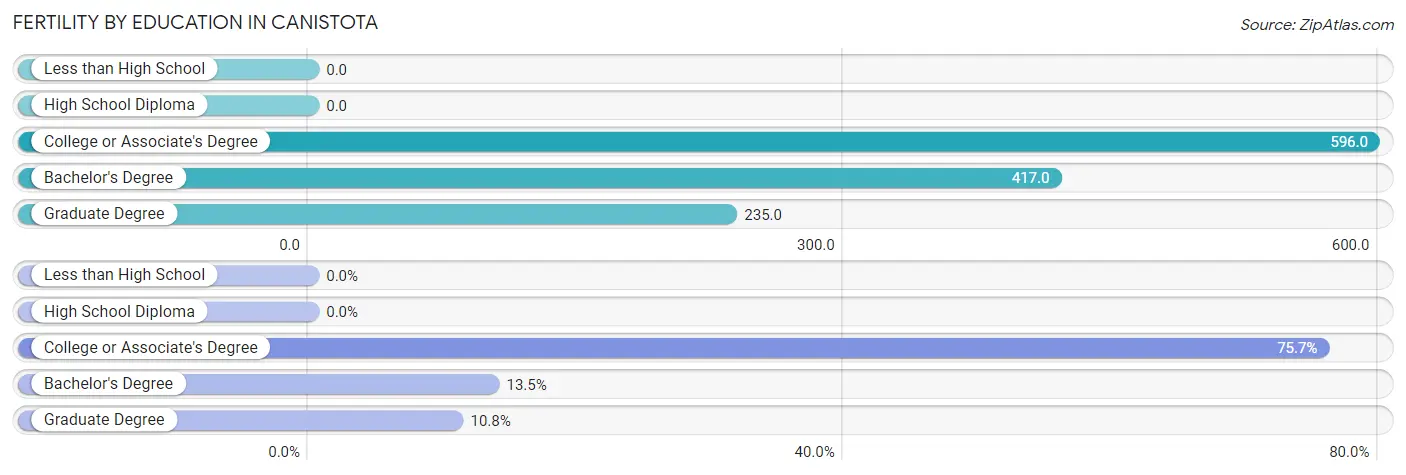
| Educational Attainment | Women with Births | Births / 1,000 Women |
| Less than High School | 0 (0.0%) | 0.0 |
| High School Diploma | 0 (0.0%) | 0.0 |
| College or Associate's Degree | 28 (75.7%) | 596.0 |
| Bachelor's Degree | 5 (13.5%) | 417.0 |
| Graduate Degree | 4 (10.8%) | 235.0 |
| Total | 37 (100.0%) | 303.0 |
Fertility by Education by Marriage Status in Canistota
64.9% of women with births in Canistota are unmarried. Women with the educational attainment of bachelor's degree are most likely to be married with 100.0% of them married at childbirth, while women with the educational attainment of college or associate's degree are least likely to be married with 85.7% of them unmarried at childbirth.
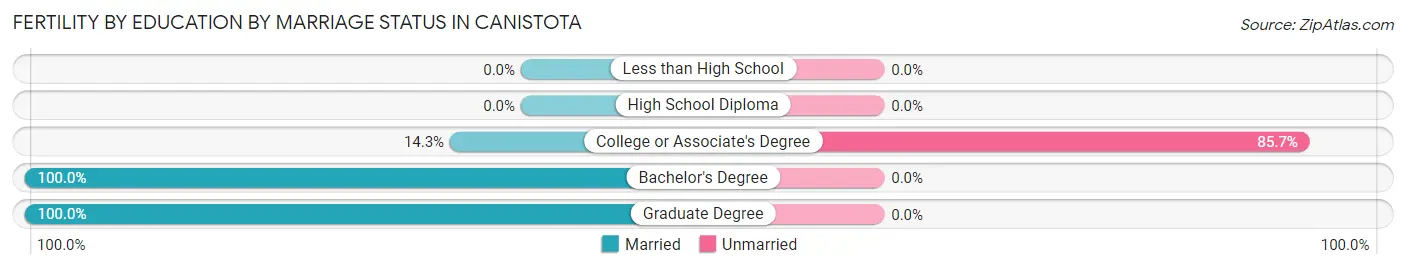
| Educational Attainment | Married | Unmarried |
| Less than High School | 0 (0.0%) | 0 (0.0%) |
| High School Diploma | 0 (0.0%) | 0 (0.0%) |
| College or Associate's Degree | 4 (14.3%) | 24 (85.7%) |
| Bachelor's Degree | 5 (100.0%) | 0 (0.0%) |
| Graduate Degree | 4 (100.0%) | 0 (0.0%) |
| Total | 13 (35.1%) | 24 (64.9%) |
Employment Characteristics in Canistota
Employment by Class of Employer in Canistota
Among the 355 employed individuals in Canistota, private company employees (225 | 63.4%), not-for-profit organizations (52 | 14.6%), and self-employed (not incorporated) (31 | 8.7%) make up the most common classes of employment.
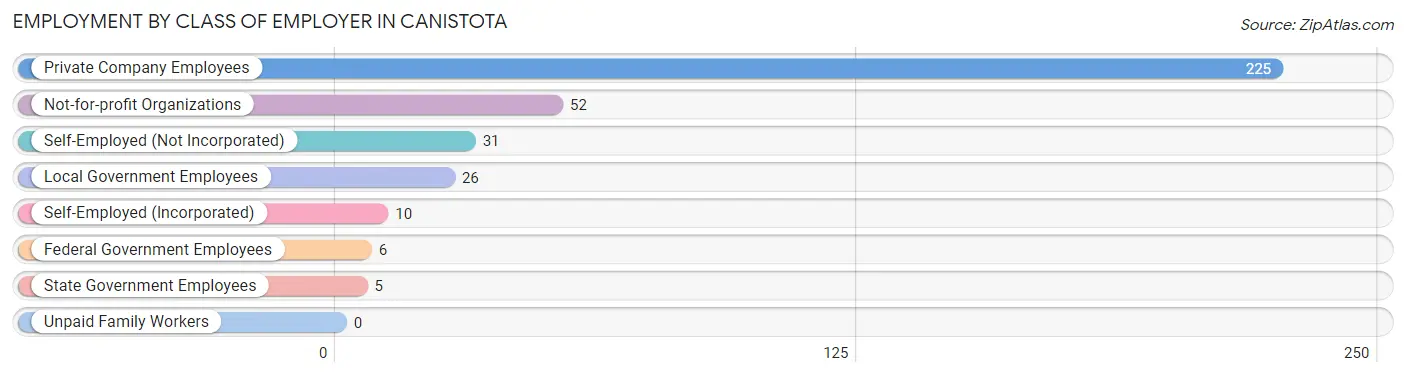
| Employer Class | # Employees | % Employees |
| Private Company Employees | 225 | 63.4% |
| Self-Employed (Incorporated) | 10 | 2.8% |
| Self-Employed (Not Incorporated) | 31 | 8.7% |
| Not-for-profit Organizations | 52 | 14.6% |
| Local Government Employees | 26 | 7.3% |
| State Government Employees | 5 | 1.4% |
| Federal Government Employees | 6 | 1.7% |
| Unpaid Family Workers | 0 | 0.0% |
| Total | 355 | 100.0% |
Employment Status by Age in Canistota
According to the labor force statistics for Canistota, out of the total population over 16 years of age (532), 69.0% or 367 individuals are in the labor force, with 3.3% or 12 of them unemployed. The age group with the highest labor force participation rate is 30 to 34 years, with 100.0% or 24 individuals in the labor force. Within the labor force, the 65 to 74 years age range has the highest percentage of unemployed individuals, with 33.3% or 5 of them being unemployed.
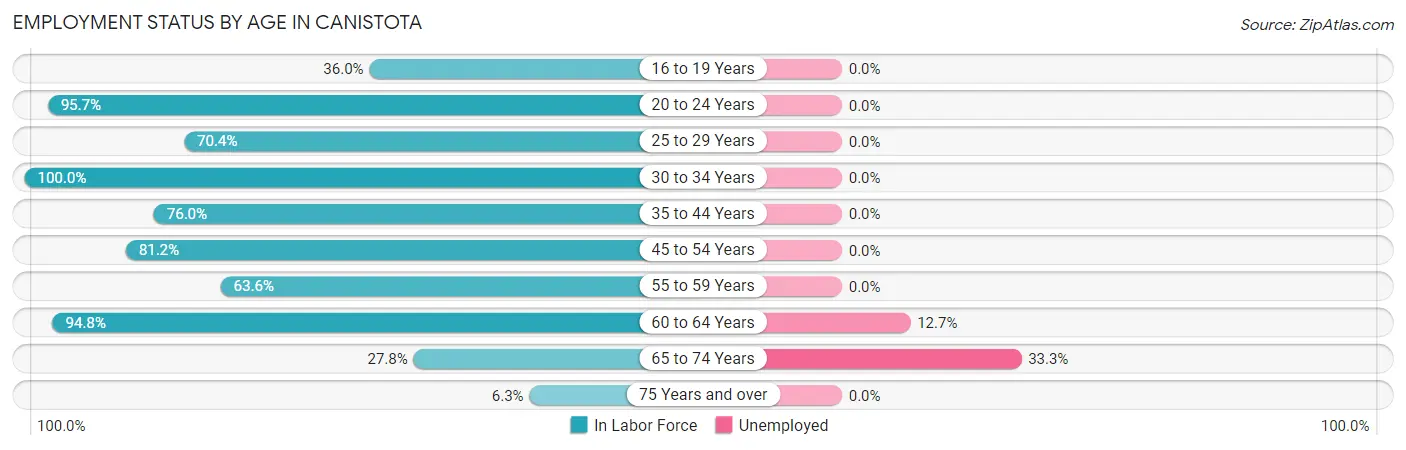
| Age Bracket | In Labor Force | Unemployed |
| 16 to 19 Years | 9 (36.0%) | 0 (0.0%) |
| 20 to 24 Years | 88 (95.7%) | 0 (0.0%) |
| 25 to 29 Years | 19 (70.4%) | 0 (0.0%) |
| 30 to 34 Years | 24 (100.0%) | 0 (0.0%) |
| 35 to 44 Years | 57 (76.0%) | 0 (0.0%) |
| 45 to 54 Years | 69 (81.2%) | 0 (0.0%) |
| 55 to 59 Years | 28 (63.6%) | 0 (0.0%) |
| 60 to 64 Years | 55 (94.8%) | 7 (12.7%) |
| 65 to 74 Years | 15 (27.8%) | 5 (33.3%) |
| 75 Years and over | 3 (6.3%) | 0 (0.0%) |
| Total | 367 (69.0%) | 12 (3.3%) |
Employment Status by Educational Attainment in Canistota
According to labor force statistics for Canistota, 80.5% of individuals (252) out of the total population between 25 and 64 years of age (313) are in the labor force, with 2.8% or 7 of them being unemployed. The group with the highest labor force participation rate are those with the educational attainment of college / associate degree, with 89.9% or 98 individuals in the labor force. Within the labor force, individuals with high school diploma education have the highest percentage of unemployment, with 7.8% or 7 of them being unemployed.
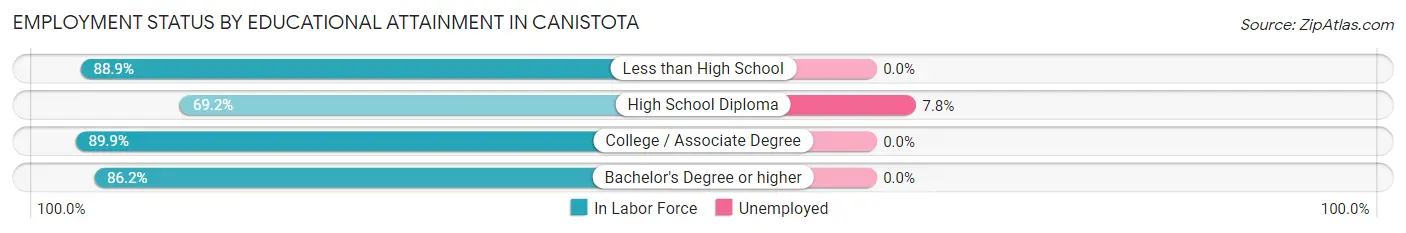
| Educational Attainment | In Labor Force | Unemployed |
| Less than High School | 8 (88.9%) | 0 (0.0%) |
| High School Diploma | 90 (69.2%) | 10 (7.8%) |
| College / Associate Degree | 98 (89.9%) | 0 (0.0%) |
| Bachelor's Degree or higher | 56 (86.2%) | 0 (0.0%) |
| Total | 252 (80.5%) | 9 (2.8%) |
Employment Occupations by Sex in Canistota
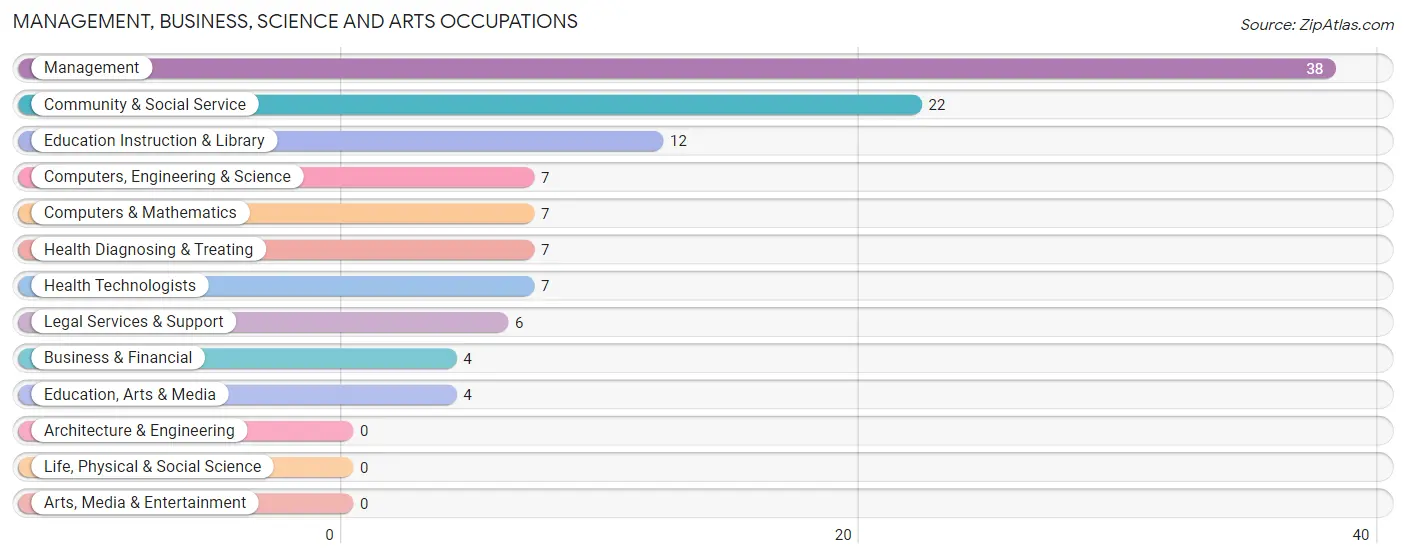
Management, Business, Science and Arts Occupations
The most common Management, Business, Science and Arts occupations in Canistota are Management (38 | 10.9%), Community & Social Service (22 | 6.3%), Education Instruction & Library (12 | 3.4%), Computers, Engineering & Science (7 | 2.0%), and Computers & Mathematics (7 | 2.0%).
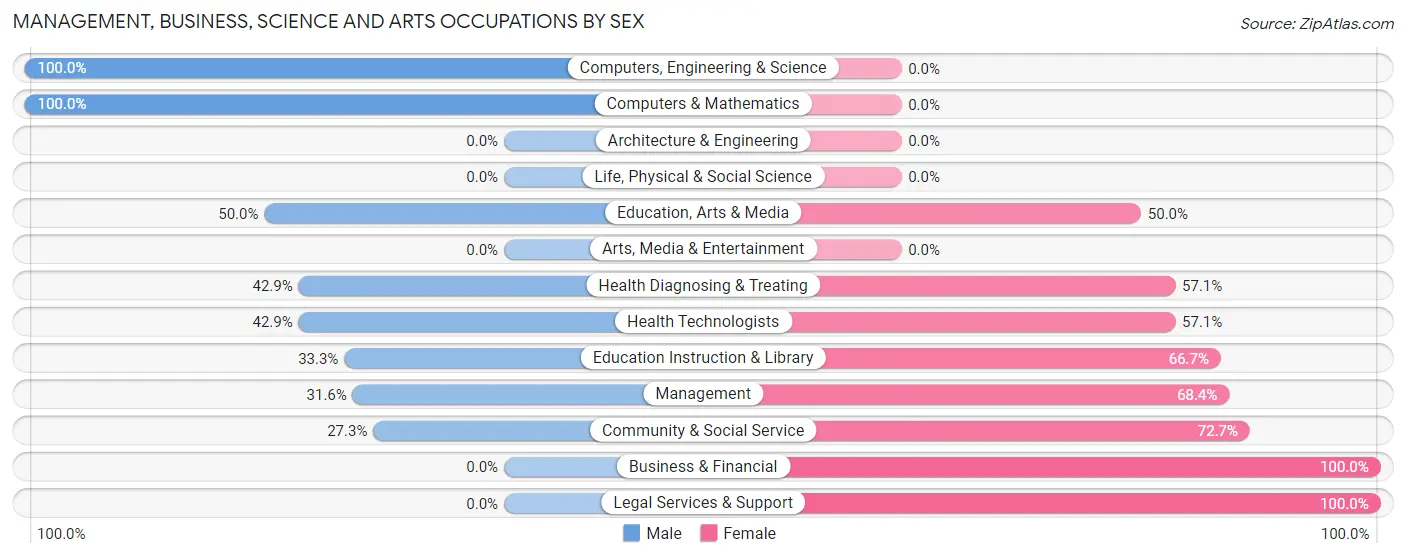
Management, Business, Science and Arts Occupations by Sex
Within the Management, Business, Science and Arts occupations in Canistota, the most male-oriented occupations are Computers, Engineering & Science (100.0%), Computers & Mathematics (100.0%), and Education, Arts & Media (50.0%), while the most female-oriented occupations are Business & Financial (100.0%), Legal Services & Support (100.0%), and Community & Social Service (72.7%).
| Occupation | Male | Female |
| Management | 12 (31.6%) | 26 (68.4%) |
| Business & Financial | 0 (0.0%) | 4 (100.0%) |
| Computers, Engineering & Science | 7 (100.0%) | 0 (0.0%) |
| Computers & Mathematics | 7 (100.0%) | 0 (0.0%) |
| Architecture & Engineering | 0 (0.0%) | 0 (0.0%) |
| Life, Physical & Social Science | 0 (0.0%) | 0 (0.0%) |
| Community & Social Service | 6 (27.3%) | 16 (72.7%) |
| Education, Arts & Media | 2 (50.0%) | 2 (50.0%) |
| Legal Services & Support | 0 (0.0%) | 6 (100.0%) |
| Education Instruction & Library | 4 (33.3%) | 8 (66.7%) |
| Arts, Media & Entertainment | 0 (0.0%) | 0 (0.0%) |
| Health Diagnosing & Treating | 3 (42.9%) | 4 (57.1%) |
| Health Technologists | 3 (42.9%) | 4 (57.1%) |
| Total (Category) | 28 (35.9%) | 50 (64.1%) |
| Total (Overall) | 222 (63.6%) | 127 (36.4%) |
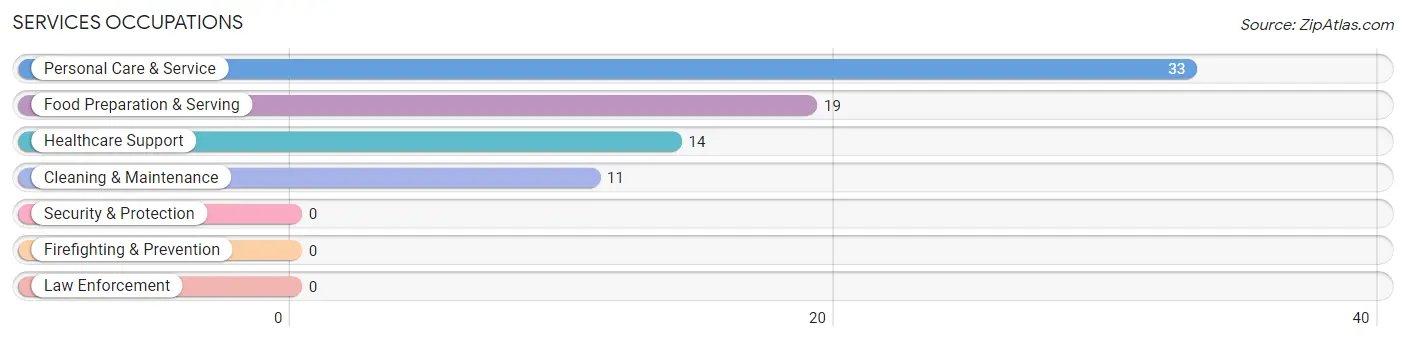
Services Occupations
The most common Services occupations in Canistota are Personal Care & Service (33 | 9.5%), Food Preparation & Serving (19 | 5.4%), Healthcare Support (14 | 4.0%), and Cleaning & Maintenance (11 | 3.2%).
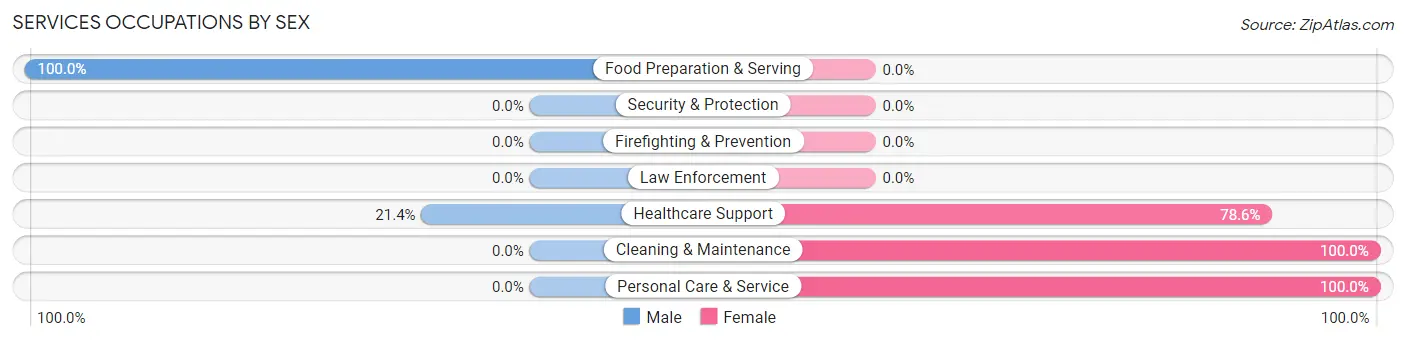
Services Occupations by Sex
Within the Services occupations in Canistota, the most male-oriented occupations are Food Preparation & Serving (100.0%), and Healthcare Support (21.4%), while the most female-oriented occupations are Cleaning & Maintenance (100.0%), Personal Care & Service (100.0%), and Healthcare Support (78.6%).
| Occupation | Male | Female |
| Healthcare Support | 3 (21.4%) | 11 (78.6%) |
| Security & Protection | 0 (0.0%) | 0 (0.0%) |
| Firefighting & Prevention | 0 (0.0%) | 0 (0.0%) |
| Law Enforcement | 0 (0.0%) | 0 (0.0%) |
| Food Preparation & Serving | 19 (100.0%) | 0 (0.0%) |
| Cleaning & Maintenance | 0 (0.0%) | 11 (100.0%) |
| Personal Care & Service | 0 (0.0%) | 33 (100.0%) |
| Total (Category) | 22 (28.6%) | 55 (71.4%) |
| Total (Overall) | 222 (63.6%) | 127 (36.4%) |
Sales and Office Occupations
The most common Sales and Office occupations in Canistota are Sales & Related (31 | 8.9%), and Office & Administration (27 | 7.7%).
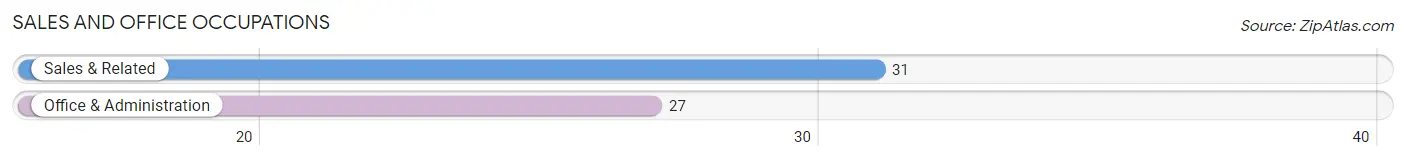
Sales and Office Occupations by Sex
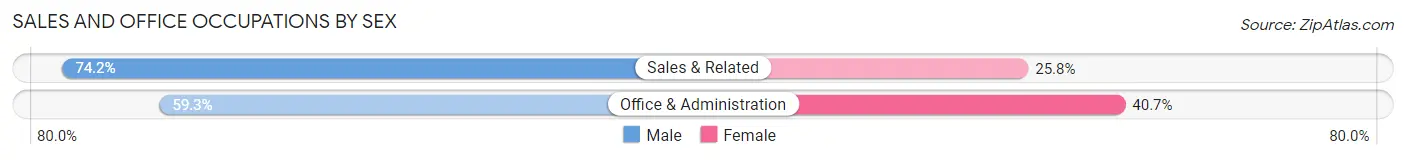
| Occupation | Male | Female |
| Sales & Related | 23 (74.2%) | 8 (25.8%) |
| Office & Administration | 16 (59.3%) | 11 (40.7%) |
| Total (Category) | 39 (67.2%) | 19 (32.8%) |
| Total (Overall) | 222 (63.6%) | 127 (36.4%) |
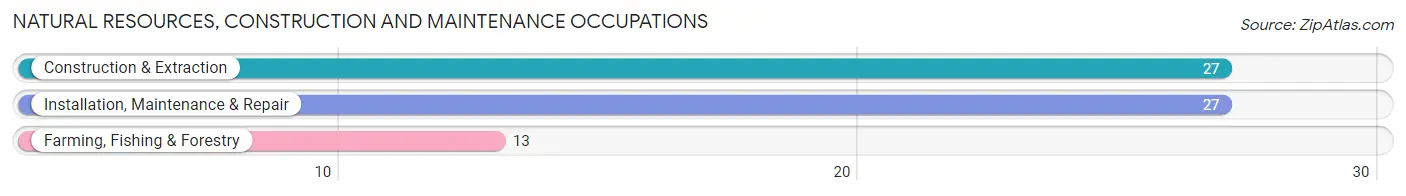
Natural Resources, Construction and Maintenance Occupations
The most common Natural Resources, Construction and Maintenance occupations in Canistota are Construction & Extraction (27 | 7.7%), Installation, Maintenance & Repair (27 | 7.7%), and Farming, Fishing & Forestry (13 | 3.7%).
Natural Resources, Construction and Maintenance Occupations by Sex
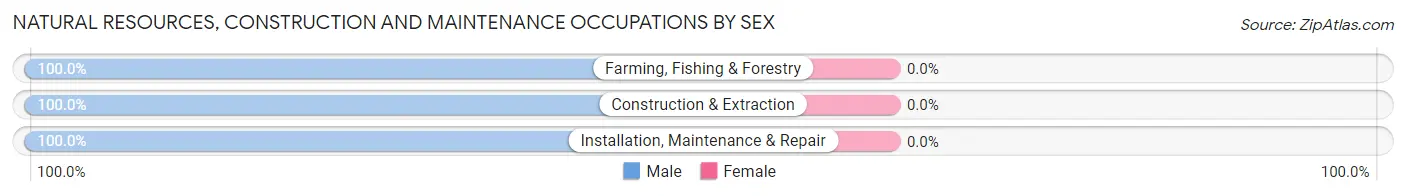
| Occupation | Male | Female |
| Farming, Fishing & Forestry | 13 (100.0%) | 0 (0.0%) |
| Construction & Extraction | 27 (100.0%) | 0 (0.0%) |
| Installation, Maintenance & Repair | 27 (100.0%) | 0 (0.0%) |
| Total (Category) | 67 (100.0%) | 0 (0.0%) |
| Total (Overall) | 222 (63.6%) | 127 (36.4%) |
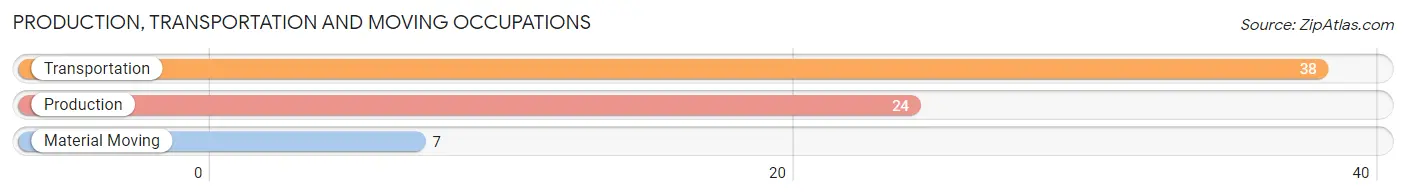
Production, Transportation and Moving Occupations
The most common Production, Transportation and Moving occupations in Canistota are Transportation (38 | 10.9%), Production (24 | 6.9%), and Material Moving (7 | 2.0%).
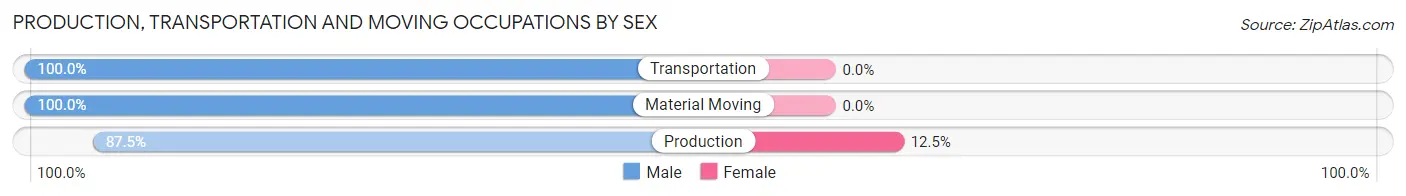
Production, Transportation and Moving Occupations by Sex
| Occupation | Male | Female |
| Production | 21 (87.5%) | 3 (12.5%) |
| Transportation | 38 (100.0%) | 0 (0.0%) |
| Material Moving | 7 (100.0%) | 0 (0.0%) |
| Total (Category) | 66 (95.7%) | 3 (4.3%) |
| Total (Overall) | 222 (63.6%) | 127 (36.4%) |
Employment Industries by Sex in Canistota
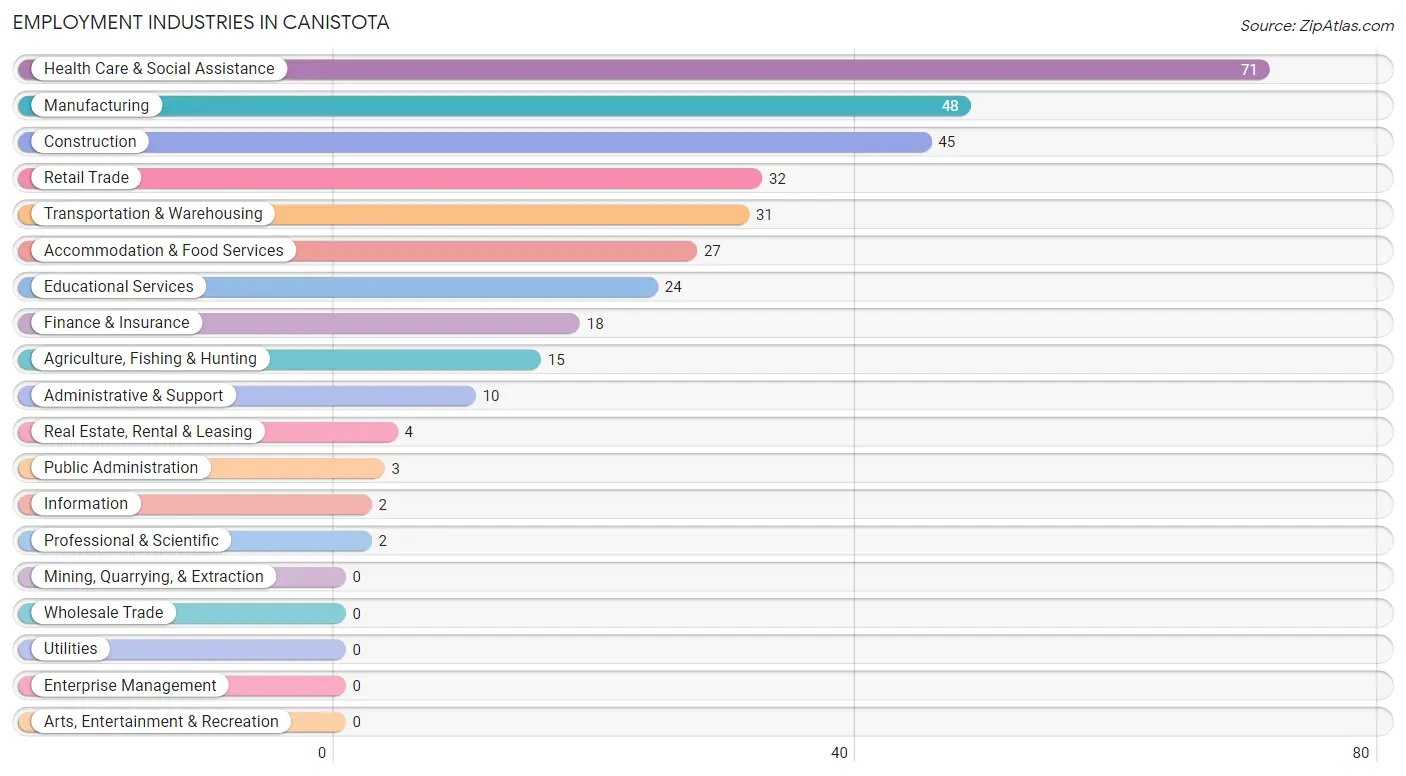
Employment Industries in Canistota
The major employment industries in Canistota include Health Care & Social Assistance (71 | 20.3%), Manufacturing (48 | 13.8%), Construction (45 | 12.9%), Retail Trade (32 | 9.2%), and Transportation & Warehousing (31 | 8.9%).
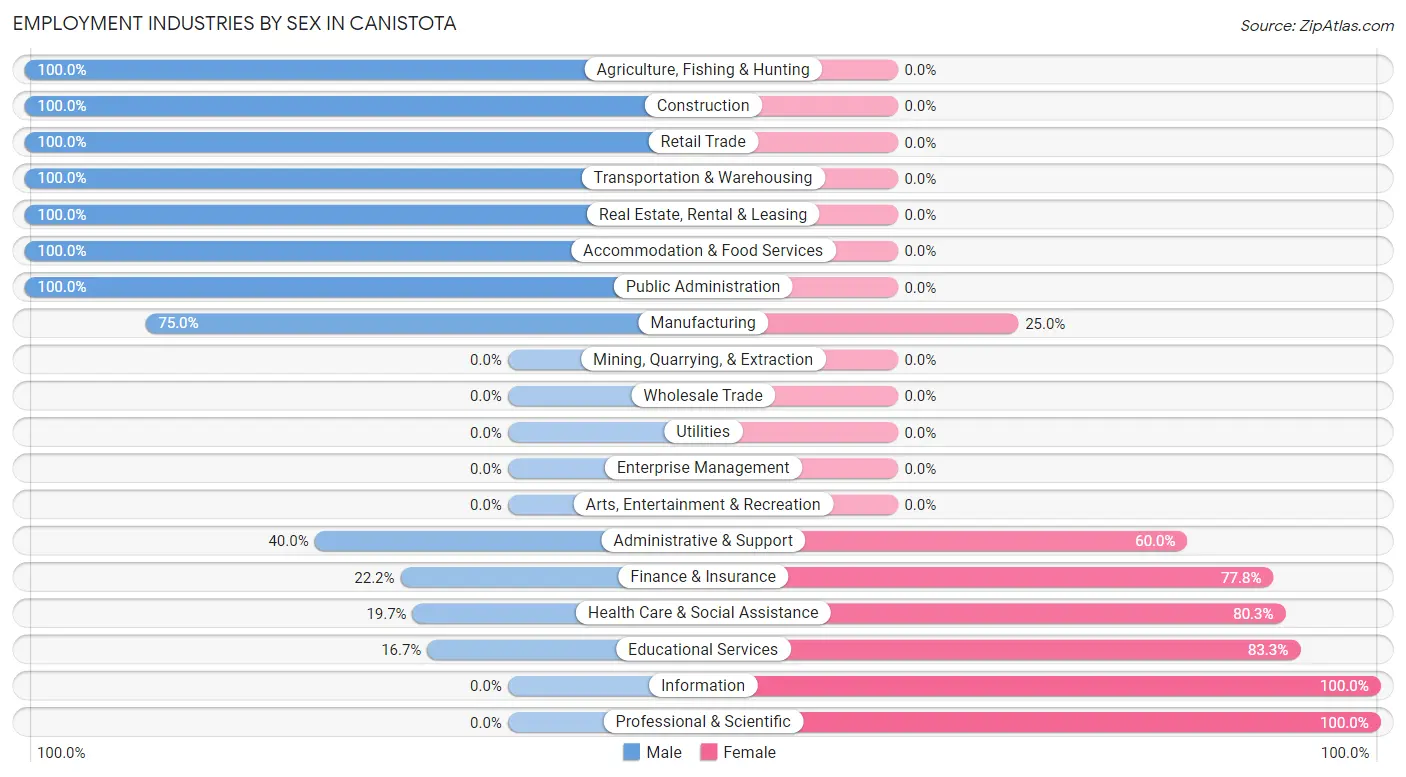
Employment Industries by Sex in Canistota
The Canistota industries that see more men than women are Agriculture, Fishing & Hunting (100.0%), Construction (100.0%), and Retail Trade (100.0%), whereas the industries that tend to have a higher number of women are Information (100.0%), Professional & Scientific (100.0%), and Educational Services (83.3%).
| Industry | Male | Female |
| Agriculture, Fishing & Hunting | 15 (100.0%) | 0 (0.0%) |
| Mining, Quarrying, & Extraction | 0 (0.0%) | 0 (0.0%) |
| Construction | 45 (100.0%) | 0 (0.0%) |
| Manufacturing | 36 (75.0%) | 12 (25.0%) |
| Wholesale Trade | 0 (0.0%) | 0 (0.0%) |
| Retail Trade | 32 (100.0%) | 0 (0.0%) |
| Transportation & Warehousing | 31 (100.0%) | 0 (0.0%) |
| Utilities | 0 (0.0%) | 0 (0.0%) |
| Information | 0 (0.0%) | 2 (100.0%) |
| Finance & Insurance | 4 (22.2%) | 14 (77.8%) |
| Real Estate, Rental & Leasing | 4 (100.0%) | 0 (0.0%) |
| Professional & Scientific | 0 (0.0%) | 2 (100.0%) |
| Enterprise Management | 0 (0.0%) | 0 (0.0%) |
| Administrative & Support | 4 (40.0%) | 6 (60.0%) |
| Educational Services | 4 (16.7%) | 20 (83.3%) |
| Health Care & Social Assistance | 14 (19.7%) | 57 (80.3%) |
| Arts, Entertainment & Recreation | 0 (0.0%) | 0 (0.0%) |
| Accommodation & Food Services | 27 (100.0%) | 0 (0.0%) |
| Public Administration | 3 (100.0%) | 0 (0.0%) |
| Total | 222 (63.6%) | 127 (36.4%) |
Education in Canistota
School Enrollment in Canistota
The most common levels of schooling among the 116 students in Canistota are middle school (33 | 28.4%), high school (32 | 27.6%), and elementary school (23 | 19.8%).
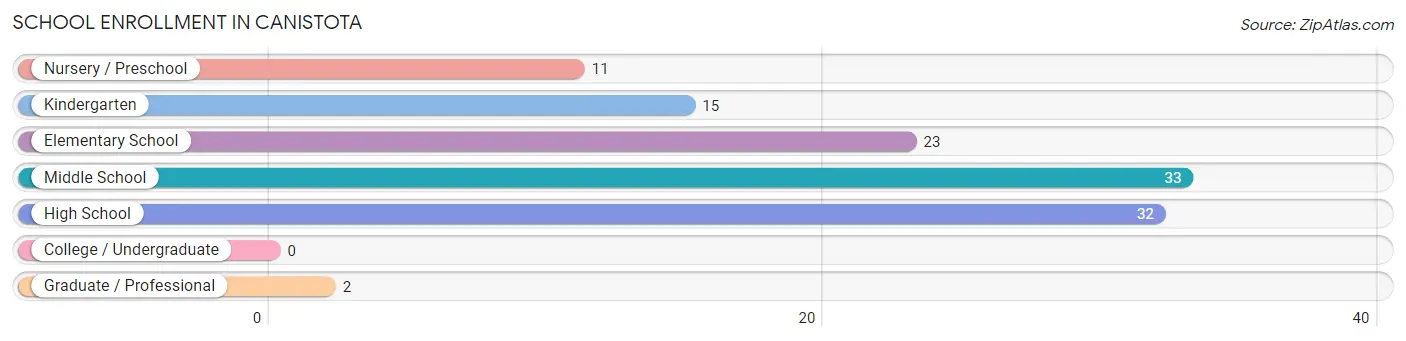
| School Level | # Students | % Students |
| Nursery / Preschool | 11 | 9.5% |
| Kindergarten | 15 | 12.9% |
| Elementary School | 23 | 19.8% |
| Middle School | 33 | 28.4% |
| High School | 32 | 27.6% |
| College / Undergraduate | 0 | 0.0% |
| Graduate / Professional | 2 | 1.7% |
| Total | 116 | 100.0% |
School Enrollment by Age by Funding Source in Canistota
Out of a total of 116 students who are enrolled in schools in Canistota, 14 (12.1%) attend a private institution, while the remaining 102 (87.9%) are enrolled in public schools. The age group of 3 to 4 year olds has the highest likelihood of being enrolled in private schools, with 11 (100.0% in the age bracket) enrolled. Conversely, the age group of 10 to 14 year olds has the lowest likelihood of being enrolled in a private school, with 36 (100.0% in the age bracket) attending a public institution.
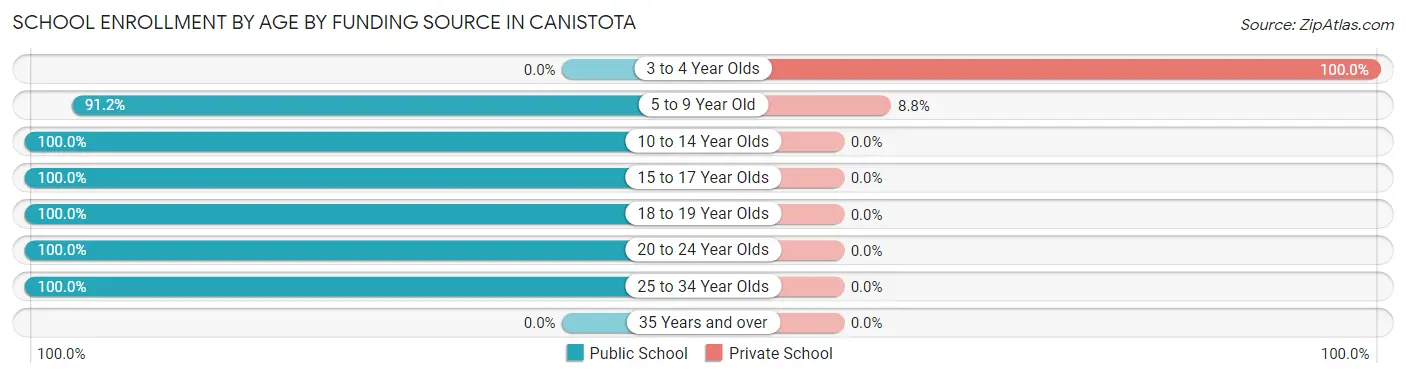
| Age Bracket | Public School | Private School |
| 3 to 4 Year Olds | 0 (0.0%) | 11 (100.0%) |
| 5 to 9 Year Old | 31 (91.2%) | 3 (8.8%) |
| 10 to 14 Year Olds | 36 (100.0%) | 0 (0.0%) |
| 15 to 17 Year Olds | 20 (100.0%) | 0 (0.0%) |
| 18 to 19 Year Olds | 9 (100.0%) | 0 (0.0%) |
| 20 to 24 Year Olds | 4 (100.0%) | 0 (0.0%) |
| 25 to 34 Year Olds | 2 (100.0%) | 0 (0.0%) |
| 35 Years and over | 0 (0.0%) | 0 (0.0%) |
| Total | 102 (87.9%) | 14 (12.1%) |
Educational Attainment by Field of Study in Canistota
Education (19 | 23.5%), computers & mathematics (9 | 11.1%), literature & languages (9 | 11.1%), psychology (8 | 9.9%), and science & technology (8 | 9.9%) are the most common fields of study among 81 individuals in Canistota who have obtained a bachelor's degree or higher.
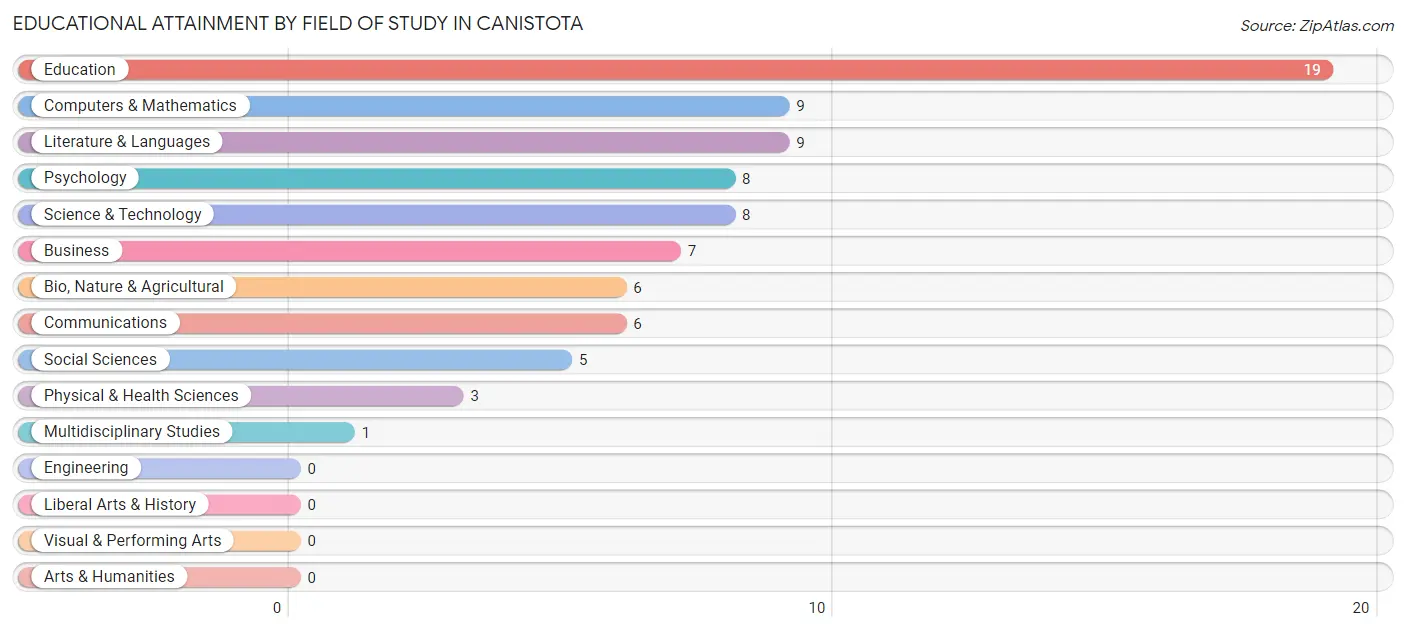
| Field of Study | # Graduates | % Graduates |
| Computers & Mathematics | 9 | 11.1% |
| Bio, Nature & Agricultural | 6 | 7.4% |
| Physical & Health Sciences | 3 | 3.7% |
| Psychology | 8 | 9.9% |
| Social Sciences | 5 | 6.2% |
| Engineering | 0 | 0.0% |
| Multidisciplinary Studies | 1 | 1.2% |
| Science & Technology | 8 | 9.9% |
| Business | 7 | 8.6% |
| Education | 19 | 23.5% |
| Literature & Languages | 9 | 11.1% |
| Liberal Arts & History | 0 | 0.0% |
| Visual & Performing Arts | 0 | 0.0% |
| Communications | 6 | 7.4% |
| Arts & Humanities | 0 | 0.0% |
| Total | 81 | 100.0% |
Transportation & Commute in Canistota
Vehicle Availability by Sex in Canistota
The most prevalent vehicle ownership categories in Canistota are males with 2 vehicles (81, accounting for 35.5%) and females with 2 vehicles (71, making up 63.8%).
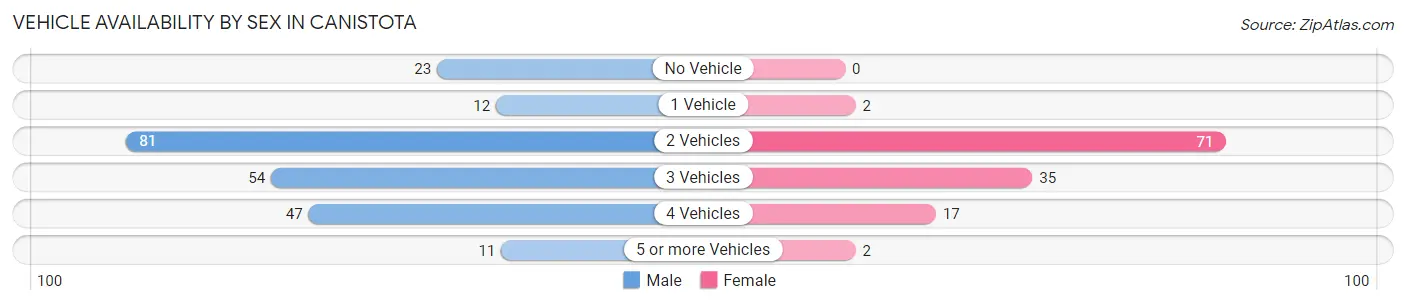
| Vehicles Available | Male | Female |
| No Vehicle | 23 (10.1%) | 0 (0.0%) |
| 1 Vehicle | 12 (5.3%) | 2 (1.6%) |
| 2 Vehicles | 81 (35.5%) | 71 (55.9%) |
| 3 Vehicles | 54 (23.7%) | 35 (27.6%) |
| 4 Vehicles | 47 (20.6%) | 17 (13.4%) |
| 5 or more Vehicles | 11 (4.8%) | 2 (1.6%) |
| Total | 228 (100.0%) | 127 (100.0%) |
Commute Time in Canistota
The most frequently occuring commute durations in Canistota are less than 5 minutes (91 commuters, 27.6%), 45 to 59 minutes (54 commuters, 16.4%), and 40 to 44 minutes (50 commuters, 15.1%).
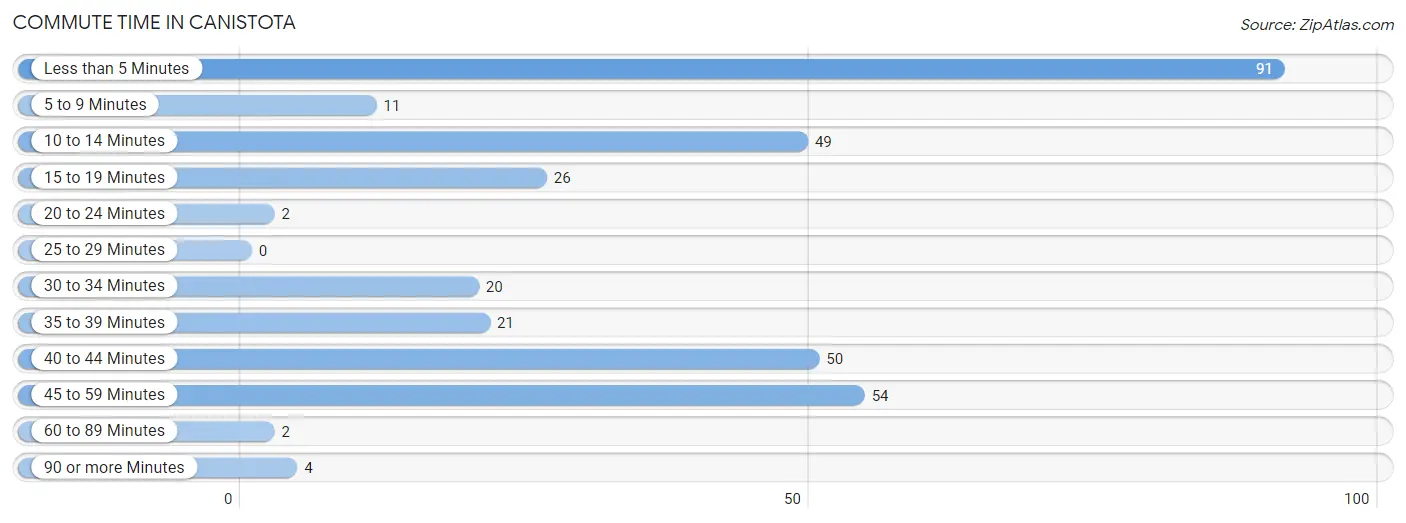
| Commute Time | # Commuters | % Commuters |
| Less than 5 Minutes | 91 | 27.6% |
| 5 to 9 Minutes | 11 | 3.3% |
| 10 to 14 Minutes | 49 | 14.8% |
| 15 to 19 Minutes | 26 | 7.9% |
| 20 to 24 Minutes | 2 | 0.6% |
| 25 to 29 Minutes | 0 | 0.0% |
| 30 to 34 Minutes | 20 | 6.1% |
| 35 to 39 Minutes | 21 | 6.4% |
| 40 to 44 Minutes | 50 | 15.1% |
| 45 to 59 Minutes | 54 | 16.4% |
| 60 to 89 Minutes | 2 | 0.6% |
| 90 or more Minutes | 4 | 1.2% |
Commute Time by Sex in Canistota
The most common commute times in Canistota are less than 5 minutes (48 commuters, 22.1%) for males and less than 5 minutes (43 commuters, 38.1%) for females.
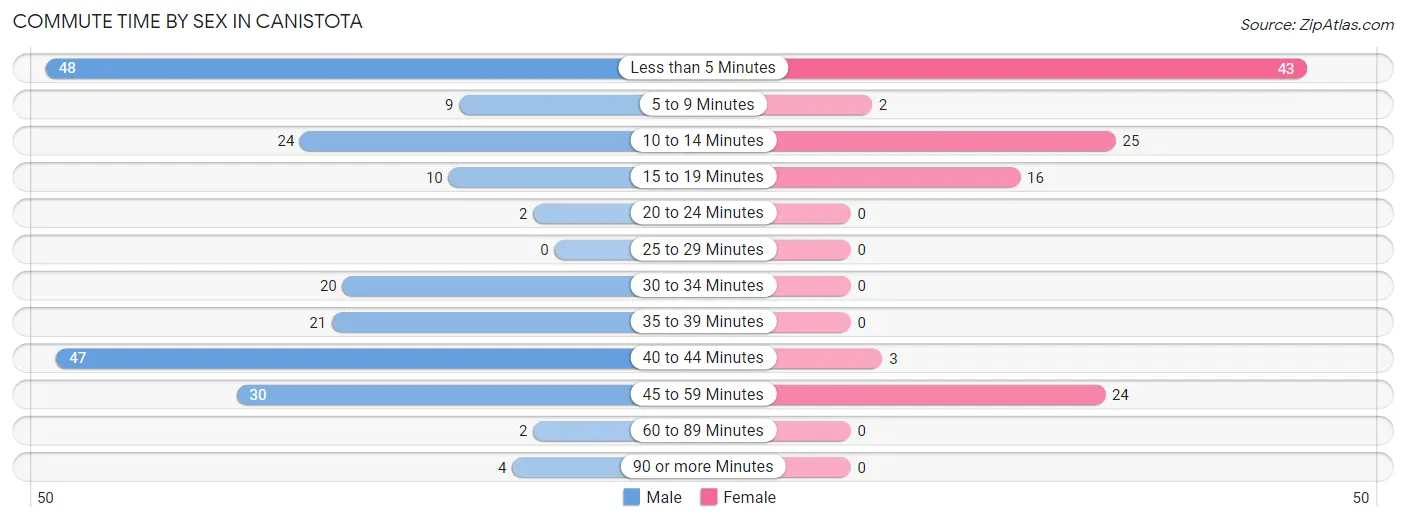
| Commute Time | Male | Female |
| Less than 5 Minutes | 48 (22.1%) | 43 (38.1%) |
| 5 to 9 Minutes | 9 (4.2%) | 2 (1.8%) |
| 10 to 14 Minutes | 24 (11.1%) | 25 (22.1%) |
| 15 to 19 Minutes | 10 (4.6%) | 16 (14.2%) |
| 20 to 24 Minutes | 2 (0.9%) | 0 (0.0%) |
| 25 to 29 Minutes | 0 (0.0%) | 0 (0.0%) |
| 30 to 34 Minutes | 20 (9.2%) | 0 (0.0%) |
| 35 to 39 Minutes | 21 (9.7%) | 0 (0.0%) |
| 40 to 44 Minutes | 47 (21.7%) | 3 (2.6%) |
| 45 to 59 Minutes | 30 (13.8%) | 24 (21.2%) |
| 60 to 89 Minutes | 2 (0.9%) | 0 (0.0%) |
| 90 or more Minutes | 4 (1.8%) | 0 (0.0%) |
Time of Departure to Work by Sex in Canistota
The most frequent times of departure to work in Canistota are 8:30 AM to 8:59 AM (36, 16.6%) for males and 7:30 AM to 7:59 AM (33, 29.2%) for females.
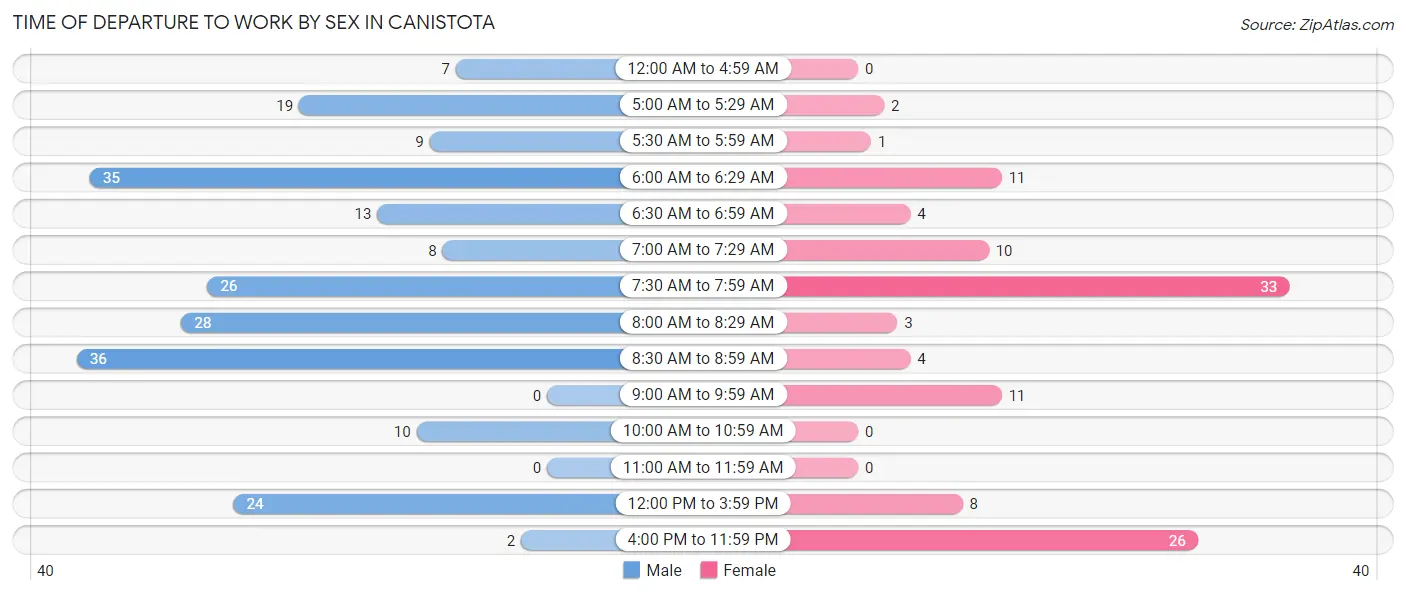
| Time of Departure | Male | Female |
| 12:00 AM to 4:59 AM | 7 (3.2%) | 0 (0.0%) |
| 5:00 AM to 5:29 AM | 19 (8.8%) | 2 (1.8%) |
| 5:30 AM to 5:59 AM | 9 (4.2%) | 1 (0.9%) |
| 6:00 AM to 6:29 AM | 35 (16.1%) | 11 (9.7%) |
| 6:30 AM to 6:59 AM | 13 (6.0%) | 4 (3.5%) |
| 7:00 AM to 7:29 AM | 8 (3.7%) | 10 (8.8%) |
| 7:30 AM to 7:59 AM | 26 (12.0%) | 33 (29.2%) |
| 8:00 AM to 8:29 AM | 28 (12.9%) | 3 (2.6%) |
| 8:30 AM to 8:59 AM | 36 (16.6%) | 4 (3.5%) |
| 9:00 AM to 9:59 AM | 0 (0.0%) | 11 (9.7%) |
| 10:00 AM to 10:59 AM | 10 (4.6%) | 0 (0.0%) |
| 11:00 AM to 11:59 AM | 0 (0.0%) | 0 (0.0%) |
| 12:00 PM to 3:59 PM | 24 (11.1%) | 8 (7.1%) |
| 4:00 PM to 11:59 PM | 2 (0.9%) | 26 (23.0%) |
| Total | 217 (100.0%) | 113 (100.0%) |
Housing Occupancy in Canistota
Occupancy by Ownership in Canistota
Of the total 285 dwellings in Canistota, owner-occupied units account for 229 (80.3%), while renter-occupied units make up 56 (19.7%).
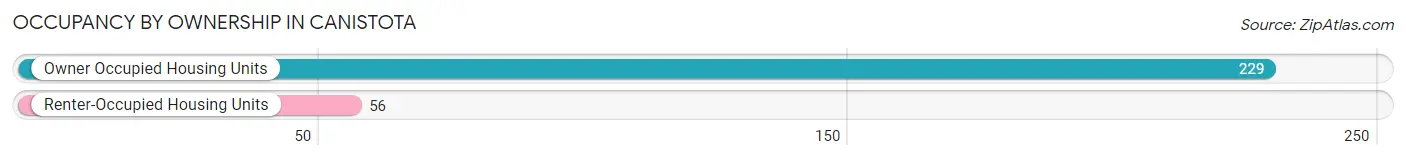
| Occupancy | # Housing Units | % Housing Units |
| Owner Occupied Housing Units | 229 | 80.3% |
| Renter-Occupied Housing Units | 56 | 19.7% |
| Total Occupied Housing Units | 285 | 100.0% |
Occupancy by Household Size in Canistota
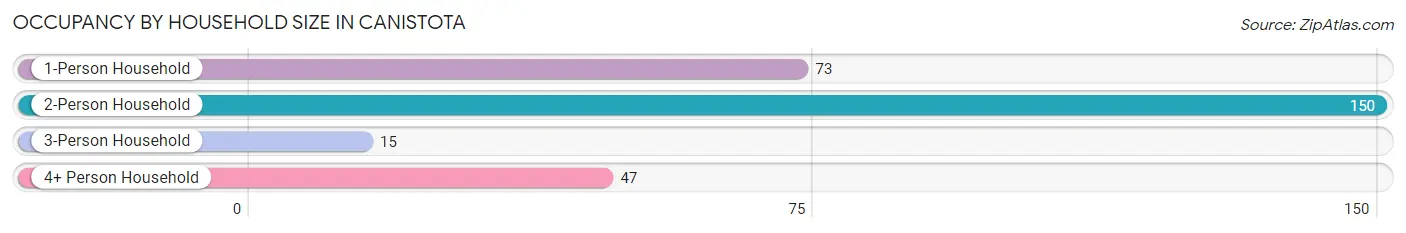
| Household Size | # Housing Units | % Housing Units |
| 1-Person Household | 73 | 25.6% |
| 2-Person Household | 150 | 52.6% |
| 3-Person Household | 15 | 5.3% |
| 4+ Person Household | 47 | 16.5% |
| Total Housing Units | 285 | 100.0% |
Occupancy by Ownership by Household Size in Canistota
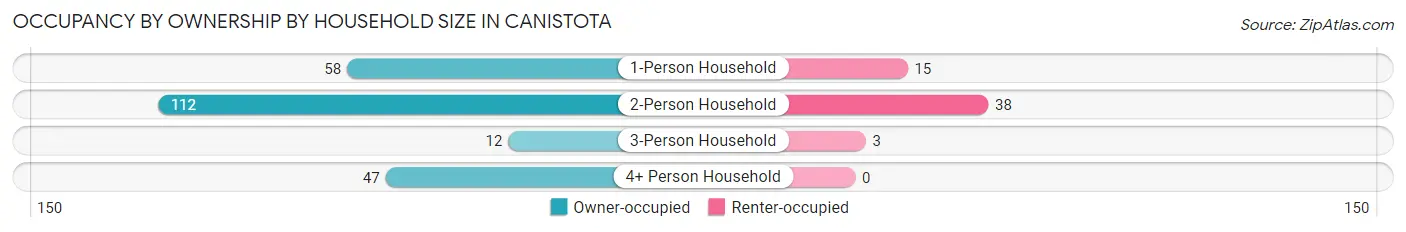
| Household Size | Owner-occupied | Renter-occupied |
| 1-Person Household | 58 (79.4%) | 15 (20.5%) |
| 2-Person Household | 112 (74.7%) | 38 (25.3%) |
| 3-Person Household | 12 (80.0%) | 3 (20.0%) |
| 4+ Person Household | 47 (100.0%) | 0 (0.0%) |
| Total Housing Units | 229 (80.3%) | 56 (19.7%) |
Occupancy by Educational Attainment in Canistota
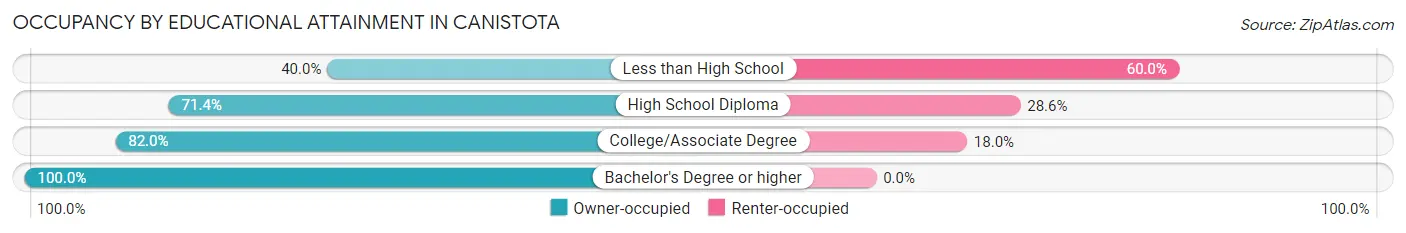
| Household Size | Owner-occupied | Renter-occupied |
| Less than High School | 2 (40.0%) | 3 (60.0%) |
| High School Diploma | 70 (71.4%) | 28 (28.6%) |
| College/Associate Degree | 114 (82.0%) | 25 (18.0%) |
| Bachelor's Degree or higher | 43 (100.0%) | 0 (0.0%) |
Occupancy by Age of Householder in Canistota
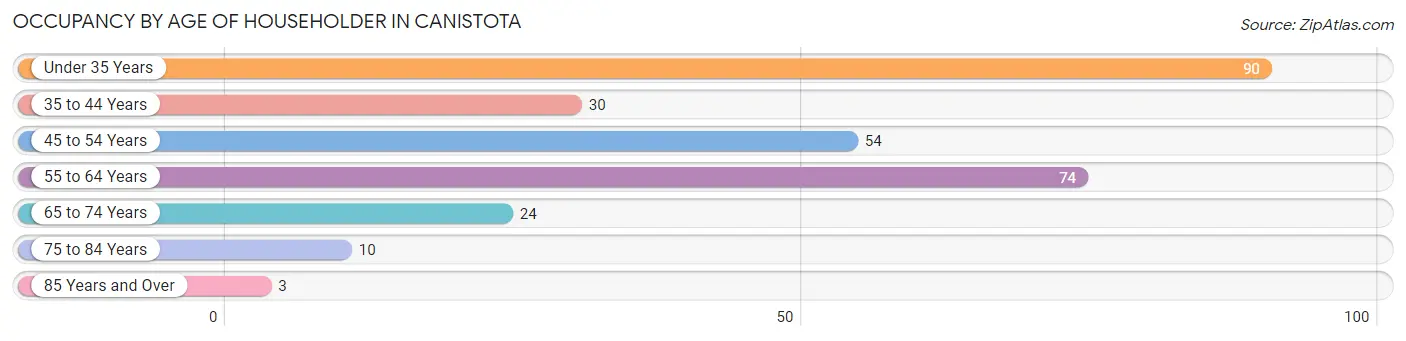
| Age Bracket | # Households | % Households |
| Under 35 Years | 90 | 31.6% |
| 35 to 44 Years | 30 | 10.5% |
| 45 to 54 Years | 54 | 19.0% |
| 55 to 64 Years | 74 | 26.0% |
| 65 to 74 Years | 24 | 8.4% |
| 75 to 84 Years | 10 | 3.5% |
| 85 Years and Over | 3 | 1.1% |
| Total | 285 | 100.0% |
Housing Finances in Canistota
Median Income by Occupancy in Canistota
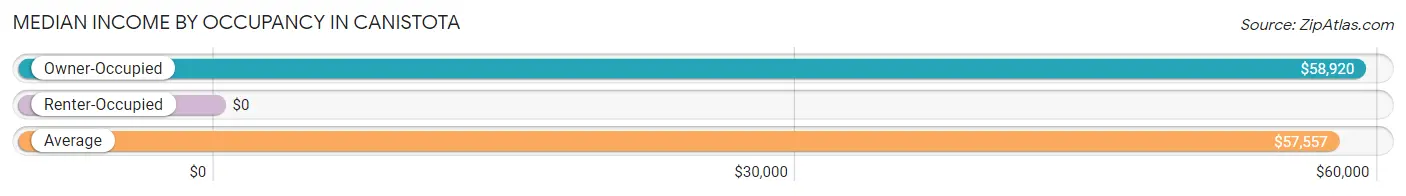
| Occupancy Type | # Households | Median Income |
| Owner-Occupied | 229 (80.3%) | $58,920 |
| Renter-Occupied | 56 (19.7%) | $0 |
| Average | 285 (100.0%) | $57,557 |
Occupancy by Householder Income Bracket in Canistota
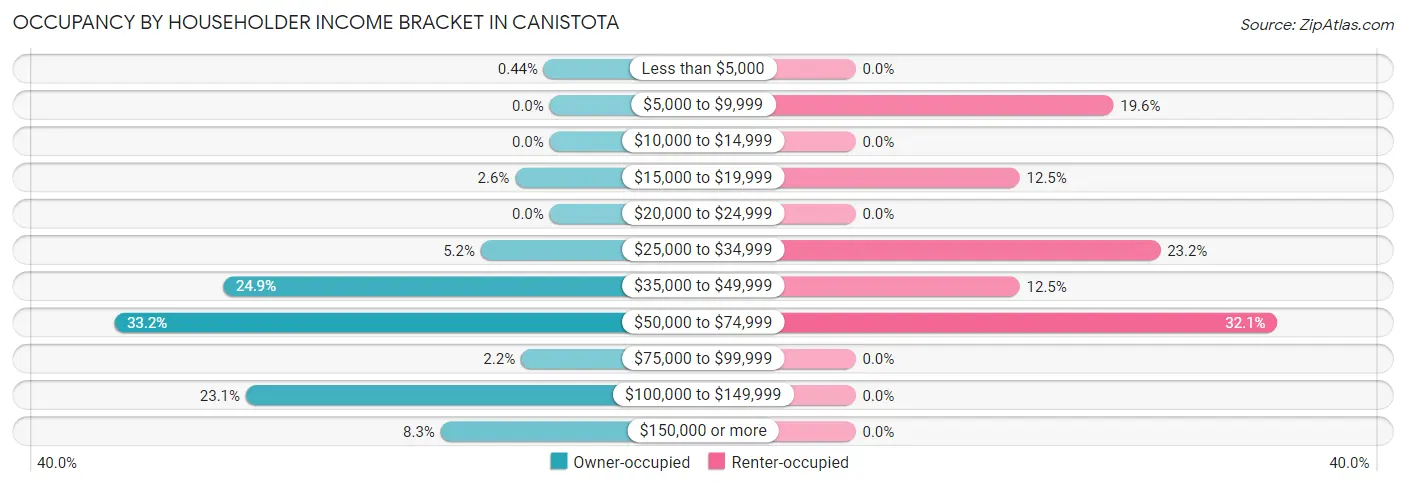
| Income Bracket | Owner-occupied | Renter-occupied |
| Less than $5,000 | 1 (0.4%) | 0 (0.0%) |
| $5,000 to $9,999 | 0 (0.0%) | 11 (19.6%) |
| $10,000 to $14,999 | 0 (0.0%) | 0 (0.0%) |
| $15,000 to $19,999 | 6 (2.6%) | 7 (12.5%) |
| $20,000 to $24,999 | 0 (0.0%) | 0 (0.0%) |
| $25,000 to $34,999 | 12 (5.2%) | 13 (23.2%) |
| $35,000 to $49,999 | 57 (24.9%) | 7 (12.5%) |
| $50,000 to $74,999 | 76 (33.2%) | 18 (32.1%) |
| $75,000 to $99,999 | 5 (2.2%) | 0 (0.0%) |
| $100,000 to $149,999 | 53 (23.1%) | 0 (0.0%) |
| $150,000 or more | 19 (8.3%) | 0 (0.0%) |
| Total | 229 (100.0%) | 56 (100.0%) |
Monthly Housing Cost Tiers in Canistota
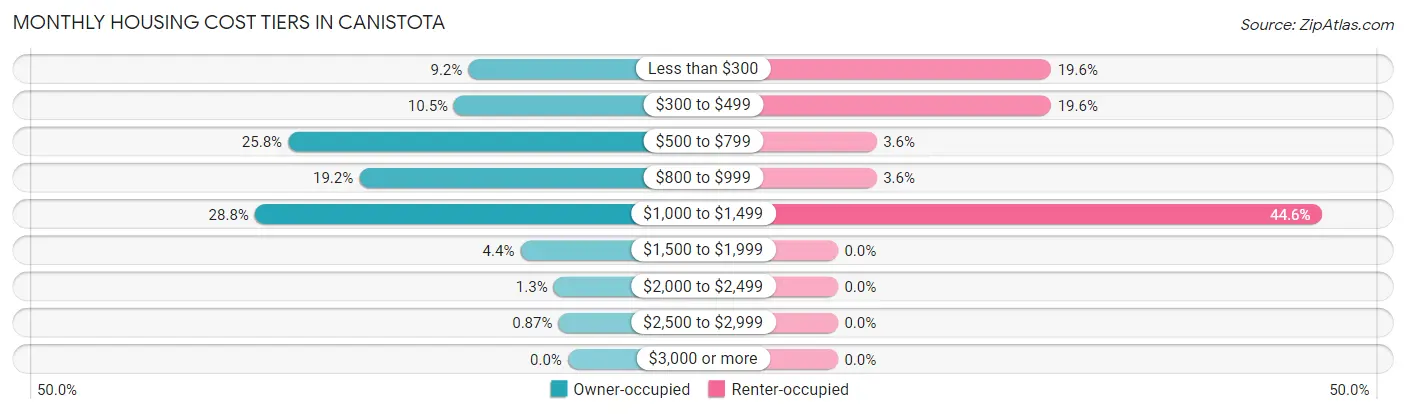
| Monthly Cost | Owner-occupied | Renter-occupied |
| Less than $300 | 21 (9.2%) | 11 (19.6%) |
| $300 to $499 | 24 (10.5%) | 11 (19.6%) |
| $500 to $799 | 59 (25.8%) | 2 (3.6%) |
| $800 to $999 | 44 (19.2%) | 2 (3.6%) |
| $1,000 to $1,499 | 66 (28.8%) | 25 (44.6%) |
| $1,500 to $1,999 | 10 (4.4%) | 0 (0.0%) |
| $2,000 to $2,499 | 3 (1.3%) | 0 (0.0%) |
| $2,500 to $2,999 | 2 (0.9%) | 0 (0.0%) |
| $3,000 or more | 0 (0.0%) | 0 (0.0%) |
| Total | 229 (100.0%) | 56 (100.0%) |
Physical Housing Characteristics in Canistota
Housing Structures in Canistota
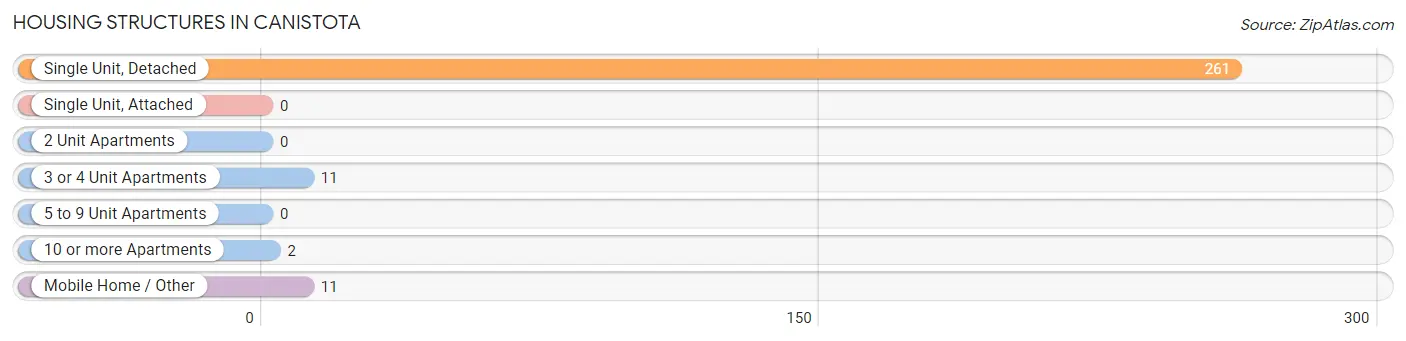
| Structure Type | # Housing Units | % Housing Units |
| Single Unit, Detached | 261 | 91.6% |
| Single Unit, Attached | 0 | 0.0% |
| 2 Unit Apartments | 0 | 0.0% |
| 3 or 4 Unit Apartments | 11 | 3.9% |
| 5 to 9 Unit Apartments | 0 | 0.0% |
| 10 or more Apartments | 2 | 0.7% |
| Mobile Home / Other | 11 | 3.9% |
| Total | 285 | 100.0% |
Housing Structures by Occupancy in Canistota
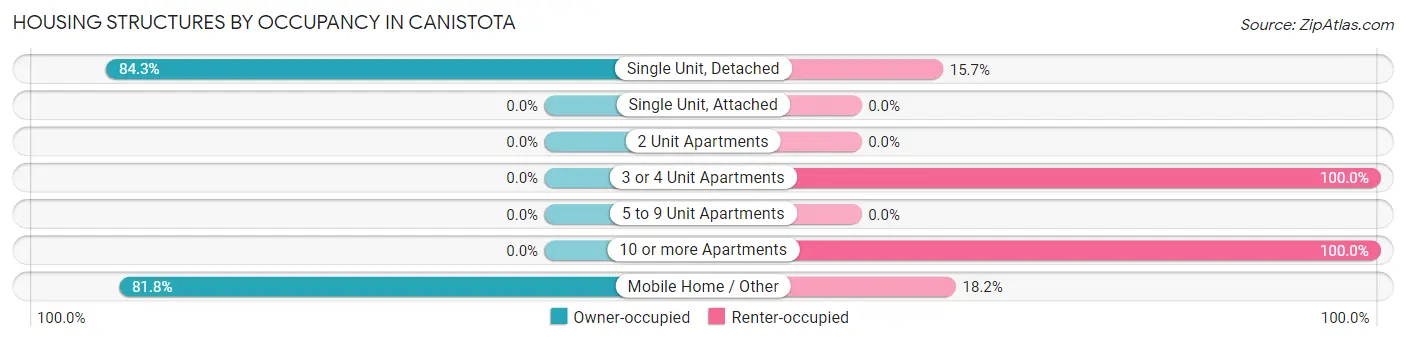
| Structure Type | Owner-occupied | Renter-occupied |
| Single Unit, Detached | 220 (84.3%) | 41 (15.7%) |
| Single Unit, Attached | 0 (0.0%) | 0 (0.0%) |
| 2 Unit Apartments | 0 (0.0%) | 0 (0.0%) |
| 3 or 4 Unit Apartments | 0 (0.0%) | 11 (100.0%) |
| 5 to 9 Unit Apartments | 0 (0.0%) | 0 (0.0%) |
| 10 or more Apartments | 0 (0.0%) | 2 (100.0%) |
| Mobile Home / Other | 9 (81.8%) | 2 (18.2%) |
| Total | 229 (80.3%) | 56 (19.7%) |
Housing Structures by Number of Rooms in Canistota
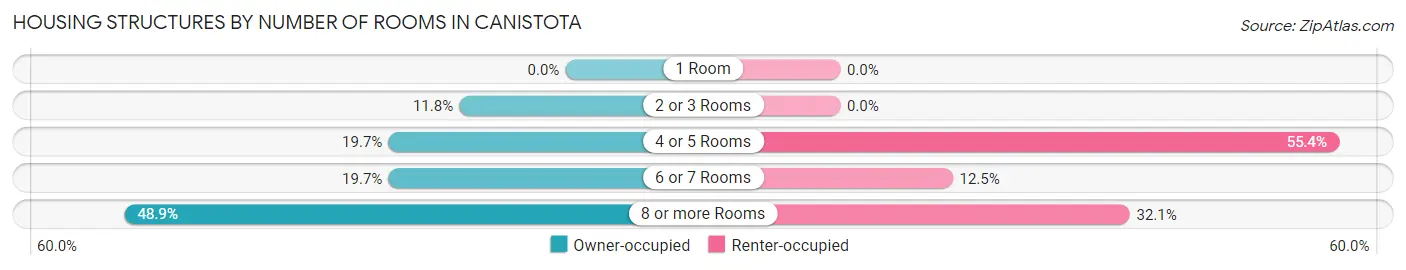
| Number of Rooms | Owner-occupied | Renter-occupied |
| 1 Room | 0 (0.0%) | 0 (0.0%) |
| 2 or 3 Rooms | 27 (11.8%) | 0 (0.0%) |
| 4 or 5 Rooms | 45 (19.7%) | 31 (55.4%) |
| 6 or 7 Rooms | 45 (19.7%) | 7 (12.5%) |
| 8 or more Rooms | 112 (48.9%) | 18 (32.1%) |
| Total | 229 (100.0%) | 56 (100.0%) |
Housing Structure by Heating Type in Canistota
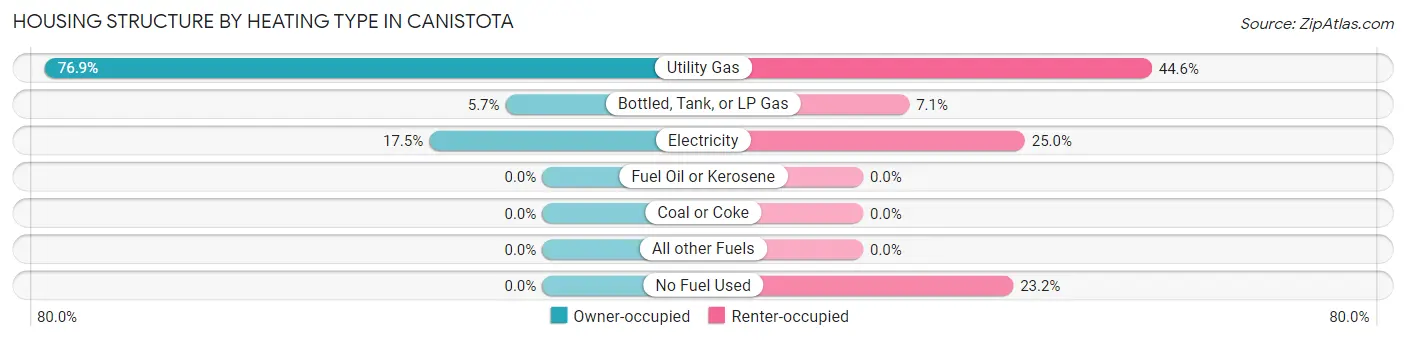
| Heating Type | Owner-occupied | Renter-occupied |
| Utility Gas | 176 (76.9%) | 25 (44.6%) |
| Bottled, Tank, or LP Gas | 13 (5.7%) | 4 (7.1%) |
| Electricity | 40 (17.5%) | 14 (25.0%) |
| Fuel Oil or Kerosene | 0 (0.0%) | 0 (0.0%) |
| Coal or Coke | 0 (0.0%) | 0 (0.0%) |
| All other Fuels | 0 (0.0%) | 0 (0.0%) |
| No Fuel Used | 0 (0.0%) | 13 (23.2%) |
| Total | 229 (100.0%) | 56 (100.0%) |
Household Vehicle Usage in Canistota
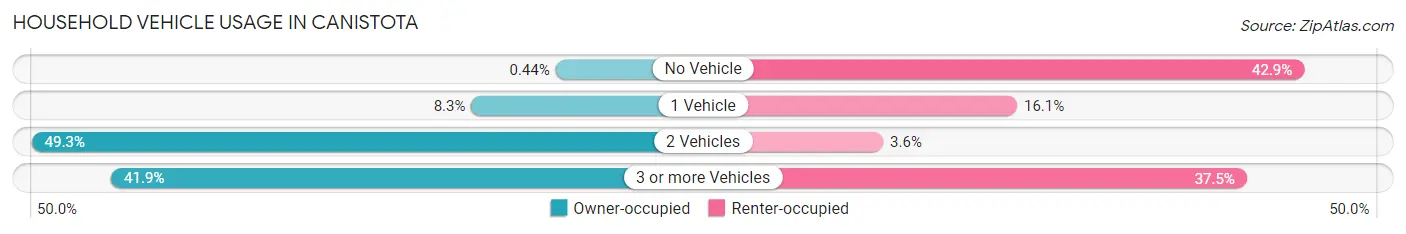
| Vehicles per Household | Owner-occupied | Renter-occupied |
| No Vehicle | 1 (0.4%) | 24 (42.9%) |
| 1 Vehicle | 19 (8.3%) | 9 (16.1%) |
| 2 Vehicles | 113 (49.3%) | 2 (3.6%) |
| 3 or more Vehicles | 96 (41.9%) | 21 (37.5%) |
| Total | 229 (100.0%) | 56 (100.0%) |
Real Estate & Mortgages in Canistota
Real Estate and Mortgage Overview in Canistota
| Characteristic | Without Mortgage | With Mortgage |
| Housing Units | 87 | 142 |
| Median Property Value | $93,000 | $105,400 |
| Median Household Income | $54,750 | $11 |
| Monthly Housing Costs | $490 | $0 |
| Real Estate Taxes | $1,679 | $0 |
Property Value by Mortgage Status in Canistota
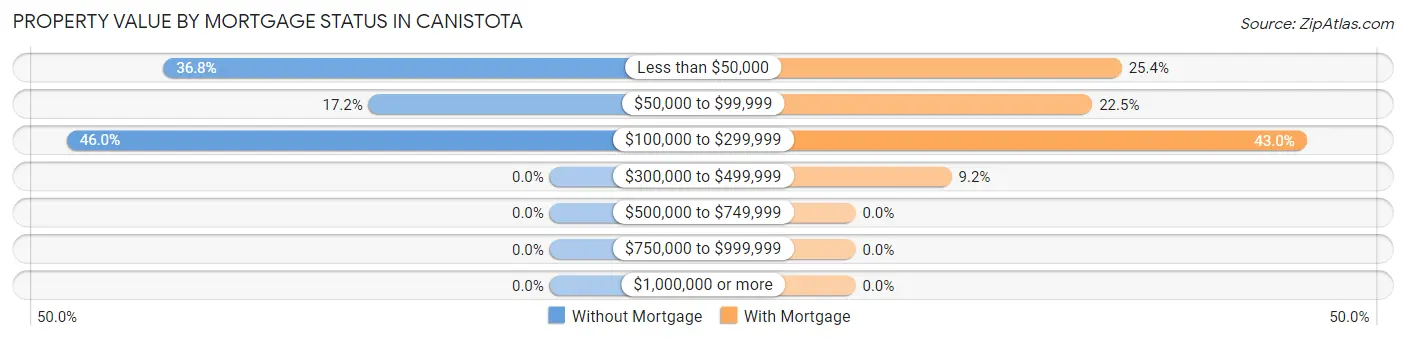
| Property Value | Without Mortgage | With Mortgage |
| Less than $50,000 | 32 (36.8%) | 36 (25.4%) |
| $50,000 to $99,999 | 15 (17.2%) | 32 (22.5%) |
| $100,000 to $299,999 | 40 (46.0%) | 61 (43.0%) |
| $300,000 to $499,999 | 0 (0.0%) | 13 (9.1%) |
| $500,000 to $749,999 | 0 (0.0%) | 0 (0.0%) |
| $750,000 to $999,999 | 0 (0.0%) | 0 (0.0%) |
| $1,000,000 or more | 0 (0.0%) | 0 (0.0%) |
| Total | 87 (100.0%) | 142 (100.0%) |
Household Income by Mortgage Status in Canistota
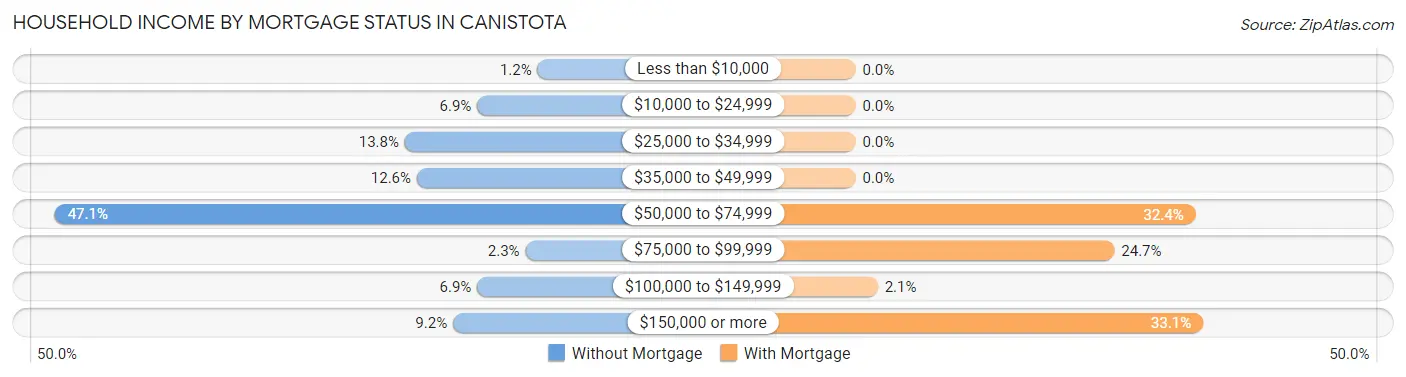
| Household Income | Without Mortgage | With Mortgage |
| Less than $10,000 | 1 (1.1%) | 0 (0.0%) |
| $10,000 to $24,999 | 6 (6.9%) | 0 (0.0%) |
| $25,000 to $34,999 | 12 (13.8%) | 0 (0.0%) |
| $35,000 to $49,999 | 11 (12.6%) | 0 (0.0%) |
| $50,000 to $74,999 | 41 (47.1%) | 46 (32.4%) |
| $75,000 to $99,999 | 2 (2.3%) | 35 (24.6%) |
| $100,000 to $149,999 | 6 (6.9%) | 3 (2.1%) |
| $150,000 or more | 8 (9.2%) | 47 (33.1%) |
| Total | 87 (100.0%) | 142 (100.0%) |
Property Value to Household Income Ratio in Canistota
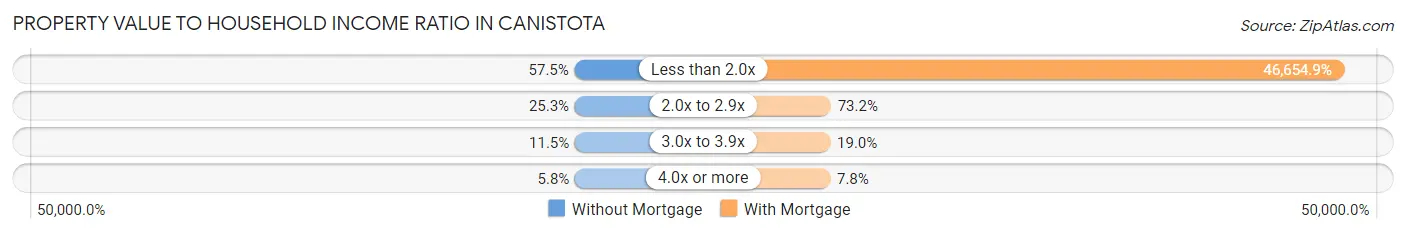
| Value-to-Income Ratio | Without Mortgage | With Mortgage |
| Less than 2.0x | 50 (57.5%) | 66,250 (46,654.9%) |
| 2.0x to 2.9x | 22 (25.3%) | 104 (73.2%) |
| 3.0x to 3.9x | 10 (11.5%) | 27 (19.0%) |
| 4.0x or more | 5 (5.8%) | 11 (7.7%) |
| Total | 87 (100.0%) | 142 (100.0%) |
Real Estate Taxes by Mortgage Status in Canistota
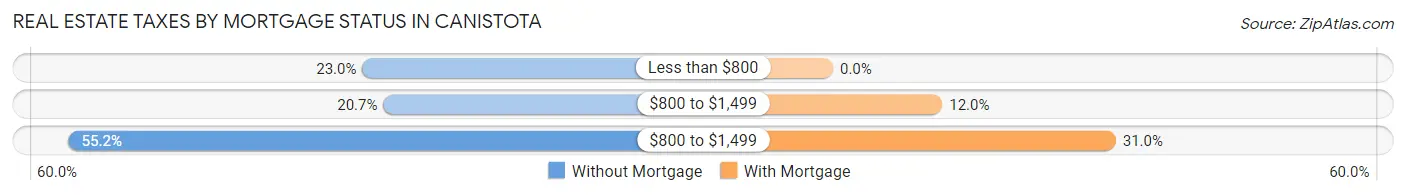
| Property Taxes | Without Mortgage | With Mortgage |
| Less than $800 | 20 (23.0%) | 0 (0.0%) |
| $800 to $1,499 | 18 (20.7%) | 17 (12.0%) |
| $800 to $1,499 | 48 (55.2%) | 44 (31.0%) |
| Total | 87 (100.0%) | 142 (100.0%) |
Health & Disability in Canistota
Health Insurance Coverage by Age in Canistota
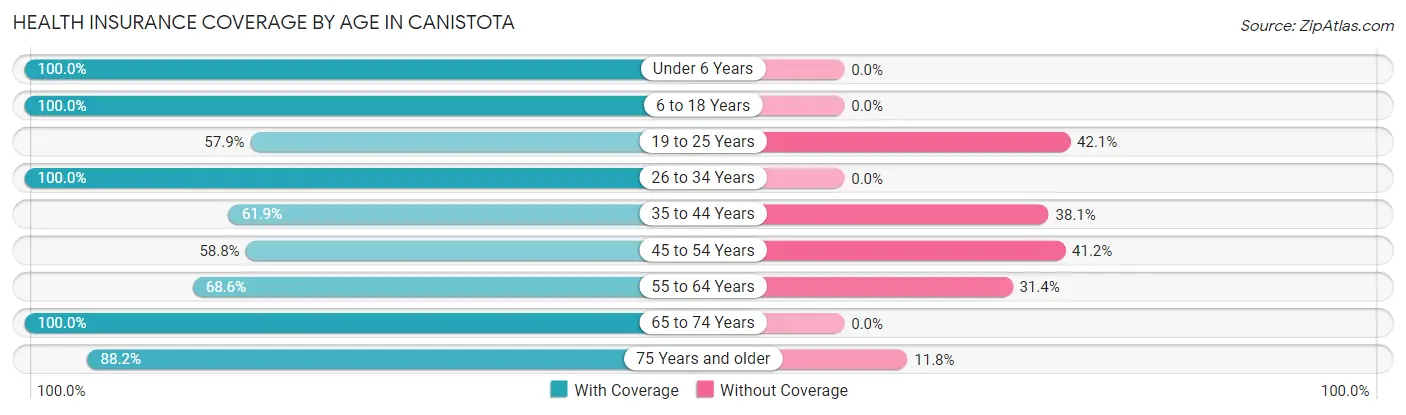
| Age Bracket | With Coverage | Without Coverage |
| Under 6 Years | 70 (100.0%) | 0 (0.0%) |
| 6 to 18 Years | 90 (100.0%) | 0 (0.0%) |
| 19 to 25 Years | 55 (57.9%) | 40 (42.1%) |
| 26 to 34 Years | 45 (100.0%) | 0 (0.0%) |
| 35 to 44 Years | 39 (61.9%) | 24 (38.1%) |
| 45 to 54 Years | 50 (58.8%) | 35 (41.2%) |
| 55 to 64 Years | 70 (68.6%) | 32 (31.4%) |
| 65 to 74 Years | 42 (100.0%) | 0 (0.0%) |
| 75 Years and older | 15 (88.2%) | 2 (11.8%) |
| Total | 476 (78.2%) | 133 (21.8%) |
Health Insurance Coverage by Citizenship Status in Canistota
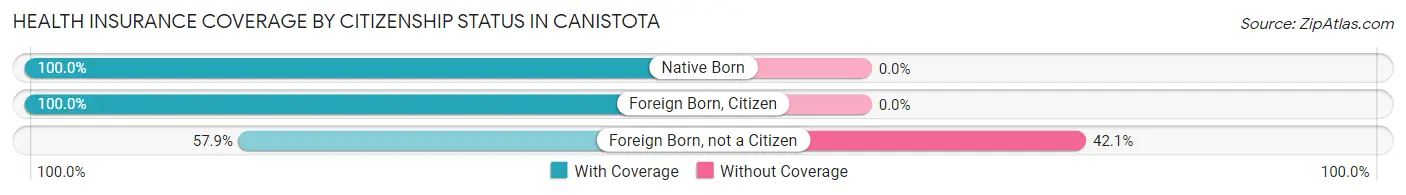
| Citizenship Status | With Coverage | Without Coverage |
| Native Born | 70 (100.0%) | 0 (0.0%) |
| Foreign Born, Citizen | 90 (100.0%) | 0 (0.0%) |
| Foreign Born, not a Citizen | 55 (57.9%) | 40 (42.1%) |
Health Insurance Coverage by Household Income in Canistota

| Household Income | With Coverage | Without Coverage |
| Under $25,000 | 18 (46.2%) | 21 (53.8%) |
| $25,000 to $49,999 | 96 (71.1%) | 39 (28.9%) |
| $50,000 to $74,999 | 156 (74.3%) | 54 (25.7%) |
| $75,000 to $99,999 | 7 (77.8%) | 2 (22.2%) |
| $100,000 and over | 199 (92.1%) | 17 (7.9%) |
Public vs Private Health Insurance Coverage by Age in Canistota
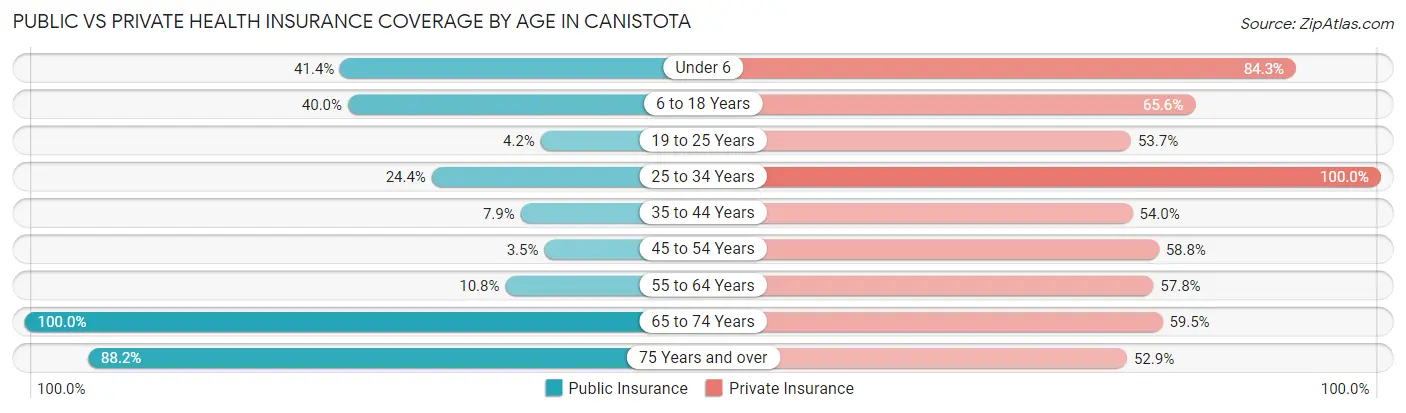
| Age Bracket | Public Insurance | Private Insurance |
| Under 6 | 29 (41.4%) | 59 (84.3%) |
| 6 to 18 Years | 36 (40.0%) | 59 (65.6%) |
| 19 to 25 Years | 4 (4.2%) | 51 (53.7%) |
| 25 to 34 Years | 11 (24.4%) | 45 (100.0%) |
| 35 to 44 Years | 5 (7.9%) | 34 (54.0%) |
| 45 to 54 Years | 3 (3.5%) | 50 (58.8%) |
| 55 to 64 Years | 11 (10.8%) | 59 (57.8%) |
| 65 to 74 Years | 42 (100.0%) | 25 (59.5%) |
| 75 Years and over | 15 (88.2%) | 9 (52.9%) |
| Total | 156 (25.6%) | 391 (64.2%) |
Disability Status by Sex by Age in Canistota
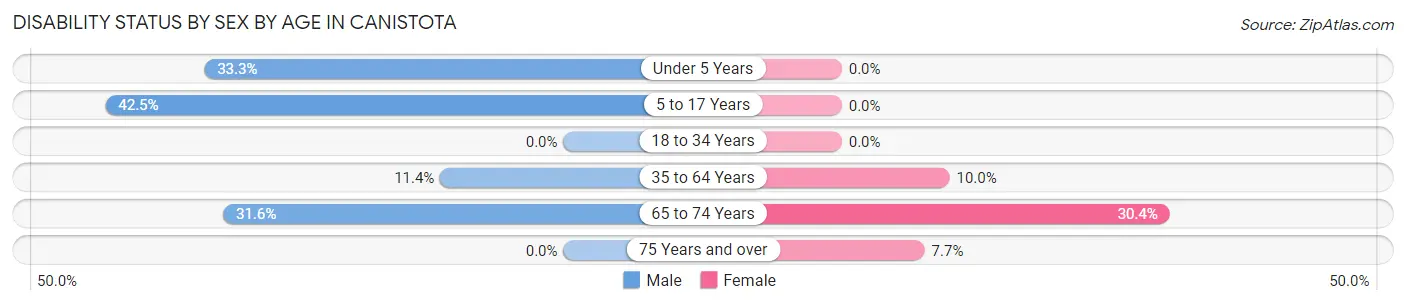
| Age Bracket | Male | Female |
| Under 5 Years | 6 (33.3%) | 0 (0.0%) |
| 5 to 17 Years | 17 (42.5%) | 0 (0.0%) |
| 18 to 34 Years | 0 (0.0%) | 0 (0.0%) |
| 35 to 64 Years | 16 (11.4%) | 11 (10.0%) |
| 65 to 74 Years | 6 (31.6%) | 7 (30.4%) |
| 75 Years and over | 0 (0.0%) | 1 (7.7%) |
Disability Class by Sex by Age in Canistota
Disability Class: Hearing Difficulty
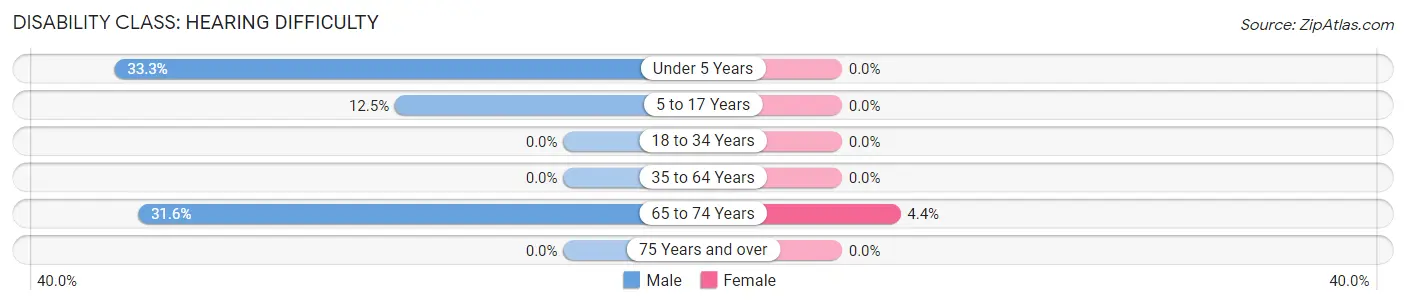
| Age Bracket | Male | Female |
| Under 5 Years | 6 (33.3%) | 0 (0.0%) |
| 5 to 17 Years | 5 (12.5%) | 0 (0.0%) |
| 18 to 34 Years | 0 (0.0%) | 0 (0.0%) |
| 35 to 64 Years | 0 (0.0%) | 0 (0.0%) |
| 65 to 74 Years | 6 (31.6%) | 1 (4.3%) |
| 75 Years and over | 0 (0.0%) | 0 (0.0%) |
Disability Class: Vision Difficulty
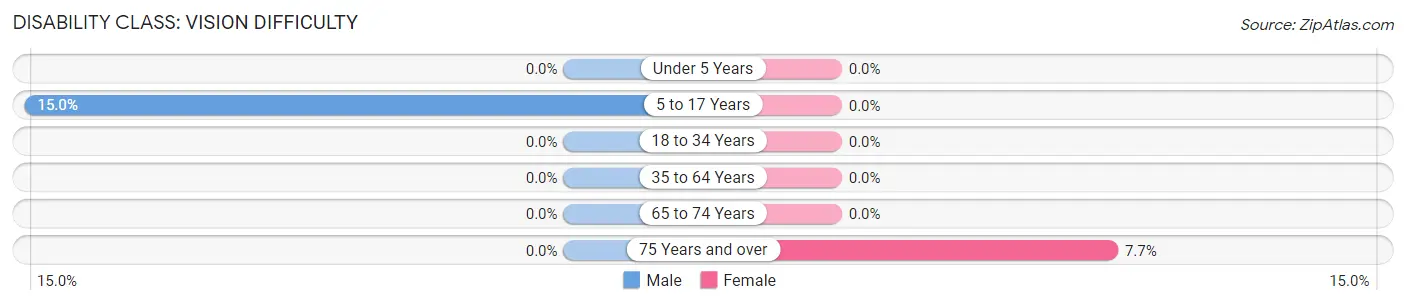
| Age Bracket | Male | Female |
| Under 5 Years | 0 (0.0%) | 0 (0.0%) |
| 5 to 17 Years | 6 (15.0%) | 0 (0.0%) |
| 18 to 34 Years | 0 (0.0%) | 0 (0.0%) |
| 35 to 64 Years | 0 (0.0%) | 0 (0.0%) |
| 65 to 74 Years | 0 (0.0%) | 0 (0.0%) |
| 75 Years and over | 0 (0.0%) | 1 (7.7%) |
Disability Class: Cognitive Difficulty
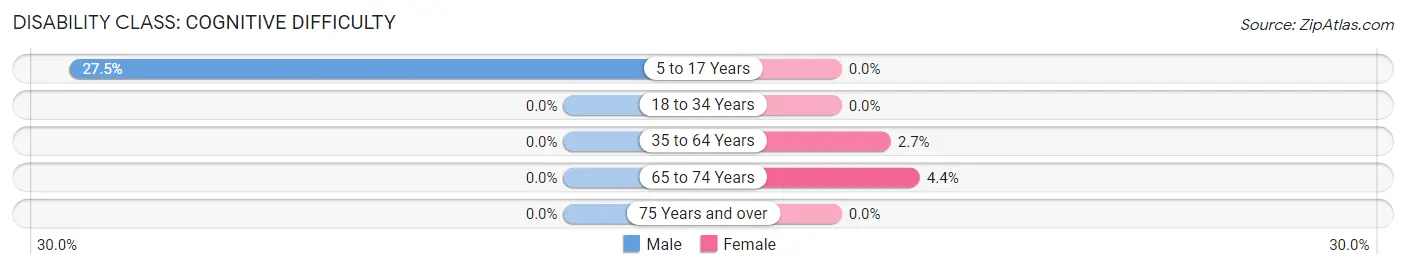
| Age Bracket | Male | Female |
| 5 to 17 Years | 11 (27.5%) | 0 (0.0%) |
| 18 to 34 Years | 0 (0.0%) | 0 (0.0%) |
| 35 to 64 Years | 0 (0.0%) | 3 (2.7%) |
| 65 to 74 Years | 0 (0.0%) | 1 (4.3%) |
| 75 Years and over | 0 (0.0%) | 0 (0.0%) |
Disability Class: Ambulatory Difficulty
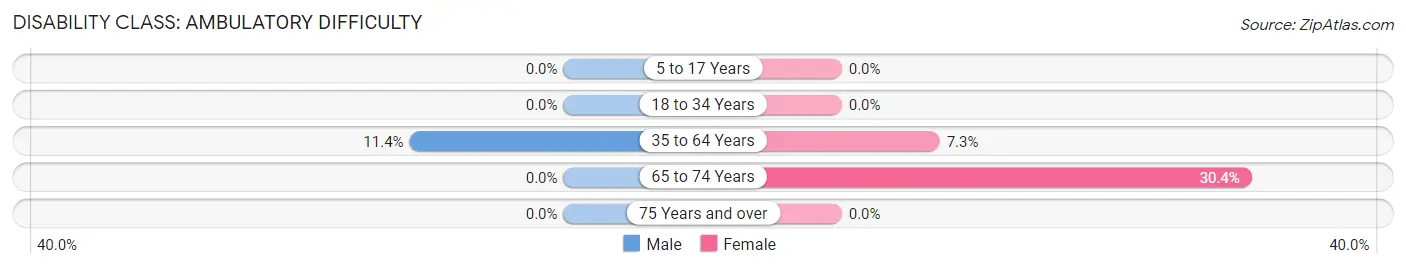
| Age Bracket | Male | Female |
| 5 to 17 Years | 0 (0.0%) | 0 (0.0%) |
| 18 to 34 Years | 0 (0.0%) | 0 (0.0%) |
| 35 to 64 Years | 16 (11.4%) | 8 (7.3%) |
| 65 to 74 Years | 0 (0.0%) | 7 (30.4%) |
| 75 Years and over | 0 (0.0%) | 0 (0.0%) |
Disability Class: Self-Care Difficulty
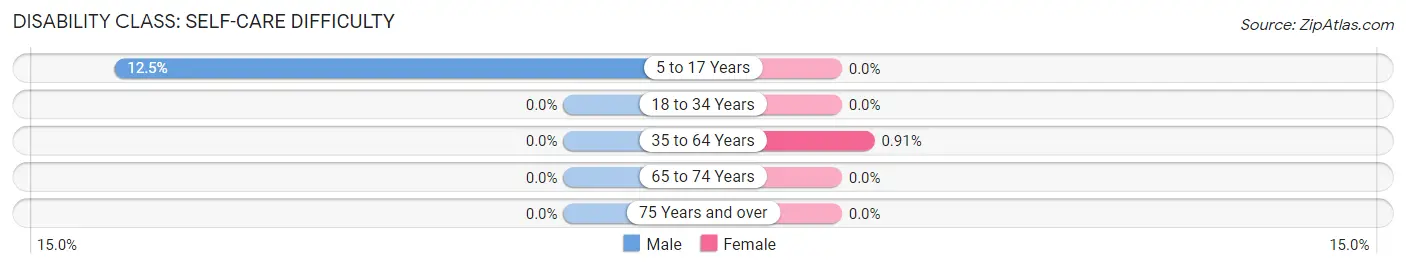
| Age Bracket | Male | Female |
| 5 to 17 Years | 5 (12.5%) | 0 (0.0%) |
| 18 to 34 Years | 0 (0.0%) | 0 (0.0%) |
| 35 to 64 Years | 0 (0.0%) | 1 (0.9%) |
| 65 to 74 Years | 0 (0.0%) | 0 (0.0%) |
| 75 Years and over | 0 (0.0%) | 0 (0.0%) |
Technology Access in Canistota
Computing Device Access in Canistota
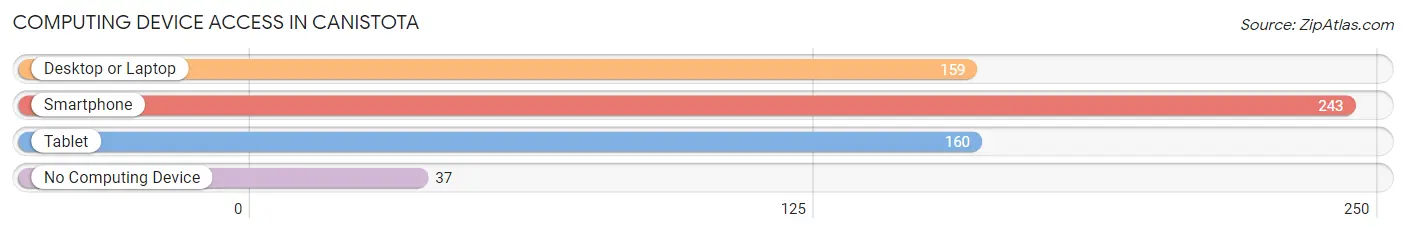
| Device Type | # Households | % Households |
| Desktop or Laptop | 159 | 55.8% |
| Smartphone | 243 | 85.3% |
| Tablet | 160 | 56.1% |
| No Computing Device | 37 | 13.0% |
| Total | 285 | 100.0% |
Internet Access in Canistota
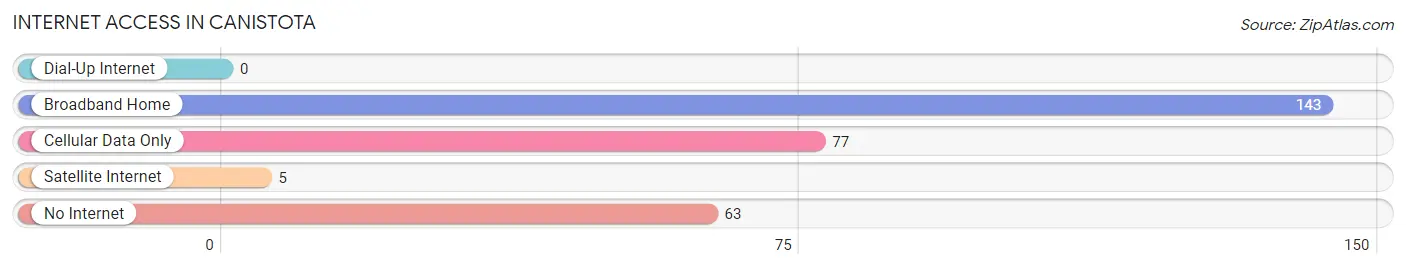
| Internet Type | # Households | % Households |
| Dial-Up Internet | 0 | 0.0% |
| Broadband Home | 143 | 50.2% |
| Cellular Data Only | 77 | 27.0% |
| Satellite Internet | 5 | 1.8% |
| No Internet | 63 | 22.1% |
| Total | 285 | 100.0% |
Canistota Summary
Canistota is a small town located in McCook County, South Dakota, United States. The town is situated on the banks of the Big Sioux River, and is home to a population of approximately 1,000 people.
History
Canistota was founded in 1881 by a group of settlers from Wisconsin. The town was named after the nearby Canistota Creek, which was named after the Sioux word for “good water”. The town was originally a farming community, and the first settlers were primarily of German and Scandinavian descent.
In the early 1900s, the town began to grow and develop. The railroad arrived in Canistota in 1906, and the town was incorporated in 1908. The railroad brought with it a new wave of settlers, and the town’s population began to grow.
In the 1920s, the town experienced a period of growth and prosperity. The population increased to over 1,000 people, and the town was home to several businesses, including a bank, a hotel, a lumberyard, and a creamery.
Geography
Canistota is located in southeastern South Dakota, in McCook County. The town is situated on the banks of the Big Sioux River, and is surrounded by rolling hills and prairies. The town is located approximately 25 miles south of Sioux Falls, and is approximately 50 miles north of Mitchell.
The town has a total area of 1.2 square miles, all of which is land. The town has a humid continental climate, with hot summers and cold winters. The average annual temperature is 48°F, and the average annual precipitation is 22 inches.
Economy
Canistota’s economy is primarily based on agriculture. The town is home to several farms, and the surrounding area is used for growing corn, soybeans, and wheat. The town is also home to several businesses, including a bank, a hotel, a lumberyard, and a creamery.
Demographics
As of the 2010 census, Canistota had a population of 1,039 people. The racial makeup of the town was 97.2% White, 0.4% African American, 0.2% Native American, 0.2% Asian, 0.2% from other races, and 1.9% from two or more races. Hispanic or Latino of any race were 1.2% of the population.
The median income for a household in Canistota was $41,250, and the median income for a family was $50,000. The per capita income for the town was $19,945. About 8.2% of families and 10.2% of the population were below the poverty line, including 11.2% of those under age 18 and 8.3% of those age 65 or over.
Common Questions
What is Per Capita Income in Canistota?
Per Capita income in Canistota is $30,316.
What is the Median Family Income in Canistota?
Median Family Income in Canistota is $67,500.
What is the Median Household income in Canistota?
Median Household Income in Canistota is $57,557.
What is Income or Wage Gap in Canistota?
Income or Wage Gap in Canistota is 38.6%.
Women in Canistota earn 61.4 cents for every dollar earned by a man.
What is Inequality or Gini Index in Canistota?
Inequality or Gini Index in Canistota is 0.35.
What is the Total Population of Canistota?
Total Population of Canistota is 670.
What is the Total Male Population of Canistota?
Total Male Population of Canistota is 340.
What is the Total Female Population of Canistota?
Total Female Population of Canistota is 330.
What is the Ratio of Males per 100 Females in Canistota?
There are 103.03 Males per 100 Females in Canistota.
What is the Ratio of Females per 100 Males in Canistota?
There are 97.06 Females per 100 Males in Canistota.
What is the Median Population Age in Canistota?
Median Population Age in Canistota is 39.0 Years.
What is the Average Family Size in Canistota
Average Family Size in Canistota is 2.7 People.
What is the Average Household Size in Canistota
Average Household Size in Canistota is 2.2 People.
How Large is the Labor Force in Canistota?
There are 367 People in the Labor Forcein in Canistota.
What is the Percentage of People in the Labor Force in Canistota?
69.0% of People are in the Labor Force in Canistota.
What is the Unemployment Rate in Canistota?
Unemployment Rate in Canistota is 3.3%.