Buffalo Gap, SD Map & Demographics
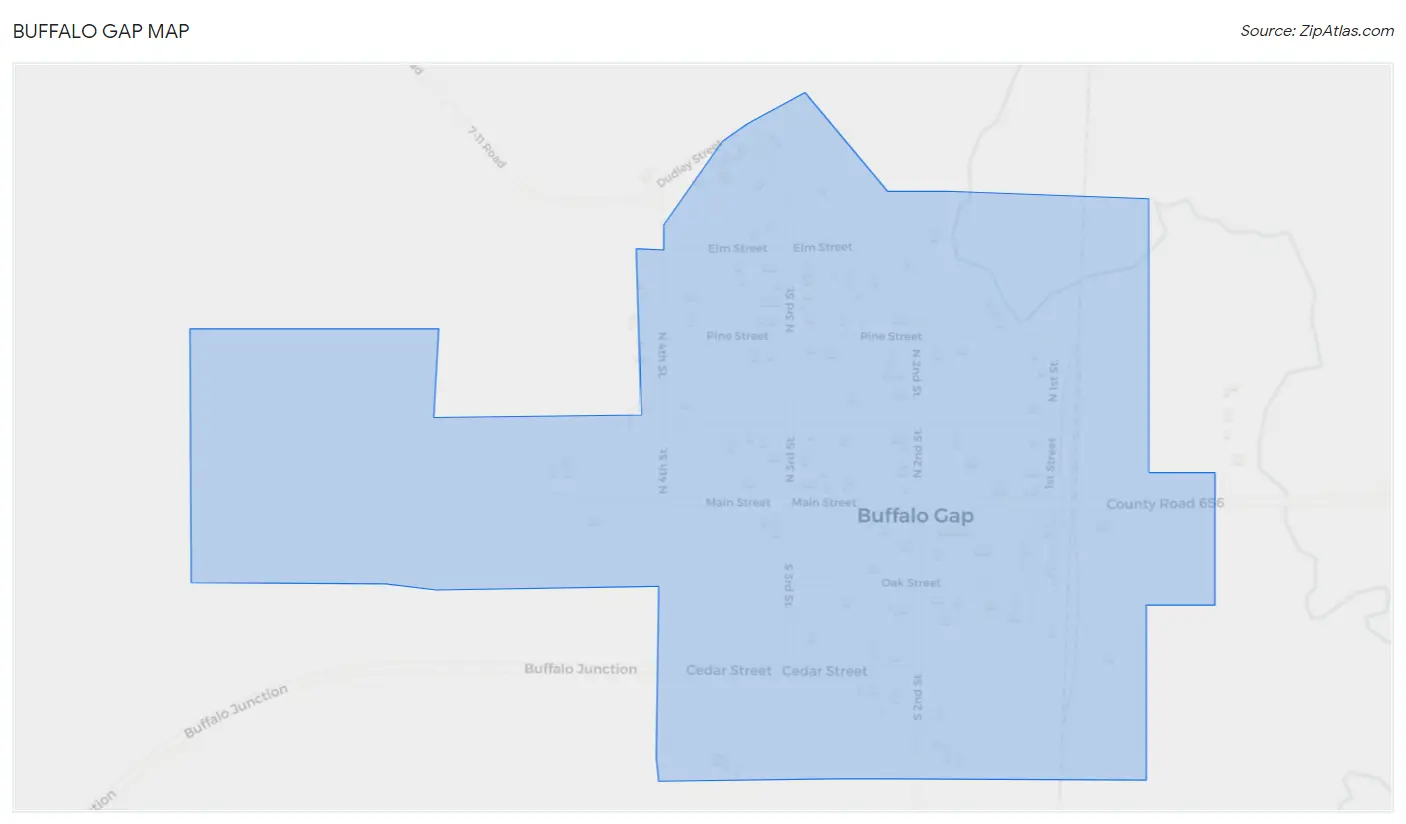
Buffalo Gap Map
Buffalo Gap Overview
$30,024
PER CAPITA INCOME
$69,792
AVG FAMILY INCOME
0.36
INEQUALITY / GINI INDEX
123
TOTAL POPULATION
72
MALE POPULATION
51
FEMALE POPULATION
141.18
MALES / 100 FEMALES
70.83
FEMALES / 100 MALES
66.5
MEDIAN AGE
2.5
AVG FAMILY SIZE
1.7
AVG HOUSEHOLD SIZE
54
LABOR FORCE [ PEOPLE ]
49.1%
PERCENT IN LABOR FORCE
5.6%
UNEMPLOYMENT RATE
Buffalo Gap Zip Codes
Buffalo Gap Area Codes
Income in Buffalo Gap
Income Overview in Buffalo Gap
| Characteristic | Number | Measure |
| Per Capita Income | 123 | $30,024 |
| Median Family Income | 33 | $69,792 |
| Mean Family Income | 33 | $69,276 |
| Median Household Income | 71 | $0 |
| Mean Household Income | 71 | $51,179 |
| Income Deficit | 33 | $0 |
| Wage / Income Gap (%) | 123 | 0.00% |
| Wage / Income Gap ($) | 123 | 100.00¢ per $1 |
| Gini / Inequality Index | 123 | 0.36 |
Earnings by Sex in Buffalo Gap
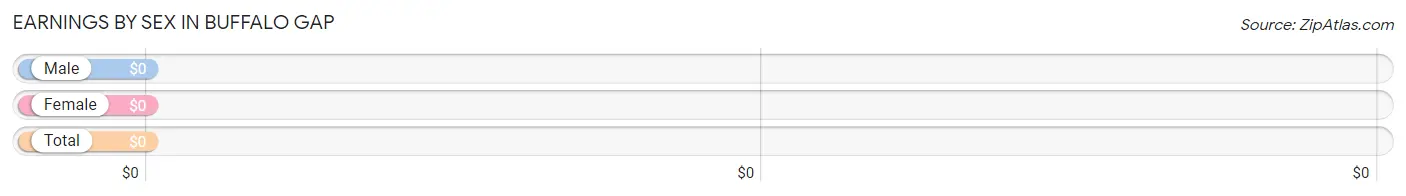
| Sex | Number | Average Earnings |
| Male | 38 (63.3%) | $0 |
| Female | 22 (36.7%) | $0 |
| Total | 60 (100.0%) | $0 |
Earnings by Sex by Income Bracket in Buffalo Gap
The most common earnings brackets in Buffalo Gap are $10,000 to $12,499 for men (11 | 28.9%) and $7,500 to $9,999 for women (12 | 54.5%).
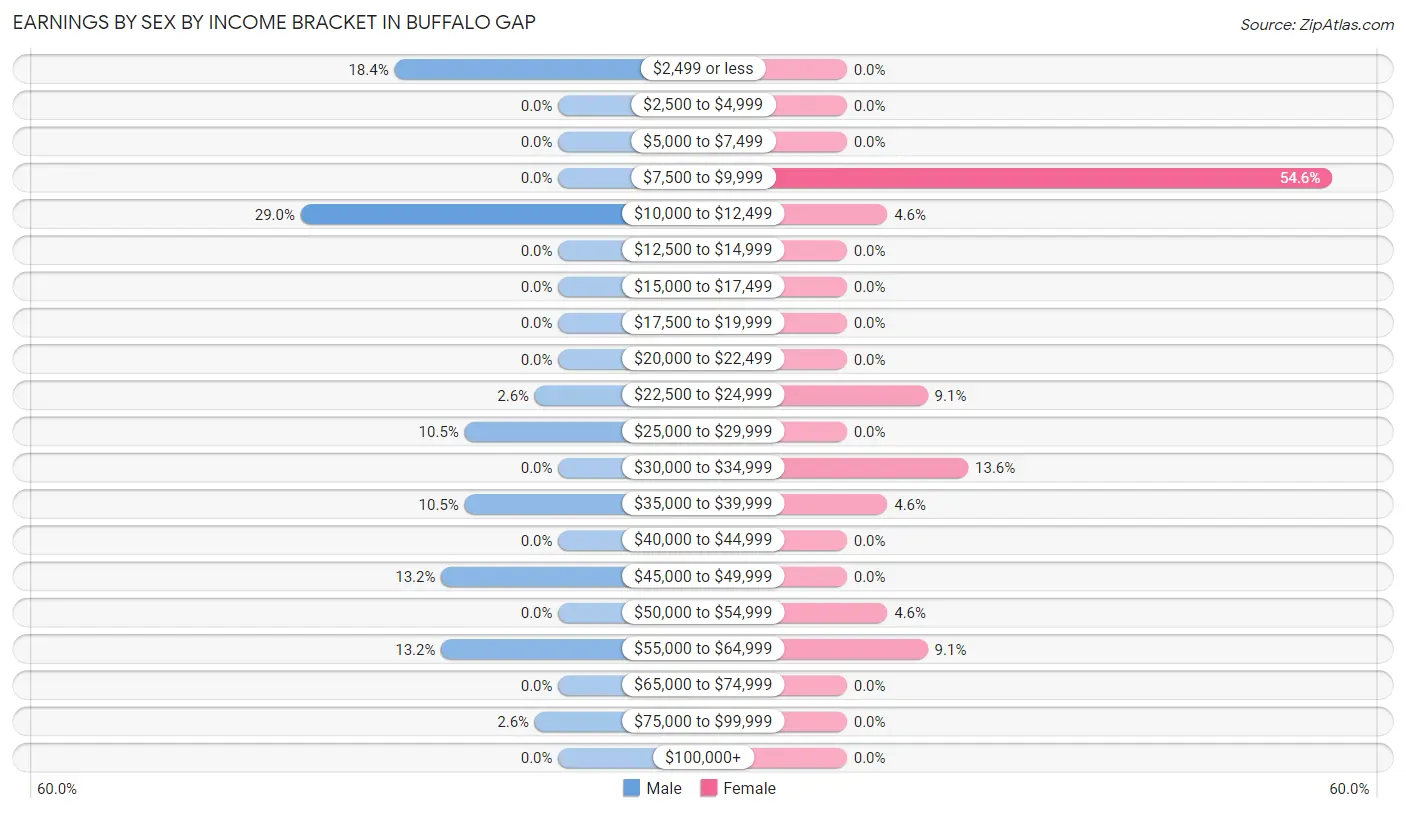
| Income | Male | Female |
| $2,499 or less | 7 (18.4%) | 0 (0.0%) |
| $2,500 to $4,999 | 0 (0.0%) | 0 (0.0%) |
| $5,000 to $7,499 | 0 (0.0%) | 0 (0.0%) |
| $7,500 to $9,999 | 0 (0.0%) | 12 (54.5%) |
| $10,000 to $12,499 | 11 (28.9%) | 1 (4.5%) |
| $12,500 to $14,999 | 0 (0.0%) | 0 (0.0%) |
| $15,000 to $17,499 | 0 (0.0%) | 0 (0.0%) |
| $17,500 to $19,999 | 0 (0.0%) | 0 (0.0%) |
| $20,000 to $22,499 | 0 (0.0%) | 0 (0.0%) |
| $22,500 to $24,999 | 1 (2.6%) | 2 (9.1%) |
| $25,000 to $29,999 | 4 (10.5%) | 0 (0.0%) |
| $30,000 to $34,999 | 0 (0.0%) | 3 (13.6%) |
| $35,000 to $39,999 | 4 (10.5%) | 1 (4.5%) |
| $40,000 to $44,999 | 0 (0.0%) | 0 (0.0%) |
| $45,000 to $49,999 | 5 (13.2%) | 0 (0.0%) |
| $50,000 to $54,999 | 0 (0.0%) | 1 (4.5%) |
| $55,000 to $64,999 | 5 (13.2%) | 2 (9.1%) |
| $65,000 to $74,999 | 0 (0.0%) | 0 (0.0%) |
| $75,000 to $99,999 | 1 (2.6%) | 0 (0.0%) |
| $100,000+ | 0 (0.0%) | 0 (0.0%) |
| Total | 38 (100.0%) | 22 (100.0%) |
Earnings by Sex by Educational Attainment in Buffalo Gap
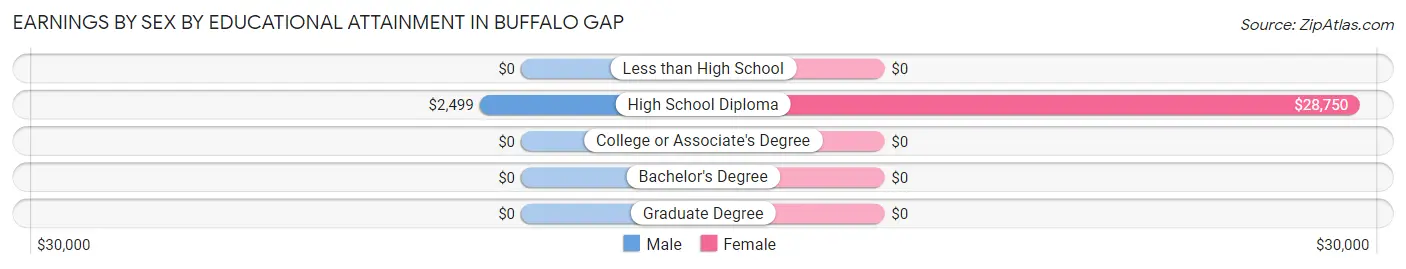
| Educational Attainment | Male Income | Female Income |
| Less than High School | - | - |
| High School Diploma | $2,499 | $28,750 |
| College or Associate's Degree | - | - |
| Bachelor's Degree | - | - |
| Graduate Degree | - | - |
| Total | - | - |
Family Income in Buffalo Gap
Family Income Brackets in Buffalo Gap
According to the Buffalo Gap family income data, there are 13 families falling into the $75,000 to $99,999 income range, which is the most common income bracket and makes up 39.4% of all families.
| Income Bracket | # Families | % Families |
| Less than $10,000 | 0 | 0.0% |
| $10,000 to $14,999 | 1 | 3.0% |
| $15,000 to $24,999 | 0 | 0.0% |
| $25,000 to $34,999 | 6 | 18.2% |
| $35,000 to $49,999 | 2 | 6.1% |
| $50,000 to $74,999 | 8 | 24.2% |
| $75,000 to $99,999 | 13 | 39.4% |
| $100,000 to $149,999 | 3 | 9.1% |
| $150,000 to $199,999 | 0 | 0.0% |
| $200,000+ | 0 | 0.0% |
Family Income by Famaliy Size in Buffalo Gap
2-person families (30 | 90.9%) account for the highest median family income in Buffalo Gap with $78,333 per family, while 2-person families (30 | 90.9%) have the highest median income of $39,166 per family member.
| Income Bracket | # Families | Median Income |
| 2-Person Families | 30 (90.9%) | $78,333 |
| 3-Person Families | 1 (3.0%) | $0 |
| 4-Person Families | 0 (0.0%) | $0 |
| 5-Person Families | 0 (0.0%) | $0 |
| 6-Person Families | 1 (3.0%) | $0 |
| 7+ Person Families | 1 (3.0%) | $0 |
| Total | 33 (100.0%) | $69,792 |
Family Income by Number of Earners in Buffalo Gap
| Number of Earners | # Families | Median Income |
| No Earners | 1 (3.0%) | $0 |
| 1 Earner | 10 (30.3%) | $0 |
| 2 Earners | 22 (66.7%) | $83,000 |
| 3+ Earners | 0 (0.0%) | $0 |
| Total | 33 (100.0%) | $69,792 |
Household Income in Buffalo Gap
Household Income Brackets in Buffalo Gap
With 25 households falling in the category, the $15,000 to $24,999 income range is the most frequent in Buffalo Gap, accounting for 35.2% of all households.
| Income Bracket | # Households | % Households |
| Less than $10,000 | 1 | 1.4% |
| $10,000 to $14,999 | 2 | 2.8% |
| $15,000 to $24,999 | 25 | 35.2% |
| $25,000 to $34,999 | 9 | 12.7% |
| $35,000 to $49,999 | 2 | 2.8% |
| $50,000 to $74,999 | 10 | 14.1% |
| $75,000 to $99,999 | 18 | 25.4% |
| $100,000 to $149,999 | 4 | 5.6% |
| $150,000 to $199,999 | 0 | 0.0% |
| $200,000+ | 0 | 0.0% |
Household Income by Householder Age in Buffalo Gap
The median household income in Buffalo Gap is $0, with the highest median household income of $67,750 found in the 45 to 64 years age bracket for the primary householder. A total of 23 households (32.4%) fall into this category.
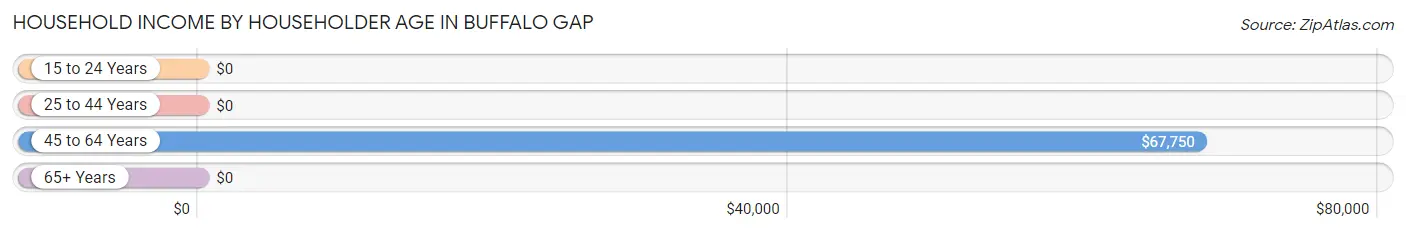
| Income Bracket | # Households | Median Income |
| 15 to 24 Years | 0 (0.0%) | $0 |
| 25 to 44 Years | 2 (2.8%) | $0 |
| 45 to 64 Years | 23 (32.4%) | $67,750 |
| 65+ Years | 46 (64.8%) | $0 |
| Total | 71 (100.0%) | $0 |
Poverty in Buffalo Gap
Income Below Poverty by Sex and Age in Buffalo Gap
With 1.4% poverty level for males and 7.8% for females among the residents of Buffalo Gap, under 5 year old males and 25 to 34 year old females are the most vulnerable to poverty, with 1 males (20.0%) and 1 females (33.3%) in their respective age groups living below the poverty level.
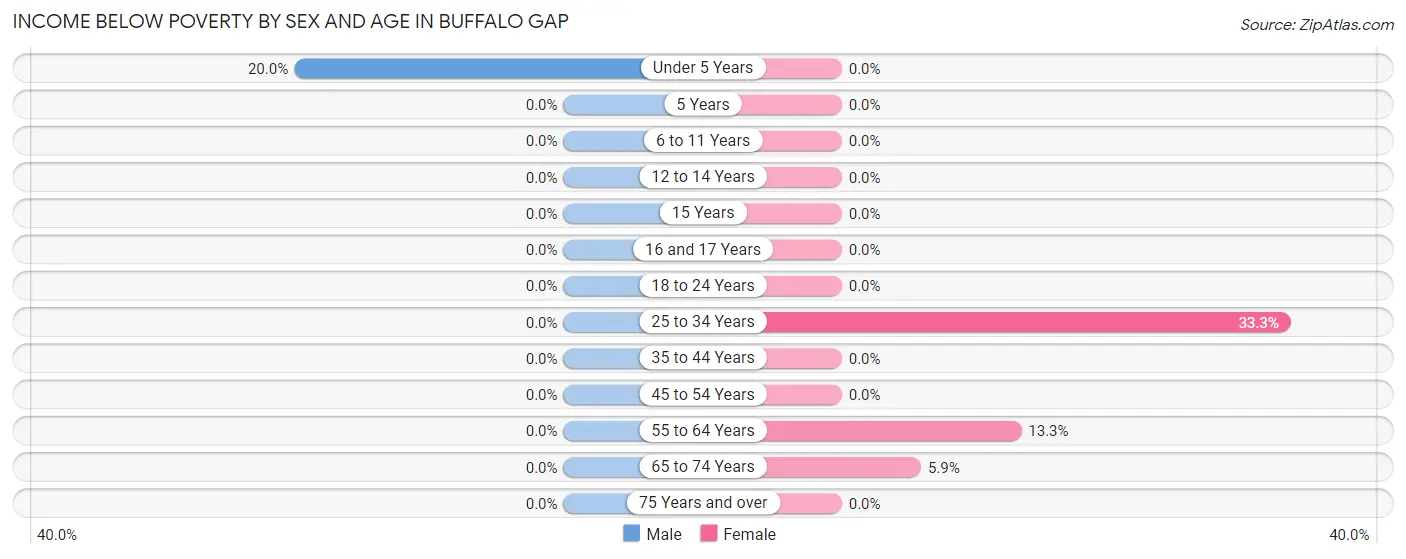
| Age Bracket | Male | Female |
| Under 5 Years | 1 (20.0%) | 0 (0.0%) |
| 5 Years | 0 (0.0%) | 0 (0.0%) |
| 6 to 11 Years | 0 (0.0%) | 0 (0.0%) |
| 12 to 14 Years | 0 (0.0%) | 0 (0.0%) |
| 15 Years | 0 (0.0%) | 0 (0.0%) |
| 16 and 17 Years | 0 (0.0%) | 0 (0.0%) |
| 18 to 24 Years | 0 (0.0%) | 0 (0.0%) |
| 25 to 34 Years | 0 (0.0%) | 1 (33.3%) |
| 35 to 44 Years | 0 (0.0%) | 0 (0.0%) |
| 45 to 54 Years | 0 (0.0%) | 0 (0.0%) |
| 55 to 64 Years | 0 (0.0%) | 2 (13.3%) |
| 65 to 74 Years | 0 (0.0%) | 1 (5.9%) |
| 75 Years and over | 0 (0.0%) | 0 (0.0%) |
| Total | 1 (1.4%) | 4 (7.8%) |
Income Above Poverty by Sex and Age in Buffalo Gap
According to the poverty statistics in Buffalo Gap, males aged 6 to 11 years and females aged under 5 years are the age groups that are most secure financially, with 100.0% of males and 100.0% of females in these age groups living above the poverty line.
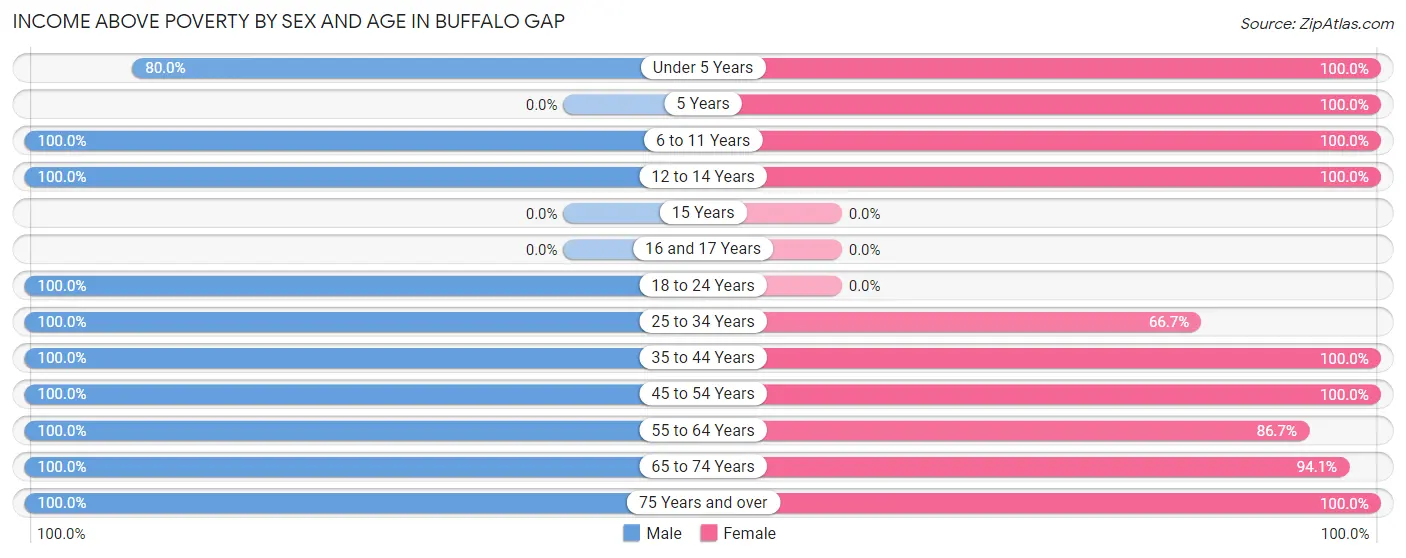
| Age Bracket | Male | Female |
| Under 5 Years | 4 (80.0%) | 2 (100.0%) |
| 5 Years | 0 (0.0%) | 2 (100.0%) |
| 6 to 11 Years | 1 (100.0%) | 1 (100.0%) |
| 12 to 14 Years | 1 (100.0%) | 1 (100.0%) |
| 15 Years | 0 (0.0%) | 0 (0.0%) |
| 16 and 17 Years | 0 (0.0%) | 0 (0.0%) |
| 18 to 24 Years | 4 (100.0%) | 0 (0.0%) |
| 25 to 34 Years | 1 (100.0%) | 2 (66.7%) |
| 35 to 44 Years | 2 (100.0%) | 1 (100.0%) |
| 45 to 54 Years | 8 (100.0%) | 2 (100.0%) |
| 55 to 64 Years | 12 (100.0%) | 13 (86.7%) |
| 65 to 74 Years | 16 (100.0%) | 16 (94.1%) |
| 75 Years and over | 22 (100.0%) | 7 (100.0%) |
| Total | 71 (98.6%) | 47 (92.2%) |
Income Below Poverty Among Married-Couple Families in Buffalo Gap
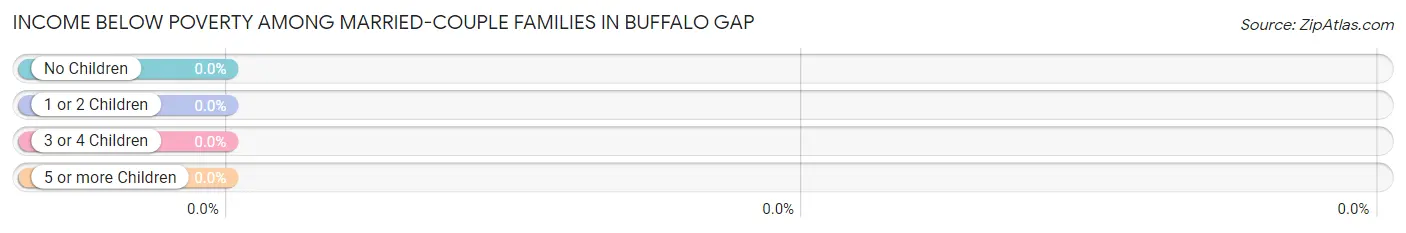
| Children | Above Poverty | Below Poverty |
| No Children | 20 (100.0%) | 0 (0.0%) |
| 1 or 2 Children | 0 (0.0%) | 0 (0.0%) |
| 3 or 4 Children | 1 (100.0%) | 0 (0.0%) |
| 5 or more Children | 1 (100.0%) | 0 (0.0%) |
| Total | 22 (100.0%) | 0 (0.0%) |
Income Below Poverty Among Single-Parent Households in Buffalo Gap
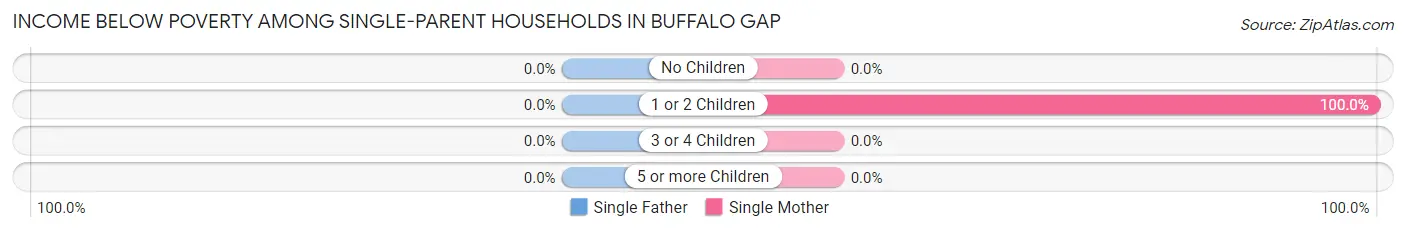
| Children | Single Father | Single Mother |
| No Children | 0 (0.0%) | 0 (0.0%) |
| 1 or 2 Children | 0 (0.0%) | 1 (100.0%) |
| 3 or 4 Children | 0 (0.0%) | 0 (0.0%) |
| 5 or more Children | 0 (0.0%) | 0 (0.0%) |
| Total | 0 (0.0%) | 1 (14.3%) |
Income Below Poverty Among Married-Couple vs Single-Parent Households in Buffalo Gap
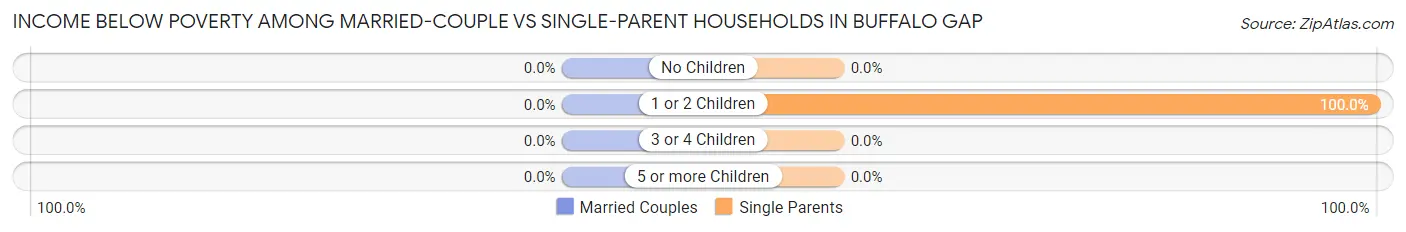
| Children | Married-Couple Families | Single-Parent Households |
| No Children | 0 (0.0%) | 0 (0.0%) |
| 1 or 2 Children | 0 (0.0%) | 1 (100.0%) |
| 3 or 4 Children | 0 (0.0%) | 0 (0.0%) |
| 5 or more Children | 0 (0.0%) | 0 (0.0%) |
| Total | 0 (0.0%) | 1 (9.1%) |
Race in Buffalo Gap
The most populous races in Buffalo Gap are White / Caucasian (120 | 97.6%), Two or more Races (2 | 1.6%), and Native / Alaskan (1 | 0.8%).
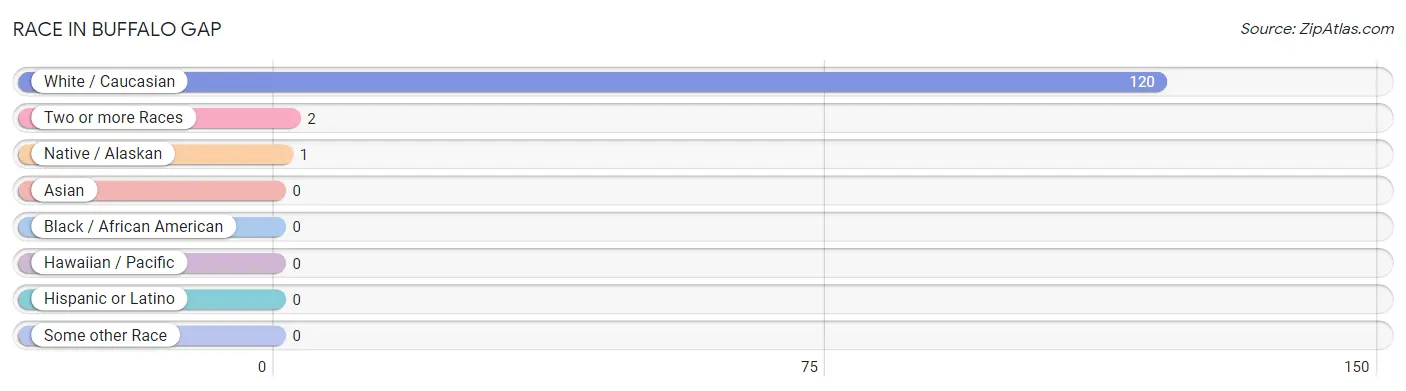
| Race | # Population | % Population |
| Asian | 0 | 0.0% |
| Black / African American | 0 | 0.0% |
| Hawaiian / Pacific | 0 | 0.0% |
| Hispanic or Latino | 0 | 0.0% |
| Native / Alaskan | 1 | 0.8% |
| White / Caucasian | 120 | 97.6% |
| Two or more Races | 2 | 1.6% |
| Some other Race | 0 | 0.0% |
| Total | 123 | 100.0% |
Ancestry in Buffalo Gap
The most populous ancestries reported in Buffalo Gap are English (60 | 48.8%), Irish (44 | 35.8%), German (27 | 22.0%), Austrian (8 | 6.5%), and Scottish (7 | 5.7%), together accounting for 118.7% of all Buffalo Gap residents.
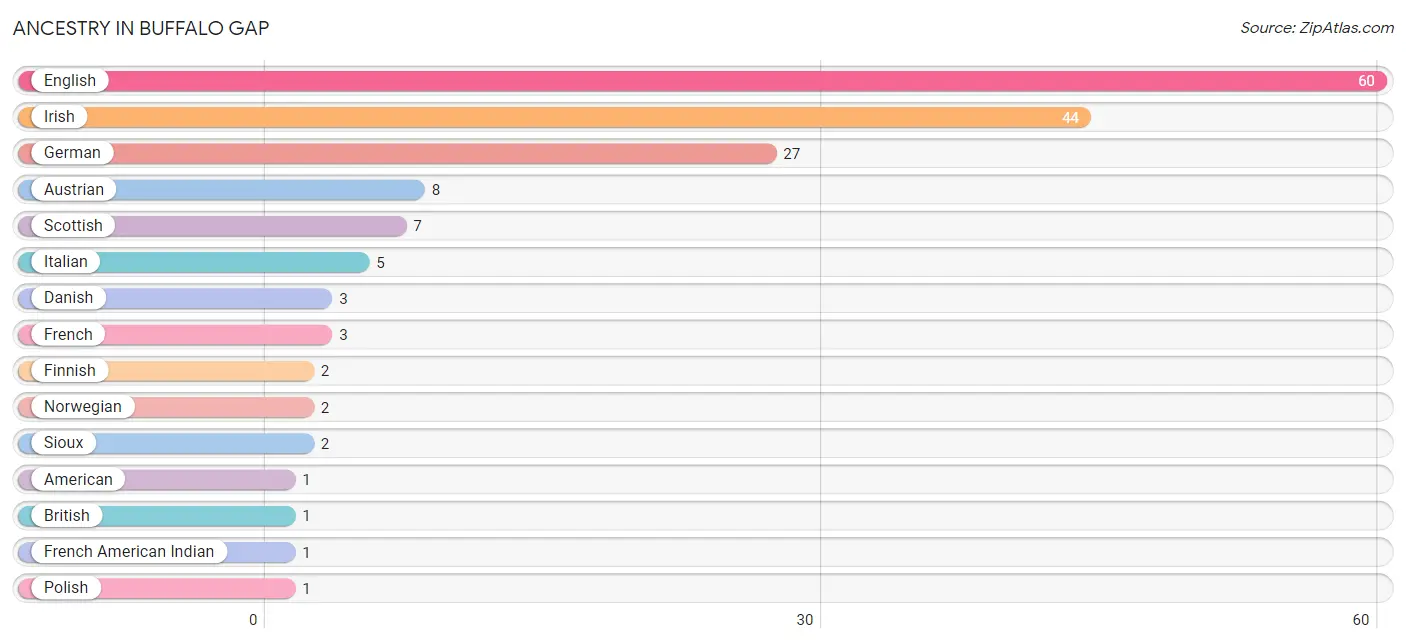
| Ancestry | # Population | % Population |
| American | 1 | 0.8% |
| Austrian | 8 | 6.5% |
| British | 1 | 0.8% |
| Danish | 3 | 2.4% |
| English | 60 | 48.8% |
| Finnish | 2 | 1.6% |
| French | 3 | 2.4% |
| French American Indian | 1 | 0.8% |
| German | 27 | 22.0% |
| Irish | 44 | 35.8% |
| Italian | 5 | 4.1% |
| Norwegian | 2 | 1.6% |
| Polish | 1 | 0.8% |
| Scottish | 7 | 5.7% |
| Sioux | 2 | 1.6% |
| Swedish | 1 | 0.8% | View All 16 Rows |
Immigrants in Buffalo Gap
The most numerous immigrant groups reported in Buffalo Gap came from , and Canada (3 | 2.4%), together accounting for 2.4% of all Buffalo Gap residents.

| Immigration Origin | # Population | % Population |
| Canada | 3 | 2.4% | View All 1 Rows |
Sex and Age in Buffalo Gap
Sex and Age in Buffalo Gap
The most populous age groups in Buffalo Gap are 80 to 84 Years (22 | 30.6%) for men and 60 to 64 Years (14 | 27.5%) for women.
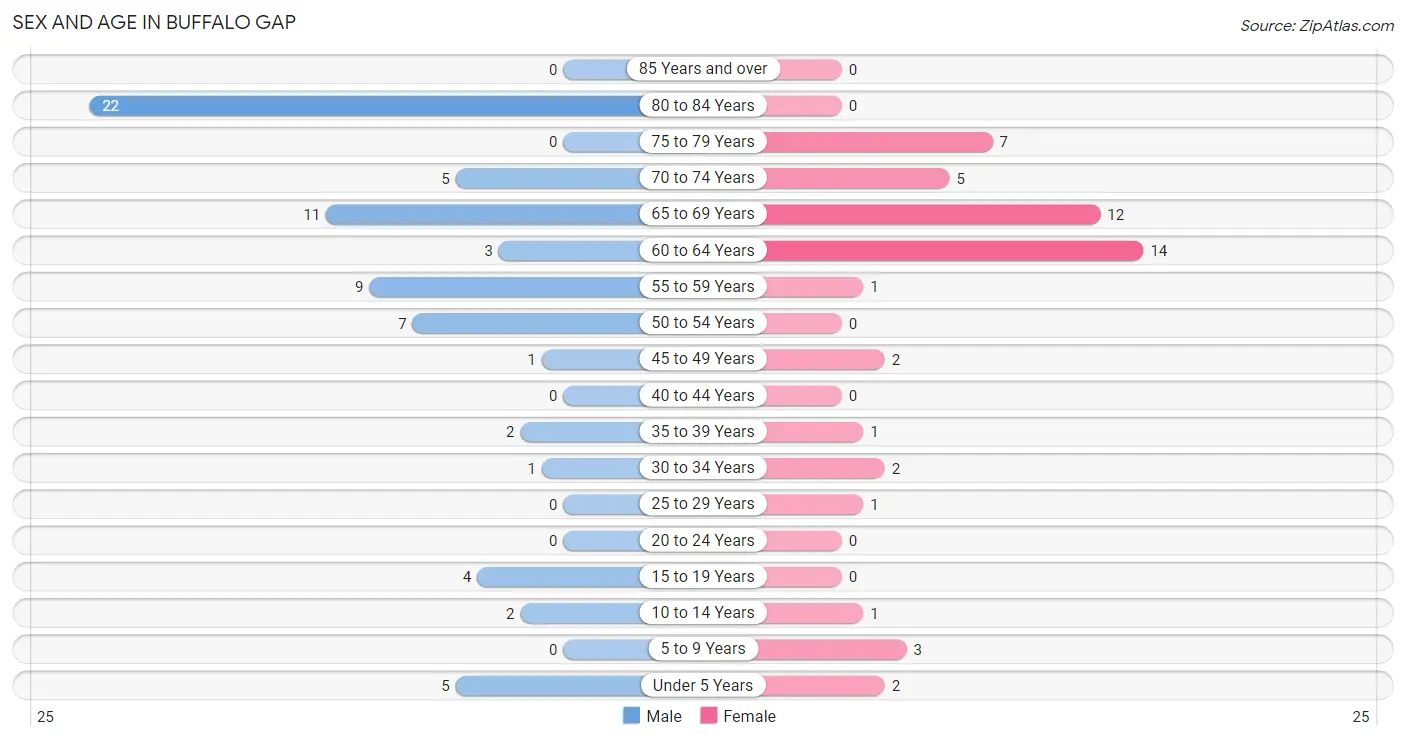
| Age Bracket | Male | Female |
| Under 5 Years | 5 (6.9%) | 2 (3.9%) |
| 5 to 9 Years | 0 (0.0%) | 3 (5.9%) |
| 10 to 14 Years | 2 (2.8%) | 1 (2.0%) |
| 15 to 19 Years | 4 (5.6%) | 0 (0.0%) |
| 20 to 24 Years | 0 (0.0%) | 0 (0.0%) |
| 25 to 29 Years | 0 (0.0%) | 1 (2.0%) |
| 30 to 34 Years | 1 (1.4%) | 2 (3.9%) |
| 35 to 39 Years | 2 (2.8%) | 1 (2.0%) |
| 40 to 44 Years | 0 (0.0%) | 0 (0.0%) |
| 45 to 49 Years | 1 (1.4%) | 2 (3.9%) |
| 50 to 54 Years | 7 (9.7%) | 0 (0.0%) |
| 55 to 59 Years | 9 (12.5%) | 1 (2.0%) |
| 60 to 64 Years | 3 (4.2%) | 14 (27.5%) |
| 65 to 69 Years | 11 (15.3%) | 12 (23.5%) |
| 70 to 74 Years | 5 (6.9%) | 5 (9.8%) |
| 75 to 79 Years | 0 (0.0%) | 7 (13.7%) |
| 80 to 84 Years | 22 (30.6%) | 0 (0.0%) |
| 85 Years and over | 0 (0.0%) | 0 (0.0%) |
| Total | 72 (100.0%) | 51 (100.0%) |
Families and Households in Buffalo Gap
Median Family Size in Buffalo Gap
The median family size in Buffalo Gap is 2.45 persons per family, with married-couple families (22 | 66.7%) accounting for the largest median family size of 2.68 persons per family. On the other hand, single male/father families (4 | 12.1%) represent the smallest median family size with 2.00 persons per family.
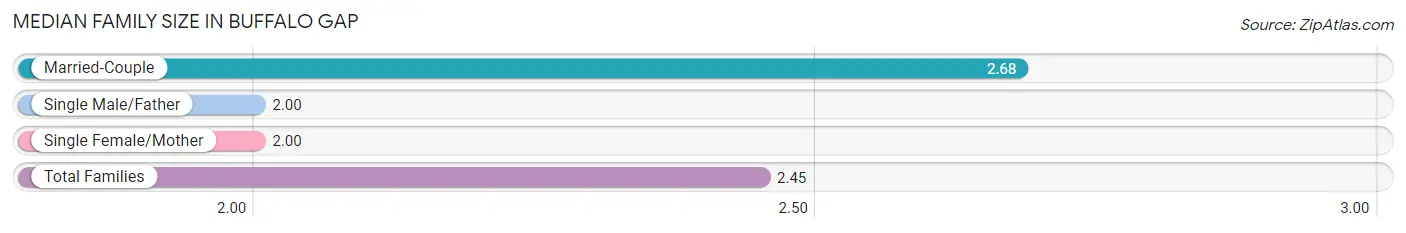
| Family Type | # Families | Family Size |
| Married-Couple | 22 (66.7%) | 2.68 |
| Single Male/Father | 4 (12.1%) | 2.00 |
| Single Female/Mother | 7 (21.2%) | 2.00 |
| Total Families | 33 (100.0%) | 2.45 |
Median Household Size in Buffalo Gap
The median household size in Buffalo Gap is 1.73 persons per household, with married-couple households (22 | 31.0%) accounting for the largest median household size of 2.68 persons per household. non-family households (38 | 53.5%) represent the smallest median household size with 1.11 persons per household.
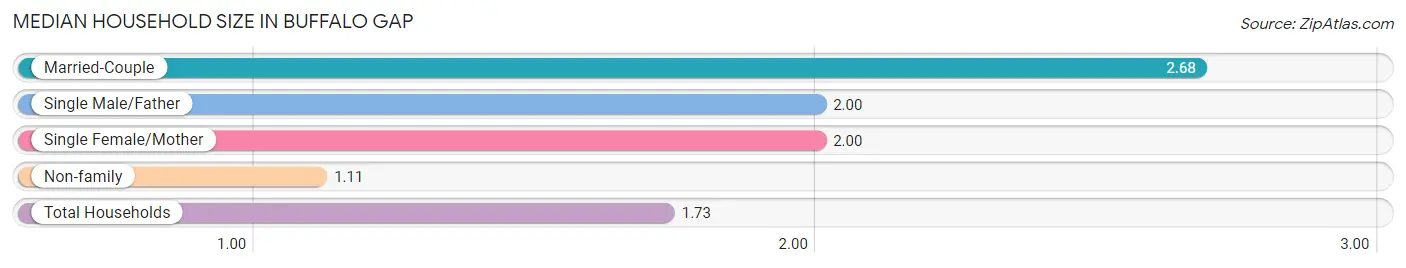
| Household Type | # Households | Household Size |
| Married-Couple | 22 (31.0%) | 2.68 |
| Single Male/Father | 4 (5.6%) | 2.00 |
| Single Female/Mother | 7 (9.9%) | 2.00 |
| Non-family | 38 (53.5%) | 1.11 |
| Total Households | 71 (100.0%) | 1.73 |
Household Size by Marriage Status in Buffalo Gap
Out of a total of 71 households in Buffalo Gap, 33 (46.5%) are family households, while 38 (53.5%) are nonfamily households. The most numerous type of family households are 2-person households, comprising 30, and the most common type of nonfamily households are 1-person households, comprising 34.
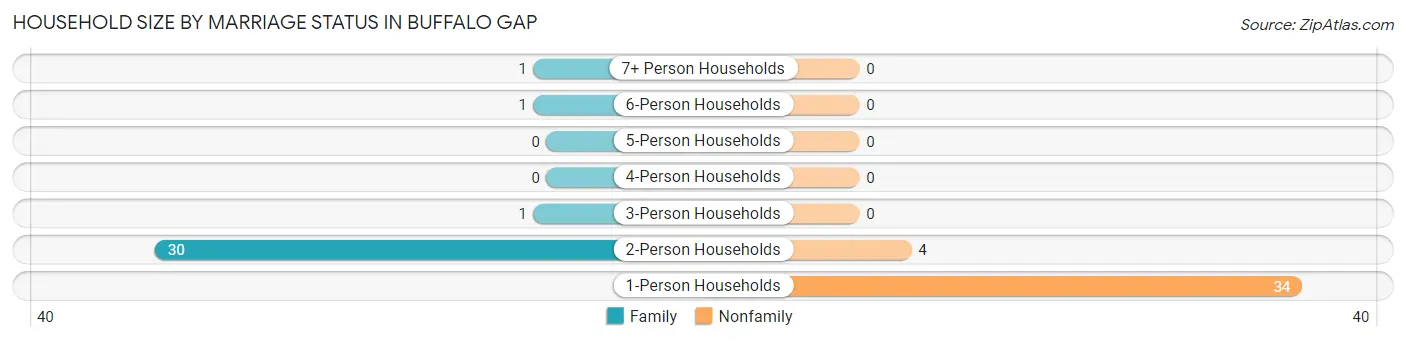
| Household Size | Family Households | Nonfamily Households |
| 1-Person Households | - | 34 (47.9%) |
| 2-Person Households | 30 (42.2%) | 4 (5.6%) |
| 3-Person Households | 1 (1.4%) | 0 (0.0%) |
| 4-Person Households | 0 (0.0%) | 0 (0.0%) |
| 5-Person Households | 0 (0.0%) | 0 (0.0%) |
| 6-Person Households | 1 (1.4%) | 0 (0.0%) |
| 7+ Person Households | 1 (1.4%) | 0 (0.0%) |
| Total | 33 (46.5%) | 38 (53.5%) |
Female Fertility in Buffalo Gap
Fertility by Age in Buffalo Gap
Average fertility rate in Buffalo Gap is 167.0 births per 1,000 women. Women in the age bracket of 20 to 34 years have the highest fertility rate with 333.0 births per 1,000 women. Women in the age bracket of 20 to 34 years acount for 100.0% of all women with births.
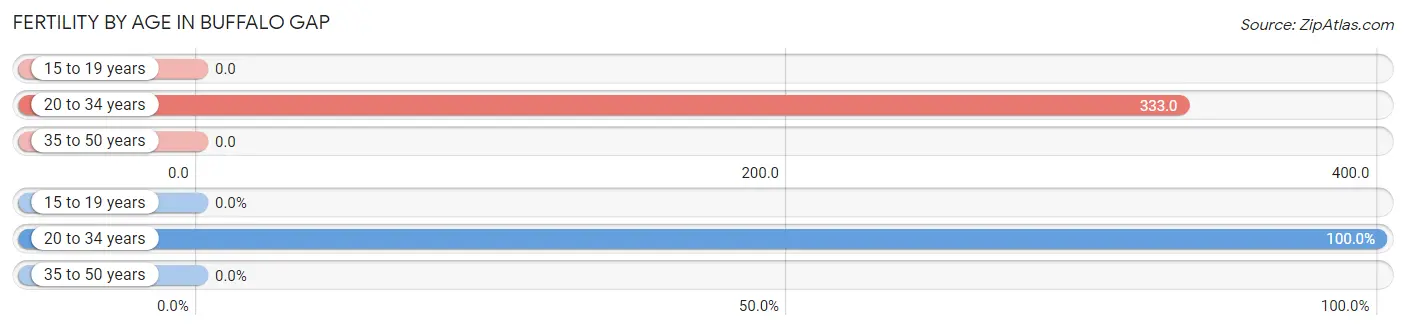
| Age Bracket | Women with Births | Births / 1,000 Women |
| 15 to 19 years | 0 (0.0%) | 0.0 |
| 20 to 34 years | 1 (100.0%) | 333.0 |
| 35 to 50 years | 0 (0.0%) | 0.0 |
| Total | 1 (100.0%) | 167.0 |
Fertility by Age by Marriage Status in Buffalo Gap
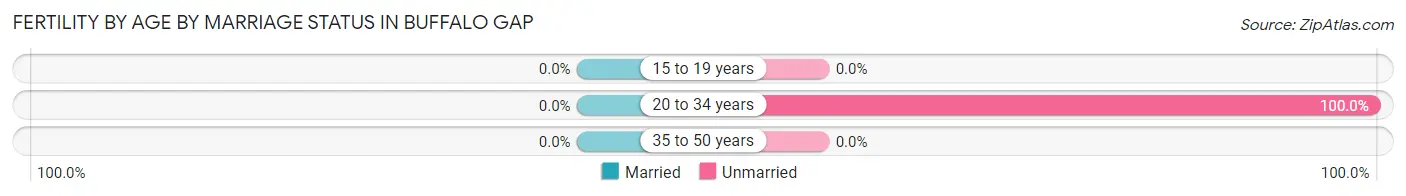
| Age Bracket | Married | Unmarried |
| 15 to 19 years | 0 (0.0%) | 0 (0.0%) |
| 20 to 34 years | 0 (0.0%) | 1 (100.0%) |
| 35 to 50 years | 0 (0.0%) | 0 (0.0%) |
| Total | 0 (0.0%) | 1 (100.0%) |
Fertility by Education in Buffalo Gap
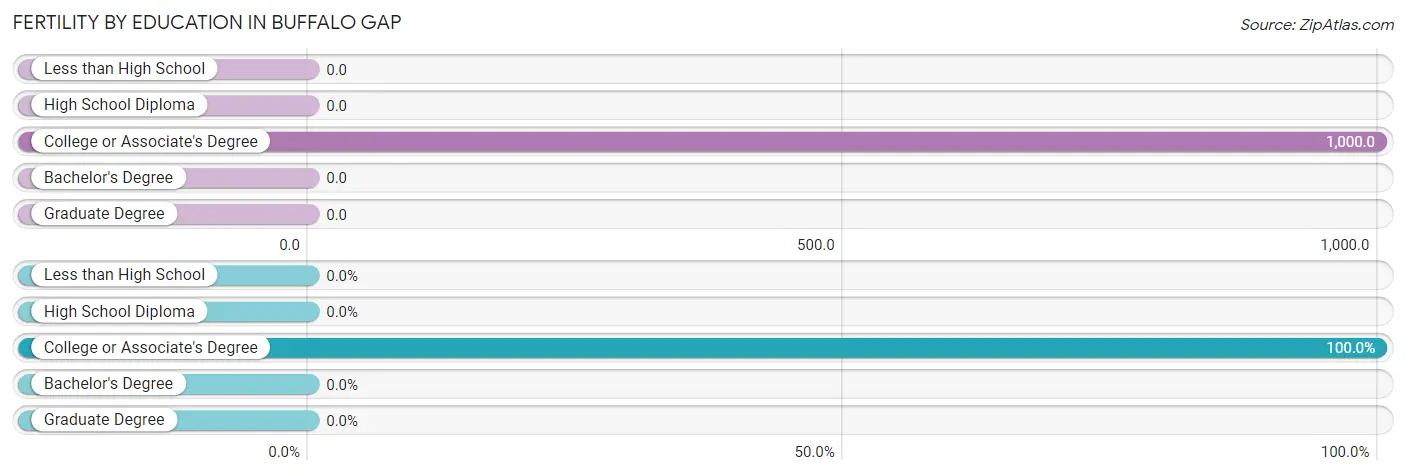
| Educational Attainment | Women with Births | Births / 1,000 Women |
| Less than High School | 0 (0.0%) | 0.0 |
| High School Diploma | 0 (0.0%) | 0.0 |
| College or Associate's Degree | 1 (100.0%) | 1,000.0 |
| Bachelor's Degree | 0 (0.0%) | 0.0 |
| Graduate Degree | 0 (0.0%) | 0.0 |
| Total | 1 (100.0%) | 167.0 |
Fertility by Education by Marriage Status in Buffalo Gap
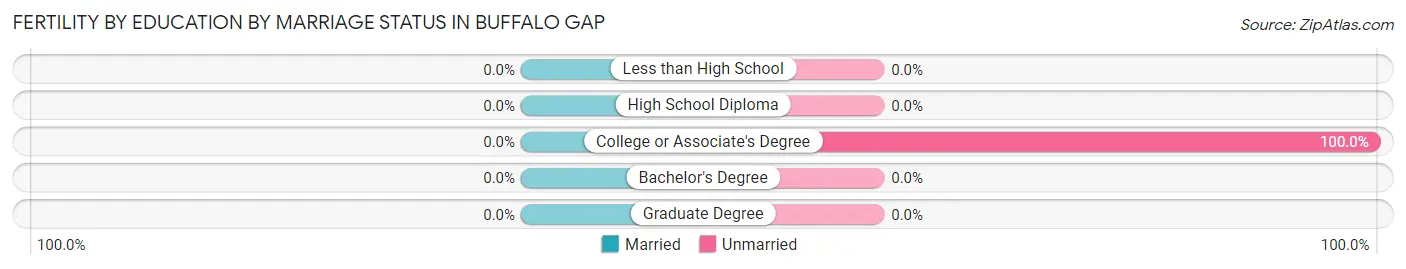
| Educational Attainment | Married | Unmarried |
| Less than High School | 0 (0.0%) | 0 (0.0%) |
| High School Diploma | 0 (0.0%) | 0 (0.0%) |
| College or Associate's Degree | 0 (0.0%) | 1 (100.0%) |
| Bachelor's Degree | 0 (0.0%) | 0 (0.0%) |
| Graduate Degree | 0 (0.0%) | 0 (0.0%) |
| Total | 0 (0.0%) | 1 (100.0%) |
Employment Characteristics in Buffalo Gap
Employment by Class of Employer in Buffalo Gap
Among the 50 employed individuals in Buffalo Gap, private company employees (24 | 48.0%), self-employed (not incorporated) (10 | 20.0%), and local government employees (5 | 10.0%) make up the most common classes of employment.
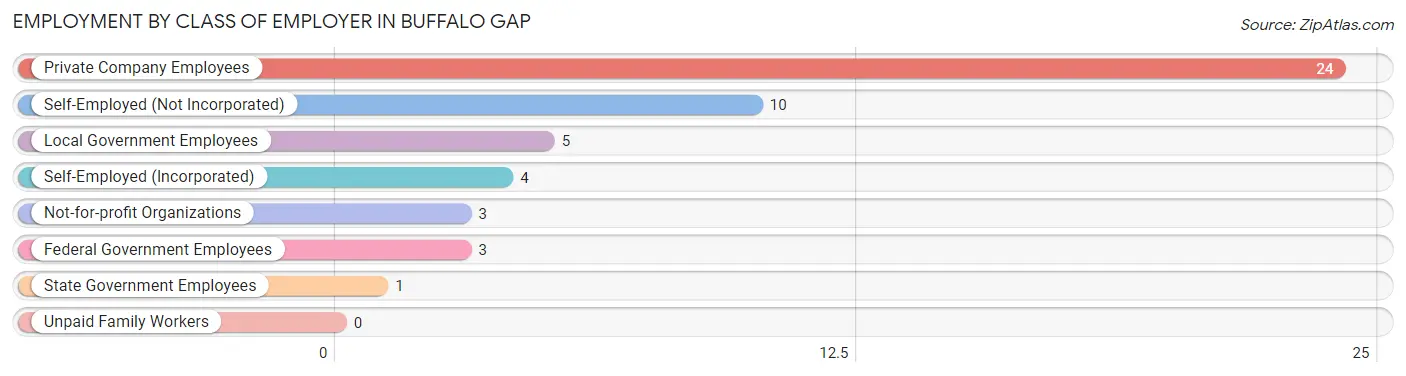
| Employer Class | # Employees | % Employees |
| Private Company Employees | 24 | 48.0% |
| Self-Employed (Incorporated) | 4 | 8.0% |
| Self-Employed (Not Incorporated) | 10 | 20.0% |
| Not-for-profit Organizations | 3 | 6.0% |
| Local Government Employees | 5 | 10.0% |
| State Government Employees | 1 | 2.0% |
| Federal Government Employees | 3 | 6.0% |
| Unpaid Family Workers | 0 | 0.0% |
| Total | 50 | 100.0% |
Employment Status by Age in Buffalo Gap
According to the labor force statistics for Buffalo Gap, out of the total population over 16 years of age (110), 49.1% or 54 individuals are in the labor force, with 5.6% or 3 of them unemployed. The age group with the highest labor force participation rate is 16 to 19 years, with 100.0% or 4 individuals in the labor force. Within the labor force, the 25 to 29 years age range has the highest percentage of unemployed individuals, with 100.0% or 1 of them being unemployed.
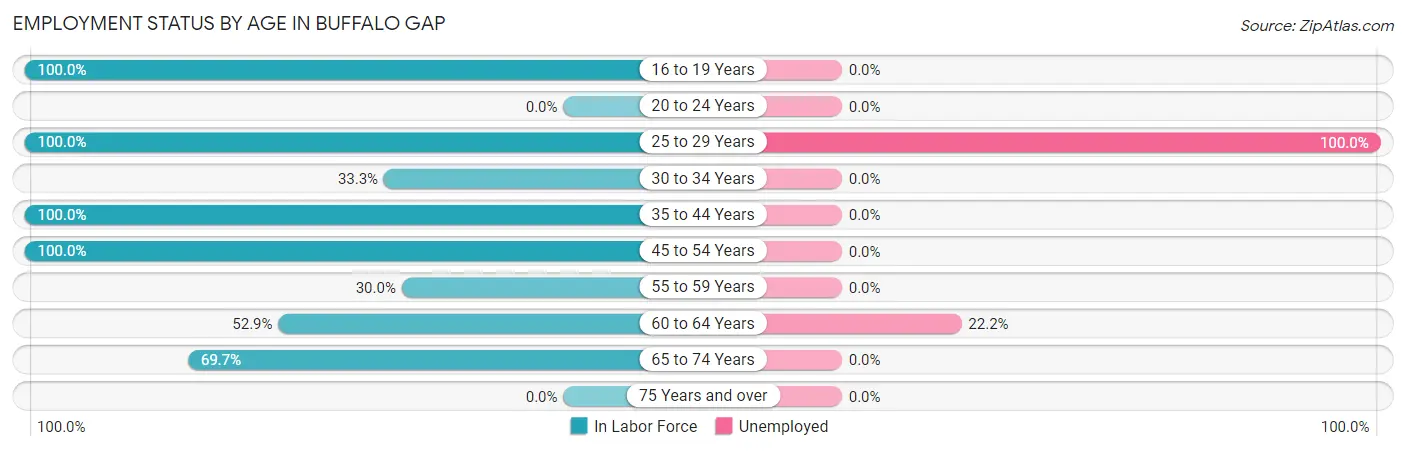
| Age Bracket | In Labor Force | Unemployed |
| 16 to 19 Years | 4 (100.0%) | 0 (0.0%) |
| 20 to 24 Years | 0 (0.0%) | 0 (0.0%) |
| 25 to 29 Years | 1 (100.0%) | 1 (100.0%) |
| 30 to 34 Years | 1 (33.3%) | 0 (0.0%) |
| 35 to 44 Years | 3 (100.0%) | 0 (0.0%) |
| 45 to 54 Years | 10 (100.0%) | 0 (0.0%) |
| 55 to 59 Years | 3 (30.0%) | 0 (0.0%) |
| 60 to 64 Years | 9 (52.9%) | 2 (22.2%) |
| 65 to 74 Years | 23 (69.7%) | 0 (0.0%) |
| 75 Years and over | 0 (0.0%) | 0 (0.0%) |
| Total | 54 (49.1%) | 3 (5.6%) |
Employment Status by Educational Attainment in Buffalo Gap
According to labor force statistics for Buffalo Gap, 61.4% of individuals (27) out of the total population between 25 and 64 years of age (44) are in the labor force, with 11.1% or 3 of them being unemployed. The group with the highest labor force participation rate are those with the educational attainment of bachelor's degree or higher, with 76.9% or 10 individuals in the labor force. Within the labor force, individuals with college / associate degree education have the highest percentage of unemployment, with 60.0% or 3 of them being unemployed.
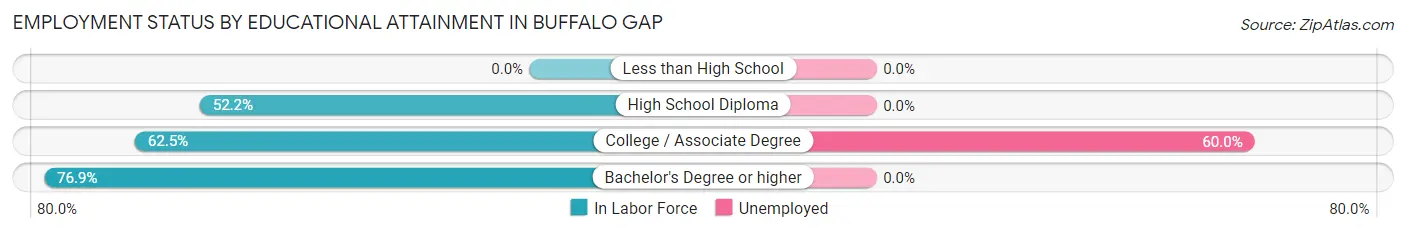
| Educational Attainment | In Labor Force | Unemployed |
| Less than High School | 0 (0.0%) | 0 (0.0%) |
| High School Diploma | 12 (52.2%) | 0 (0.0%) |
| College / Associate Degree | 5 (62.5%) | 5 (60.0%) |
| Bachelor's Degree or higher | 10 (76.9%) | 0 (0.0%) |
| Total | 27 (61.4%) | 5 (11.1%) |
Employment Occupations by Sex in Buffalo Gap
Management, Business, Science and Arts Occupations
The most common Management, Business, Science and Arts occupations in Buffalo Gap are Management (3 | 5.9%), Business & Financial (1 | 2.0%), Community & Social Service (1 | 2.0%), and Education, Arts & Media (1 | 2.0%).
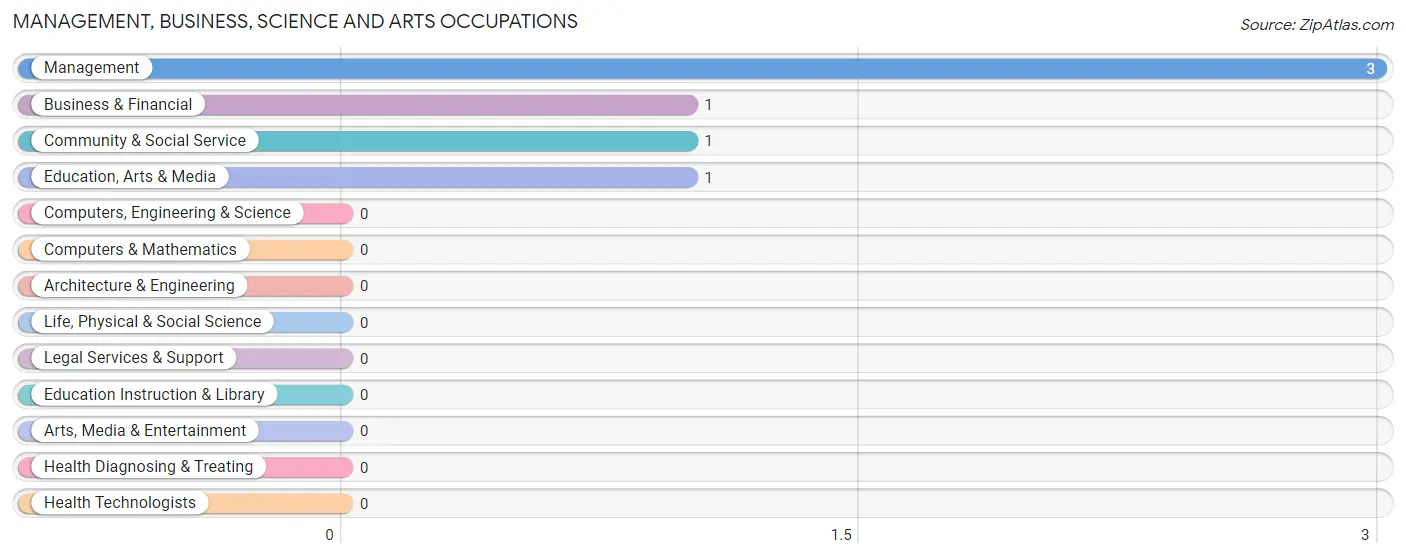
Management, Business, Science and Arts Occupations by Sex
Within the Management, Business, Science and Arts occupations in Buffalo Gap, the most male-oriented occupations are Business & Financial (100.0%), and Management (33.3%), while the most female-oriented occupations are Community & Social Service (100.0%), Education, Arts & Media (100.0%), and Management (66.7%).
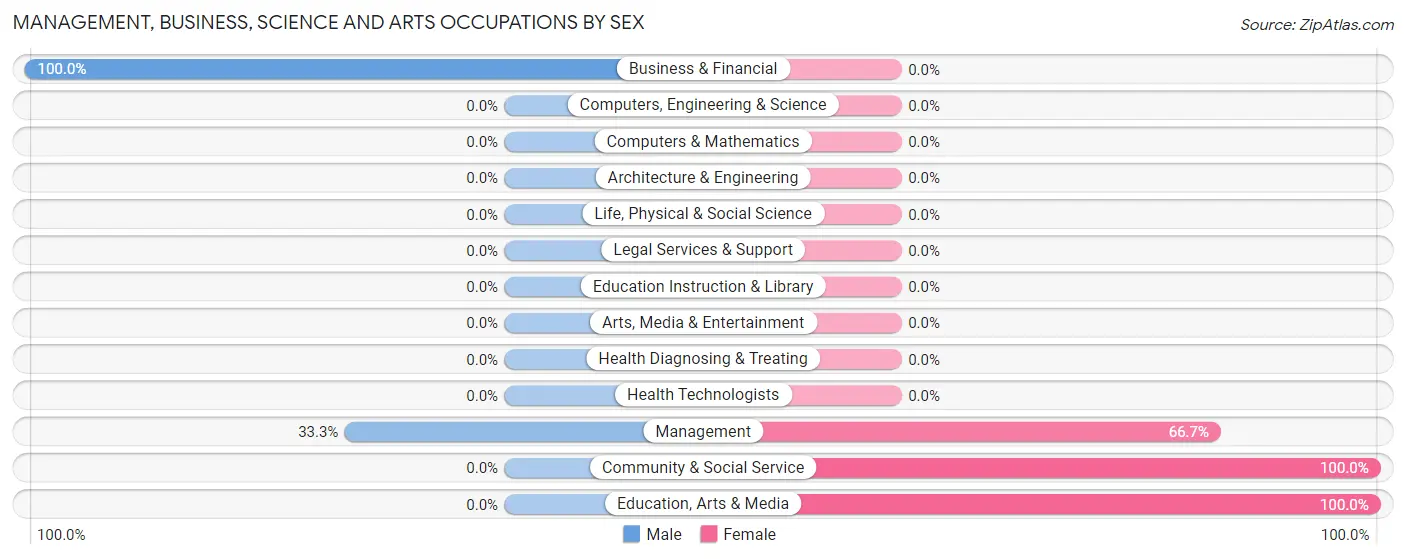
| Occupation | Male | Female |
| Management | 1 (33.3%) | 2 (66.7%) |
| Business & Financial | 1 (100.0%) | 0 (0.0%) |
| Computers, Engineering & Science | 0 (0.0%) | 0 (0.0%) |
| Computers & Mathematics | 0 (0.0%) | 0 (0.0%) |
| Architecture & Engineering | 0 (0.0%) | 0 (0.0%) |
| Life, Physical & Social Science | 0 (0.0%) | 0 (0.0%) |
| Community & Social Service | 0 (0.0%) | 1 (100.0%) |
| Education, Arts & Media | 0 (0.0%) | 1 (100.0%) |
| Legal Services & Support | 0 (0.0%) | 0 (0.0%) |
| Education Instruction & Library | 0 (0.0%) | 0 (0.0%) |
| Arts, Media & Entertainment | 0 (0.0%) | 0 (0.0%) |
| Health Diagnosing & Treating | 0 (0.0%) | 0 (0.0%) |
| Health Technologists | 0 (0.0%) | 0 (0.0%) |
| Total (Category) | 2 (40.0%) | 3 (60.0%) |
| Total (Overall) | 30 (58.8%) | 21 (41.2%) |
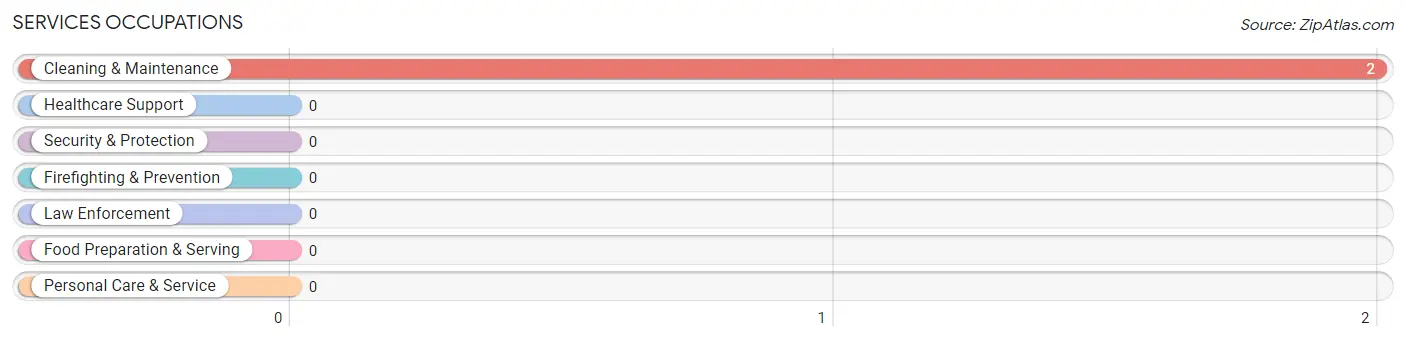
Services Occupations
The most common Services occupations in Buffalo Gap are , and Cleaning & Maintenance (2 | 3.9%).
Services Occupations by Sex
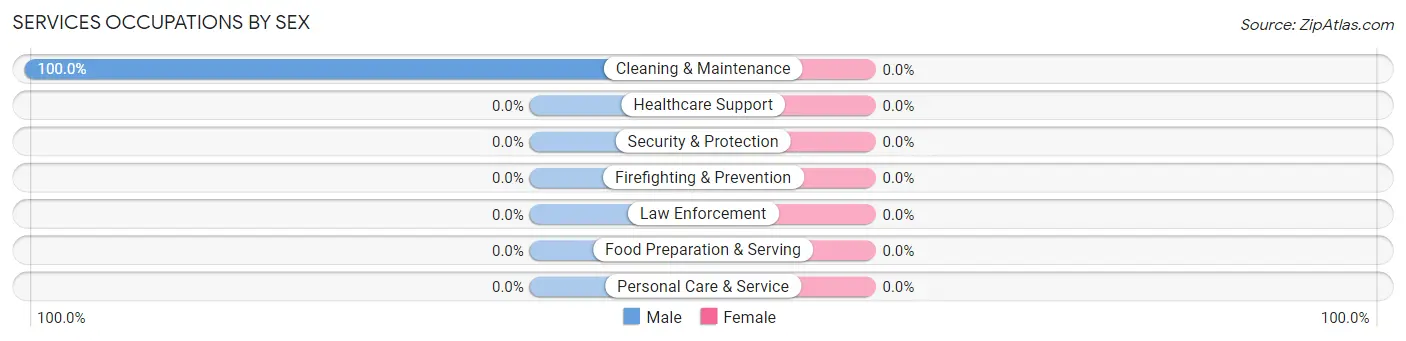
| Occupation | Male | Female |
| Healthcare Support | 0 (0.0%) | 0 (0.0%) |
| Security & Protection | 0 (0.0%) | 0 (0.0%) |
| Firefighting & Prevention | 0 (0.0%) | 0 (0.0%) |
| Law Enforcement | 0 (0.0%) | 0 (0.0%) |
| Food Preparation & Serving | 0 (0.0%) | 0 (0.0%) |
| Cleaning & Maintenance | 2 (100.0%) | 0 (0.0%) |
| Personal Care & Service | 0 (0.0%) | 0 (0.0%) |
| Total (Category) | 2 (100.0%) | 0 (0.0%) |
| Total (Overall) | 30 (58.8%) | 21 (41.2%) |
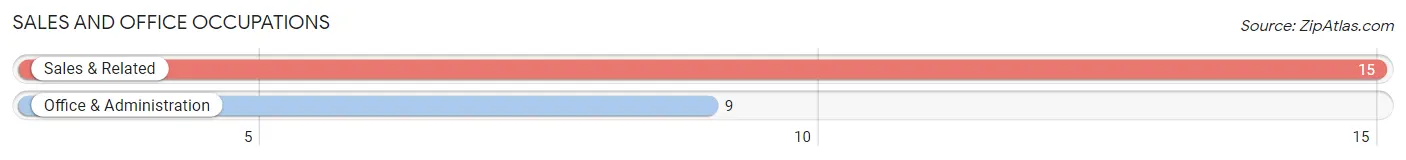
Sales and Office Occupations
The most common Sales and Office occupations in Buffalo Gap are Sales & Related (15 | 29.4%), and Office & Administration (9 | 17.6%).
Sales and Office Occupations by Sex
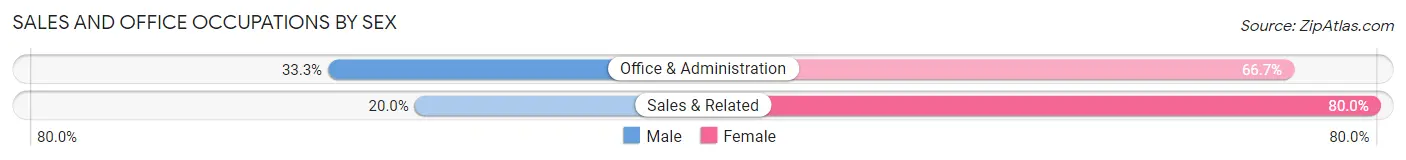
| Occupation | Male | Female |
| Sales & Related | 3 (20.0%) | 12 (80.0%) |
| Office & Administration | 3 (33.3%) | 6 (66.7%) |
| Total (Category) | 6 (25.0%) | 18 (75.0%) |
| Total (Overall) | 30 (58.8%) | 21 (41.2%) |
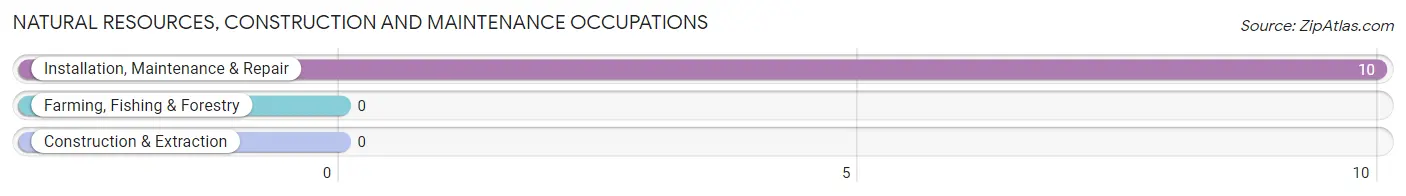
Natural Resources, Construction and Maintenance Occupations
The most common Natural Resources, Construction and Maintenance occupations in Buffalo Gap are , and Installation, Maintenance & Repair (10 | 19.6%).
Natural Resources, Construction and Maintenance Occupations by Sex
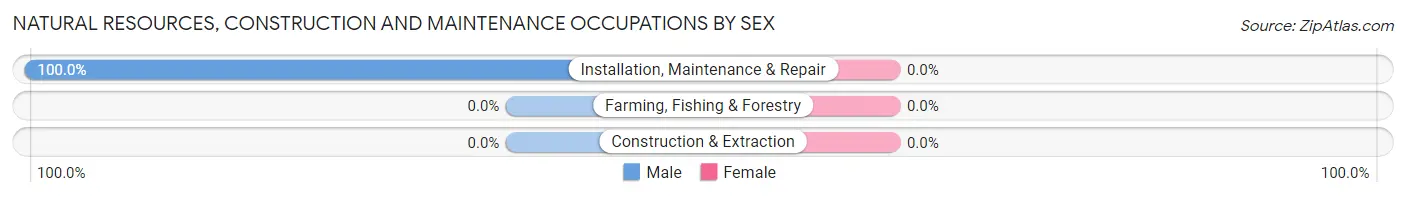
| Occupation | Male | Female |
| Farming, Fishing & Forestry | 0 (0.0%) | 0 (0.0%) |
| Construction & Extraction | 0 (0.0%) | 0 (0.0%) |
| Installation, Maintenance & Repair | 10 (100.0%) | 0 (0.0%) |
| Total (Category) | 10 (100.0%) | 0 (0.0%) |
| Total (Overall) | 30 (58.8%) | 21 (41.2%) |
Production, Transportation and Moving Occupations
The most common Production, Transportation and Moving occupations in Buffalo Gap are Transportation (5 | 9.8%), Material Moving (4 | 7.8%), and Production (1 | 2.0%).
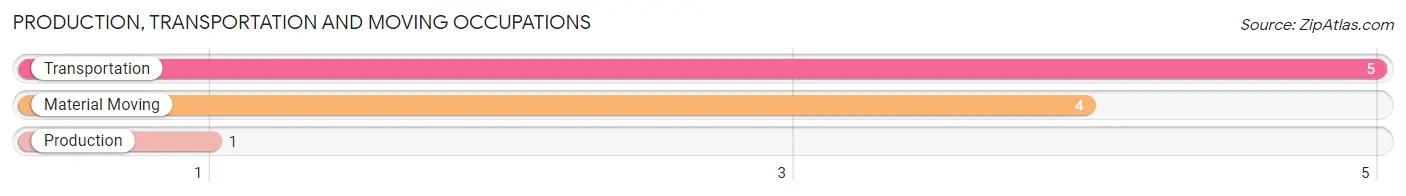
Production, Transportation and Moving Occupations by Sex
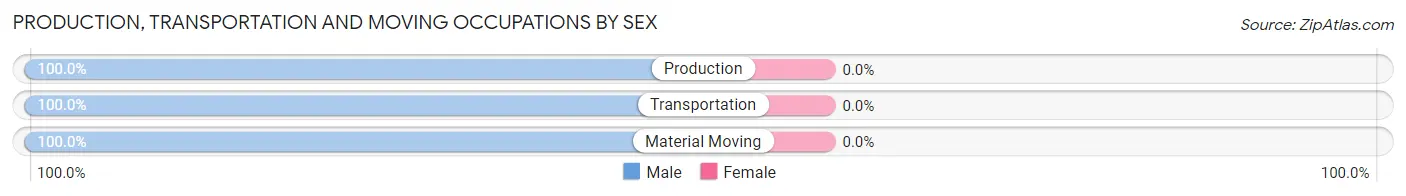
| Occupation | Male | Female |
| Production | 1 (100.0%) | 0 (0.0%) |
| Transportation | 5 (100.0%) | 0 (0.0%) |
| Material Moving | 4 (100.0%) | 0 (0.0%) |
| Total (Category) | 10 (100.0%) | 0 (0.0%) |
| Total (Overall) | 30 (58.8%) | 21 (41.2%) |
Employment Industries by Sex in Buffalo Gap
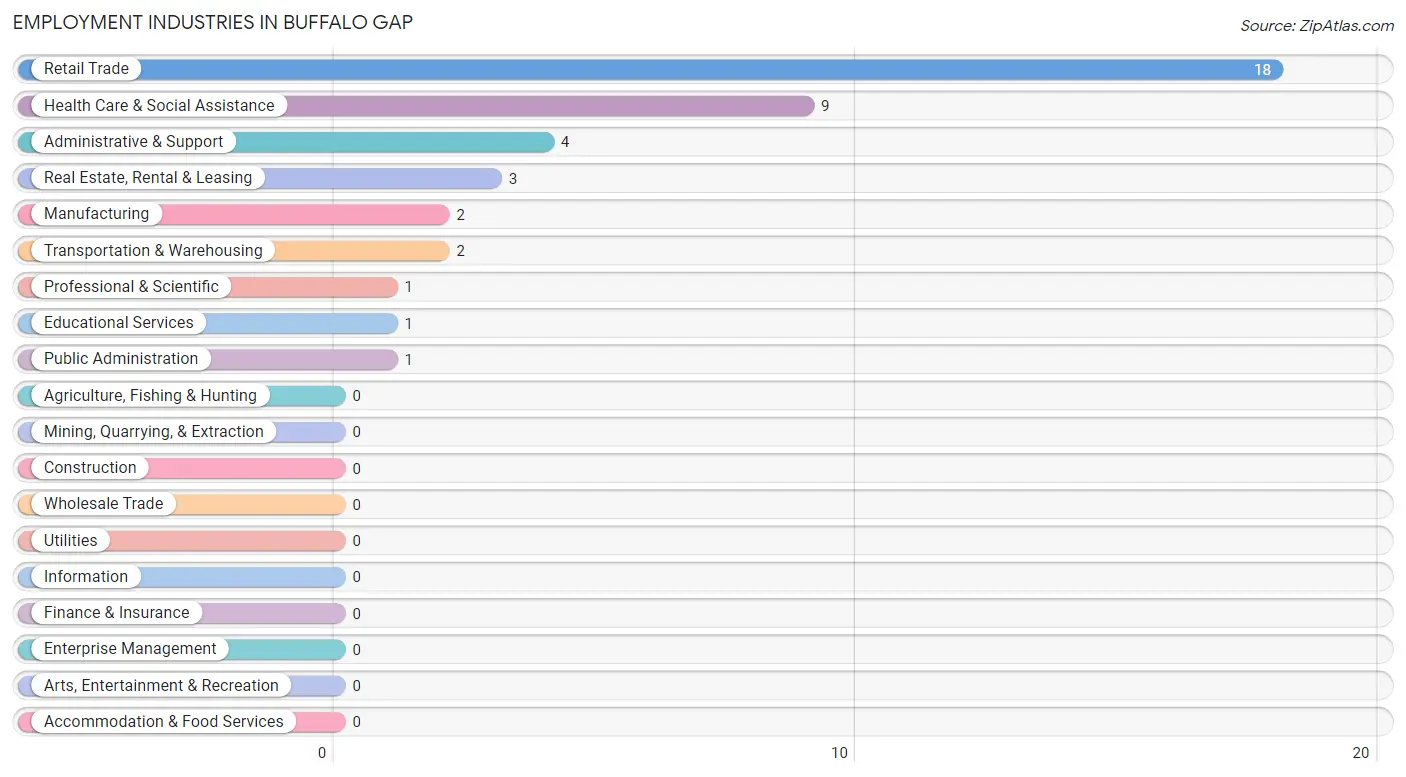
Employment Industries in Buffalo Gap
The major employment industries in Buffalo Gap include Retail Trade (18 | 35.3%), Health Care & Social Assistance (9 | 17.6%), Administrative & Support (4 | 7.8%), Real Estate, Rental & Leasing (3 | 5.9%), and Manufacturing (2 | 3.9%).
Employment Industries by Sex in Buffalo Gap
The Buffalo Gap industries that see more men than women are Manufacturing (100.0%), Transportation & Warehousing (100.0%), and Real Estate, Rental & Leasing (100.0%), whereas the industries that tend to have a higher number of women are Public Administration (100.0%), Retail Trade (77.8%), and Health Care & Social Assistance (66.7%).
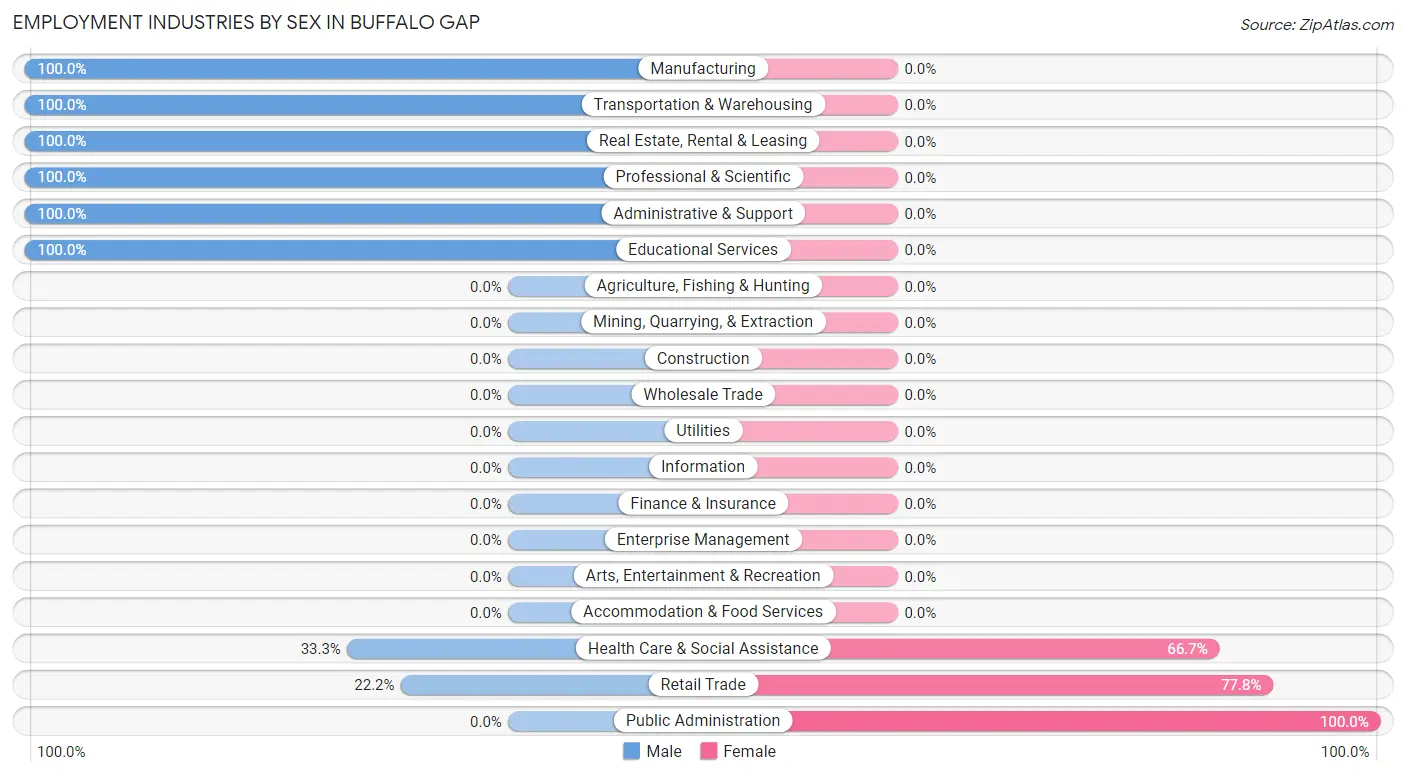
| Industry | Male | Female |
| Agriculture, Fishing & Hunting | 0 (0.0%) | 0 (0.0%) |
| Mining, Quarrying, & Extraction | 0 (0.0%) | 0 (0.0%) |
| Construction | 0 (0.0%) | 0 (0.0%) |
| Manufacturing | 2 (100.0%) | 0 (0.0%) |
| Wholesale Trade | 0 (0.0%) | 0 (0.0%) |
| Retail Trade | 4 (22.2%) | 14 (77.8%) |
| Transportation & Warehousing | 2 (100.0%) | 0 (0.0%) |
| Utilities | 0 (0.0%) | 0 (0.0%) |
| Information | 0 (0.0%) | 0 (0.0%) |
| Finance & Insurance | 0 (0.0%) | 0 (0.0%) |
| Real Estate, Rental & Leasing | 3 (100.0%) | 0 (0.0%) |
| Professional & Scientific | 1 (100.0%) | 0 (0.0%) |
| Enterprise Management | 0 (0.0%) | 0 (0.0%) |
| Administrative & Support | 4 (100.0%) | 0 (0.0%) |
| Educational Services | 1 (100.0%) | 0 (0.0%) |
| Health Care & Social Assistance | 3 (33.3%) | 6 (66.7%) |
| Arts, Entertainment & Recreation | 0 (0.0%) | 0 (0.0%) |
| Accommodation & Food Services | 0 (0.0%) | 0 (0.0%) |
| Public Administration | 0 (0.0%) | 1 (100.0%) |
| Total | 30 (58.8%) | 21 (41.2%) |
Education in Buffalo Gap
School Enrollment in Buffalo Gap
The most common levels of schooling among the 10 students in Buffalo Gap are college / undergraduate (4 | 40.0%), elementary school (3 | 30.0%), and middle school (3 | 30.0%).
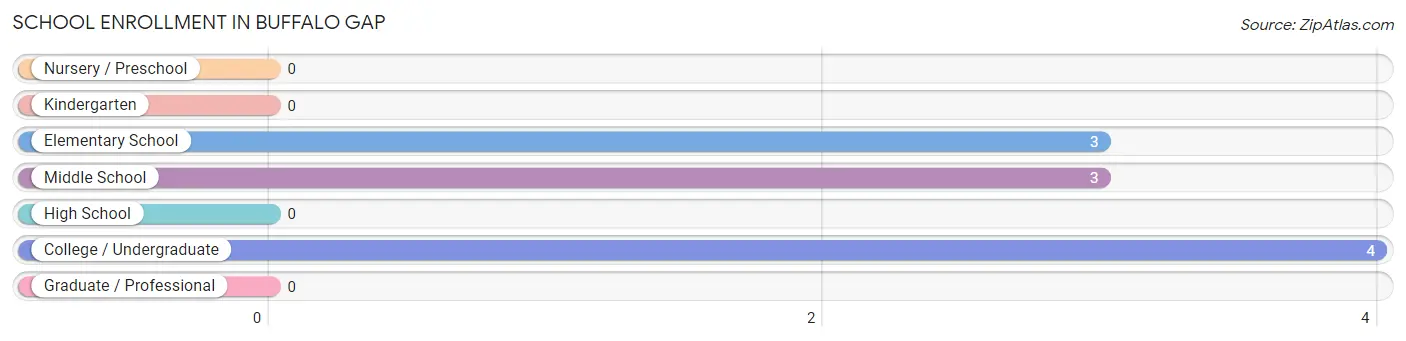
| School Level | # Students | % Students |
| Nursery / Preschool | 0 | 0.0% |
| Kindergarten | 0 | 0.0% |
| Elementary School | 3 | 30.0% |
| Middle School | 3 | 30.0% |
| High School | 0 | 0.0% |
| College / Undergraduate | 4 | 40.0% |
| Graduate / Professional | 0 | 0.0% |
| Total | 10 | 100.0% |
School Enrollment by Age by Funding Source in Buffalo Gap
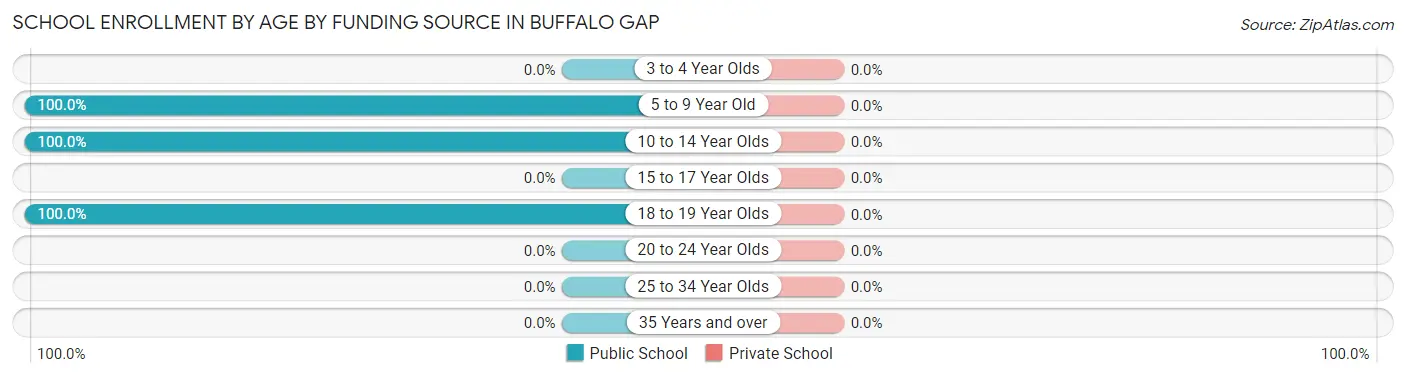
| Age Bracket | Public School | Private School |
| 3 to 4 Year Olds | 0 (0.0%) | 0 (0.0%) |
| 5 to 9 Year Old | 3 (100.0%) | 0 (0.0%) |
| 10 to 14 Year Olds | 3 (100.0%) | 0 (0.0%) |
| 15 to 17 Year Olds | 0 (0.0%) | 0 (0.0%) |
| 18 to 19 Year Olds | 4 (100.0%) | 0 (0.0%) |
| 20 to 24 Year Olds | 0 (0.0%) | 0 (0.0%) |
| 25 to 34 Year Olds | 0 (0.0%) | 0 (0.0%) |
| 35 Years and over | 0 (0.0%) | 0 (0.0%) |
| Total | 10 (100.0%) | 0 (0.0%) |
Educational Attainment by Field of Study in Buffalo Gap
Business (6 | 28.6%), science & technology (4 | 19.1%), social sciences (3 | 14.3%), visual & performing arts (3 | 14.3%), and arts & humanities (3 | 14.3%) are the most common fields of study among 21 individuals in Buffalo Gap who have obtained a bachelor's degree or higher.
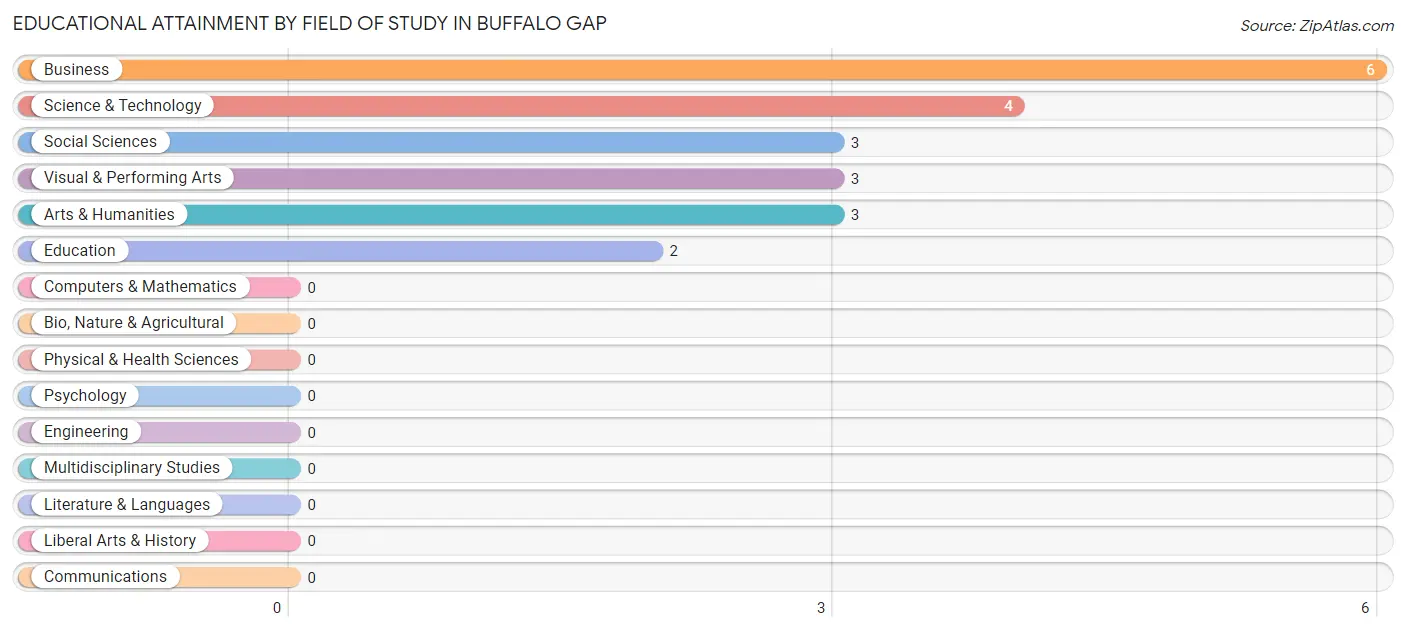
| Field of Study | # Graduates | % Graduates |
| Computers & Mathematics | 0 | 0.0% |
| Bio, Nature & Agricultural | 0 | 0.0% |
| Physical & Health Sciences | 0 | 0.0% |
| Psychology | 0 | 0.0% |
| Social Sciences | 3 | 14.3% |
| Engineering | 0 | 0.0% |
| Multidisciplinary Studies | 0 | 0.0% |
| Science & Technology | 4 | 19.1% |
| Business | 6 | 28.6% |
| Education | 2 | 9.5% |
| Literature & Languages | 0 | 0.0% |
| Liberal Arts & History | 0 | 0.0% |
| Visual & Performing Arts | 3 | 14.3% |
| Communications | 0 | 0.0% |
| Arts & Humanities | 3 | 14.3% |
| Total | 21 | 100.0% |
Transportation & Commute in Buffalo Gap
Vehicle Availability by Sex in Buffalo Gap
The most prevalent vehicle ownership categories in Buffalo Gap are males with 3 vehicles (15, accounting for 50.0%) and females with 3 vehicles (5, making up 75.0%).
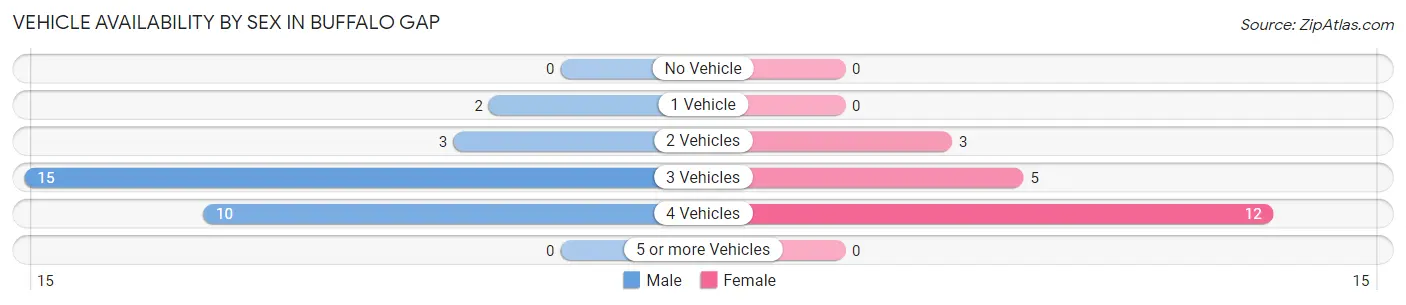
| Vehicles Available | Male | Female |
| No Vehicle | 0 (0.0%) | 0 (0.0%) |
| 1 Vehicle | 2 (6.7%) | 0 (0.0%) |
| 2 Vehicles | 3 (10.0%) | 3 (15.0%) |
| 3 Vehicles | 15 (50.0%) | 5 (25.0%) |
| 4 Vehicles | 10 (33.3%) | 12 (60.0%) |
| 5 or more Vehicles | 0 (0.0%) | 0 (0.0%) |
| Total | 30 (100.0%) | 20 (100.0%) |
Commute Time in Buffalo Gap
The most frequently occuring commute durations in Buffalo Gap are 20 to 24 minutes (20 commuters, 50.0%), 45 to 59 minutes (12 commuters, 30.0%), and 10 to 14 minutes (4 commuters, 10.0%).
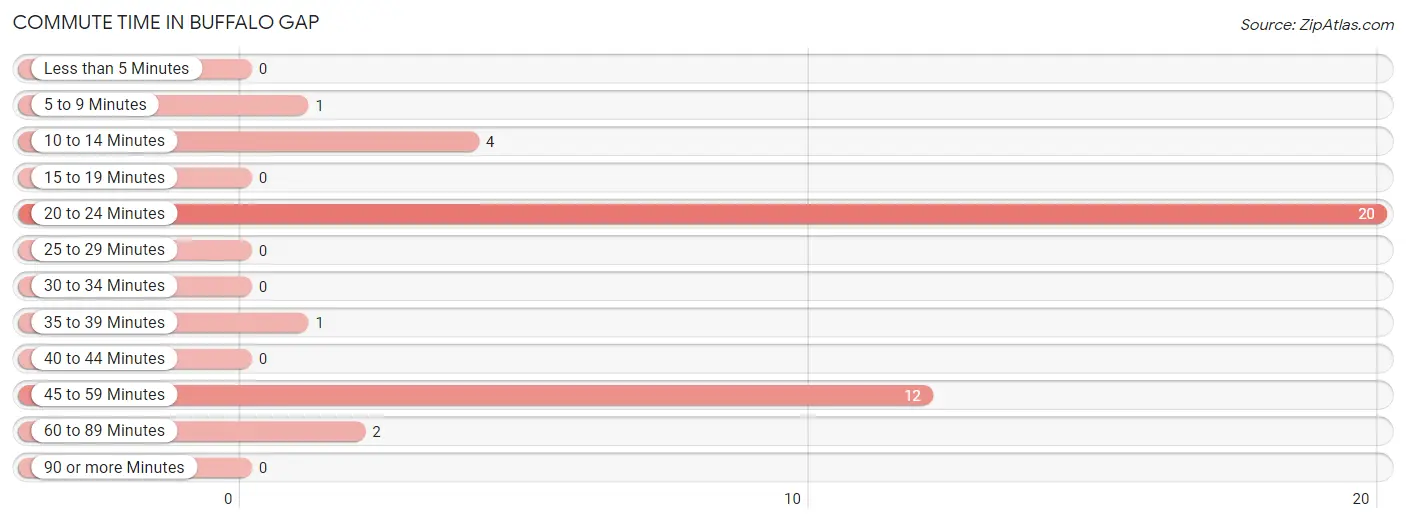
| Commute Time | # Commuters | % Commuters |
| Less than 5 Minutes | 0 | 0.0% |
| 5 to 9 Minutes | 1 | 2.5% |
| 10 to 14 Minutes | 4 | 10.0% |
| 15 to 19 Minutes | 0 | 0.0% |
| 20 to 24 Minutes | 20 | 50.0% |
| 25 to 29 Minutes | 0 | 0.0% |
| 30 to 34 Minutes | 0 | 0.0% |
| 35 to 39 Minutes | 1 | 2.5% |
| 40 to 44 Minutes | 0 | 0.0% |
| 45 to 59 Minutes | 12 | 30.0% |
| 60 to 89 Minutes | 2 | 5.0% |
| 90 or more Minutes | 0 | 0.0% |
Commute Time by Sex in Buffalo Gap
The most common commute times in Buffalo Gap are 45 to 59 minutes (10 commuters, 50.0%) for males and 20 to 24 minutes (17 commuters, 85.0%) for females.
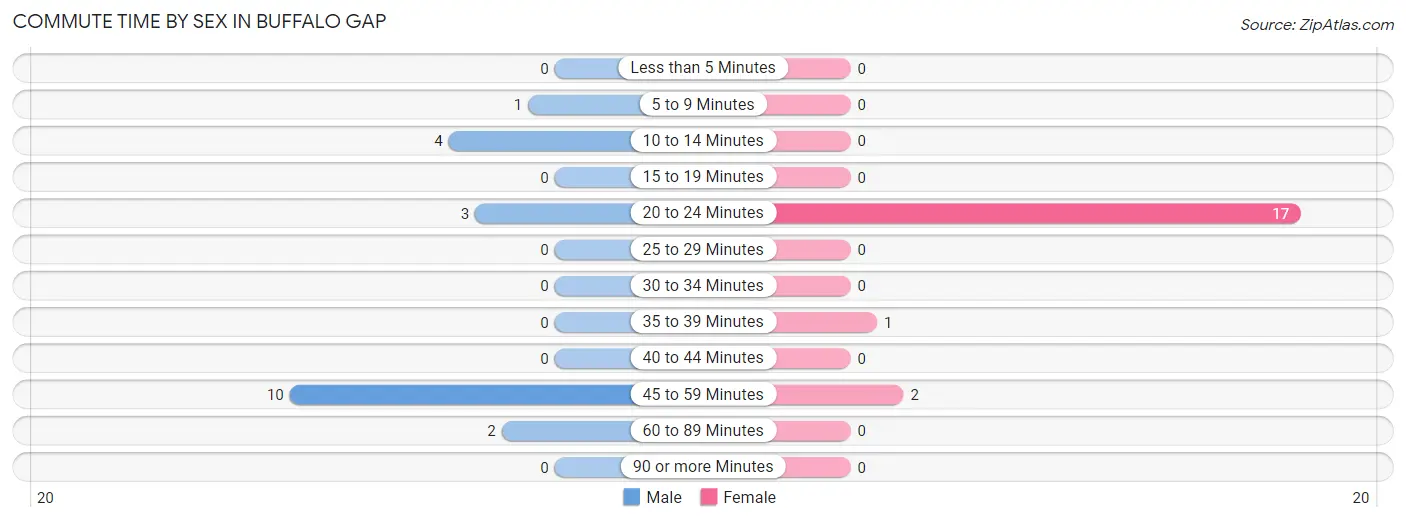
| Commute Time | Male | Female |
| Less than 5 Minutes | 0 (0.0%) | 0 (0.0%) |
| 5 to 9 Minutes | 1 (5.0%) | 0 (0.0%) |
| 10 to 14 Minutes | 4 (20.0%) | 0 (0.0%) |
| 15 to 19 Minutes | 0 (0.0%) | 0 (0.0%) |
| 20 to 24 Minutes | 3 (15.0%) | 17 (85.0%) |
| 25 to 29 Minutes | 0 (0.0%) | 0 (0.0%) |
| 30 to 34 Minutes | 0 (0.0%) | 0 (0.0%) |
| 35 to 39 Minutes | 0 (0.0%) | 1 (5.0%) |
| 40 to 44 Minutes | 0 (0.0%) | 0 (0.0%) |
| 45 to 59 Minutes | 10 (50.0%) | 2 (10.0%) |
| 60 to 89 Minutes | 2 (10.0%) | 0 (0.0%) |
| 90 or more Minutes | 0 (0.0%) | 0 (0.0%) |
Time of Departure to Work by Sex in Buffalo Gap
The most frequent times of departure to work in Buffalo Gap are 7:00 AM to 7:29 AM (11, 55.0%) for males and 10:00 AM to 10:59 AM (12, 60.0%) for females.
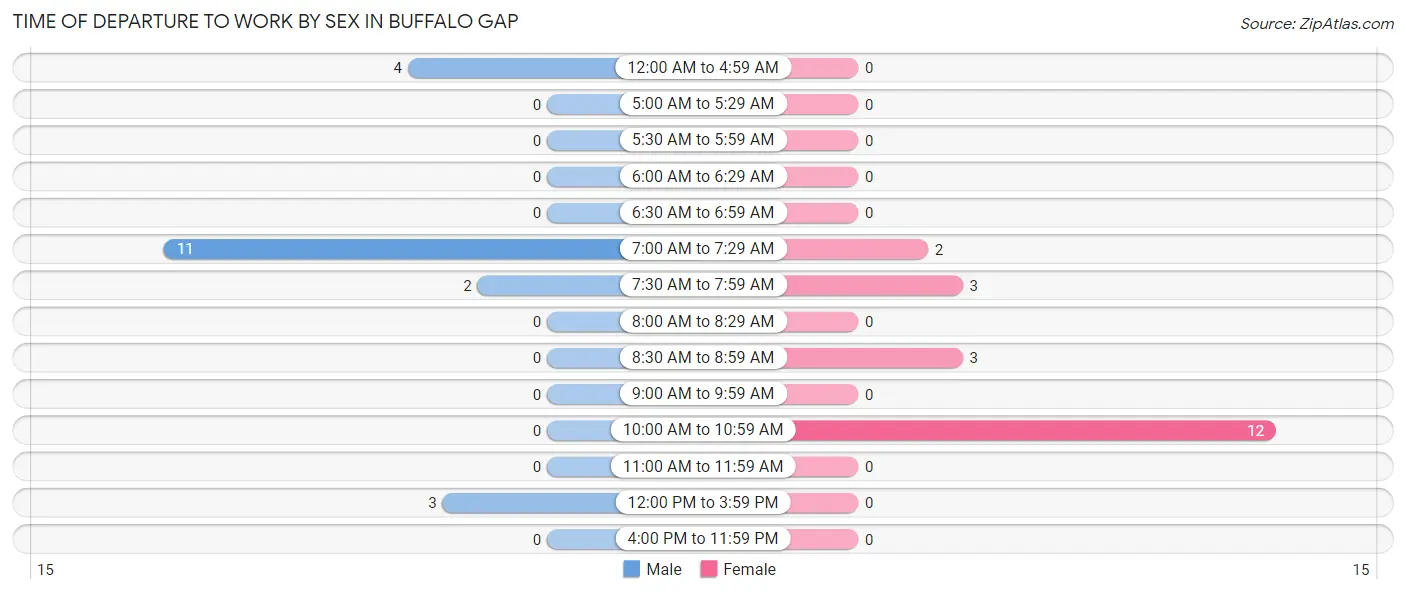
| Time of Departure | Male | Female |
| 12:00 AM to 4:59 AM | 4 (20.0%) | 0 (0.0%) |
| 5:00 AM to 5:29 AM | 0 (0.0%) | 0 (0.0%) |
| 5:30 AM to 5:59 AM | 0 (0.0%) | 0 (0.0%) |
| 6:00 AM to 6:29 AM | 0 (0.0%) | 0 (0.0%) |
| 6:30 AM to 6:59 AM | 0 (0.0%) | 0 (0.0%) |
| 7:00 AM to 7:29 AM | 11 (55.0%) | 2 (10.0%) |
| 7:30 AM to 7:59 AM | 2 (10.0%) | 3 (15.0%) |
| 8:00 AM to 8:29 AM | 0 (0.0%) | 0 (0.0%) |
| 8:30 AM to 8:59 AM | 0 (0.0%) | 3 (15.0%) |
| 9:00 AM to 9:59 AM | 0 (0.0%) | 0 (0.0%) |
| 10:00 AM to 10:59 AM | 0 (0.0%) | 12 (60.0%) |
| 11:00 AM to 11:59 AM | 0 (0.0%) | 0 (0.0%) |
| 12:00 PM to 3:59 PM | 3 (15.0%) | 0 (0.0%) |
| 4:00 PM to 11:59 PM | 0 (0.0%) | 0 (0.0%) |
| Total | 20 (100.0%) | 20 (100.0%) |
Housing Occupancy in Buffalo Gap
Occupancy by Ownership in Buffalo Gap
Of the total 71 dwellings in Buffalo Gap, owner-occupied units account for 69 (97.2%), while renter-occupied units make up 2 (2.8%).
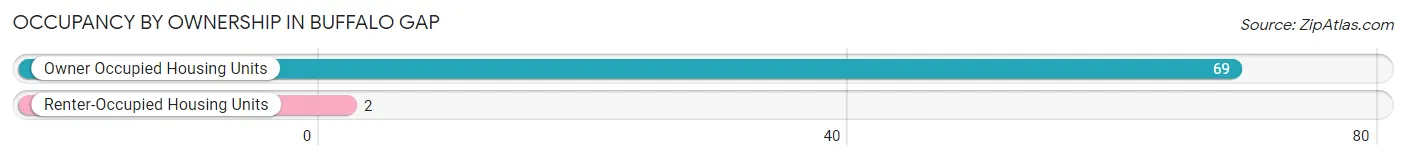
| Occupancy | # Housing Units | % Housing Units |
| Owner Occupied Housing Units | 69 | 97.2% |
| Renter-Occupied Housing Units | 2 | 2.8% |
| Total Occupied Housing Units | 71 | 100.0% |
Occupancy by Household Size in Buffalo Gap
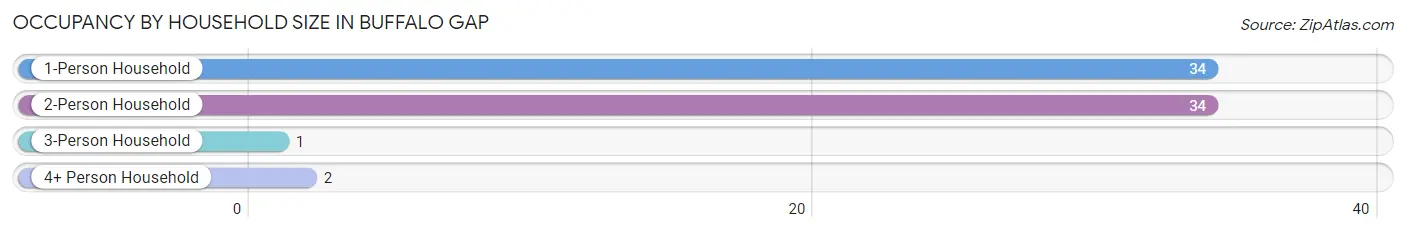
| Household Size | # Housing Units | % Housing Units |
| 1-Person Household | 34 | 47.9% |
| 2-Person Household | 34 | 47.9% |
| 3-Person Household | 1 | 1.4% |
| 4+ Person Household | 2 | 2.8% |
| Total Housing Units | 71 | 100.0% |
Occupancy by Ownership by Household Size in Buffalo Gap
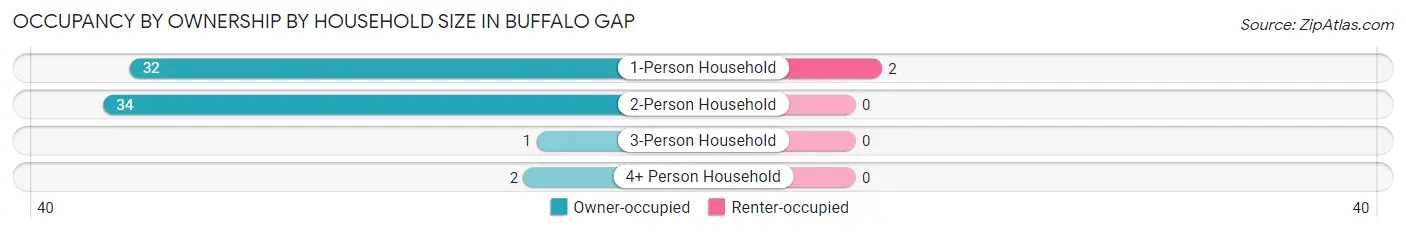
| Household Size | Owner-occupied | Renter-occupied |
| 1-Person Household | 32 (94.1%) | 2 (5.9%) |
| 2-Person Household | 34 (100.0%) | 0 (0.0%) |
| 3-Person Household | 1 (100.0%) | 0 (0.0%) |
| 4+ Person Household | 2 (100.0%) | 0 (0.0%) |
| Total Housing Units | 69 (97.2%) | 2 (2.8%) |
Occupancy by Educational Attainment in Buffalo Gap
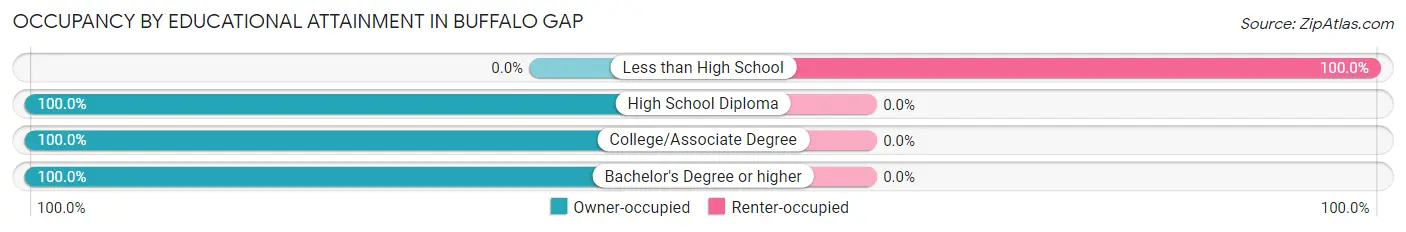
| Household Size | Owner-occupied | Renter-occupied |
| Less than High School | 0 (0.0%) | 2 (100.0%) |
| High School Diploma | 15 (100.0%) | 0 (0.0%) |
| College/Associate Degree | 38 (100.0%) | 0 (0.0%) |
| Bachelor's Degree or higher | 16 (100.0%) | 0 (0.0%) |
Occupancy by Age of Householder in Buffalo Gap
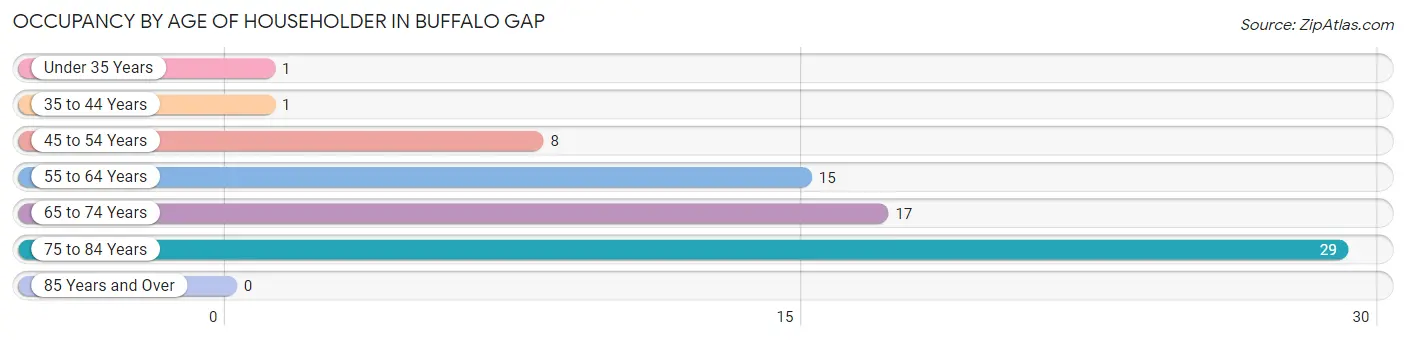
| Age Bracket | # Households | % Households |
| Under 35 Years | 1 | 1.4% |
| 35 to 44 Years | 1 | 1.4% |
| 45 to 54 Years | 8 | 11.3% |
| 55 to 64 Years | 15 | 21.1% |
| 65 to 74 Years | 17 | 23.9% |
| 75 to 84 Years | 29 | 40.8% |
| 85 Years and Over | 0 | 0.0% |
| Total | 71 | 100.0% |
Housing Finances in Buffalo Gap
Median Income by Occupancy in Buffalo Gap
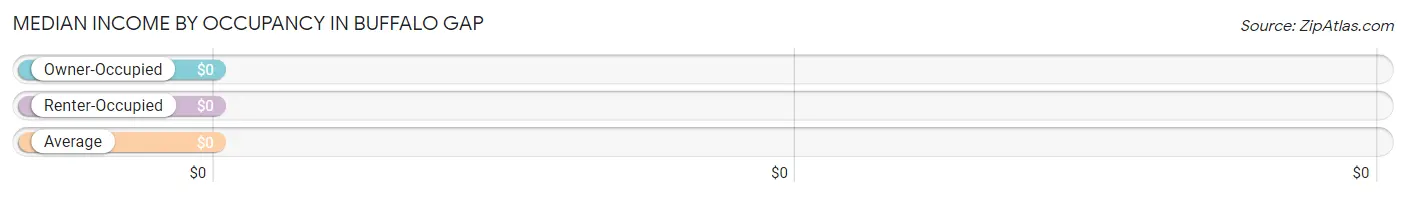
| Occupancy Type | # Households | Median Income |
| Owner-Occupied | 69 (97.2%) | $0 |
| Renter-Occupied | 2 (2.8%) | $0 |
| Average | 71 (100.0%) | $0 |
Occupancy by Householder Income Bracket in Buffalo Gap
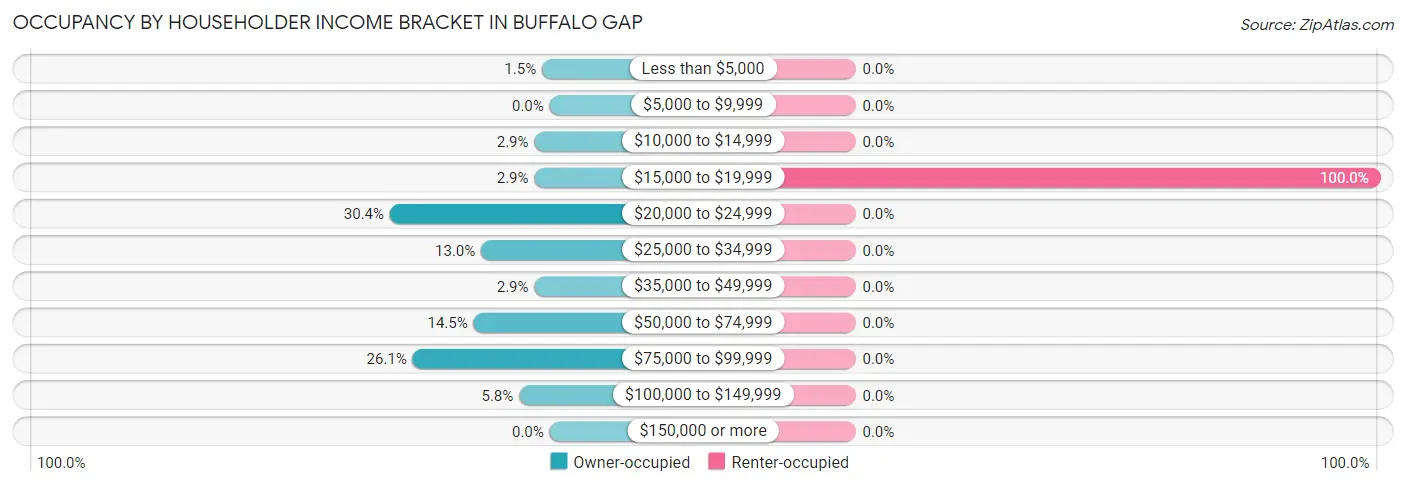
| Income Bracket | Owner-occupied | Renter-occupied |
| Less than $5,000 | 1 (1.5%) | 0 (0.0%) |
| $5,000 to $9,999 | 0 (0.0%) | 0 (0.0%) |
| $10,000 to $14,999 | 2 (2.9%) | 0 (0.0%) |
| $15,000 to $19,999 | 2 (2.9%) | 2 (100.0%) |
| $20,000 to $24,999 | 21 (30.4%) | 0 (0.0%) |
| $25,000 to $34,999 | 9 (13.0%) | 0 (0.0%) |
| $35,000 to $49,999 | 2 (2.9%) | 0 (0.0%) |
| $50,000 to $74,999 | 10 (14.5%) | 0 (0.0%) |
| $75,000 to $99,999 | 18 (26.1%) | 0 (0.0%) |
| $100,000 to $149,999 | 4 (5.8%) | 0 (0.0%) |
| $150,000 or more | 0 (0.0%) | 0 (0.0%) |
| Total | 69 (100.0%) | 2 (100.0%) |
Monthly Housing Cost Tiers in Buffalo Gap
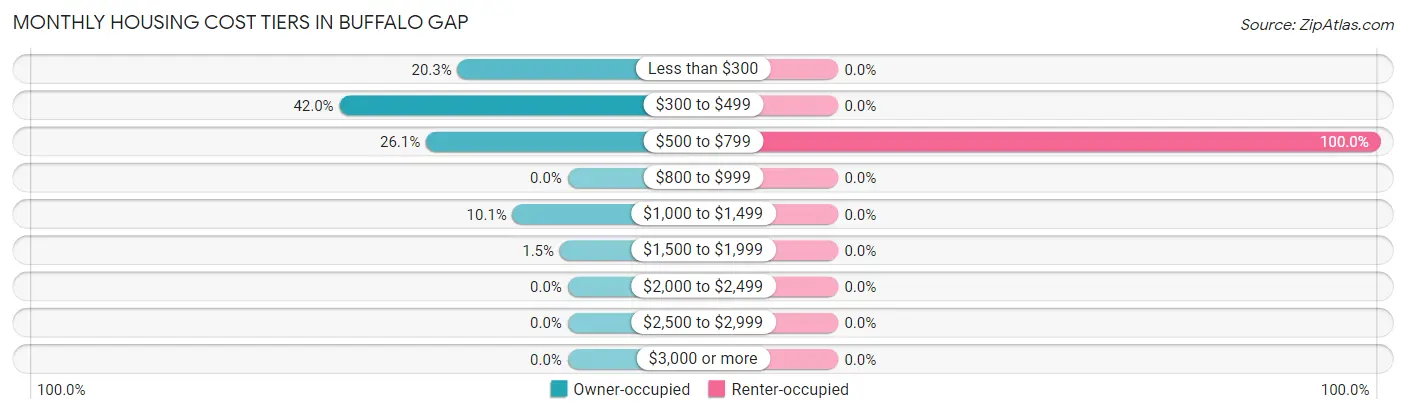
| Monthly Cost | Owner-occupied | Renter-occupied |
| Less than $300 | 14 (20.3%) | 0 (0.0%) |
| $300 to $499 | 29 (42.0%) | 0 (0.0%) |
| $500 to $799 | 18 (26.1%) | 2 (100.0%) |
| $800 to $999 | 0 (0.0%) | 0 (0.0%) |
| $1,000 to $1,499 | 7 (10.1%) | 0 (0.0%) |
| $1,500 to $1,999 | 1 (1.5%) | 0 (0.0%) |
| $2,000 to $2,499 | 0 (0.0%) | 0 (0.0%) |
| $2,500 to $2,999 | 0 (0.0%) | 0 (0.0%) |
| $3,000 or more | 0 (0.0%) | 0 (0.0%) |
| Total | 69 (100.0%) | 2 (100.0%) |
Physical Housing Characteristics in Buffalo Gap
Housing Structures in Buffalo Gap
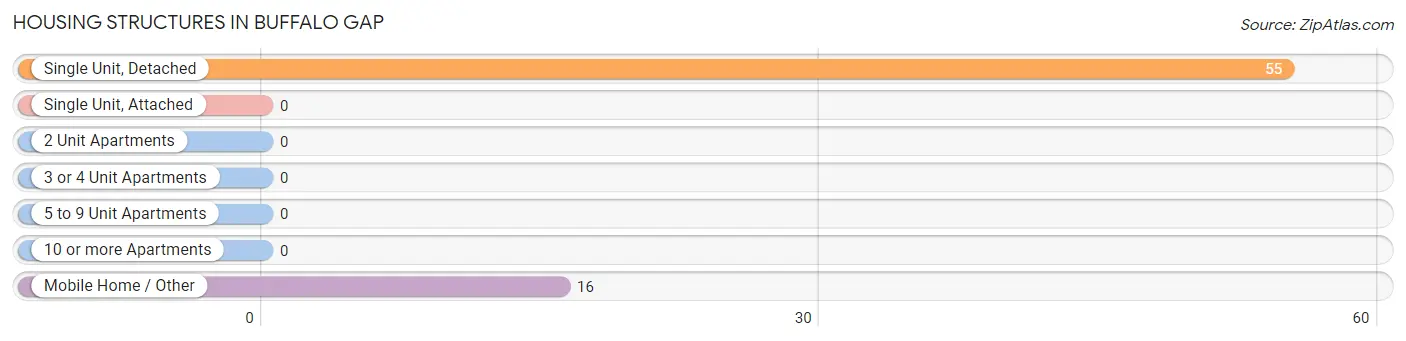
| Structure Type | # Housing Units | % Housing Units |
| Single Unit, Detached | 55 | 77.5% |
| Single Unit, Attached | 0 | 0.0% |
| 2 Unit Apartments | 0 | 0.0% |
| 3 or 4 Unit Apartments | 0 | 0.0% |
| 5 to 9 Unit Apartments | 0 | 0.0% |
| 10 or more Apartments | 0 | 0.0% |
| Mobile Home / Other | 16 | 22.5% |
| Total | 71 | 100.0% |
Housing Structures by Occupancy in Buffalo Gap
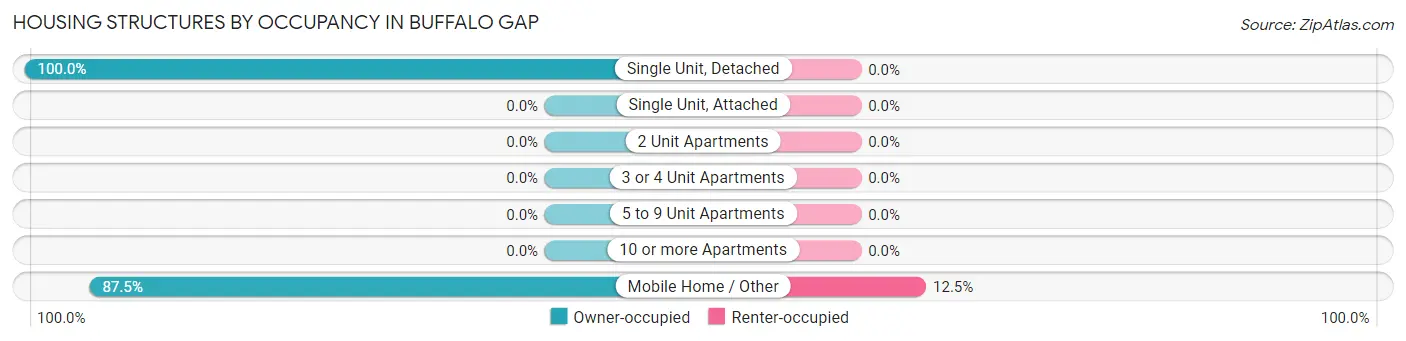
| Structure Type | Owner-occupied | Renter-occupied |
| Single Unit, Detached | 55 (100.0%) | 0 (0.0%) |
| Single Unit, Attached | 0 (0.0%) | 0 (0.0%) |
| 2 Unit Apartments | 0 (0.0%) | 0 (0.0%) |
| 3 or 4 Unit Apartments | 0 (0.0%) | 0 (0.0%) |
| 5 to 9 Unit Apartments | 0 (0.0%) | 0 (0.0%) |
| 10 or more Apartments | 0 (0.0%) | 0 (0.0%) |
| Mobile Home / Other | 14 (87.5%) | 2 (12.5%) |
| Total | 69 (97.2%) | 2 (2.8%) |
Housing Structures by Number of Rooms in Buffalo Gap
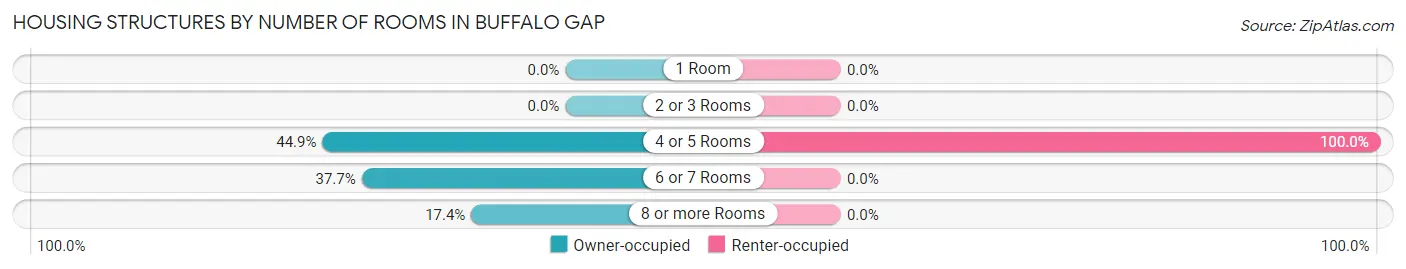
| Number of Rooms | Owner-occupied | Renter-occupied |
| 1 Room | 0 (0.0%) | 0 (0.0%) |
| 2 or 3 Rooms | 0 (0.0%) | 0 (0.0%) |
| 4 or 5 Rooms | 31 (44.9%) | 2 (100.0%) |
| 6 or 7 Rooms | 26 (37.7%) | 0 (0.0%) |
| 8 or more Rooms | 12 (17.4%) | 0 (0.0%) |
| Total | 69 (100.0%) | 2 (100.0%) |
Housing Structure by Heating Type in Buffalo Gap
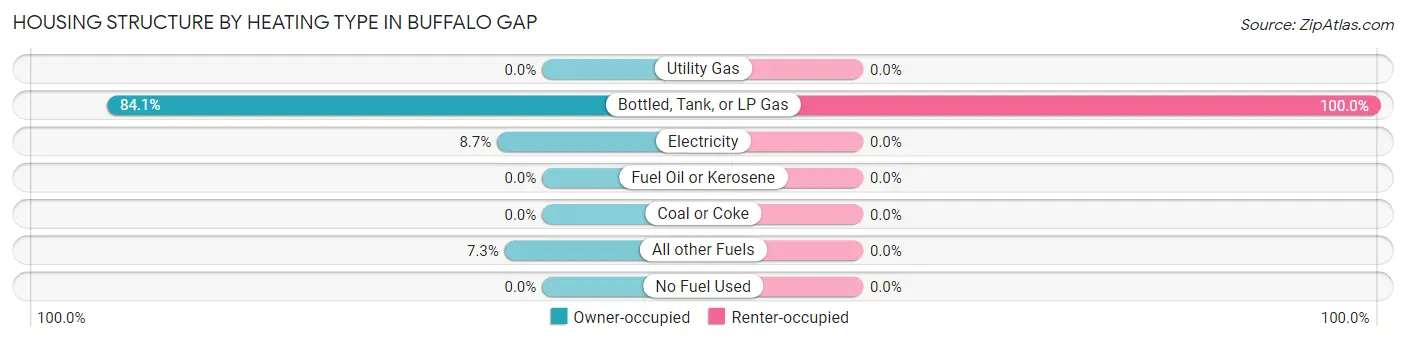
| Heating Type | Owner-occupied | Renter-occupied |
| Utility Gas | 0 (0.0%) | 0 (0.0%) |
| Bottled, Tank, or LP Gas | 58 (84.1%) | 2 (100.0%) |
| Electricity | 6 (8.7%) | 0 (0.0%) |
| Fuel Oil or Kerosene | 0 (0.0%) | 0 (0.0%) |
| Coal or Coke | 0 (0.0%) | 0 (0.0%) |
| All other Fuels | 5 (7.2%) | 0 (0.0%) |
| No Fuel Used | 0 (0.0%) | 0 (0.0%) |
| Total | 69 (100.0%) | 2 (100.0%) |
Household Vehicle Usage in Buffalo Gap
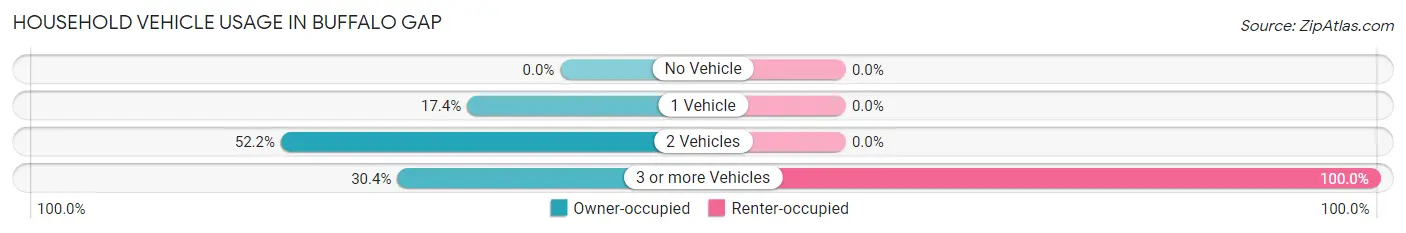
| Vehicles per Household | Owner-occupied | Renter-occupied |
| No Vehicle | 0 (0.0%) | 0 (0.0%) |
| 1 Vehicle | 12 (17.4%) | 0 (0.0%) |
| 2 Vehicles | 36 (52.2%) | 0 (0.0%) |
| 3 or more Vehicles | 21 (30.4%) | 2 (100.0%) |
| Total | 69 (100.0%) | 2 (100.0%) |
Real Estate & Mortgages in Buffalo Gap
Real Estate and Mortgage Overview in Buffalo Gap
| Characteristic | Without Mortgage | With Mortgage |
| Housing Units | 61 | 8 |
| Median Property Value | $64,200 | $0 |
| Median Household Income | - | - |
| Monthly Housing Costs | $338 | $0 |
| Real Estate Taxes | $667 | $0 |
Property Value by Mortgage Status in Buffalo Gap
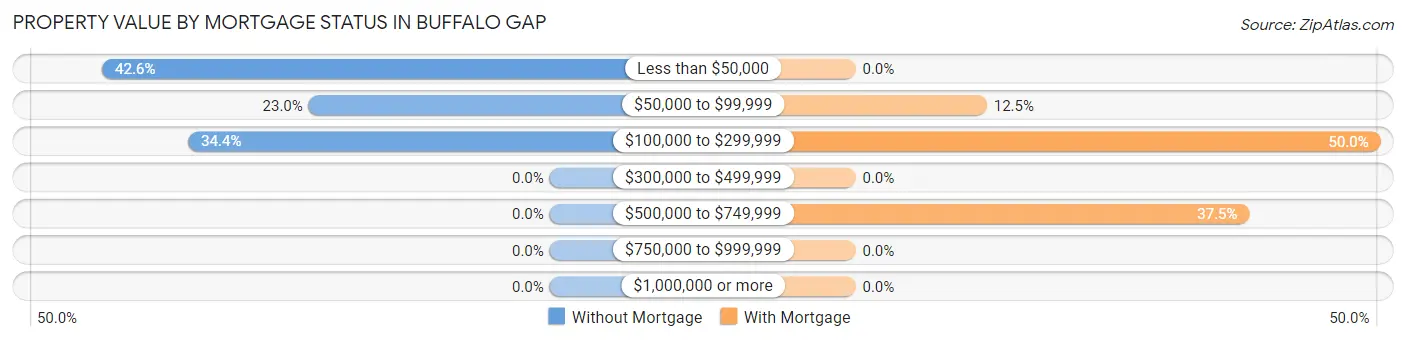
| Property Value | Without Mortgage | With Mortgage |
| Less than $50,000 | 26 (42.6%) | 0 (0.0%) |
| $50,000 to $99,999 | 14 (23.0%) | 1 (12.5%) |
| $100,000 to $299,999 | 21 (34.4%) | 4 (50.0%) |
| $300,000 to $499,999 | 0 (0.0%) | 0 (0.0%) |
| $500,000 to $749,999 | 0 (0.0%) | 3 (37.5%) |
| $750,000 to $999,999 | 0 (0.0%) | 0 (0.0%) |
| $1,000,000 or more | 0 (0.0%) | 0 (0.0%) |
| Total | 61 (100.0%) | 8 (100.0%) |
Household Income by Mortgage Status in Buffalo Gap
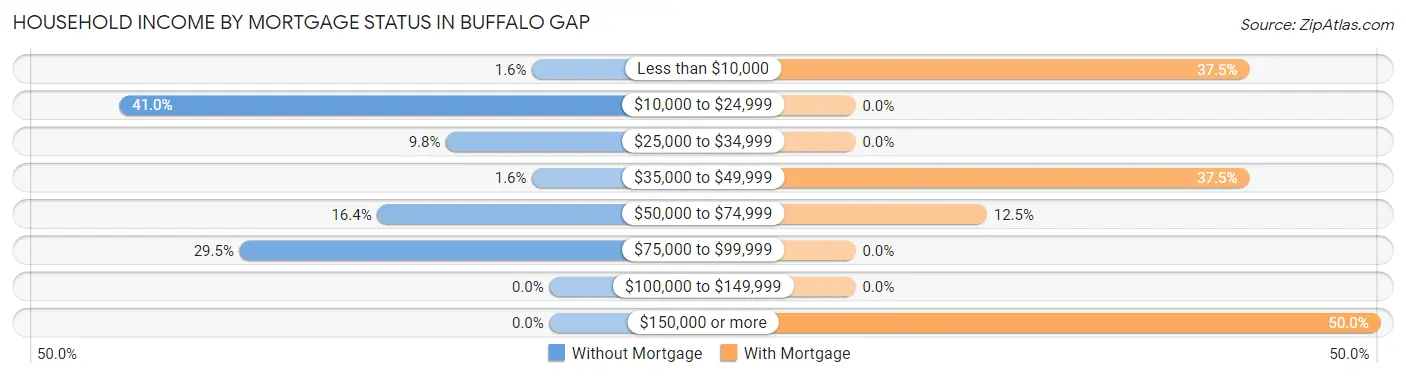
| Household Income | Without Mortgage | With Mortgage |
| Less than $10,000 | 1 (1.6%) | 3 (37.5%) |
| $10,000 to $24,999 | 25 (41.0%) | 0 (0.0%) |
| $25,000 to $34,999 | 6 (9.8%) | 0 (0.0%) |
| $35,000 to $49,999 | 1 (1.6%) | 3 (37.5%) |
| $50,000 to $74,999 | 10 (16.4%) | 1 (12.5%) |
| $75,000 to $99,999 | 18 (29.5%) | 0 (0.0%) |
| $100,000 to $149,999 | 0 (0.0%) | 0 (0.0%) |
| $150,000 or more | 0 (0.0%) | 4 (50.0%) |
| Total | 61 (100.0%) | 8 (100.0%) |
Property Value to Household Income Ratio in Buffalo Gap
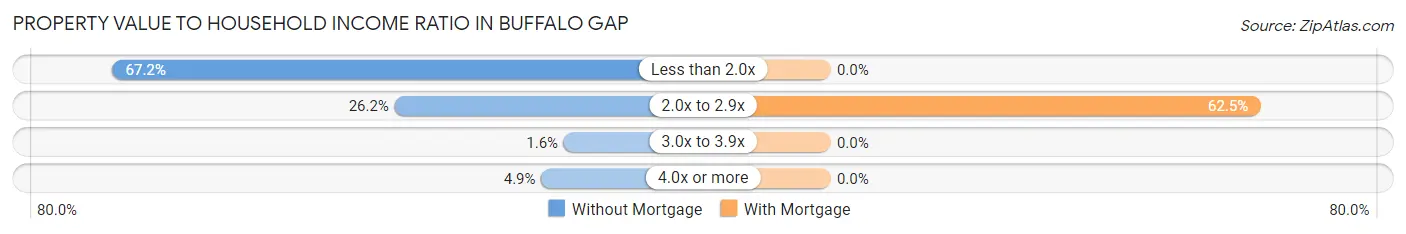
| Value-to-Income Ratio | Without Mortgage | With Mortgage |
| Less than 2.0x | 41 (67.2%) | 0 (0.0%) |
| 2.0x to 2.9x | 16 (26.2%) | 5 (62.5%) |
| 3.0x to 3.9x | 1 (1.6%) | 0 (0.0%) |
| 4.0x or more | 3 (4.9%) | 0 (0.0%) |
| Total | 61 (100.0%) | 8 (100.0%) |
Real Estate Taxes by Mortgage Status in Buffalo Gap
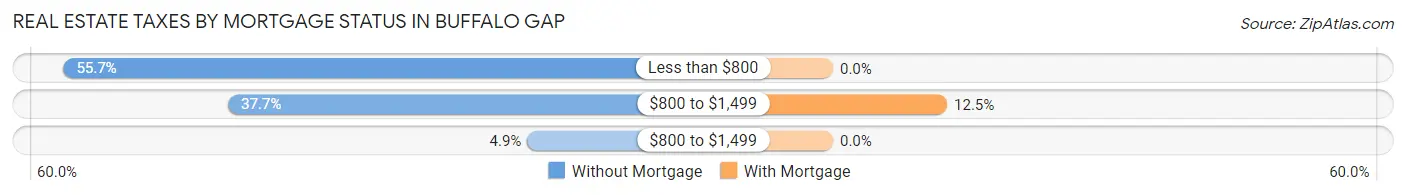
| Property Taxes | Without Mortgage | With Mortgage |
| Less than $800 | 34 (55.7%) | 0 (0.0%) |
| $800 to $1,499 | 23 (37.7%) | 1 (12.5%) |
| $800 to $1,499 | 3 (4.9%) | 0 (0.0%) |
| Total | 61 (100.0%) | 8 (100.0%) |
Health & Disability in Buffalo Gap
Health Insurance Coverage by Age in Buffalo Gap
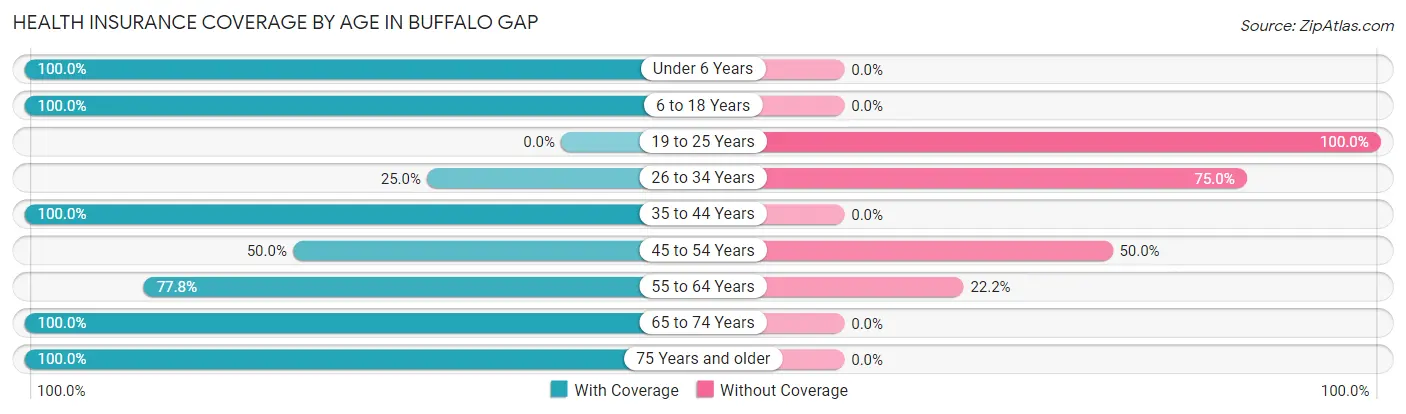
| Age Bracket | With Coverage | Without Coverage |
| Under 6 Years | 9 (100.0%) | 0 (0.0%) |
| 6 to 18 Years | 4 (100.0%) | 0 (0.0%) |
| 19 to 25 Years | 0 (0.0%) | 4 (100.0%) |
| 26 to 34 Years | 1 (25.0%) | 3 (75.0%) |
| 35 to 44 Years | 3 (100.0%) | 0 (0.0%) |
| 45 to 54 Years | 5 (50.0%) | 5 (50.0%) |
| 55 to 64 Years | 21 (77.8%) | 6 (22.2%) |
| 65 to 74 Years | 33 (100.0%) | 0 (0.0%) |
| 75 Years and older | 29 (100.0%) | 0 (0.0%) |
| Total | 105 (85.4%) | 18 (14.6%) |
Health Insurance Coverage by Citizenship Status in Buffalo Gap
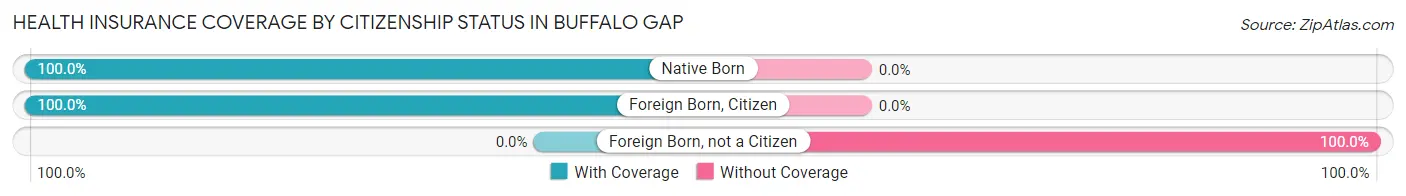
| Citizenship Status | With Coverage | Without Coverage |
| Native Born | 9 (100.0%) | 0 (0.0%) |
| Foreign Born, Citizen | 4 (100.0%) | 0 (0.0%) |
| Foreign Born, not a Citizen | 0 (0.0%) | 4 (100.0%) |
Health Insurance Coverage by Household Income in Buffalo Gap
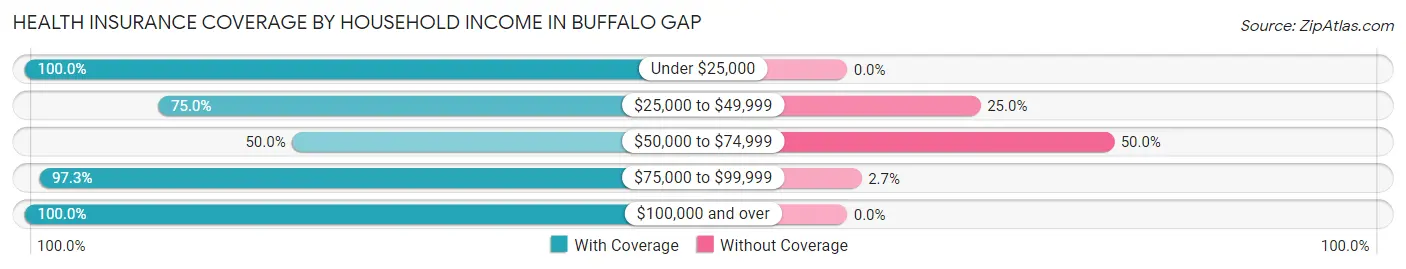
| Household Income | With Coverage | Without Coverage |
| Under $25,000 | 30 (100.0%) | 0 (0.0%) |
| $25,000 to $49,999 | 24 (75.0%) | 8 (25.0%) |
| $50,000 to $74,999 | 9 (50.0%) | 9 (50.0%) |
| $75,000 to $99,999 | 36 (97.3%) | 1 (2.7%) |
| $100,000 and over | 6 (100.0%) | 0 (0.0%) |
Public vs Private Health Insurance Coverage by Age in Buffalo Gap
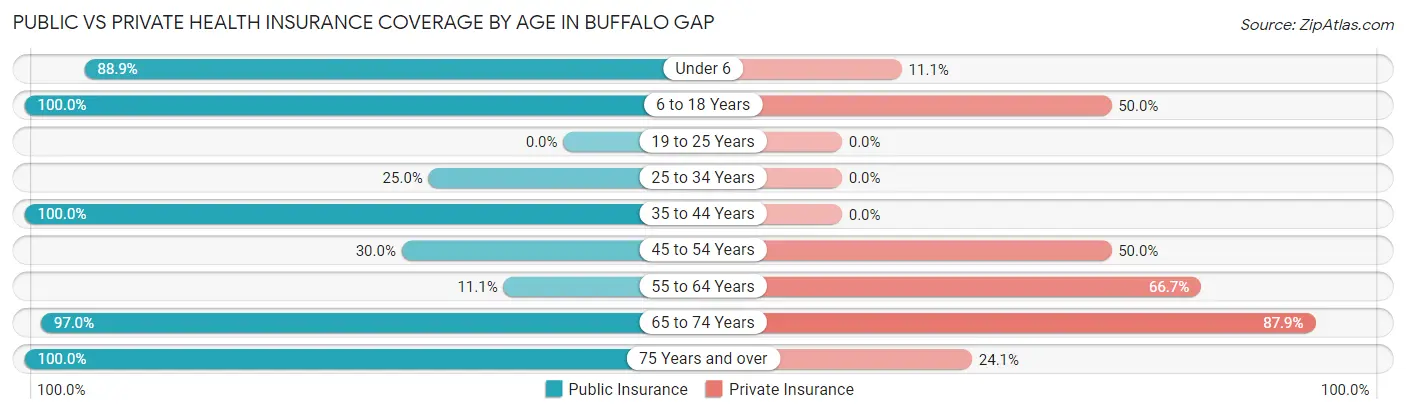
| Age Bracket | Public Insurance | Private Insurance |
| Under 6 | 8 (88.9%) | 1 (11.1%) |
| 6 to 18 Years | 4 (100.0%) | 2 (50.0%) |
| 19 to 25 Years | 0 (0.0%) | 0 (0.0%) |
| 25 to 34 Years | 1 (25.0%) | 0 (0.0%) |
| 35 to 44 Years | 3 (100.0%) | 0 (0.0%) |
| 45 to 54 Years | 3 (30.0%) | 5 (50.0%) |
| 55 to 64 Years | 3 (11.1%) | 18 (66.7%) |
| 65 to 74 Years | 32 (97.0%) | 29 (87.9%) |
| 75 Years and over | 29 (100.0%) | 7 (24.1%) |
| Total | 83 (67.5%) | 62 (50.4%) |
Disability Status by Sex by Age in Buffalo Gap
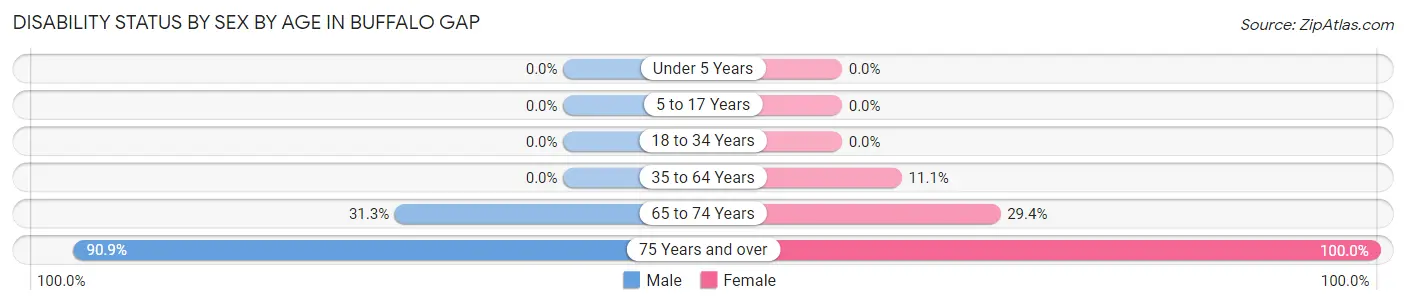
| Age Bracket | Male | Female |
| Under 5 Years | 0 (0.0%) | 0 (0.0%) |
| 5 to 17 Years | 0 (0.0%) | 0 (0.0%) |
| 18 to 34 Years | 0 (0.0%) | 0 (0.0%) |
| 35 to 64 Years | 0 (0.0%) | 2 (11.1%) |
| 65 to 74 Years | 5 (31.2%) | 5 (29.4%) |
| 75 Years and over | 20 (90.9%) | 7 (100.0%) |
Disability Class by Sex by Age in Buffalo Gap
Disability Class: Hearing Difficulty
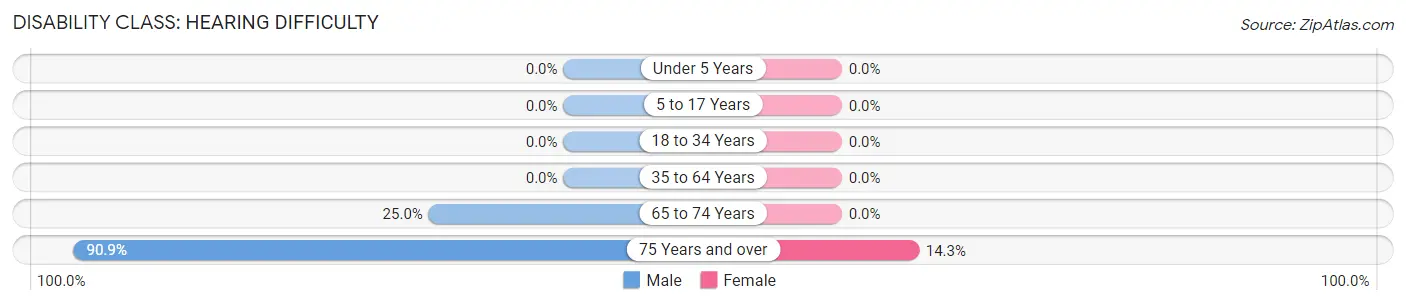
| Age Bracket | Male | Female |
| Under 5 Years | 0 (0.0%) | 0 (0.0%) |
| 5 to 17 Years | 0 (0.0%) | 0 (0.0%) |
| 18 to 34 Years | 0 (0.0%) | 0 (0.0%) |
| 35 to 64 Years | 0 (0.0%) | 0 (0.0%) |
| 65 to 74 Years | 4 (25.0%) | 0 (0.0%) |
| 75 Years and over | 20 (90.9%) | 1 (14.3%) |
Disability Class: Vision Difficulty
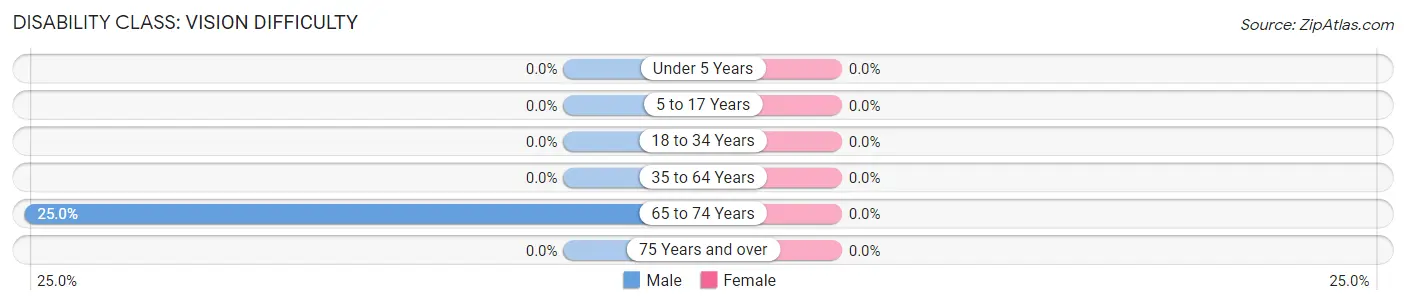
| Age Bracket | Male | Female |
| Under 5 Years | 0 (0.0%) | 0 (0.0%) |
| 5 to 17 Years | 0 (0.0%) | 0 (0.0%) |
| 18 to 34 Years | 0 (0.0%) | 0 (0.0%) |
| 35 to 64 Years | 0 (0.0%) | 0 (0.0%) |
| 65 to 74 Years | 4 (25.0%) | 0 (0.0%) |
| 75 Years and over | 0 (0.0%) | 0 (0.0%) |
Disability Class: Cognitive Difficulty
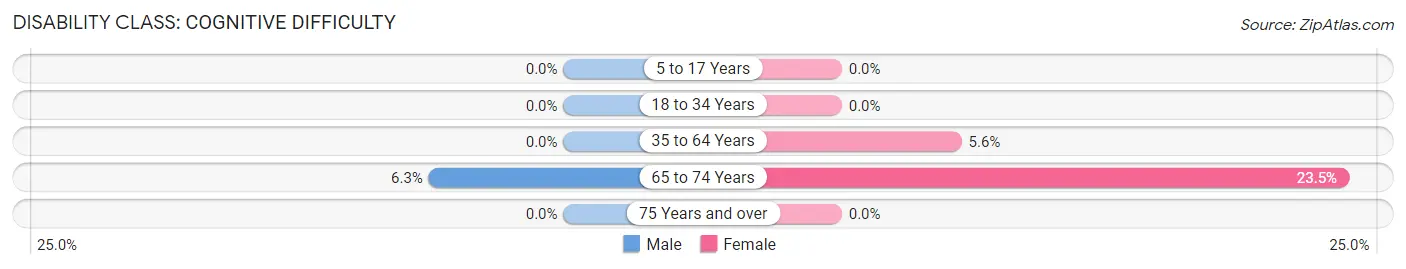
| Age Bracket | Male | Female |
| 5 to 17 Years | 0 (0.0%) | 0 (0.0%) |
| 18 to 34 Years | 0 (0.0%) | 0 (0.0%) |
| 35 to 64 Years | 0 (0.0%) | 1 (5.6%) |
| 65 to 74 Years | 1 (6.2%) | 4 (23.5%) |
| 75 Years and over | 0 (0.0%) | 0 (0.0%) |
Disability Class: Ambulatory Difficulty
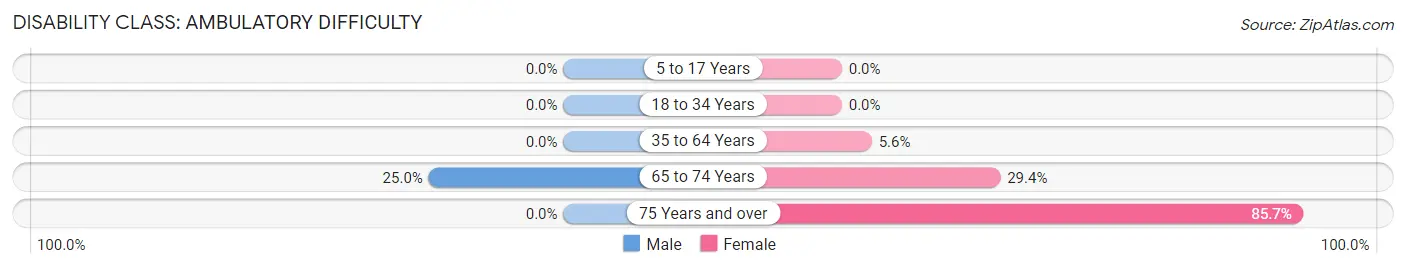
| Age Bracket | Male | Female |
| 5 to 17 Years | 0 (0.0%) | 0 (0.0%) |
| 18 to 34 Years | 0 (0.0%) | 0 (0.0%) |
| 35 to 64 Years | 0 (0.0%) | 1 (5.6%) |
| 65 to 74 Years | 4 (25.0%) | 5 (29.4%) |
| 75 Years and over | 0 (0.0%) | 6 (85.7%) |
Disability Class: Self-Care Difficulty
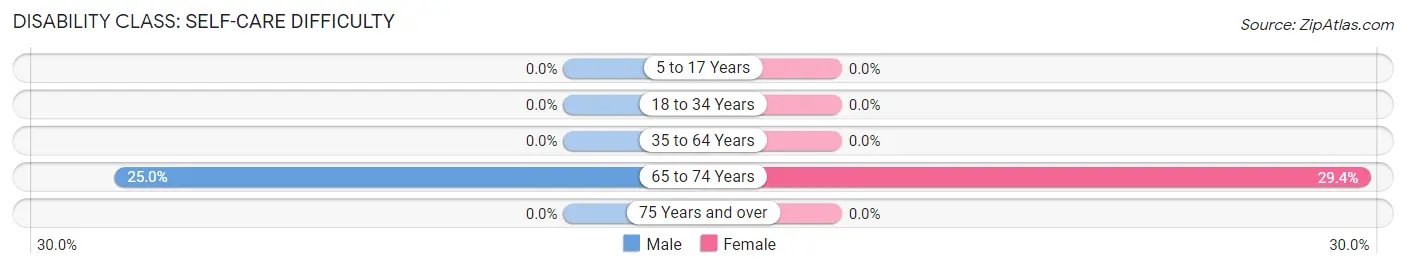
| Age Bracket | Male | Female |
| 5 to 17 Years | 0 (0.0%) | 0 (0.0%) |
| 18 to 34 Years | 0 (0.0%) | 0 (0.0%) |
| 35 to 64 Years | 0 (0.0%) | 0 (0.0%) |
| 65 to 74 Years | 4 (25.0%) | 5 (29.4%) |
| 75 Years and over | 0 (0.0%) | 0 (0.0%) |
Technology Access in Buffalo Gap
Computing Device Access in Buffalo Gap
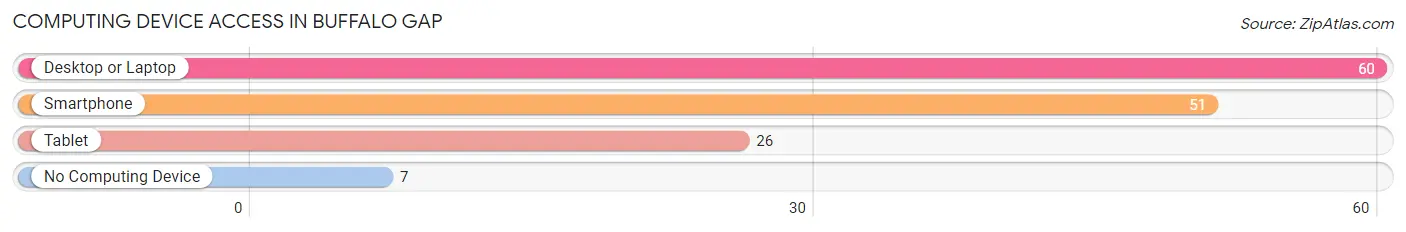
| Device Type | # Households | % Households |
| Desktop or Laptop | 60 | 84.5% |
| Smartphone | 51 | 71.8% |
| Tablet | 26 | 36.6% |
| No Computing Device | 7 | 9.9% |
| Total | 71 | 100.0% |
Internet Access in Buffalo Gap
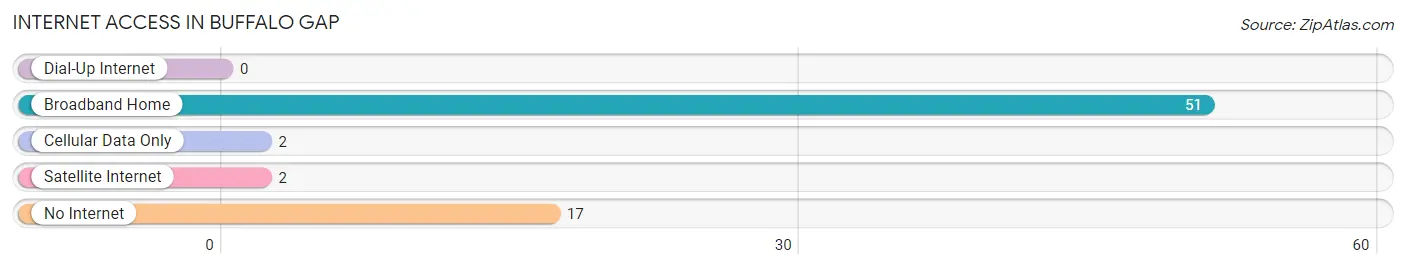
| Internet Type | # Households | % Households |
| Dial-Up Internet | 0 | 0.0% |
| Broadband Home | 51 | 71.8% |
| Cellular Data Only | 2 | 2.8% |
| Satellite Internet | 2 | 2.8% |
| No Internet | 17 | 23.9% |
| Total | 71 | 100.0% |
Buffalo Gap Summary
Buffalo Gap is a small unincorporated community located in the southwestern corner of South Dakota, in Fall River County. It is situated on the edge of the Black Hills, and is surrounded by rolling hills and prairies. The town is home to a population of approximately 200 people, and is a popular tourist destination due to its proximity to the Black Hills National Forest and Mount Rushmore National Memorial.
History
Buffalo Gap was first settled in the late 1800s by homesteaders who were drawn to the area by the abundance of buffalo. The town was officially established in 1883, and was named after a nearby gap in the hills. The town quickly grew, and by the early 1900s it had become a popular stop for travelers and tourists.
In the early 1900s, Buffalo Gap was a bustling town with a variety of businesses, including a hotel, saloon, general store, and post office. The town was also home to a number of churches, including the First Congregational Church, which was established in 1885.
In the 1920s, the town began to decline as the buffalo population dwindled and the railroad bypassed the town. By the 1940s, the town had become a virtual ghost town, with only a few residents remaining.
In the 1950s, the town began to experience a resurgence as tourists began to visit the area to explore the Black Hills. The town was incorporated in 1959, and in the 1960s, the town began to experience a period of growth and development.
Geography
Buffalo Gap is located in the southwestern corner of South Dakota, in Fall River County. It is situated on the edge of the Black Hills, and is surrounded by rolling hills and prairies. The town is located at an elevation of 4,000 feet, and has a total area of 0.6 square miles.
The town is located near the intersection of US Highway 385 and South Dakota Highway 79. It is approximately 25 miles south of Rapid City, and is within a short drive of Mount Rushmore National Memorial, Crazy Horse Memorial, and Custer State Park.
Economy
The economy of Buffalo Gap is largely based on tourism. The town is a popular destination for visitors to the Black Hills, and is home to a variety of tourist attractions, including the Buffalo Gap National Grassland, the Buffalo Gap Historic Village, and the Buffalo Gap Saloon.
The town is also home to a number of small businesses, including restaurants, gift shops, and art galleries. The town is also home to a number of bed and breakfasts, and is a popular destination for outdoor enthusiasts, as it is located near a number of hiking trails and other outdoor activities.
Demographics
As of the 2010 census, the population of Buffalo Gap was 200. The racial makeup of the town was 97.5% White, 0.5% Native American, 0.5% Asian, and 1.5% from two or more races. The median household income was $37,500, and the median age was 44.
Conclusion
Buffalo Gap is a small unincorporated community located in the southwestern corner of South Dakota, in Fall River County. It is situated on the edge of the Black Hills, and is surrounded by rolling hills and prairies. The town is home to a population of approximately 200 people, and is a popular tourist destination due to its proximity to the Black Hills National Forest and Mount Rushmore National Memorial. The economy of Buffalo Gap is largely based on tourism, and the town is home to a variety of small businesses and tourist attractions. The racial makeup of the town is predominantly White, with a small percentage of Native American and Asian residents.
Common Questions
What is Per Capita Income in Buffalo Gap?
Per Capita income in Buffalo Gap is $30,024.
What is the Median Family Income in Buffalo Gap?
Median Family Income in Buffalo Gap is $69,792.
What is Inequality or Gini Index in Buffalo Gap?
Inequality or Gini Index in Buffalo Gap is 0.36.
What is the Total Population of Buffalo Gap?
Total Population of Buffalo Gap is 123.
What is the Total Male Population of Buffalo Gap?
Total Male Population of Buffalo Gap is 72.
What is the Total Female Population of Buffalo Gap?
Total Female Population of Buffalo Gap is 51.
What is the Ratio of Males per 100 Females in Buffalo Gap?
There are 141.18 Males per 100 Females in Buffalo Gap.
What is the Ratio of Females per 100 Males in Buffalo Gap?
There are 70.83 Females per 100 Males in Buffalo Gap.
What is the Median Population Age in Buffalo Gap?
Median Population Age in Buffalo Gap is 66.5 Years.
What is the Average Family Size in Buffalo Gap
Average Family Size in Buffalo Gap is 2.5 People.
What is the Average Household Size in Buffalo Gap
Average Household Size in Buffalo Gap is 1.7 People.
How Large is the Labor Force in Buffalo Gap?
There are 54 People in the Labor Forcein in Buffalo Gap.
What is the Percentage of People in the Labor Force in Buffalo Gap?
49.1% of People are in the Labor Force in Buffalo Gap.
What is the Unemployment Rate in Buffalo Gap?
Unemployment Rate in Buffalo Gap is 5.6%.