Bryant, SD Map & Demographics
Bryant Map
Bryant Overview
$23,544
PER CAPITA INCOME
$65,417
AVG FAMILY INCOME
$58,558
AVG HOUSEHOLD INCOME
38.4%
WAGE / INCOME GAP [ % ]
61.6¢/ $1
WAGE / INCOME GAP [ $ ]
0.40
INEQUALITY / GINI INDEX
749
TOTAL POPULATION
395
MALE POPULATION
354
FEMALE POPULATION
111.58
MALES / 100 FEMALES
89.62
FEMALES / 100 MALES
22.8
MEDIAN AGE
3.8
AVG FAMILY SIZE
3.0
AVG HOUSEHOLD SIZE
263
LABOR FORCE [ PEOPLE ]
53.2%
PERCENT IN LABOR FORCE
1.9%
UNEMPLOYMENT RATE
Bryant Zip Codes
Bryant Area Codes
Income in Bryant
Income Overview in Bryant
Per Capita Income in Bryant is $23,544, while median incomes of families and households are $65,417 and $58,558 respectively.
| Characteristic | Number | Measure |
| Per Capita Income | 749 | $23,544 |
| Median Family Income | 147 | $65,417 |
| Mean Family Income | 147 | $83,406 |
| Median Household Income | 219 | $58,558 |
| Mean Household Income | 219 | $75,886 |
| Income Deficit | 147 | $0 |
| Wage / Income Gap (%) | 749 | 38.35% |
| Wage / Income Gap ($) | 749 | 61.65¢ per $1 |
| Gini / Inequality Index | 749 | 0.40 |
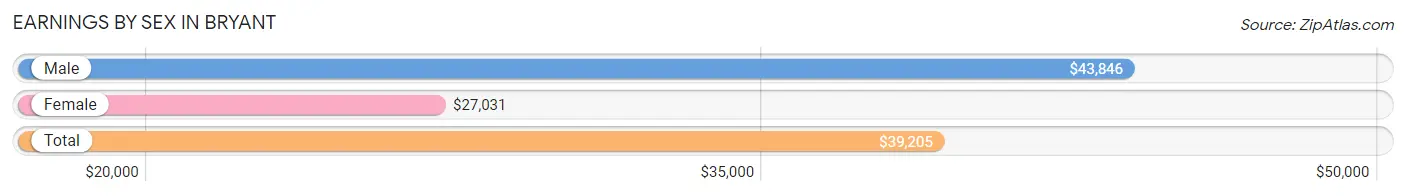
Earnings by Sex in Bryant
Average Earnings in Bryant are $39,205, $43,846 for men and $27,031 for women, a difference of 38.4%.
| Sex | Number | Average Earnings |
| Male | 196 (70.3%) | $43,846 |
| Female | 83 (29.7%) | $27,031 |
| Total | 279 (100.0%) | $39,205 |
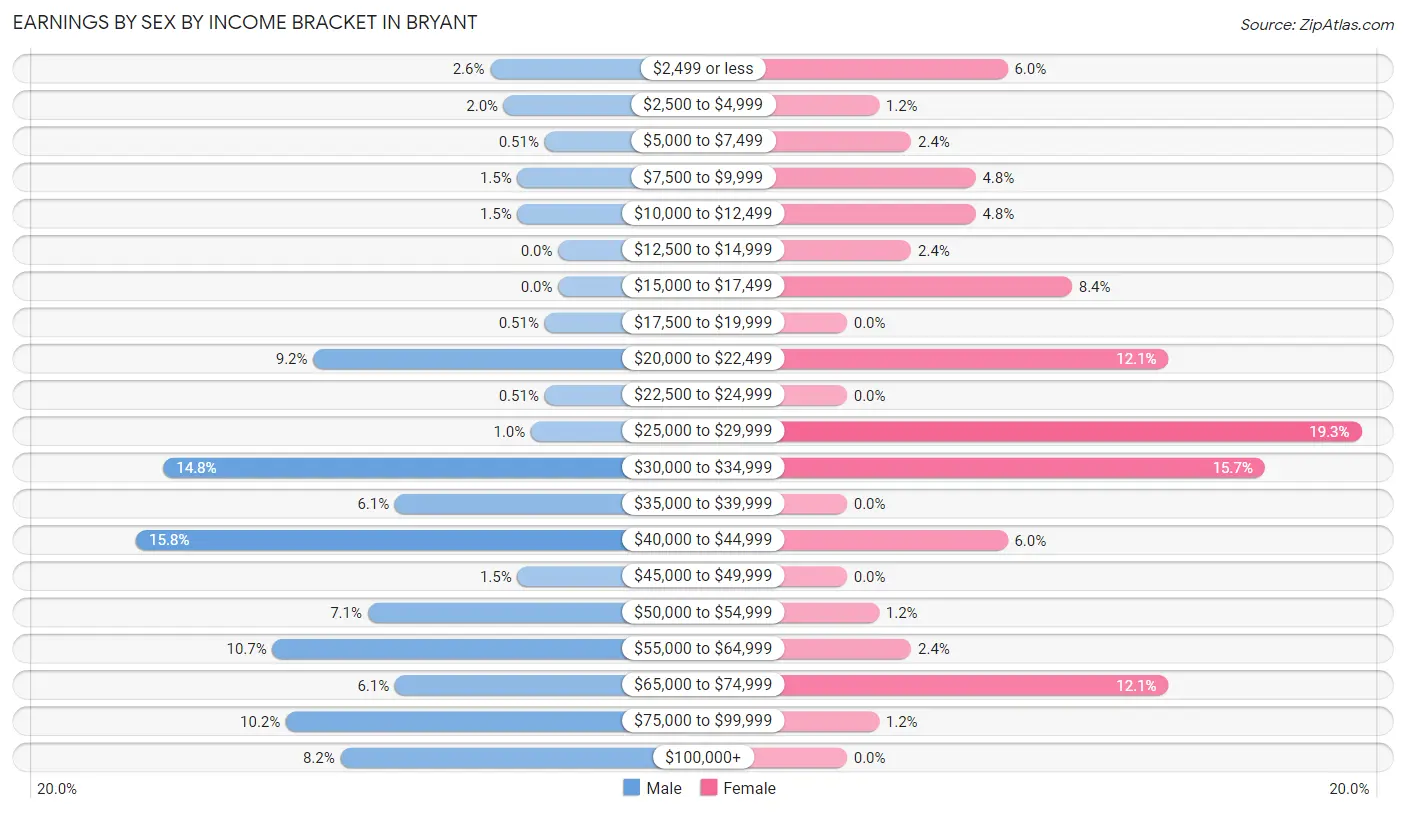
Earnings by Sex by Income Bracket in Bryant
The most common earnings brackets in Bryant are $40,000 to $44,999 for men (31 | 15.8%) and $25,000 to $29,999 for women (16 | 19.3%).
| Income | Male | Female |
| $2,499 or less | 5 (2.5%) | 5 (6.0%) |
| $2,500 to $4,999 | 4 (2.0%) | 1 (1.2%) |
| $5,000 to $7,499 | 1 (0.5%) | 2 (2.4%) |
| $7,500 to $9,999 | 3 (1.5%) | 4 (4.8%) |
| $10,000 to $12,499 | 3 (1.5%) | 4 (4.8%) |
| $12,500 to $14,999 | 0 (0.0%) | 2 (2.4%) |
| $15,000 to $17,499 | 0 (0.0%) | 7 (8.4%) |
| $17,500 to $19,999 | 1 (0.5%) | 0 (0.0%) |
| $20,000 to $22,499 | 18 (9.2%) | 10 (12.0%) |
| $22,500 to $24,999 | 1 (0.5%) | 0 (0.0%) |
| $25,000 to $29,999 | 2 (1.0%) | 16 (19.3%) |
| $30,000 to $34,999 | 29 (14.8%) | 13 (15.7%) |
| $35,000 to $39,999 | 12 (6.1%) | 0 (0.0%) |
| $40,000 to $44,999 | 31 (15.8%) | 5 (6.0%) |
| $45,000 to $49,999 | 3 (1.5%) | 0 (0.0%) |
| $50,000 to $54,999 | 14 (7.1%) | 1 (1.2%) |
| $55,000 to $64,999 | 21 (10.7%) | 2 (2.4%) |
| $65,000 to $74,999 | 12 (6.1%) | 10 (12.0%) |
| $75,000 to $99,999 | 20 (10.2%) | 1 (1.2%) |
| $100,000+ | 16 (8.2%) | 0 (0.0%) |
| Total | 196 (100.0%) | 83 (100.0%) |
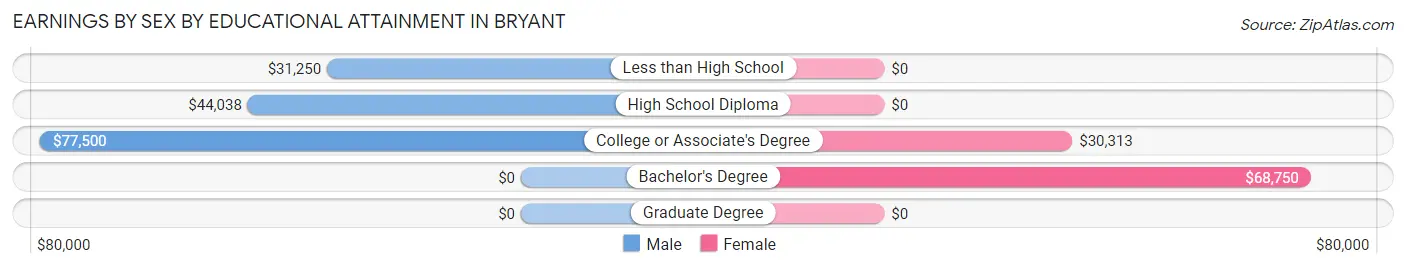
Earnings by Sex by Educational Attainment in Bryant
Average earnings in Bryant are $43,990 for men and $27,083 for women, a difference of 38.4%. Men with an educational attainment of college or associate's degree enjoy the highest average annual earnings of $77,500, while those with less than high school education earn the least with $31,250. Women with an educational attainment of bachelor's degree earn the most with the average annual earnings of $68,750, while those with college or associate's degree education have the smallest earnings of $30,313.
| Educational Attainment | Male Income | Female Income |
| Less than High School | $31,250 | $0 |
| High School Diploma | $44,038 | $0 |
| College or Associate's Degree | $77,500 | $30,313 |
| Bachelor's Degree | - | - |
| Graduate Degree | - | - |
| Total | $43,990 | $27,083 |
Family Income in Bryant
Family Income Brackets in Bryant
According to the Bryant family income data, there are 40 families falling into the $50,000 to $74,999 income range, which is the most common income bracket and makes up 27.2% of all families.
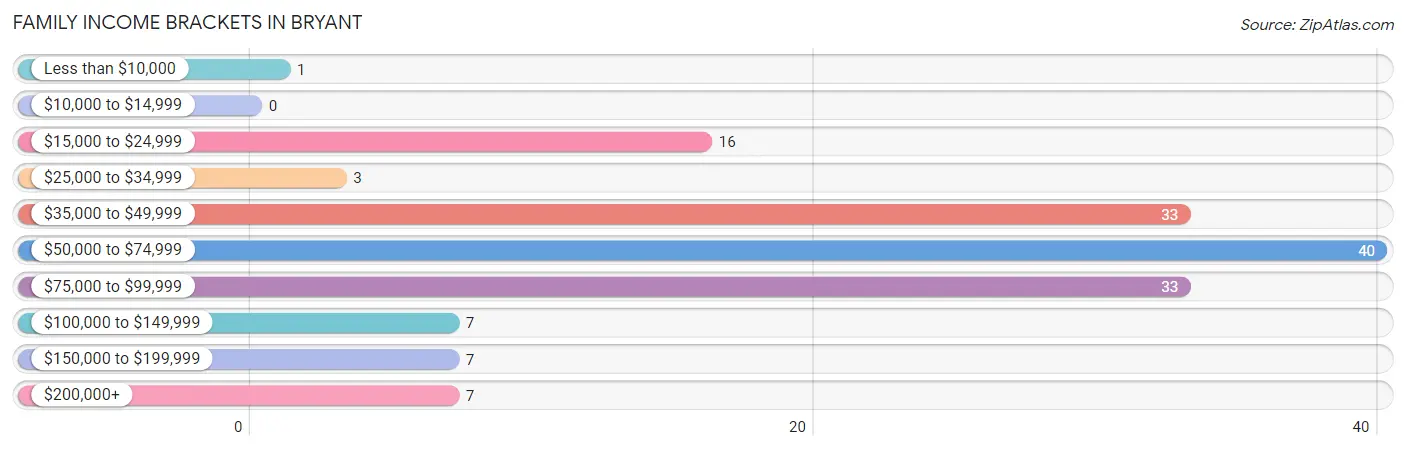
| Income Bracket | # Families | % Families |
| Less than $10,000 | 1 | 0.7% |
| $10,000 to $14,999 | 0 | 0.0% |
| $15,000 to $24,999 | 16 | 10.9% |
| $25,000 to $34,999 | 3 | 2.0% |
| $35,000 to $49,999 | 33 | 22.4% |
| $50,000 to $74,999 | 40 | 27.2% |
| $75,000 to $99,999 | 33 | 22.4% |
| $100,000 to $149,999 | 7 | 4.8% |
| $150,000 to $199,999 | 7 | 4.8% |
| $200,000+ | 7 | 4.8% |
Family Income by Famaliy Size in Bryant
4-person families (11 | 7.5%) account for the highest median family income in Bryant with $89,688 per family, while 2-person families (59 | 40.1%) have the highest median income of $32,054 per family member.
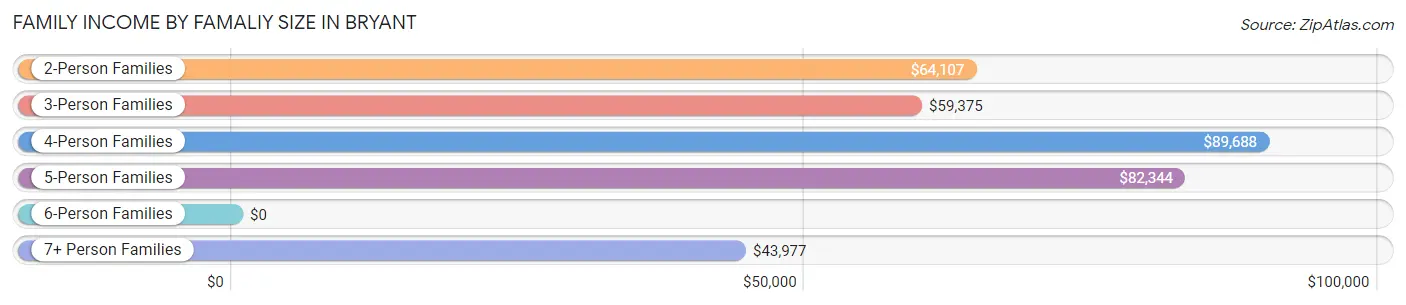
| Income Bracket | # Families | Median Income |
| 2-Person Families | 59 (40.1%) | $64,107 |
| 3-Person Families | 23 (15.7%) | $59,375 |
| 4-Person Families | 11 (7.5%) | $89,688 |
| 5-Person Families | 21 (14.3%) | $82,344 |
| 6-Person Families | 1 (0.7%) | $0 |
| 7+ Person Families | 32 (21.8%) | $43,977 |
| Total | 147 (100.0%) | $65,417 |
Family Income by Number of Earners in Bryant
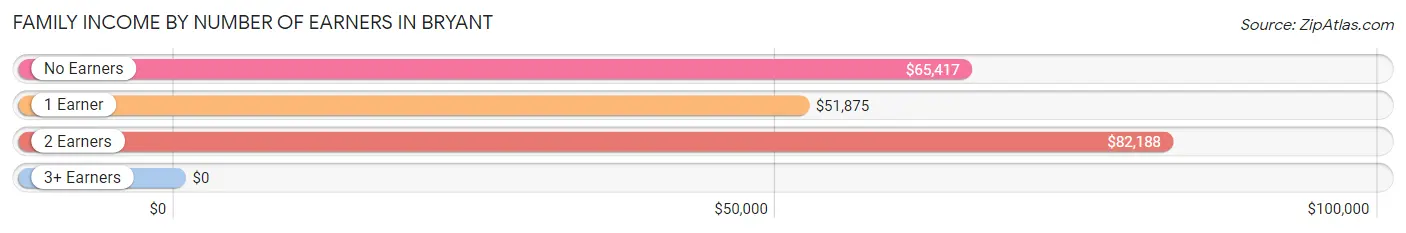
| Number of Earners | # Families | Median Income |
| No Earners | 13 (8.8%) | $65,417 |
| 1 Earner | 93 (63.3%) | $51,875 |
| 2 Earners | 31 (21.1%) | $82,188 |
| 3+ Earners | 10 (6.8%) | $0 |
| Total | 147 (100.0%) | $65,417 |
Household Income in Bryant
Household Income Brackets in Bryant
With 47 households falling in the category, the $50,000 to $74,999 income range is the most frequent in Bryant, accounting for 21.5% of all households. In contrast, only 2 households (0.9%) fall into the less than $10,000 income bracket, making it the least populous group.
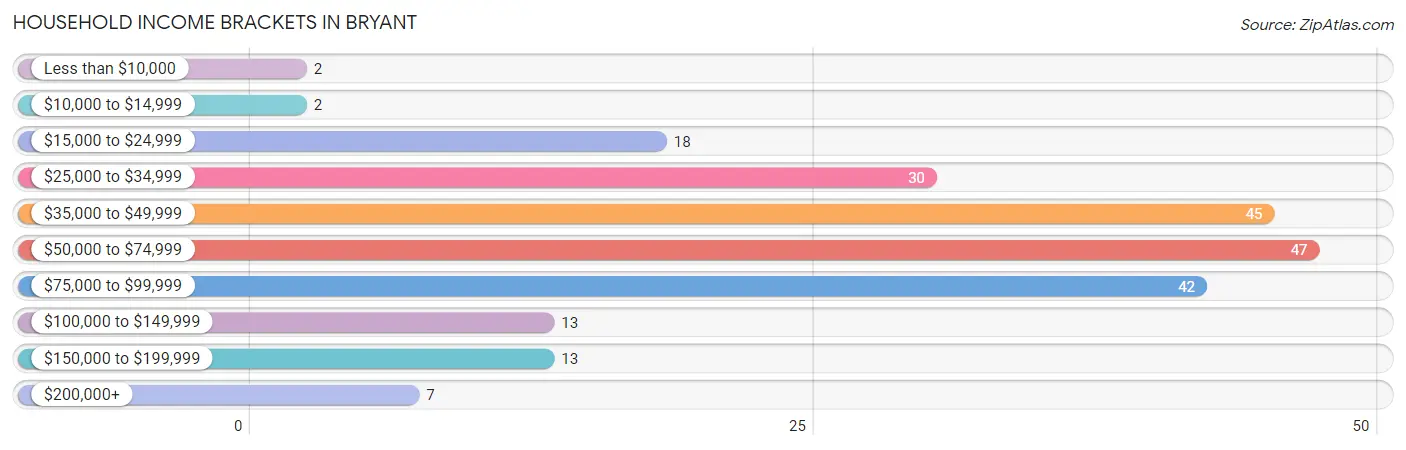
| Income Bracket | # Households | % Households |
| Less than $10,000 | 2 | 0.9% |
| $10,000 to $14,999 | 2 | 0.9% |
| $15,000 to $24,999 | 18 | 8.2% |
| $25,000 to $34,999 | 30 | 13.7% |
| $35,000 to $49,999 | 45 | 20.5% |
| $50,000 to $74,999 | 47 | 21.5% |
| $75,000 to $99,999 | 42 | 19.2% |
| $100,000 to $149,999 | 13 | 5.9% |
| $150,000 to $199,999 | 13 | 5.9% |
| $200,000+ | 7 | 3.2% |
Household Income by Householder Age in Bryant
The median household income in Bryant is $58,558, with the highest median household income of $78,750 found in the 15 to 24 years age bracket for the primary householder. A total of 51 households (23.3%) fall into this category. Meanwhile, the 25 to 44 years age bracket for the primary householder has the lowest median household income of $44,100, with 88 households (40.2%) in this group.
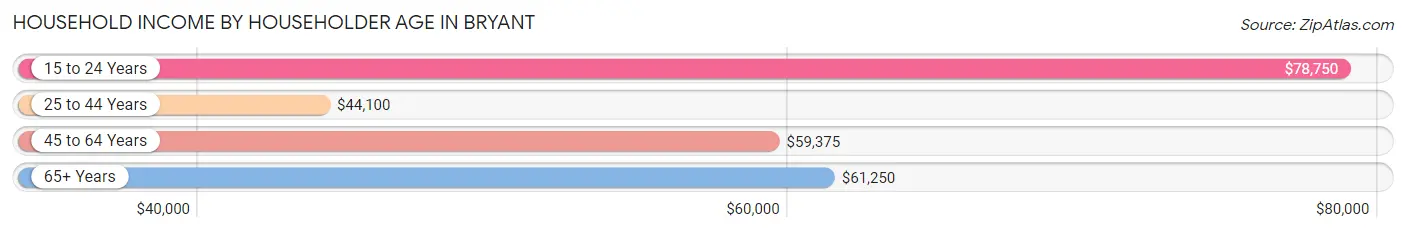
| Income Bracket | # Households | Median Income |
| 15 to 24 Years | 51 (23.3%) | $78,750 |
| 25 to 44 Years | 88 (40.2%) | $44,100 |
| 45 to 64 Years | 37 (16.9%) | $59,375 |
| 65+ Years | 43 (19.6%) | $61,250 |
| Total | 219 (100.0%) | $58,558 |
Poverty in Bryant
Income Below Poverty by Sex and Age in Bryant
With 36.9% poverty level for males and 20.3% for females among the residents of Bryant, 15 year old males and 25 to 34 year old females are the most vulnerable to poverty, with 2 males (100.0%) and 22 females (84.6%) in their respective age groups living below the poverty level.
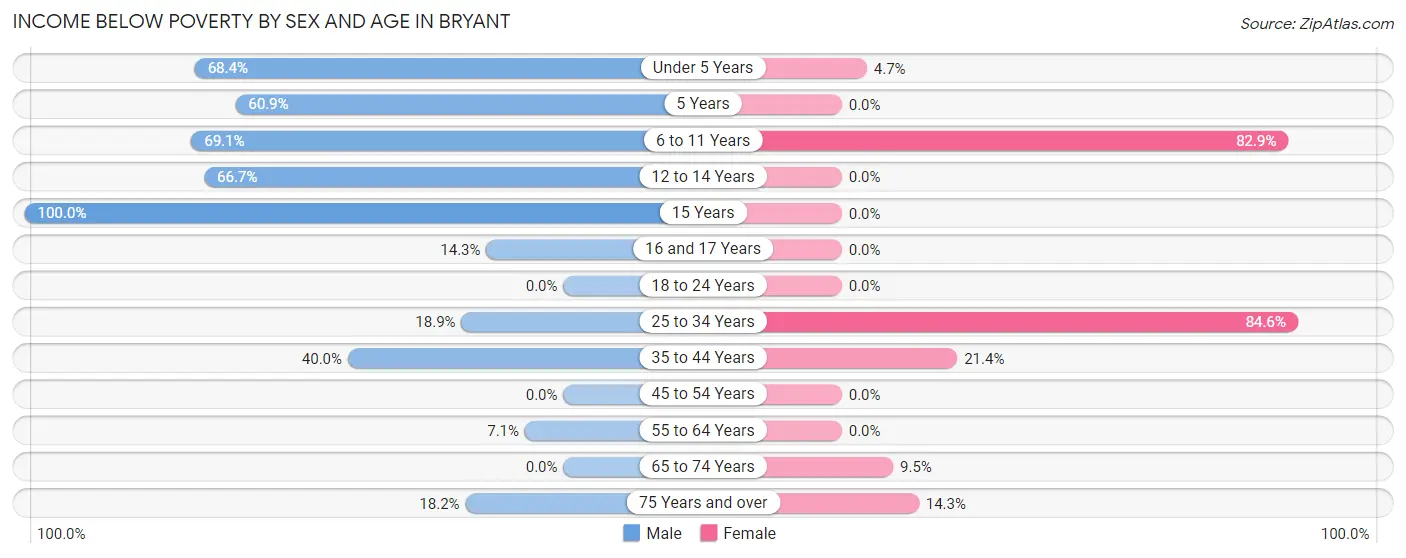
| Age Bracket | Male | Female |
| Under 5 Years | 52 (68.4%) | 2 (4.6%) |
| 5 Years | 14 (60.9%) | 0 (0.0%) |
| 6 to 11 Years | 29 (69.1%) | 29 (82.9%) |
| 12 to 14 Years | 2 (66.7%) | 0 (0.0%) |
| 15 Years | 2 (100.0%) | 0 (0.0%) |
| 16 and 17 Years | 1 (14.3%) | 0 (0.0%) |
| 18 to 24 Years | 0 (0.0%) | 0 (0.0%) |
| 25 to 34 Years | 7 (18.9%) | 22 (84.6%) |
| 35 to 44 Years | 24 (40.0%) | 3 (21.4%) |
| 45 to 54 Years | 0 (0.0%) | 0 (0.0%) |
| 55 to 64 Years | 2 (7.1%) | 0 (0.0%) |
| 65 to 74 Years | 0 (0.0%) | 2 (9.5%) |
| 75 Years and over | 2 (18.2%) | 2 (14.3%) |
| Total | 135 (36.9%) | 60 (20.3%) |
Income Above Poverty by Sex and Age in Bryant
According to the poverty statistics in Bryant, males aged 18 to 24 years and females aged 5 years are the age groups that are most secure financially, with 100.0% of males and 100.0% of females in these age groups living above the poverty line.
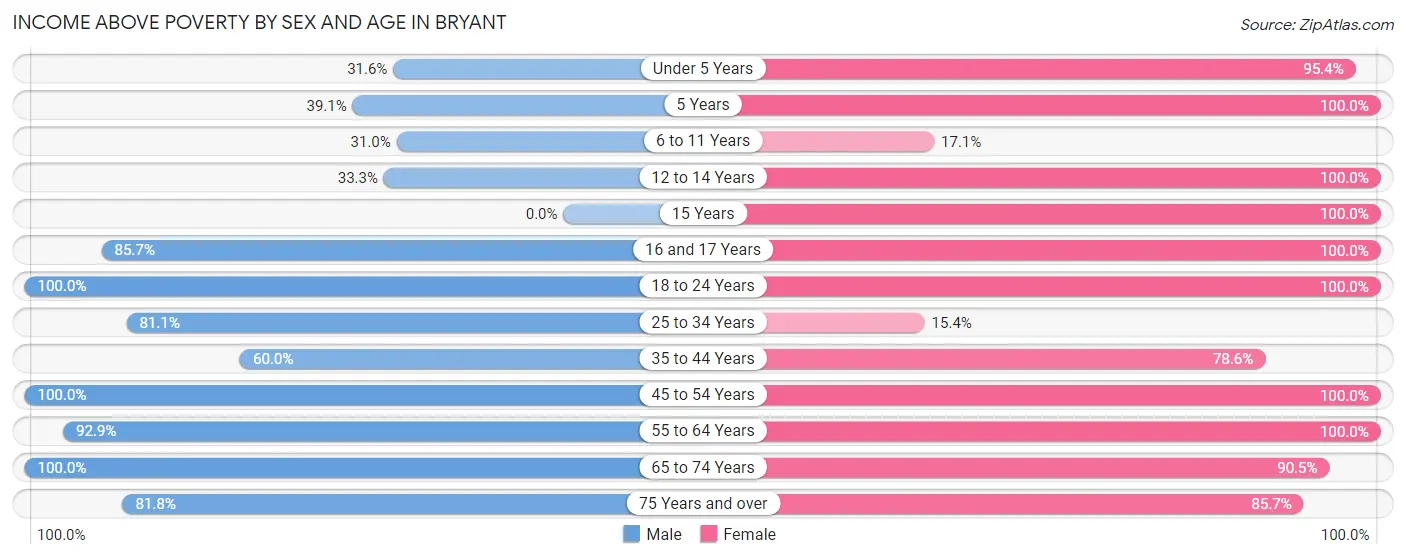
| Age Bracket | Male | Female |
| Under 5 Years | 24 (31.6%) | 41 (95.4%) |
| 5 Years | 9 (39.1%) | 7 (100.0%) |
| 6 to 11 Years | 13 (30.9%) | 6 (17.1%) |
| 12 to 14 Years | 1 (33.3%) | 10 (100.0%) |
| 15 Years | 0 (0.0%) | 9 (100.0%) |
| 16 and 17 Years | 6 (85.7%) | 10 (100.0%) |
| 18 to 24 Years | 50 (100.0%) | 83 (100.0%) |
| 25 to 34 Years | 30 (81.1%) | 4 (15.4%) |
| 35 to 44 Years | 36 (60.0%) | 11 (78.6%) |
| 45 to 54 Years | 8 (100.0%) | 12 (100.0%) |
| 55 to 64 Years | 26 (92.9%) | 11 (100.0%) |
| 65 to 74 Years | 19 (100.0%) | 19 (90.5%) |
| 75 Years and over | 9 (81.8%) | 12 (85.7%) |
| Total | 231 (63.1%) | 235 (79.7%) |
Income Below Poverty Among Married-Couple Families in Bryant
The poverty statistics for married-couple families in Bryant show that 24.2% or 29 of the total 120 families live below the poverty line. Families with 5 or more children have the highest poverty rate of 78.1%, comprising of 25 families. On the other hand, families with 1 or 2 children have the lowest poverty rate of 0.0%, which includes 0 families.
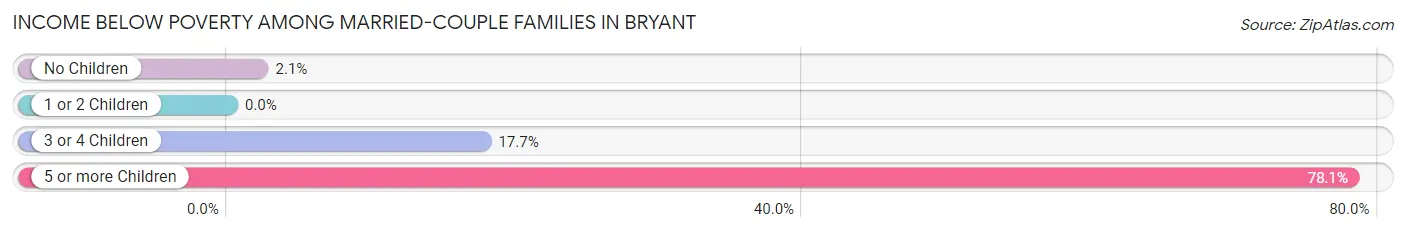
| Children | Above Poverty | Below Poverty |
| No Children | 46 (97.9%) | 1 (2.1%) |
| 1 or 2 Children | 24 (100.0%) | 0 (0.0%) |
| 3 or 4 Children | 14 (82.4%) | 3 (17.6%) |
| 5 or more Children | 7 (21.9%) | 25 (78.1%) |
| Total | 91 (75.8%) | 29 (24.2%) |
Income Below Poverty Among Single-Parent Households in Bryant
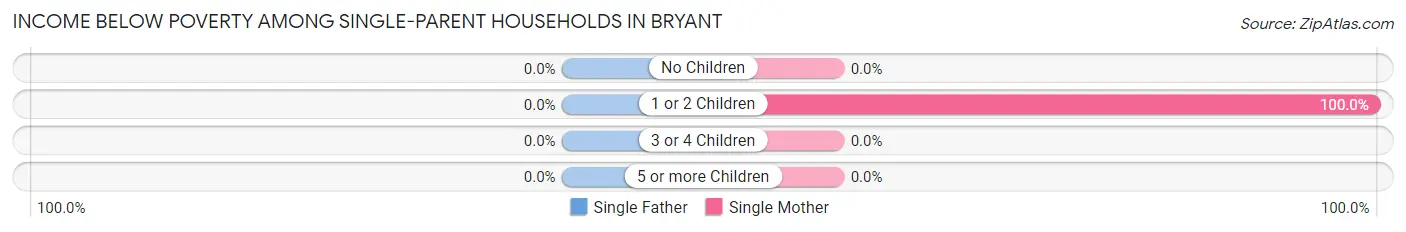
| Children | Single Father | Single Mother |
| No Children | 0 (0.0%) | 0 (0.0%) |
| 1 or 2 Children | 0 (0.0%) | 1 (100.0%) |
| 3 or 4 Children | 0 (0.0%) | 0 (0.0%) |
| 5 or more Children | 0 (0.0%) | 0 (0.0%) |
| Total | 0 (0.0%) | 1 (12.5%) |
Income Below Poverty Among Married-Couple vs Single-Parent Households in Bryant
The poverty data for Bryant shows that 29 of the married-couple family households (24.2%) and 1 of the single-parent households (3.7%) are living below the poverty level. Within the married-couple family households, those with 5 or more children have the highest poverty rate, with 25 households (78.1%) falling below the poverty line. Among the single-parent households, those with 1 or 2 children have the highest poverty rate, with 1 household (7.7%) living below poverty.
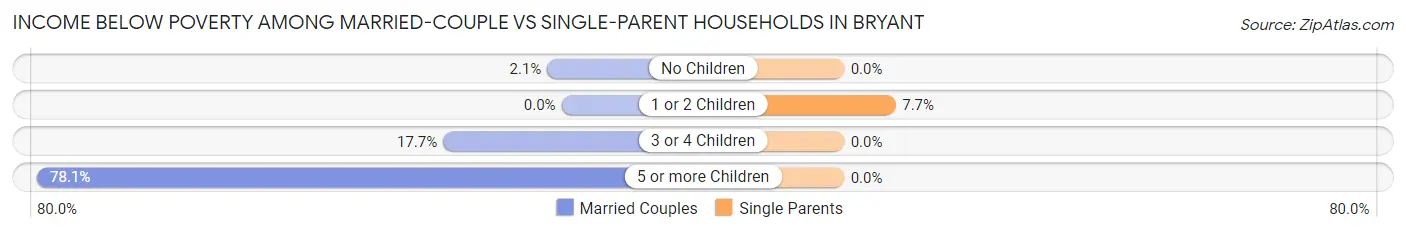
| Children | Married-Couple Families | Single-Parent Households |
| No Children | 1 (2.1%) | 0 (0.0%) |
| 1 or 2 Children | 0 (0.0%) | 1 (7.7%) |
| 3 or 4 Children | 3 (17.6%) | 0 (0.0%) |
| 5 or more Children | 25 (78.1%) | 0 (0.0%) |
| Total | 29 (24.2%) | 1 (3.7%) |
Race in Bryant
The most populous races in Bryant are White / Caucasian (726 | 96.9%), Hispanic or Latino (54 | 7.2%), and Some other Race (20 | 2.7%).
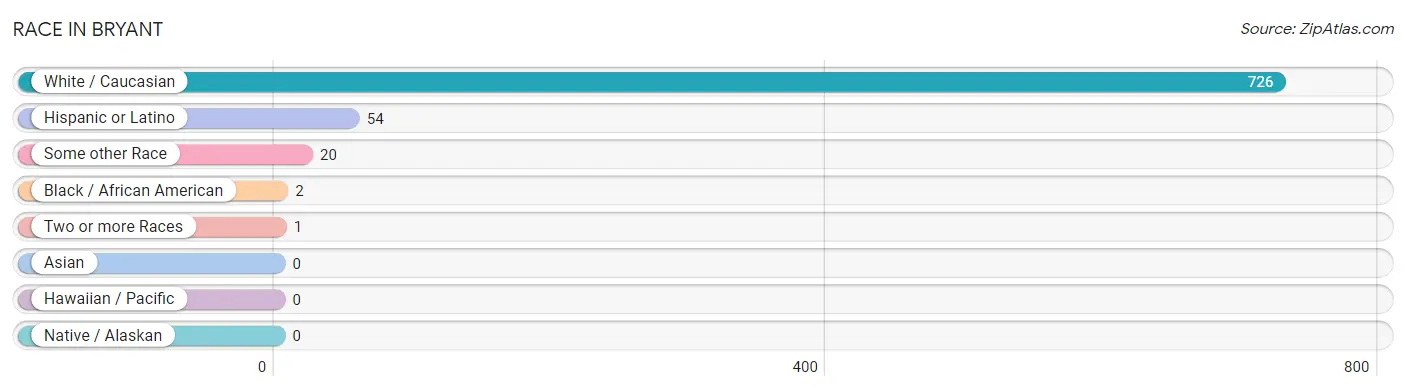
| Race | # Population | % Population |
| Asian | 0 | 0.0% |
| Black / African American | 2 | 0.3% |
| Hawaiian / Pacific | 0 | 0.0% |
| Hispanic or Latino | 54 | 7.2% |
| Native / Alaskan | 0 | 0.0% |
| White / Caucasian | 726 | 96.9% |
| Two or more Races | 1 | 0.1% |
| Some other Race | 20 | 2.7% |
| Total | 749 | 100.0% |
Ancestry in Bryant
The most populous ancestries reported in Bryant are German (148 | 19.8%), Norwegian (100 | 13.4%), Finnish (69 | 9.2%), English (66 | 8.8%), and Mexican (34 | 4.5%), together accounting for 55.7% of all Bryant residents.
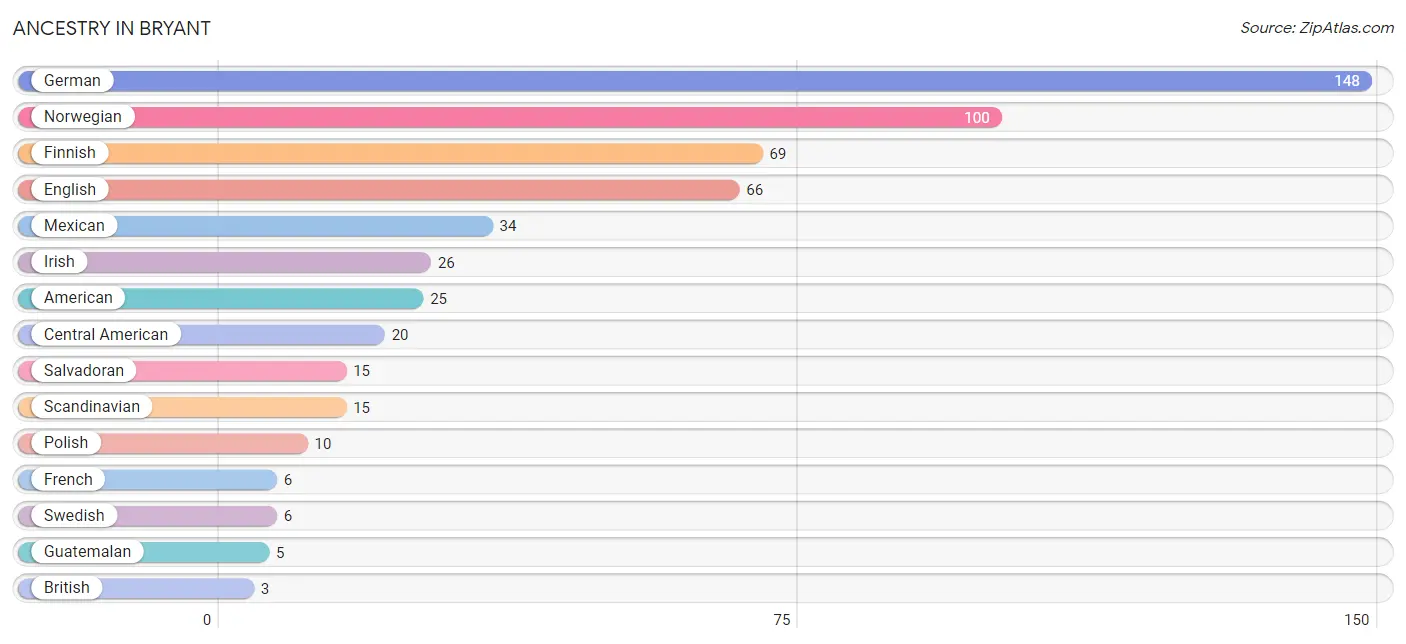
| Ancestry | # Population | % Population |
| American | 25 | 3.3% |
| British | 3 | 0.4% |
| Central American | 20 | 2.7% |
| Czech | 3 | 0.4% |
| Danish | 3 | 0.4% |
| Dutch | 1 | 0.1% |
| English | 66 | 8.8% |
| Ethiopian | 2 | 0.3% |
| Finnish | 69 | 9.2% |
| French | 6 | 0.8% |
| German | 148 | 19.8% |
| Guatemalan | 5 | 0.7% |
| Irish | 26 | 3.5% |
| Mexican | 34 | 4.5% |
| Norwegian | 100 | 13.4% |
| Polish | 10 | 1.3% |
| Portuguese | 2 | 0.3% |
| Russian | 1 | 0.1% |
| Salvadoran | 15 | 2.0% |
| Scandinavian | 15 | 2.0% |
| Scottish | 3 | 0.4% |
| Subsaharan African | 2 | 0.3% |
| Swedish | 6 | 0.8% |
| Swiss | 2 | 0.3% |
| Welsh | 3 | 0.4% | View All 25 Rows |
Immigrants in Bryant
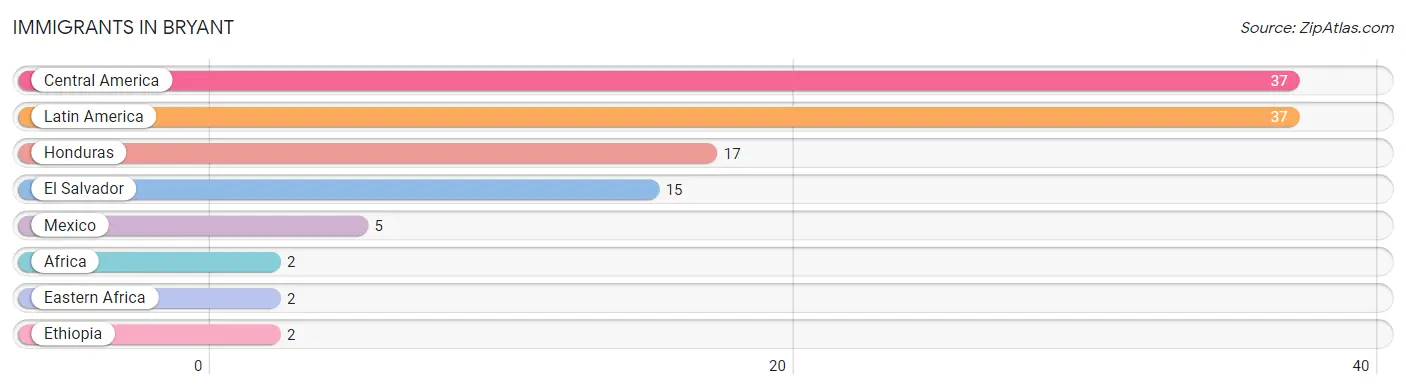
The most numerous immigrant groups reported in Bryant came from Central America (37 | 4.9%), Latin America (37 | 4.9%), Honduras (17 | 2.3%), El Salvador (15 | 2.0%), and Mexico (5 | 0.7%), together accounting for 14.8% of all Bryant residents.
| Immigration Origin | # Population | % Population |
| Africa | 2 | 0.3% |
| Central America | 37 | 4.9% |
| Eastern Africa | 2 | 0.3% |
| El Salvador | 15 | 2.0% |
| Ethiopia | 2 | 0.3% |
| Honduras | 17 | 2.3% |
| Latin America | 37 | 4.9% |
| Mexico | 5 | 0.7% | View All 8 Rows |
Sex and Age in Bryant
Sex and Age in Bryant
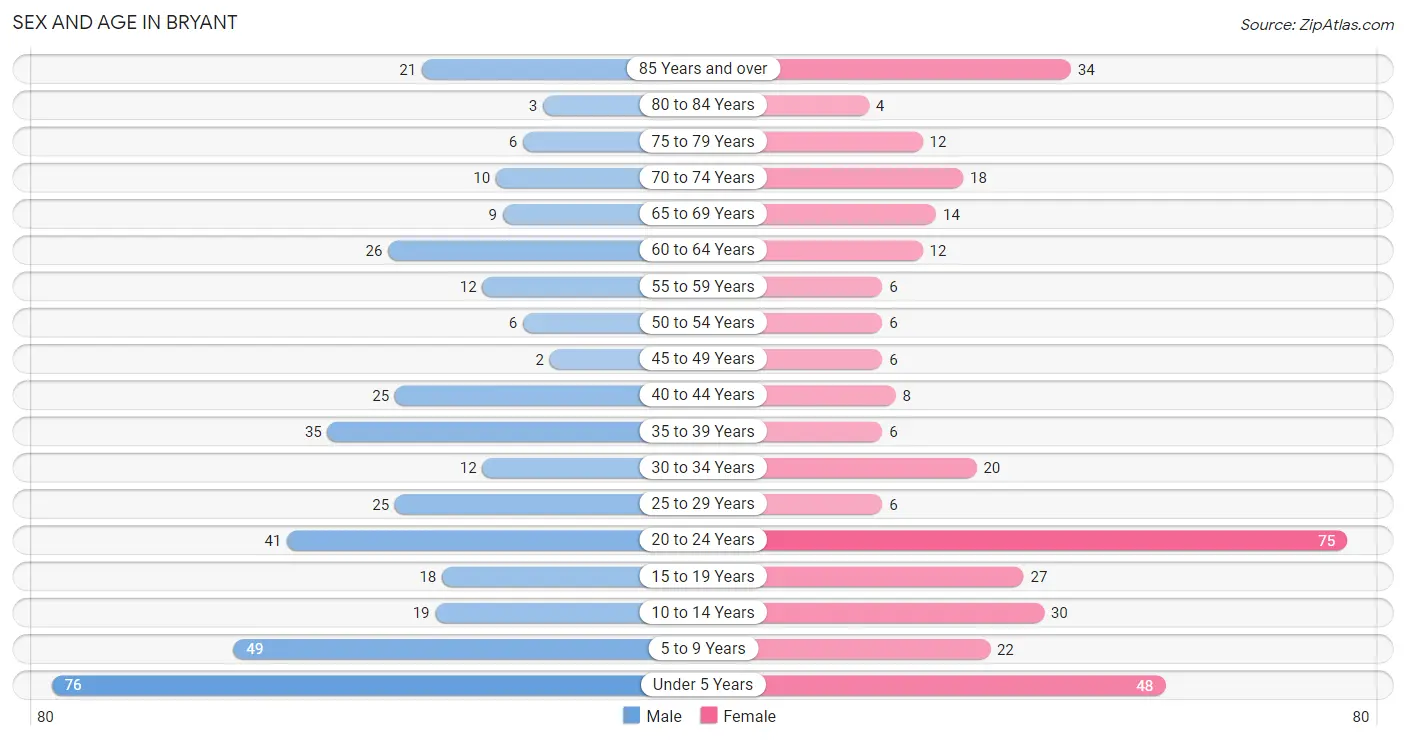
The most populous age groups in Bryant are Under 5 Years (76 | 19.2%) for men and 20 to 24 Years (75 | 21.2%) for women.
| Age Bracket | Male | Female |
| Under 5 Years | 76 (19.2%) | 48 (13.6%) |
| 5 to 9 Years | 49 (12.4%) | 22 (6.2%) |
| 10 to 14 Years | 19 (4.8%) | 30 (8.5%) |
| 15 to 19 Years | 18 (4.6%) | 27 (7.6%) |
| 20 to 24 Years | 41 (10.4%) | 75 (21.2%) |
| 25 to 29 Years | 25 (6.3%) | 6 (1.7%) |
| 30 to 34 Years | 12 (3.0%) | 20 (5.7%) |
| 35 to 39 Years | 35 (8.9%) | 6 (1.7%) |
| 40 to 44 Years | 25 (6.3%) | 8 (2.3%) |
| 45 to 49 Years | 2 (0.5%) | 6 (1.7%) |
| 50 to 54 Years | 6 (1.5%) | 6 (1.7%) |
| 55 to 59 Years | 12 (3.0%) | 6 (1.7%) |
| 60 to 64 Years | 26 (6.6%) | 12 (3.4%) |
| 65 to 69 Years | 9 (2.3%) | 14 (4.0%) |
| 70 to 74 Years | 10 (2.5%) | 18 (5.1%) |
| 75 to 79 Years | 6 (1.5%) | 12 (3.4%) |
| 80 to 84 Years | 3 (0.8%) | 4 (1.1%) |
| 85 Years and over | 21 (5.3%) | 34 (9.6%) |
| Total | 395 (100.0%) | 354 (100.0%) |
Families and Households in Bryant
Median Family Size in Bryant
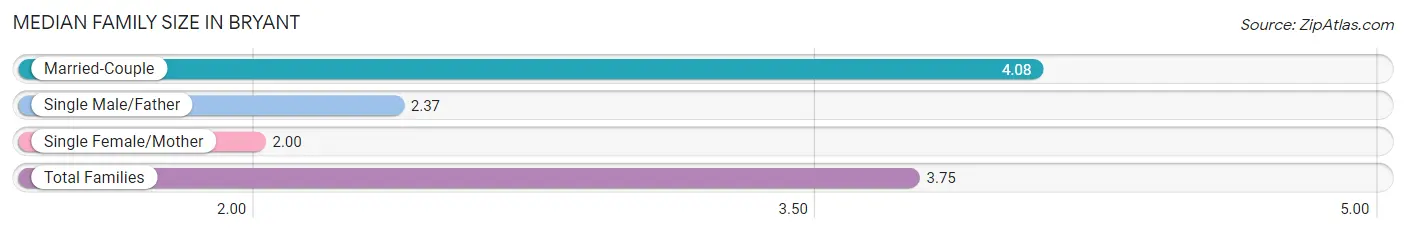
The median family size in Bryant is 3.75 persons per family, with married-couple families (120 | 81.6%) accounting for the largest median family size of 4.08 persons per family. On the other hand, single female/mother families (8 | 5.4%) represent the smallest median family size with 2.00 persons per family.
| Family Type | # Families | Family Size |
| Married-Couple | 120 (81.6%) | 4.08 |
| Single Male/Father | 19 (12.9%) | 2.37 |
| Single Female/Mother | 8 (5.4%) | 2.00 |
| Total Families | 147 (100.0%) | 3.75 |
Median Household Size in Bryant
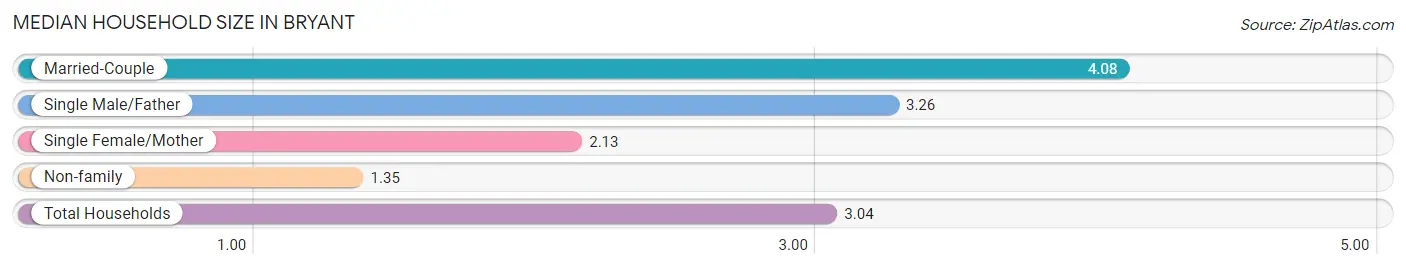
The median household size in Bryant is 3.04 persons per household, with married-couple households (120 | 54.8%) accounting for the largest median household size of 4.08 persons per household. non-family households (72 | 32.9%) represent the smallest median household size with 1.35 persons per household.
| Household Type | # Households | Household Size |
| Married-Couple | 120 (54.8%) | 4.08 |
| Single Male/Father | 19 (8.7%) | 3.26 |
| Single Female/Mother | 8 (3.6%) | 2.13 |
| Non-family | 72 (32.9%) | 1.35 |
| Total Households | 219 (100.0%) | 3.04 |
Household Size by Marriage Status in Bryant
Out of a total of 219 households in Bryant, 147 (67.1%) are family households, while 72 (32.9%) are nonfamily households. The most numerous type of family households are 2-person households, comprising 54, and the most common type of nonfamily households are 1-person households, comprising 62.
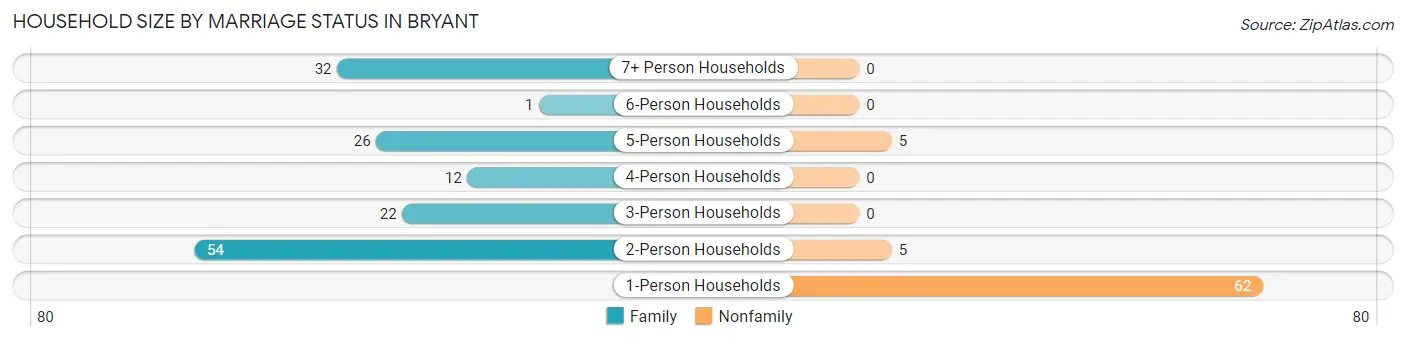
| Household Size | Family Households | Nonfamily Households |
| 1-Person Households | - | 62 (28.3%) |
| 2-Person Households | 54 (24.7%) | 5 (2.3%) |
| 3-Person Households | 22 (10.1%) | 0 (0.0%) |
| 4-Person Households | 12 (5.5%) | 0 (0.0%) |
| 5-Person Households | 26 (11.9%) | 5 (2.3%) |
| 6-Person Households | 1 (0.5%) | 0 (0.0%) |
| 7+ Person Households | 32 (14.6%) | 0 (0.0%) |
| Total | 147 (67.1%) | 72 (32.9%) |
Female Fertility in Bryant
Fertility by Age in Bryant
Average fertility rate in Bryant is 142.0 births per 1,000 women. Women in the age bracket of 20 to 34 years have the highest fertility rate with 198.0 births per 1,000 women. Women in the age bracket of 20 to 34 years acount for 95.2% of all women with births.
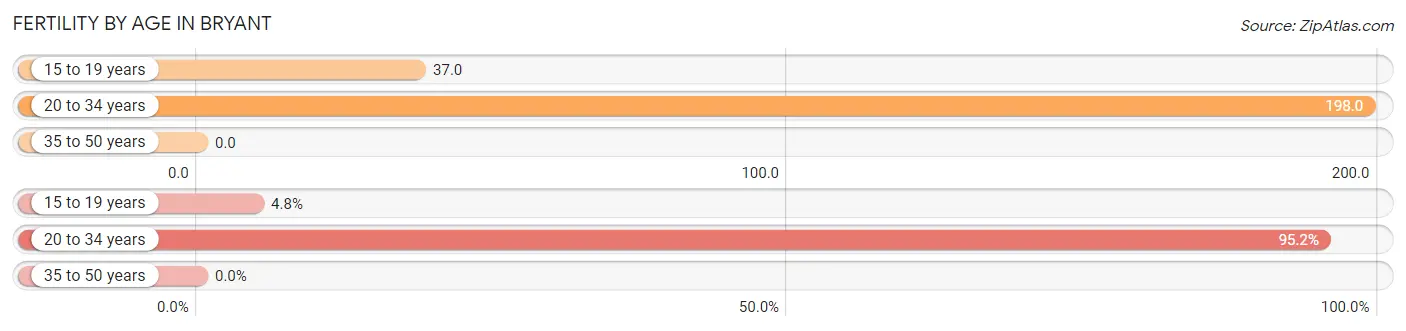
| Age Bracket | Women with Births | Births / 1,000 Women |
| 15 to 19 years | 1 (4.8%) | 37.0 |
| 20 to 34 years | 20 (95.2%) | 198.0 |
| 35 to 50 years | 0 (0.0%) | 0.0 |
| Total | 21 (100.0%) | 142.0 |
Fertility by Age by Marriage Status in Bryant
95.2% of women with births (21) in Bryant are married. The highest percentage of unmarried women with births falls into 20 to 34 years age bracket with 5.0% of them unmarried at the time of birth, while the lowest percentage of unmarried women with births belong to 15 to 19 years age bracket with 0.0% of them unmarried.
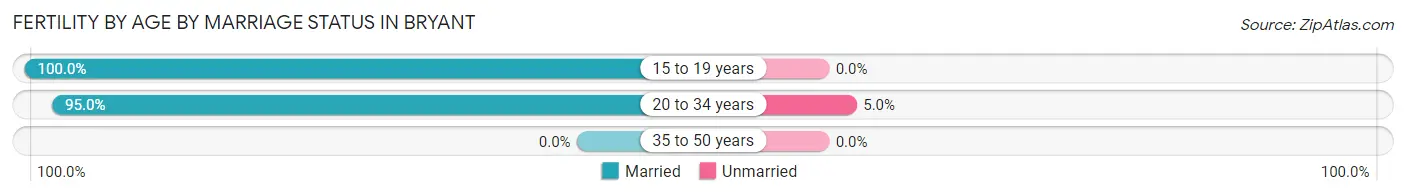
| Age Bracket | Married | Unmarried |
| 15 to 19 years | 1 (100.0%) | 0 (0.0%) |
| 20 to 34 years | 19 (95.0%) | 1 (5.0%) |
| 35 to 50 years | 0 (0.0%) | 0 (0.0%) |
| Total | 20 (95.2%) | 1 (4.8%) |
Fertility by Education in Bryant
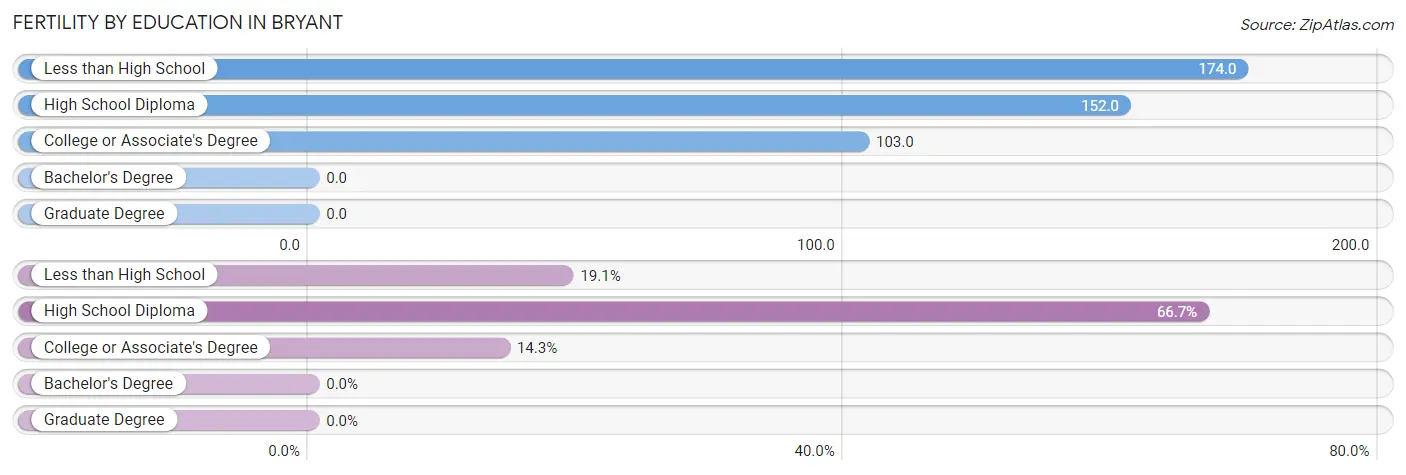
| Educational Attainment | Women with Births | Births / 1,000 Women |
| Less than High School | 4 (19.1%) | 174.0 |
| High School Diploma | 14 (66.7%) | 152.0 |
| College or Associate's Degree | 3 (14.3%) | 103.0 |
| Bachelor's Degree | 0 (0.0%) | 0.0 |
| Graduate Degree | 0 (0.0%) | 0.0 |
| Total | 21 (100.0%) | 142.0 |
Fertility by Education by Marriage Status in Bryant
4.8% of women with births in Bryant are unmarried. Women with the educational attainment of less than high school are most likely to be married with 100.0% of them married at childbirth, while women with the educational attainment of high school diploma are least likely to be married with 7.1% of them unmarried at childbirth.
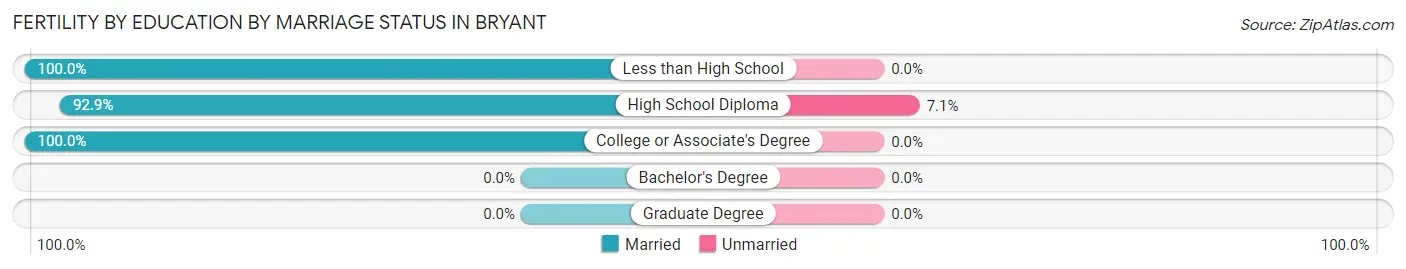
| Educational Attainment | Married | Unmarried |
| Less than High School | 4 (100.0%) | 0 (0.0%) |
| High School Diploma | 13 (92.9%) | 1 (7.1%) |
| College or Associate's Degree | 3 (100.0%) | 0 (0.0%) |
| Bachelor's Degree | 0 (0.0%) | 0 (0.0%) |
| Graduate Degree | 0 (0.0%) | 0 (0.0%) |
| Total | 20 (95.2%) | 1 (4.8%) |
Employment Characteristics in Bryant
Employment by Class of Employer in Bryant
Among the 258 employed individuals in Bryant, private company employees (207 | 80.2%), self-employed (not incorporated) (17 | 6.6%), and local government employees (15 | 5.8%) make up the most common classes of employment.
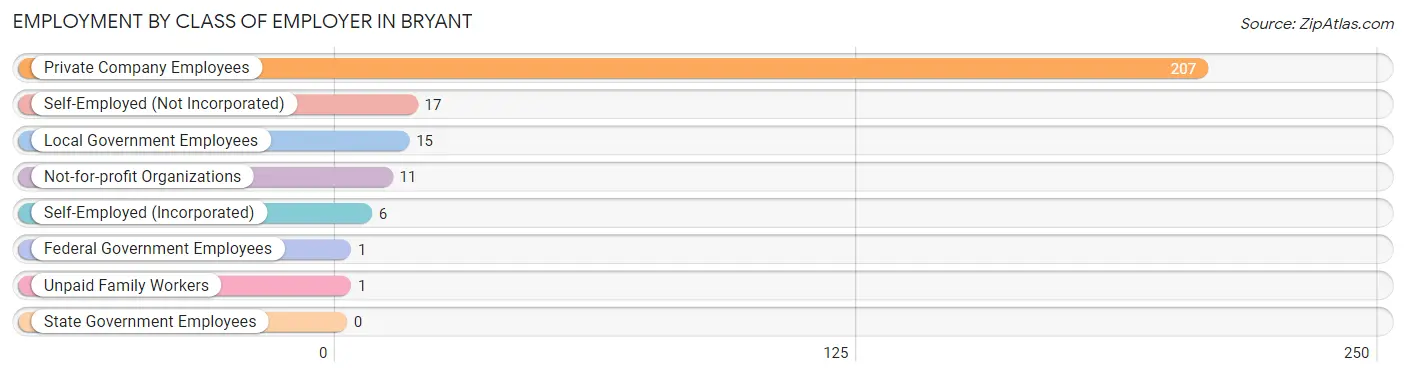
| Employer Class | # Employees | % Employees |
| Private Company Employees | 207 | 80.2% |
| Self-Employed (Incorporated) | 6 | 2.3% |
| Self-Employed (Not Incorporated) | 17 | 6.6% |
| Not-for-profit Organizations | 11 | 4.3% |
| Local Government Employees | 15 | 5.8% |
| State Government Employees | 0 | 0.0% |
| Federal Government Employees | 1 | 0.4% |
| Unpaid Family Workers | 1 | 0.4% |
| Total | 258 | 100.0% |
Employment Status by Age in Bryant
According to the labor force statistics for Bryant, out of the total population over 16 years of age (494), 53.2% or 263 individuals are in the labor force, with 1.9% or 5 of them unemployed. The age group with the highest labor force participation rate is 55 to 59 years, with 100.0% or 18 individuals in the labor force. Within the labor force, the 25 to 29 years age range has the highest percentage of unemployed individuals, with 19.2% or 5 of them being unemployed.
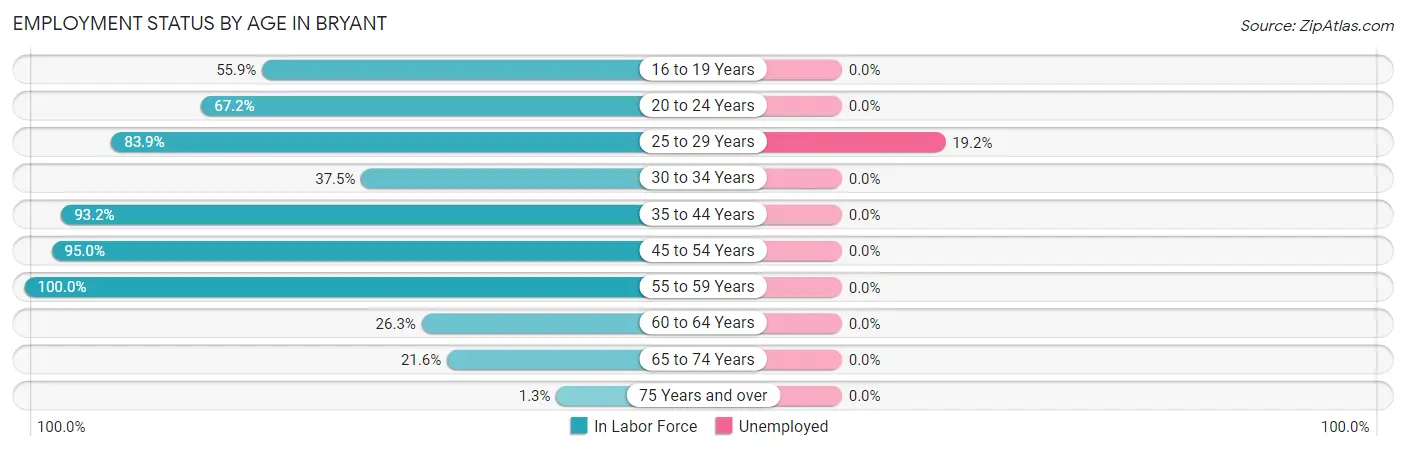
| Age Bracket | In Labor Force | Unemployed |
| 16 to 19 Years | 19 (55.9%) | 0 (0.0%) |
| 20 to 24 Years | 78 (67.2%) | 0 (0.0%) |
| 25 to 29 Years | 26 (83.9%) | 5 (19.2%) |
| 30 to 34 Years | 12 (37.5%) | 0 (0.0%) |
| 35 to 44 Years | 69 (93.2%) | 0 (0.0%) |
| 45 to 54 Years | 19 (95.0%) | 0 (0.0%) |
| 55 to 59 Years | 18 (100.0%) | 0 (0.0%) |
| 60 to 64 Years | 10 (26.3%) | 0 (0.0%) |
| 65 to 74 Years | 11 (21.6%) | 0 (0.0%) |
| 75 Years and over | 1 (1.3%) | 0 (0.0%) |
| Total | 263 (53.2%) | 5 (1.9%) |
Employment Status by Educational Attainment in Bryant
According to labor force statistics for Bryant, 72.3% of individuals (154) out of the total population between 25 and 64 years of age (213) are in the labor force, with 3.2% or 5 of them being unemployed. The group with the highest labor force participation rate are those with the educational attainment of bachelor's degree or higher, with 100.0% or 15 individuals in the labor force. Within the labor force, individuals with high school diploma education have the highest percentage of unemployment, with 6.0% or 5 of them being unemployed.
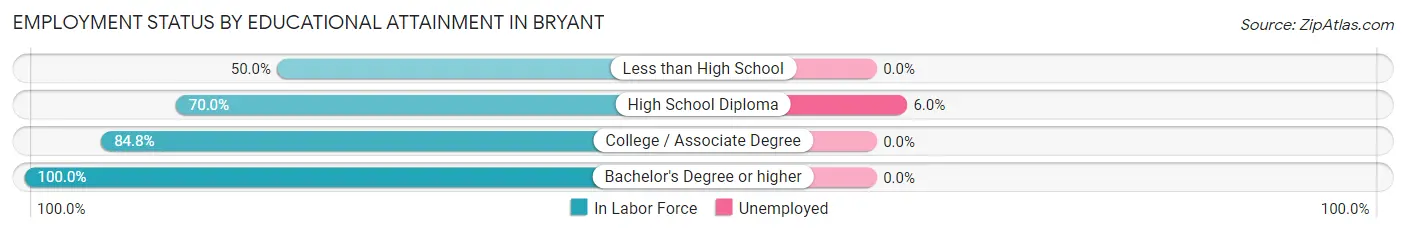
| Educational Attainment | In Labor Force | Unemployed |
| Less than High School | 16 (50.0%) | 0 (0.0%) |
| High School Diploma | 84 (70.0%) | 7 (6.0%) |
| College / Associate Degree | 39 (84.8%) | 0 (0.0%) |
| Bachelor's Degree or higher | 15 (100.0%) | 0 (0.0%) |
| Total | 154 (72.3%) | 7 (3.2%) |
Employment Occupations by Sex in Bryant
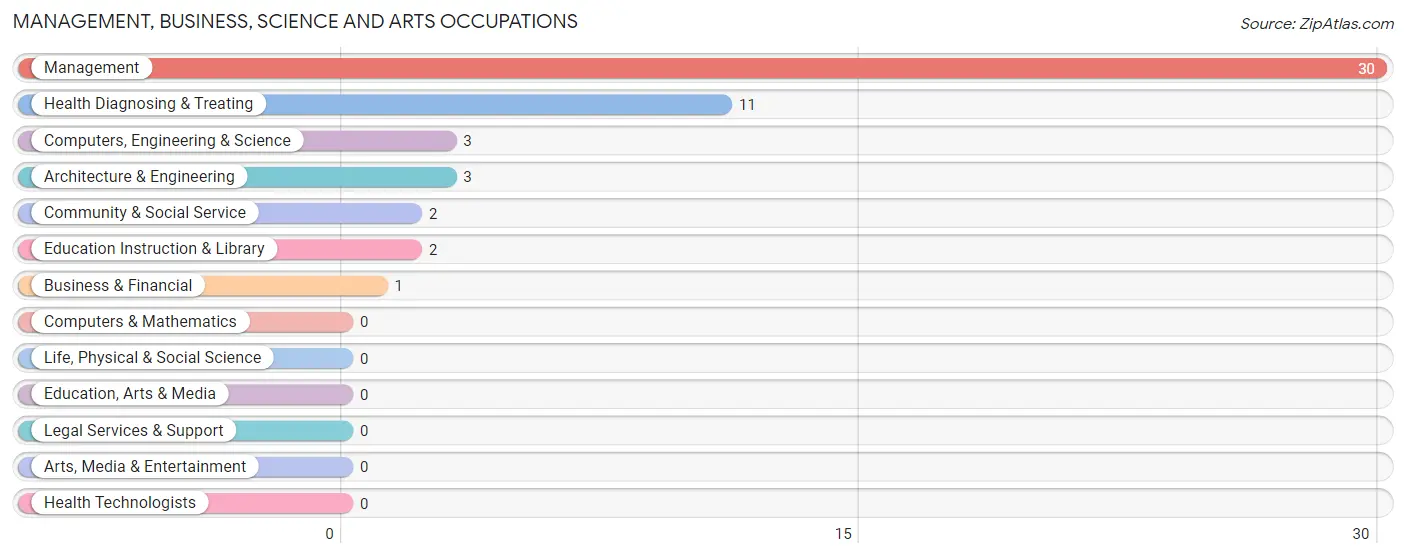
Management, Business, Science and Arts Occupations
The most common Management, Business, Science and Arts occupations in Bryant are Management (30 | 11.6%), Health Diagnosing & Treating (11 | 4.3%), Computers, Engineering & Science (3 | 1.2%), Architecture & Engineering (3 | 1.2%), and Community & Social Service (2 | 0.8%).
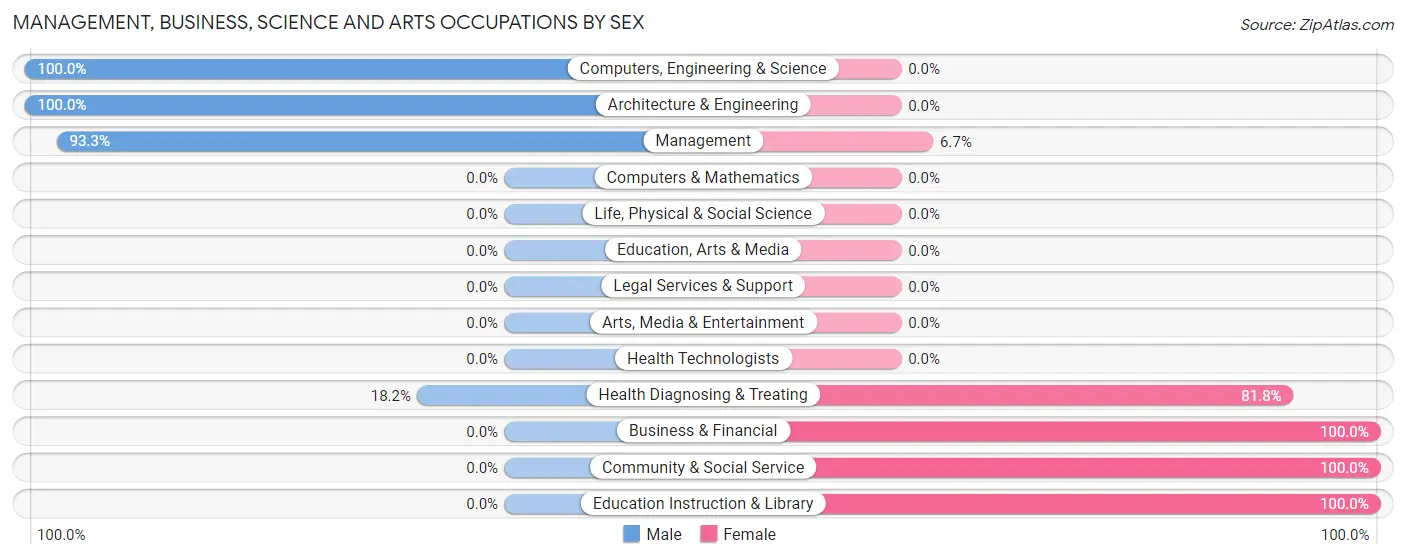
Management, Business, Science and Arts Occupations by Sex
Within the Management, Business, Science and Arts occupations in Bryant, the most male-oriented occupations are Computers, Engineering & Science (100.0%), Architecture & Engineering (100.0%), and Management (93.3%), while the most female-oriented occupations are Business & Financial (100.0%), Community & Social Service (100.0%), and Education Instruction & Library (100.0%).
| Occupation | Male | Female |
| Management | 28 (93.3%) | 2 (6.7%) |
| Business & Financial | 0 (0.0%) | 1 (100.0%) |
| Computers, Engineering & Science | 3 (100.0%) | 0 (0.0%) |
| Computers & Mathematics | 0 (0.0%) | 0 (0.0%) |
| Architecture & Engineering | 3 (100.0%) | 0 (0.0%) |
| Life, Physical & Social Science | 0 (0.0%) | 0 (0.0%) |
| Community & Social Service | 0 (0.0%) | 2 (100.0%) |
| Education, Arts & Media | 0 (0.0%) | 0 (0.0%) |
| Legal Services & Support | 0 (0.0%) | 0 (0.0%) |
| Education Instruction & Library | 0 (0.0%) | 2 (100.0%) |
| Arts, Media & Entertainment | 0 (0.0%) | 0 (0.0%) |
| Health Diagnosing & Treating | 2 (18.2%) | 9 (81.8%) |
| Health Technologists | 0 (0.0%) | 0 (0.0%) |
| Total (Category) | 33 (70.2%) | 14 (29.8%) |
| Total (Overall) | 184 (71.3%) | 74 (28.7%) |
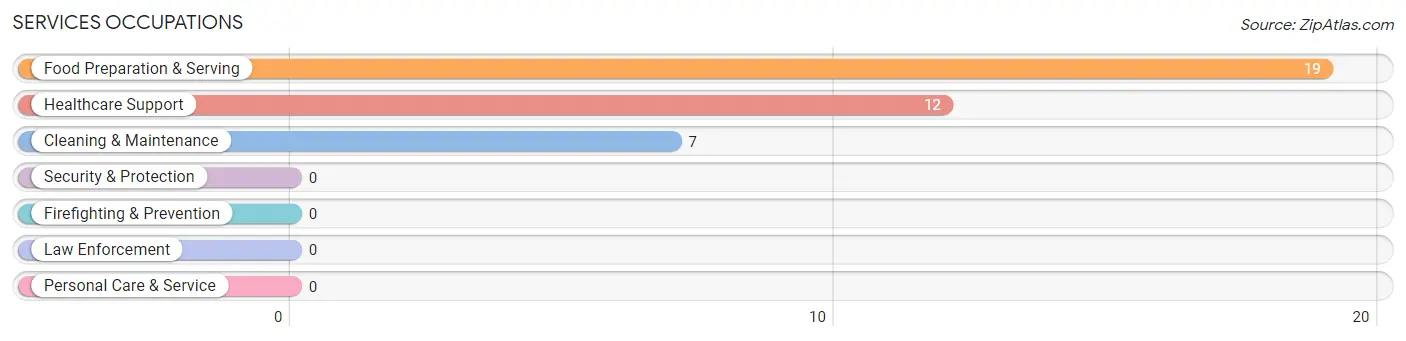
Services Occupations
The most common Services occupations in Bryant are Food Preparation & Serving (19 | 7.4%), Healthcare Support (12 | 4.6%), and Cleaning & Maintenance (7 | 2.7%).
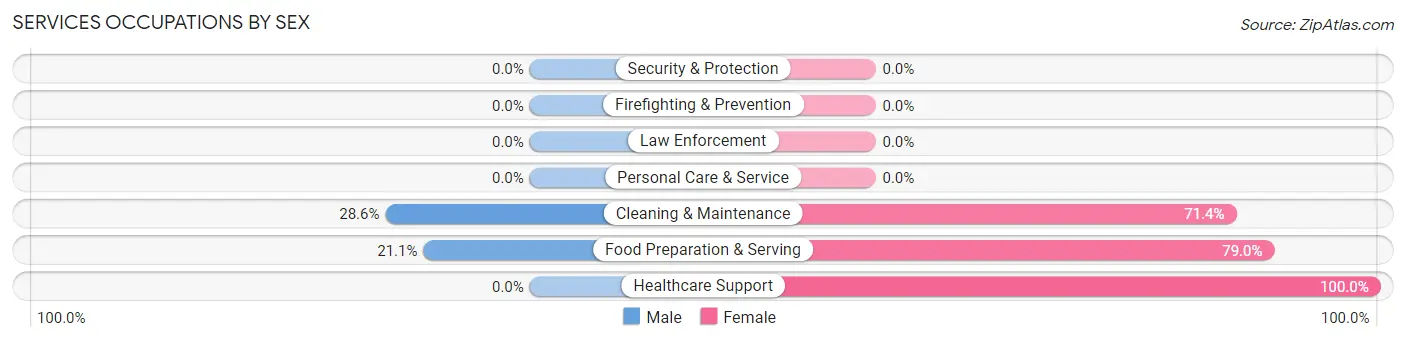
Services Occupations by Sex
Within the Services occupations in Bryant, the most male-oriented occupations are Cleaning & Maintenance (28.6%), and Food Preparation & Serving (21.0%), while the most female-oriented occupations are Healthcare Support (100.0%), Food Preparation & Serving (78.9%), and Cleaning & Maintenance (71.4%).
| Occupation | Male | Female |
| Healthcare Support | 0 (0.0%) | 12 (100.0%) |
| Security & Protection | 0 (0.0%) | 0 (0.0%) |
| Firefighting & Prevention | 0 (0.0%) | 0 (0.0%) |
| Law Enforcement | 0 (0.0%) | 0 (0.0%) |
| Food Preparation & Serving | 4 (21.0%) | 15 (78.9%) |
| Cleaning & Maintenance | 2 (28.6%) | 5 (71.4%) |
| Personal Care & Service | 0 (0.0%) | 0 (0.0%) |
| Total (Category) | 6 (15.8%) | 32 (84.2%) |
| Total (Overall) | 184 (71.3%) | 74 (28.7%) |
Sales and Office Occupations
The most common Sales and Office occupations in Bryant are Office & Administration (16 | 6.2%), and Sales & Related (12 | 4.6%).
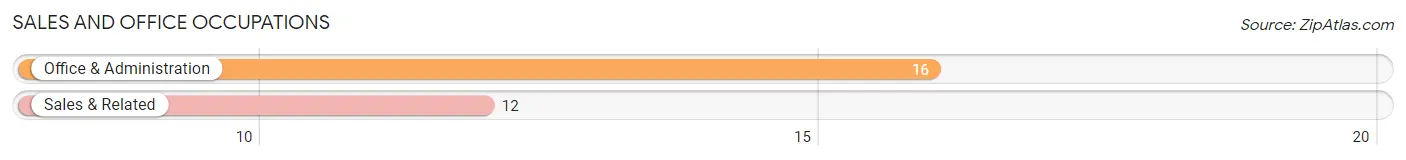
Sales and Office Occupations by Sex
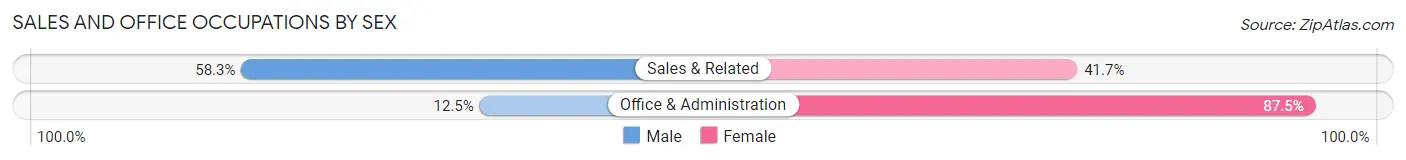
| Occupation | Male | Female |
| Sales & Related | 7 (58.3%) | 5 (41.7%) |
| Office & Administration | 2 (12.5%) | 14 (87.5%) |
| Total (Category) | 9 (32.1%) | 19 (67.9%) |
| Total (Overall) | 184 (71.3%) | 74 (28.7%) |
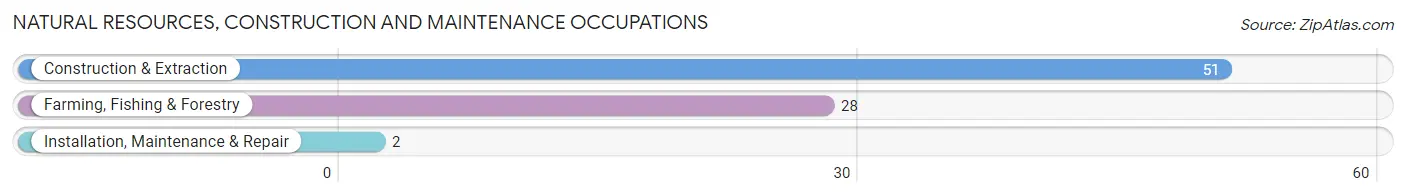
Natural Resources, Construction and Maintenance Occupations
The most common Natural Resources, Construction and Maintenance occupations in Bryant are Construction & Extraction (51 | 19.8%), Farming, Fishing & Forestry (28 | 10.8%), and Installation, Maintenance & Repair (2 | 0.8%).
Natural Resources, Construction and Maintenance Occupations by Sex
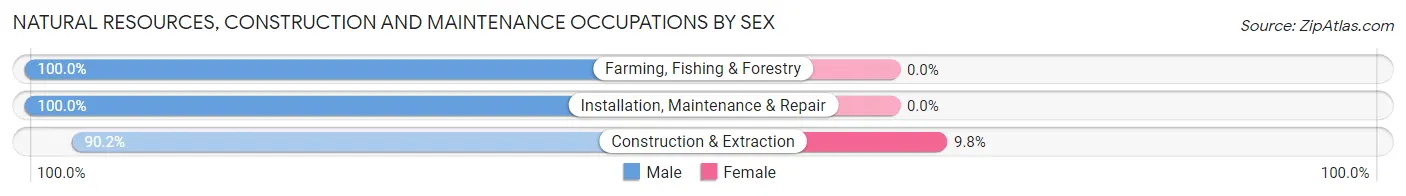
| Occupation | Male | Female |
| Farming, Fishing & Forestry | 28 (100.0%) | 0 (0.0%) |
| Construction & Extraction | 46 (90.2%) | 5 (9.8%) |
| Installation, Maintenance & Repair | 2 (100.0%) | 0 (0.0%) |
| Total (Category) | 76 (93.8%) | 5 (6.2%) |
| Total (Overall) | 184 (71.3%) | 74 (28.7%) |
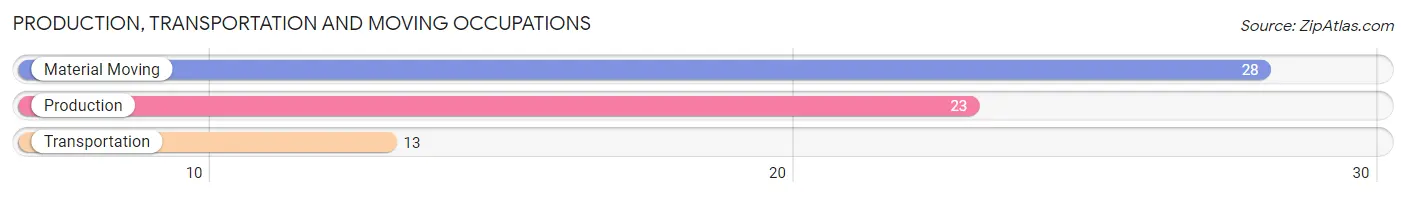
Production, Transportation and Moving Occupations
The most common Production, Transportation and Moving occupations in Bryant are Material Moving (28 | 10.8%), Production (23 | 8.9%), and Transportation (13 | 5.0%).
Production, Transportation and Moving Occupations by Sex
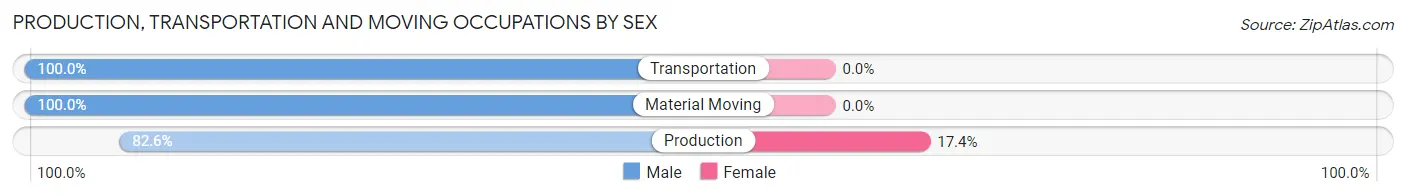
| Occupation | Male | Female |
| Production | 19 (82.6%) | 4 (17.4%) |
| Transportation | 13 (100.0%) | 0 (0.0%) |
| Material Moving | 28 (100.0%) | 0 (0.0%) |
| Total (Category) | 60 (93.8%) | 4 (6.2%) |
| Total (Overall) | 184 (71.3%) | 74 (28.7%) |
Employment Industries by Sex in Bryant
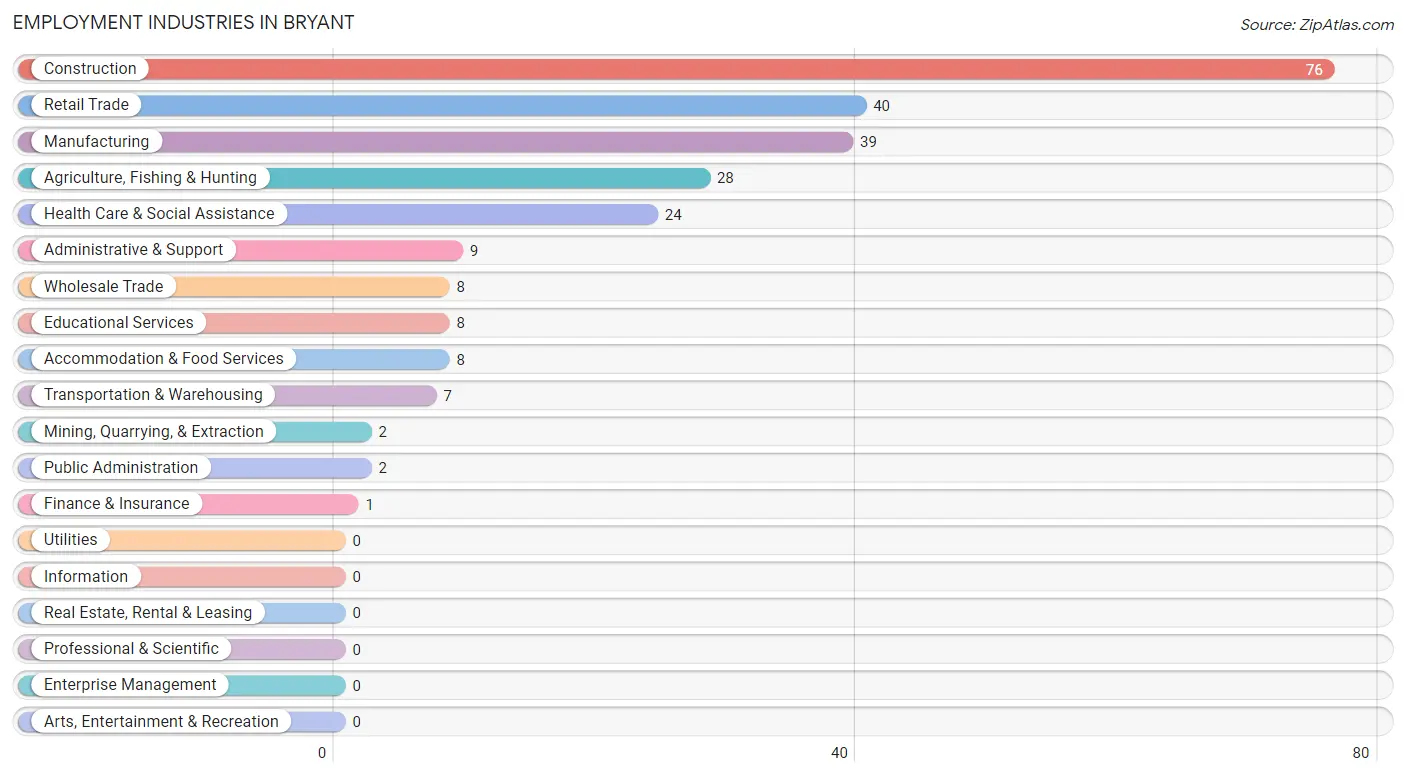
Employment Industries in Bryant
The major employment industries in Bryant include Construction (76 | 29.5%), Retail Trade (40 | 15.5%), Manufacturing (39 | 15.1%), Agriculture, Fishing & Hunting (28 | 10.8%), and Health Care & Social Assistance (24 | 9.3%).
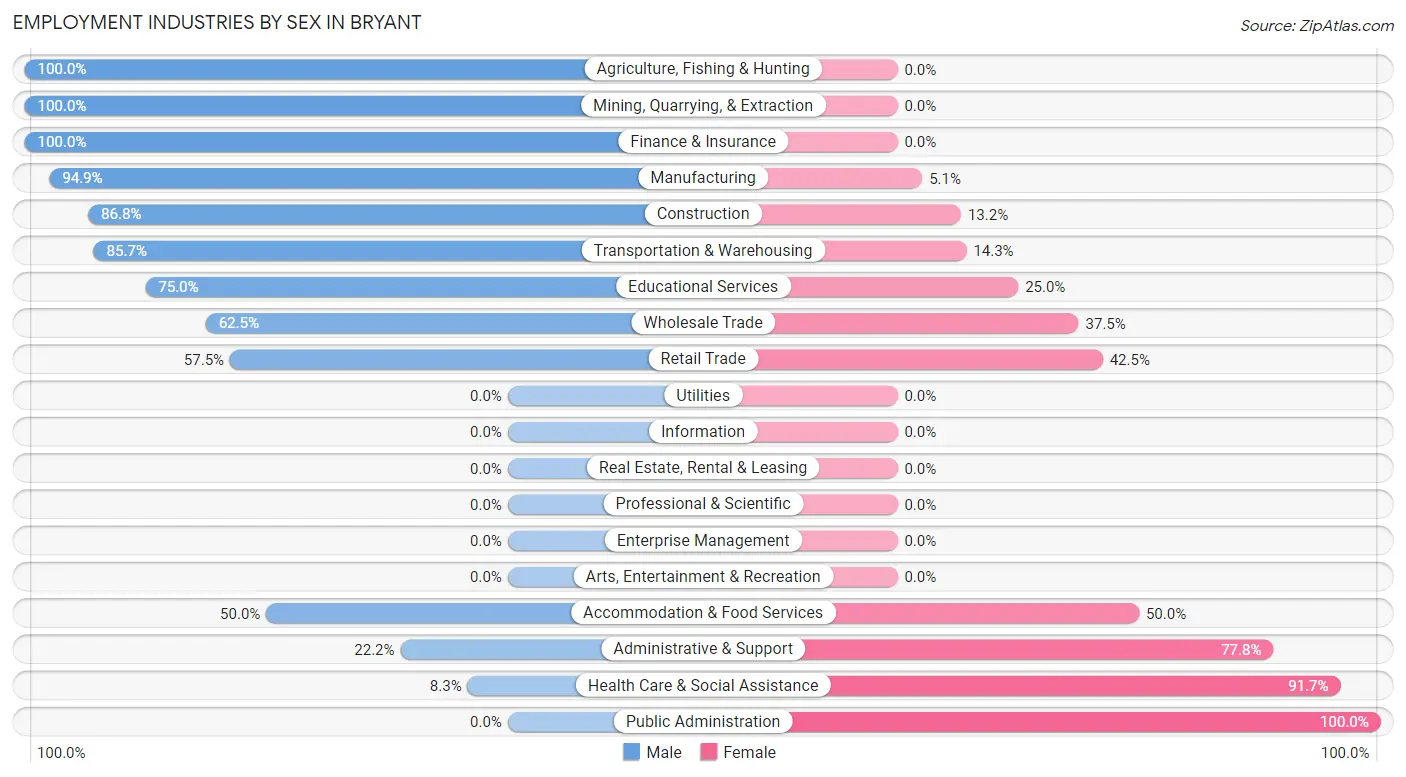
Employment Industries by Sex in Bryant
The Bryant industries that see more men than women are Agriculture, Fishing & Hunting (100.0%), Mining, Quarrying, & Extraction (100.0%), and Finance & Insurance (100.0%), whereas the industries that tend to have a higher number of women are Public Administration (100.0%), Health Care & Social Assistance (91.7%), and Administrative & Support (77.8%).
| Industry | Male | Female |
| Agriculture, Fishing & Hunting | 28 (100.0%) | 0 (0.0%) |
| Mining, Quarrying, & Extraction | 2 (100.0%) | 0 (0.0%) |
| Construction | 66 (86.8%) | 10 (13.2%) |
| Manufacturing | 37 (94.9%) | 2 (5.1%) |
| Wholesale Trade | 5 (62.5%) | 3 (37.5%) |
| Retail Trade | 23 (57.5%) | 17 (42.5%) |
| Transportation & Warehousing | 6 (85.7%) | 1 (14.3%) |
| Utilities | 0 (0.0%) | 0 (0.0%) |
| Information | 0 (0.0%) | 0 (0.0%) |
| Finance & Insurance | 1 (100.0%) | 0 (0.0%) |
| Real Estate, Rental & Leasing | 0 (0.0%) | 0 (0.0%) |
| Professional & Scientific | 0 (0.0%) | 0 (0.0%) |
| Enterprise Management | 0 (0.0%) | 0 (0.0%) |
| Administrative & Support | 2 (22.2%) | 7 (77.8%) |
| Educational Services | 6 (75.0%) | 2 (25.0%) |
| Health Care & Social Assistance | 2 (8.3%) | 22 (91.7%) |
| Arts, Entertainment & Recreation | 0 (0.0%) | 0 (0.0%) |
| Accommodation & Food Services | 4 (50.0%) | 4 (50.0%) |
| Public Administration | 0 (0.0%) | 2 (100.0%) |
| Total | 184 (71.3%) | 74 (28.7%) |
Education in Bryant
School Enrollment in Bryant
The most common levels of schooling among the 154 students in Bryant are elementary school (47 | 30.5%), middle school (32 | 20.8%), and high school (29 | 18.8%).
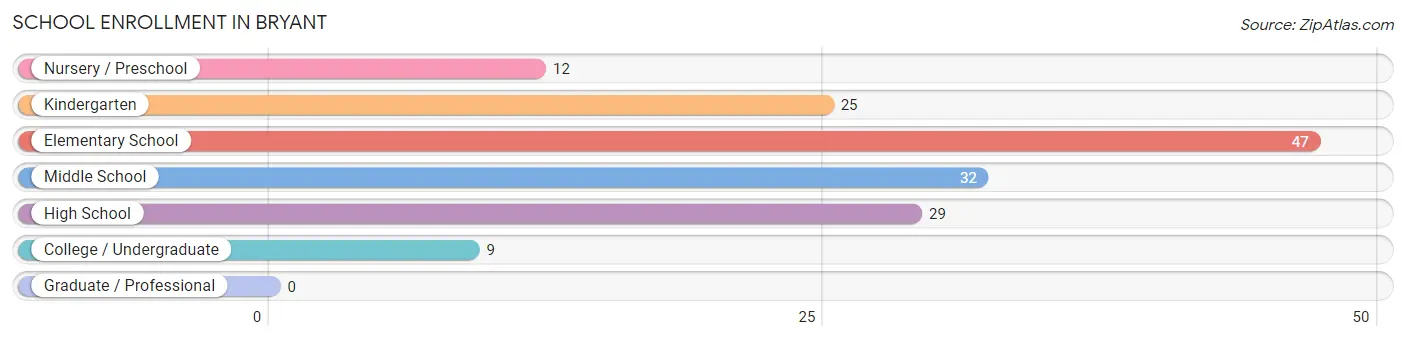
| School Level | # Students | % Students |
| Nursery / Preschool | 12 | 7.8% |
| Kindergarten | 25 | 16.2% |
| Elementary School | 47 | 30.5% |
| Middle School | 32 | 20.8% |
| High School | 29 | 18.8% |
| College / Undergraduate | 9 | 5.8% |
| Graduate / Professional | 0 | 0.0% |
| Total | 154 | 100.0% |
School Enrollment by Age by Funding Source in Bryant
Out of a total of 154 students who are enrolled in schools in Bryant, 5 (3.2%) attend a private institution, while the remaining 149 (96.8%) are enrolled in public schools. The age group of 5 to 9 year old has the highest likelihood of being enrolled in private schools, with 5 (7.6% in the age bracket) enrolled. Conversely, the age group of 3 to 4 year olds has the lowest likelihood of being enrolled in a private school, with 2 (100.0% in the age bracket) attending a public institution.
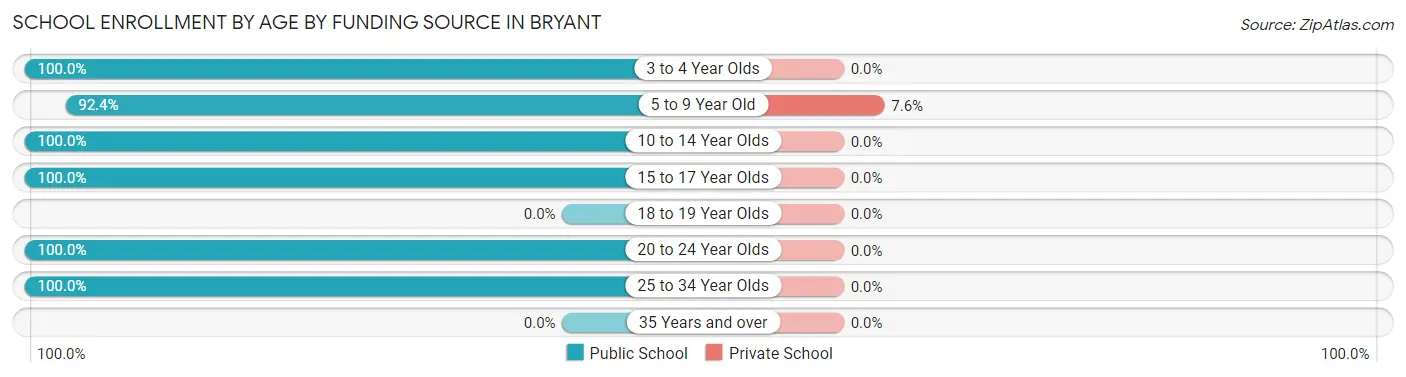
| Age Bracket | Public School | Private School |
| 3 to 4 Year Olds | 2 (100.0%) | 0 (0.0%) |
| 5 to 9 Year Old | 61 (92.4%) | 5 (7.6%) |
| 10 to 14 Year Olds | 49 (100.0%) | 0 (0.0%) |
| 15 to 17 Year Olds | 28 (100.0%) | 0 (0.0%) |
| 18 to 19 Year Olds | 0 (0.0%) | 0 (0.0%) |
| 20 to 24 Year Olds | 2 (100.0%) | 0 (0.0%) |
| 25 to 34 Year Olds | 7 (100.0%) | 0 (0.0%) |
| 35 Years and over | 0 (0.0%) | 0 (0.0%) |
| Total | 149 (96.8%) | 5 (3.2%) |
Educational Attainment by Field of Study in Bryant
Education (7 | 23.3%), social sciences (5 | 16.7%), science & technology (5 | 16.7%), arts & humanities (4 | 13.3%), and computers & mathematics (2 | 6.7%) are the most common fields of study among 30 individuals in Bryant who have obtained a bachelor's degree or higher.
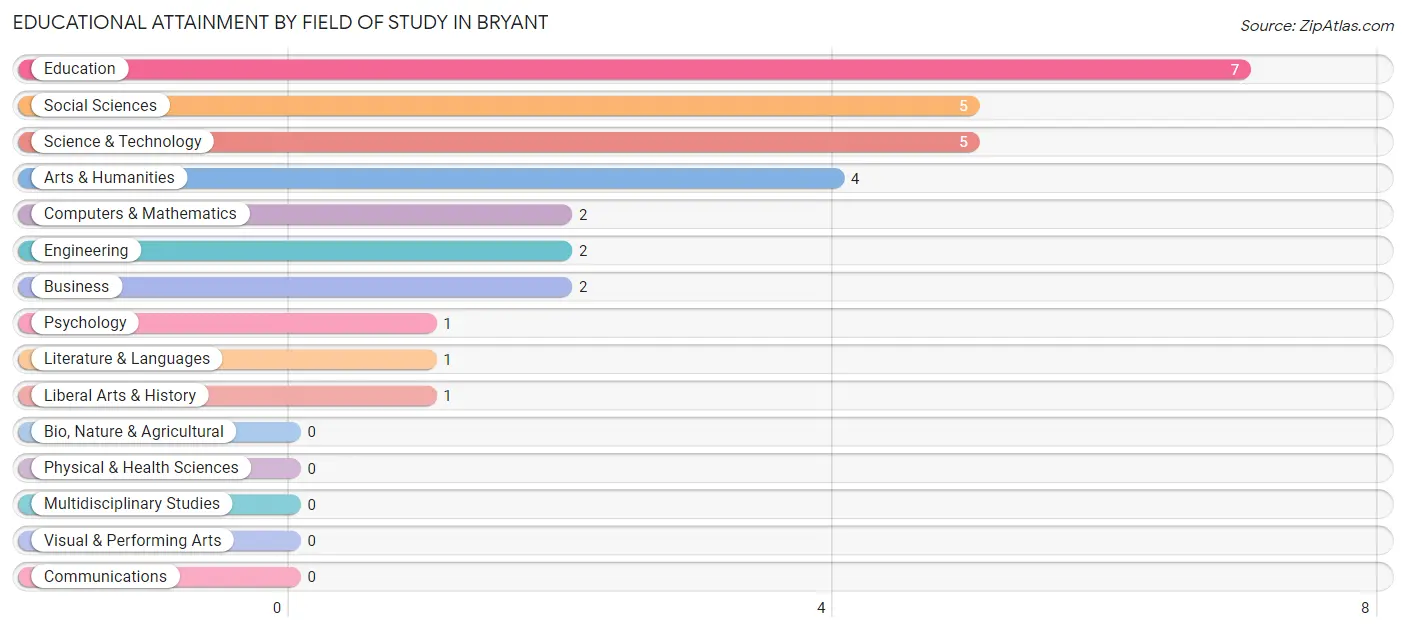
| Field of Study | # Graduates | % Graduates |
| Computers & Mathematics | 2 | 6.7% |
| Bio, Nature & Agricultural | 0 | 0.0% |
| Physical & Health Sciences | 0 | 0.0% |
| Psychology | 1 | 3.3% |
| Social Sciences | 5 | 16.7% |
| Engineering | 2 | 6.7% |
| Multidisciplinary Studies | 0 | 0.0% |
| Science & Technology | 5 | 16.7% |
| Business | 2 | 6.7% |
| Education | 7 | 23.3% |
| Literature & Languages | 1 | 3.3% |
| Liberal Arts & History | 1 | 3.3% |
| Visual & Performing Arts | 0 | 0.0% |
| Communications | 0 | 0.0% |
| Arts & Humanities | 4 | 13.3% |
| Total | 30 | 100.0% |
Transportation & Commute in Bryant
Vehicle Availability by Sex in Bryant
The most prevalent vehicle ownership categories in Bryant are males with 2 vehicles (78, accounting for 42.4%) and females with 2 vehicles (20, making up 105.4%).
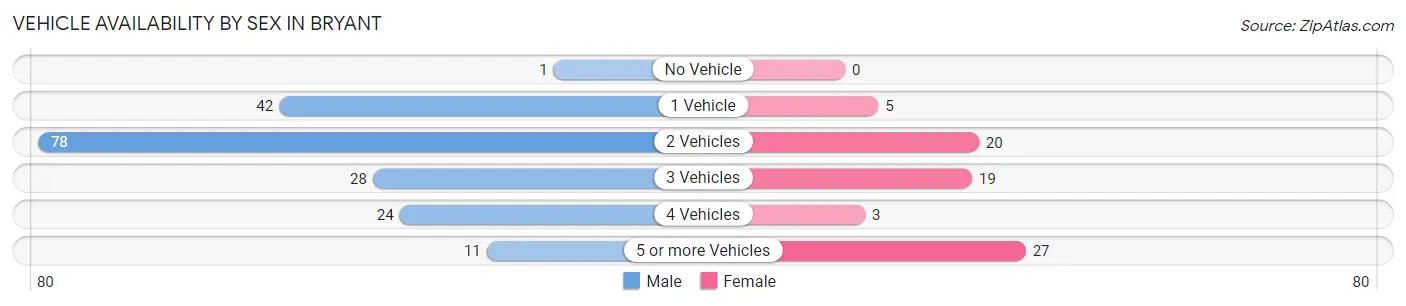
| Vehicles Available | Male | Female |
| No Vehicle | 1 (0.5%) | 0 (0.0%) |
| 1 Vehicle | 42 (22.8%) | 5 (6.8%) |
| 2 Vehicles | 78 (42.4%) | 20 (27.0%) |
| 3 Vehicles | 28 (15.2%) | 19 (25.7%) |
| 4 Vehicles | 24 (13.0%) | 3 (4.1%) |
| 5 or more Vehicles | 11 (6.0%) | 27 (36.5%) |
| Total | 184 (100.0%) | 74 (100.0%) |
Commute Time in Bryant
The most frequently occuring commute durations in Bryant are 10 to 14 minutes (52 commuters, 20.2%), less than 5 minutes (51 commuters, 19.8%), and 15 to 19 minutes (50 commuters, 19.4%).
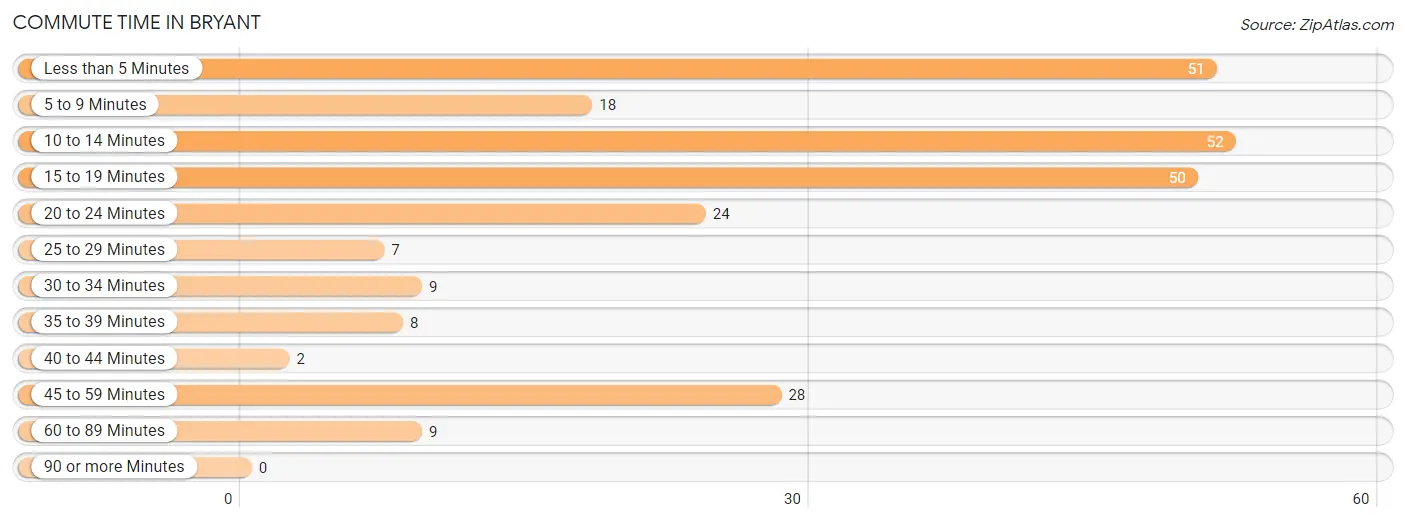
| Commute Time | # Commuters | % Commuters |
| Less than 5 Minutes | 51 | 19.8% |
| 5 to 9 Minutes | 18 | 7.0% |
| 10 to 14 Minutes | 52 | 20.2% |
| 15 to 19 Minutes | 50 | 19.4% |
| 20 to 24 Minutes | 24 | 9.3% |
| 25 to 29 Minutes | 7 | 2.7% |
| 30 to 34 Minutes | 9 | 3.5% |
| 35 to 39 Minutes | 8 | 3.1% |
| 40 to 44 Minutes | 2 | 0.8% |
| 45 to 59 Minutes | 28 | 10.8% |
| 60 to 89 Minutes | 9 | 3.5% |
| 90 or more Minutes | 0 | 0.0% |
Commute Time by Sex in Bryant
The most common commute times in Bryant are 10 to 14 minutes (42 commuters, 22.8%) for males and 45 to 59 minutes (20 commuters, 27.0%) for females.
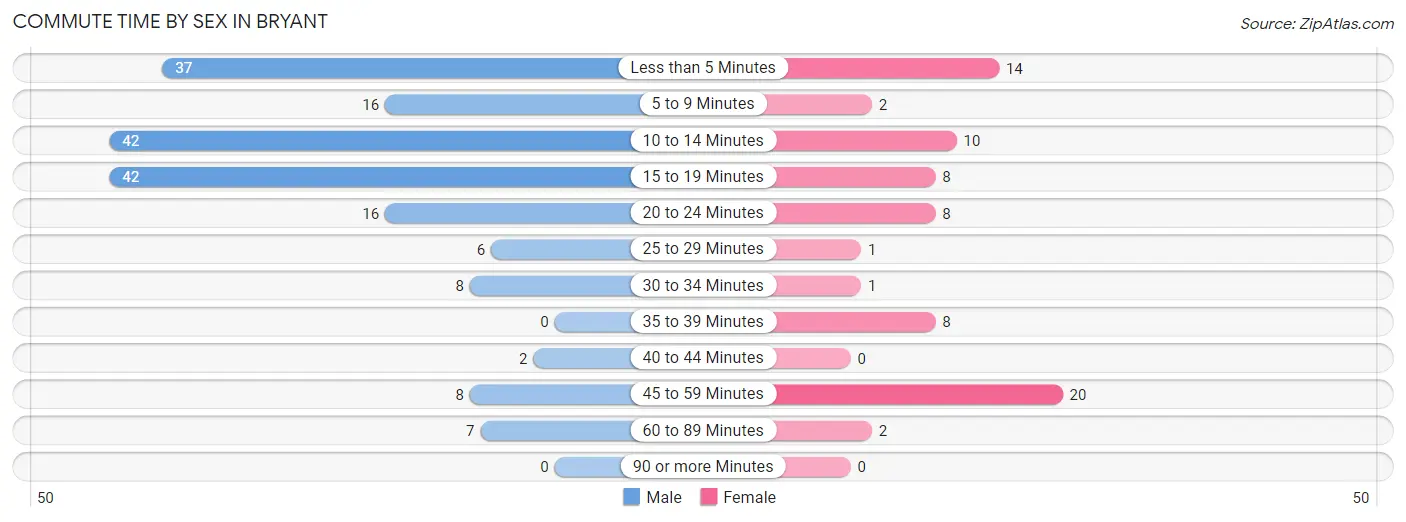
| Commute Time | Male | Female |
| Less than 5 Minutes | 37 (20.1%) | 14 (18.9%) |
| 5 to 9 Minutes | 16 (8.7%) | 2 (2.7%) |
| 10 to 14 Minutes | 42 (22.8%) | 10 (13.5%) |
| 15 to 19 Minutes | 42 (22.8%) | 8 (10.8%) |
| 20 to 24 Minutes | 16 (8.7%) | 8 (10.8%) |
| 25 to 29 Minutes | 6 (3.3%) | 1 (1.3%) |
| 30 to 34 Minutes | 8 (4.3%) | 1 (1.3%) |
| 35 to 39 Minutes | 0 (0.0%) | 8 (10.8%) |
| 40 to 44 Minutes | 2 (1.1%) | 0 (0.0%) |
| 45 to 59 Minutes | 8 (4.3%) | 20 (27.0%) |
| 60 to 89 Minutes | 7 (3.8%) | 2 (2.7%) |
| 90 or more Minutes | 0 (0.0%) | 0 (0.0%) |
Time of Departure to Work by Sex in Bryant
The most frequent times of departure to work in Bryant are 6:30 AM to 6:59 AM (46, 25.0%) for males and 7:00 AM to 7:29 AM (16, 21.6%) for females.
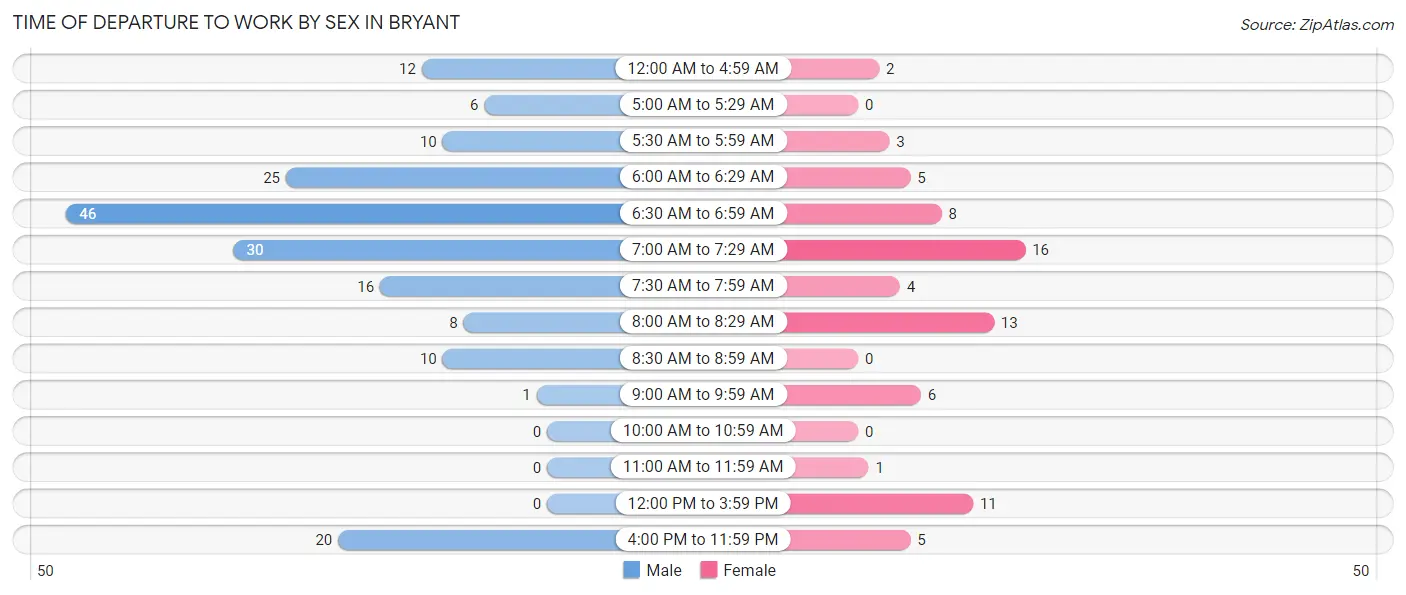
| Time of Departure | Male | Female |
| 12:00 AM to 4:59 AM | 12 (6.5%) | 2 (2.7%) |
| 5:00 AM to 5:29 AM | 6 (3.3%) | 0 (0.0%) |
| 5:30 AM to 5:59 AM | 10 (5.4%) | 3 (4.1%) |
| 6:00 AM to 6:29 AM | 25 (13.6%) | 5 (6.8%) |
| 6:30 AM to 6:59 AM | 46 (25.0%) | 8 (10.8%) |
| 7:00 AM to 7:29 AM | 30 (16.3%) | 16 (21.6%) |
| 7:30 AM to 7:59 AM | 16 (8.7%) | 4 (5.4%) |
| 8:00 AM to 8:29 AM | 8 (4.3%) | 13 (17.6%) |
| 8:30 AM to 8:59 AM | 10 (5.4%) | 0 (0.0%) |
| 9:00 AM to 9:59 AM | 1 (0.5%) | 6 (8.1%) |
| 10:00 AM to 10:59 AM | 0 (0.0%) | 0 (0.0%) |
| 11:00 AM to 11:59 AM | 0 (0.0%) | 1 (1.3%) |
| 12:00 PM to 3:59 PM | 0 (0.0%) | 11 (14.9%) |
| 4:00 PM to 11:59 PM | 20 (10.9%) | 5 (6.8%) |
| Total | 184 (100.0%) | 74 (100.0%) |
Housing Occupancy in Bryant
Occupancy by Ownership in Bryant
Of the total 219 dwellings in Bryant, owner-occupied units account for 147 (67.1%), while renter-occupied units make up 72 (32.9%).
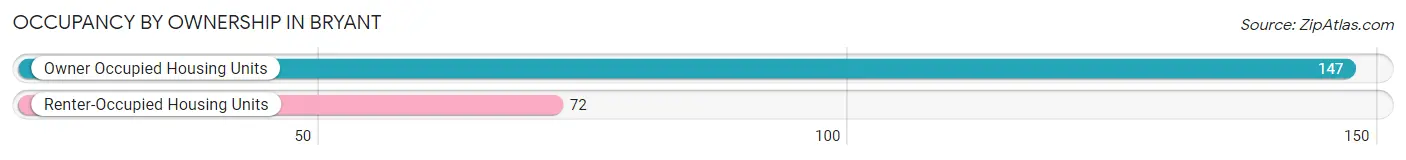
| Occupancy | # Housing Units | % Housing Units |
| Owner Occupied Housing Units | 147 | 67.1% |
| Renter-Occupied Housing Units | 72 | 32.9% |
| Total Occupied Housing Units | 219 | 100.0% |
Occupancy by Household Size in Bryant
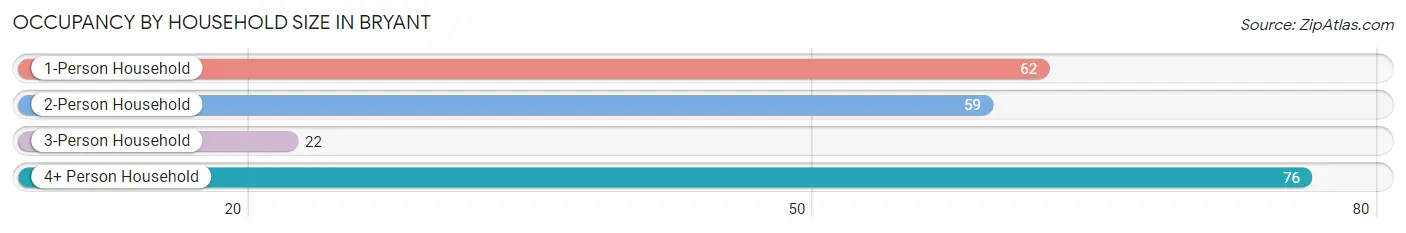
| Household Size | # Housing Units | % Housing Units |
| 1-Person Household | 62 | 28.3% |
| 2-Person Household | 59 | 26.9% |
| 3-Person Household | 22 | 10.1% |
| 4+ Person Household | 76 | 34.7% |
| Total Housing Units | 219 | 100.0% |
Occupancy by Ownership by Household Size in Bryant
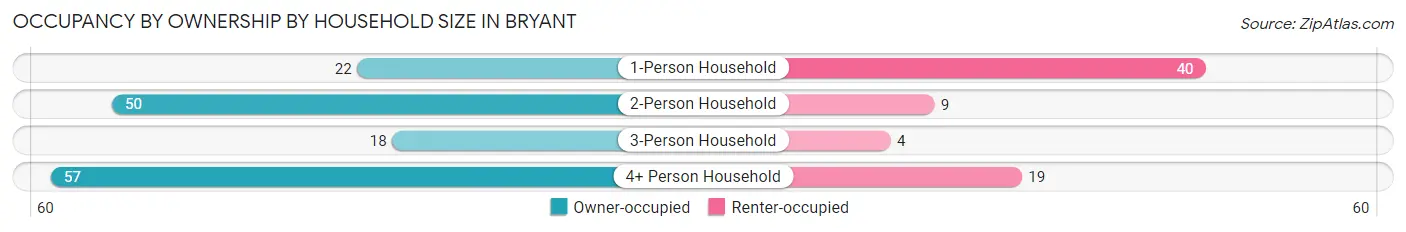
| Household Size | Owner-occupied | Renter-occupied |
| 1-Person Household | 22 (35.5%) | 40 (64.5%) |
| 2-Person Household | 50 (84.8%) | 9 (15.2%) |
| 3-Person Household | 18 (81.8%) | 4 (18.2%) |
| 4+ Person Household | 57 (75.0%) | 19 (25.0%) |
| Total Housing Units | 147 (67.1%) | 72 (32.9%) |
Occupancy by Educational Attainment in Bryant
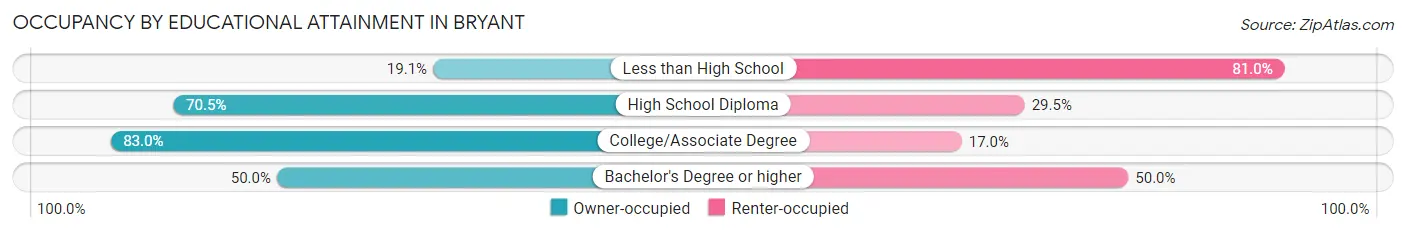
| Household Size | Owner-occupied | Renter-occupied |
| Less than High School | 4 (19.1%) | 17 (80.9%) |
| High School Diploma | 91 (70.5%) | 38 (29.5%) |
| College/Associate Degree | 44 (83.0%) | 9 (17.0%) |
| Bachelor's Degree or higher | 8 (50.0%) | 8 (50.0%) |
Occupancy by Age of Householder in Bryant
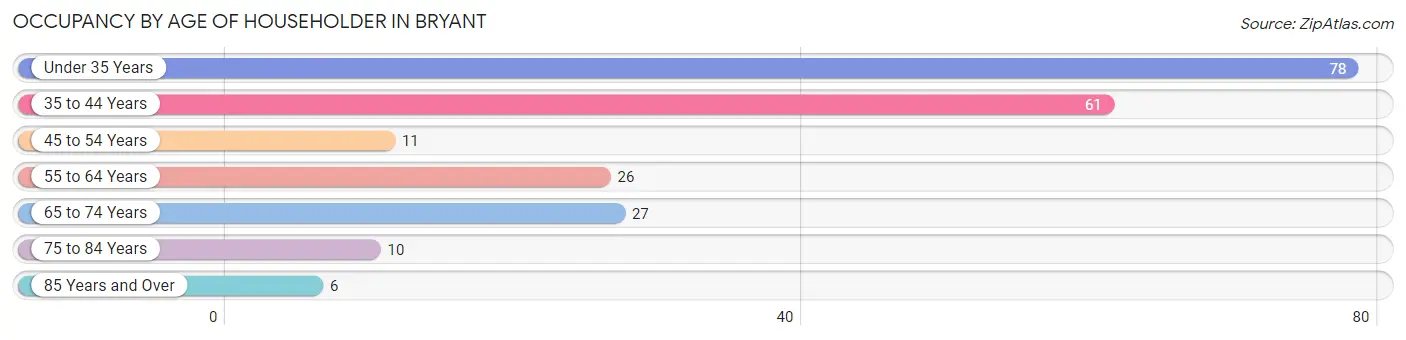
| Age Bracket | # Households | % Households |
| Under 35 Years | 78 | 35.6% |
| 35 to 44 Years | 61 | 27.9% |
| 45 to 54 Years | 11 | 5.0% |
| 55 to 64 Years | 26 | 11.9% |
| 65 to 74 Years | 27 | 12.3% |
| 75 to 84 Years | 10 | 4.6% |
| 85 Years and Over | 6 | 2.7% |
| Total | 219 | 100.0% |
Housing Finances in Bryant
Median Income by Occupancy in Bryant
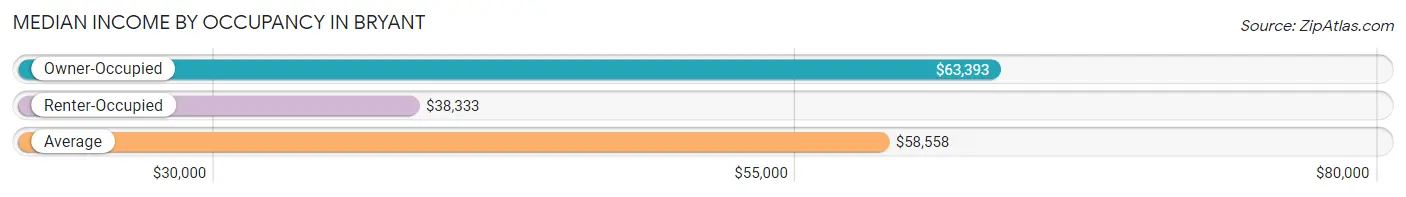
| Occupancy Type | # Households | Median Income |
| Owner-Occupied | 147 (67.1%) | $63,393 |
| Renter-Occupied | 72 (32.9%) | $38,333 |
| Average | 219 (100.0%) | $58,558 |
Occupancy by Householder Income Bracket in Bryant
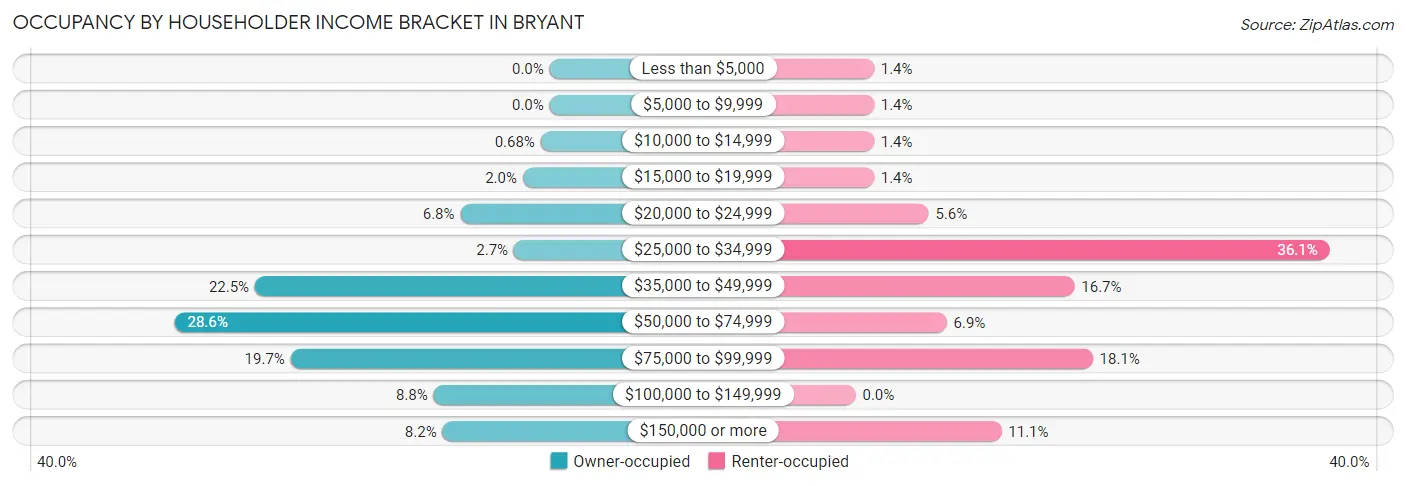
| Income Bracket | Owner-occupied | Renter-occupied |
| Less than $5,000 | 0 (0.0%) | 1 (1.4%) |
| $5,000 to $9,999 | 0 (0.0%) | 1 (1.4%) |
| $10,000 to $14,999 | 1 (0.7%) | 1 (1.4%) |
| $15,000 to $19,999 | 3 (2.0%) | 1 (1.4%) |
| $20,000 to $24,999 | 10 (6.8%) | 4 (5.6%) |
| $25,000 to $34,999 | 4 (2.7%) | 26 (36.1%) |
| $35,000 to $49,999 | 33 (22.5%) | 12 (16.7%) |
| $50,000 to $74,999 | 42 (28.6%) | 5 (6.9%) |
| $75,000 to $99,999 | 29 (19.7%) | 13 (18.1%) |
| $100,000 to $149,999 | 13 (8.8%) | 0 (0.0%) |
| $150,000 or more | 12 (8.2%) | 8 (11.1%) |
| Total | 147 (100.0%) | 72 (100.0%) |
Monthly Housing Cost Tiers in Bryant
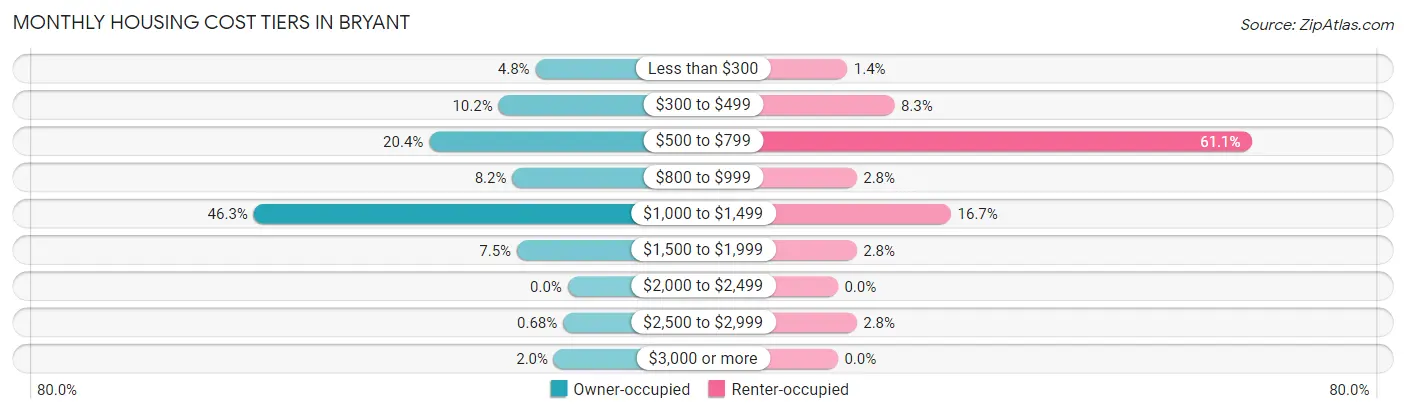
| Monthly Cost | Owner-occupied | Renter-occupied |
| Less than $300 | 7 (4.8%) | 1 (1.4%) |
| $300 to $499 | 15 (10.2%) | 6 (8.3%) |
| $500 to $799 | 30 (20.4%) | 44 (61.1%) |
| $800 to $999 | 12 (8.2%) | 2 (2.8%) |
| $1,000 to $1,499 | 68 (46.3%) | 12 (16.7%) |
| $1,500 to $1,999 | 11 (7.5%) | 2 (2.8%) |
| $2,000 to $2,499 | 0 (0.0%) | 0 (0.0%) |
| $2,500 to $2,999 | 1 (0.7%) | 2 (2.8%) |
| $3,000 or more | 3 (2.0%) | 0 (0.0%) |
| Total | 147 (100.0%) | 72 (100.0%) |
Physical Housing Characteristics in Bryant
Housing Structures in Bryant
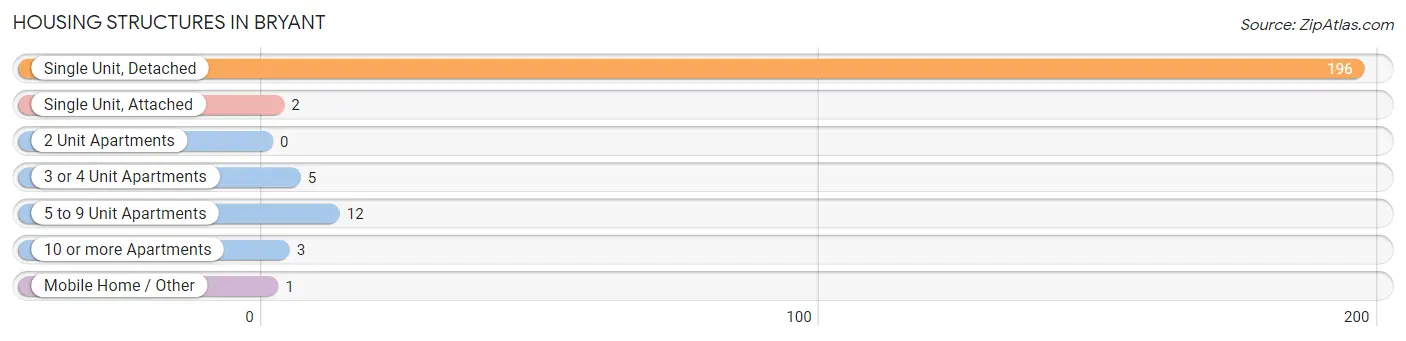
| Structure Type | # Housing Units | % Housing Units |
| Single Unit, Detached | 196 | 89.5% |
| Single Unit, Attached | 2 | 0.9% |
| 2 Unit Apartments | 0 | 0.0% |
| 3 or 4 Unit Apartments | 5 | 2.3% |
| 5 to 9 Unit Apartments | 12 | 5.5% |
| 10 or more Apartments | 3 | 1.4% |
| Mobile Home / Other | 1 | 0.5% |
| Total | 219 | 100.0% |
Housing Structures by Occupancy in Bryant
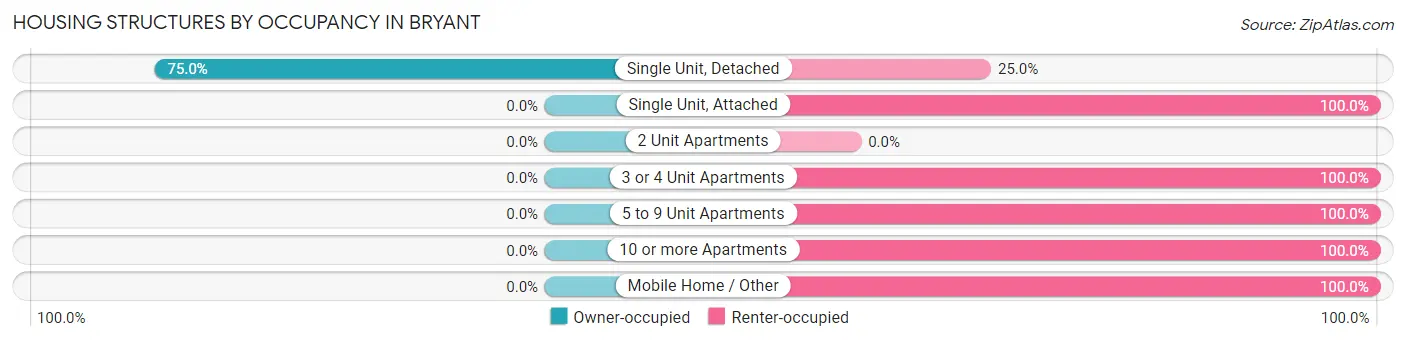
| Structure Type | Owner-occupied | Renter-occupied |
| Single Unit, Detached | 147 (75.0%) | 49 (25.0%) |
| Single Unit, Attached | 0 (0.0%) | 2 (100.0%) |
| 2 Unit Apartments | 0 (0.0%) | 0 (0.0%) |
| 3 or 4 Unit Apartments | 0 (0.0%) | 5 (100.0%) |
| 5 to 9 Unit Apartments | 0 (0.0%) | 12 (100.0%) |
| 10 or more Apartments | 0 (0.0%) | 3 (100.0%) |
| Mobile Home / Other | 0 (0.0%) | 1 (100.0%) |
| Total | 147 (67.1%) | 72 (32.9%) |
Housing Structures by Number of Rooms in Bryant
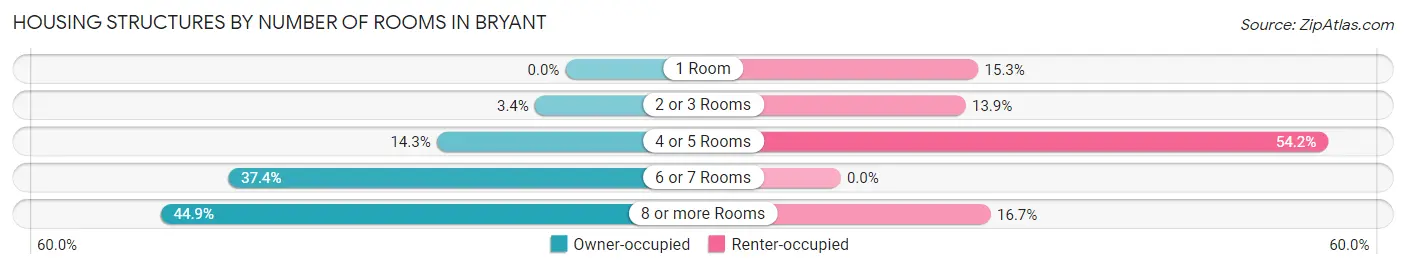
| Number of Rooms | Owner-occupied | Renter-occupied |
| 1 Room | 0 (0.0%) | 11 (15.3%) |
| 2 or 3 Rooms | 5 (3.4%) | 10 (13.9%) |
| 4 or 5 Rooms | 21 (14.3%) | 39 (54.2%) |
| 6 or 7 Rooms | 55 (37.4%) | 0 (0.0%) |
| 8 or more Rooms | 66 (44.9%) | 12 (16.7%) |
| Total | 147 (100.0%) | 72 (100.0%) |
Housing Structure by Heating Type in Bryant
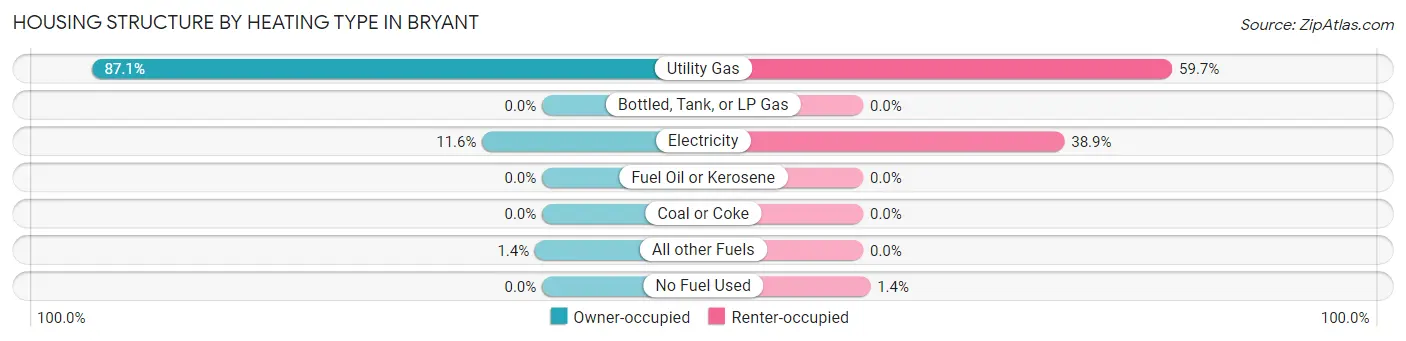
| Heating Type | Owner-occupied | Renter-occupied |
| Utility Gas | 128 (87.1%) | 43 (59.7%) |
| Bottled, Tank, or LP Gas | 0 (0.0%) | 0 (0.0%) |
| Electricity | 17 (11.6%) | 28 (38.9%) |
| Fuel Oil or Kerosene | 0 (0.0%) | 0 (0.0%) |
| Coal or Coke | 0 (0.0%) | 0 (0.0%) |
| All other Fuels | 2 (1.4%) | 0 (0.0%) |
| No Fuel Used | 0 (0.0%) | 1 (1.4%) |
| Total | 147 (100.0%) | 72 (100.0%) |
Household Vehicle Usage in Bryant
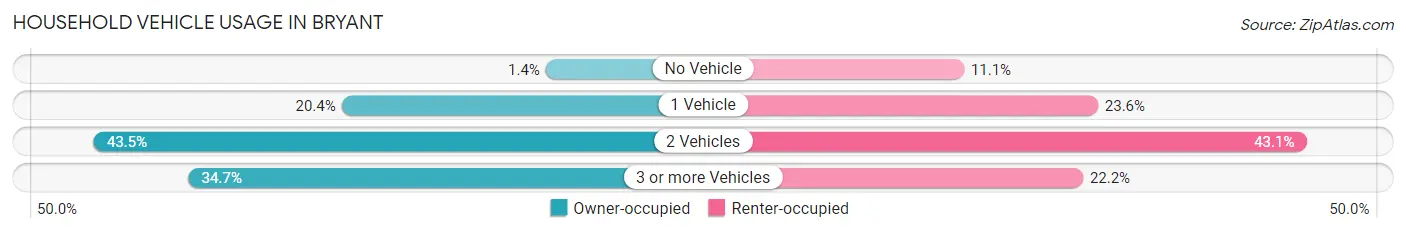
| Vehicles per Household | Owner-occupied | Renter-occupied |
| No Vehicle | 2 (1.4%) | 8 (11.1%) |
| 1 Vehicle | 30 (20.4%) | 17 (23.6%) |
| 2 Vehicles | 64 (43.5%) | 31 (43.1%) |
| 3 or more Vehicles | 51 (34.7%) | 16 (22.2%) |
| Total | 147 (100.0%) | 72 (100.0%) |
Real Estate & Mortgages in Bryant
Real Estate and Mortgage Overview in Bryant
| Characteristic | Without Mortgage | With Mortgage |
| Housing Units | 42 | 105 |
| Median Property Value | $152,500 | $114,000 |
| Median Household Income | $64,375 | $6 |
| Monthly Housing Costs | $571 | $3 |
| Real Estate Taxes | $1,800 | $0 |
Property Value by Mortgage Status in Bryant
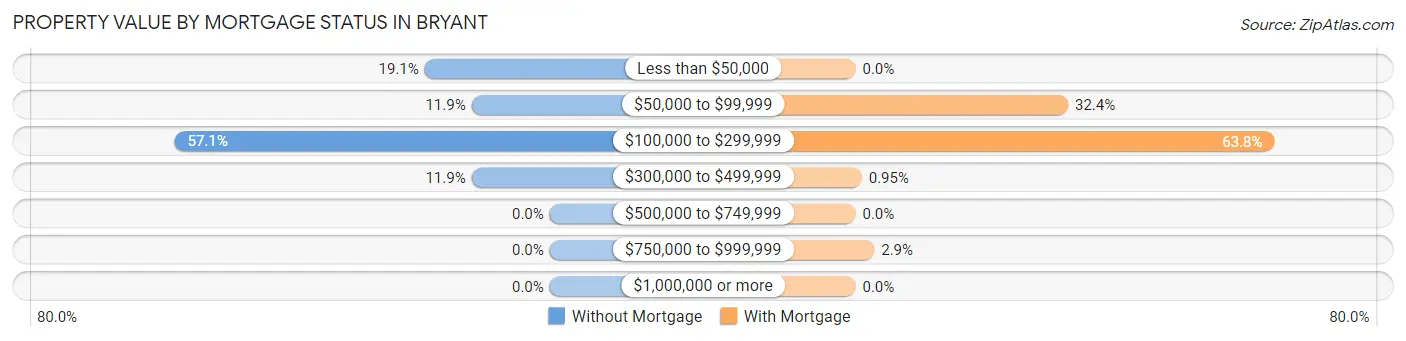
| Property Value | Without Mortgage | With Mortgage |
| Less than $50,000 | 8 (19.1%) | 0 (0.0%) |
| $50,000 to $99,999 | 5 (11.9%) | 34 (32.4%) |
| $100,000 to $299,999 | 24 (57.1%) | 67 (63.8%) |
| $300,000 to $499,999 | 5 (11.9%) | 1 (0.9%) |
| $500,000 to $749,999 | 0 (0.0%) | 0 (0.0%) |
| $750,000 to $999,999 | 0 (0.0%) | 3 (2.9%) |
| $1,000,000 or more | 0 (0.0%) | 0 (0.0%) |
| Total | 42 (100.0%) | 105 (100.0%) |
Household Income by Mortgage Status in Bryant
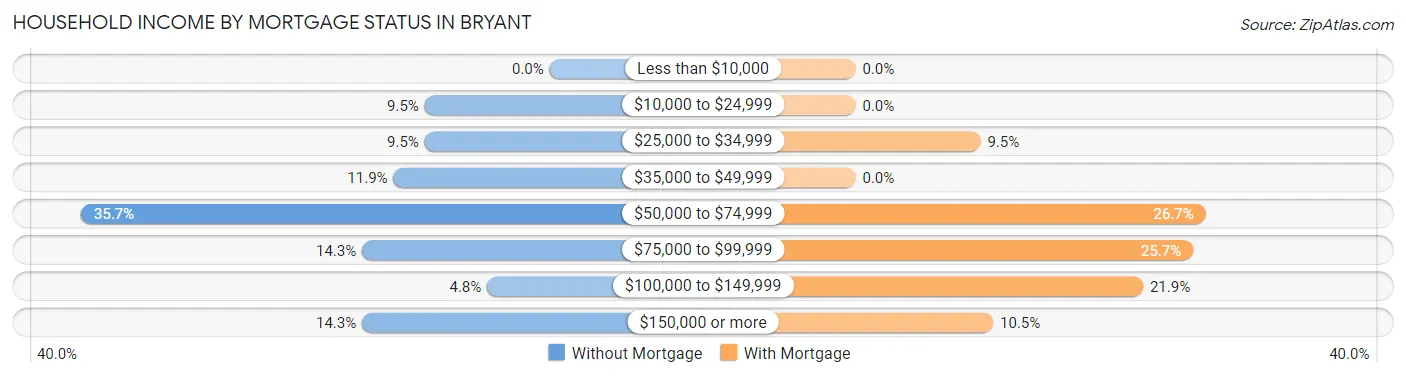
| Household Income | Without Mortgage | With Mortgage |
| Less than $10,000 | 0 (0.0%) | 0 (0.0%) |
| $10,000 to $24,999 | 4 (9.5%) | 0 (0.0%) |
| $25,000 to $34,999 | 4 (9.5%) | 10 (9.5%) |
| $35,000 to $49,999 | 5 (11.9%) | 0 (0.0%) |
| $50,000 to $74,999 | 15 (35.7%) | 28 (26.7%) |
| $75,000 to $99,999 | 6 (14.3%) | 27 (25.7%) |
| $100,000 to $149,999 | 2 (4.8%) | 23 (21.9%) |
| $150,000 or more | 6 (14.3%) | 11 (10.5%) |
| Total | 42 (100.0%) | 105 (100.0%) |
Property Value to Household Income Ratio in Bryant
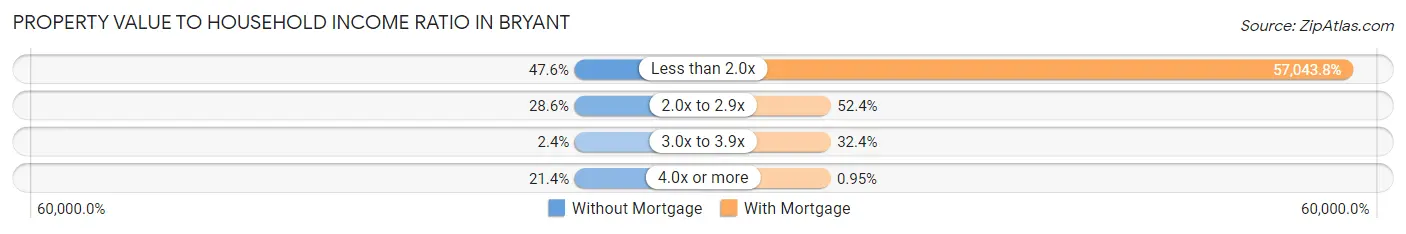
| Value-to-Income Ratio | Without Mortgage | With Mortgage |
| Less than 2.0x | 20 (47.6%) | 59,896 (57,043.8%) |
| 2.0x to 2.9x | 12 (28.6%) | 55 (52.4%) |
| 3.0x to 3.9x | 1 (2.4%) | 34 (32.4%) |
| 4.0x or more | 9 (21.4%) | 1 (0.9%) |
| Total | 42 (100.0%) | 105 (100.0%) |
Real Estate Taxes by Mortgage Status in Bryant
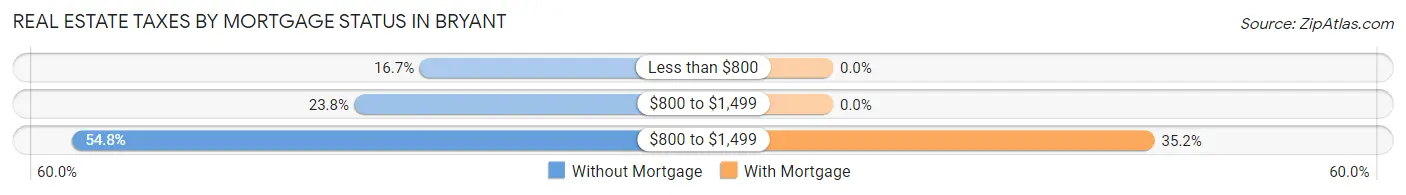
| Property Taxes | Without Mortgage | With Mortgage |
| Less than $800 | 7 (16.7%) | 0 (0.0%) |
| $800 to $1,499 | 10 (23.8%) | 0 (0.0%) |
| $800 to $1,499 | 23 (54.8%) | 37 (35.2%) |
| Total | 42 (100.0%) | 105 (100.0%) |
Health & Disability in Bryant
Health Insurance Coverage by Age in Bryant
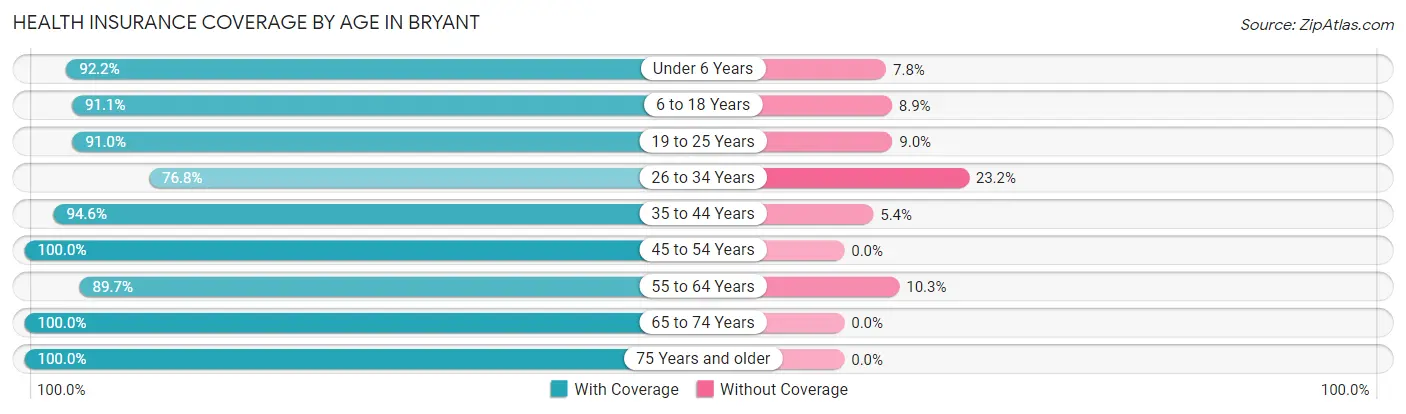
| Age Bracket | With Coverage | Without Coverage |
| Under 6 Years | 142 (92.2%) | 12 (7.8%) |
| 6 to 18 Years | 113 (91.1%) | 11 (8.9%) |
| 19 to 25 Years | 122 (91.0%) | 12 (9.0%) |
| 26 to 34 Years | 43 (76.8%) | 13 (23.2%) |
| 35 to 44 Years | 70 (94.6%) | 4 (5.4%) |
| 45 to 54 Years | 20 (100.0%) | 0 (0.0%) |
| 55 to 64 Years | 35 (89.7%) | 4 (10.3%) |
| 65 to 74 Years | 40 (100.0%) | 0 (0.0%) |
| 75 Years and older | 25 (100.0%) | 0 (0.0%) |
| Total | 610 (91.6%) | 56 (8.4%) |
Health Insurance Coverage by Citizenship Status in Bryant
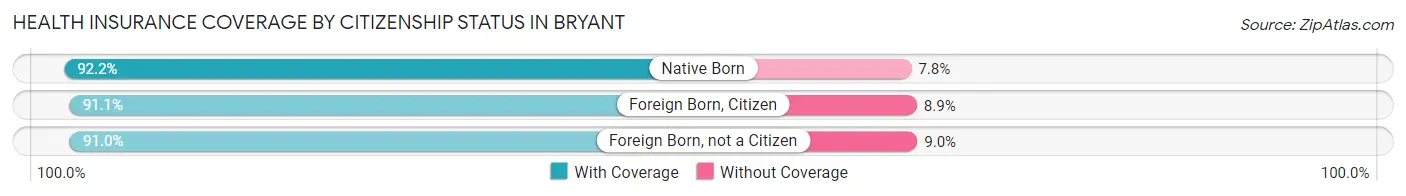
| Citizenship Status | With Coverage | Without Coverage |
| Native Born | 142 (92.2%) | 12 (7.8%) |
| Foreign Born, Citizen | 113 (91.1%) | 11 (8.9%) |
| Foreign Born, not a Citizen | 122 (91.0%) | 12 (9.0%) |
Health Insurance Coverage by Household Income in Bryant
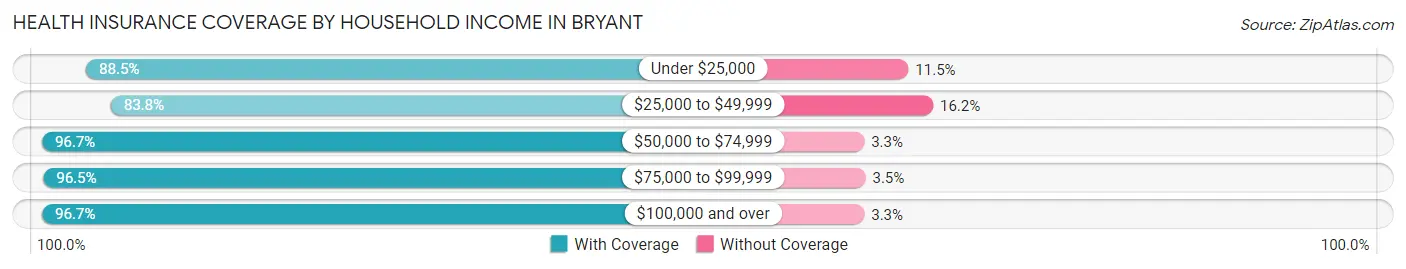
| Household Income | With Coverage | Without Coverage |
| Under $25,000 | 46 (88.5%) | 6 (11.5%) |
| $25,000 to $49,999 | 192 (83.8%) | 37 (16.2%) |
| $50,000 to $74,999 | 89 (96.7%) | 3 (3.3%) |
| $75,000 to $99,999 | 165 (96.5%) | 6 (3.5%) |
| $100,000 and over | 118 (96.7%) | 4 (3.3%) |
Public vs Private Health Insurance Coverage by Age in Bryant
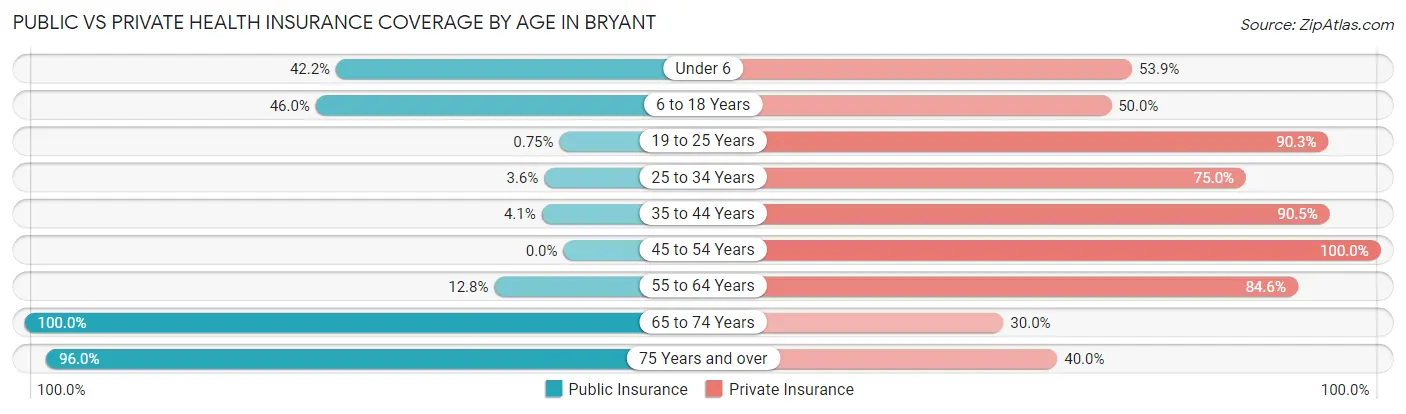
| Age Bracket | Public Insurance | Private Insurance |
| Under 6 | 65 (42.2%) | 83 (53.9%) |
| 6 to 18 Years | 57 (46.0%) | 62 (50.0%) |
| 19 to 25 Years | 1 (0.7%) | 121 (90.3%) |
| 25 to 34 Years | 2 (3.6%) | 42 (75.0%) |
| 35 to 44 Years | 3 (4.1%) | 67 (90.5%) |
| 45 to 54 Years | 0 (0.0%) | 20 (100.0%) |
| 55 to 64 Years | 5 (12.8%) | 33 (84.6%) |
| 65 to 74 Years | 40 (100.0%) | 12 (30.0%) |
| 75 Years and over | 24 (96.0%) | 10 (40.0%) |
| Total | 197 (29.6%) | 450 (67.6%) |
Disability Status by Sex by Age in Bryant
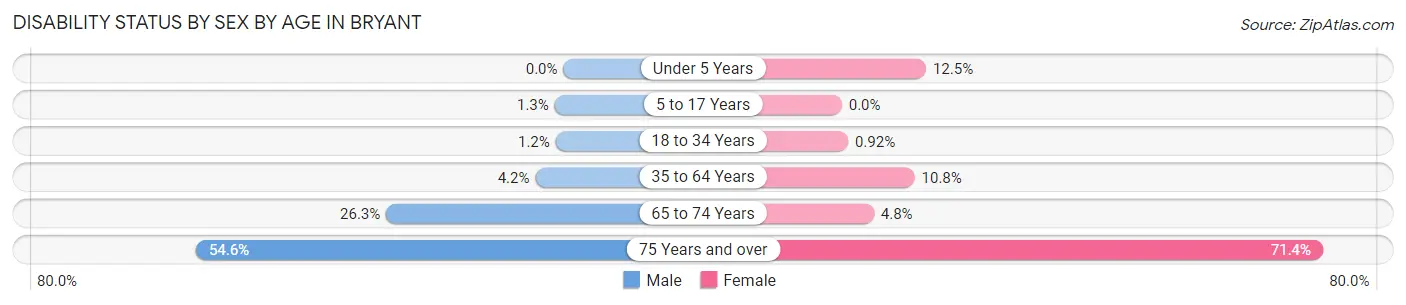
| Age Bracket | Male | Female |
| Under 5 Years | 0 (0.0%) | 6 (12.5%) |
| 5 to 17 Years | 1 (1.3%) | 0 (0.0%) |
| 18 to 34 Years | 1 (1.1%) | 1 (0.9%) |
| 35 to 64 Years | 4 (4.2%) | 4 (10.8%) |
| 65 to 74 Years | 5 (26.3%) | 1 (4.8%) |
| 75 Years and over | 6 (54.5%) | 10 (71.4%) |
Disability Class by Sex by Age in Bryant
Disability Class: Hearing Difficulty
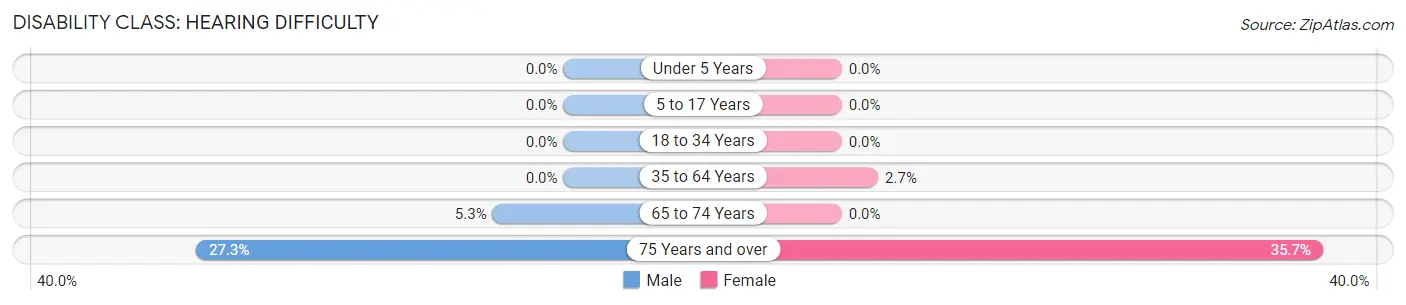
| Age Bracket | Male | Female |
| Under 5 Years | 0 (0.0%) | 0 (0.0%) |
| 5 to 17 Years | 0 (0.0%) | 0 (0.0%) |
| 18 to 34 Years | 0 (0.0%) | 0 (0.0%) |
| 35 to 64 Years | 0 (0.0%) | 1 (2.7%) |
| 65 to 74 Years | 1 (5.3%) | 0 (0.0%) |
| 75 Years and over | 3 (27.3%) | 5 (35.7%) |
Disability Class: Vision Difficulty
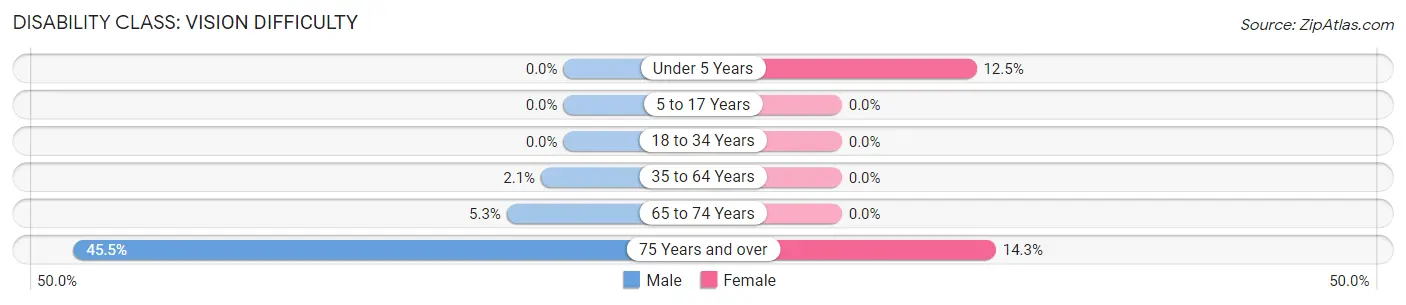
| Age Bracket | Male | Female |
| Under 5 Years | 0 (0.0%) | 6 (12.5%) |
| 5 to 17 Years | 0 (0.0%) | 0 (0.0%) |
| 18 to 34 Years | 0 (0.0%) | 0 (0.0%) |
| 35 to 64 Years | 2 (2.1%) | 0 (0.0%) |
| 65 to 74 Years | 1 (5.3%) | 0 (0.0%) |
| 75 Years and over | 5 (45.5%) | 2 (14.3%) |
Disability Class: Cognitive Difficulty
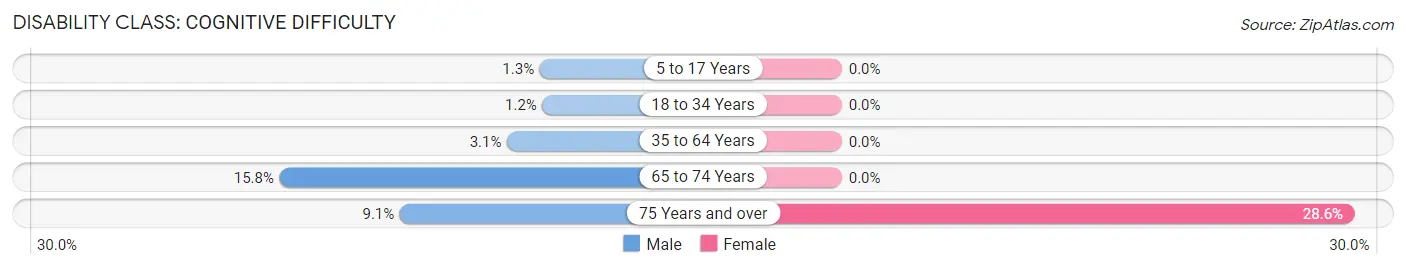
| Age Bracket | Male | Female |
| 5 to 17 Years | 1 (1.3%) | 0 (0.0%) |
| 18 to 34 Years | 1 (1.1%) | 0 (0.0%) |
| 35 to 64 Years | 3 (3.1%) | 0 (0.0%) |
| 65 to 74 Years | 3 (15.8%) | 0 (0.0%) |
| 75 Years and over | 1 (9.1%) | 4 (28.6%) |
Disability Class: Ambulatory Difficulty
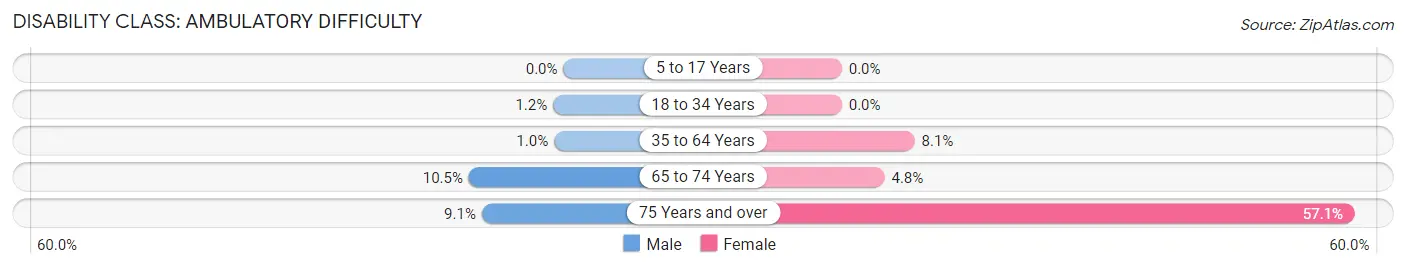
| Age Bracket | Male | Female |
| 5 to 17 Years | 0 (0.0%) | 0 (0.0%) |
| 18 to 34 Years | 1 (1.1%) | 0 (0.0%) |
| 35 to 64 Years | 1 (1.0%) | 3 (8.1%) |
| 65 to 74 Years | 2 (10.5%) | 1 (4.8%) |
| 75 Years and over | 1 (9.1%) | 8 (57.1%) |
Disability Class: Self-Care Difficulty
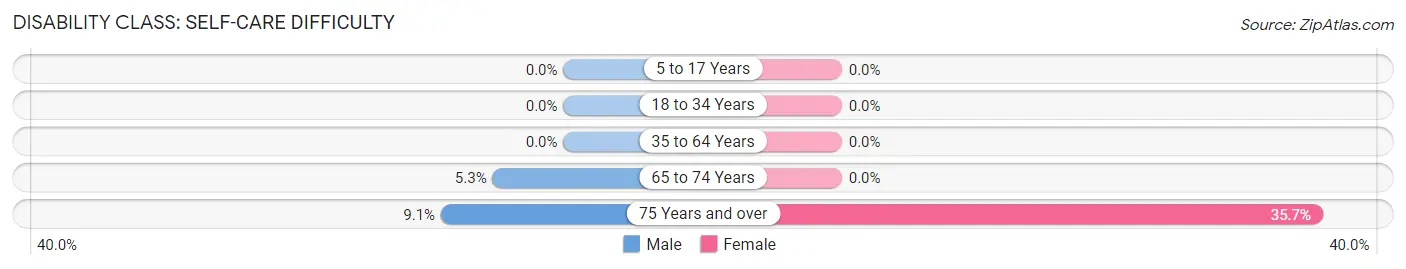
| Age Bracket | Male | Female |
| 5 to 17 Years | 0 (0.0%) | 0 (0.0%) |
| 18 to 34 Years | 0 (0.0%) | 0 (0.0%) |
| 35 to 64 Years | 0 (0.0%) | 0 (0.0%) |
| 65 to 74 Years | 1 (5.3%) | 0 (0.0%) |
| 75 Years and over | 1 (9.1%) | 5 (35.7%) |
Technology Access in Bryant
Computing Device Access in Bryant
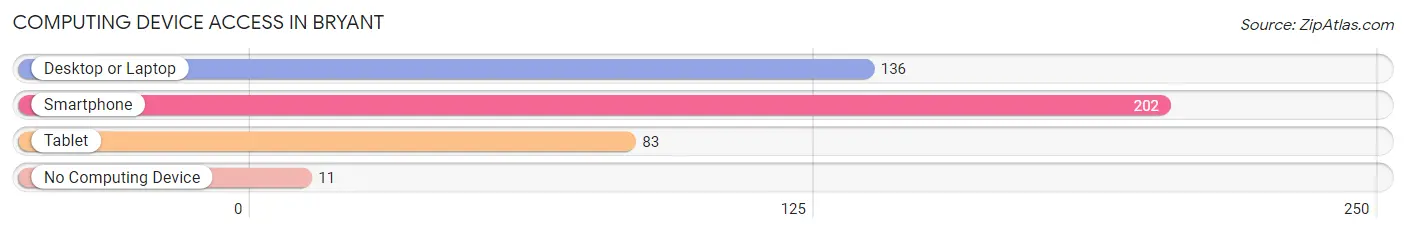
| Device Type | # Households | % Households |
| Desktop or Laptop | 136 | 62.1% |
| Smartphone | 202 | 92.2% |
| Tablet | 83 | 37.9% |
| No Computing Device | 11 | 5.0% |
| Total | 219 | 100.0% |
Internet Access in Bryant
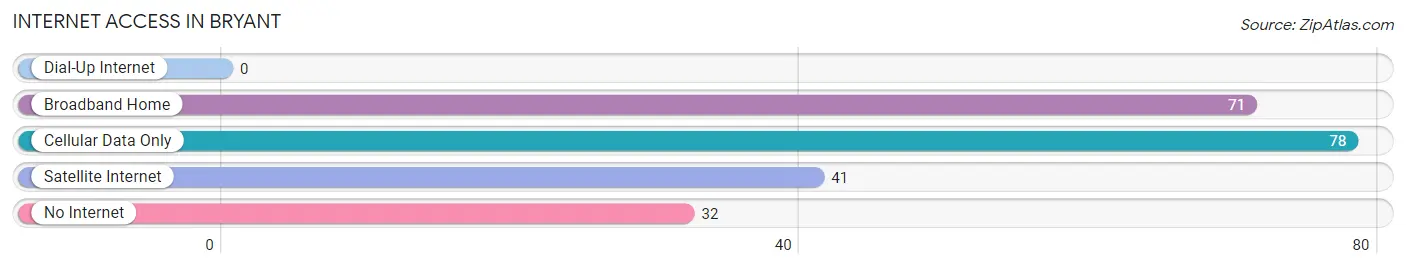
| Internet Type | # Households | % Households |
| Dial-Up Internet | 0 | 0.0% |
| Broadband Home | 71 | 32.4% |
| Cellular Data Only | 78 | 35.6% |
| Satellite Internet | 41 | 18.7% |
| No Internet | 32 | 14.6% |
| Total | 219 | 100.0% |
Bryant Summary
History
Bryant, South Dakota is a small town located in the southeastern corner of the state. It is situated in the rolling hills of the Missouri River Valley, and is part of the larger Sioux Falls metropolitan area. The town was founded in 1881 by a group of settlers from Iowa, who were looking for a place to settle and start a new life. The town was named after the first settler, William Bryant, who had come to the area in search of gold.
The town quickly grew, and by the early 1900s, it had become a bustling community with a population of over 500 people. The town was home to a variety of businesses, including a general store, a blacksmith, a hotel, and a post office. The town also had a school, a church, and a library.
In the early 1900s, the town was also home to a large number of immigrants from Europe, particularly from Germany and Scandinavia. These immigrants brought with them their own culture and traditions, which helped to shape the town’s identity.
In the 1920s, the town experienced a period of growth and prosperity. The population increased to over 1,000 people, and the town was home to a variety of businesses, including a bank, a movie theater, and a variety of stores.
However, the Great Depression of the 1930s hit the town hard, and the population began to decline. By the 1950s, the population had dropped to just over 500 people.
In the late 1950s, the town began to experience a period of revitalization. The population began to increase, and the town was home to a variety of businesses, including a grocery store, a hardware store, and a variety of restaurants.
Today, Bryant is a small town with a population of just over 1,000 people. The town is home to a variety of businesses, including a bank, a post office, a library, and a variety of stores. The town is also home to a variety of churches, and is a popular destination for tourists.
Geography
Bryant is located in the southeastern corner of South Dakota, in the rolling hills of the Missouri River Valley. The town is situated at an elevation of 1,845 feet above sea level, and is located approximately 25 miles east of Sioux Falls.
The town is located in the heart of the Great Plains, and is surrounded by a variety of natural features, including prairies, rivers, and lakes. The town is also located near the Big Sioux River, which is a popular destination for fishing and boating.
Economy
Bryant’s economy is largely based on agriculture and tourism. The town is home to a variety of farms, which produce a variety of crops, including corn, soybeans, and wheat. The town is also home to a variety of businesses, including a bank, a post office, a library, and a variety of stores.
The town is also a popular destination for tourists, who come to enjoy the town’s natural beauty and its variety of outdoor activities. The town is home to a variety of parks, including the Big Sioux River State Park, which is a popular destination for fishing and boating.
Demographics
As of the 2010 census, the population of Bryant was 1,072 people. The town is predominantly white, with 92.3% of the population identifying as white. The town is also home to a variety of other ethnicities, including African American (2.2%), Native American (1.2%), Asian (0.7%), and Hispanic (2.6%).
The median household income in Bryant is $45,000, and the median home value is $125,000. The town has a poverty rate of 11.3%, and the unemployment rate is 4.2%.
Common Questions
What is Per Capita Income in Bryant?
Per Capita income in Bryant is $23,544.
What is the Median Family Income in Bryant?
Median Family Income in Bryant is $65,417.
What is the Median Household income in Bryant?
Median Household Income in Bryant is $58,558.
What is Income or Wage Gap in Bryant?
Income or Wage Gap in Bryant is 38.4%.
Women in Bryant earn 61.6 cents for every dollar earned by a man.
What is Inequality or Gini Index in Bryant?
Inequality or Gini Index in Bryant is 0.40.
What is the Total Population of Bryant?
Total Population of Bryant is 749.
What is the Total Male Population of Bryant?
Total Male Population of Bryant is 395.
What is the Total Female Population of Bryant?
Total Female Population of Bryant is 354.
What is the Ratio of Males per 100 Females in Bryant?
There are 111.58 Males per 100 Females in Bryant.
What is the Ratio of Females per 100 Males in Bryant?
There are 89.62 Females per 100 Males in Bryant.
What is the Median Population Age in Bryant?
Median Population Age in Bryant is 22.8 Years.
What is the Average Family Size in Bryant
Average Family Size in Bryant is 3.8 People.
What is the Average Household Size in Bryant
Average Household Size in Bryant is 3.0 People.
How Large is the Labor Force in Bryant?
There are 263 People in the Labor Forcein in Bryant.
What is the Percentage of People in the Labor Force in Bryant?
53.2% of People are in the Labor Force in Bryant.
What is the Unemployment Rate in Bryant?
Unemployment Rate in Bryant is 1.9%.