Camp Crook, SD Map & Demographics
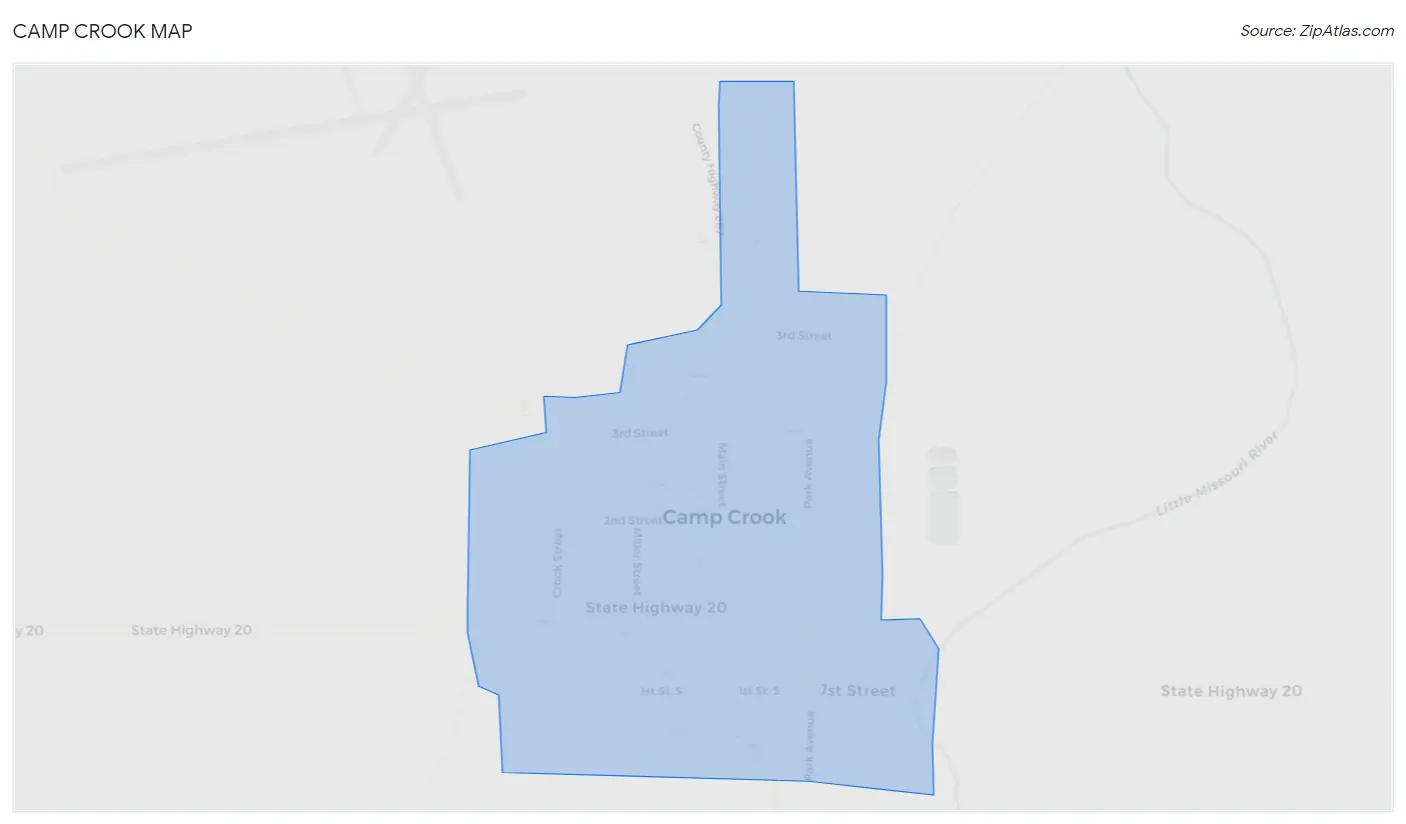
Camp Crook Map
Camp Crook Overview
$32,303
PER CAPITA INCOME
$75,417
AVG FAMILY INCOME
$36,591
AVG HOUSEHOLD INCOME
66.7%
WAGE / INCOME GAP [ % ]
33.3¢/ $1
WAGE / INCOME GAP [ $ ]
0.31
INEQUALITY / GINI INDEX
38
TOTAL POPULATION
16
MALE POPULATION
22
FEMALE POPULATION
72.73
MALES / 100 FEMALES
137.50
FEMALES / 100 MALES
67.3
MEDIAN AGE
2.1
AVG FAMILY SIZE
1.4
AVG HOUSEHOLD SIZE
20
LABOR FORCE [ PEOPLE ]
52.6%
PERCENT IN LABOR FORCE
Camp Crook Zip Codes
Camp Crook Area Codes
Income in Camp Crook
Income Overview in Camp Crook
Per Capita Income in Camp Crook is $32,303, while median incomes of families and households are $75,417 and $36,591 respectively.
| Characteristic | Number | Measure |
| Per Capita Income | 38 | $32,303 |
| Median Family Income | 9 | $75,417 |
| Mean Family Income | 9 | $68,156 |
| Median Household Income | 28 | $36,591 |
| Mean Household Income | 28 | $42,546 |
| Income Deficit | 9 | $0 |
| Wage / Income Gap (%) | 38 | 66.72% |
| Wage / Income Gap ($) | 38 | 33.28¢ per $1 |
| Gini / Inequality Index | 38 | 0.31 |
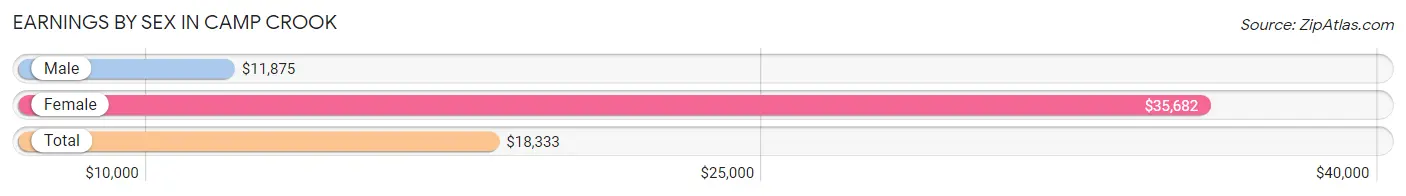
Earnings by Sex in Camp Crook
Average Earnings in Camp Crook are $18,333, $11,875 for men and $35,682 for women, a difference of 66.7%.
| Sex | Number | Average Earnings |
| Male | 10 (38.5%) | $11,875 |
| Female | 16 (61.5%) | $35,682 |
| Total | 26 (100.0%) | $18,333 |
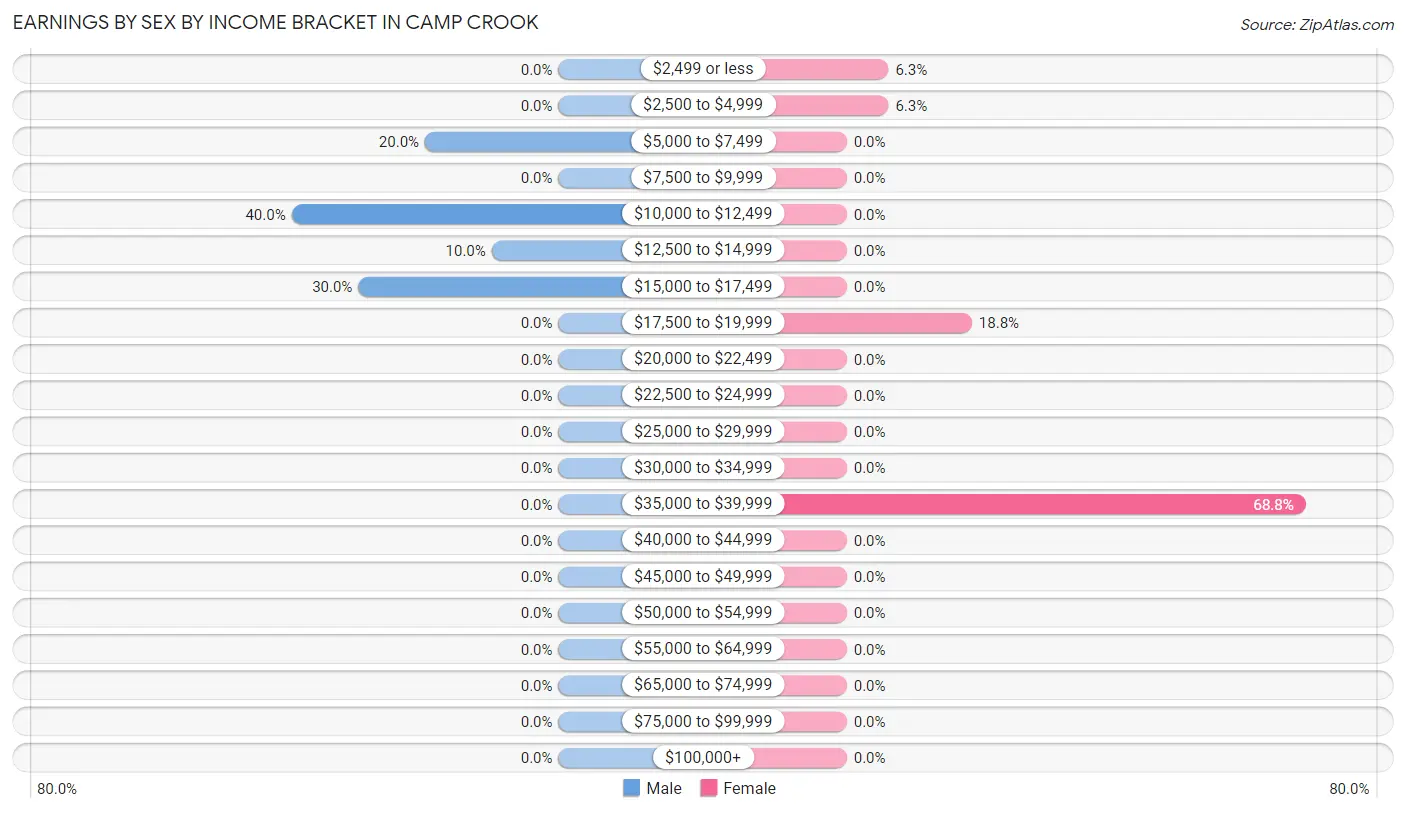
Earnings by Sex by Income Bracket in Camp Crook
The most common earnings brackets in Camp Crook are $10,000 to $12,499 for men (4 | 40.0%) and $35,000 to $39,999 for women (11 | 68.8%).
| Income | Male | Female |
| $2,499 or less | 0 (0.0%) | 1 (6.2%) |
| $2,500 to $4,999 | 0 (0.0%) | 1 (6.2%) |
| $5,000 to $7,499 | 2 (20.0%) | 0 (0.0%) |
| $7,500 to $9,999 | 0 (0.0%) | 0 (0.0%) |
| $10,000 to $12,499 | 4 (40.0%) | 0 (0.0%) |
| $12,500 to $14,999 | 1 (10.0%) | 0 (0.0%) |
| $15,000 to $17,499 | 3 (30.0%) | 0 (0.0%) |
| $17,500 to $19,999 | 0 (0.0%) | 3 (18.8%) |
| $20,000 to $22,499 | 0 (0.0%) | 0 (0.0%) |
| $22,500 to $24,999 | 0 (0.0%) | 0 (0.0%) |
| $25,000 to $29,999 | 0 (0.0%) | 0 (0.0%) |
| $30,000 to $34,999 | 0 (0.0%) | 0 (0.0%) |
| $35,000 to $39,999 | 0 (0.0%) | 11 (68.8%) |
| $40,000 to $44,999 | 0 (0.0%) | 0 (0.0%) |
| $45,000 to $49,999 | 0 (0.0%) | 0 (0.0%) |
| $50,000 to $54,999 | 0 (0.0%) | 0 (0.0%) |
| $55,000 to $64,999 | 0 (0.0%) | 0 (0.0%) |
| $65,000 to $74,999 | 0 (0.0%) | 0 (0.0%) |
| $75,000 to $99,999 | 0 (0.0%) | 0 (0.0%) |
| $100,000+ | 0 (0.0%) | 0 (0.0%) |
| Total | 10 (100.0%) | 16 (100.0%) |
Earnings by Sex by Educational Attainment in Camp Crook
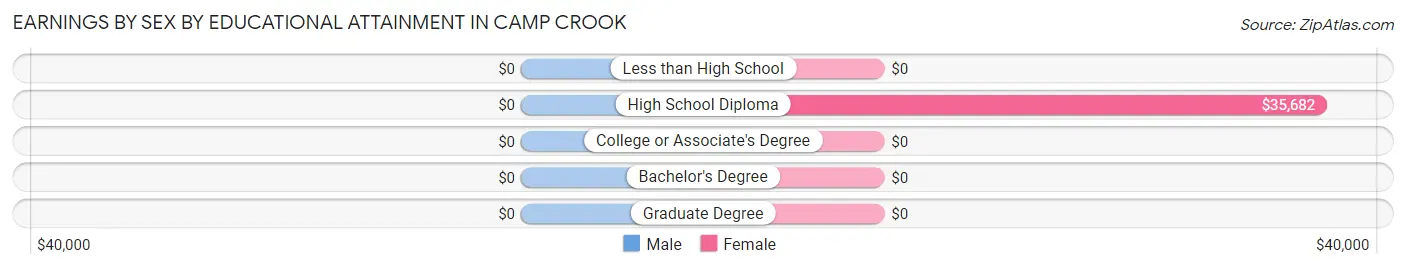
| Educational Attainment | Male Income | Female Income |
| Less than High School | - | - |
| High School Diploma | - | - |
| College or Associate's Degree | - | - |
| Bachelor's Degree | - | - |
| Graduate Degree | - | - |
| Total | $11,875 | $35,682 |
Family Income in Camp Crook
Family Income Brackets in Camp Crook
According to the Camp Crook family income data, there are 5 families falling into the $75,000 to $99,999 income range, which is the most common income bracket and makes up 55.6% of all families.
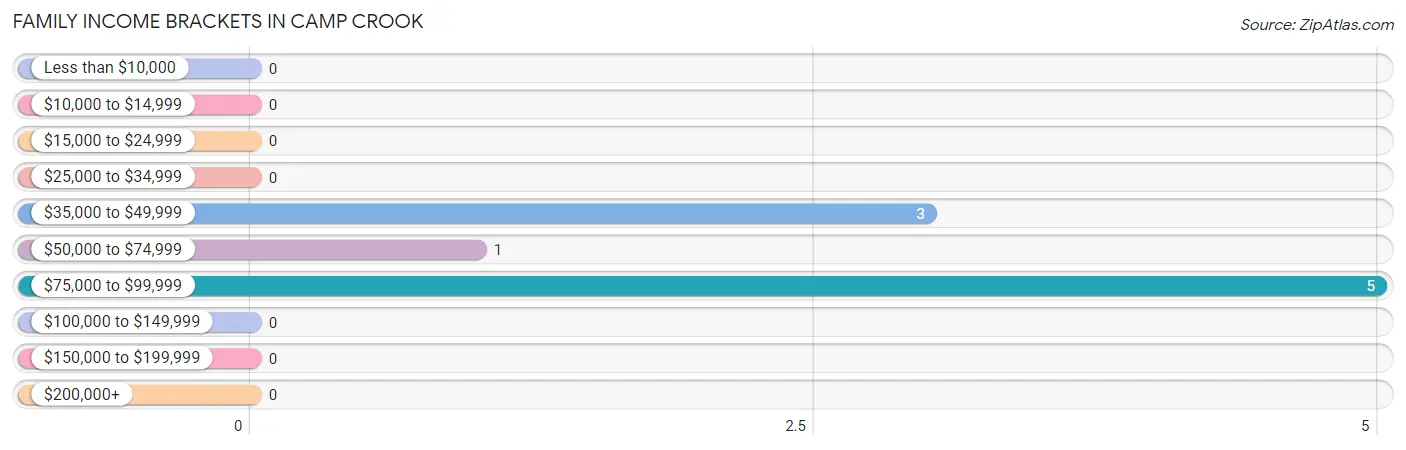
| Income Bracket | # Families | % Families |
| Less than $10,000 | 0 | 0.0% |
| $10,000 to $14,999 | 0 | 0.0% |
| $15,000 to $24,999 | 0 | 0.0% |
| $25,000 to $34,999 | 0 | 0.0% |
| $35,000 to $49,999 | 3 | 33.3% |
| $50,000 to $74,999 | 1 | 11.1% |
| $75,000 to $99,999 | 5 | 55.6% |
| $100,000 to $149,999 | 0 | 0.0% |
| $150,000 to $199,999 | 0 | 0.0% |
| $200,000+ | 0 | 0.0% |
Family Income by Famaliy Size in Camp Crook
2-person families (9 | 100.0%) account for the highest median family income in Camp Crook with $75,417 per family, while 2-person families (9 | 100.0%) have the highest median income of $37,708 per family member.
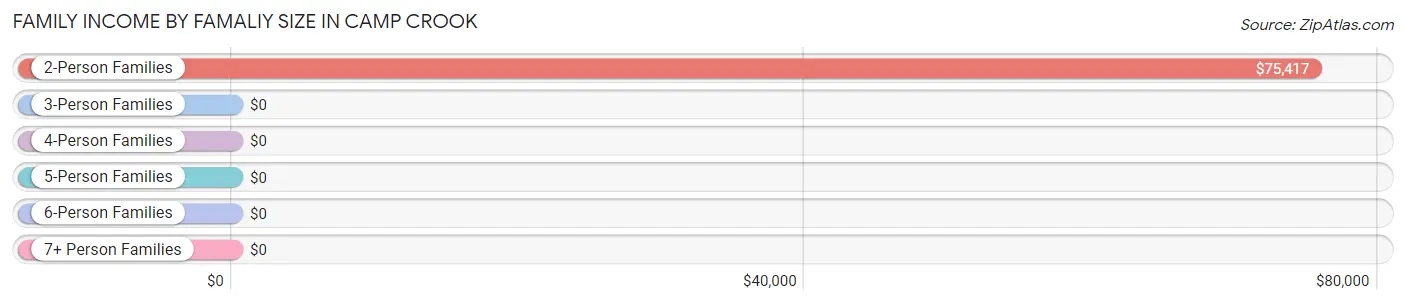
| Income Bracket | # Families | Median Income |
| 2-Person Families | 9 (100.0%) | $75,417 |
| 3-Person Families | 0 (0.0%) | $0 |
| 4-Person Families | 0 (0.0%) | $0 |
| 5-Person Families | 0 (0.0%) | $0 |
| 6-Person Families | 0 (0.0%) | $0 |
| 7+ Person Families | 0 (0.0%) | $0 |
| Total | 9 (100.0%) | $75,417 |
Family Income by Number of Earners in Camp Crook
| Number of Earners | # Families | Median Income |
| No Earners | 3 (33.3%) | $0 |
| 1 Earner | 3 (33.3%) | $0 |
| 2 Earners | 3 (33.3%) | $0 |
| 3+ Earners | 0 (0.0%) | $0 |
| Total | 9 (100.0%) | $75,417 |
Household Income in Camp Crook
Household Income Brackets in Camp Crook
With 14 households falling in the category, the $35,000 to $49,999 income range is the most frequent in Camp Crook, accounting for 50.0% of all households.
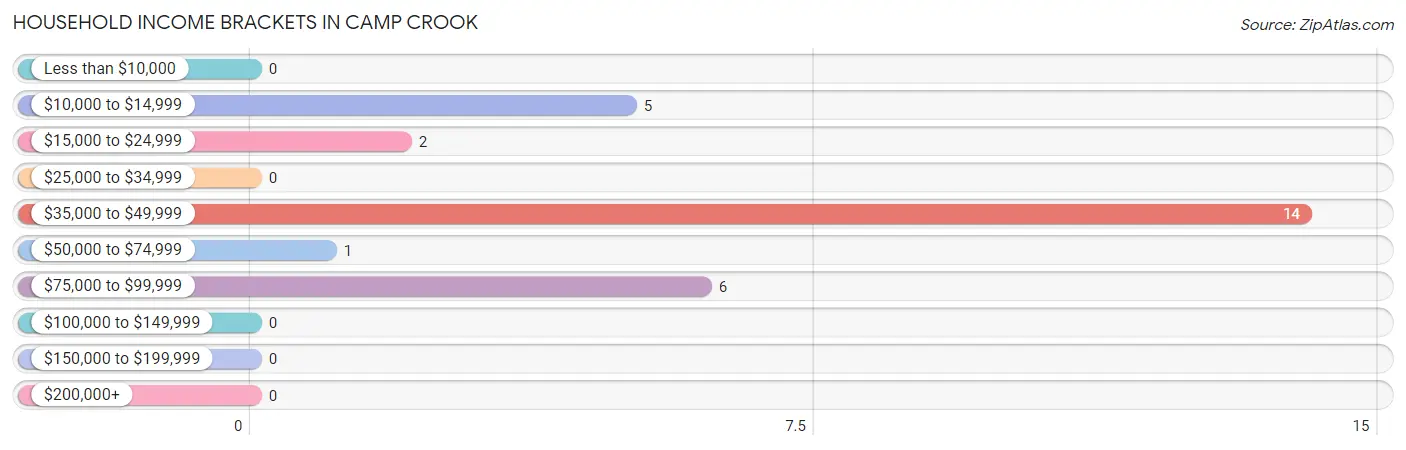
| Income Bracket | # Households | % Households |
| Less than $10,000 | 0 | 0.0% |
| $10,000 to $14,999 | 5 | 17.9% |
| $15,000 to $24,999 | 2 | 7.1% |
| $25,000 to $34,999 | 0 | 0.0% |
| $35,000 to $49,999 | 14 | 50.0% |
| $50,000 to $74,999 | 1 | 3.6% |
| $75,000 to $99,999 | 6 | 21.4% |
| $100,000 to $149,999 | 0 | 0.0% |
| $150,000 to $199,999 | 0 | 0.0% |
| $200,000+ | 0 | 0.0% |
Household Income by Householder Age in Camp Crook
The median household income in Camp Crook is $36,591, with the highest median household income of $65,000 found in the 65+ years age bracket for the primary householder. A total of 12 households (42.9%) fall into this category.
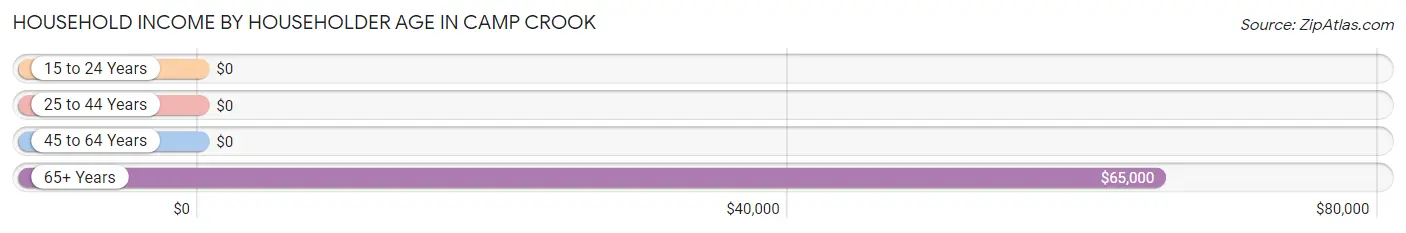
| Income Bracket | # Households | Median Income |
| 15 to 24 Years | 0 (0.0%) | $0 |
| 25 to 44 Years | 0 (0.0%) | $0 |
| 45 to 64 Years | 16 (57.1%) | $0 |
| 65+ Years | 12 (42.9%) | $65,000 |
| Total | 28 (100.0%) | $36,591 |
Poverty in Camp Crook
Income Below Poverty by Sex and Age in Camp Crook
With 25.0% poverty level for males and 4.5% for females among the residents of Camp Crook, 55 to 64 year old males and 55 to 64 year old females are the most vulnerable to poverty, with 4 males (100.0%) and 1 females (33.3%) in their respective age groups living below the poverty level.
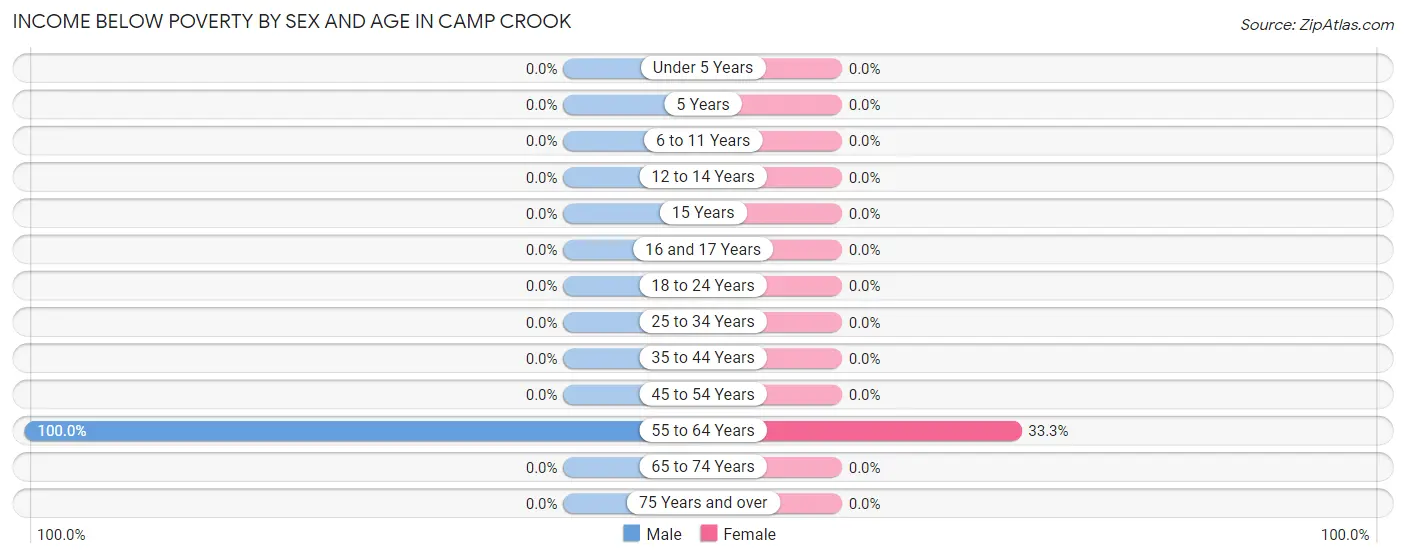
| Age Bracket | Male | Female |
| Under 5 Years | 0 (0.0%) | 0 (0.0%) |
| 5 Years | 0 (0.0%) | 0 (0.0%) |
| 6 to 11 Years | 0 (0.0%) | 0 (0.0%) |
| 12 to 14 Years | 0 (0.0%) | 0 (0.0%) |
| 15 Years | 0 (0.0%) | 0 (0.0%) |
| 16 and 17 Years | 0 (0.0%) | 0 (0.0%) |
| 18 to 24 Years | 0 (0.0%) | 0 (0.0%) |
| 25 to 34 Years | 0 (0.0%) | 0 (0.0%) |
| 35 to 44 Years | 0 (0.0%) | 0 (0.0%) |
| 45 to 54 Years | 0 (0.0%) | 0 (0.0%) |
| 55 to 64 Years | 4 (100.0%) | 1 (33.3%) |
| 65 to 74 Years | 0 (0.0%) | 0 (0.0%) |
| 75 Years and over | 0 (0.0%) | 0 (0.0%) |
| Total | 4 (25.0%) | 1 (4.5%) |
Income Above Poverty by Sex and Age in Camp Crook
According to the poverty statistics in Camp Crook, males aged 65 to 74 years and females aged 45 to 54 years are the age groups that are most secure financially, with 100.0% of males and 100.0% of females in these age groups living above the poverty line.
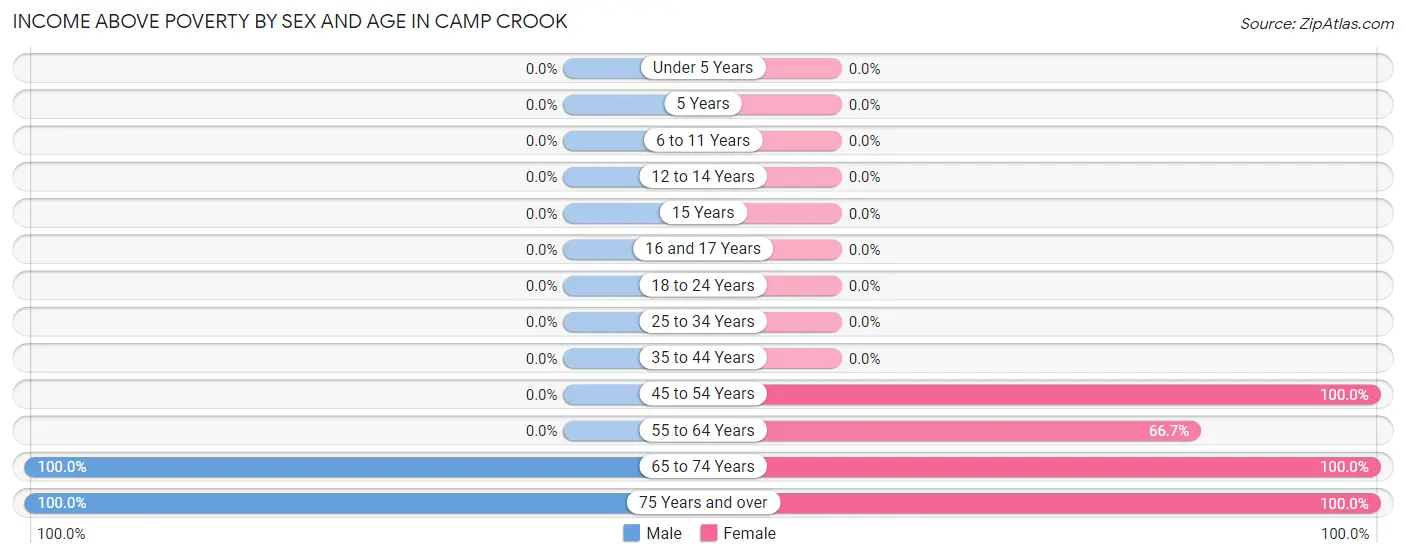
| Age Bracket | Male | Female |
| Under 5 Years | 0 (0.0%) | 0 (0.0%) |
| 5 Years | 0 (0.0%) | 0 (0.0%) |
| 6 to 11 Years | 0 (0.0%) | 0 (0.0%) |
| 12 to 14 Years | 0 (0.0%) | 0 (0.0%) |
| 15 Years | 0 (0.0%) | 0 (0.0%) |
| 16 and 17 Years | 0 (0.0%) | 0 (0.0%) |
| 18 to 24 Years | 0 (0.0%) | 0 (0.0%) |
| 25 to 34 Years | 0 (0.0%) | 0 (0.0%) |
| 35 to 44 Years | 0 (0.0%) | 0 (0.0%) |
| 45 to 54 Years | 0 (0.0%) | 11 (100.0%) |
| 55 to 64 Years | 0 (0.0%) | 2 (66.7%) |
| 65 to 74 Years | 10 (100.0%) | 6 (100.0%) |
| 75 Years and over | 2 (100.0%) | 2 (100.0%) |
| Total | 12 (75.0%) | 21 (95.5%) |
Income Below Poverty Among Married-Couple Families in Camp Crook
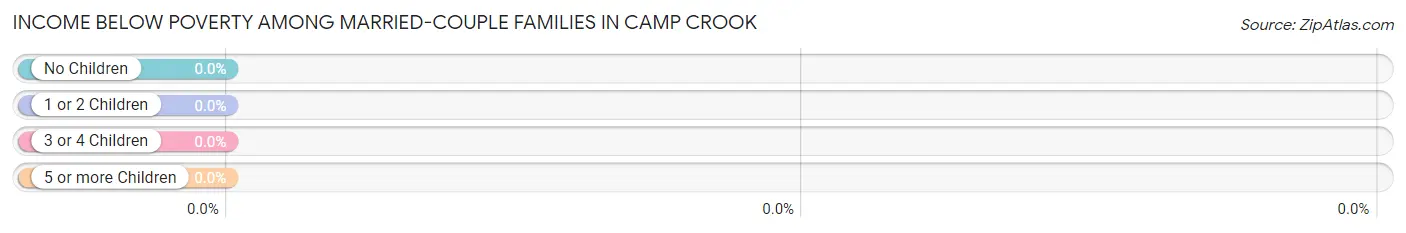
| Children | Above Poverty | Below Poverty |
| No Children | 9 (100.0%) | 0 (0.0%) |
| 1 or 2 Children | 0 (0.0%) | 0 (0.0%) |
| 3 or 4 Children | 0 (0.0%) | 0 (0.0%) |
| 5 or more Children | 0 (0.0%) | 0 (0.0%) |
| Total | 9 (100.0%) | 0 (0.0%) |
Income Below Poverty Among Single-Parent Households in Camp Crook
| Children | Single Father | Single Mother |
| No Children | 0 (0.0%) | 0 (0.0%) |
| 1 or 2 Children | 0 (0.0%) | 0 (0.0%) |
| 3 or 4 Children | 0 (0.0%) | 0 (0.0%) |
| 5 or more Children | 0 (0.0%) | 0 (0.0%) |
| Total | 0 (0.0%) | 0 (0.0%) |
Income Below Poverty Among Married-Couple vs Single-Parent Households in Camp Crook
| Children | Married-Couple Families | Single-Parent Households |
| No Children | 0 (0.0%) | 0 (0.0%) |
| 1 or 2 Children | 0 (0.0%) | 0 (0.0%) |
| 3 or 4 Children | 0 (0.0%) | 0 (0.0%) |
| 5 or more Children | 0 (0.0%) | 0 (0.0%) |
| Total | 0 (0.0%) | 0 (0.0%) |
Race in Camp Crook
The most populous races in Camp Crook are , and White / Caucasian (38 | 100.0%).
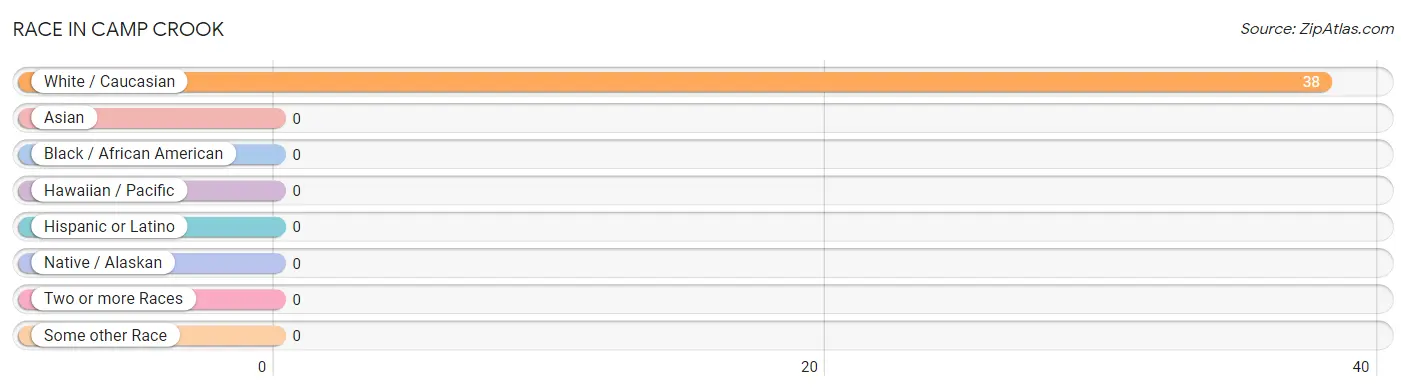
| Race | # Population | % Population |
| Asian | 0 | 0.0% |
| Black / African American | 0 | 0.0% |
| Hawaiian / Pacific | 0 | 0.0% |
| Hispanic or Latino | 0 | 0.0% |
| Native / Alaskan | 0 | 0.0% |
| White / Caucasian | 38 | 100.0% |
| Two or more Races | 0 | 0.0% |
| Some other Race | 0 | 0.0% |
| Total | 38 | 100.0% |
Ancestry in Camp Crook
The most populous ancestries reported in Camp Crook are American (14 | 36.8%), German (11 | 28.9%), English (5 | 13.2%), Norwegian (4 | 10.5%), and Irish (2 | 5.3%), together accounting for 94.7% of all Camp Crook residents.
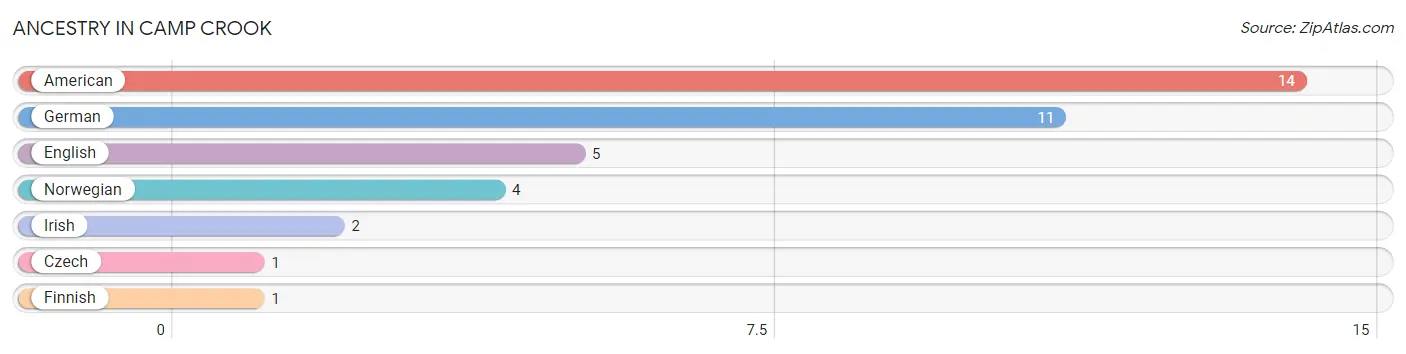
| Ancestry | # Population | % Population |
| American | 14 | 36.8% |
| Czech | 1 | 2.6% |
| English | 5 | 13.2% |
| Finnish | 1 | 2.6% |
| German | 11 | 28.9% |
| Irish | 2 | 5.3% |
| Norwegian | 4 | 10.5% | View All 7 Rows |
Immigrants in Camp Crook

| Immigration Origin | # Population | % Population | View All 0 Rows |
Sex and Age in Camp Crook
Sex and Age in Camp Crook
The most populous age groups in Camp Crook are 65 to 69 Years (6 | 37.5%) for men and 45 to 49 Years (11 | 50.0%) for women.
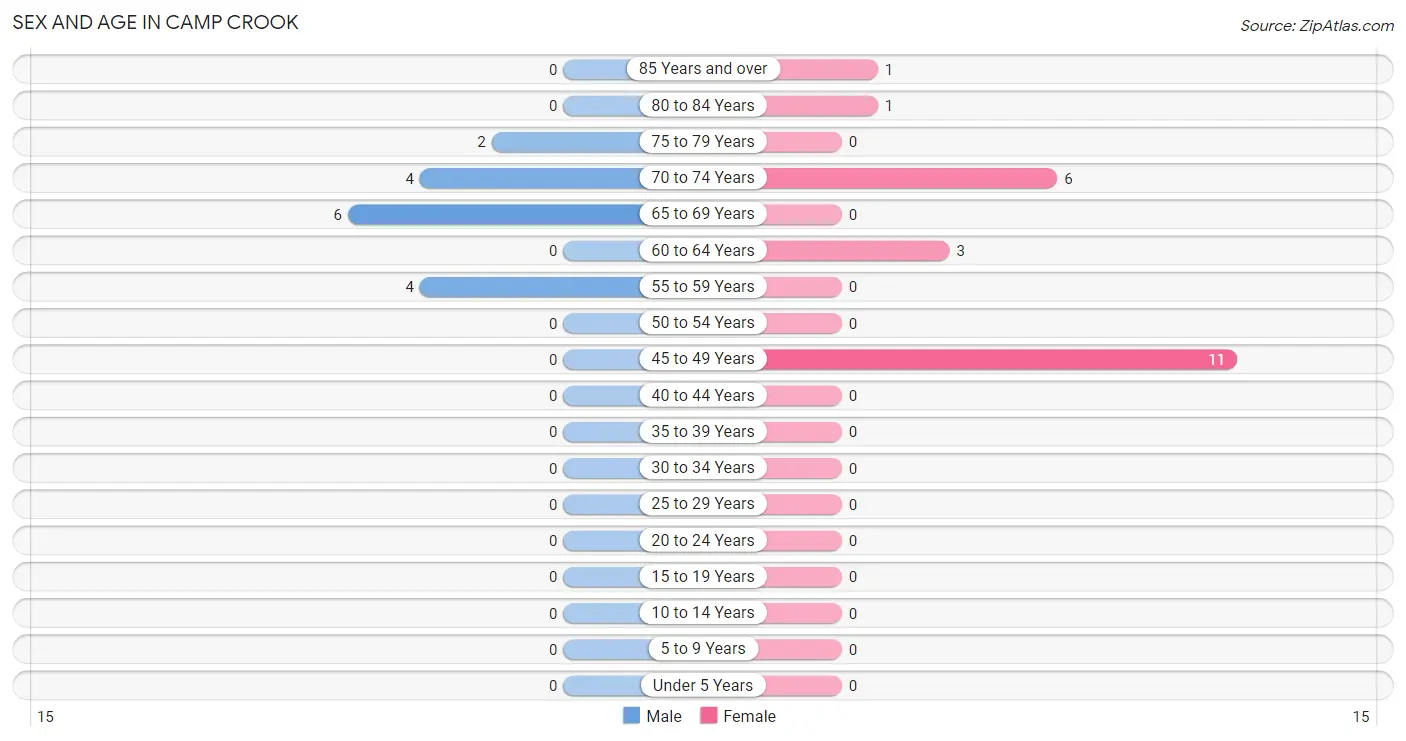
| Age Bracket | Male | Female |
| Under 5 Years | 0 (0.0%) | 0 (0.0%) |
| 5 to 9 Years | 0 (0.0%) | 0 (0.0%) |
| 10 to 14 Years | 0 (0.0%) | 0 (0.0%) |
| 15 to 19 Years | 0 (0.0%) | 0 (0.0%) |
| 20 to 24 Years | 0 (0.0%) | 0 (0.0%) |
| 25 to 29 Years | 0 (0.0%) | 0 (0.0%) |
| 30 to 34 Years | 0 (0.0%) | 0 (0.0%) |
| 35 to 39 Years | 0 (0.0%) | 0 (0.0%) |
| 40 to 44 Years | 0 (0.0%) | 0 (0.0%) |
| 45 to 49 Years | 0 (0.0%) | 11 (50.0%) |
| 50 to 54 Years | 0 (0.0%) | 0 (0.0%) |
| 55 to 59 Years | 4 (25.0%) | 0 (0.0%) |
| 60 to 64 Years | 0 (0.0%) | 3 (13.6%) |
| 65 to 69 Years | 6 (37.5%) | 0 (0.0%) |
| 70 to 74 Years | 4 (25.0%) | 6 (27.3%) |
| 75 to 79 Years | 2 (12.5%) | 0 (0.0%) |
| 80 to 84 Years | 0 (0.0%) | 1 (4.5%) |
| 85 Years and over | 0 (0.0%) | 1 (4.5%) |
| Total | 16 (100.0%) | 22 (100.0%) |
Families and Households in Camp Crook
Median Family Size in Camp Crook
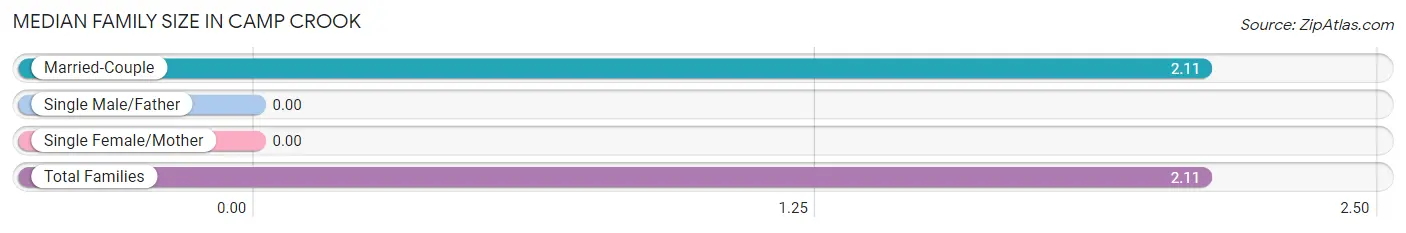
| Family Type | # Families | Family Size |
| Married-Couple | 9 (100.0%) | 2.11 |
| Single Male/Father | 0 (0.0%) | - |
| Single Female/Mother | 0 (0.0%) | - |
| Total Families | 9 (100.0%) | 2.11 |
Median Household Size in Camp Crook
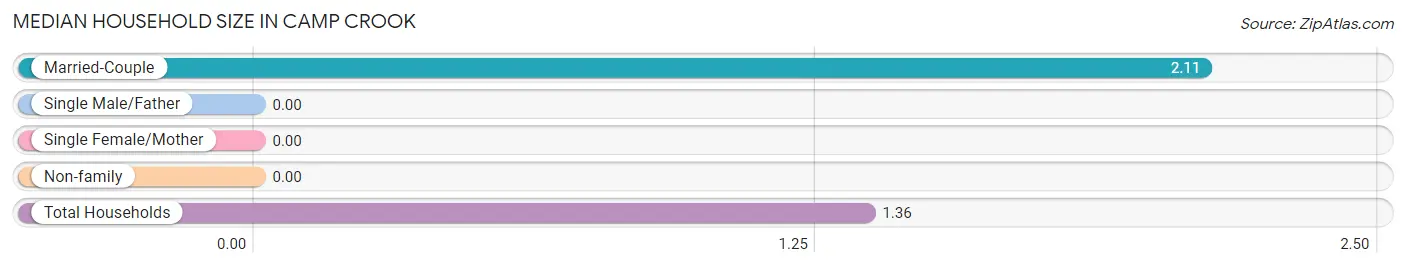
| Household Type | # Households | Household Size |
| Married-Couple | 9 (32.1%) | 2.11 |
| Single Male/Father | 0 (0.0%) | - |
| Single Female/Mother | 0 (0.0%) | - |
| Non-family | 19 (67.9%) | - |
| Total Households | 28 (100.0%) | 1.36 |
Household Size by Marriage Status in Camp Crook
Out of a total of 28 households in Camp Crook, 9 (32.1%) are family households, while 19 (67.9%) are nonfamily households. The most numerous type of family households are 2-person households, comprising 9, and the most common type of nonfamily households are 1-person households, comprising 19.
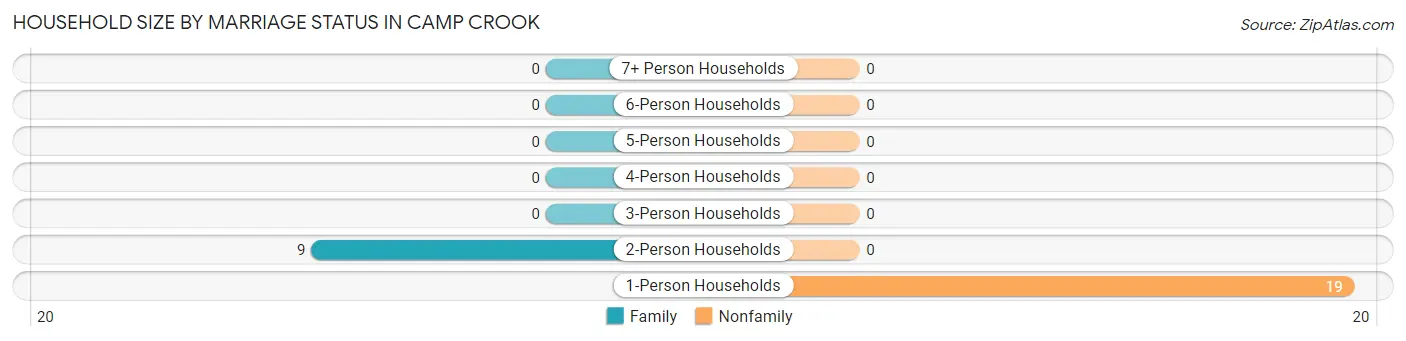
| Household Size | Family Households | Nonfamily Households |
| 1-Person Households | - | 19 (67.9%) |
| 2-Person Households | 9 (32.1%) | 0 (0.0%) |
| 3-Person Households | 0 (0.0%) | 0 (0.0%) |
| 4-Person Households | 0 (0.0%) | 0 (0.0%) |
| 5-Person Households | 0 (0.0%) | 0 (0.0%) |
| 6-Person Households | 0 (0.0%) | 0 (0.0%) |
| 7+ Person Households | 0 (0.0%) | 0 (0.0%) |
| Total | 9 (32.1%) | 19 (67.9%) |
Female Fertility in Camp Crook
Fertility by Age in Camp Crook
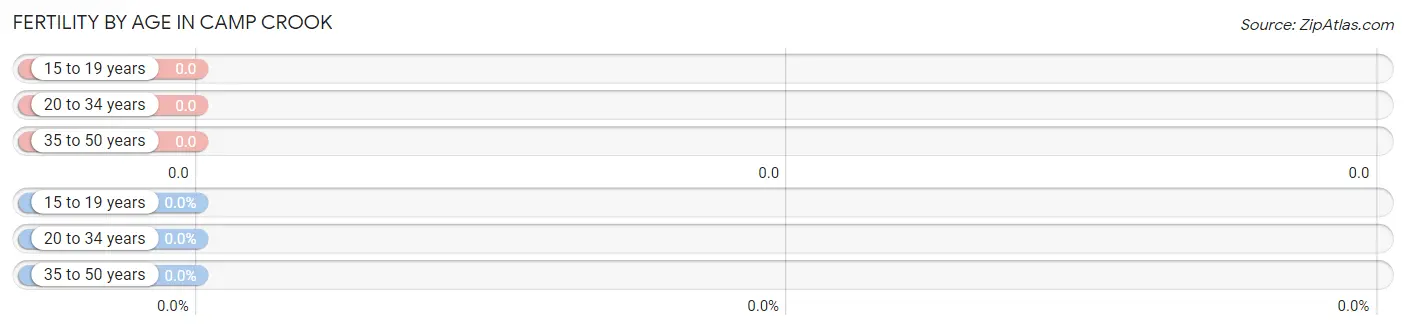
| Age Bracket | Women with Births | Births / 1,000 Women |
| 15 to 19 years | 0 (0.0%) | 0.0 |
| 20 to 34 years | 0 (0.0%) | 0.0 |
| 35 to 50 years | 0 (0.0%) | 0.0 |
| Total | 0 (0.0%) | 0.0 |
Fertility by Age by Marriage Status in Camp Crook
| Age Bracket | Married | Unmarried |
| 15 to 19 years | 0 (0.0%) | 0 (0.0%) |
| 20 to 34 years | 0 (0.0%) | 0 (0.0%) |
| 35 to 50 years | 0 (0.0%) | 0 (0.0%) |
| Total | 0 (0.0%) | 0 (0.0%) |
Fertility by Education in Camp Crook
| Educational Attainment | Women with Births | Births / 1,000 Women |
| Less than High School | 0 (0.0%) | 0.0 |
| High School Diploma | 0 (0.0%) | 0.0 |
| College or Associate's Degree | 0 (0.0%) | 0.0 |
| Bachelor's Degree | 0 (0.0%) | 0.0 |
| Graduate Degree | 0 (0.0%) | 0.0 |
| Total | 0 (0.0%) | 0.0 |
Fertility by Education by Marriage Status in Camp Crook
| Educational Attainment | Married | Unmarried |
| Less than High School | 0 (0.0%) | 0 (0.0%) |
| High School Diploma | 0 (0.0%) | 0 (0.0%) |
| College or Associate's Degree | 0 (0.0%) | 0 (0.0%) |
| Bachelor's Degree | 0 (0.0%) | 0 (0.0%) |
| Graduate Degree | 0 (0.0%) | 0 (0.0%) |
| Total | 0 (0.0%) | 0 (0.0%) |
Employment Characteristics in Camp Crook
Employment by Class of Employer in Camp Crook
Among the 20 employed individuals in Camp Crook, private company employees (18 | 90.0%), and local government employees (2 | 10.0%) make up the most common classes of employment.
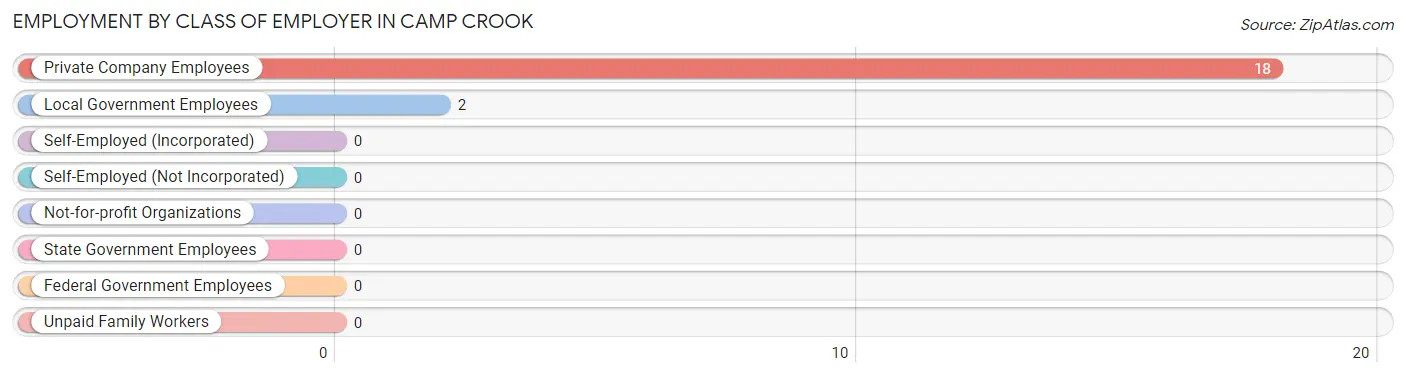
| Employer Class | # Employees | % Employees |
| Private Company Employees | 18 | 90.0% |
| Self-Employed (Incorporated) | 0 | 0.0% |
| Self-Employed (Not Incorporated) | 0 | 0.0% |
| Not-for-profit Organizations | 0 | 0.0% |
| Local Government Employees | 2 | 10.0% |
| State Government Employees | 0 | 0.0% |
| Federal Government Employees | 0 | 0.0% |
| Unpaid Family Workers | 0 | 0.0% |
| Total | 20 | 100.0% |
Employment Status by Age in Camp Crook
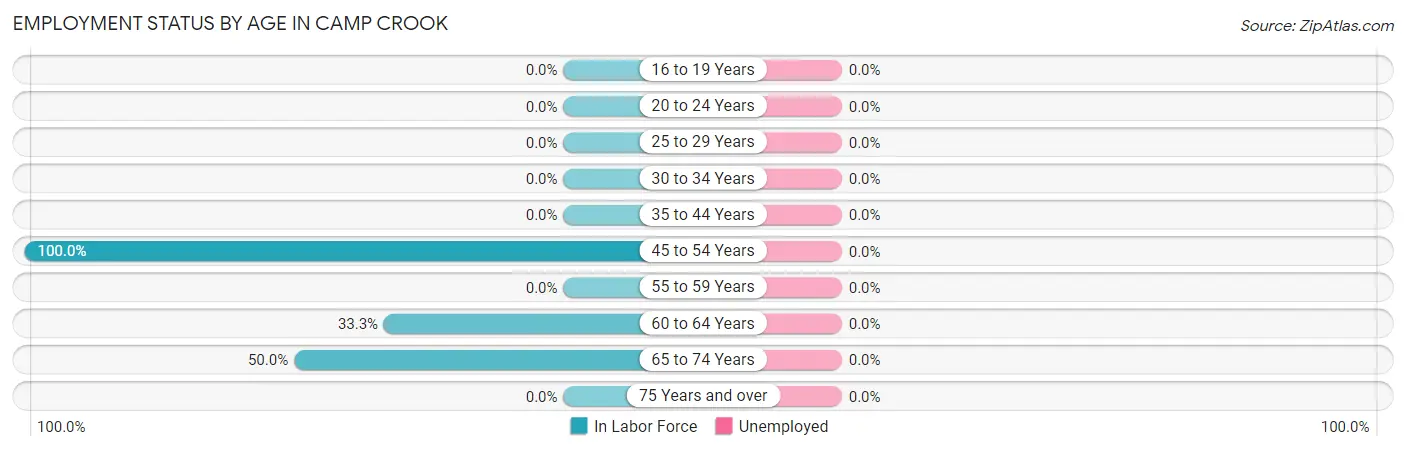
| Age Bracket | In Labor Force | Unemployed |
| 16 to 19 Years | 0 (0.0%) | 0 (0.0%) |
| 20 to 24 Years | 0 (0.0%) | 0 (0.0%) |
| 25 to 29 Years | 0 (0.0%) | 0 (0.0%) |
| 30 to 34 Years | 0 (0.0%) | 0 (0.0%) |
| 35 to 44 Years | 0 (0.0%) | 0 (0.0%) |
| 45 to 54 Years | 11 (100.0%) | 0 (0.0%) |
| 55 to 59 Years | 0 (0.0%) | 0 (0.0%) |
| 60 to 64 Years | 1 (33.3%) | 0 (0.0%) |
| 65 to 74 Years | 8 (50.0%) | 0 (0.0%) |
| 75 Years and over | 0 (0.0%) | 0 (0.0%) |
| Total | 20 (52.6%) | 0 (0.0%) |
Employment Status by Educational Attainment in Camp Crook
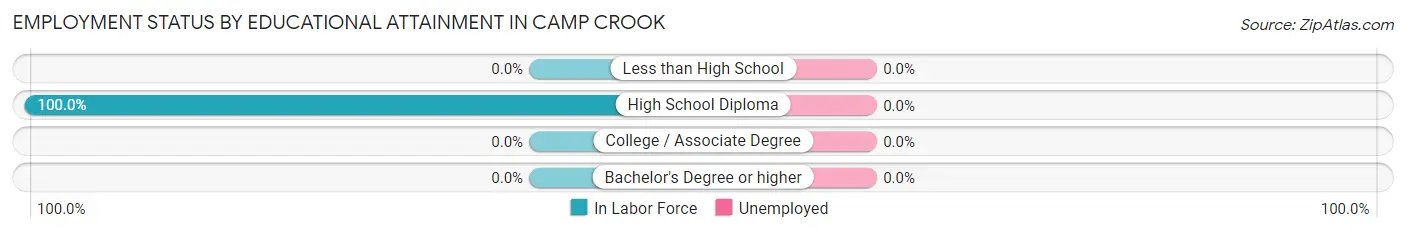
| Educational Attainment | In Labor Force | Unemployed |
| Less than High School | 0 (0.0%) | 0 (0.0%) |
| High School Diploma | 12 (100.0%) | 0 (0.0%) |
| College / Associate Degree | 0 (0.0%) | 0 (0.0%) |
| Bachelor's Degree or higher | 0 (0.0%) | 0 (0.0%) |
| Total | 12 (66.7%) | 0 (0.0%) |
Employment Occupations by Sex in Camp Crook
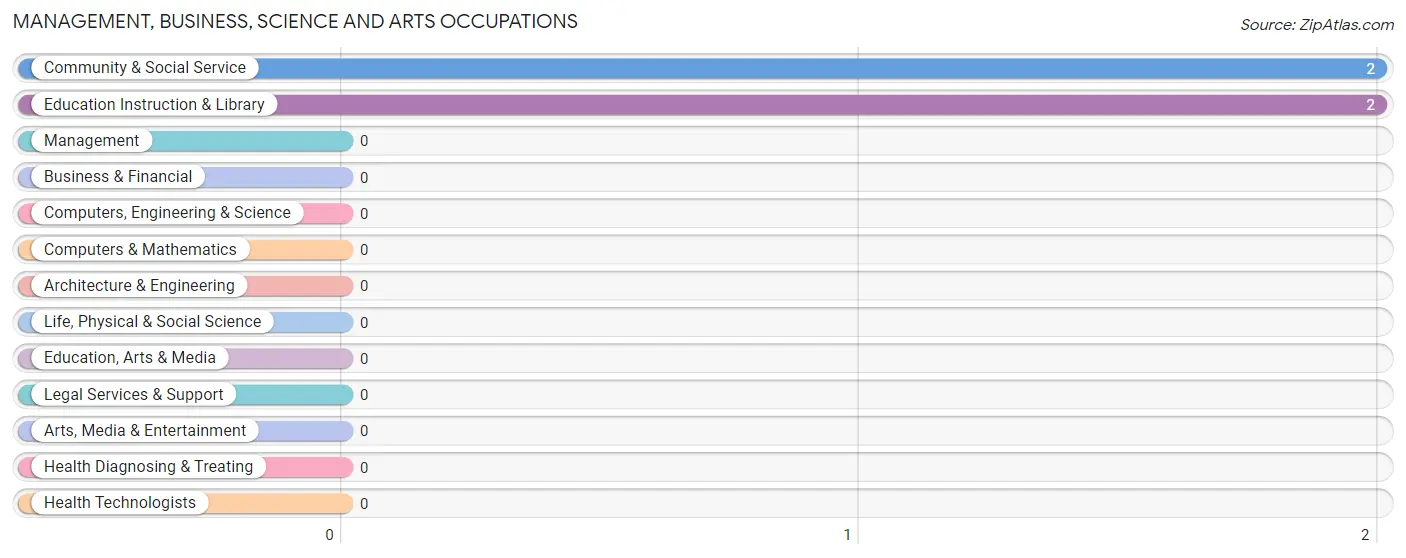
Management, Business, Science and Arts Occupations
The most common Management, Business, Science and Arts occupations in Camp Crook are Community & Social Service (2 | 10.0%), and Education Instruction & Library (2 | 10.0%).
Management, Business, Science and Arts Occupations by Sex
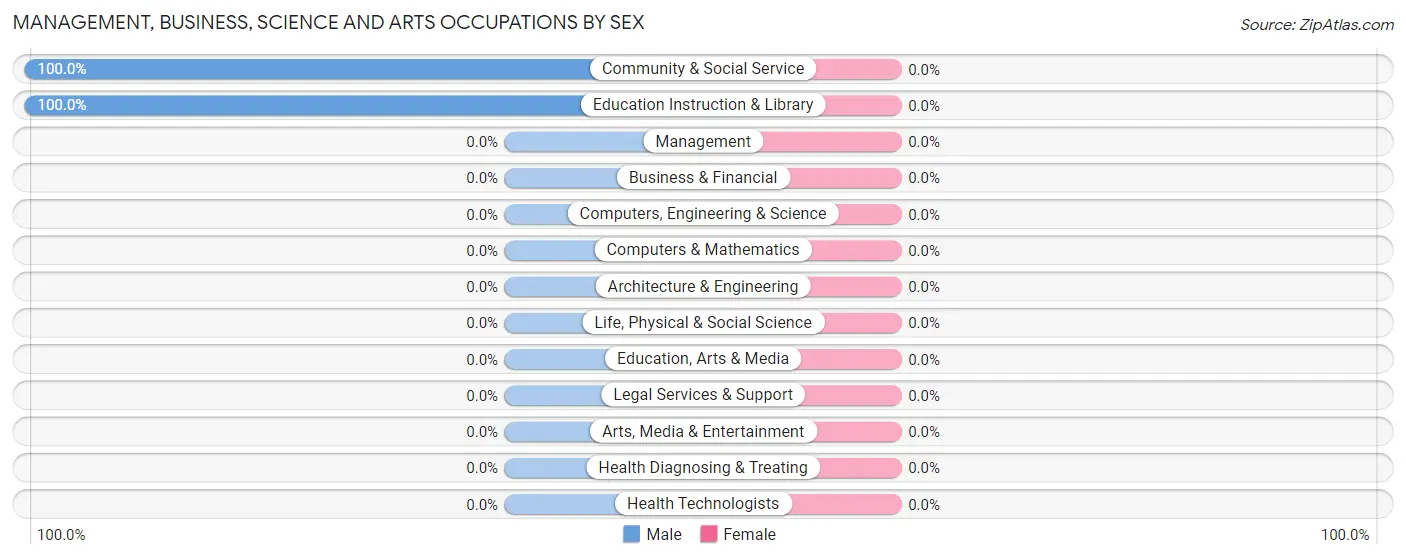
| Occupation | Male | Female |
| Management | 0 (0.0%) | 0 (0.0%) |
| Business & Financial | 0 (0.0%) | 0 (0.0%) |
| Computers, Engineering & Science | 0 (0.0%) | 0 (0.0%) |
| Computers & Mathematics | 0 (0.0%) | 0 (0.0%) |
| Architecture & Engineering | 0 (0.0%) | 0 (0.0%) |
| Life, Physical & Social Science | 0 (0.0%) | 0 (0.0%) |
| Community & Social Service | 2 (100.0%) | 0 (0.0%) |
| Education, Arts & Media | 0 (0.0%) | 0 (0.0%) |
| Legal Services & Support | 0 (0.0%) | 0 (0.0%) |
| Education Instruction & Library | 2 (100.0%) | 0 (0.0%) |
| Arts, Media & Entertainment | 0 (0.0%) | 0 (0.0%) |
| Health Diagnosing & Treating | 0 (0.0%) | 0 (0.0%) |
| Health Technologists | 0 (0.0%) | 0 (0.0%) |
| Total (Category) | 2 (100.0%) | 0 (0.0%) |
| Total (Overall) | 5 (25.0%) | 15 (75.0%) |
Services Occupations
The most common Services occupations in Camp Crook are Food Preparation & Serving (3 | 15.0%), and Cleaning & Maintenance (1 | 5.0%).
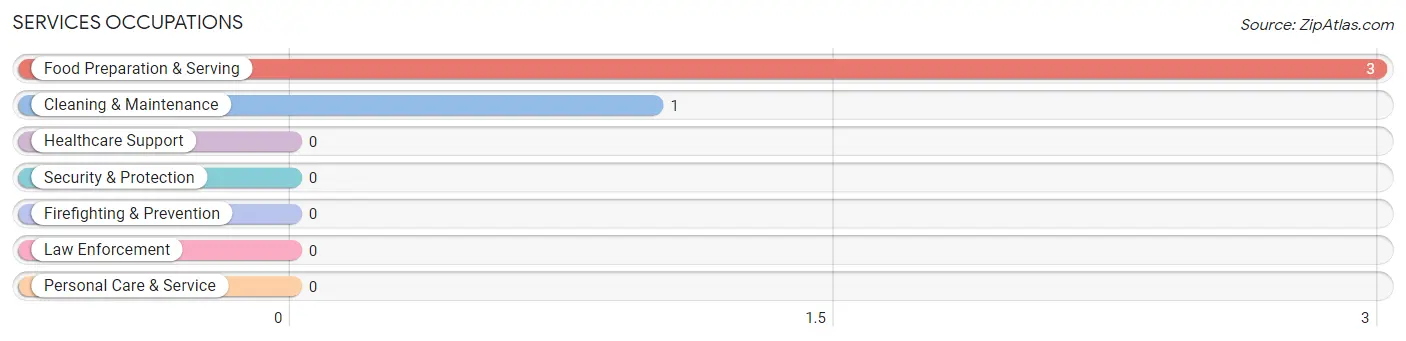
Services Occupations by Sex
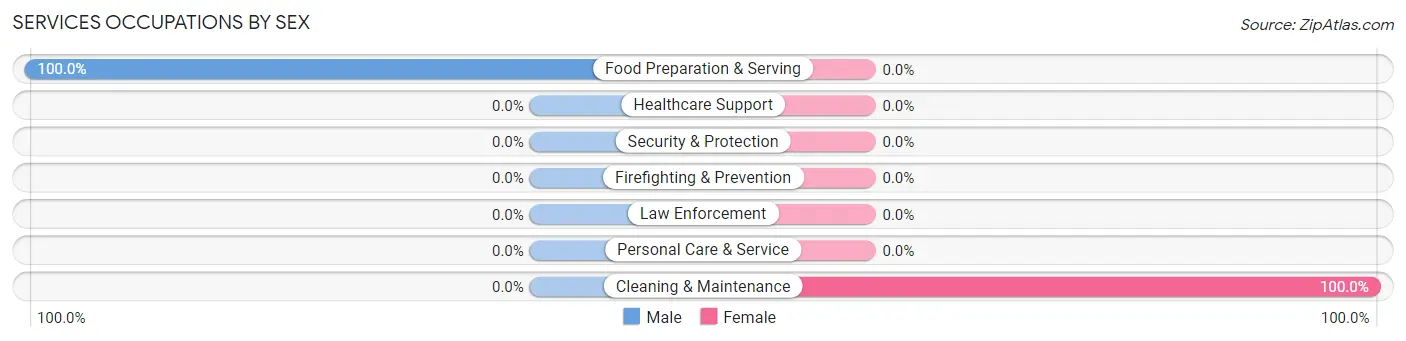
| Occupation | Male | Female |
| Healthcare Support | 0 (0.0%) | 0 (0.0%) |
| Security & Protection | 0 (0.0%) | 0 (0.0%) |
| Firefighting & Prevention | 0 (0.0%) | 0 (0.0%) |
| Law Enforcement | 0 (0.0%) | 0 (0.0%) |
| Food Preparation & Serving | 3 (100.0%) | 0 (0.0%) |
| Cleaning & Maintenance | 0 (0.0%) | 1 (100.0%) |
| Personal Care & Service | 0 (0.0%) | 0 (0.0%) |
| Total (Category) | 3 (75.0%) | 1 (25.0%) |
| Total (Overall) | 5 (25.0%) | 15 (75.0%) |
Sales and Office Occupations
The most common Sales and Office occupations in Camp Crook are , and Sales & Related (11 | 55.0%).
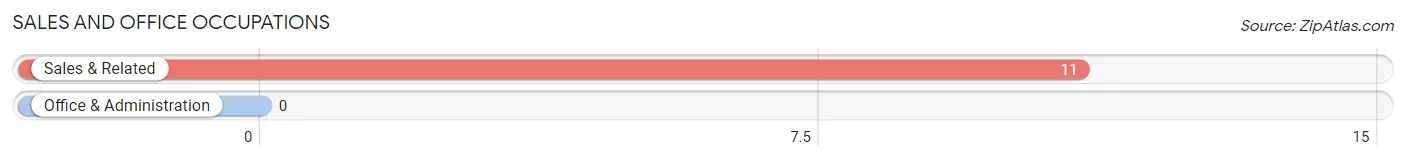
Sales and Office Occupations by Sex
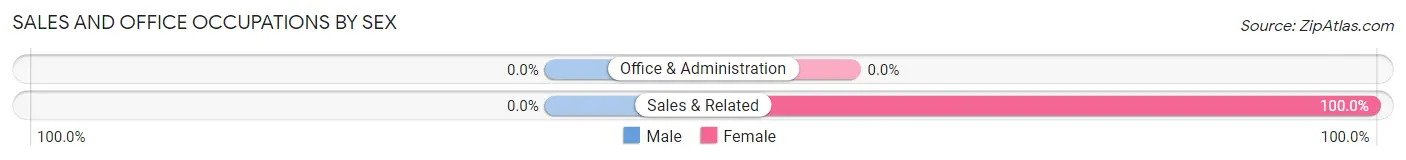
| Occupation | Male | Female |
| Sales & Related | 0 (0.0%) | 11 (100.0%) |
| Office & Administration | 0 (0.0%) | 0 (0.0%) |
| Total (Category) | 0 (0.0%) | 11 (100.0%) |
| Total (Overall) | 5 (25.0%) | 15 (75.0%) |
Natural Resources, Construction and Maintenance Occupations
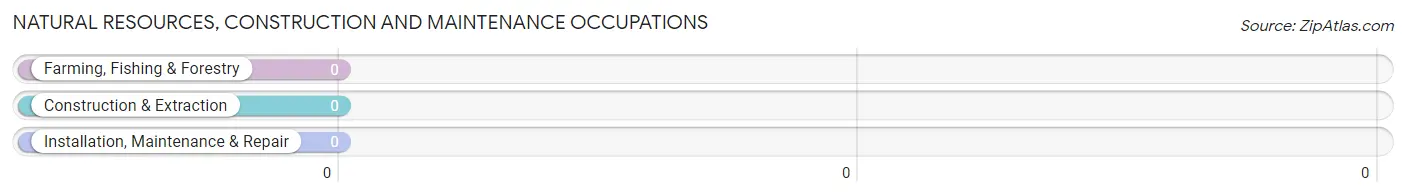
Natural Resources, Construction and Maintenance Occupations by Sex
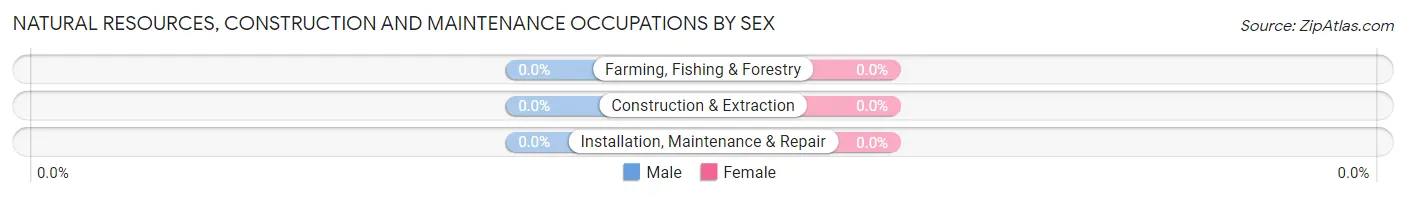
| Occupation | Male | Female |
| Farming, Fishing & Forestry | 0 (0.0%) | 0 (0.0%) |
| Construction & Extraction | 0 (0.0%) | 0 (0.0%) |
| Installation, Maintenance & Repair | 0 (0.0%) | 0 (0.0%) |
| Total (Category) | 0 (0.0%) | 0 (0.0%) |
| Total (Overall) | 5 (25.0%) | 15 (75.0%) |
Production, Transportation and Moving Occupations
The most common Production, Transportation and Moving occupations in Camp Crook are , and Material Moving (3 | 15.0%).
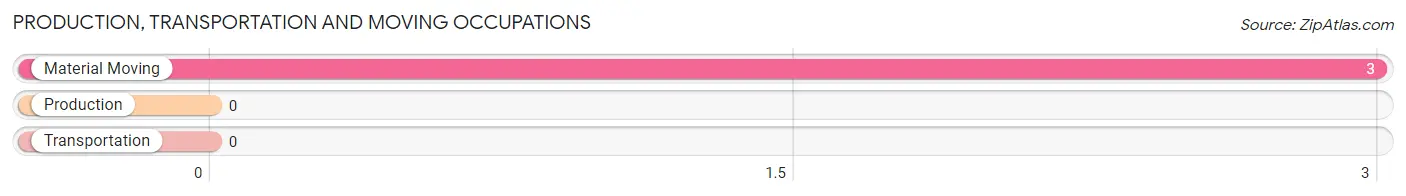
Production, Transportation and Moving Occupations by Sex
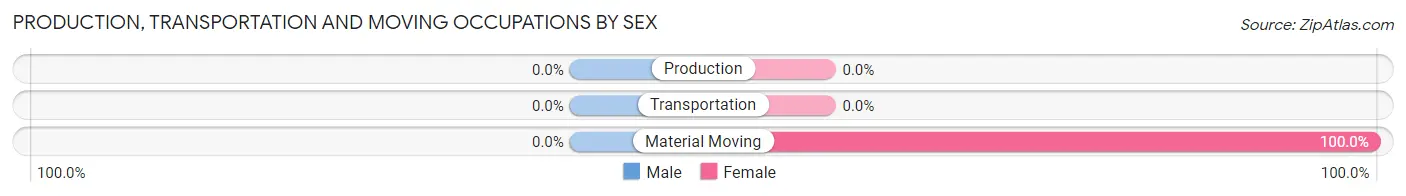
| Occupation | Male | Female |
| Production | 0 (0.0%) | 0 (0.0%) |
| Transportation | 0 (0.0%) | 0 (0.0%) |
| Material Moving | 0 (0.0%) | 3 (100.0%) |
| Total (Category) | 0 (0.0%) | 3 (100.0%) |
| Total (Overall) | 5 (25.0%) | 15 (75.0%) |
Employment Industries by Sex in Camp Crook
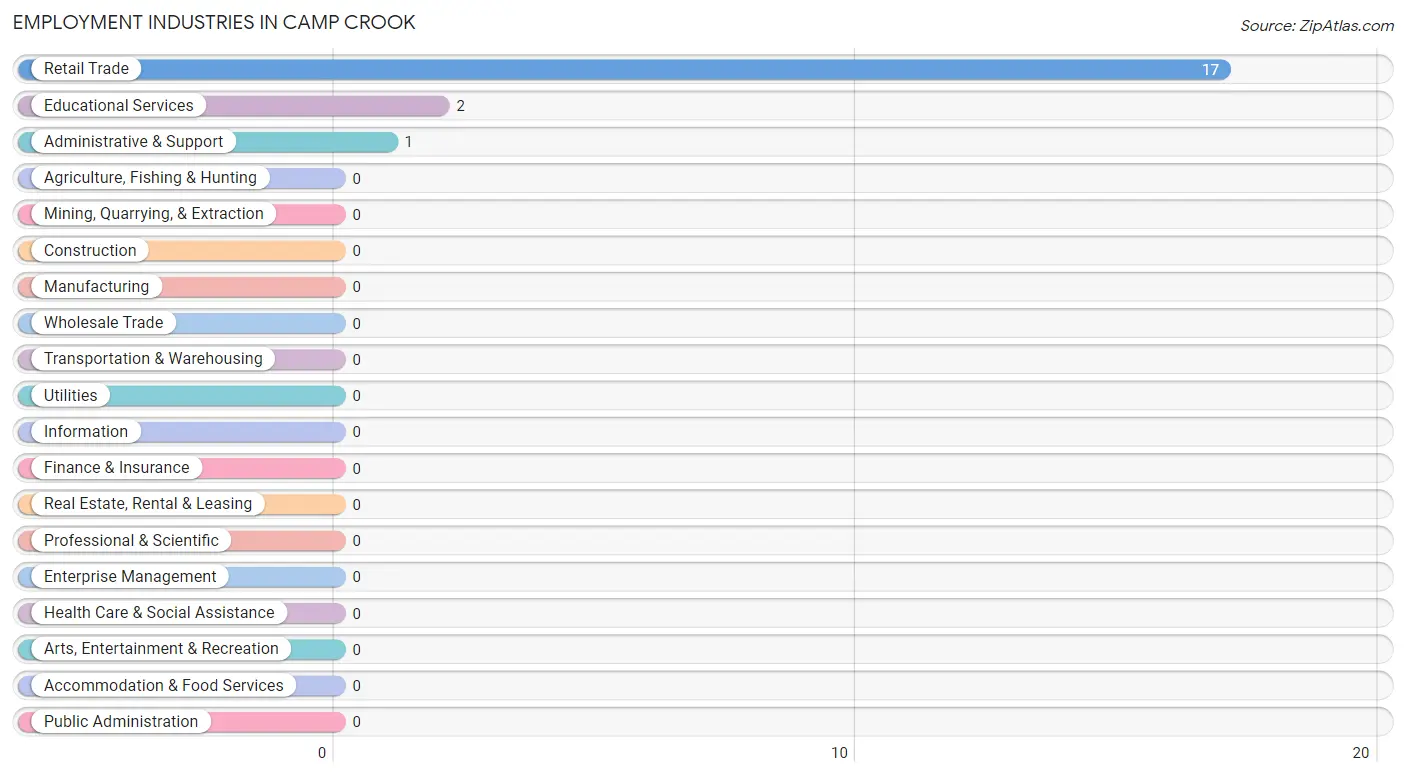
Employment Industries in Camp Crook
The major employment industries in Camp Crook include Retail Trade (17 | 85.0%), Educational Services (2 | 10.0%), and Administrative & Support (1 | 5.0%).
Employment Industries by Sex in Camp Crook
The Camp Crook industries that see more men than women are Educational Services (100.0%), and Retail Trade (17.6%), whereas the industries that tend to have a higher number of women are Administrative & Support (100.0%), and Retail Trade (82.4%).
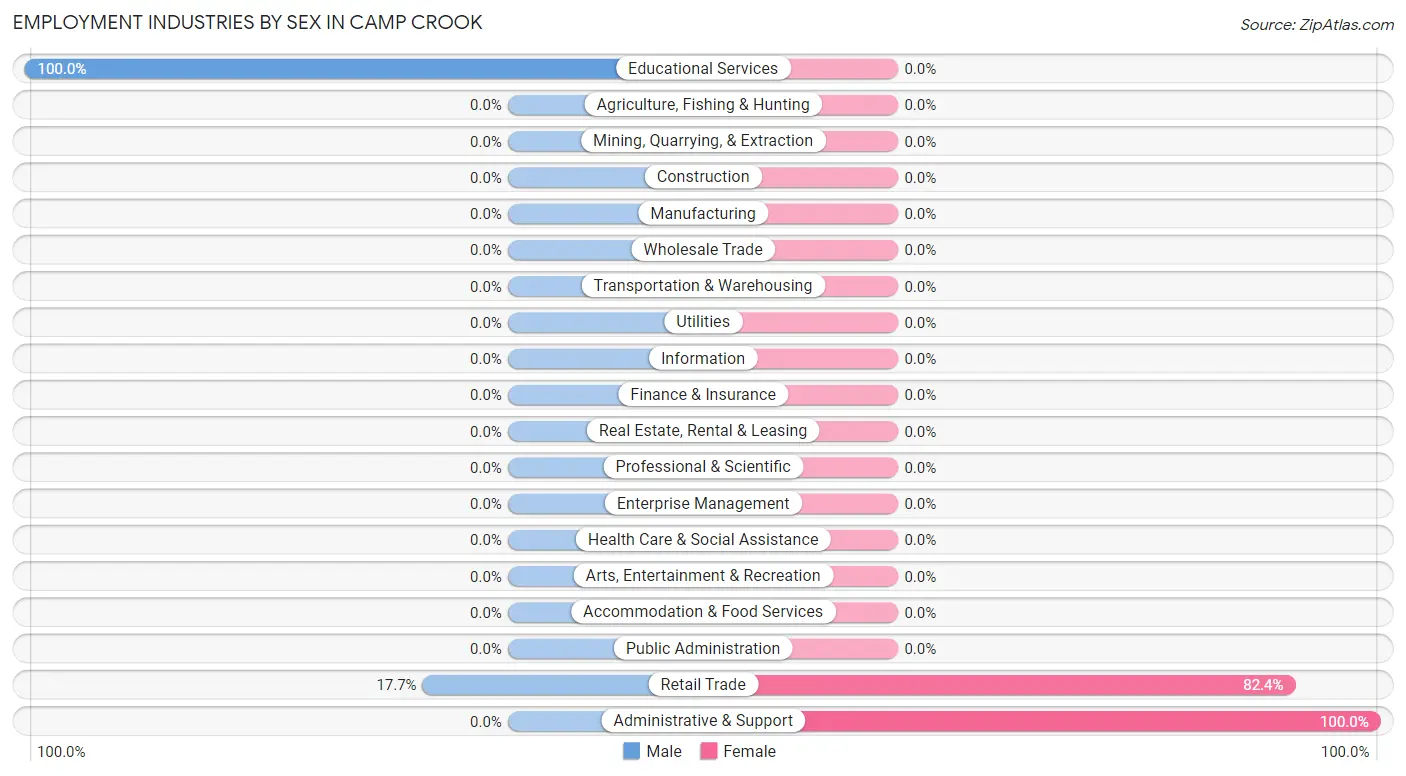
| Industry | Male | Female |
| Agriculture, Fishing & Hunting | 0 (0.0%) | 0 (0.0%) |
| Mining, Quarrying, & Extraction | 0 (0.0%) | 0 (0.0%) |
| Construction | 0 (0.0%) | 0 (0.0%) |
| Manufacturing | 0 (0.0%) | 0 (0.0%) |
| Wholesale Trade | 0 (0.0%) | 0 (0.0%) |
| Retail Trade | 3 (17.6%) | 14 (82.4%) |
| Transportation & Warehousing | 0 (0.0%) | 0 (0.0%) |
| Utilities | 0 (0.0%) | 0 (0.0%) |
| Information | 0 (0.0%) | 0 (0.0%) |
| Finance & Insurance | 0 (0.0%) | 0 (0.0%) |
| Real Estate, Rental & Leasing | 0 (0.0%) | 0 (0.0%) |
| Professional & Scientific | 0 (0.0%) | 0 (0.0%) |
| Enterprise Management | 0 (0.0%) | 0 (0.0%) |
| Administrative & Support | 0 (0.0%) | 1 (100.0%) |
| Educational Services | 2 (100.0%) | 0 (0.0%) |
| Health Care & Social Assistance | 0 (0.0%) | 0 (0.0%) |
| Arts, Entertainment & Recreation | 0 (0.0%) | 0 (0.0%) |
| Accommodation & Food Services | 0 (0.0%) | 0 (0.0%) |
| Public Administration | 0 (0.0%) | 0 (0.0%) |
| Total | 5 (25.0%) | 15 (75.0%) |
Education in Camp Crook
School Enrollment in Camp Crook
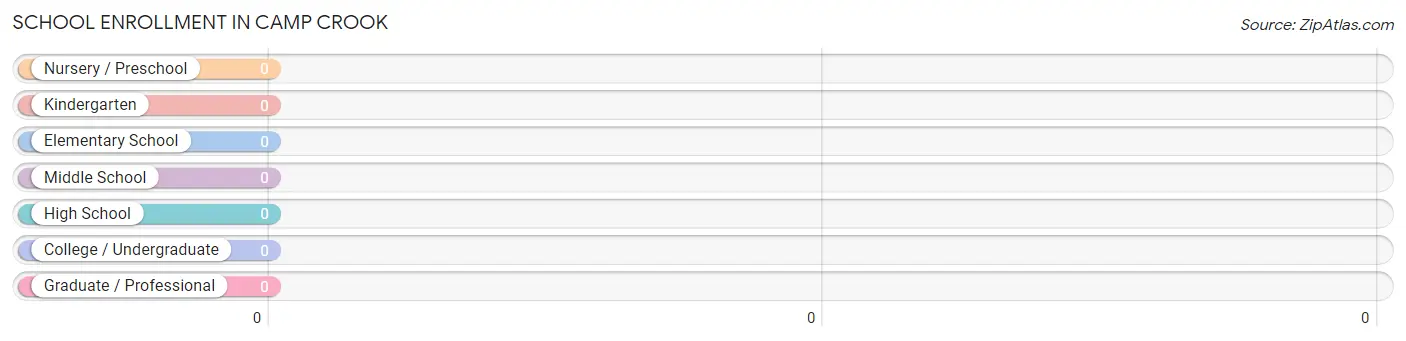
| School Level | # Students | % Students |
| Nursery / Preschool | 0 | 0.0% |
| Kindergarten | 0 | 0.0% |
| Elementary School | 0 | 0.0% |
| Middle School | 0 | 0.0% |
| High School | 0 | 0.0% |
| College / Undergraduate | 0 | 0.0% |
| Graduate / Professional | 0 | 0.0% |
| Total | 0 | 0.0% |
School Enrollment by Age by Funding Source in Camp Crook
| Age Bracket | Public School | Private School |
| 3 to 4 Year Olds | 0 (0.0%) | 0 (0.0%) |
| 5 to 9 Year Old | 0 (0.0%) | 0 (0.0%) |
| 10 to 14 Year Olds | 0 (0.0%) | 0 (0.0%) |
| 15 to 17 Year Olds | 0 (0.0%) | 0 (0.0%) |
| 18 to 19 Year Olds | 0 (0.0%) | 0 (0.0%) |
| 20 to 24 Year Olds | 0 (0.0%) | 0 (0.0%) |
| 25 to 34 Year Olds | 0 (0.0%) | 0 (0.0%) |
| 35 Years and over | 0 (0.0%) | 0 (0.0%) |
| Total | 0 (0.0%) | 0 (0.0%) |
Educational Attainment by Field of Study in Camp Crook
Education (4 | 80.0%), and psychology (1 | 20.0%) are the most common fields of study among 5 individuals in Camp Crook who have obtained a bachelor's degree or higher.
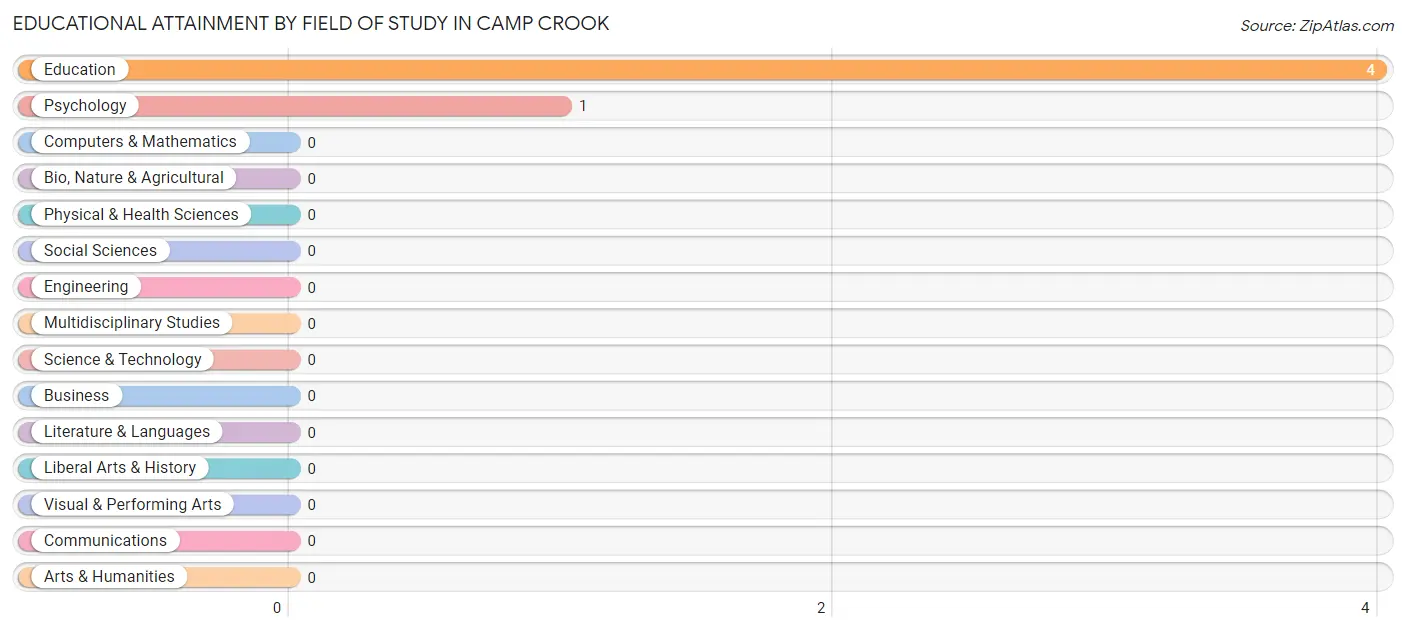
| Field of Study | # Graduates | % Graduates |
| Computers & Mathematics | 0 | 0.0% |
| Bio, Nature & Agricultural | 0 | 0.0% |
| Physical & Health Sciences | 0 | 0.0% |
| Psychology | 1 | 20.0% |
| Social Sciences | 0 | 0.0% |
| Engineering | 0 | 0.0% |
| Multidisciplinary Studies | 0 | 0.0% |
| Science & Technology | 0 | 0.0% |
| Business | 0 | 0.0% |
| Education | 4 | 80.0% |
| Literature & Languages | 0 | 0.0% |
| Liberal Arts & History | 0 | 0.0% |
| Visual & Performing Arts | 0 | 0.0% |
| Communications | 0 | 0.0% |
| Arts & Humanities | 0 | 0.0% |
| Total | 5 | 100.0% |
Transportation & Commute in Camp Crook
Vehicle Availability by Sex in Camp Crook
The most prevalent vehicle ownership categories in Camp Crook are males with 4 vehicles (3, accounting for 60.0%) and females with 4 vehicles (3, making up 20.0%).
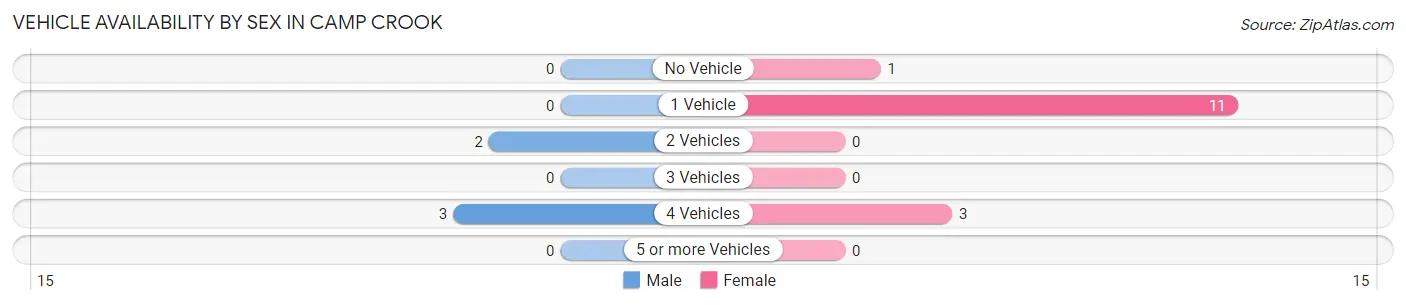
| Vehicles Available | Male | Female |
| No Vehicle | 0 (0.0%) | 1 (6.7%) |
| 1 Vehicle | 0 (0.0%) | 11 (73.3%) |
| 2 Vehicles | 2 (40.0%) | 0 (0.0%) |
| 3 Vehicles | 0 (0.0%) | 0 (0.0%) |
| 4 Vehicles | 3 (60.0%) | 3 (20.0%) |
| 5 or more Vehicles | 0 (0.0%) | 0 (0.0%) |
| Total | 5 (100.0%) | 15 (100.0%) |
Commute Time in Camp Crook
The most frequently occuring commute durations in Camp Crook are 25 to 29 minutes (19 commuters, 95.0%), 5 to 9 minutes (1 commuters, 5.0%), and less than 5 minutes (0 commuters, 0.0%).
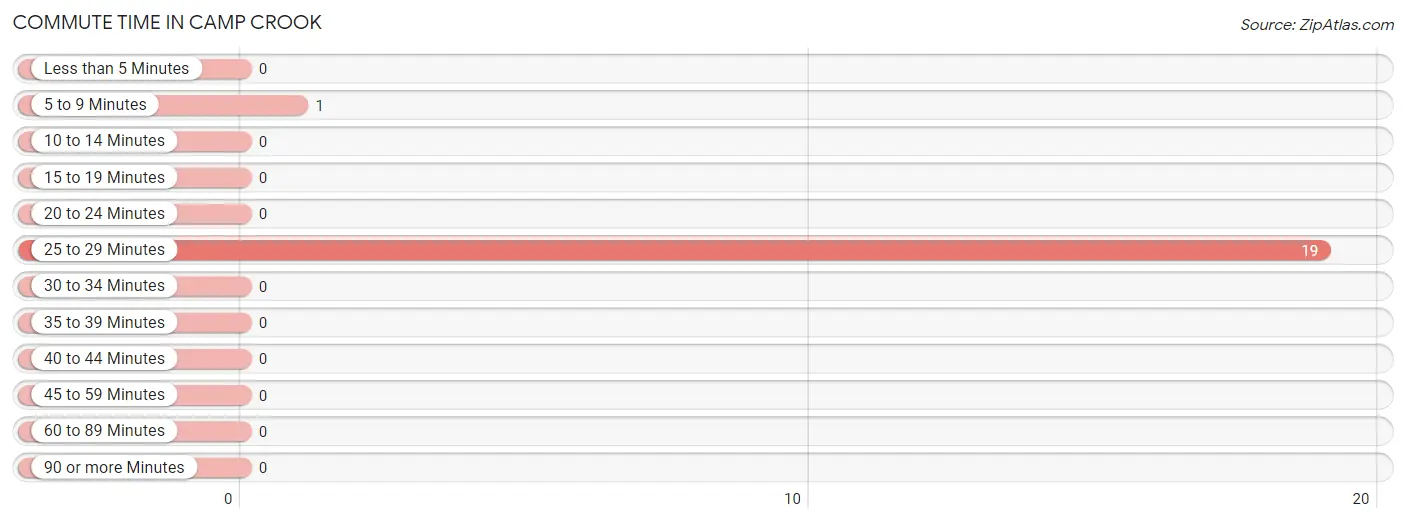
| Commute Time | # Commuters | % Commuters |
| Less than 5 Minutes | 0 | 0.0% |
| 5 to 9 Minutes | 1 | 5.0% |
| 10 to 14 Minutes | 0 | 0.0% |
| 15 to 19 Minutes | 0 | 0.0% |
| 20 to 24 Minutes | 0 | 0.0% |
| 25 to 29 Minutes | 19 | 95.0% |
| 30 to 34 Minutes | 0 | 0.0% |
| 35 to 39 Minutes | 0 | 0.0% |
| 40 to 44 Minutes | 0 | 0.0% |
| 45 to 59 Minutes | 0 | 0.0% |
| 60 to 89 Minutes | 0 | 0.0% |
| 90 or more Minutes | 0 | 0.0% |
Commute Time by Sex in Camp Crook
The most common commute times in Camp Crook are 25 to 29 minutes (5 commuters, 100.0%) for males and 25 to 29 minutes (14 commuters, 93.3%) for females.
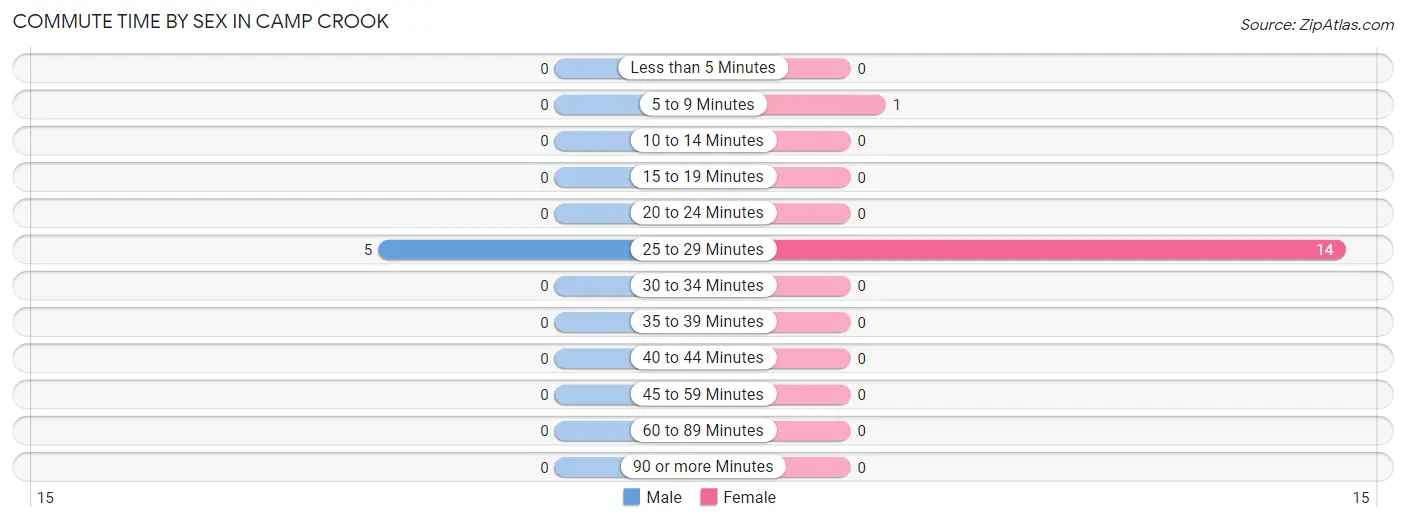
| Commute Time | Male | Female |
| Less than 5 Minutes | 0 (0.0%) | 0 (0.0%) |
| 5 to 9 Minutes | 0 (0.0%) | 1 (6.7%) |
| 10 to 14 Minutes | 0 (0.0%) | 0 (0.0%) |
| 15 to 19 Minutes | 0 (0.0%) | 0 (0.0%) |
| 20 to 24 Minutes | 0 (0.0%) | 0 (0.0%) |
| 25 to 29 Minutes | 5 (100.0%) | 14 (93.3%) |
| 30 to 34 Minutes | 0 (0.0%) | 0 (0.0%) |
| 35 to 39 Minutes | 0 (0.0%) | 0 (0.0%) |
| 40 to 44 Minutes | 0 (0.0%) | 0 (0.0%) |
| 45 to 59 Minutes | 0 (0.0%) | 0 (0.0%) |
| 60 to 89 Minutes | 0 (0.0%) | 0 (0.0%) |
| 90 or more Minutes | 0 (0.0%) | 0 (0.0%) |
Time of Departure to Work by Sex in Camp Crook
The most frequent times of departure to work in Camp Crook are 8:00 AM to 8:29 AM (3, 60.0%) for males and 7:00 AM to 7:29 AM (14, 93.3%) for females.
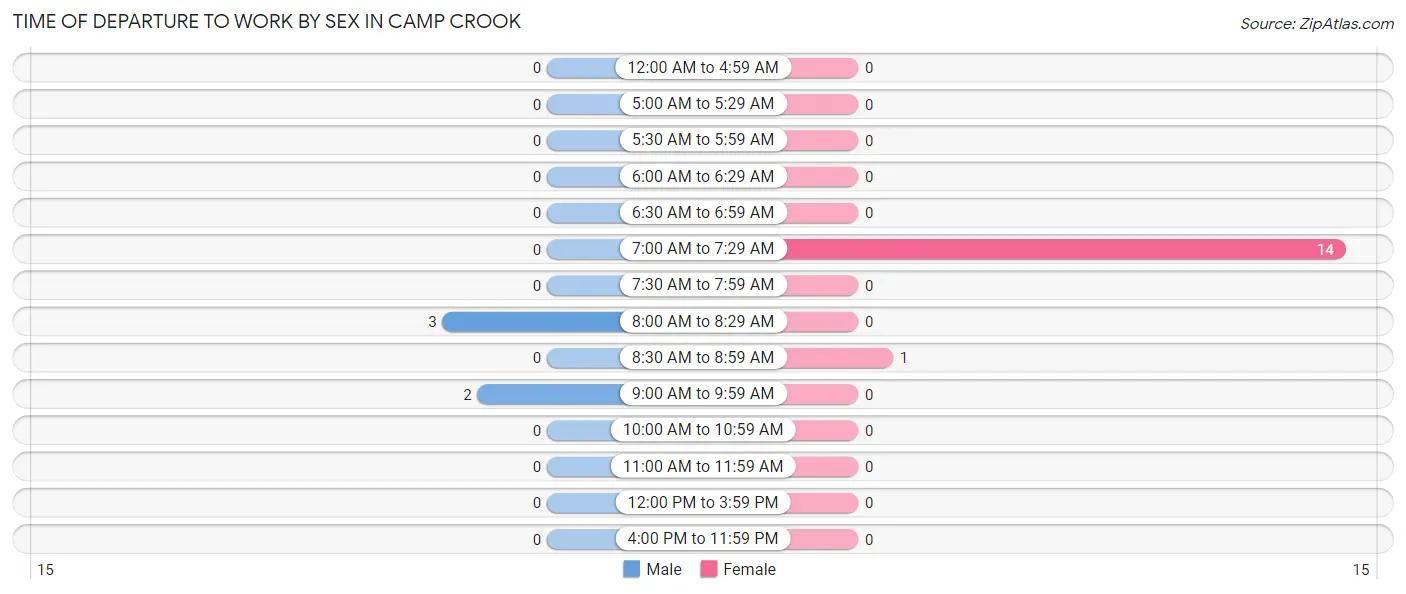
| Time of Departure | Male | Female |
| 12:00 AM to 4:59 AM | 0 (0.0%) | 0 (0.0%) |
| 5:00 AM to 5:29 AM | 0 (0.0%) | 0 (0.0%) |
| 5:30 AM to 5:59 AM | 0 (0.0%) | 0 (0.0%) |
| 6:00 AM to 6:29 AM | 0 (0.0%) | 0 (0.0%) |
| 6:30 AM to 6:59 AM | 0 (0.0%) | 0 (0.0%) |
| 7:00 AM to 7:29 AM | 0 (0.0%) | 14 (93.3%) |
| 7:30 AM to 7:59 AM | 0 (0.0%) | 0 (0.0%) |
| 8:00 AM to 8:29 AM | 3 (60.0%) | 0 (0.0%) |
| 8:30 AM to 8:59 AM | 0 (0.0%) | 1 (6.7%) |
| 9:00 AM to 9:59 AM | 2 (40.0%) | 0 (0.0%) |
| 10:00 AM to 10:59 AM | 0 (0.0%) | 0 (0.0%) |
| 11:00 AM to 11:59 AM | 0 (0.0%) | 0 (0.0%) |
| 12:00 PM to 3:59 PM | 0 (0.0%) | 0 (0.0%) |
| 4:00 PM to 11:59 PM | 0 (0.0%) | 0 (0.0%) |
| Total | 5 (100.0%) | 15 (100.0%) |
Housing Occupancy in Camp Crook
Occupancy by Ownership in Camp Crook
Of the total 28 dwellings in Camp Crook, owner-occupied units account for 28 (100.0%), while renter-occupied units make up 0 (0.0%).
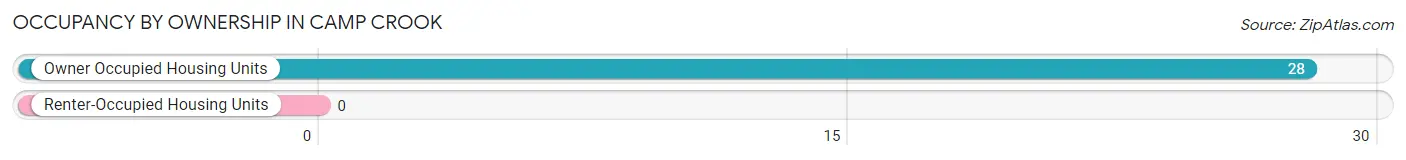
| Occupancy | # Housing Units | % Housing Units |
| Owner Occupied Housing Units | 28 | 100.0% |
| Renter-Occupied Housing Units | 0 | 0.0% |
| Total Occupied Housing Units | 28 | 100.0% |
Occupancy by Household Size in Camp Crook
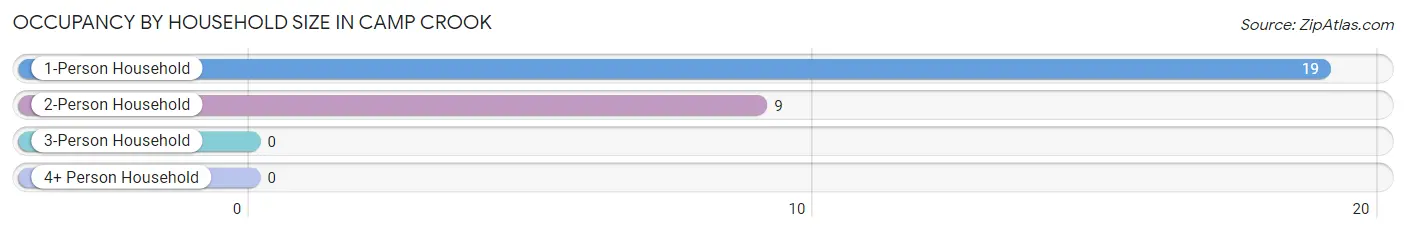
| Household Size | # Housing Units | % Housing Units |
| 1-Person Household | 19 | 67.9% |
| 2-Person Household | 9 | 32.1% |
| 3-Person Household | 0 | 0.0% |
| 4+ Person Household | 0 | 0.0% |
| Total Housing Units | 28 | 100.0% |
Occupancy by Ownership by Household Size in Camp Crook
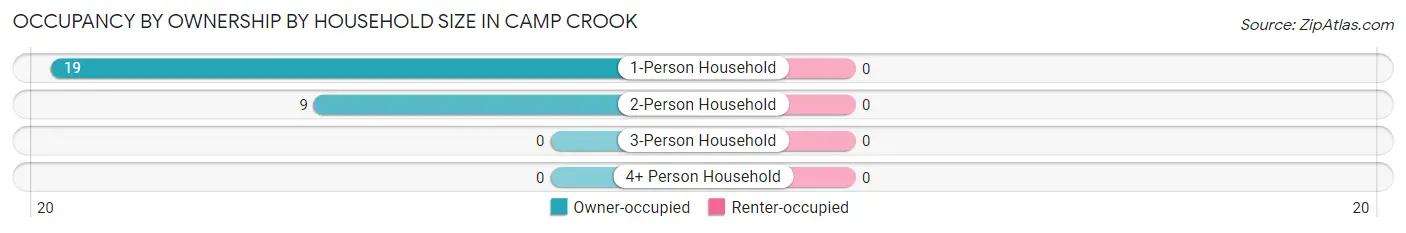
| Household Size | Owner-occupied | Renter-occupied |
| 1-Person Household | 19 (100.0%) | 0 (0.0%) |
| 2-Person Household | 9 (100.0%) | 0 (0.0%) |
| 3-Person Household | 0 (0.0%) | 0 (0.0%) |
| 4+ Person Household | 0 (0.0%) | 0 (0.0%) |
| Total Housing Units | 28 (100.0%) | 0 (0.0%) |
Occupancy by Educational Attainment in Camp Crook
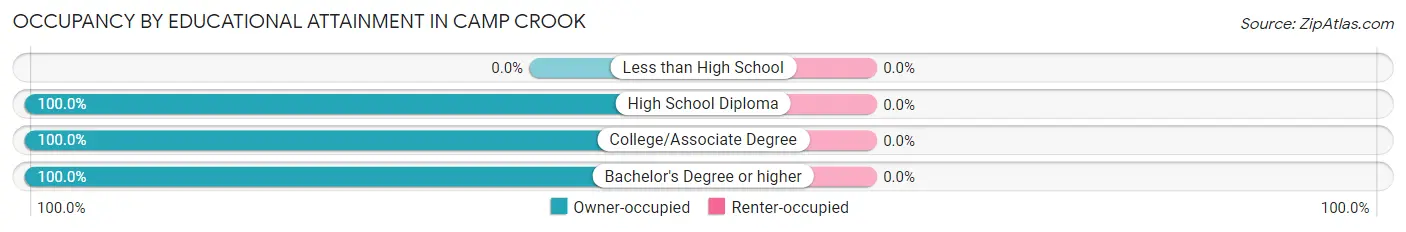
| Household Size | Owner-occupied | Renter-occupied |
| Less than High School | 0 (0.0%) | 0 (0.0%) |
| High School Diploma | 16 (100.0%) | 0 (0.0%) |
| College/Associate Degree | 9 (100.0%) | 0 (0.0%) |
| Bachelor's Degree or higher | 3 (100.0%) | 0 (0.0%) |
Occupancy by Age of Householder in Camp Crook
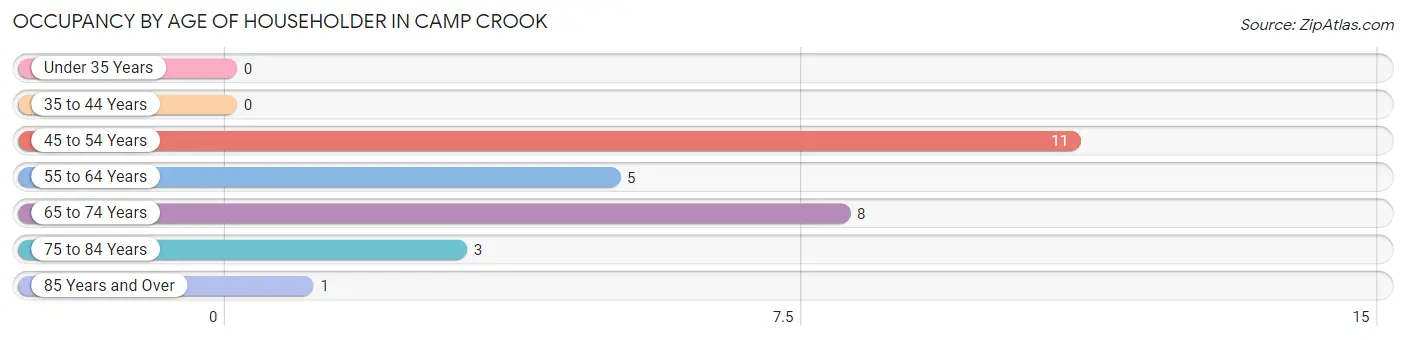
| Age Bracket | # Households | % Households |
| Under 35 Years | 0 | 0.0% |
| 35 to 44 Years | 0 | 0.0% |
| 45 to 54 Years | 11 | 39.3% |
| 55 to 64 Years | 5 | 17.9% |
| 65 to 74 Years | 8 | 28.6% |
| 75 to 84 Years | 3 | 10.7% |
| 85 Years and Over | 1 | 3.6% |
| Total | 28 | 100.0% |
Housing Finances in Camp Crook
Median Income by Occupancy in Camp Crook
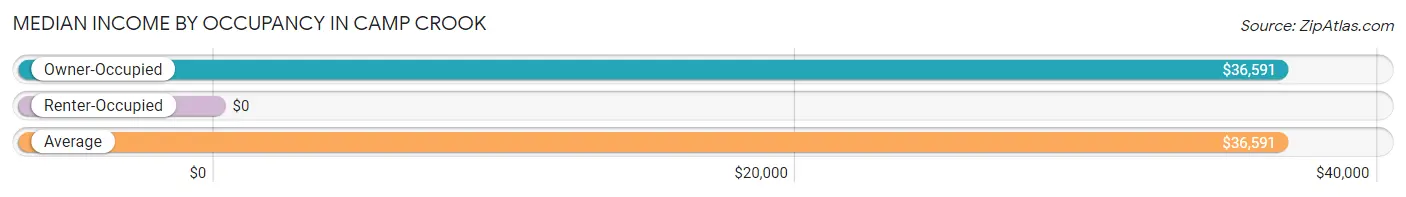
| Occupancy Type | # Households | Median Income |
| Owner-Occupied | 28 (100.0%) | $36,591 |
| Renter-Occupied | 0 (0.0%) | $0 |
| Average | 28 (100.0%) | $36,591 |
Occupancy by Householder Income Bracket in Camp Crook
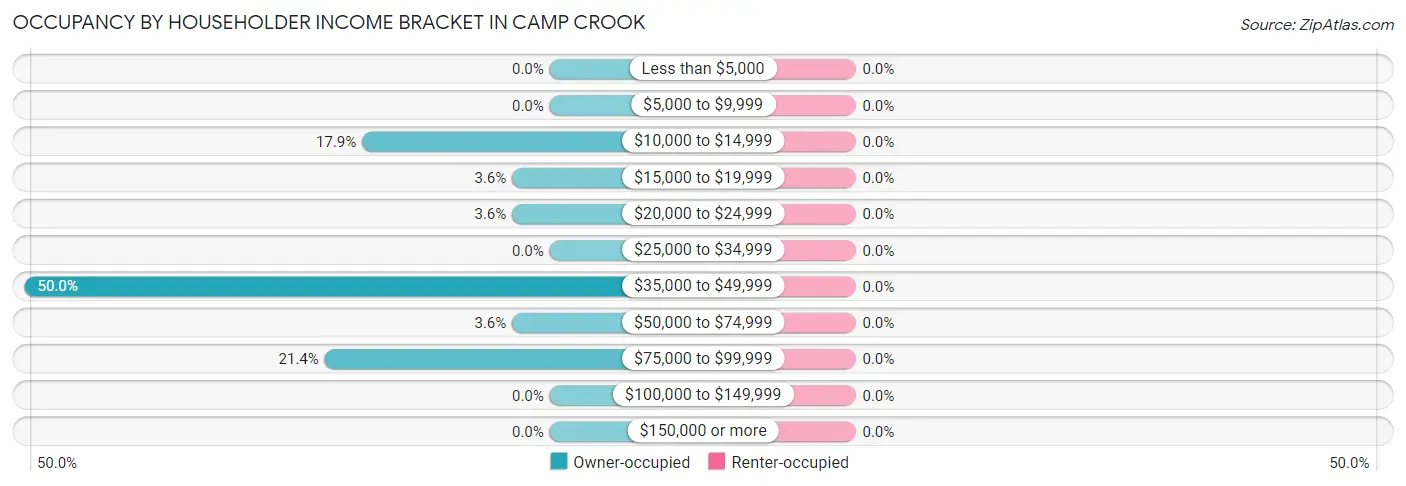
| Income Bracket | Owner-occupied | Renter-occupied |
| Less than $5,000 | 0 (0.0%) | 0 (0.0%) |
| $5,000 to $9,999 | 0 (0.0%) | 0 (0.0%) |
| $10,000 to $14,999 | 5 (17.9%) | 0 (0.0%) |
| $15,000 to $19,999 | 1 (3.6%) | 0 (0.0%) |
| $20,000 to $24,999 | 1 (3.6%) | 0 (0.0%) |
| $25,000 to $34,999 | 0 (0.0%) | 0 (0.0%) |
| $35,000 to $49,999 | 14 (50.0%) | 0 (0.0%) |
| $50,000 to $74,999 | 1 (3.6%) | 0 (0.0%) |
| $75,000 to $99,999 | 6 (21.4%) | 0 (0.0%) |
| $100,000 to $149,999 | 0 (0.0%) | 0 (0.0%) |
| $150,000 or more | 0 (0.0%) | 0 (0.0%) |
| Total | 28 (100.0%) | 0 (0.0%) |
Monthly Housing Cost Tiers in Camp Crook
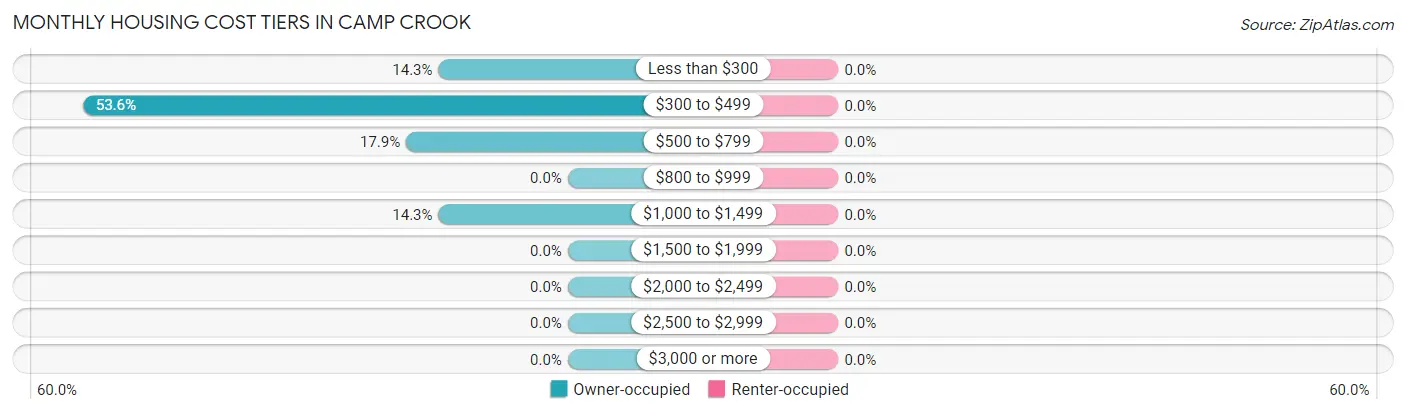
| Monthly Cost | Owner-occupied | Renter-occupied |
| Less than $300 | 4 (14.3%) | 0 (0.0%) |
| $300 to $499 | 15 (53.6%) | 0 (0.0%) |
| $500 to $799 | 5 (17.9%) | 0 (0.0%) |
| $800 to $999 | 0 (0.0%) | 0 (0.0%) |
| $1,000 to $1,499 | 4 (14.3%) | 0 (0.0%) |
| $1,500 to $1,999 | 0 (0.0%) | 0 (0.0%) |
| $2,000 to $2,499 | 0 (0.0%) | 0 (0.0%) |
| $2,500 to $2,999 | 0 (0.0%) | 0 (0.0%) |
| $3,000 or more | 0 (0.0%) | 0 (0.0%) |
| Total | 28 (100.0%) | 0 (0.0%) |
Physical Housing Characteristics in Camp Crook
Housing Structures in Camp Crook
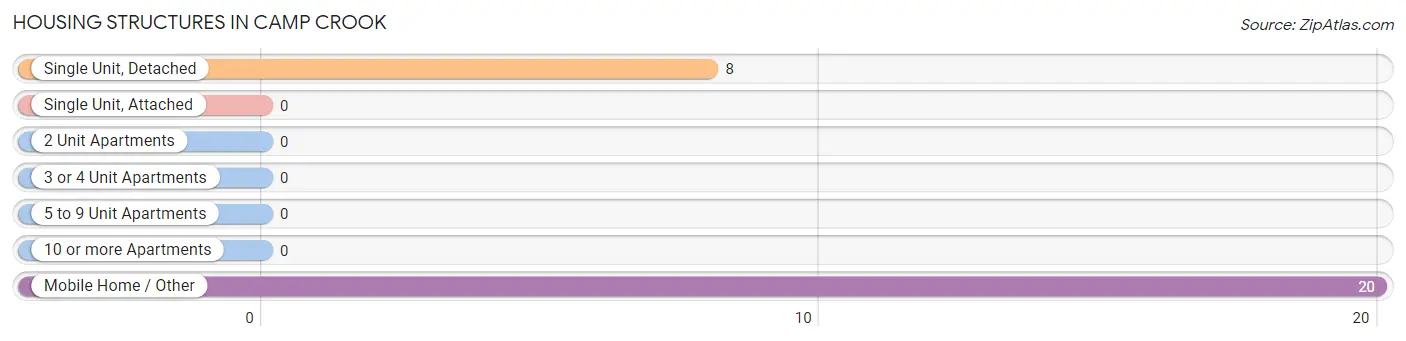
| Structure Type | # Housing Units | % Housing Units |
| Single Unit, Detached | 8 | 28.6% |
| Single Unit, Attached | 0 | 0.0% |
| 2 Unit Apartments | 0 | 0.0% |
| 3 or 4 Unit Apartments | 0 | 0.0% |
| 5 to 9 Unit Apartments | 0 | 0.0% |
| 10 or more Apartments | 0 | 0.0% |
| Mobile Home / Other | 20 | 71.4% |
| Total | 28 | 100.0% |
Housing Structures by Occupancy in Camp Crook
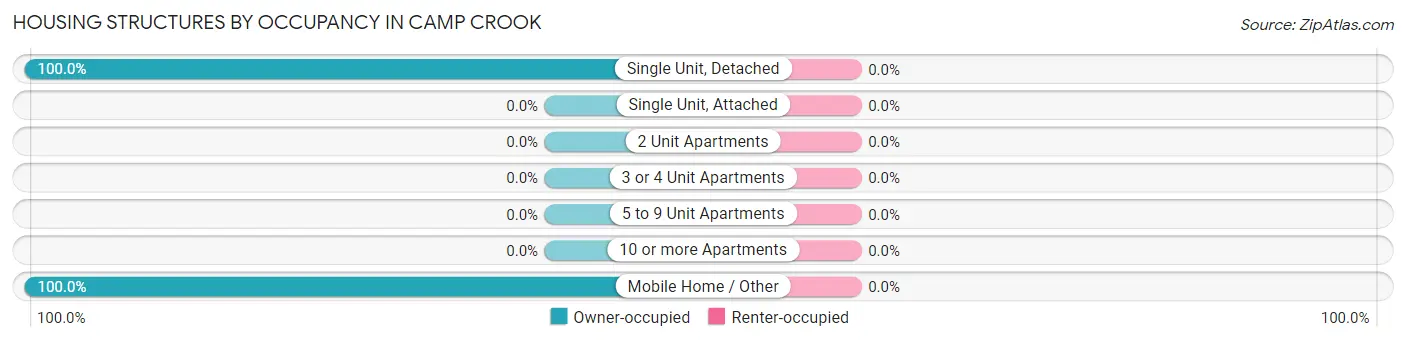
| Structure Type | Owner-occupied | Renter-occupied |
| Single Unit, Detached | 8 (100.0%) | 0 (0.0%) |
| Single Unit, Attached | 0 (0.0%) | 0 (0.0%) |
| 2 Unit Apartments | 0 (0.0%) | 0 (0.0%) |
| 3 or 4 Unit Apartments | 0 (0.0%) | 0 (0.0%) |
| 5 to 9 Unit Apartments | 0 (0.0%) | 0 (0.0%) |
| 10 or more Apartments | 0 (0.0%) | 0 (0.0%) |
| Mobile Home / Other | 20 (100.0%) | 0 (0.0%) |
| Total | 28 (100.0%) | 0 (0.0%) |
Housing Structures by Number of Rooms in Camp Crook
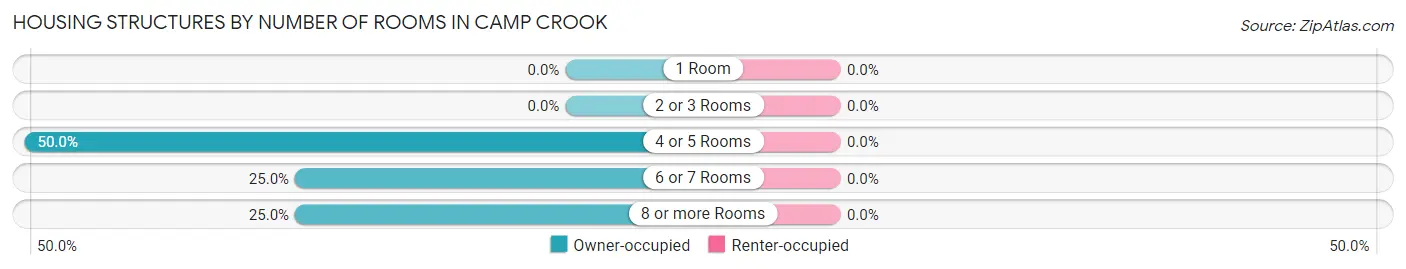
| Number of Rooms | Owner-occupied | Renter-occupied |
| 1 Room | 0 (0.0%) | 0 (0.0%) |
| 2 or 3 Rooms | 0 (0.0%) | 0 (0.0%) |
| 4 or 5 Rooms | 14 (50.0%) | 0 (0.0%) |
| 6 or 7 Rooms | 7 (25.0%) | 0 (0.0%) |
| 8 or more Rooms | 7 (25.0%) | 0 (0.0%) |
| Total | 28 (100.0%) | 0 (0.0%) |
Housing Structure by Heating Type in Camp Crook
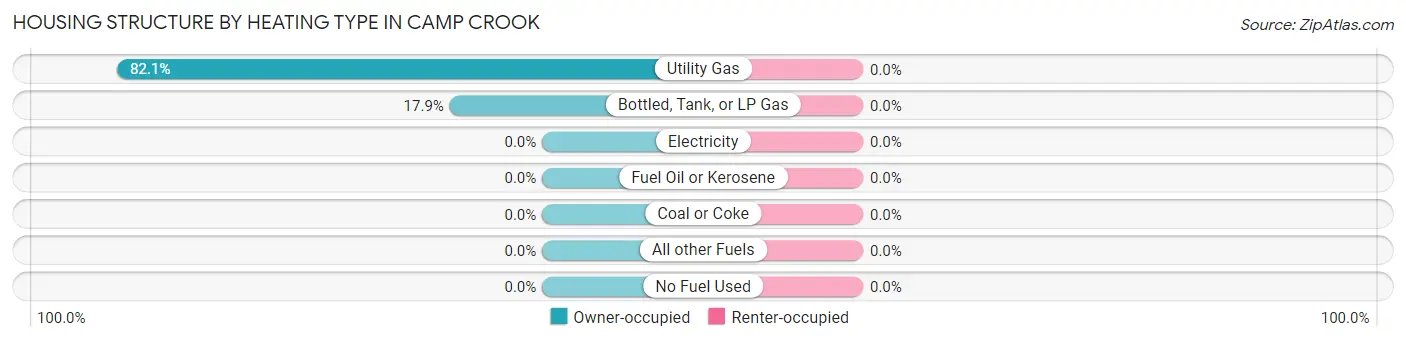
| Heating Type | Owner-occupied | Renter-occupied |
| Utility Gas | 23 (82.1%) | 0 (0.0%) |
| Bottled, Tank, or LP Gas | 5 (17.9%) | 0 (0.0%) |
| Electricity | 0 (0.0%) | 0 (0.0%) |
| Fuel Oil or Kerosene | 0 (0.0%) | 0 (0.0%) |
| Coal or Coke | 0 (0.0%) | 0 (0.0%) |
| All other Fuels | 0 (0.0%) | 0 (0.0%) |
| No Fuel Used | 0 (0.0%) | 0 (0.0%) |
| Total | 28 (100.0%) | 0 (0.0%) |
Household Vehicle Usage in Camp Crook
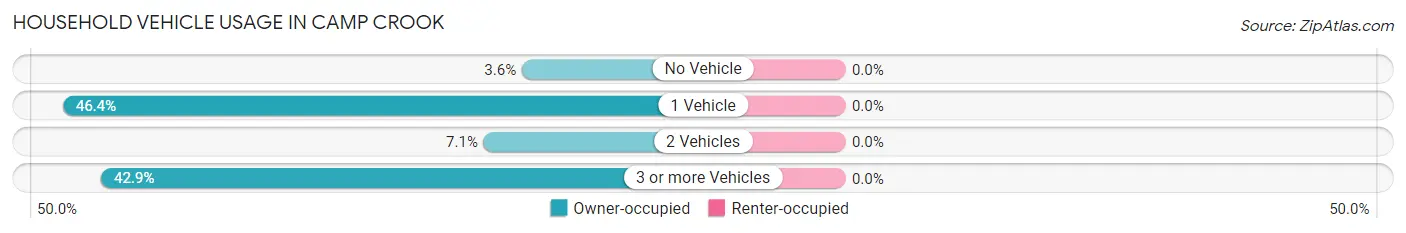
| Vehicles per Household | Owner-occupied | Renter-occupied |
| No Vehicle | 1 (3.6%) | 0 (0.0%) |
| 1 Vehicle | 13 (46.4%) | 0 (0.0%) |
| 2 Vehicles | 2 (7.1%) | 0 (0.0%) |
| 3 or more Vehicles | 12 (42.9%) | 0 (0.0%) |
| Total | 28 (100.0%) | 0 (0.0%) |
Real Estate & Mortgages in Camp Crook
Real Estate and Mortgage Overview in Camp Crook
| Characteristic | Without Mortgage | With Mortgage |
| Housing Units | 24 | 4 |
| Median Property Value | $66,900 | $0 |
| Median Household Income | $37,045 | $0 |
| Monthly Housing Costs | $446 | $0 |
| Real Estate Taxes | $891 | $0 |
Property Value by Mortgage Status in Camp Crook
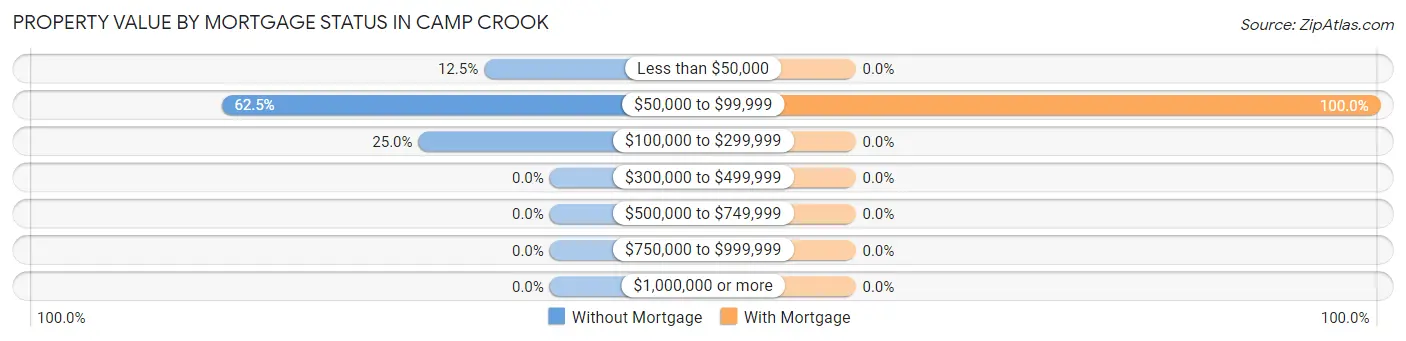
| Property Value | Without Mortgage | With Mortgage |
| Less than $50,000 | 3 (12.5%) | 0 (0.0%) |
| $50,000 to $99,999 | 15 (62.5%) | 4 (100.0%) |
| $100,000 to $299,999 | 6 (25.0%) | 0 (0.0%) |
| $300,000 to $499,999 | 0 (0.0%) | 0 (0.0%) |
| $500,000 to $749,999 | 0 (0.0%) | 0 (0.0%) |
| $750,000 to $999,999 | 0 (0.0%) | 0 (0.0%) |
| $1,000,000 or more | 0 (0.0%) | 0 (0.0%) |
| Total | 24 (100.0%) | 4 (100.0%) |
Household Income by Mortgage Status in Camp Crook
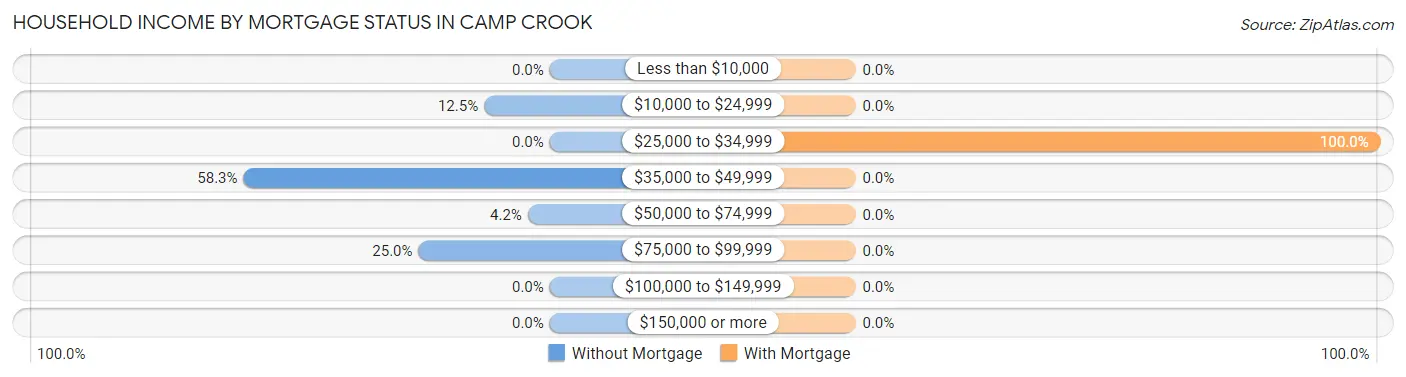
| Household Income | Without Mortgage | With Mortgage |
| Less than $10,000 | 0 (0.0%) | 0 (0.0%) |
| $10,000 to $24,999 | 3 (12.5%) | 0 (0.0%) |
| $25,000 to $34,999 | 0 (0.0%) | 4 (100.0%) |
| $35,000 to $49,999 | 14 (58.3%) | 0 (0.0%) |
| $50,000 to $74,999 | 1 (4.2%) | 0 (0.0%) |
| $75,000 to $99,999 | 6 (25.0%) | 0 (0.0%) |
| $100,000 to $149,999 | 0 (0.0%) | 0 (0.0%) |
| $150,000 or more | 0 (0.0%) | 0 (0.0%) |
| Total | 24 (100.0%) | 4 (100.0%) |
Property Value to Household Income Ratio in Camp Crook
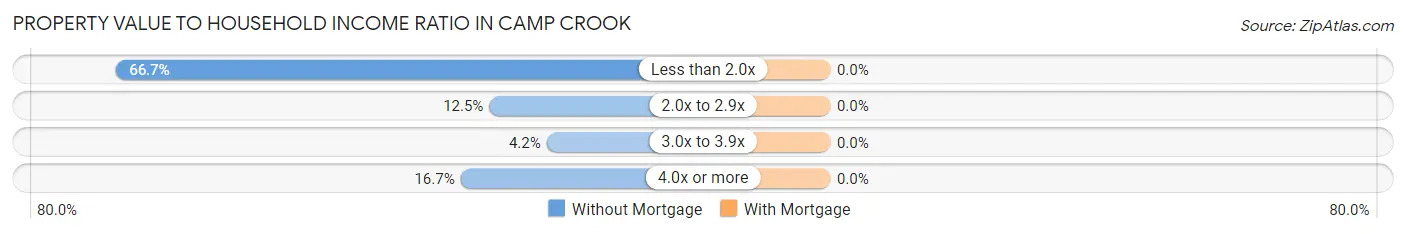
| Value-to-Income Ratio | Without Mortgage | With Mortgage |
| Less than 2.0x | 16 (66.7%) | 0 (0.0%) |
| 2.0x to 2.9x | 3 (12.5%) | 0 (0.0%) |
| 3.0x to 3.9x | 1 (4.2%) | 0 (0.0%) |
| 4.0x or more | 4 (16.7%) | 0 (0.0%) |
| Total | 24 (100.0%) | 4 (100.0%) |
Real Estate Taxes by Mortgage Status in Camp Crook
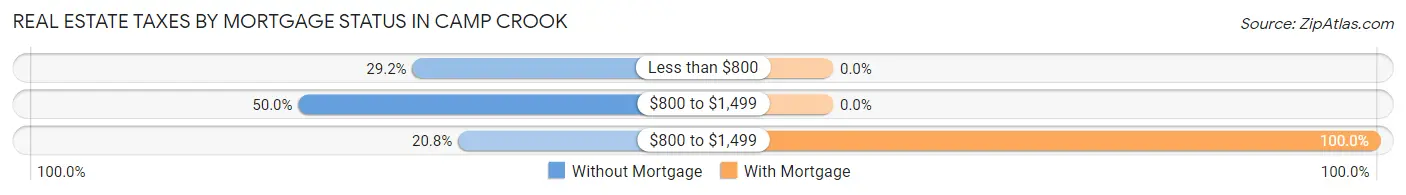
| Property Taxes | Without Mortgage | With Mortgage |
| Less than $800 | 7 (29.2%) | 0 (0.0%) |
| $800 to $1,499 | 12 (50.0%) | 0 (0.0%) |
| $800 to $1,499 | 5 (20.8%) | 4 (100.0%) |
| Total | 24 (100.0%) | 4 (100.0%) |
Health & Disability in Camp Crook
Health Insurance Coverage by Age in Camp Crook
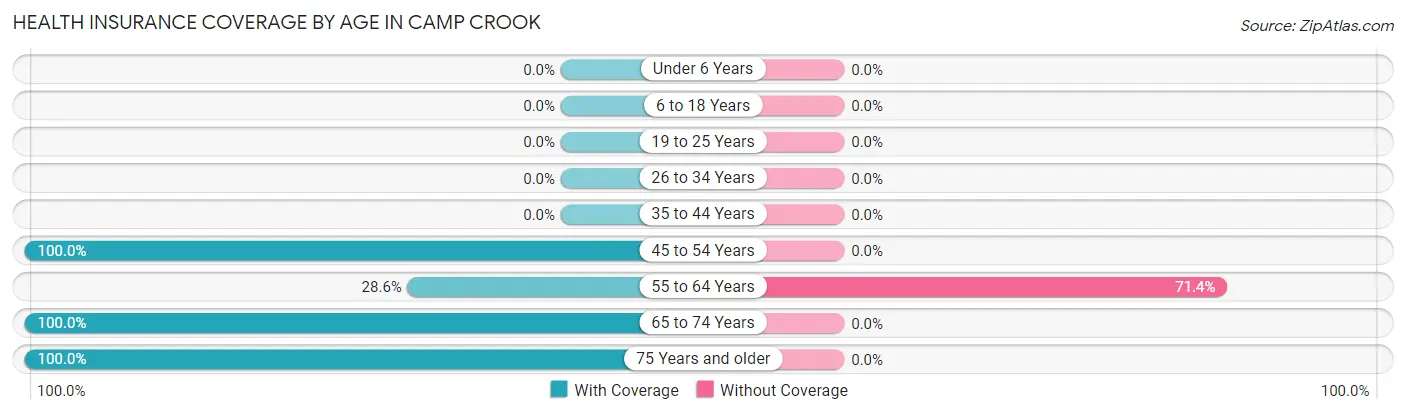
| Age Bracket | With Coverage | Without Coverage |
| Under 6 Years | 0 (0.0%) | 0 (0.0%) |
| 6 to 18 Years | 0 (0.0%) | 0 (0.0%) |
| 19 to 25 Years | 0 (0.0%) | 0 (0.0%) |
| 26 to 34 Years | 0 (0.0%) | 0 (0.0%) |
| 35 to 44 Years | 0 (0.0%) | 0 (0.0%) |
| 45 to 54 Years | 11 (100.0%) | 0 (0.0%) |
| 55 to 64 Years | 2 (28.6%) | 5 (71.4%) |
| 65 to 74 Years | 16 (100.0%) | 0 (0.0%) |
| 75 Years and older | 4 (100.0%) | 0 (0.0%) |
| Total | 33 (86.8%) | 5 (13.2%) |
Health Insurance Coverage by Citizenship Status in Camp Crook
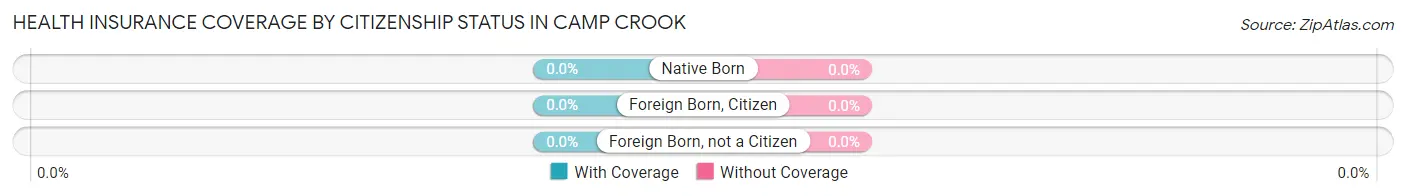
| Citizenship Status | With Coverage | Without Coverage |
| Native Born | 0 (0.0%) | 0 (0.0%) |
| Foreign Born, Citizen | 0 (0.0%) | 0 (0.0%) |
| Foreign Born, not a Citizen | 0 (0.0%) | 0 (0.0%) |
Health Insurance Coverage by Household Income in Camp Crook
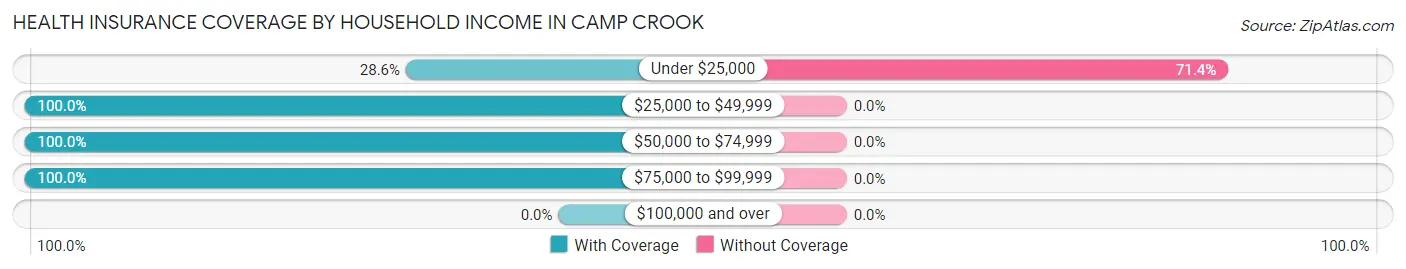
| Household Income | With Coverage | Without Coverage |
| Under $25,000 | 2 (28.6%) | 5 (71.4%) |
| $25,000 to $49,999 | 17 (100.0%) | 0 (0.0%) |
| $50,000 to $74,999 | 3 (100.0%) | 0 (0.0%) |
| $75,000 to $99,999 | 11 (100.0%) | 0 (0.0%) |
| $100,000 and over | 0 (0.0%) | 0 (0.0%) |
Public vs Private Health Insurance Coverage by Age in Camp Crook
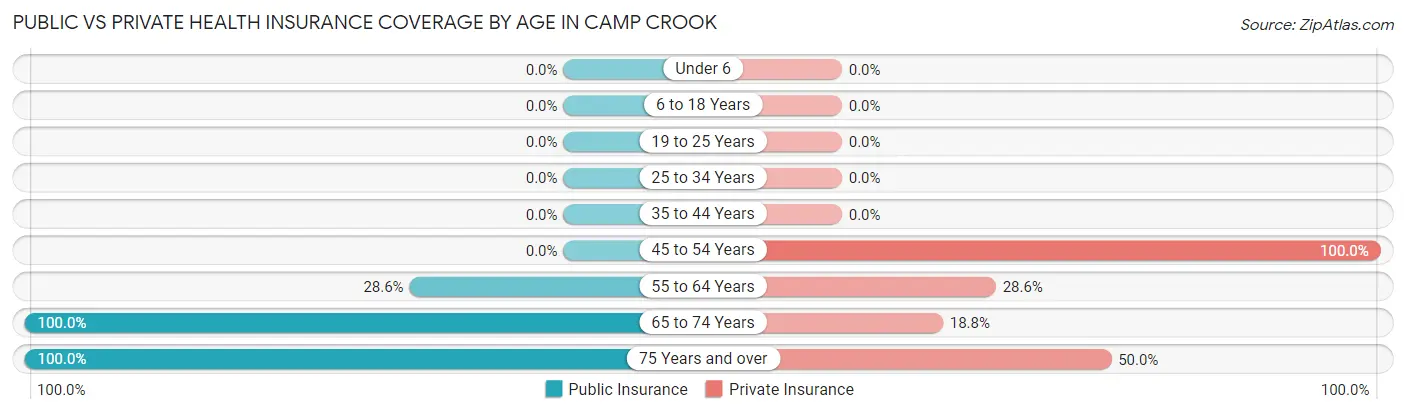
| Age Bracket | Public Insurance | Private Insurance |
| Under 6 | 0 (0.0%) | 0 (0.0%) |
| 6 to 18 Years | 0 (0.0%) | 0 (0.0%) |
| 19 to 25 Years | 0 (0.0%) | 0 (0.0%) |
| 25 to 34 Years | 0 (0.0%) | 0 (0.0%) |
| 35 to 44 Years | 0 (0.0%) | 0 (0.0%) |
| 45 to 54 Years | 0 (0.0%) | 11 (100.0%) |
| 55 to 64 Years | 2 (28.6%) | 2 (28.6%) |
| 65 to 74 Years | 16 (100.0%) | 3 (18.8%) |
| 75 Years and over | 4 (100.0%) | 2 (50.0%) |
| Total | 22 (57.9%) | 18 (47.4%) |
Disability Status by Sex by Age in Camp Crook
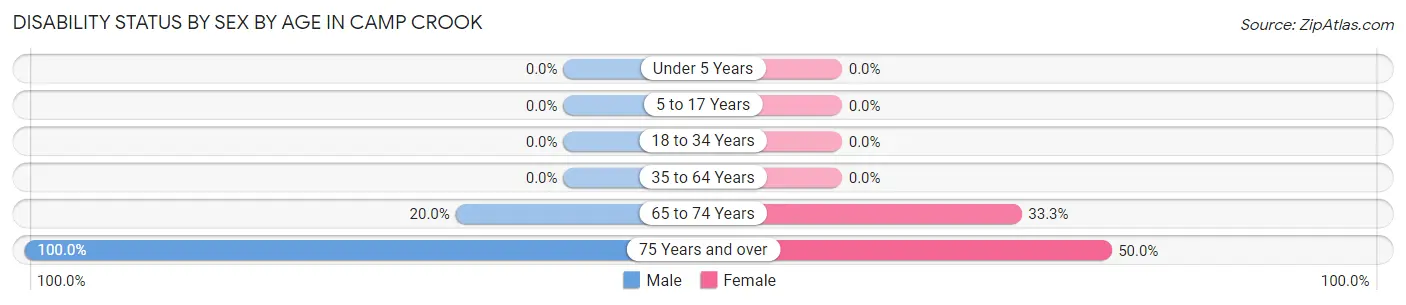
| Age Bracket | Male | Female |
| Under 5 Years | 0 (0.0%) | 0 (0.0%) |
| 5 to 17 Years | 0 (0.0%) | 0 (0.0%) |
| 18 to 34 Years | 0 (0.0%) | 0 (0.0%) |
| 35 to 64 Years | 0 (0.0%) | 0 (0.0%) |
| 65 to 74 Years | 2 (20.0%) | 2 (33.3%) |
| 75 Years and over | 2 (100.0%) | 1 (50.0%) |
Disability Class by Sex by Age in Camp Crook
Disability Class: Hearing Difficulty
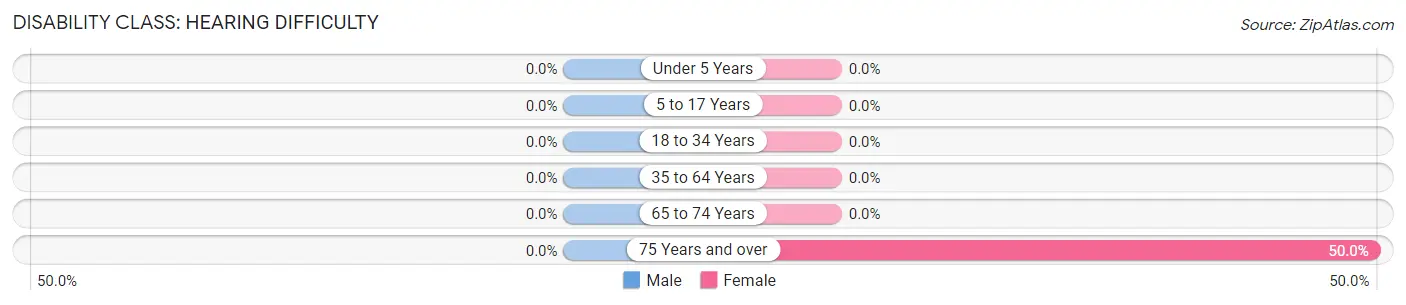
| Age Bracket | Male | Female |
| Under 5 Years | 0 (0.0%) | 0 (0.0%) |
| 5 to 17 Years | 0 (0.0%) | 0 (0.0%) |
| 18 to 34 Years | 0 (0.0%) | 0 (0.0%) |
| 35 to 64 Years | 0 (0.0%) | 0 (0.0%) |
| 65 to 74 Years | 0 (0.0%) | 0 (0.0%) |
| 75 Years and over | 0 (0.0%) | 1 (50.0%) |
Disability Class: Vision Difficulty
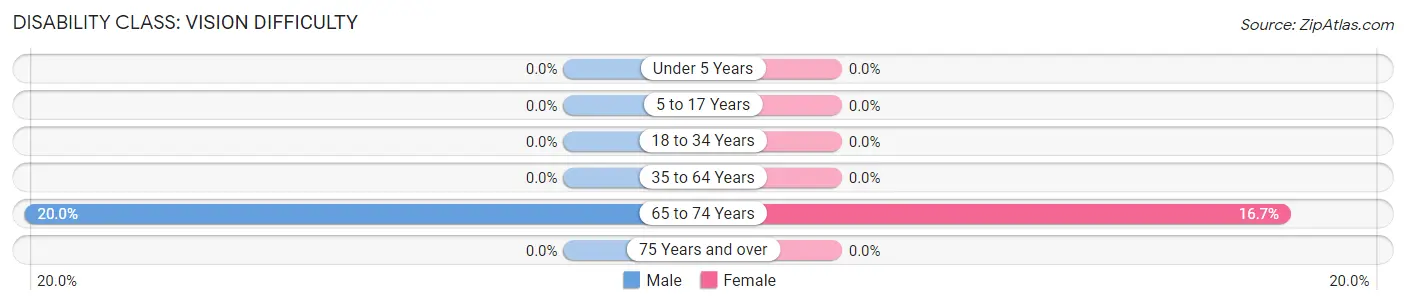
| Age Bracket | Male | Female |
| Under 5 Years | 0 (0.0%) | 0 (0.0%) |
| 5 to 17 Years | 0 (0.0%) | 0 (0.0%) |
| 18 to 34 Years | 0 (0.0%) | 0 (0.0%) |
| 35 to 64 Years | 0 (0.0%) | 0 (0.0%) |
| 65 to 74 Years | 2 (20.0%) | 1 (16.7%) |
| 75 Years and over | 0 (0.0%) | 0 (0.0%) |
Disability Class: Cognitive Difficulty
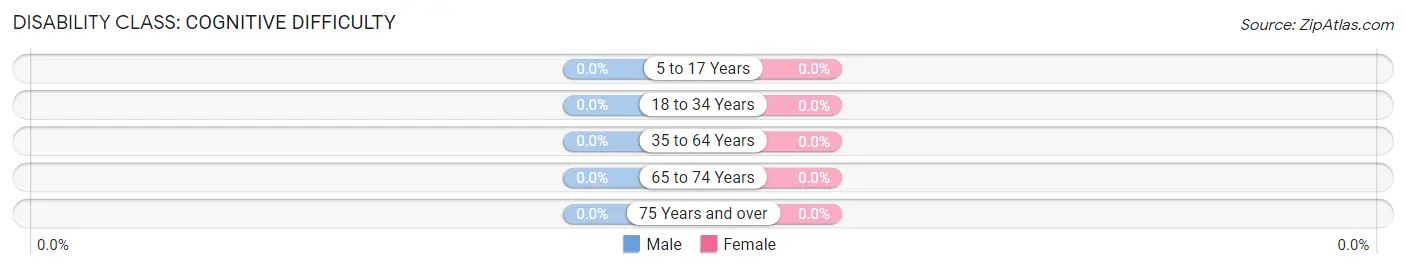
| Age Bracket | Male | Female |
| 5 to 17 Years | 0 (0.0%) | 0 (0.0%) |
| 18 to 34 Years | 0 (0.0%) | 0 (0.0%) |
| 35 to 64 Years | 0 (0.0%) | 0 (0.0%) |
| 65 to 74 Years | 0 (0.0%) | 0 (0.0%) |
| 75 Years and over | 0 (0.0%) | 0 (0.0%) |
Disability Class: Ambulatory Difficulty
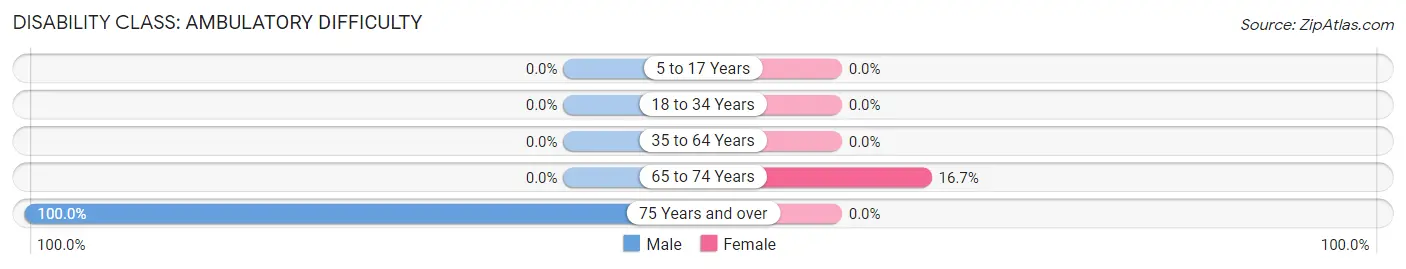
| Age Bracket | Male | Female |
| 5 to 17 Years | 0 (0.0%) | 0 (0.0%) |
| 18 to 34 Years | 0 (0.0%) | 0 (0.0%) |
| 35 to 64 Years | 0 (0.0%) | 0 (0.0%) |
| 65 to 74 Years | 0 (0.0%) | 1 (16.7%) |
| 75 Years and over | 2 (100.0%) | 0 (0.0%) |
Disability Class: Self-Care Difficulty
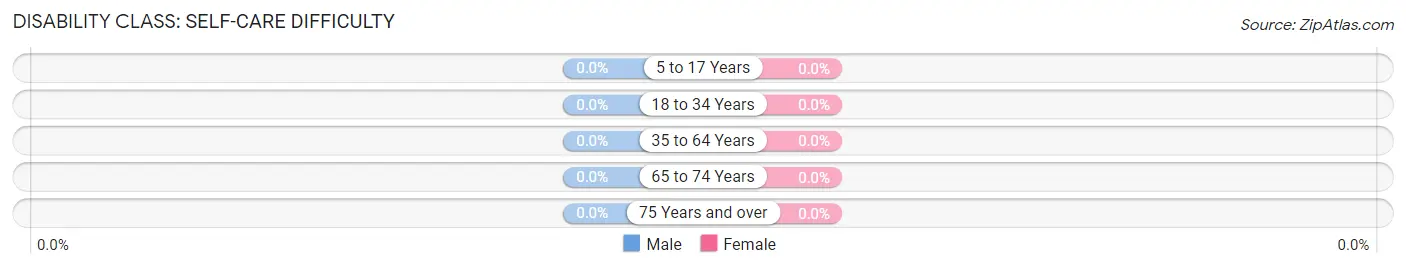
| Age Bracket | Male | Female |
| 5 to 17 Years | 0 (0.0%) | 0 (0.0%) |
| 18 to 34 Years | 0 (0.0%) | 0 (0.0%) |
| 35 to 64 Years | 0 (0.0%) | 0 (0.0%) |
| 65 to 74 Years | 0 (0.0%) | 0 (0.0%) |
| 75 Years and over | 0 (0.0%) | 0 (0.0%) |
Technology Access in Camp Crook
Computing Device Access in Camp Crook
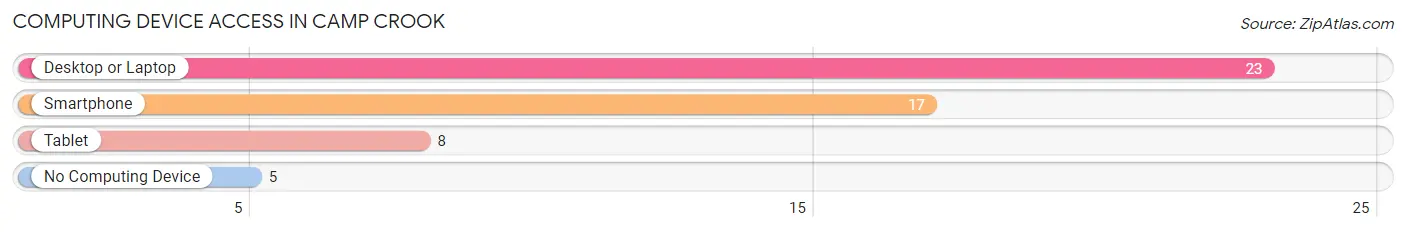
| Device Type | # Households | % Households |
| Desktop or Laptop | 23 | 82.1% |
| Smartphone | 17 | 60.7% |
| Tablet | 8 | 28.6% |
| No Computing Device | 5 | 17.9% |
| Total | 28 | 100.0% |
Internet Access in Camp Crook
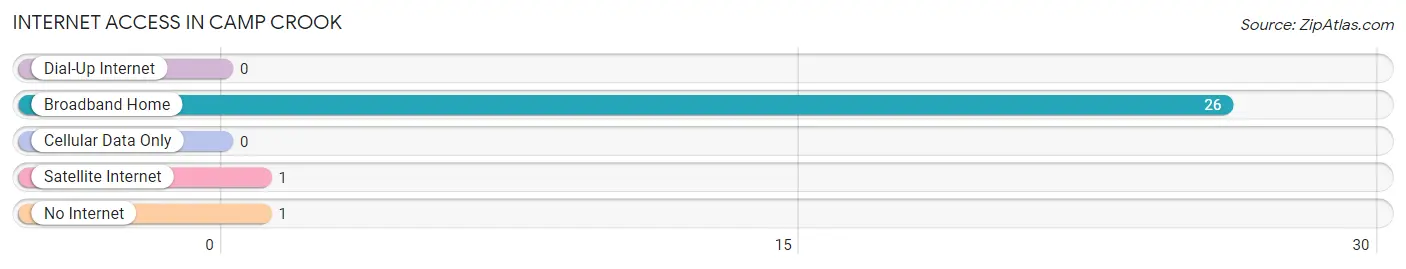
| Internet Type | # Households | % Households |
| Dial-Up Internet | 0 | 0.0% |
| Broadband Home | 26 | 92.9% |
| Cellular Data Only | 0 | 0.0% |
| Satellite Internet | 1 | 3.6% |
| No Internet | 1 | 3.6% |
| Total | 28 | 100.0% |
Camp Crook Summary
History
Camp Crook is a small town located in Harding County, South Dakota. It was founded in 1883 by the United States Army as a military camp. The camp was established to protect settlers from Native American attacks. The camp was named after General George Crook, who was a Union Army officer during the Civil War.
The camp was initially used as a supply depot and a place for soldiers to rest and recuperate. It was also used as a staging area for troops heading to the nearby Indian reservations. In 1885, the camp was abandoned and the land was sold to settlers.
The town of Camp Crook was officially established in 1887. The town was named after the military camp and was initially a small farming community. The town grew slowly over the years and by the early 1900s, it had a population of around 500 people.
The town was primarily an agricultural community, with most of the population working in the fields or in the local businesses. The town also had a few small businesses, such as a general store, a blacksmith, and a livery stable.
In the 1920s, the town began to experience a population boom. This was due to the discovery of oil in the area. The oil boom brought in a large number of people looking for work in the oil fields. This influx of people caused the population of Camp Crook to grow to over 1,000 people by the 1930s.
The oil boom also brought in a lot of money to the town. This allowed the town to build a new school, a hospital, and other amenities. The town also had a movie theater, a bowling alley, and a few other businesses.
The oil boom eventually ended in the 1940s and the population of Camp Crook began to decline. By the 1950s, the population had dropped to around 500 people. The town continued to decline over the years and by the 2000 census, the population had dropped to just over 200 people.
Geography
Camp Crook is located in Harding County, South Dakota. It is situated in the northwestern part of the state, near the border with Montana. The town is located in the Badlands region of South Dakota, which is characterized by its rugged terrain and sparse vegetation.
The town is situated on the banks of the Little Missouri River. The river is a tributary of the Missouri River and is a popular spot for fishing and other recreational activities.
The town is located in a semi-arid climate, with hot summers and cold winters. The average temperature in the summer is around 85 degrees Fahrenheit and the average temperature in the winter is around 20 degrees Fahrenheit.
Economy
The economy of Camp Crook is primarily based on agriculture and tourism. The town is home to several farms, which produce a variety of crops, including wheat, corn, and hay. The town also has a few small businesses, such as a general store, a gas station, and a few restaurants.
The town is also a popular tourist destination. The nearby Badlands National Park attracts visitors from all over the world. The town also has a few bed and breakfasts, as well as a few campgrounds.
Demographics
According to the 2000 census, the population of Camp Crook was 203 people. The racial makeup of the town was 97.5% White, 0.5% Native American, 0.5% Asian, and 1.5% from other races.
The median household income in Camp Crook was $25,000 and the median family income was $30,000. The per capita income was $14,000. Around 20% of the population was below the poverty line.
Common Questions
What is Per Capita Income in Camp Crook?
Per Capita income in Camp Crook is $32,303.
What is the Median Family Income in Camp Crook?
Median Family Income in Camp Crook is $75,417.
What is the Median Household income in Camp Crook?
Median Household Income in Camp Crook is $36,591.
What is Income or Wage Gap in Camp Crook?
Income or Wage Gap in Camp Crook is 66.7%.
Women in Camp Crook earn 33.3 cents for every dollar earned by a man.
What is Inequality or Gini Index in Camp Crook?
Inequality or Gini Index in Camp Crook is 0.31.
What is the Total Population of Camp Crook?
Total Population of Camp Crook is 38.
What is the Total Male Population of Camp Crook?
Total Male Population of Camp Crook is 16.
What is the Total Female Population of Camp Crook?
Total Female Population of Camp Crook is 22.
What is the Ratio of Males per 100 Females in Camp Crook?
There are 72.73 Males per 100 Females in Camp Crook.
What is the Ratio of Females per 100 Males in Camp Crook?
There are 137.50 Females per 100 Males in Camp Crook.
What is the Median Population Age in Camp Crook?
Median Population Age in Camp Crook is 67.3 Years.
What is the Average Family Size in Camp Crook
Average Family Size in Camp Crook is 2.1 People.
What is the Average Household Size in Camp Crook
Average Household Size in Camp Crook is 1.4 People.
How Large is the Labor Force in Camp Crook?
There are 20 People in the Labor Forcein in Camp Crook.
What is the Percentage of People in the Labor Force in Camp Crook?
52.6% of People are in the Labor Force in Camp Crook.