Oglala, SD Map & Demographics
Oglala Map
Oglala Overview
$17,678
PER CAPITA INCOME
$42,321
AVG FAMILY INCOME
$31,042
AVG HOUSEHOLD INCOME
0.55
INEQUALITY / GINI INDEX
1,440
TOTAL POPULATION
821
MALE POPULATION
619
FEMALE POPULATION
132.63
MALES / 100 FEMALES
75.40
FEMALES / 100 MALES
28.2
MEDIAN AGE
4.8
AVG FAMILY SIZE
4.1
AVG HOUSEHOLD SIZE
639
LABOR FORCE [ PEOPLE ]
63.1%
PERCENT IN LABOR FORCE
21.0%
UNEMPLOYMENT RATE
Oglala Zip Codes
Oglala Area Codes
Income in Oglala
Income Overview in Oglala
Per Capita Income in Oglala is $17,678, while median incomes of families and households are $42,321 and $31,042 respectively.
| Characteristic | Number | Measure |
| Per Capita Income | 1,440 | $17,678 |
| Median Family Income | 272 | $42,321 |
| Mean Family Income | 272 | $68,086 |
| Median Household Income | 347 | $31,042 |
| Mean Household Income | 347 | $59,073 |
| Income Deficit | 272 | $0 |
| Wage / Income Gap (%) | 1,440 | 0.00% |
| Wage / Income Gap ($) | 1,440 | 100.00¢ per $1 |
| Gini / Inequality Index | 1,440 | 0.55 |
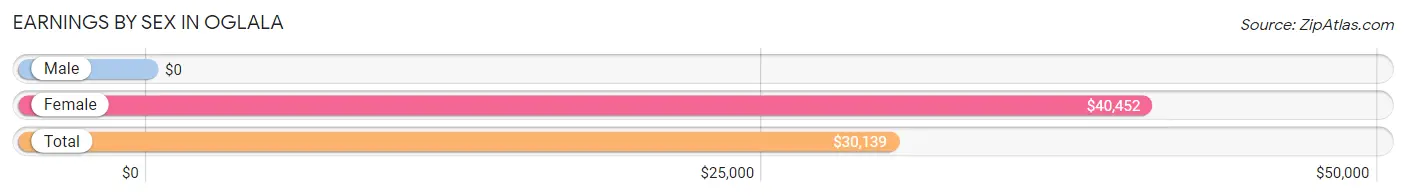
Earnings by Sex in Oglala
| Sex | Number | Average Earnings |
| Male | 380 (59.8%) | $0 |
| Female | 255 (40.2%) | $40,452 |
| Total | 635 (100.0%) | $30,139 |
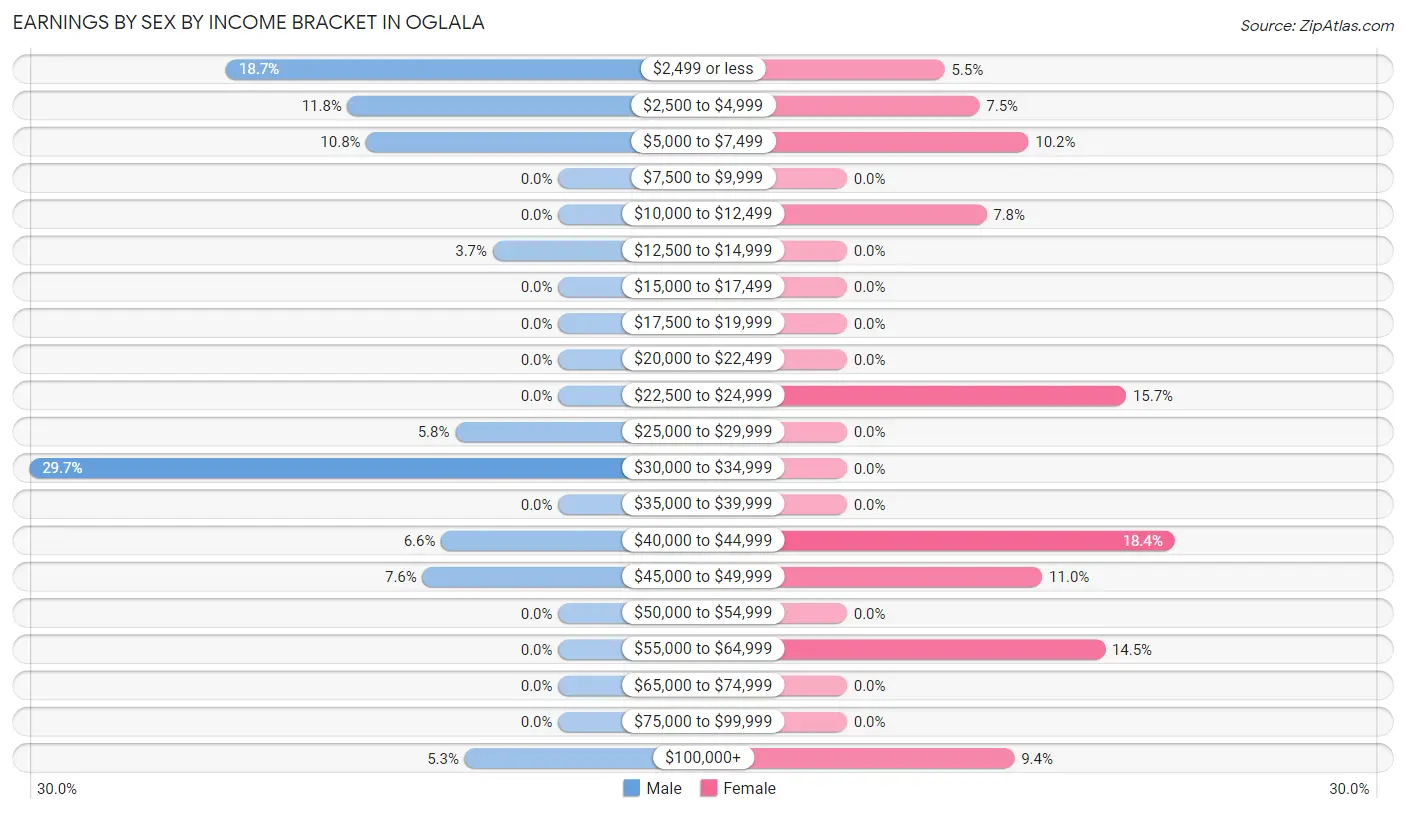
Earnings by Sex by Income Bracket in Oglala
The most common earnings brackets in Oglala are $30,000 to $34,999 for men (113 | 29.7%) and $40,000 to $44,999 for women (47 | 18.4%).
| Income | Male | Female |
| $2,499 or less | 71 (18.7%) | 14 (5.5%) |
| $2,500 to $4,999 | 45 (11.8%) | 19 (7.4%) |
| $5,000 to $7,499 | 41 (10.8%) | 26 (10.2%) |
| $7,500 to $9,999 | 0 (0.0%) | 0 (0.0%) |
| $10,000 to $12,499 | 0 (0.0%) | 20 (7.8%) |
| $12,500 to $14,999 | 14 (3.7%) | 0 (0.0%) |
| $15,000 to $17,499 | 0 (0.0%) | 0 (0.0%) |
| $17,500 to $19,999 | 0 (0.0%) | 0 (0.0%) |
| $20,000 to $22,499 | 0 (0.0%) | 0 (0.0%) |
| $22,500 to $24,999 | 0 (0.0%) | 40 (15.7%) |
| $25,000 to $29,999 | 22 (5.8%) | 0 (0.0%) |
| $30,000 to $34,999 | 113 (29.7%) | 0 (0.0%) |
| $35,000 to $39,999 | 0 (0.0%) | 0 (0.0%) |
| $40,000 to $44,999 | 25 (6.6%) | 47 (18.4%) |
| $45,000 to $49,999 | 29 (7.6%) | 28 (11.0%) |
| $50,000 to $54,999 | 0 (0.0%) | 0 (0.0%) |
| $55,000 to $64,999 | 0 (0.0%) | 37 (14.5%) |
| $65,000 to $74,999 | 0 (0.0%) | 0 (0.0%) |
| $75,000 to $99,999 | 0 (0.0%) | 0 (0.0%) |
| $100,000+ | 20 (5.3%) | 24 (9.4%) |
| Total | 380 (100.0%) | 255 (100.0%) |
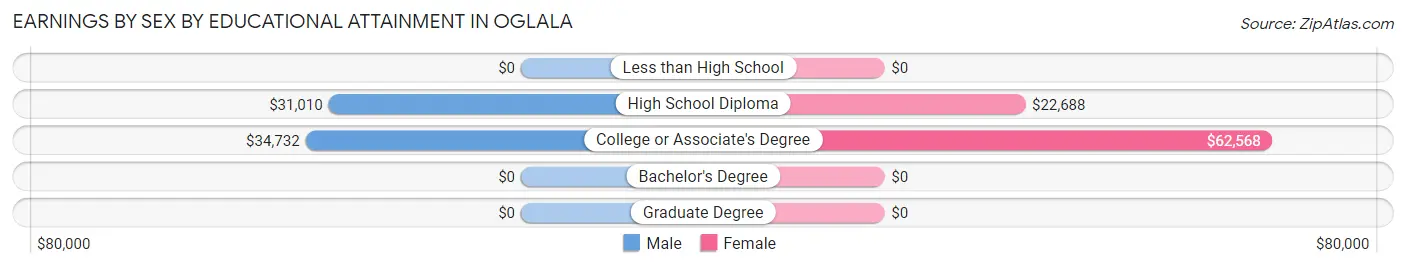
Earnings by Sex by Educational Attainment in Oglala
Average earnings in Oglala are $30,631 for men and $41,649 for women, a difference of 26.5%. Men with an educational attainment of college or associate's degree enjoy the highest average annual earnings of $34,732, while those with high school diploma education earn the least with $31,010. Women with an educational attainment of college or associate's degree earn the most with the average annual earnings of $62,568, while those with high school diploma education have the smallest earnings of $22,688.
| Educational Attainment | Male Income | Female Income |
| Less than High School | - | - |
| High School Diploma | $31,010 | $22,688 |
| College or Associate's Degree | $34,732 | $62,568 |
| Bachelor's Degree | - | - |
| Graduate Degree | - | - |
| Total | $30,631 | $41,649 |
Family Income in Oglala
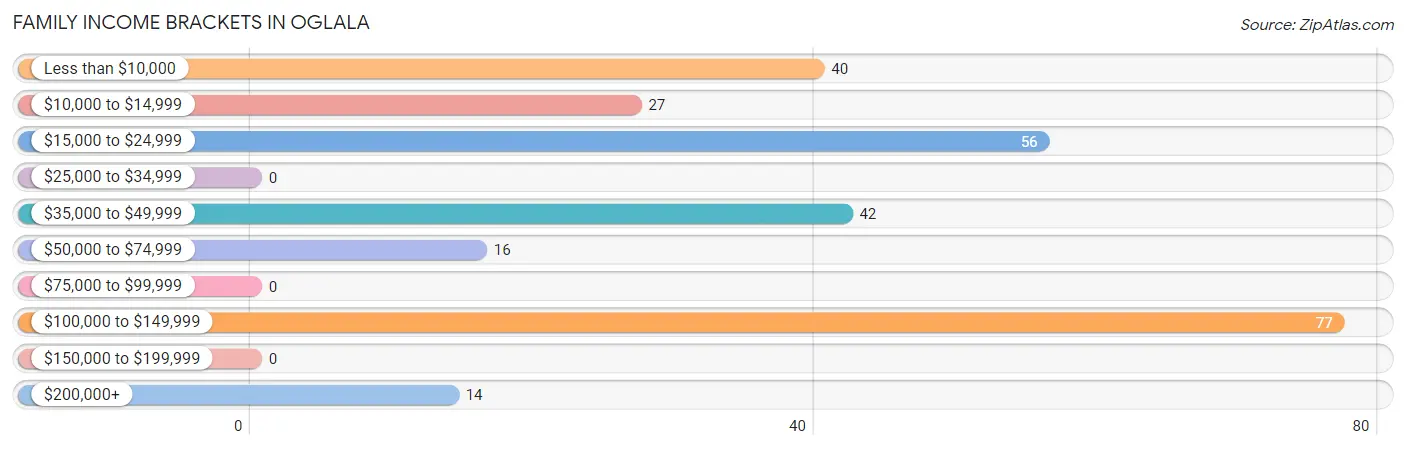
Family Income Brackets in Oglala
According to the Oglala family income data, there are 77 families falling into the $100,000 to $149,999 income range, which is the most common income bracket and makes up 28.3% of all families.
| Income Bracket | # Families | % Families |
| Less than $10,000 | 40 | 14.7% |
| $10,000 to $14,999 | 27 | 9.9% |
| $15,000 to $24,999 | 56 | 20.6% |
| $25,000 to $34,999 | 0 | 0.0% |
| $35,000 to $49,999 | 42 | 15.4% |
| $50,000 to $74,999 | 16 | 5.9% |
| $75,000 to $99,999 | 0 | 0.0% |
| $100,000 to $149,999 | 77 | 28.3% |
| $150,000 to $199,999 | 0 | 0.0% |
| $200,000+ | 14 | 5.1% |
Family Income by Famaliy Size in Oglala
| Income Bracket | # Families | Median Income |
| 2-Person Families | 30 (11.0%) | $0 |
| 3-Person Families | 125 (46.0%) | $0 |
| 4-Person Families | 46 (16.9%) | $0 |
| 5-Person Families | 0 (0.0%) | $0 |
| 6-Person Families | 0 (0.0%) | $0 |
| 7+ Person Families | 71 (26.1%) | $0 |
| Total | 272 (100.0%) | $42,321 |
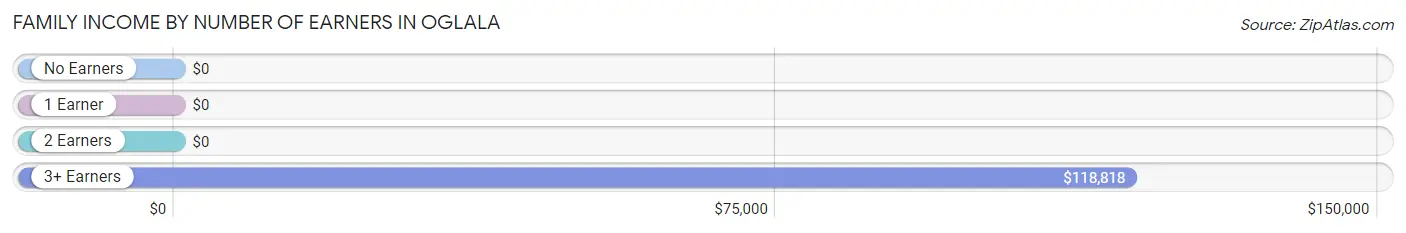
Family Income by Number of Earners in Oglala
| Number of Earners | # Families | Median Income |
| No Earners | 60 (22.1%) | $0 |
| 1 Earner | 79 (29.0%) | $0 |
| 2 Earners | 66 (24.3%) | $0 |
| 3+ Earners | 67 (24.6%) | $118,818 |
| Total | 272 (100.0%) | $42,321 |
Household Income in Oglala
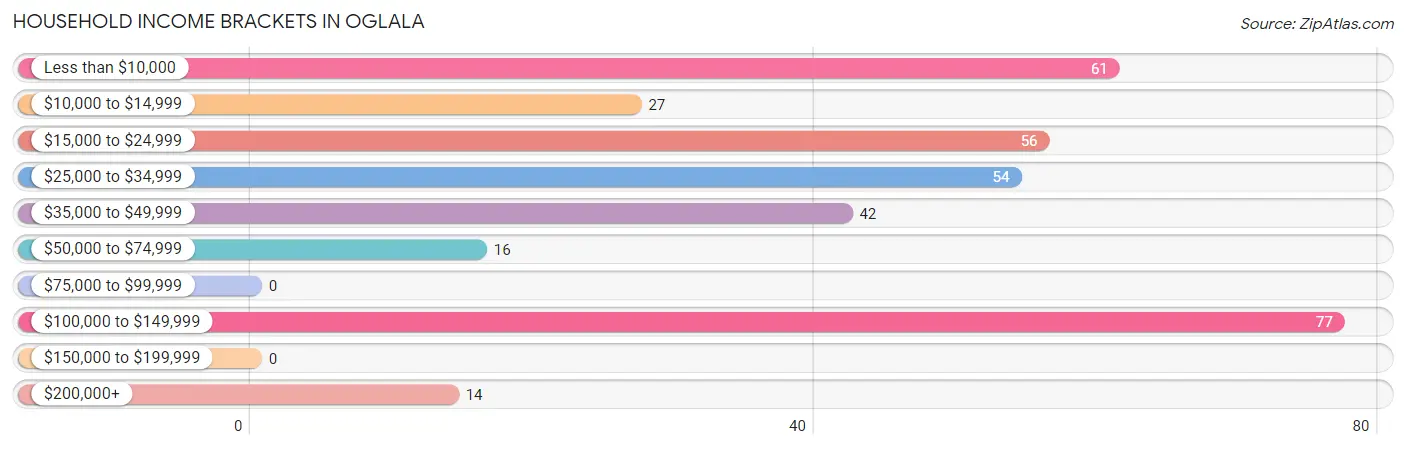
Household Income Brackets in Oglala
With 77 households falling in the category, the $100,000 to $149,999 income range is the most frequent in Oglala, accounting for 22.2% of all households.
| Income Bracket | # Households | % Households |
| Less than $10,000 | 61 | 17.6% |
| $10,000 to $14,999 | 27 | 7.8% |
| $15,000 to $24,999 | 56 | 16.1% |
| $25,000 to $34,999 | 54 | 15.6% |
| $35,000 to $49,999 | 42 | 12.1% |
| $50,000 to $74,999 | 16 | 4.6% |
| $75,000 to $99,999 | 0 | 0.0% |
| $100,000 to $149,999 | 77 | 22.2% |
| $150,000 to $199,999 | 0 | 0.0% |
| $200,000+ | 14 | 4.0% |
Household Income by Householder Age in Oglala
| Income Bracket | # Households | Median Income |
| 15 to 24 Years | 0 (0.0%) | $0 |
| 25 to 44 Years | 87 (25.1%) | $0 |
| 45 to 64 Years | 202 (58.2%) | $0 |
| 65+ Years | 58 (16.7%) | $0 |
| Total | 347 (100.0%) | $31,042 |
Poverty in Oglala
Income Below Poverty by Sex and Age in Oglala
With 48.5% poverty level for males and 43.6% for females among the residents of Oglala, 5 year old males and 5 year old females are the most vulnerable to poverty, with 33 males (100.0%) and 10 females (100.0%) in their respective age groups living below the poverty level.
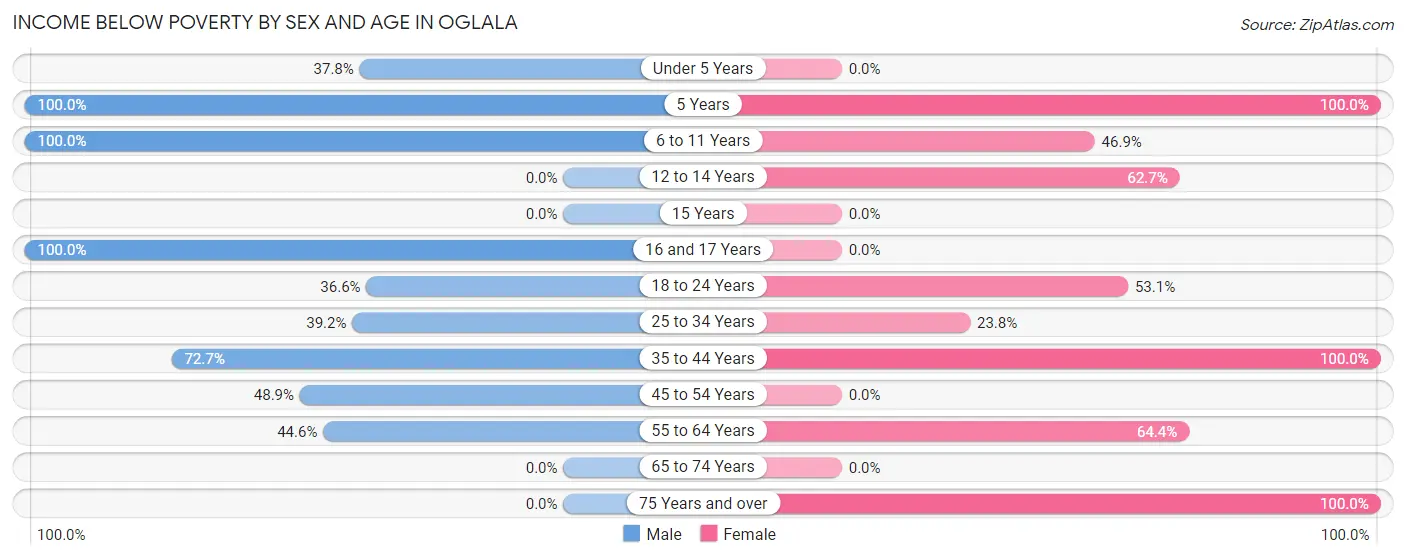
| Age Bracket | Male | Female |
| Under 5 Years | 45 (37.8%) | 0 (0.0%) |
| 5 Years | 33 (100.0%) | 10 (100.0%) |
| 6 to 11 Years | 34 (100.0%) | 23 (46.9%) |
| 12 to 14 Years | 0 (0.0%) | 42 (62.7%) |
| 15 Years | 0 (0.0%) | 0 (0.0%) |
| 16 and 17 Years | 16 (100.0%) | 0 (0.0%) |
| 18 to 24 Years | 34 (36.6%) | 51 (53.1%) |
| 25 to 34 Years | 76 (39.2%) | 20 (23.8%) |
| 35 to 44 Years | 48 (72.7%) | 65 (100.0%) |
| 45 to 54 Years | 67 (48.9%) | 0 (0.0%) |
| 55 to 64 Years | 41 (44.6%) | 29 (64.4%) |
| 65 to 74 Years | 0 (0.0%) | 0 (0.0%) |
| 75 Years and over | 0 (0.0%) | 30 (100.0%) |
| Total | 394 (48.5%) | 270 (43.6%) |
Income Above Poverty by Sex and Age in Oglala
According to the poverty statistics in Oglala, males aged 12 to 14 years and females aged under 5 years are the age groups that are most secure financially, with 100.0% of males and 100.0% of females in these age groups living above the poverty line.
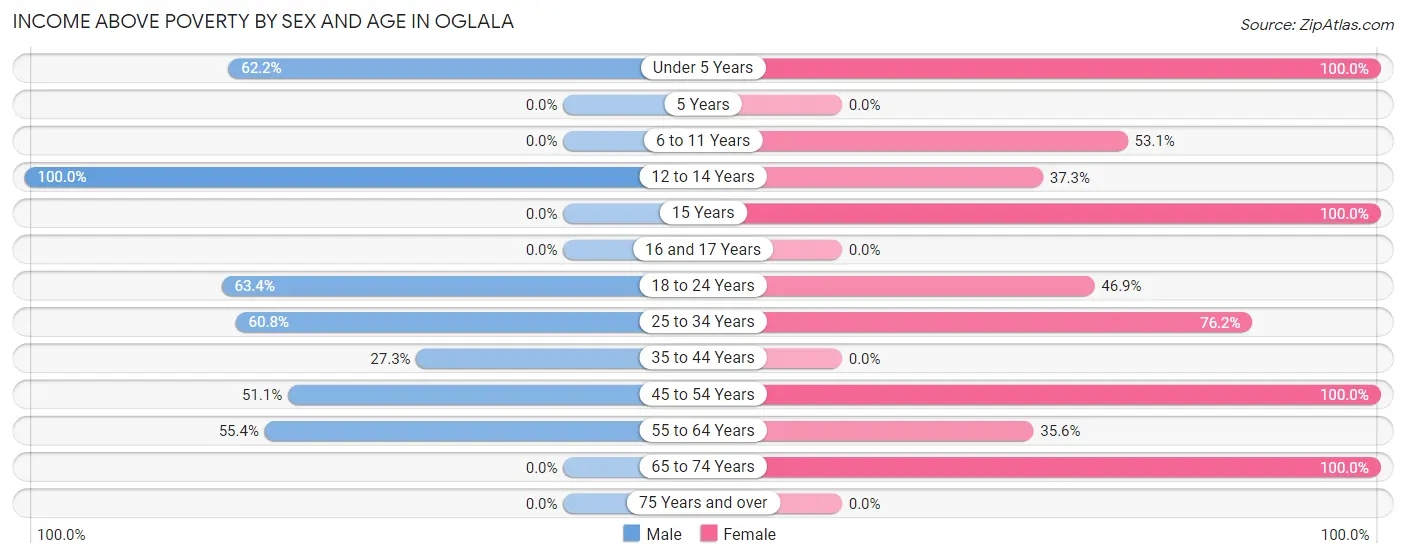
| Age Bracket | Male | Female |
| Under 5 Years | 74 (62.2%) | 54 (100.0%) |
| 5 Years | 0 (0.0%) | 0 (0.0%) |
| 6 to 11 Years | 0 (0.0%) | 26 (53.1%) |
| 12 to 14 Years | 28 (100.0%) | 25 (37.3%) |
| 15 Years | 0 (0.0%) | 24 (100.0%) |
| 16 and 17 Years | 0 (0.0%) | 0 (0.0%) |
| 18 to 24 Years | 59 (63.4%) | 45 (46.9%) |
| 25 to 34 Years | 118 (60.8%) | 64 (76.2%) |
| 35 to 44 Years | 18 (27.3%) | 0 (0.0%) |
| 45 to 54 Years | 70 (51.1%) | 67 (100.0%) |
| 55 to 64 Years | 51 (55.4%) | 16 (35.6%) |
| 65 to 74 Years | 0 (0.0%) | 28 (100.0%) |
| 75 Years and over | 0 (0.0%) | 0 (0.0%) |
| Total | 418 (51.5%) | 349 (56.4%) |
Income Below Poverty Among Married-Couple Families in Oglala
| Children | Above Poverty | Below Poverty |
| No Children | 22 (100.0%) | 0 (0.0%) |
| 1 or 2 Children | 0 (0.0%) | 0 (0.0%) |
| 3 or 4 Children | 37 (100.0%) | 0 (0.0%) |
| 5 or more Children | 0 (0.0%) | 0 (0.0%) |
| Total | 59 (100.0%) | 0 (0.0%) |
Income Below Poverty Among Single-Parent Households in Oglala
According to the poverty data in Oglala, 77.0% or 47 single-father households and 55.3% or 84 single-mother households are living below the poverty line. Among single-father households, those with 1 or 2 children have the highest poverty rate, with 47 households (100.0%) experiencing poverty. Likewise, among single-mother households, those with no children have the highest poverty rate, with 15 households (100.0%) falling below the poverty line.
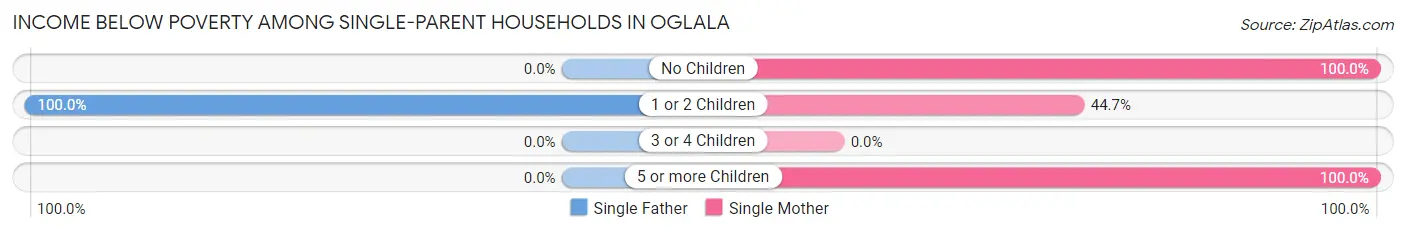
| Children | Single Father | Single Mother |
| No Children | 0 (0.0%) | 15 (100.0%) |
| 1 or 2 Children | 47 (100.0%) | 55 (44.7%) |
| 3 or 4 Children | 0 (0.0%) | 0 (0.0%) |
| 5 or more Children | 0 (0.0%) | 14 (100.0%) |
| Total | 47 (77.0%) | 84 (55.3%) |
Income Below Poverty Among Married-Couple vs Single-Parent Households in Oglala
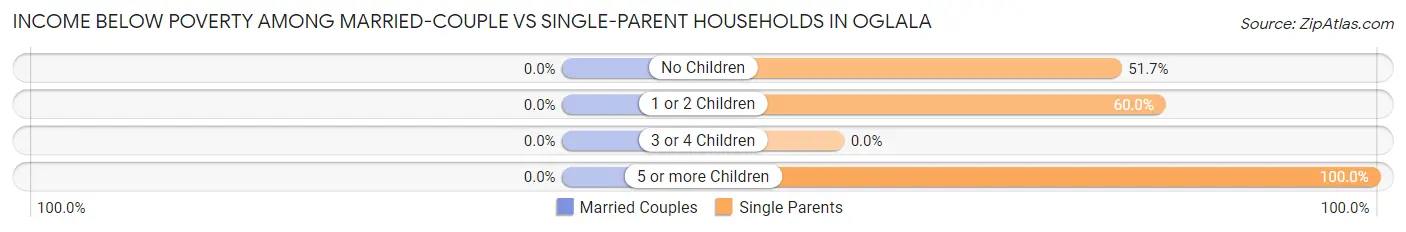
| Children | Married-Couple Families | Single-Parent Households |
| No Children | 0 (0.0%) | 15 (51.7%) |
| 1 or 2 Children | 0 (0.0%) | 102 (60.0%) |
| 3 or 4 Children | 0 (0.0%) | 0 (0.0%) |
| 5 or more Children | 0 (0.0%) | 14 (100.0%) |
| Total | 0 (0.0%) | 131 (61.5%) |
Race in Oglala
The most populous races in Oglala are Native / Alaskan (1,340 | 93.1%), Hispanic or Latino (81 | 5.6%), and Two or more Races (81 | 5.6%).
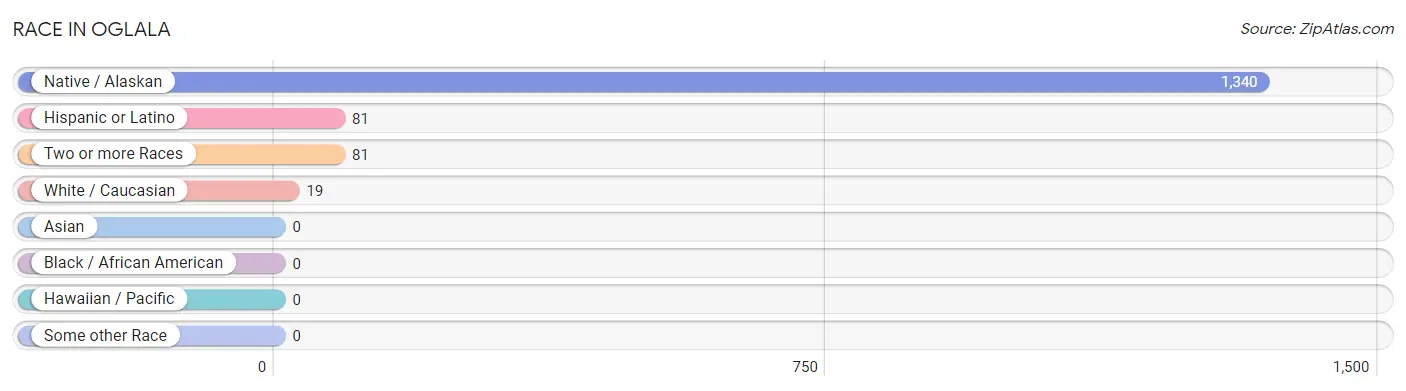
| Race | # Population | % Population |
| Asian | 0 | 0.0% |
| Black / African American | 0 | 0.0% |
| Hawaiian / Pacific | 0 | 0.0% |
| Hispanic or Latino | 81 | 5.6% |
| Native / Alaskan | 1,340 | 93.1% |
| White / Caucasian | 19 | 1.3% |
| Two or more Races | 81 | 5.6% |
| Some other Race | 0 | 0.0% |
| Total | 1,440 | 100.0% |
Ancestry in Oglala
The most populous ancestries reported in Oglala are Sioux (825 | 57.3%), Mexican (81 | 5.6%), Arapaho (37 | 2.6%), and Ukrainian (19 | 1.3%), together accounting for 66.8% of all Oglala residents.
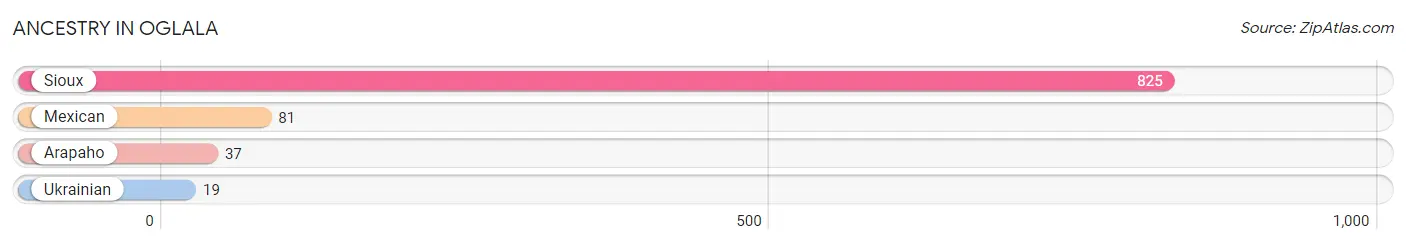
| Ancestry | # Population | % Population |
| Arapaho | 37 | 2.6% |
| Mexican | 81 | 5.6% |
| Sioux | 825 | 57.3% |
| Ukrainian | 19 | 1.3% | View All 4 Rows |
Immigrants in Oglala

| Immigration Origin | # Population | % Population | View All 0 Rows |
Sex and Age in Oglala
Sex and Age in Oglala
The most populous age groups in Oglala are 25 to 29 Years (120 | 14.6%) for men and 10 to 14 Years (93 | 15.0%) for women.
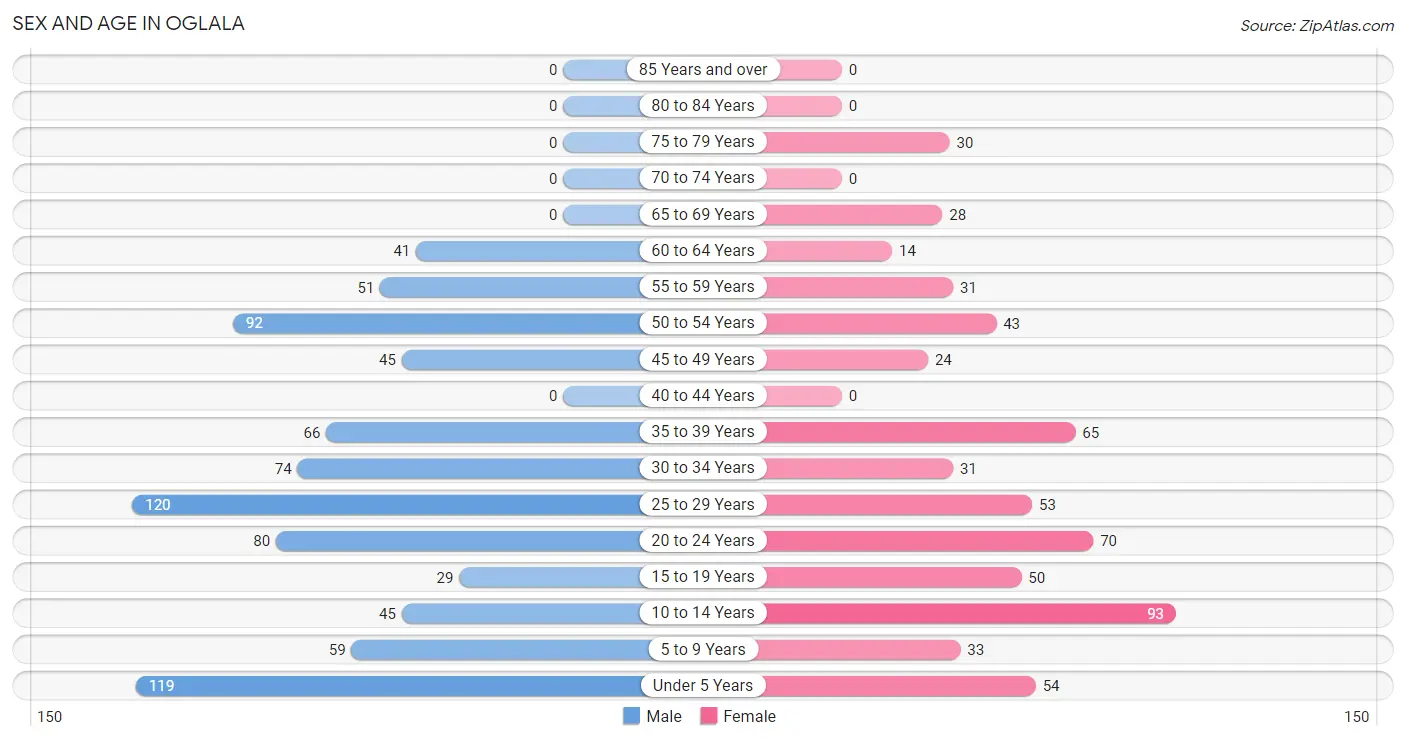
| Age Bracket | Male | Female |
| Under 5 Years | 119 (14.5%) | 54 (8.7%) |
| 5 to 9 Years | 59 (7.2%) | 33 (5.3%) |
| 10 to 14 Years | 45 (5.5%) | 93 (15.0%) |
| 15 to 19 Years | 29 (3.5%) | 50 (8.1%) |
| 20 to 24 Years | 80 (9.7%) | 70 (11.3%) |
| 25 to 29 Years | 120 (14.6%) | 53 (8.6%) |
| 30 to 34 Years | 74 (9.0%) | 31 (5.0%) |
| 35 to 39 Years | 66 (8.0%) | 65 (10.5%) |
| 40 to 44 Years | 0 (0.0%) | 0 (0.0%) |
| 45 to 49 Years | 45 (5.5%) | 24 (3.9%) |
| 50 to 54 Years | 92 (11.2%) | 43 (7.0%) |
| 55 to 59 Years | 51 (6.2%) | 31 (5.0%) |
| 60 to 64 Years | 41 (5.0%) | 14 (2.3%) |
| 65 to 69 Years | 0 (0.0%) | 28 (4.5%) |
| 70 to 74 Years | 0 (0.0%) | 0 (0.0%) |
| 75 to 79 Years | 0 (0.0%) | 30 (4.9%) |
| 80 to 84 Years | 0 (0.0%) | 0 (0.0%) |
| 85 Years and over | 0 (0.0%) | 0 (0.0%) |
| Total | 821 (100.0%) | 619 (100.0%) |
Families and Households in Oglala
Median Family Size in Oglala
The median family size in Oglala is 4.82 persons per family, with married-couple families (59 | 21.7%) accounting for the largest median family size of 7.24 persons per family. On the other hand, single male/father families (61 | 22.4%) represent the smallest median family size with 3.77 persons per family.
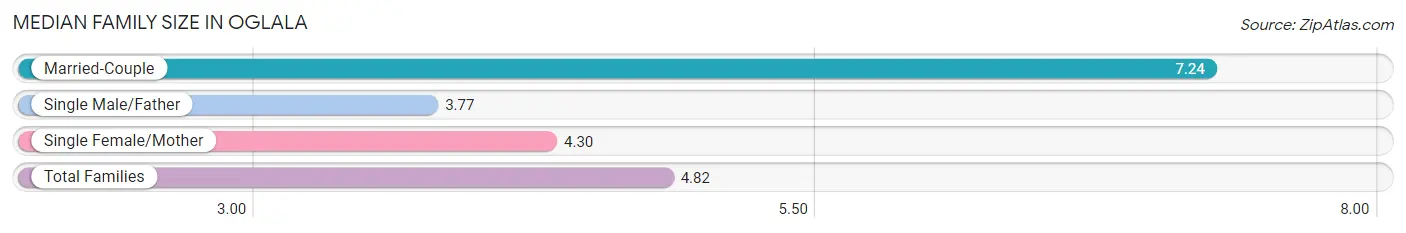
| Family Type | # Families | Family Size |
| Married-Couple | 59 (21.7%) | 7.24 |
| Single Male/Father | 61 (22.4%) | 3.77 |
| Single Female/Mother | 152 (55.9%) | 4.30 |
| Total Families | 272 (100.0%) | 4.82 |
Median Household Size in Oglala
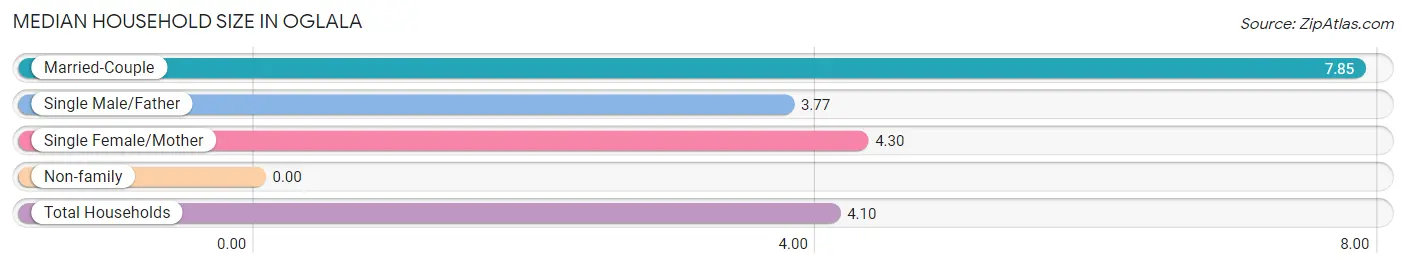
| Household Type | # Households | Household Size |
| Married-Couple | 59 (17.0%) | 7.85 |
| Single Male/Father | 61 (17.6%) | 3.77 |
| Single Female/Mother | 152 (43.8%) | 4.30 |
| Non-family | 75 (21.6%) | - |
| Total Households | 347 (100.0%) | 4.10 |
Household Size by Marriage Status in Oglala
Out of a total of 347 households in Oglala, 272 (78.4%) are family households, while 75 (21.6%) are nonfamily households. The most numerous type of family households are 3-person households, comprising 125, and the most common type of nonfamily households are 1-person households, comprising 75.
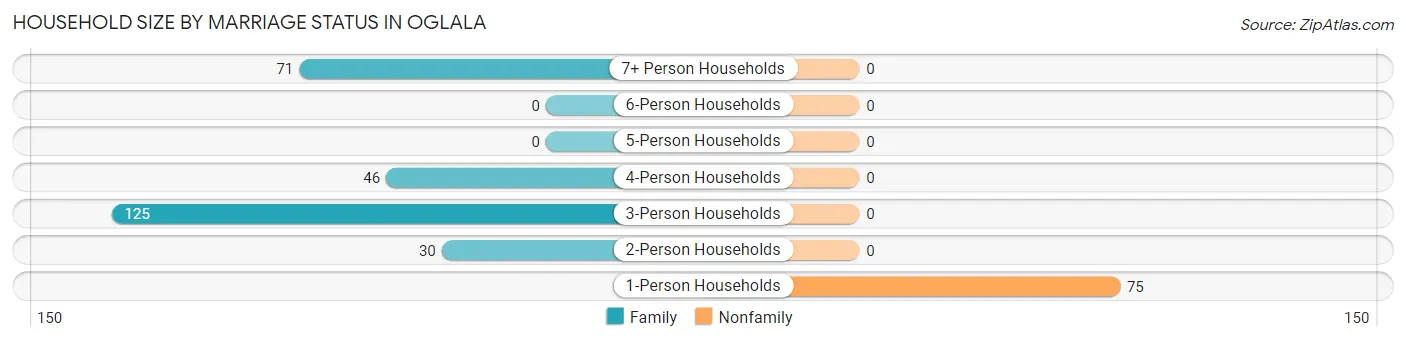
| Household Size | Family Households | Nonfamily Households |
| 1-Person Households | - | 75 (21.6%) |
| 2-Person Households | 30 (8.6%) | 0 (0.0%) |
| 3-Person Households | 125 (36.0%) | 0 (0.0%) |
| 4-Person Households | 46 (13.3%) | 0 (0.0%) |
| 5-Person Households | 0 (0.0%) | 0 (0.0%) |
| 6-Person Households | 0 (0.0%) | 0 (0.0%) |
| 7+ Person Households | 71 (20.5%) | 0 (0.0%) |
| Total | 272 (78.4%) | 75 (21.6%) |
Female Fertility in Oglala
Fertility by Age in Oglala
| Age Bracket | Women with Births | Births / 1,000 Women |
| 15 to 19 years | 0 (0.0%) | 0.0 |
| 20 to 34 years | 0 (0.0%) | 0.0 |
| 35 to 50 years | 0 (0.0%) | 0.0 |
| Total | 0 (0.0%) | 0.0 |
Fertility by Age by Marriage Status in Oglala
| Age Bracket | Married | Unmarried |
| 15 to 19 years | 0 (0.0%) | 0 (0.0%) |
| 20 to 34 years | 0 (0.0%) | 0 (0.0%) |
| 35 to 50 years | 0 (0.0%) | 0 (0.0%) |
| Total | 0 (0.0%) | 0 (0.0%) |
Fertility by Education in Oglala
| Educational Attainment | Women with Births | Births / 1,000 Women |
| Less than High School | 0 (0.0%) | 0.0 |
| High School Diploma | 0 (0.0%) | 0.0 |
| College or Associate's Degree | 0 (0.0%) | 0.0 |
| Bachelor's Degree | 0 (0.0%) | 0.0 |
| Graduate Degree | 0 (0.0%) | 0.0 |
| Total | 0 (0.0%) | 0.0 |
Fertility by Education by Marriage Status in Oglala
| Educational Attainment | Married | Unmarried |
| Less than High School | 0 (0.0%) | 0 (0.0%) |
| High School Diploma | 0 (0.0%) | 0 (0.0%) |
| College or Associate's Degree | 0 (0.0%) | 0 (0.0%) |
| Bachelor's Degree | 0 (0.0%) | 0 (0.0%) |
| Graduate Degree | 0 (0.0%) | 0 (0.0%) |
| Total | 0 (0.0%) | 0 (0.0%) |
Employment Characteristics in Oglala
Employment by Class of Employer in Oglala
Among the 505 employed individuals in Oglala, local government employees (257 | 50.9%), private company employees (192 | 38.0%), and not-for-profit organizations (51 | 10.1%) make up the most common classes of employment.
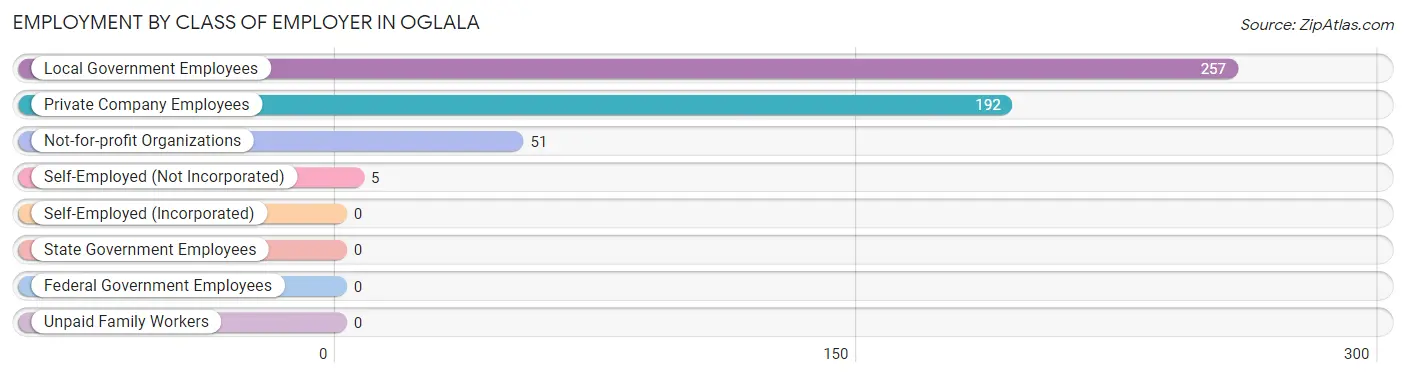
| Employer Class | # Employees | % Employees |
| Private Company Employees | 192 | 38.0% |
| Self-Employed (Incorporated) | 0 | 0.0% |
| Self-Employed (Not Incorporated) | 5 | 1.0% |
| Not-for-profit Organizations | 51 | 10.1% |
| Local Government Employees | 257 | 50.9% |
| State Government Employees | 0 | 0.0% |
| Federal Government Employees | 0 | 0.0% |
| Unpaid Family Workers | 0 | 0.0% |
| Total | 505 | 100.0% |
Employment Status by Age in Oglala
According to the labor force statistics for Oglala, out of the total population over 16 years of age (1,013), 63.1% or 639 individuals are in the labor force, with 21.0% or 134 of them unemployed. The age group with the highest labor force participation rate is 65 to 74 years, with 100.0% or 28 individuals in the labor force. Within the labor force, the 75 years and over age range has the highest percentage of unemployed individuals, with 100.0% or 30 of them being unemployed.
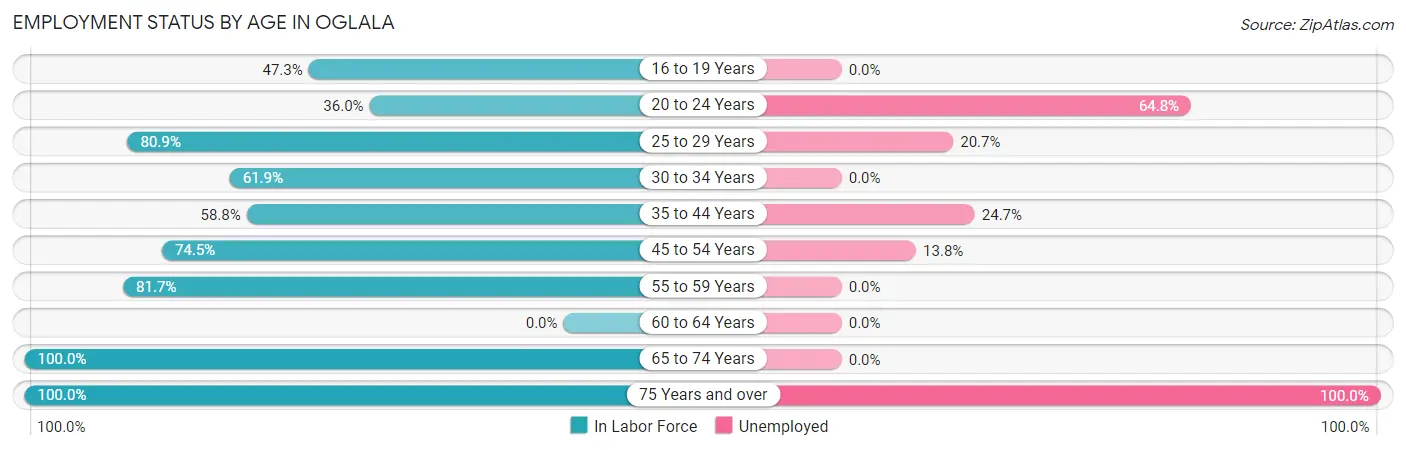
| Age Bracket | In Labor Force | Unemployed |
| 16 to 19 Years | 26 (47.3%) | 0 (0.0%) |
| 20 to 24 Years | 54 (36.0%) | 35 (64.8%) |
| 25 to 29 Years | 140 (80.9%) | 29 (20.7%) |
| 30 to 34 Years | 65 (61.9%) | 0 (0.0%) |
| 35 to 44 Years | 77 (58.8%) | 19 (24.7%) |
| 45 to 54 Years | 152 (74.5%) | 21 (13.8%) |
| 55 to 59 Years | 67 (81.7%) | 0 (0.0%) |
| 60 to 64 Years | 0 (0.0%) | 0 (0.0%) |
| 65 to 74 Years | 28 (100.0%) | 0 (0.0%) |
| 75 Years and over | 30 (100.0%) | 30 (100.0%) |
| Total | 639 (63.1%) | 134 (21.0%) |
Employment Status by Educational Attainment in Oglala
According to labor force statistics for Oglala, 66.8% of individuals (501) out of the total population between 25 and 64 years of age (750) are in the labor force, with 13.8% or 69 of them being unemployed. The group with the highest labor force participation rate are those with the educational attainment of college / associate degree, with 89.2% or 165 individuals in the labor force. Within the labor force, individuals with high school diploma education have the highest percentage of unemployment, with 23.2% or 48 of them being unemployed.
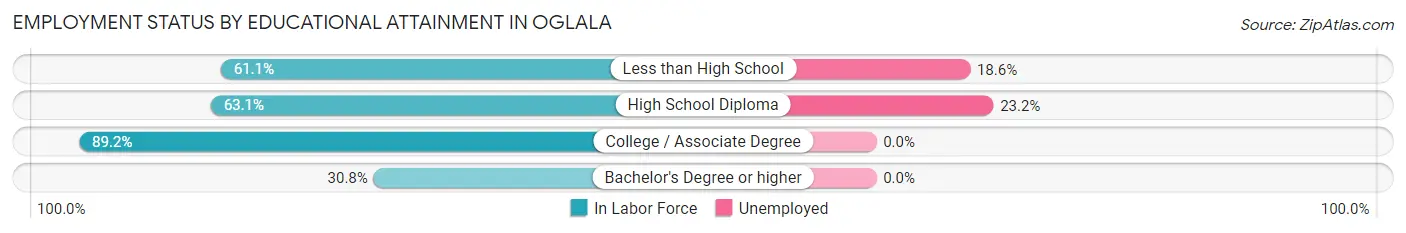
| Educational Attainment | In Labor Force | Unemployed |
| Less than High School | 113 (61.1%) | 34 (18.6%) |
| High School Diploma | 207 (63.1%) | 76 (23.2%) |
| College / Associate Degree | 165 (89.2%) | 0 (0.0%) |
| Bachelor's Degree or higher | 16 (30.8%) | 0 (0.0%) |
| Total | 501 (66.8%) | 104 (13.8%) |
Employment Occupations by Sex in Oglala
Management, Business, Science and Arts Occupations
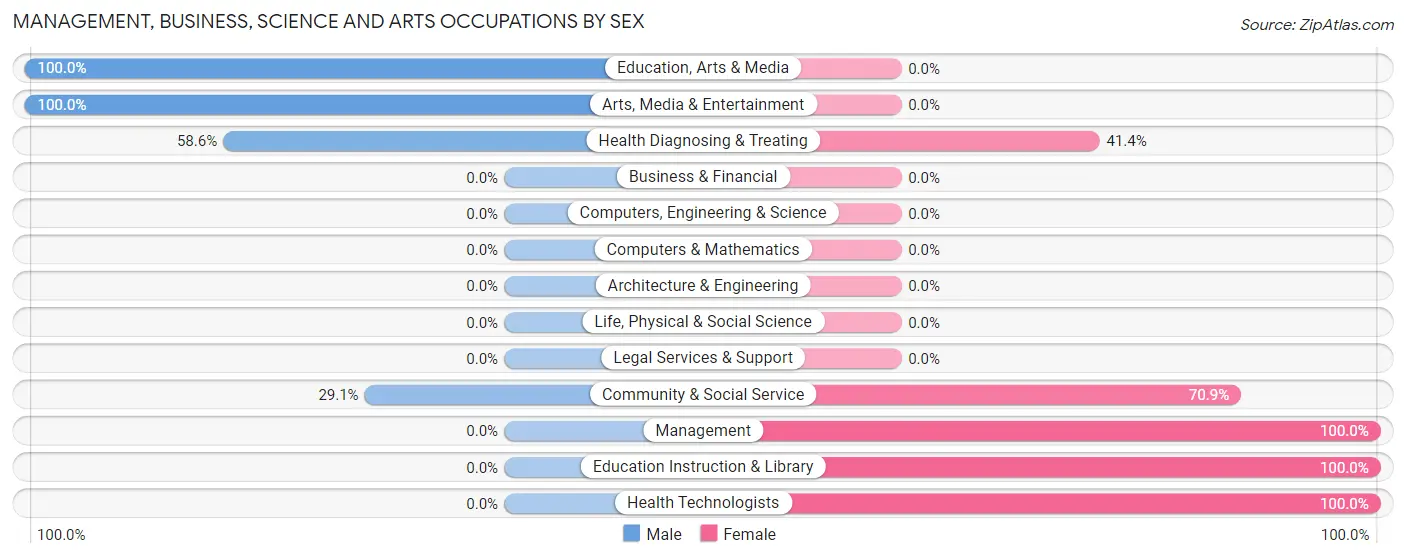
The most common Management, Business, Science and Arts occupations in Oglala are Community & Social Service (79 | 15.6%), Health Diagnosing & Treating (58 | 11.5%), Education Instruction & Library (56 | 11.1%), Management (37 | 7.3%), and Health Technologists (24 | 4.8%).
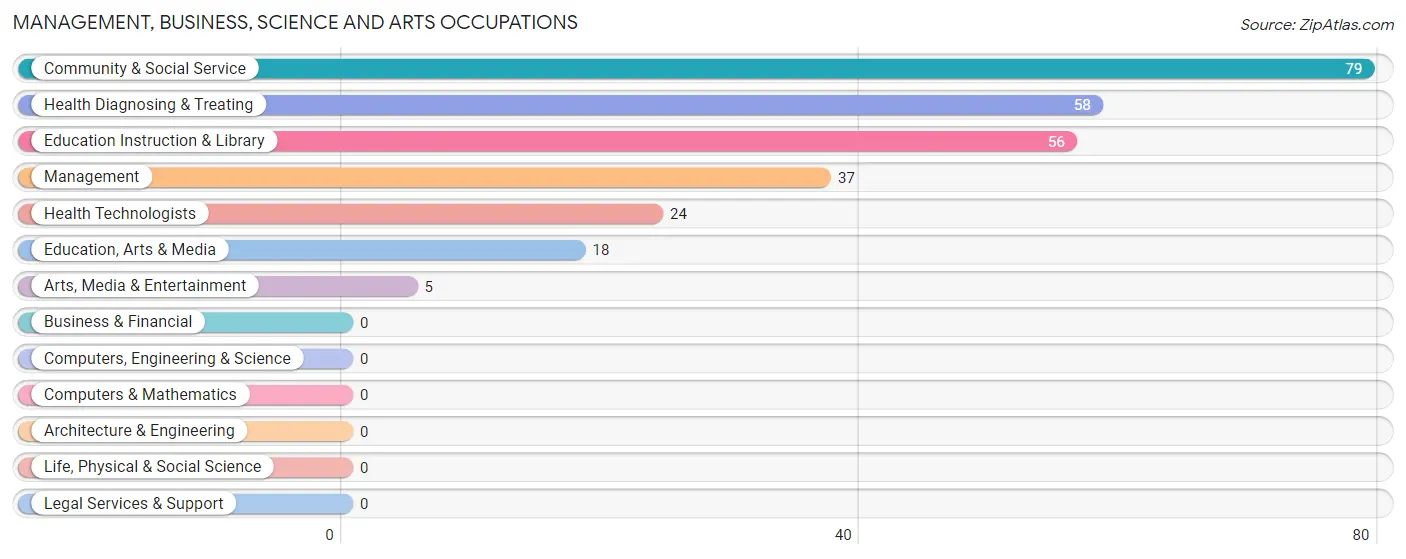
Management, Business, Science and Arts Occupations by Sex
Within the Management, Business, Science and Arts occupations in Oglala, the most male-oriented occupations are Education, Arts & Media (100.0%), Arts, Media & Entertainment (100.0%), and Health Diagnosing & Treating (58.6%), while the most female-oriented occupations are Management (100.0%), Education Instruction & Library (100.0%), and Health Technologists (100.0%).
| Occupation | Male | Female |
| Management | 0 (0.0%) | 37 (100.0%) |
| Business & Financial | 0 (0.0%) | 0 (0.0%) |
| Computers, Engineering & Science | 0 (0.0%) | 0 (0.0%) |
| Computers & Mathematics | 0 (0.0%) | 0 (0.0%) |
| Architecture & Engineering | 0 (0.0%) | 0 (0.0%) |
| Life, Physical & Social Science | 0 (0.0%) | 0 (0.0%) |
| Community & Social Service | 23 (29.1%) | 56 (70.9%) |
| Education, Arts & Media | 18 (100.0%) | 0 (0.0%) |
| Legal Services & Support | 0 (0.0%) | 0 (0.0%) |
| Education Instruction & Library | 0 (0.0%) | 56 (100.0%) |
| Arts, Media & Entertainment | 5 (100.0%) | 0 (0.0%) |
| Health Diagnosing & Treating | 34 (58.6%) | 24 (41.4%) |
| Health Technologists | 0 (0.0%) | 24 (100.0%) |
| Total (Category) | 57 (32.8%) | 117 (67.2%) |
| Total (Overall) | 264 (52.3%) | 241 (47.7%) |
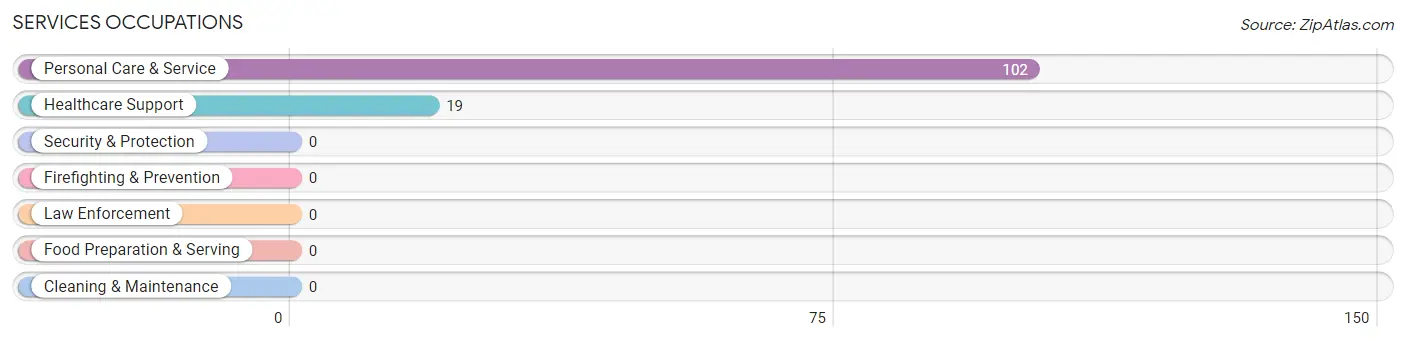
Services Occupations
The most common Services occupations in Oglala are Personal Care & Service (102 | 20.2%), and Healthcare Support (19 | 3.8%).
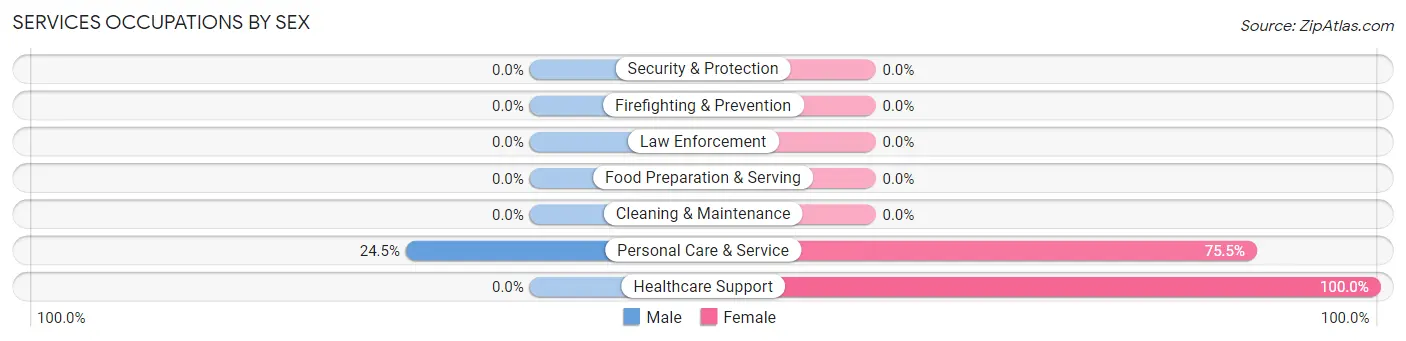
Services Occupations by Sex
| Occupation | Male | Female |
| Healthcare Support | 0 (0.0%) | 19 (100.0%) |
| Security & Protection | 0 (0.0%) | 0 (0.0%) |
| Firefighting & Prevention | 0 (0.0%) | 0 (0.0%) |
| Law Enforcement | 0 (0.0%) | 0 (0.0%) |
| Food Preparation & Serving | 0 (0.0%) | 0 (0.0%) |
| Cleaning & Maintenance | 0 (0.0%) | 0 (0.0%) |
| Personal Care & Service | 25 (24.5%) | 77 (75.5%) |
| Total (Category) | 25 (20.7%) | 96 (79.3%) |
| Total (Overall) | 264 (52.3%) | 241 (47.7%) |
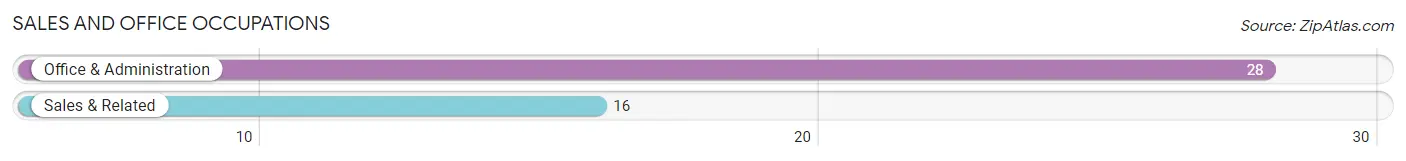
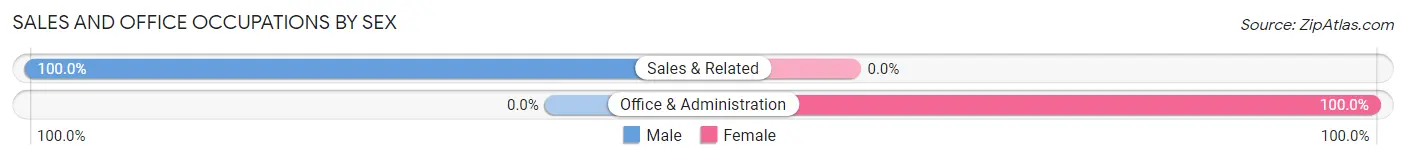
Sales and Office Occupations
The most common Sales and Office occupations in Oglala are Office & Administration (28 | 5.5%), and Sales & Related (16 | 3.2%).
Sales and Office Occupations by Sex
| Occupation | Male | Female |
| Sales & Related | 16 (100.0%) | 0 (0.0%) |
| Office & Administration | 0 (0.0%) | 28 (100.0%) |
| Total (Category) | 16 (36.4%) | 28 (63.6%) |
| Total (Overall) | 264 (52.3%) | 241 (47.7%) |
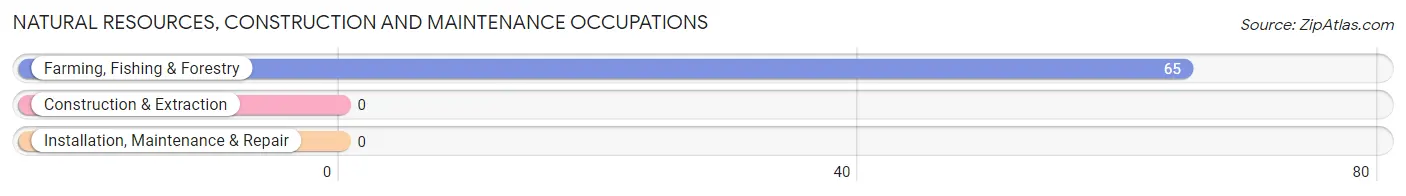
Natural Resources, Construction and Maintenance Occupations
The most common Natural Resources, Construction and Maintenance occupations in Oglala are , and Farming, Fishing & Forestry (65 | 12.9%).
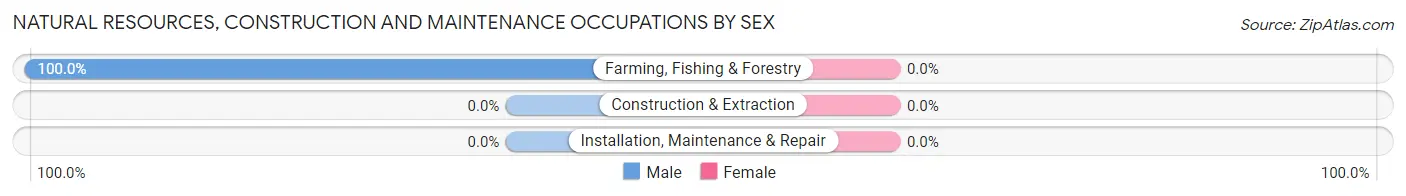
Natural Resources, Construction and Maintenance Occupations by Sex
| Occupation | Male | Female |
| Farming, Fishing & Forestry | 65 (100.0%) | 0 (0.0%) |
| Construction & Extraction | 0 (0.0%) | 0 (0.0%) |
| Installation, Maintenance & Repair | 0 (0.0%) | 0 (0.0%) |
| Total (Category) | 65 (100.0%) | 0 (0.0%) |
| Total (Overall) | 264 (52.3%) | 241 (47.7%) |
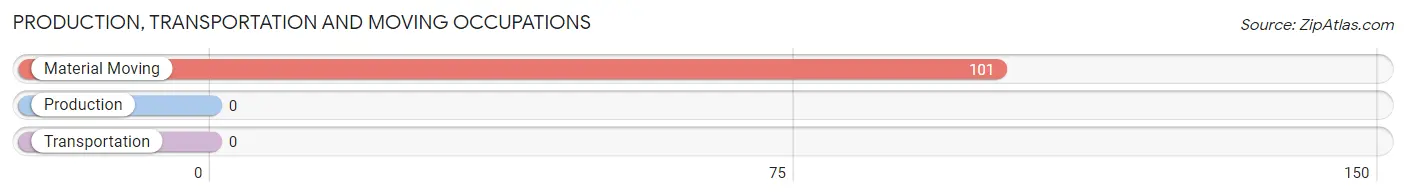
Production, Transportation and Moving Occupations
The most common Production, Transportation and Moving occupations in Oglala are , and Material Moving (101 | 20.0%).
Production, Transportation and Moving Occupations by Sex
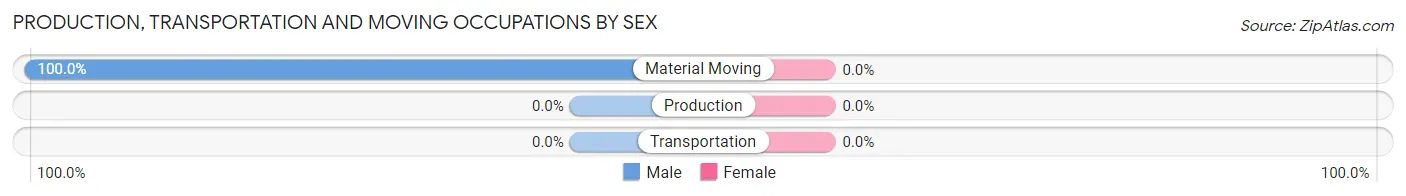
| Occupation | Male | Female |
| Production | 0 (0.0%) | 0 (0.0%) |
| Transportation | 0 (0.0%) | 0 (0.0%) |
| Material Moving | 101 (100.0%) | 0 (0.0%) |
| Total (Category) | 101 (100.0%) | 0 (0.0%) |
| Total (Overall) | 264 (52.3%) | 241 (47.7%) |
Employment Industries by Sex in Oglala
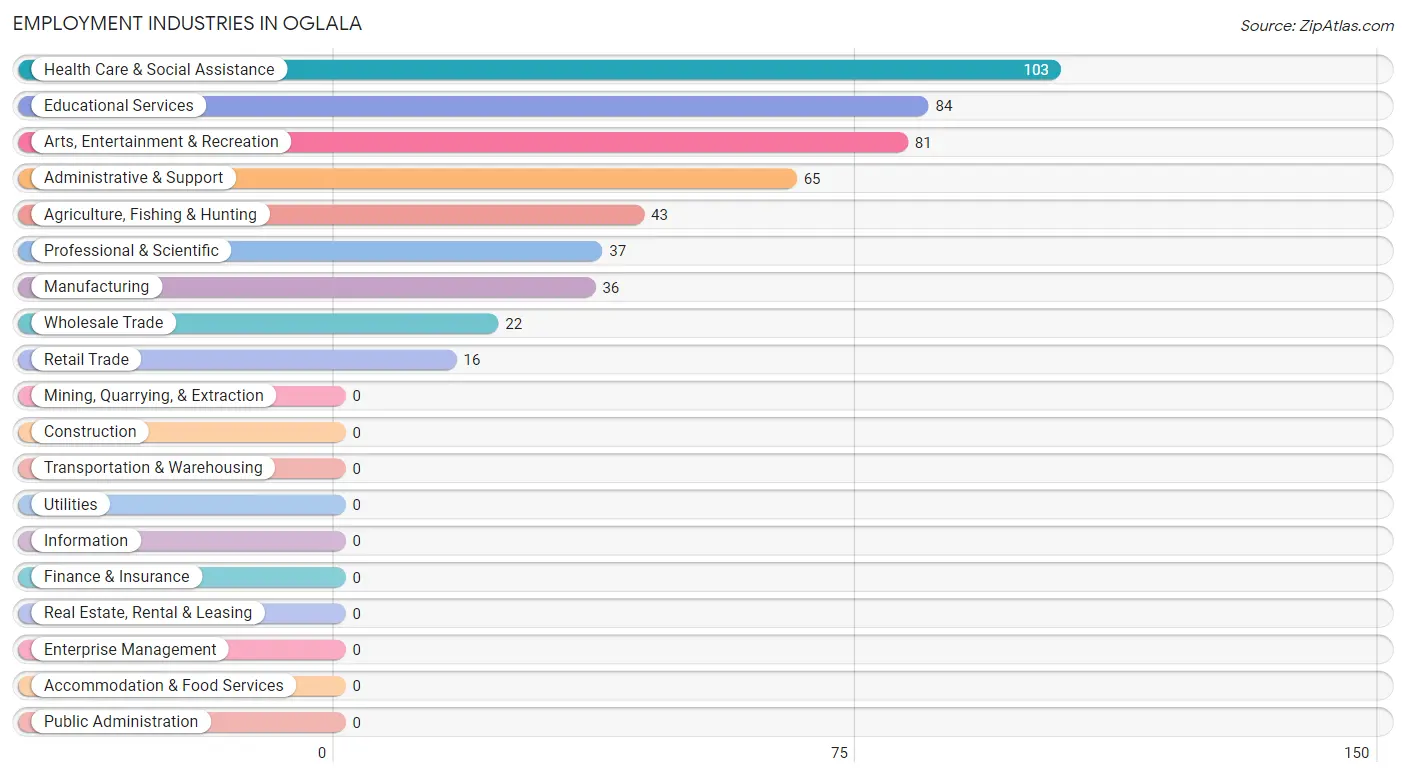
Employment Industries in Oglala
The major employment industries in Oglala include Health Care & Social Assistance (103 | 20.4%), Educational Services (84 | 16.6%), Arts, Entertainment & Recreation (81 | 16.0%), Administrative & Support (65 | 12.9%), and Agriculture, Fishing & Hunting (43 | 8.5%).
Employment Industries by Sex in Oglala
The Oglala industries that see more men than women are Agriculture, Fishing & Hunting (100.0%), Manufacturing (100.0%), and Wholesale Trade (100.0%), whereas the industries that tend to have a higher number of women are Professional & Scientific (100.0%), Educational Services (100.0%), and Health Care & Social Assistance (67.0%).
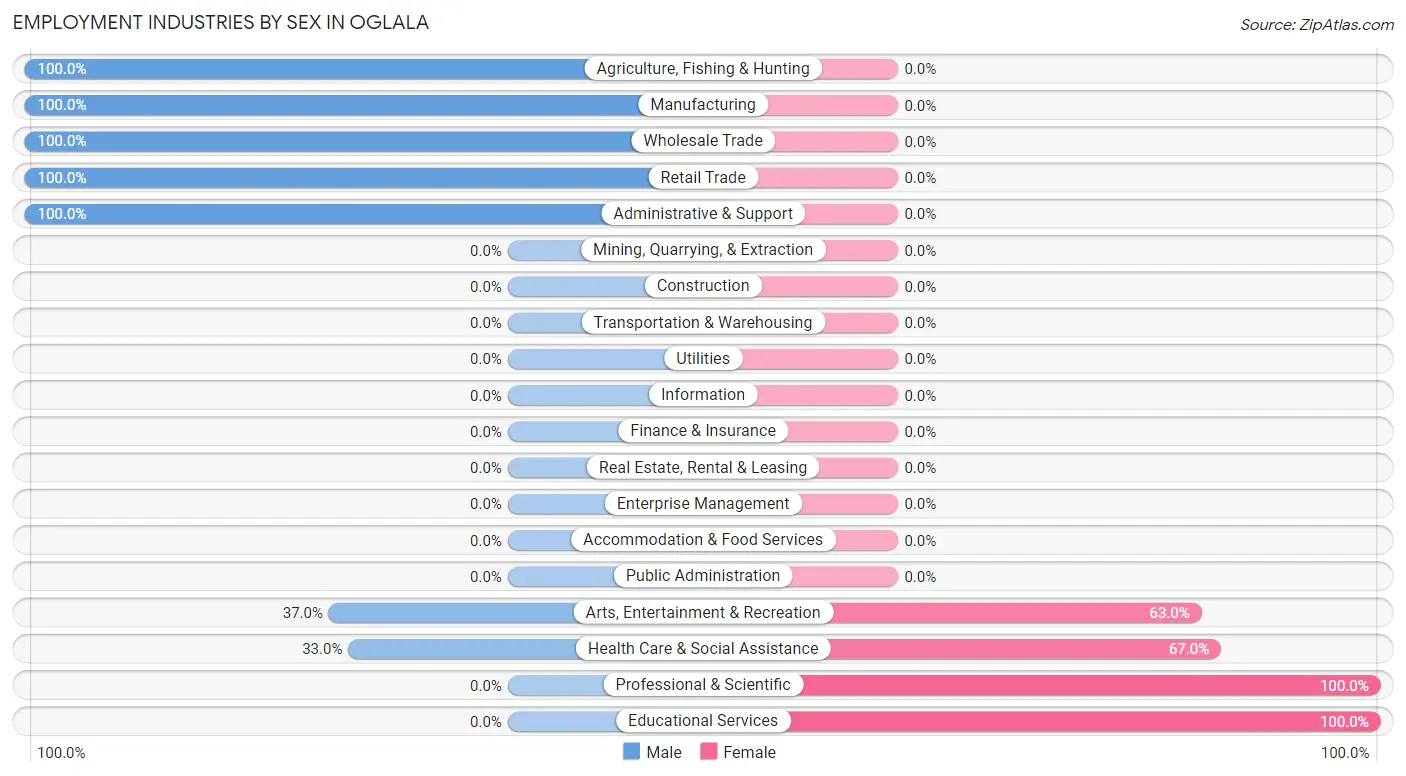
| Industry | Male | Female |
| Agriculture, Fishing & Hunting | 43 (100.0%) | 0 (0.0%) |
| Mining, Quarrying, & Extraction | 0 (0.0%) | 0 (0.0%) |
| Construction | 0 (0.0%) | 0 (0.0%) |
| Manufacturing | 36 (100.0%) | 0 (0.0%) |
| Wholesale Trade | 22 (100.0%) | 0 (0.0%) |
| Retail Trade | 16 (100.0%) | 0 (0.0%) |
| Transportation & Warehousing | 0 (0.0%) | 0 (0.0%) |
| Utilities | 0 (0.0%) | 0 (0.0%) |
| Information | 0 (0.0%) | 0 (0.0%) |
| Finance & Insurance | 0 (0.0%) | 0 (0.0%) |
| Real Estate, Rental & Leasing | 0 (0.0%) | 0 (0.0%) |
| Professional & Scientific | 0 (0.0%) | 37 (100.0%) |
| Enterprise Management | 0 (0.0%) | 0 (0.0%) |
| Administrative & Support | 65 (100.0%) | 0 (0.0%) |
| Educational Services | 0 (0.0%) | 84 (100.0%) |
| Health Care & Social Assistance | 34 (33.0%) | 69 (67.0%) |
| Arts, Entertainment & Recreation | 30 (37.0%) | 51 (63.0%) |
| Accommodation & Food Services | 0 (0.0%) | 0 (0.0%) |
| Public Administration | 0 (0.0%) | 0 (0.0%) |
| Total | 264 (52.3%) | 241 (47.7%) |
Education in Oglala
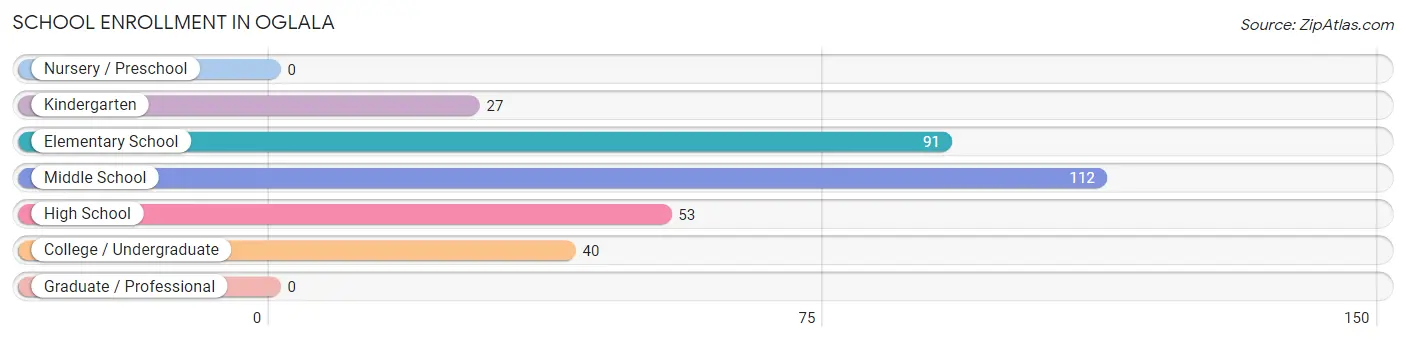
School Enrollment in Oglala
The most common levels of schooling among the 323 students in Oglala are middle school (112 | 34.7%), elementary school (91 | 28.2%), and high school (53 | 16.4%).
| School Level | # Students | % Students |
| Nursery / Preschool | 0 | 0.0% |
| Kindergarten | 27 | 8.4% |
| Elementary School | 91 | 28.2% |
| Middle School | 112 | 34.7% |
| High School | 53 | 16.4% |
| College / Undergraduate | 40 | 12.4% |
| Graduate / Professional | 0 | 0.0% |
| Total | 323 | 100.0% |
School Enrollment by Age by Funding Source in Oglala
Out of a total of 323 students who are enrolled in schools in Oglala, 67 (20.7%) attend a private institution, while the remaining 256 (79.3%) are enrolled in public schools. The age group of 5 to 9 year old has the highest likelihood of being enrolled in private schools, with 67 (72.8% in the age bracket) enrolled. Conversely, the age group of 10 to 14 year olds has the lowest likelihood of being enrolled in a private school, with 138 (100.0% in the age bracket) attending a public institution.
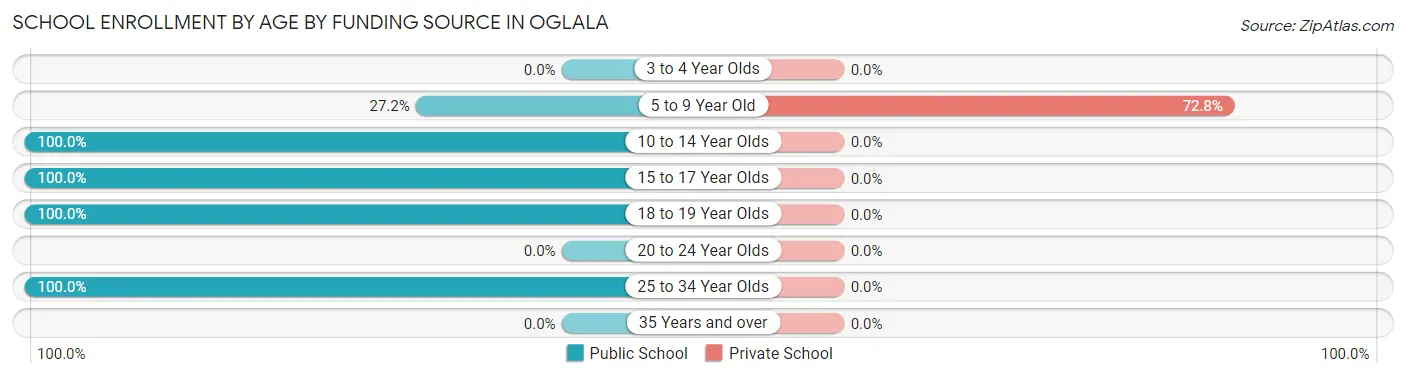
| Age Bracket | Public School | Private School |
| 3 to 4 Year Olds | 0 (0.0%) | 0 (0.0%) |
| 5 to 9 Year Old | 25 (27.2%) | 67 (72.8%) |
| 10 to 14 Year Olds | 138 (100.0%) | 0 (0.0%) |
| 15 to 17 Year Olds | 40 (100.0%) | 0 (0.0%) |
| 18 to 19 Year Olds | 39 (100.0%) | 0 (0.0%) |
| 20 to 24 Year Olds | 0 (0.0%) | 0 (0.0%) |
| 25 to 34 Year Olds | 14 (100.0%) | 0 (0.0%) |
| 35 Years and over | 0 (0.0%) | 0 (0.0%) |
| Total | 256 (79.3%) | 67 (20.7%) |
Educational Attainment by Field of Study in Oglala
Education (37 | 71.2%), and business (15 | 28.8%) are the most common fields of study among 52 individuals in Oglala who have obtained a bachelor's degree or higher.
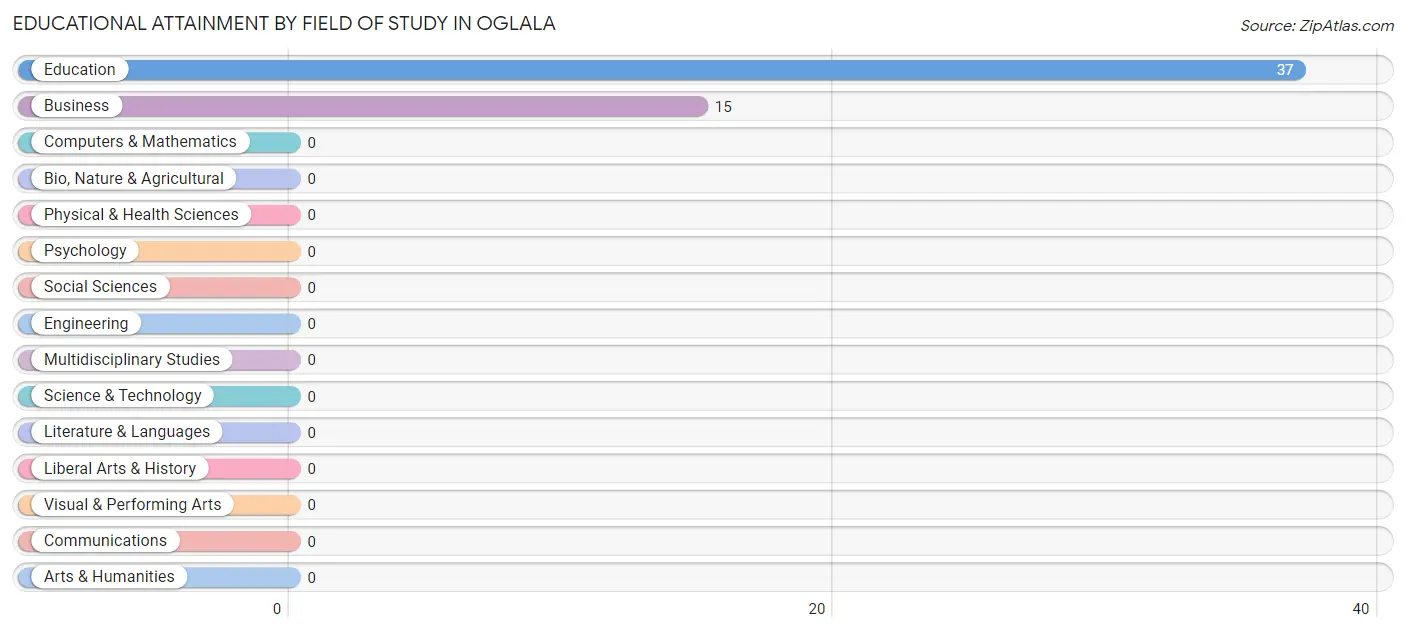
| Field of Study | # Graduates | % Graduates |
| Computers & Mathematics | 0 | 0.0% |
| Bio, Nature & Agricultural | 0 | 0.0% |
| Physical & Health Sciences | 0 | 0.0% |
| Psychology | 0 | 0.0% |
| Social Sciences | 0 | 0.0% |
| Engineering | 0 | 0.0% |
| Multidisciplinary Studies | 0 | 0.0% |
| Science & Technology | 0 | 0.0% |
| Business | 15 | 28.8% |
| Education | 37 | 71.2% |
| Literature & Languages | 0 | 0.0% |
| Liberal Arts & History | 0 | 0.0% |
| Visual & Performing Arts | 0 | 0.0% |
| Communications | 0 | 0.0% |
| Arts & Humanities | 0 | 0.0% |
| Total | 52 | 100.0% |
Transportation & Commute in Oglala
Vehicle Availability by Sex in Oglala
The most prevalent vehicle ownership categories in Oglala are males with 2 vehicles (172, accounting for 65.1%) and females with 2 vehicles (131, making up 71.4%).
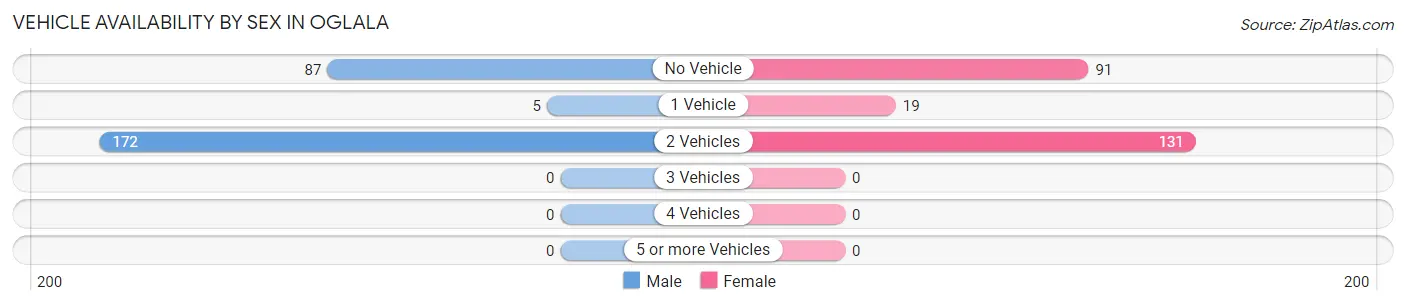
| Vehicles Available | Male | Female |
| No Vehicle | 87 (33.0%) | 91 (37.8%) |
| 1 Vehicle | 5 (1.9%) | 19 (7.9%) |
| 2 Vehicles | 172 (65.1%) | 131 (54.4%) |
| 3 Vehicles | 0 (0.0%) | 0 (0.0%) |
| 4 Vehicles | 0 (0.0%) | 0 (0.0%) |
| 5 or more Vehicles | 0 (0.0%) | 0 (0.0%) |
| Total | 264 (100.0%) | 241 (100.0%) |
Commute Time in Oglala
The most frequently occuring commute durations in Oglala are 30 to 34 minutes (152 commuters, 30.4%), less than 5 minutes (91 commuters, 18.2%), and 15 to 19 minutes (76 commuters, 15.2%).
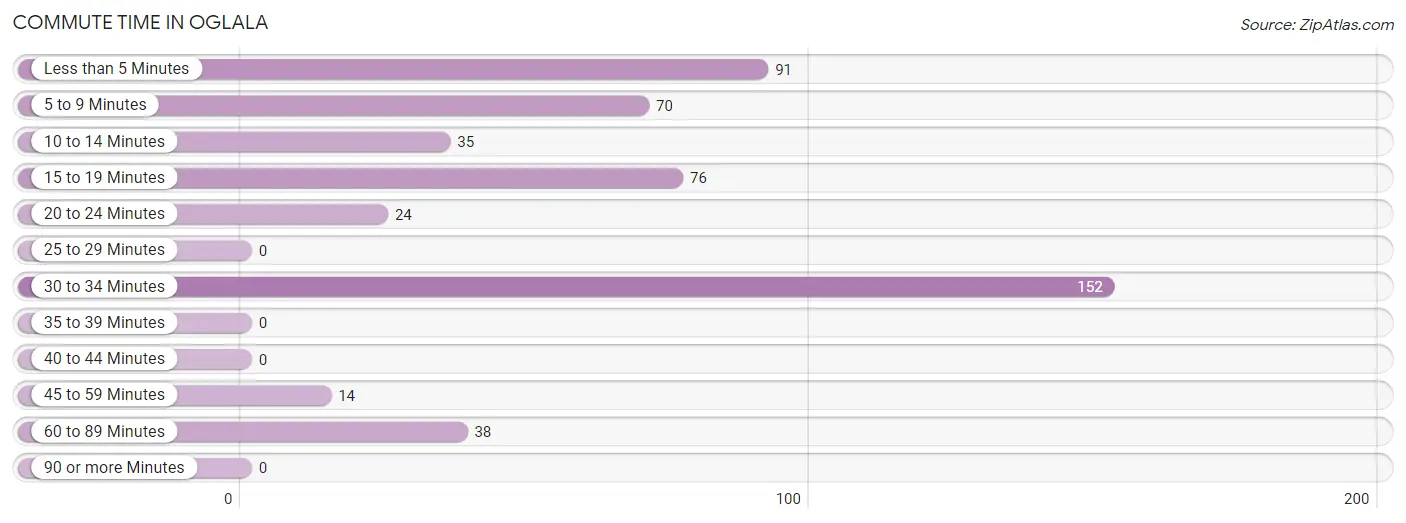
| Commute Time | # Commuters | % Commuters |
| Less than 5 Minutes | 91 | 18.2% |
| 5 to 9 Minutes | 70 | 14.0% |
| 10 to 14 Minutes | 35 | 7.0% |
| 15 to 19 Minutes | 76 | 15.2% |
| 20 to 24 Minutes | 24 | 4.8% |
| 25 to 29 Minutes | 0 | 0.0% |
| 30 to 34 Minutes | 152 | 30.4% |
| 35 to 39 Minutes | 0 | 0.0% |
| 40 to 44 Minutes | 0 | 0.0% |
| 45 to 59 Minutes | 14 | 2.8% |
| 60 to 89 Minutes | 38 | 7.6% |
| 90 or more Minutes | 0 | 0.0% |
Commute Time by Sex in Oglala
The most common commute times in Oglala are 30 to 34 minutes (87 commuters, 33.6%) for males and 30 to 34 minutes (65 commuters, 27.0%) for females.
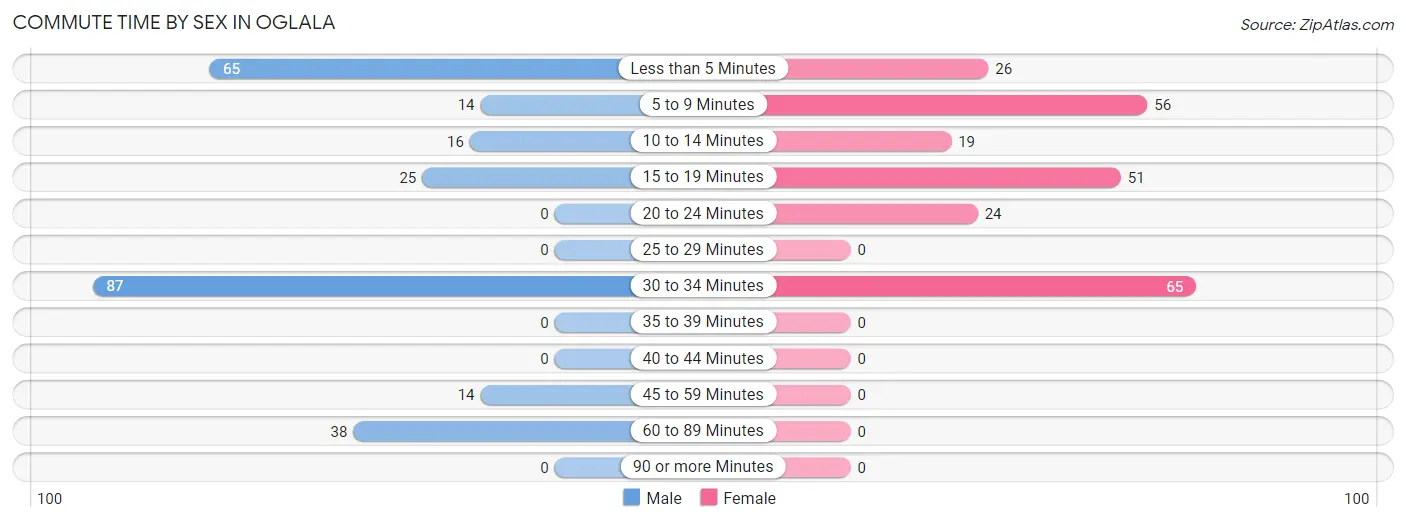
| Commute Time | Male | Female |
| Less than 5 Minutes | 65 (25.1%) | 26 (10.8%) |
| 5 to 9 Minutes | 14 (5.4%) | 56 (23.2%) |
| 10 to 14 Minutes | 16 (6.2%) | 19 (7.9%) |
| 15 to 19 Minutes | 25 (9.7%) | 51 (21.2%) |
| 20 to 24 Minutes | 0 (0.0%) | 24 (10.0%) |
| 25 to 29 Minutes | 0 (0.0%) | 0 (0.0%) |
| 30 to 34 Minutes | 87 (33.6%) | 65 (27.0%) |
| 35 to 39 Minutes | 0 (0.0%) | 0 (0.0%) |
| 40 to 44 Minutes | 0 (0.0%) | 0 (0.0%) |
| 45 to 59 Minutes | 14 (5.4%) | 0 (0.0%) |
| 60 to 89 Minutes | 38 (14.7%) | 0 (0.0%) |
| 90 or more Minutes | 0 (0.0%) | 0 (0.0%) |
Time of Departure to Work by Sex in Oglala
The most frequent times of departure to work in Oglala are 6:30 AM to 6:59 AM (79, 30.5%) for males and 8:00 AM to 8:29 AM (105, 43.6%) for females.
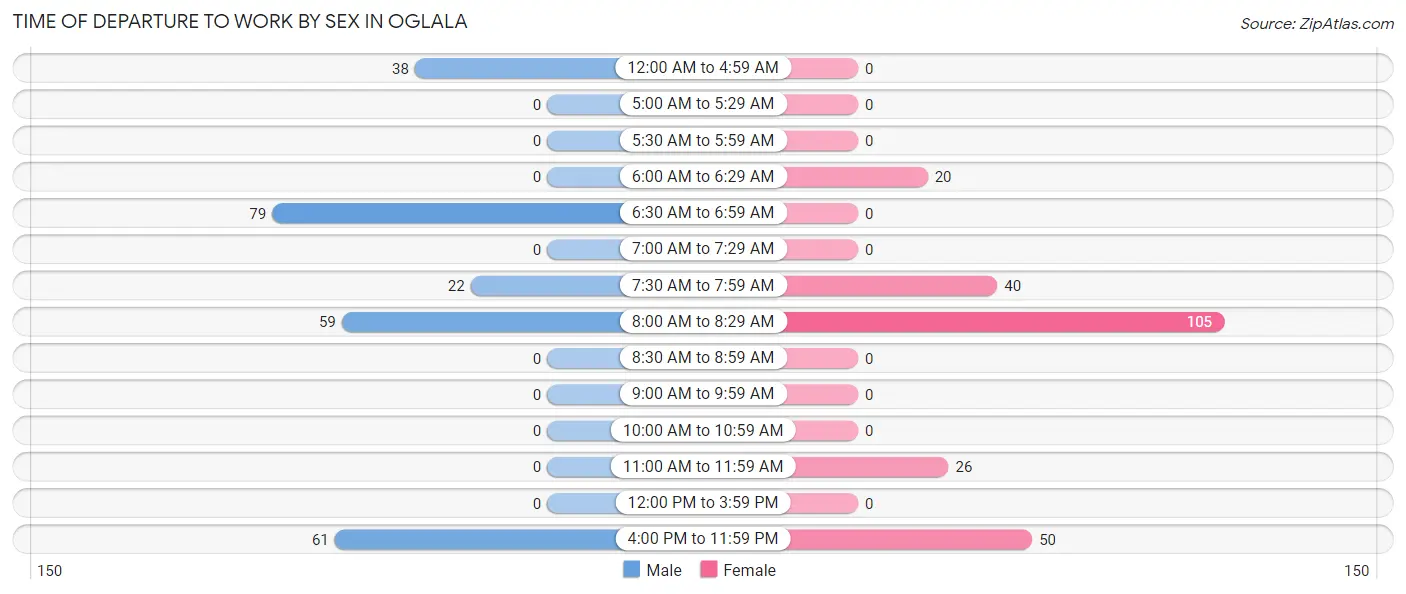
| Time of Departure | Male | Female |
| 12:00 AM to 4:59 AM | 38 (14.7%) | 0 (0.0%) |
| 5:00 AM to 5:29 AM | 0 (0.0%) | 0 (0.0%) |
| 5:30 AM to 5:59 AM | 0 (0.0%) | 0 (0.0%) |
| 6:00 AM to 6:29 AM | 0 (0.0%) | 20 (8.3%) |
| 6:30 AM to 6:59 AM | 79 (30.5%) | 0 (0.0%) |
| 7:00 AM to 7:29 AM | 0 (0.0%) | 0 (0.0%) |
| 7:30 AM to 7:59 AM | 22 (8.5%) | 40 (16.6%) |
| 8:00 AM to 8:29 AM | 59 (22.8%) | 105 (43.6%) |
| 8:30 AM to 8:59 AM | 0 (0.0%) | 0 (0.0%) |
| 9:00 AM to 9:59 AM | 0 (0.0%) | 0 (0.0%) |
| 10:00 AM to 10:59 AM | 0 (0.0%) | 0 (0.0%) |
| 11:00 AM to 11:59 AM | 0 (0.0%) | 26 (10.8%) |
| 12:00 PM to 3:59 PM | 0 (0.0%) | 0 (0.0%) |
| 4:00 PM to 11:59 PM | 61 (23.5%) | 50 (20.7%) |
| Total | 259 (100.0%) | 241 (100.0%) |
Housing Occupancy in Oglala
Occupancy by Ownership in Oglala
Of the total 347 dwellings in Oglala, owner-occupied units account for 144 (41.5%), while renter-occupied units make up 203 (58.5%).
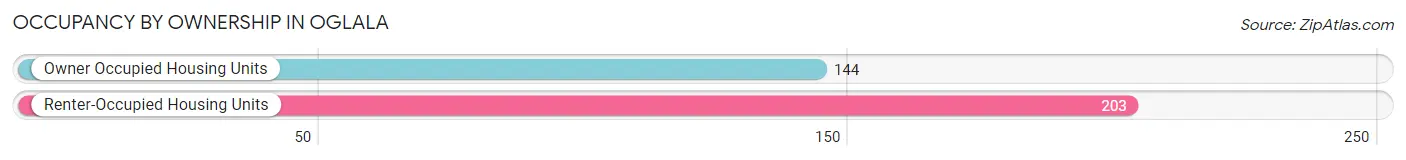
| Occupancy | # Housing Units | % Housing Units |
| Owner Occupied Housing Units | 144 | 41.5% |
| Renter-Occupied Housing Units | 203 | 58.5% |
| Total Occupied Housing Units | 347 | 100.0% |
Occupancy by Household Size in Oglala
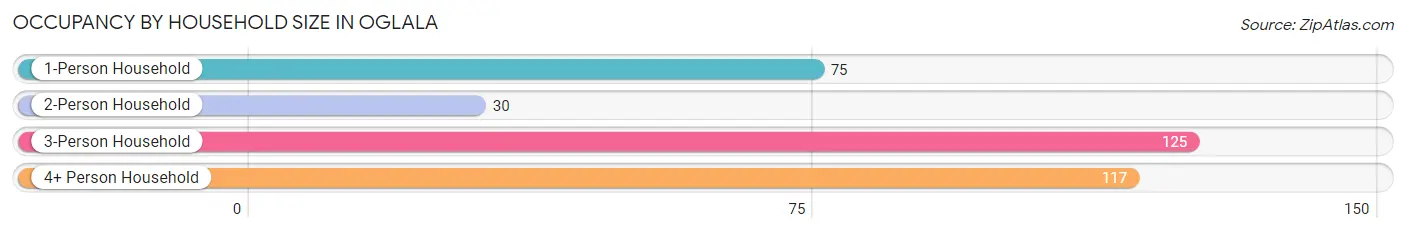
| Household Size | # Housing Units | % Housing Units |
| 1-Person Household | 75 | 21.6% |
| 2-Person Household | 30 | 8.6% |
| 3-Person Household | 125 | 36.0% |
| 4+ Person Household | 117 | 33.7% |
| Total Housing Units | 347 | 100.0% |
Occupancy by Ownership by Household Size in Oglala
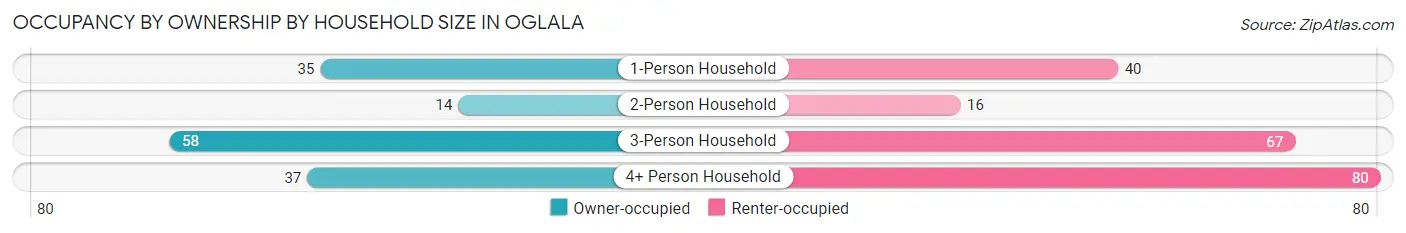
| Household Size | Owner-occupied | Renter-occupied |
| 1-Person Household | 35 (46.7%) | 40 (53.3%) |
| 2-Person Household | 14 (46.7%) | 16 (53.3%) |
| 3-Person Household | 58 (46.4%) | 67 (53.6%) |
| 4+ Person Household | 37 (31.6%) | 80 (68.4%) |
| Total Housing Units | 144 (41.5%) | 203 (58.5%) |
Occupancy by Educational Attainment in Oglala
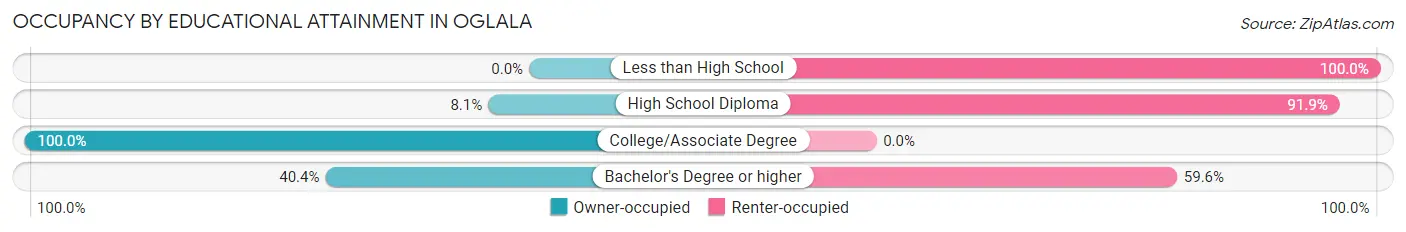
| Household Size | Owner-occupied | Renter-occupied |
| Less than High School | 0 (0.0%) | 104 (100.0%) |
| High School Diploma | 6 (8.1%) | 68 (91.9%) |
| College/Associate Degree | 117 (100.0%) | 0 (0.0%) |
| Bachelor's Degree or higher | 21 (40.4%) | 31 (59.6%) |
Occupancy by Age of Householder in Oglala
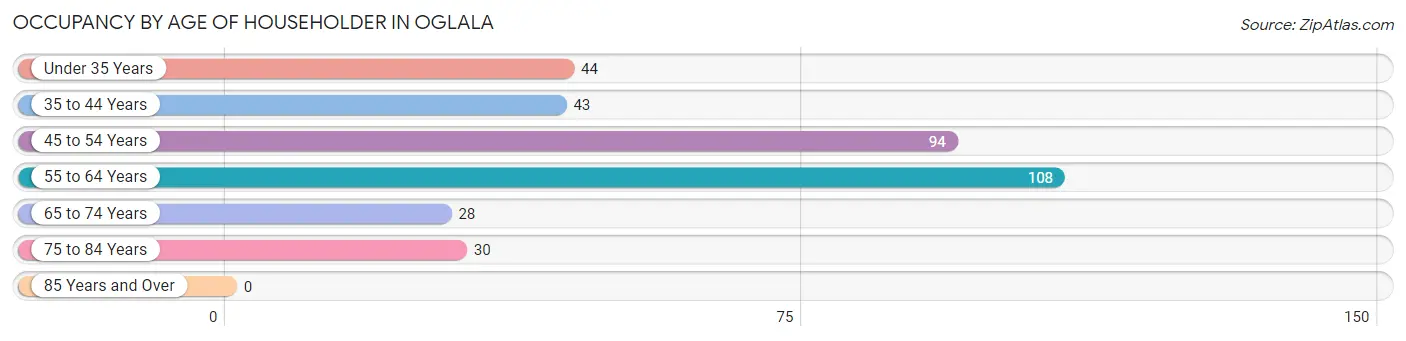
| Age Bracket | # Households | % Households |
| Under 35 Years | 44 | 12.7% |
| 35 to 44 Years | 43 | 12.4% |
| 45 to 54 Years | 94 | 27.1% |
| 55 to 64 Years | 108 | 31.1% |
| 65 to 74 Years | 28 | 8.1% |
| 75 to 84 Years | 30 | 8.6% |
| 85 Years and Over | 0 | 0.0% |
| Total | 347 | 100.0% |
Housing Finances in Oglala
Median Income by Occupancy in Oglala
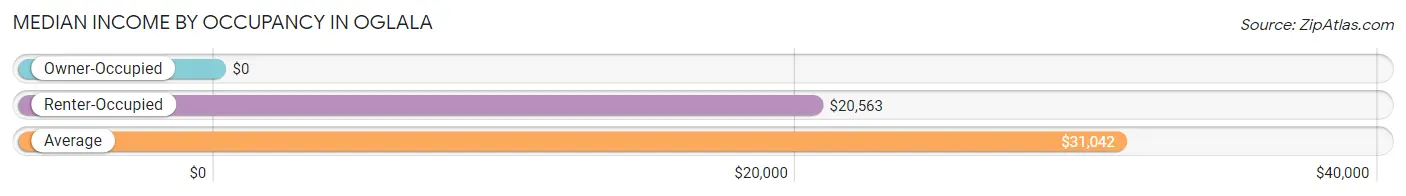
| Occupancy Type | # Households | Median Income |
| Owner-Occupied | 144 (41.5%) | $0 |
| Renter-Occupied | 203 (58.5%) | $20,563 |
| Average | 347 (100.0%) | $31,042 |
Occupancy by Householder Income Bracket in Oglala
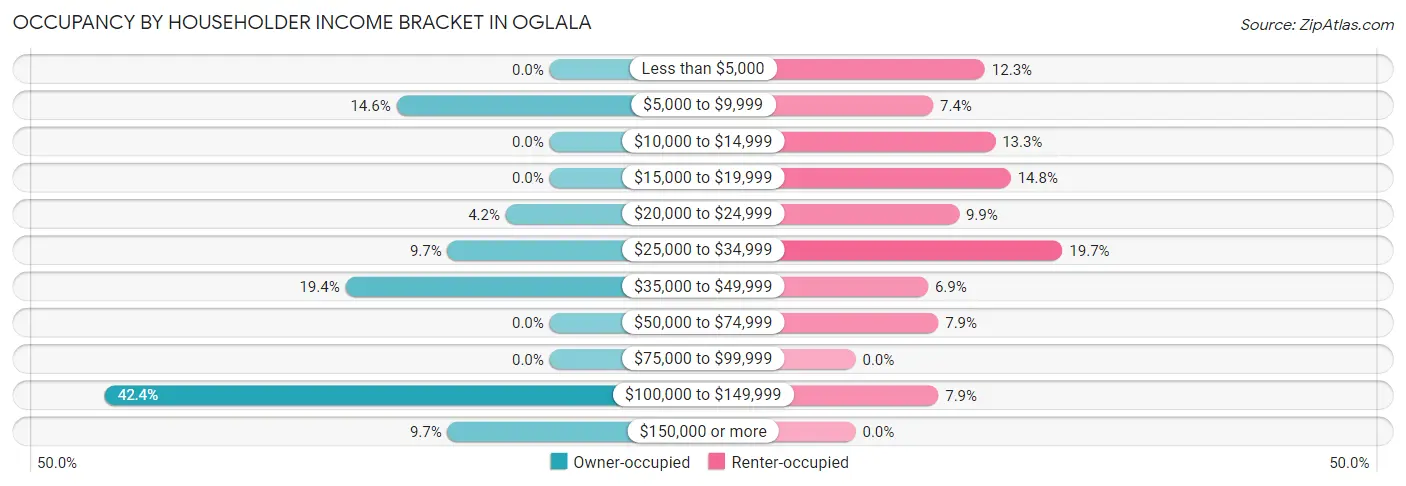
| Income Bracket | Owner-occupied | Renter-occupied |
| Less than $5,000 | 0 (0.0%) | 25 (12.3%) |
| $5,000 to $9,999 | 21 (14.6%) | 15 (7.4%) |
| $10,000 to $14,999 | 0 (0.0%) | 27 (13.3%) |
| $15,000 to $19,999 | 0 (0.0%) | 30 (14.8%) |
| $20,000 to $24,999 | 6 (4.2%) | 20 (9.9%) |
| $25,000 to $34,999 | 14 (9.7%) | 40 (19.7%) |
| $35,000 to $49,999 | 28 (19.4%) | 14 (6.9%) |
| $50,000 to $74,999 | 0 (0.0%) | 16 (7.9%) |
| $75,000 to $99,999 | 0 (0.0%) | 0 (0.0%) |
| $100,000 to $149,999 | 61 (42.4%) | 16 (7.9%) |
| $150,000 or more | 14 (9.7%) | 0 (0.0%) |
| Total | 144 (100.0%) | 203 (100.0%) |
Monthly Housing Cost Tiers in Oglala
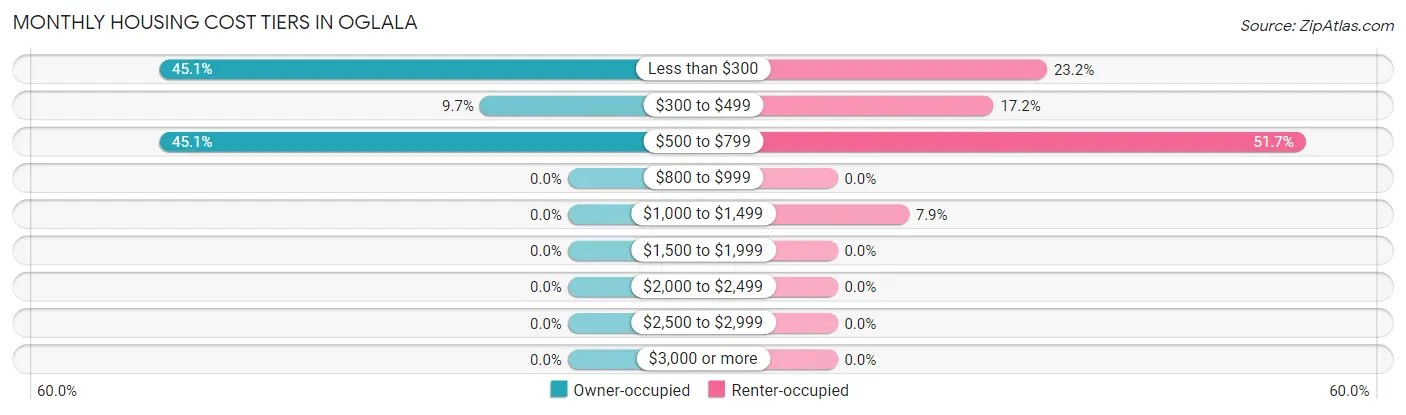
| Monthly Cost | Owner-occupied | Renter-occupied |
| Less than $300 | 65 (45.1%) | 47 (23.2%) |
| $300 to $499 | 14 (9.7%) | 35 (17.2%) |
| $500 to $799 | 65 (45.1%) | 105 (51.7%) |
| $800 to $999 | 0 (0.0%) | 0 (0.0%) |
| $1,000 to $1,499 | 0 (0.0%) | 16 (7.9%) |
| $1,500 to $1,999 | 0 (0.0%) | 0 (0.0%) |
| $2,000 to $2,499 | 0 (0.0%) | 0 (0.0%) |
| $2,500 to $2,999 | 0 (0.0%) | 0 (0.0%) |
| $3,000 or more | 0 (0.0%) | 0 (0.0%) |
| Total | 144 (100.0%) | 203 (100.0%) |
Physical Housing Characteristics in Oglala
Housing Structures in Oglala
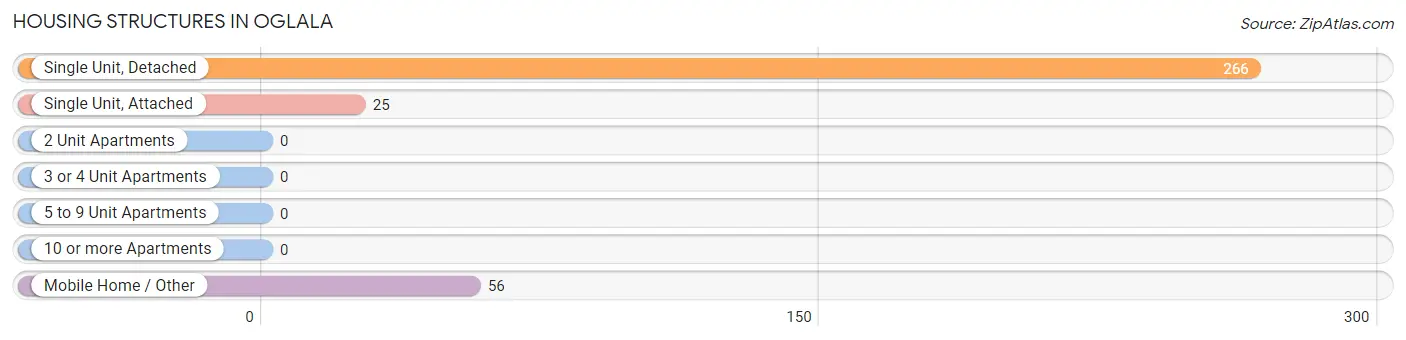
| Structure Type | # Housing Units | % Housing Units |
| Single Unit, Detached | 266 | 76.7% |
| Single Unit, Attached | 25 | 7.2% |
| 2 Unit Apartments | 0 | 0.0% |
| 3 or 4 Unit Apartments | 0 | 0.0% |
| 5 to 9 Unit Apartments | 0 | 0.0% |
| 10 or more Apartments | 0 | 0.0% |
| Mobile Home / Other | 56 | 16.1% |
| Total | 347 | 100.0% |
Housing Structures by Occupancy in Oglala
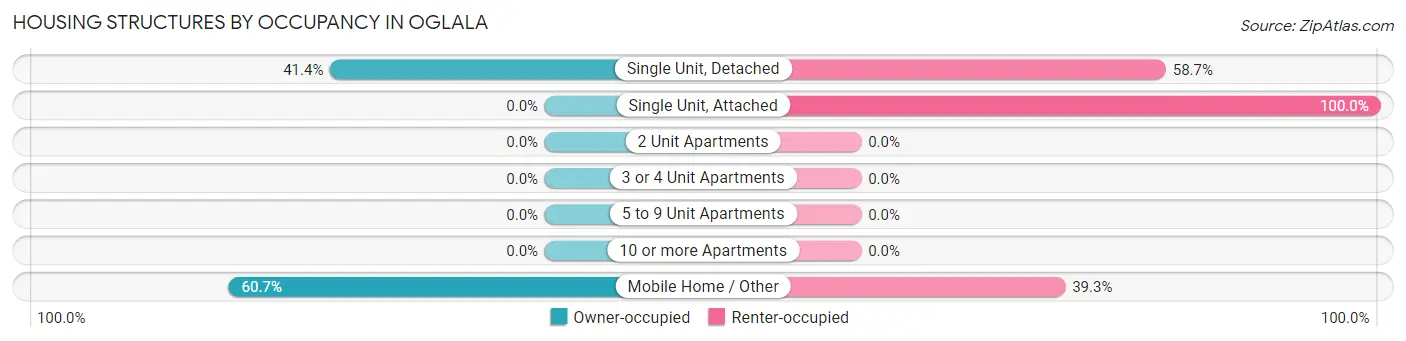
| Structure Type | Owner-occupied | Renter-occupied |
| Single Unit, Detached | 110 (41.3%) | 156 (58.7%) |
| Single Unit, Attached | 0 (0.0%) | 25 (100.0%) |
| 2 Unit Apartments | 0 (0.0%) | 0 (0.0%) |
| 3 or 4 Unit Apartments | 0 (0.0%) | 0 (0.0%) |
| 5 to 9 Unit Apartments | 0 (0.0%) | 0 (0.0%) |
| 10 or more Apartments | 0 (0.0%) | 0 (0.0%) |
| Mobile Home / Other | 34 (60.7%) | 22 (39.3%) |
| Total | 144 (41.5%) | 203 (58.5%) |
Housing Structures by Number of Rooms in Oglala
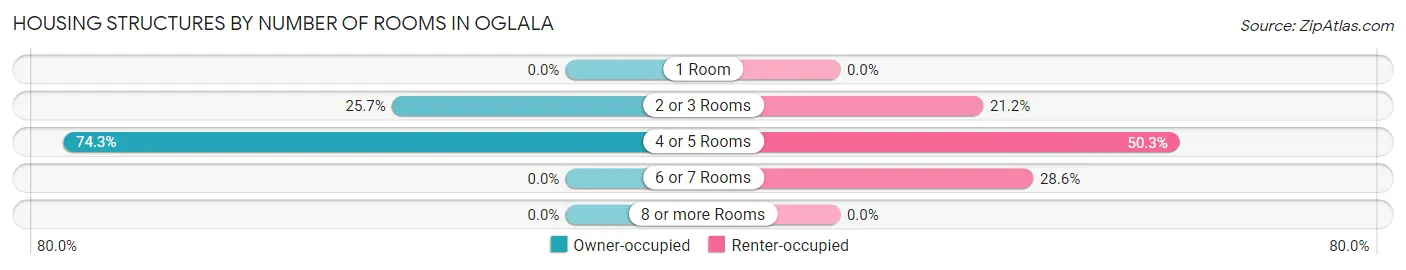
| Number of Rooms | Owner-occupied | Renter-occupied |
| 1 Room | 0 (0.0%) | 0 (0.0%) |
| 2 or 3 Rooms | 37 (25.7%) | 43 (21.2%) |
| 4 or 5 Rooms | 107 (74.3%) | 102 (50.2%) |
| 6 or 7 Rooms | 0 (0.0%) | 58 (28.6%) |
| 8 or more Rooms | 0 (0.0%) | 0 (0.0%) |
| Total | 144 (100.0%) | 203 (100.0%) |
Housing Structure by Heating Type in Oglala
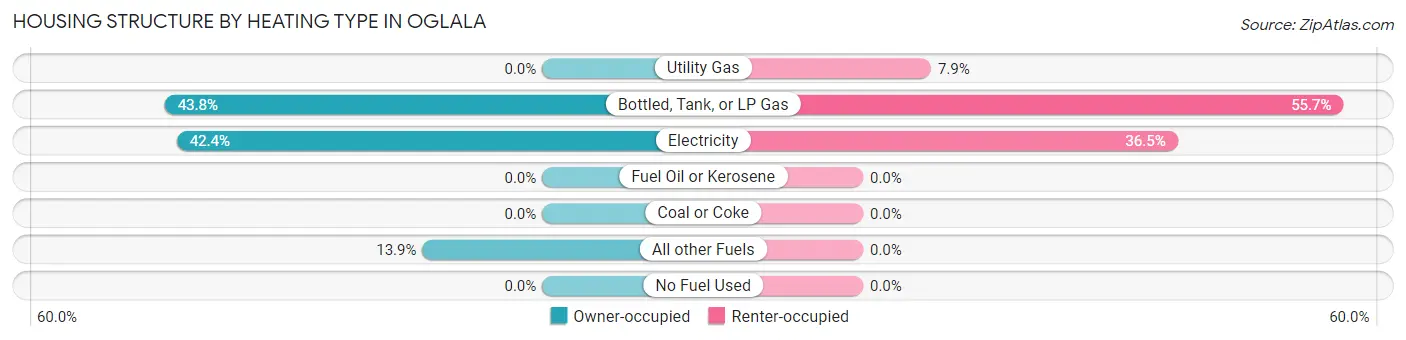
| Heating Type | Owner-occupied | Renter-occupied |
| Utility Gas | 0 (0.0%) | 16 (7.9%) |
| Bottled, Tank, or LP Gas | 63 (43.8%) | 113 (55.7%) |
| Electricity | 61 (42.4%) | 74 (36.4%) |
| Fuel Oil or Kerosene | 0 (0.0%) | 0 (0.0%) |
| Coal or Coke | 0 (0.0%) | 0 (0.0%) |
| All other Fuels | 20 (13.9%) | 0 (0.0%) |
| No Fuel Used | 0 (0.0%) | 0 (0.0%) |
| Total | 144 (100.0%) | 203 (100.0%) |
Household Vehicle Usage in Oglala
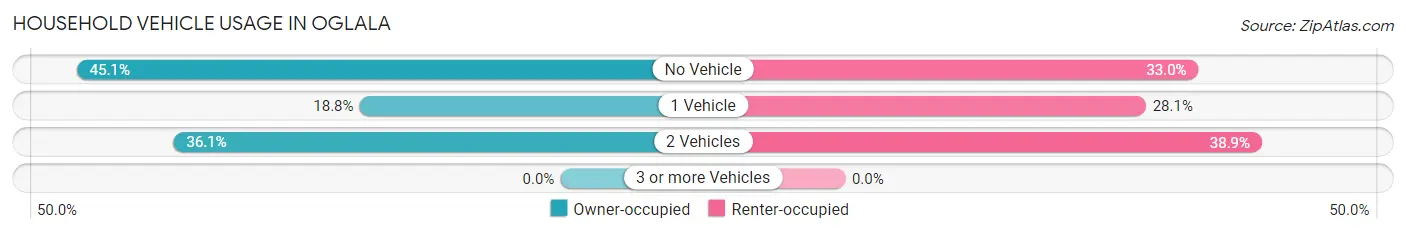
| Vehicles per Household | Owner-occupied | Renter-occupied |
| No Vehicle | 65 (45.1%) | 67 (33.0%) |
| 1 Vehicle | 27 (18.8%) | 57 (28.1%) |
| 2 Vehicles | 52 (36.1%) | 79 (38.9%) |
| 3 or more Vehicles | 0 (0.0%) | 0 (0.0%) |
| Total | 144 (100.0%) | 203 (100.0%) |
Real Estate & Mortgages in Oglala
Real Estate and Mortgage Overview in Oglala
| Characteristic | Without Mortgage | With Mortgage |
| Housing Units | 116 | 28 |
| Median Property Value | - | - |
| Median Household Income | $116,771 | $0 |
| Monthly Housing Costs | - | - |
| Real Estate Taxes | - | - |
Property Value by Mortgage Status in Oglala
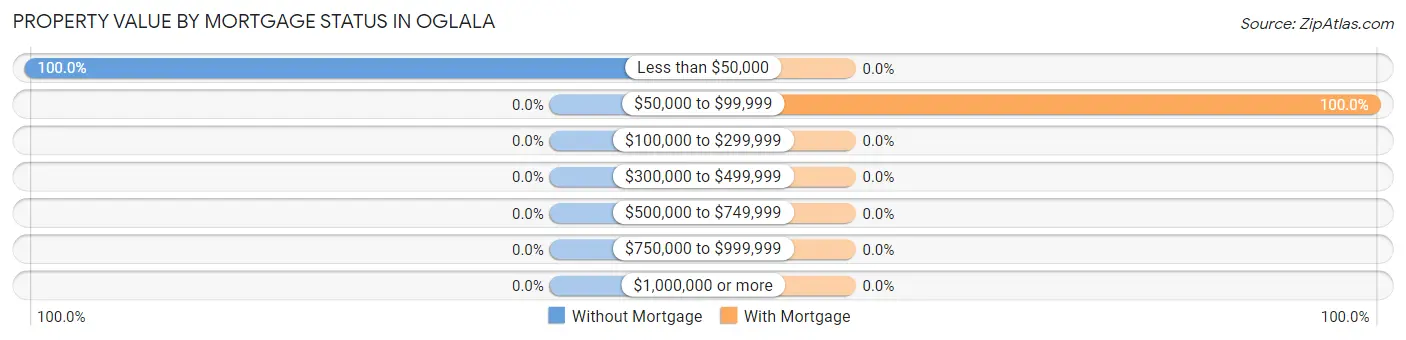
| Property Value | Without Mortgage | With Mortgage |
| Less than $50,000 | 116 (100.0%) | 0 (0.0%) |
| $50,000 to $99,999 | 0 (0.0%) | 28 (100.0%) |
| $100,000 to $299,999 | 0 (0.0%) | 0 (0.0%) |
| $300,000 to $499,999 | 0 (0.0%) | 0 (0.0%) |
| $500,000 to $749,999 | 0 (0.0%) | 0 (0.0%) |
| $750,000 to $999,999 | 0 (0.0%) | 0 (0.0%) |
| $1,000,000 or more | 0 (0.0%) | 0 (0.0%) |
| Total | 116 (100.0%) | 28 (100.0%) |
Household Income by Mortgage Status in Oglala
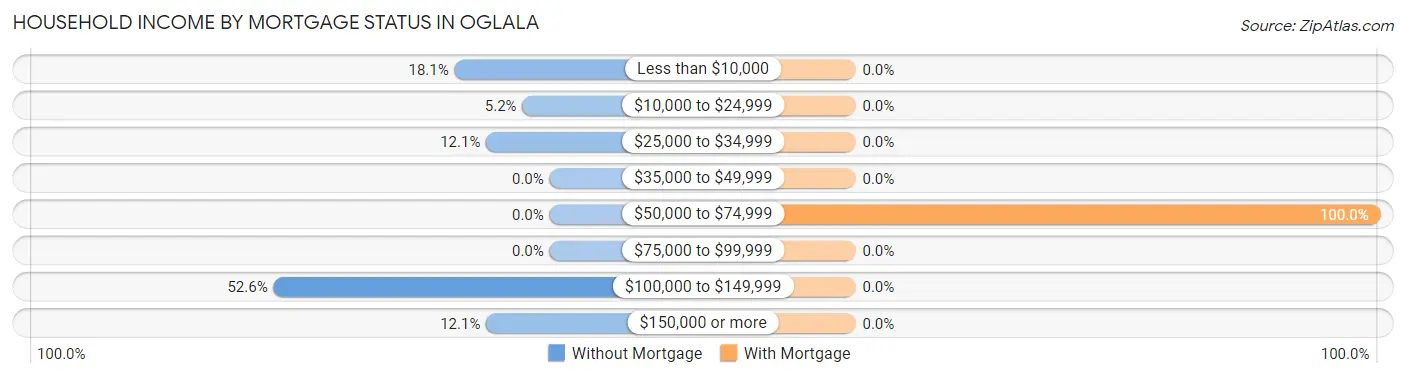
| Household Income | Without Mortgage | With Mortgage |
| Less than $10,000 | 21 (18.1%) | 0 (0.0%) |
| $10,000 to $24,999 | 6 (5.2%) | 0 (0.0%) |
| $25,000 to $34,999 | 14 (12.1%) | 0 (0.0%) |
| $35,000 to $49,999 | 0 (0.0%) | 0 (0.0%) |
| $50,000 to $74,999 | 0 (0.0%) | 28 (100.0%) |
| $75,000 to $99,999 | 0 (0.0%) | 0 (0.0%) |
| $100,000 to $149,999 | 61 (52.6%) | 0 (0.0%) |
| $150,000 or more | 14 (12.1%) | 0 (0.0%) |
| Total | 116 (100.0%) | 28 (100.0%) |
Property Value to Household Income Ratio in Oglala
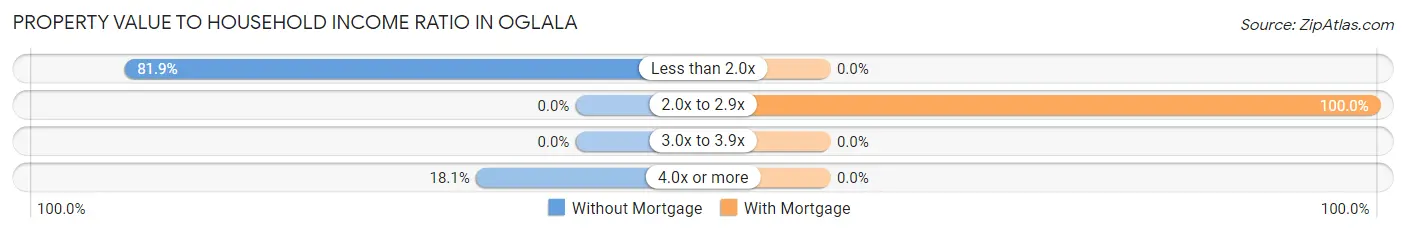
| Value-to-Income Ratio | Without Mortgage | With Mortgage |
| Less than 2.0x | 95 (81.9%) | 0 (0.0%) |
| 2.0x to 2.9x | 0 (0.0%) | 28 (100.0%) |
| 3.0x to 3.9x | 0 (0.0%) | 0 (0.0%) |
| 4.0x or more | 21 (18.1%) | 0 (0.0%) |
| Total | 116 (100.0%) | 28 (100.0%) |
Real Estate Taxes by Mortgage Status in Oglala
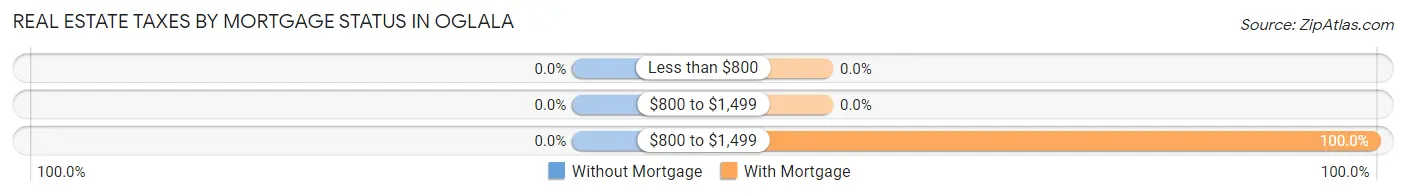
| Property Taxes | Without Mortgage | With Mortgage |
| Less than $800 | 0 (0.0%) | 0 (0.0%) |
| $800 to $1,499 | 0 (0.0%) | 0 (0.0%) |
| $800 to $1,499 | 0 (0.0%) | 28 (100.0%) |
| Total | 116 (100.0%) | 28 (100.0%) |
Health & Disability in Oglala
Health Insurance Coverage by Age in Oglala
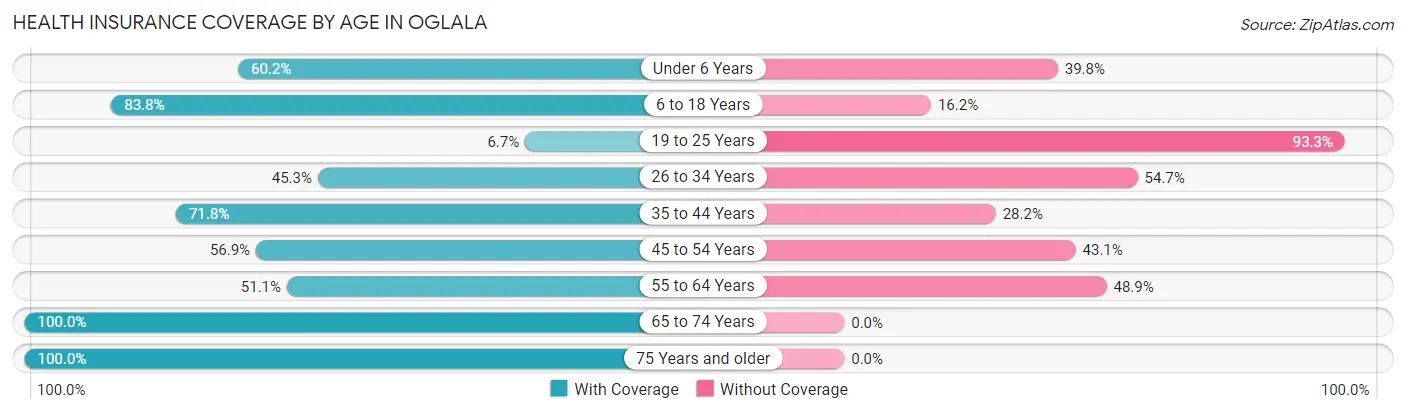
| Age Bracket | With Coverage | Without Coverage |
| Under 6 Years | 130 (60.2%) | 86 (39.8%) |
| 6 to 18 Years | 223 (83.8%) | 43 (16.2%) |
| 19 to 25 Years | 10 (6.7%) | 140 (93.3%) |
| 26 to 34 Years | 126 (45.3%) | 152 (54.7%) |
| 35 to 44 Years | 94 (71.8%) | 37 (28.2%) |
| 45 to 54 Years | 116 (56.9%) | 88 (43.1%) |
| 55 to 64 Years | 70 (51.1%) | 67 (48.9%) |
| 65 to 74 Years | 28 (100.0%) | 0 (0.0%) |
| 75 Years and older | 30 (100.0%) | 0 (0.0%) |
| Total | 827 (57.4%) | 613 (42.6%) |
Health Insurance Coverage by Citizenship Status in Oglala
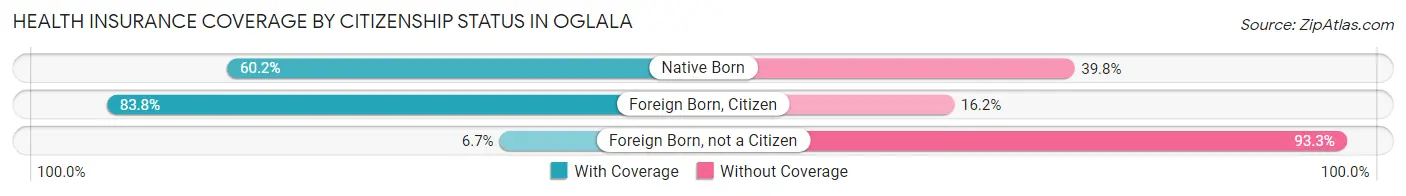
| Citizenship Status | With Coverage | Without Coverage |
| Native Born | 130 (60.2%) | 86 (39.8%) |
| Foreign Born, Citizen | 223 (83.8%) | 43 (16.2%) |
| Foreign Born, not a Citizen | 10 (6.7%) | 140 (93.3%) |
Health Insurance Coverage by Household Income in Oglala
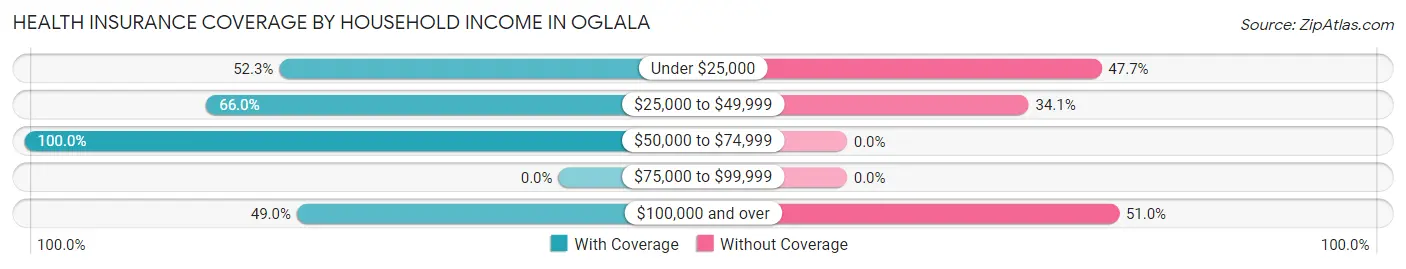
| Household Income | With Coverage | Without Coverage |
| Under $25,000 | 239 (52.3%) | 218 (47.7%) |
| $25,000 to $49,999 | 215 (65.9%) | 111 (34.1%) |
| $50,000 to $74,999 | 81 (100.0%) | 0 (0.0%) |
| $75,000 to $99,999 | 0 (0.0%) | 0 (0.0%) |
| $100,000 and over | 273 (49.0%) | 284 (51.0%) |
Public vs Private Health Insurance Coverage by Age in Oglala
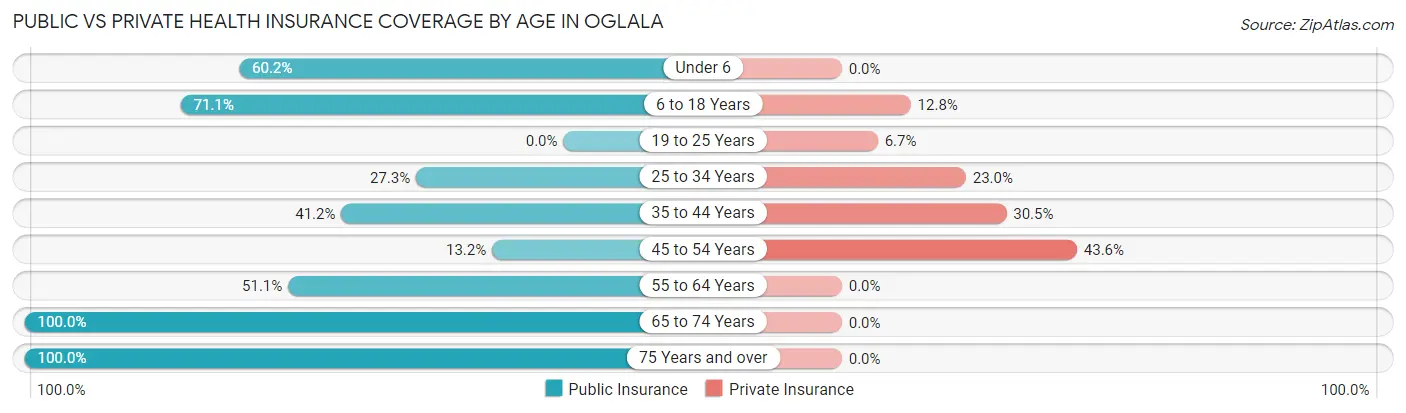
| Age Bracket | Public Insurance | Private Insurance |
| Under 6 | 130 (60.2%) | 0 (0.0%) |
| 6 to 18 Years | 189 (71.1%) | 34 (12.8%) |
| 19 to 25 Years | 0 (0.0%) | 10 (6.7%) |
| 25 to 34 Years | 76 (27.3%) | 64 (23.0%) |
| 35 to 44 Years | 54 (41.2%) | 40 (30.5%) |
| 45 to 54 Years | 27 (13.2%) | 89 (43.6%) |
| 55 to 64 Years | 70 (51.1%) | 0 (0.0%) |
| 65 to 74 Years | 28 (100.0%) | 0 (0.0%) |
| 75 Years and over | 30 (100.0%) | 0 (0.0%) |
| Total | 604 (41.9%) | 237 (16.5%) |
Disability Status by Sex by Age in Oglala
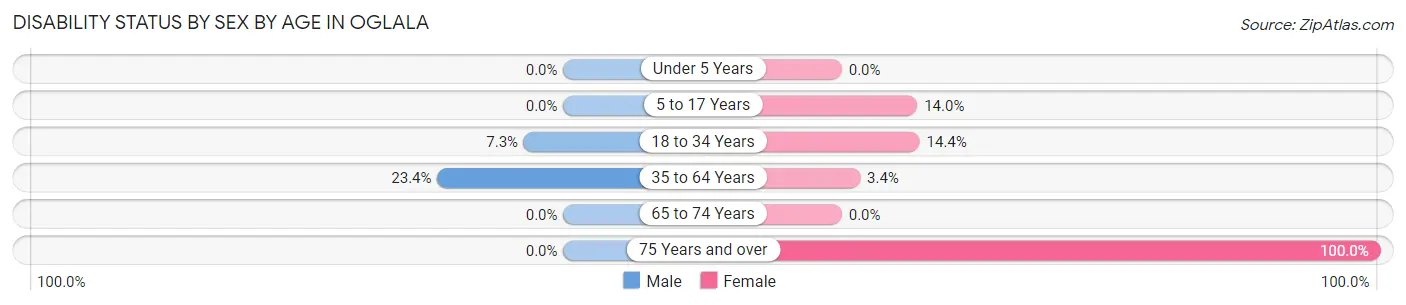
| Age Bracket | Male | Female |
| Under 5 Years | 0 (0.0%) | 0 (0.0%) |
| 5 to 17 Years | 0 (0.0%) | 21 (14.0%) |
| 18 to 34 Years | 21 (7.3%) | 26 (14.4%) |
| 35 to 64 Years | 69 (23.4%) | 6 (3.4%) |
| 65 to 74 Years | 0 (0.0%) | 0 (0.0%) |
| 75 Years and over | 0 (0.0%) | 30 (100.0%) |
Disability Class by Sex by Age in Oglala
Disability Class: Hearing Difficulty
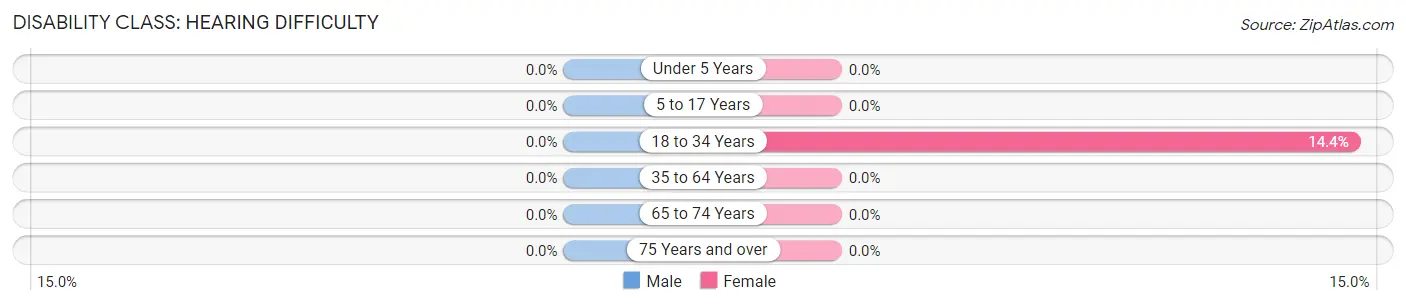
| Age Bracket | Male | Female |
| Under 5 Years | 0 (0.0%) | 0 (0.0%) |
| 5 to 17 Years | 0 (0.0%) | 0 (0.0%) |
| 18 to 34 Years | 0 (0.0%) | 26 (14.4%) |
| 35 to 64 Years | 0 (0.0%) | 0 (0.0%) |
| 65 to 74 Years | 0 (0.0%) | 0 (0.0%) |
| 75 Years and over | 0 (0.0%) | 0 (0.0%) |
Disability Class: Vision Difficulty
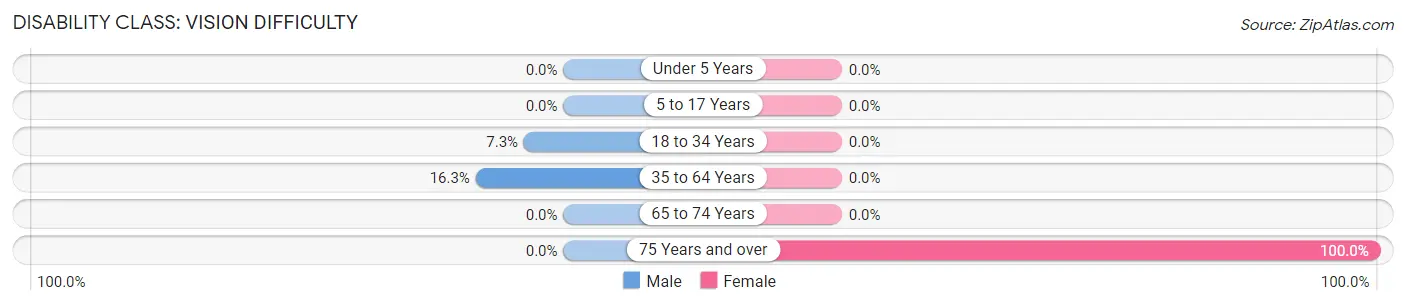
| Age Bracket | Male | Female |
| Under 5 Years | 0 (0.0%) | 0 (0.0%) |
| 5 to 17 Years | 0 (0.0%) | 0 (0.0%) |
| 18 to 34 Years | 21 (7.3%) | 0 (0.0%) |
| 35 to 64 Years | 48 (16.3%) | 0 (0.0%) |
| 65 to 74 Years | 0 (0.0%) | 0 (0.0%) |
| 75 Years and over | 0 (0.0%) | 30 (100.0%) |
Disability Class: Cognitive Difficulty
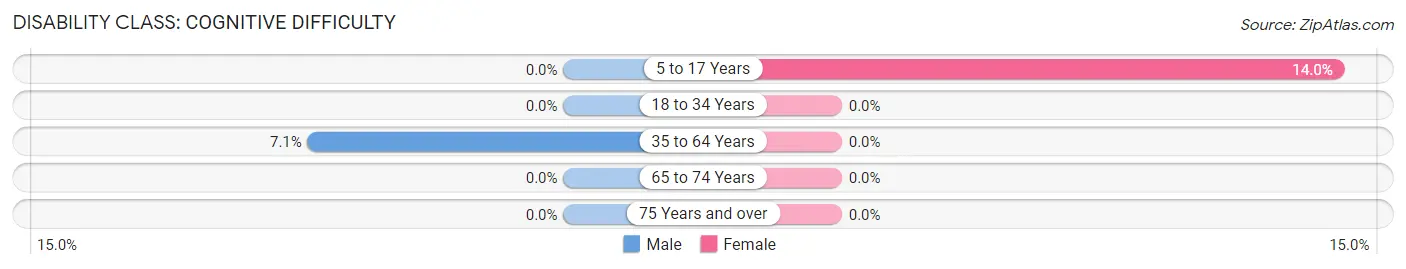
| Age Bracket | Male | Female |
| 5 to 17 Years | 0 (0.0%) | 21 (14.0%) |
| 18 to 34 Years | 0 (0.0%) | 0 (0.0%) |
| 35 to 64 Years | 21 (7.1%) | 0 (0.0%) |
| 65 to 74 Years | 0 (0.0%) | 0 (0.0%) |
| 75 Years and over | 0 (0.0%) | 0 (0.0%) |
Disability Class: Ambulatory Difficulty
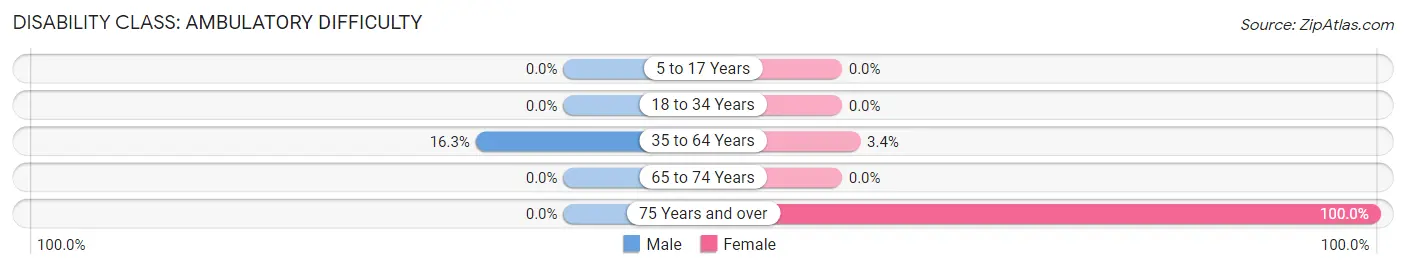
| Age Bracket | Male | Female |
| 5 to 17 Years | 0 (0.0%) | 0 (0.0%) |
| 18 to 34 Years | 0 (0.0%) | 0 (0.0%) |
| 35 to 64 Years | 48 (16.3%) | 6 (3.4%) |
| 65 to 74 Years | 0 (0.0%) | 0 (0.0%) |
| 75 Years and over | 0 (0.0%) | 30 (100.0%) |
Disability Class: Self-Care Difficulty
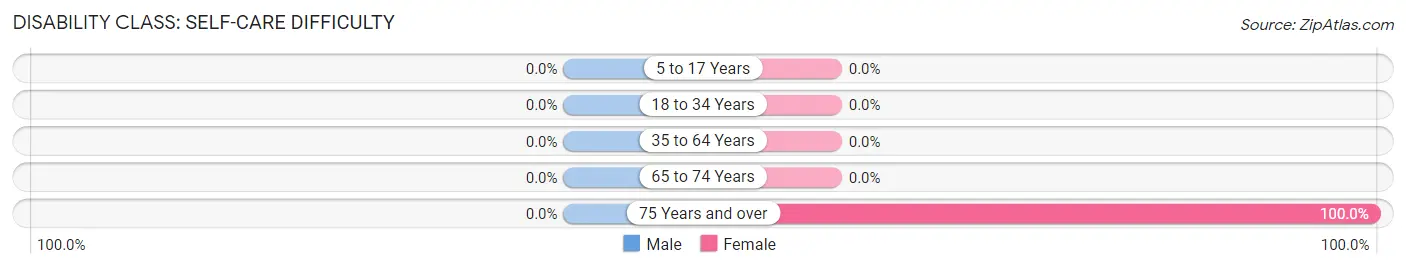
| Age Bracket | Male | Female |
| 5 to 17 Years | 0 (0.0%) | 0 (0.0%) |
| 18 to 34 Years | 0 (0.0%) | 0 (0.0%) |
| 35 to 64 Years | 0 (0.0%) | 0 (0.0%) |
| 65 to 74 Years | 0 (0.0%) | 0 (0.0%) |
| 75 Years and over | 0 (0.0%) | 30 (100.0%) |
Technology Access in Oglala
Computing Device Access in Oglala
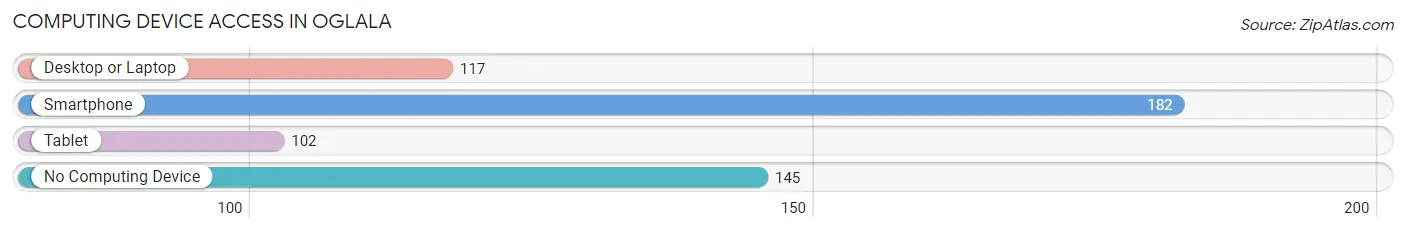
| Device Type | # Households | % Households |
| Desktop or Laptop | 117 | 33.7% |
| Smartphone | 182 | 52.4% |
| Tablet | 102 | 29.4% |
| No Computing Device | 145 | 41.8% |
| Total | 347 | 100.0% |
Internet Access in Oglala
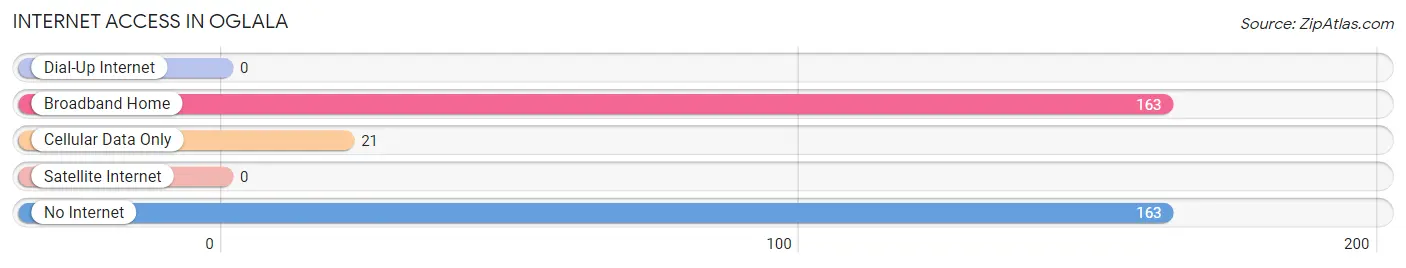
| Internet Type | # Households | % Households |
| Dial-Up Internet | 0 | 0.0% |
| Broadband Home | 163 | 47.0% |
| Cellular Data Only | 21 | 6.0% |
| Satellite Internet | 0 | 0.0% |
| No Internet | 163 | 47.0% |
| Total | 347 | 100.0% |
Oglala Summary
Oglala, South Dakota is a small town located in the Pine Ridge Indian Reservation in the southwestern corner of the state. It is the largest town in the reservation and is home to the Oglala Sioux Tribe. The town has a population of about 2,000 people and is located in Shannon County.
Geography
Oglala is located in the Pine Ridge Indian Reservation in the southwestern corner of South Dakota. The town is situated on the northern edge of the Badlands National Park and is surrounded by rolling hills and grasslands. The town is located at an elevation of 3,400 feet and has a total area of 0.6 square miles. The town is located in the Central Time Zone and has a semi-arid climate with hot summers and cold winters.
Economy
The economy of Oglala is largely based on tourism and agriculture. The town is home to the Oglala Sioux Tribe and is a popular destination for tourists who come to visit the Badlands National Park. The town also has a number of small businesses, including a grocery store, a gas station, and a few restaurants. The town also has a casino, which is a major source of revenue for the town.
Agriculture is also an important part of the economy of Oglala. The town is home to a number of farms and ranches, which produce a variety of crops, including corn, wheat, and hay. Livestock is also raised in the area, including cattle, horses, and sheep.
Demographics
As of the 2010 census, the population of Oglala was 2,073. The town has a population that is predominantly Native American, with the majority of the population being members of the Oglala Sioux Tribe. The town also has a small population of non-Native Americans, including African Americans, Hispanics, and Asians.
The median household income in Oglala is $20,000, which is significantly lower than the national average. The poverty rate in the town is also higher than the national average, with nearly 40% of the population living below the poverty line.
Conclusion
Oglala, South Dakota is a small town located in the Pine Ridge Indian Reservation in the southwestern corner of the state. The town has a population of about 2,000 people and is home to the Oglala Sioux Tribe. The economy of Oglala is largely based on tourism and agriculture, and the town is a popular destination for tourists who come to visit the Badlands National Park. The town also has a number of small businesses, including a grocery store, a gas station, and a few restaurants. The population of Oglala is predominantly Native American, with the majority of the population being members of the Oglala Sioux Tribe. The median household income in Oglala is significantly lower than the national average, and the poverty rate in the town is also higher than the national average.
Common Questions
What is Per Capita Income in Oglala?
Per Capita income in Oglala is $17,678.
What is the Median Family Income in Oglala?
Median Family Income in Oglala is $42,321.
What is the Median Household income in Oglala?
Median Household Income in Oglala is $31,042.
What is Inequality or Gini Index in Oglala?
Inequality or Gini Index in Oglala is 0.55.
What is the Total Population of Oglala?
Total Population of Oglala is 1,440.
What is the Total Male Population of Oglala?
Total Male Population of Oglala is 821.
What is the Total Female Population of Oglala?
Total Female Population of Oglala is 619.
What is the Ratio of Males per 100 Females in Oglala?
There are 132.63 Males per 100 Females in Oglala.
What is the Ratio of Females per 100 Males in Oglala?
There are 75.40 Females per 100 Males in Oglala.
What is the Median Population Age in Oglala?
Median Population Age in Oglala is 28.2 Years.
What is the Average Family Size in Oglala
Average Family Size in Oglala is 4.8 People.
What is the Average Household Size in Oglala
Average Household Size in Oglala is 4.1 People.
How Large is the Labor Force in Oglala?
There are 639 People in the Labor Forcein in Oglala.
What is the Percentage of People in the Labor Force in Oglala?
63.1% of People are in the Labor Force in Oglala.
What is the Unemployment Rate in Oglala?
Unemployment Rate in Oglala is 21.0%.