Agency Village, SD Map & Demographics
Agency Village Map
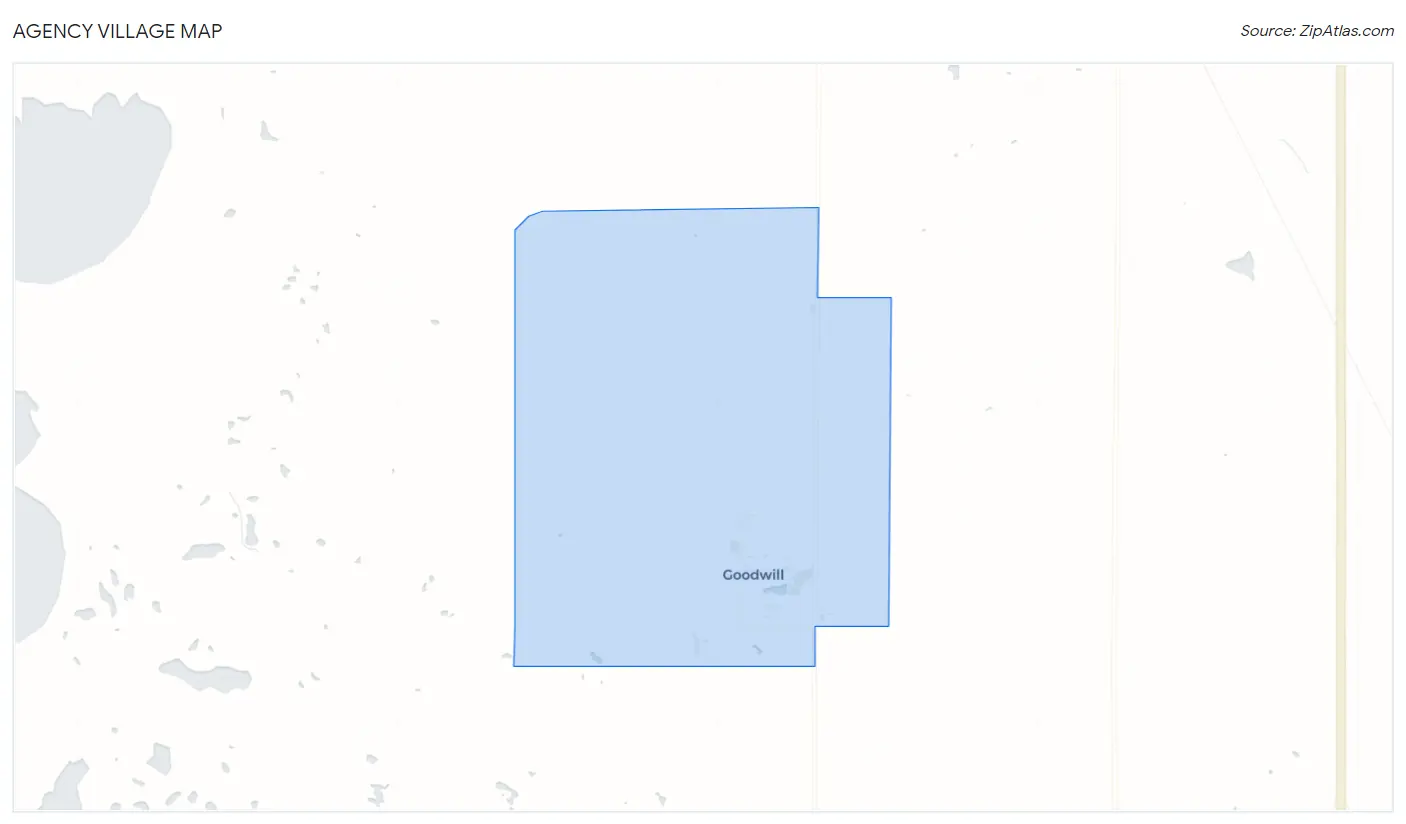
Agency Village Overview
$14,033
PER CAPITA INCOME
$46,500
AVG FAMILY INCOME
$48,194
AVG HOUSEHOLD INCOME
53.1%
WAGE / INCOME GAP [ % ]
46.9¢/ $1
WAGE / INCOME GAP [ $ ]
0.41
INEQUALITY / GINI INDEX
972
TOTAL POPULATION
604
MALE POPULATION
368
FEMALE POPULATION
164.13
MALES / 100 FEMALES
60.93
FEMALES / 100 MALES
26.5
MEDIAN AGE
5.1
AVG FAMILY SIZE
4.5
AVG HOUSEHOLD SIZE
394
LABOR FORCE [ PEOPLE ]
59.0%
PERCENT IN LABOR FORCE
6.3%
UNEMPLOYMENT RATE
Agency Village Area Codes
Income in Agency Village
Income Overview in Agency Village
Per Capita Income in Agency Village is $14,033, while median incomes of families and households are $46,500 and $48,194 respectively.
| Characteristic | Number | Measure |
| Per Capita Income | 972 | $14,033 |
| Median Family Income | 160 | $46,500 |
| Mean Family Income | 160 | $55,599 |
| Median Household Income | 204 | $48,194 |
| Mean Household Income | 204 | $53,125 |
| Income Deficit | 160 | $0 |
| Wage / Income Gap (%) | 972 | 53.13% |
| Wage / Income Gap ($) | 972 | 46.87¢ per $1 |
| Gini / Inequality Index | 972 | 0.41 |
Earnings by Sex in Agency Village
Average Earnings in Agency Village are $18,182, $16,458 for men and $35,114 for women, a difference of 53.1%.
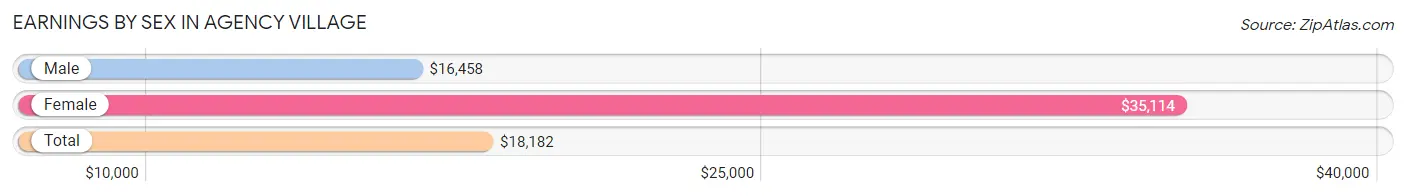
| Sex | Number | Average Earnings |
| Male | 288 (62.3%) | $16,458 |
| Female | 174 (37.7%) | $35,114 |
| Total | 462 (100.0%) | $18,182 |
Earnings by Sex by Income Bracket in Agency Village
The most common earnings brackets in Agency Village are $12,500 to $14,999 for men (44 | 15.3%) and $40,000 to $44,999 for women (32 | 18.4%).
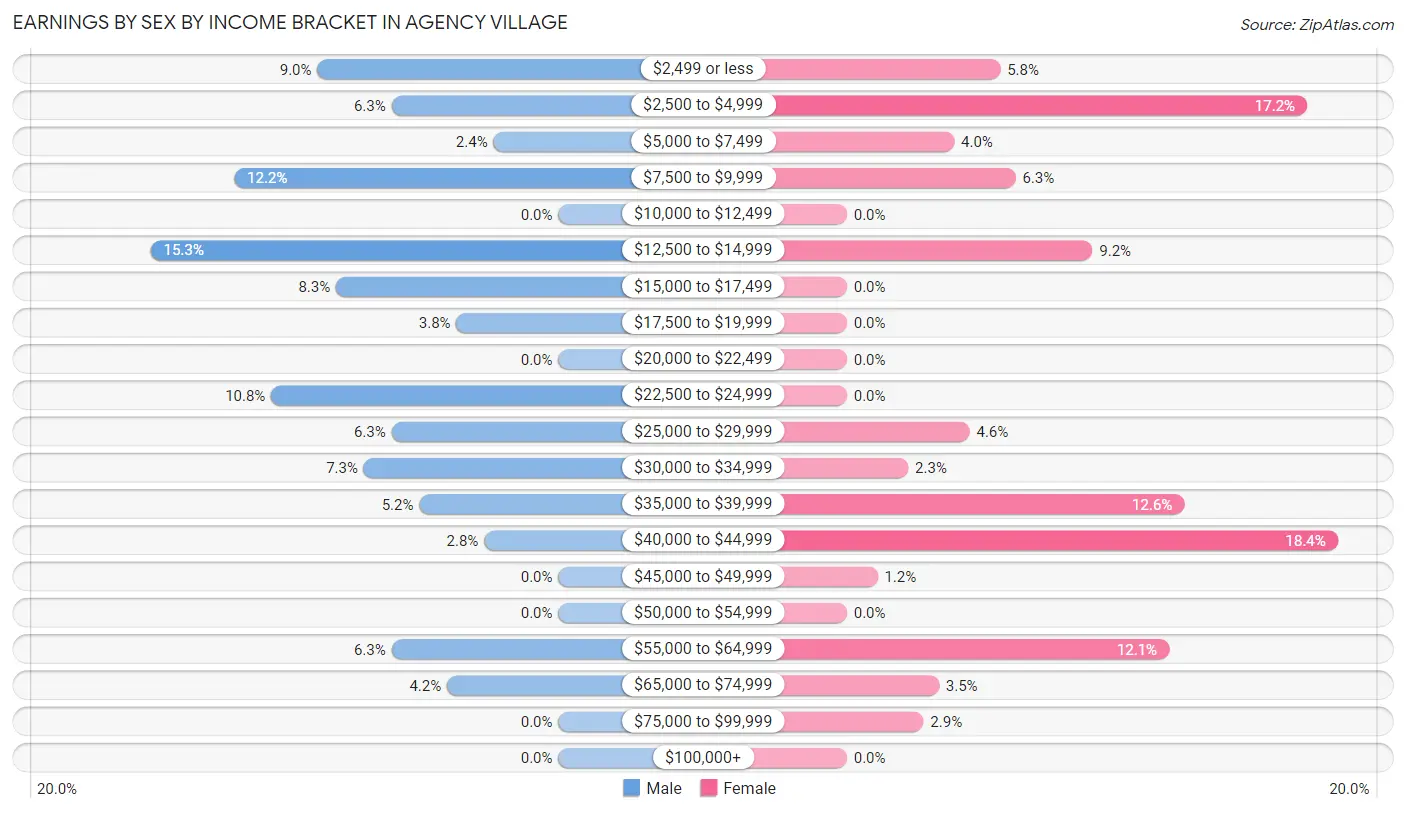
| Income | Male | Female |
| $2,499 or less | 26 (9.0%) | 10 (5.8%) |
| $2,500 to $4,999 | 18 (6.2%) | 30 (17.2%) |
| $5,000 to $7,499 | 7 (2.4%) | 7 (4.0%) |
| $7,500 to $9,999 | 35 (12.1%) | 11 (6.3%) |
| $10,000 to $12,499 | 0 (0.0%) | 0 (0.0%) |
| $12,500 to $14,999 | 44 (15.3%) | 16 (9.2%) |
| $15,000 to $17,499 | 24 (8.3%) | 0 (0.0%) |
| $17,500 to $19,999 | 11 (3.8%) | 0 (0.0%) |
| $20,000 to $22,499 | 0 (0.0%) | 0 (0.0%) |
| $22,500 to $24,999 | 31 (10.8%) | 0 (0.0%) |
| $25,000 to $29,999 | 18 (6.2%) | 8 (4.6%) |
| $30,000 to $34,999 | 21 (7.3%) | 4 (2.3%) |
| $35,000 to $39,999 | 15 (5.2%) | 22 (12.6%) |
| $40,000 to $44,999 | 8 (2.8%) | 32 (18.4%) |
| $45,000 to $49,999 | 0 (0.0%) | 2 (1.1%) |
| $50,000 to $54,999 | 0 (0.0%) | 0 (0.0%) |
| $55,000 to $64,999 | 18 (6.2%) | 21 (12.1%) |
| $65,000 to $74,999 | 12 (4.2%) | 6 (3.5%) |
| $75,000 to $99,999 | 0 (0.0%) | 5 (2.9%) |
| $100,000+ | 0 (0.0%) | 0 (0.0%) |
| Total | 288 (100.0%) | 174 (100.0%) |
Earnings by Sex by Educational Attainment in Agency Village
Average earnings in Agency Village are $19,091 for men and $36,534 for women, a difference of 47.7%. Men with an educational attainment of high school diploma enjoy the highest average annual earnings of $21,250, while those with college or associate's degree education earn the least with $9,571. Women with an educational attainment of college or associate's degree earn the most with the average annual earnings of $36,964, while those with high school diploma education have the smallest earnings of $36,083.
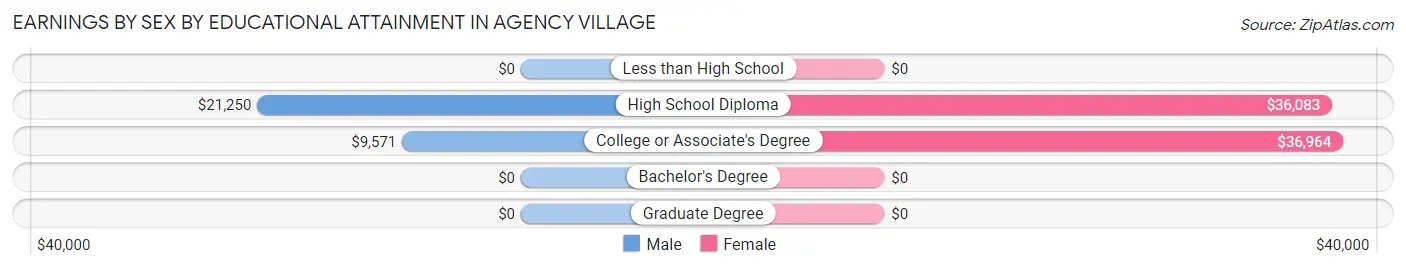
| Educational Attainment | Male Income | Female Income |
| Less than High School | - | - |
| High School Diploma | $21,250 | $36,083 |
| College or Associate's Degree | $9,571 | $36,964 |
| Bachelor's Degree | - | - |
| Graduate Degree | - | - |
| Total | $19,091 | $36,534 |
Family Income in Agency Village
Family Income Brackets in Agency Village
According to the Agency Village family income data, there are 29 families falling into the $35,000 to $49,999 income range, which is the most common income bracket and makes up 18.1% of all families.
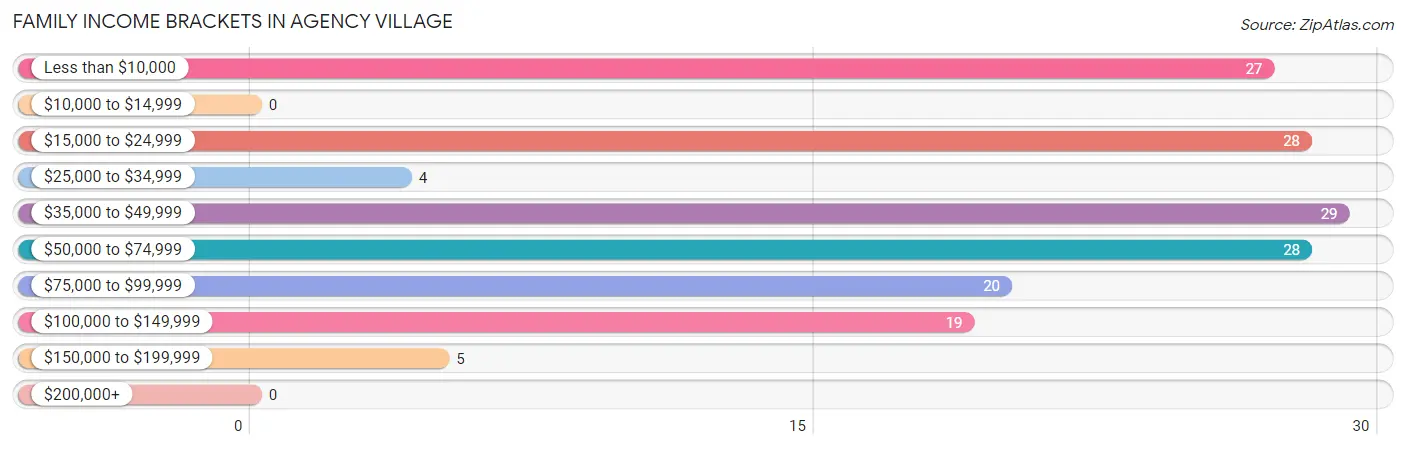
| Income Bracket | # Families | % Families |
| Less than $10,000 | 27 | 16.9% |
| $10,000 to $14,999 | 0 | 0.0% |
| $15,000 to $24,999 | 28 | 17.5% |
| $25,000 to $34,999 | 4 | 2.5% |
| $35,000 to $49,999 | 29 | 18.1% |
| $50,000 to $74,999 | 28 | 17.5% |
| $75,000 to $99,999 | 20 | 12.5% |
| $100,000 to $149,999 | 19 | 11.9% |
| $150,000 to $199,999 | 5 | 3.1% |
| $200,000+ | 0 | 0.0% |
Family Income by Famaliy Size in Agency Village
7+ person families (15 | 9.4%) account for the highest median family income in Agency Village with $88,125 per family, while 7+ person families (15 | 9.4%) have the highest median income of $12,589 per family member.
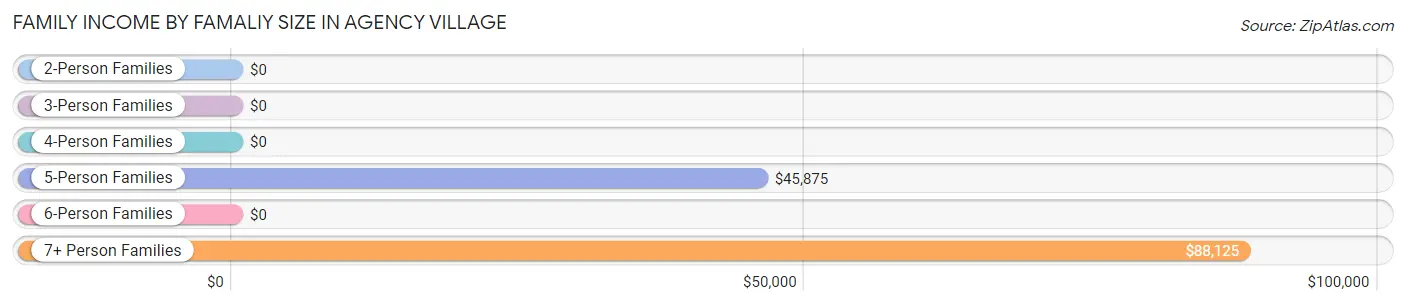
| Income Bracket | # Families | Median Income |
| 2-Person Families | 25 (15.6%) | $0 |
| 3-Person Families | 20 (12.5%) | $0 |
| 4-Person Families | 57 (35.6%) | $0 |
| 5-Person Families | 31 (19.4%) | $45,875 |
| 6-Person Families | 12 (7.5%) | $0 |
| 7+ Person Families | 15 (9.4%) | $88,125 |
| Total | 160 (100.0%) | $46,500 |
Family Income by Number of Earners in Agency Village
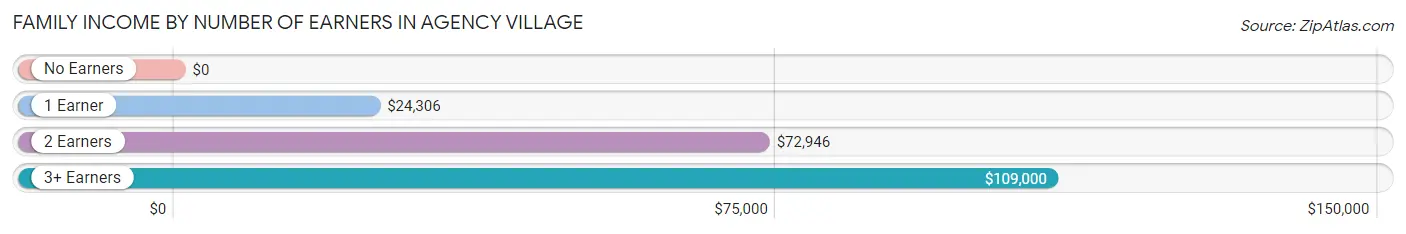
| Number of Earners | # Families | Median Income |
| No Earners | 15 (9.4%) | $0 |
| 1 Earner | 58 (36.2%) | $24,306 |
| 2 Earners | 59 (36.9%) | $72,946 |
| 3+ Earners | 28 (17.5%) | $109,000 |
| Total | 160 (100.0%) | $46,500 |
Household Income in Agency Village
Household Income Brackets in Agency Village
With 45 households falling in the category, the $50,000 to $74,999 income range is the most frequent in Agency Village, accounting for 22.1% of all households.
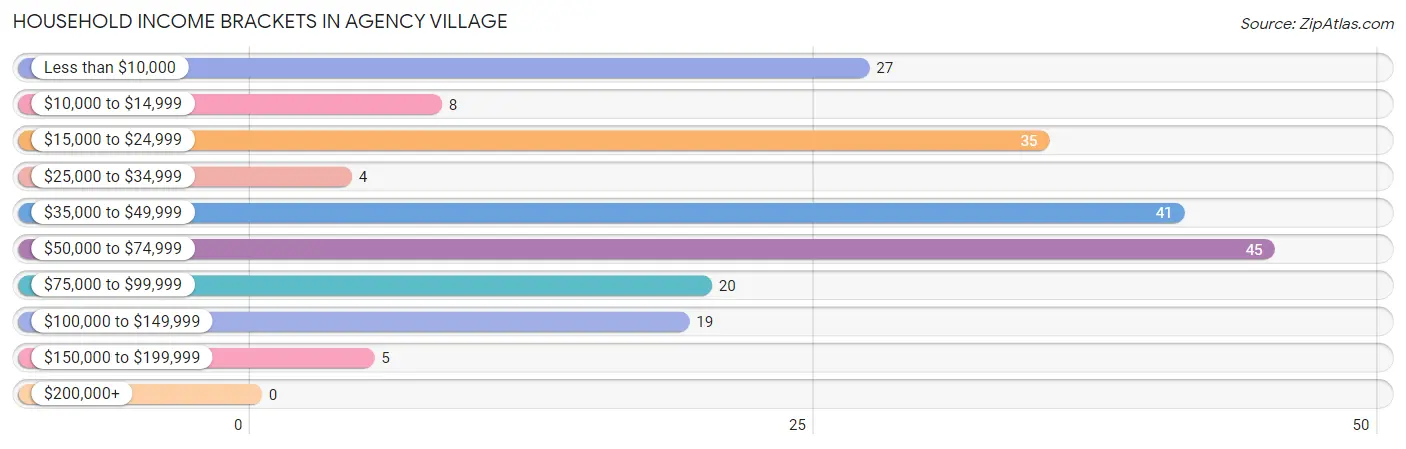
| Income Bracket | # Households | % Households |
| Less than $10,000 | 27 | 13.2% |
| $10,000 to $14,999 | 8 | 3.9% |
| $15,000 to $24,999 | 35 | 17.2% |
| $25,000 to $34,999 | 4 | 2.0% |
| $35,000 to $49,999 | 41 | 20.1% |
| $50,000 to $74,999 | 45 | 22.1% |
| $75,000 to $99,999 | 20 | 9.8% |
| $100,000 to $149,999 | 19 | 9.3% |
| $150,000 to $199,999 | 5 | 2.5% |
| $200,000+ | 0 | 0.0% |
Household Income by Householder Age in Agency Village
The median household income in Agency Village is $48,194, with the highest median household income of $49,545 found in the 45 to 64 years age bracket for the primary householder. A total of 100 households (49.0%) fall into this category.
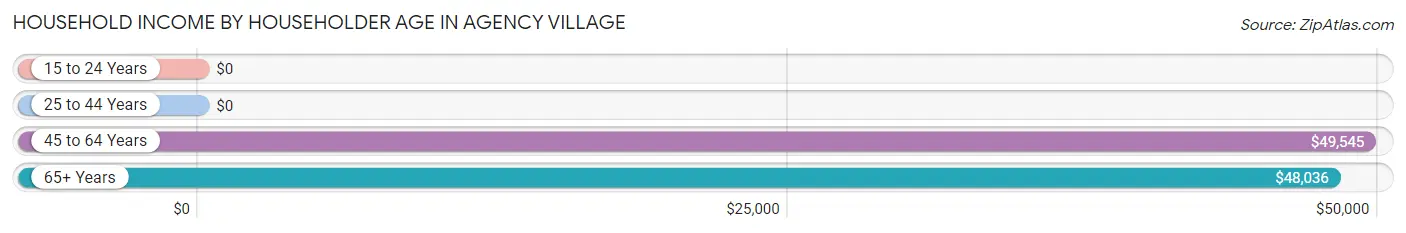
| Income Bracket | # Households | Median Income |
| 15 to 24 Years | 0 (0.0%) | $0 |
| 25 to 44 Years | 55 (27.0%) | $0 |
| 45 to 64 Years | 100 (49.0%) | $49,545 |
| 65+ Years | 49 (24.0%) | $48,036 |
| Total | 204 (100.0%) | $48,194 |
Poverty in Agency Village
Income Below Poverty by Sex and Age in Agency Village
With 23.2% poverty level for males and 27.5% for females among the residents of Agency Village, 12 to 14 year old males and 25 to 34 year old females are the most vulnerable to poverty, with 18 males (47.4%) and 43 females (66.1%) in their respective age groups living below the poverty level.
| Age Bracket | Male | Female |
| Under 5 Years | 5 (15.1%) | 0 (0.0%) |
| 5 Years | 0 (0.0%) | 0 (0.0%) |
| 6 to 11 Years | 27 (22.1%) | 15 (34.9%) |
| 12 to 14 Years | 18 (47.4%) | 0 (0.0%) |
| 15 Years | 0 (0.0%) | 5 (50.0%) |
| 16 and 17 Years | 0 (0.0%) | 2 (18.2%) |
| 18 to 24 Years | 2 (2.8%) | 5 (10.4%) |
| 25 to 34 Years | 29 (35.4%) | 43 (66.1%) |
| 35 to 44 Years | 24 (25.0%) | 11 (28.9%) |
| 45 to 54 Years | 25 (33.8%) | 13 (23.6%) |
| 55 to 64 Years | 0 (0.0%) | 0 (0.0%) |
| 65 to 74 Years | 7 (26.9%) | 4 (17.4%) |
| 75 Years and over | 0 (0.0%) | 0 (0.0%) |
| Total | 137 (23.2%) | 98 (27.5%) |
Income Above Poverty by Sex and Age in Agency Village
According to the poverty statistics in Agency Village, males aged 5 years and females aged under 5 years are the age groups that are most secure financially, with 100.0% of males and 100.0% of females in these age groups living above the poverty line.
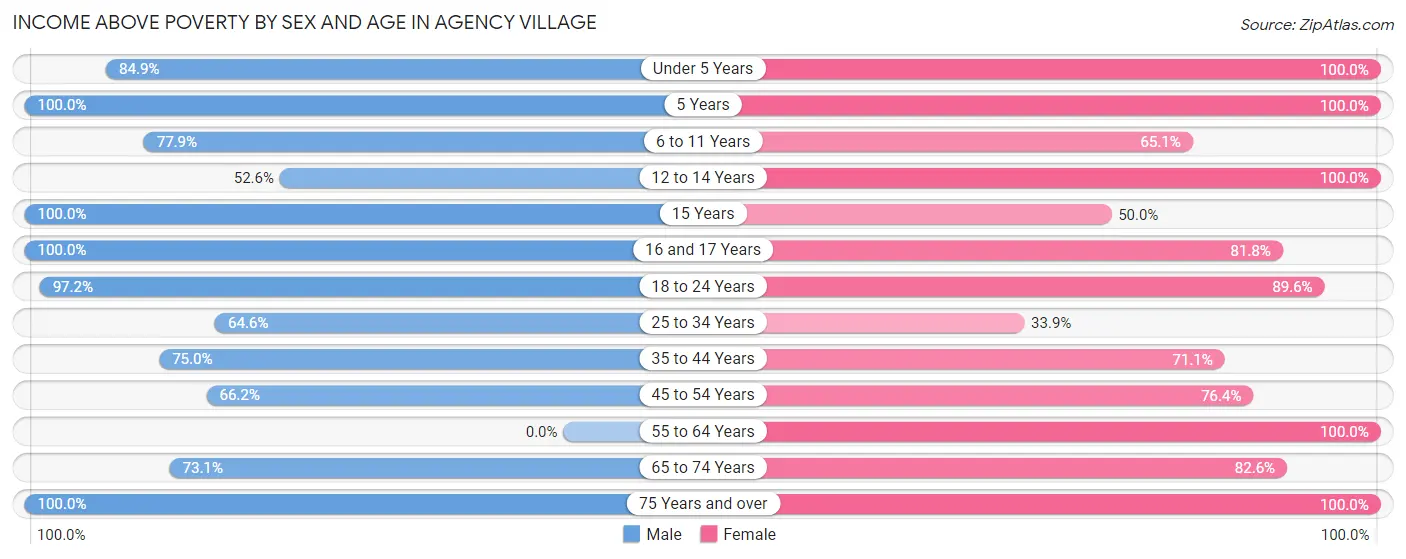
| Age Bracket | Male | Female |
| Under 5 Years | 28 (84.9%) | 2 (100.0%) |
| 5 Years | 9 (100.0%) | 11 (100.0%) |
| 6 to 11 Years | 95 (77.9%) | 28 (65.1%) |
| 12 to 14 Years | 20 (52.6%) | 23 (100.0%) |
| 15 Years | 6 (100.0%) | 5 (50.0%) |
| 16 and 17 Years | 19 (100.0%) | 9 (81.8%) |
| 18 to 24 Years | 69 (97.2%) | 43 (89.6%) |
| 25 to 34 Years | 53 (64.6%) | 22 (33.9%) |
| 35 to 44 Years | 72 (75.0%) | 27 (71.1%) |
| 45 to 54 Years | 49 (66.2%) | 42 (76.4%) |
| 55 to 64 Years | 0 (0.0%) | 20 (100.0%) |
| 65 to 74 Years | 19 (73.1%) | 19 (82.6%) |
| 75 Years and over | 15 (100.0%) | 7 (100.0%) |
| Total | 454 (76.8%) | 258 (72.5%) |
Income Below Poverty Among Married-Couple Families in Agency Village
The poverty statistics for married-couple families in Agency Village show that 10.9% or 6 of the total 55 families live below the poverty line. Families with no children have the highest poverty rate of 100.0%, comprising of 6 families. On the other hand, families with 1 or 2 children have the lowest poverty rate of 0.0%, which includes 0 families.
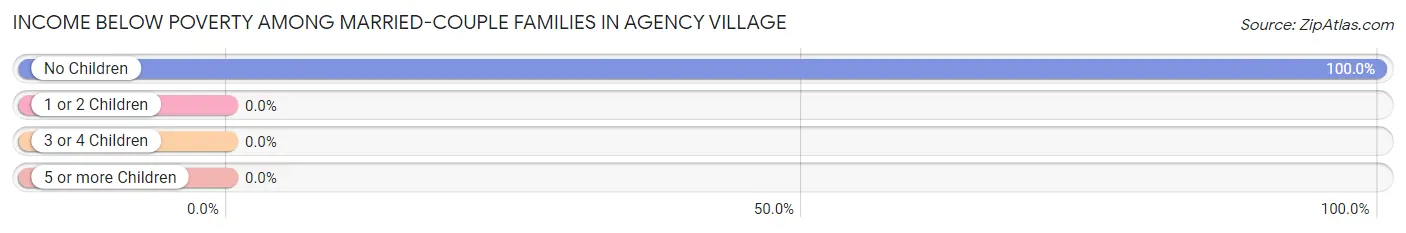
| Children | Above Poverty | Below Poverty |
| No Children | 0 (0.0%) | 6 (100.0%) |
| 1 or 2 Children | 38 (100.0%) | 0 (0.0%) |
| 3 or 4 Children | 5 (100.0%) | 0 (0.0%) |
| 5 or more Children | 6 (100.0%) | 0 (0.0%) |
| Total | 49 (89.1%) | 6 (10.9%) |
Income Below Poverty Among Single-Parent Households in Agency Village
According to the poverty data in Agency Village, 60.0% or 36 single-father households and 28.9% or 13 single-mother households are living below the poverty line. Among single-father households, those with no children have the highest poverty rate, with 12 households (100.0%) experiencing poverty. Likewise, among single-mother households, those with 1 or 2 children have the highest poverty rate, with 9 households (69.2%) falling below the poverty line.
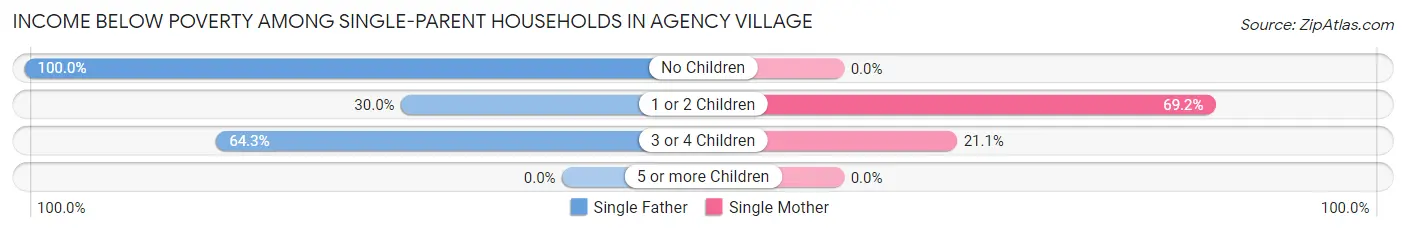
| Children | Single Father | Single Mother |
| No Children | 12 (100.0%) | 0 (0.0%) |
| 1 or 2 Children | 6 (30.0%) | 9 (69.2%) |
| 3 or 4 Children | 18 (64.3%) | 4 (21.0%) |
| 5 or more Children | 0 (0.0%) | 0 (0.0%) |
| Total | 36 (60.0%) | 13 (28.9%) |
Income Below Poverty Among Married-Couple vs Single-Parent Households in Agency Village
The poverty data for Agency Village shows that 6 of the married-couple family households (10.9%) and 49 of the single-parent households (46.7%) are living below the poverty level. Within the married-couple family households, those with no children have the highest poverty rate, with 6 households (100.0%) falling below the poverty line. Among the single-parent households, those with no children have the highest poverty rate, with 12 household (75.0%) living below poverty.
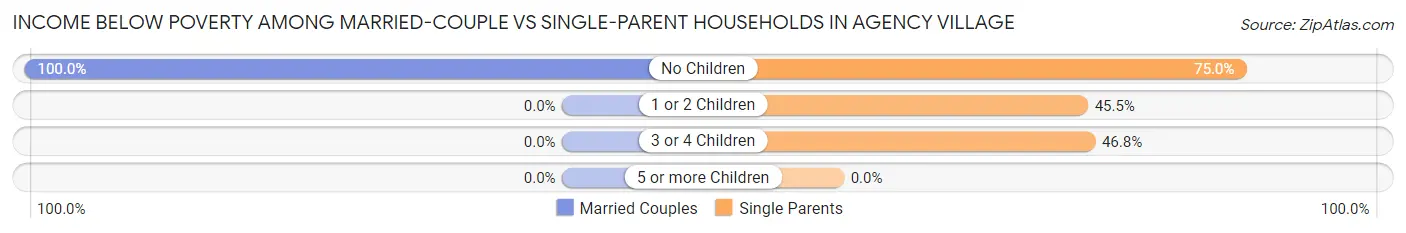
| Children | Married-Couple Families | Single-Parent Households |
| No Children | 6 (100.0%) | 12 (75.0%) |
| 1 or 2 Children | 0 (0.0%) | 15 (45.5%) |
| 3 or 4 Children | 0 (0.0%) | 22 (46.8%) |
| 5 or more Children | 0 (0.0%) | 0 (0.0%) |
| Total | 6 (10.9%) | 49 (46.7%) |
Race in Agency Village
The most populous races in Agency Village are Native / Alaskan (883 | 90.8%), Two or more Races (58 | 6.0%), and Hispanic or Latino (17 | 1.8%).
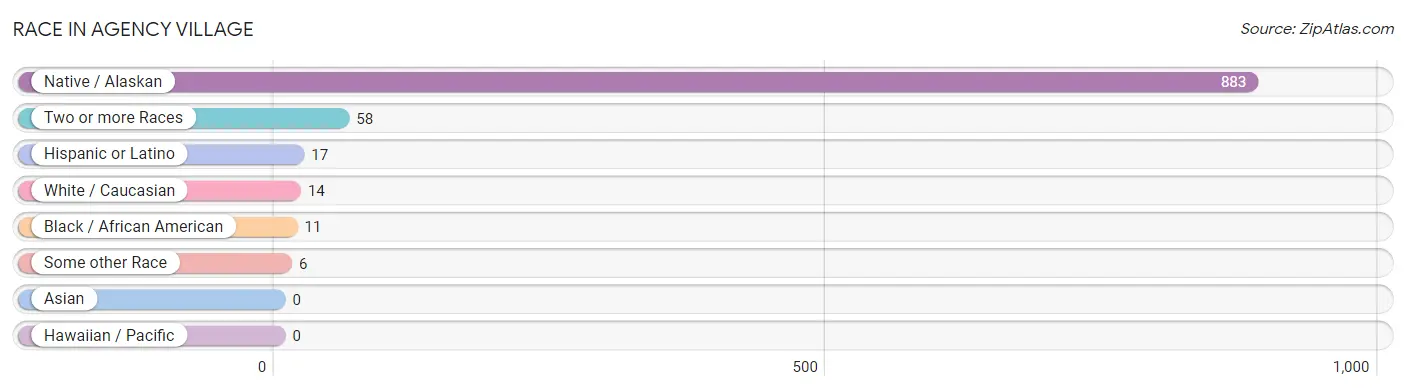
| Race | # Population | % Population |
| Asian | 0 | 0.0% |
| Black / African American | 11 | 1.1% |
| Hawaiian / Pacific | 0 | 0.0% |
| Hispanic or Latino | 17 | 1.8% |
| Native / Alaskan | 883 | 90.8% |
| White / Caucasian | 14 | 1.4% |
| Two or more Races | 58 | 6.0% |
| Some other Race | 6 | 0.6% |
| Total | 972 | 100.0% |
Ancestry in Agency Village
The most populous ancestries reported in Agency Village are Sioux (814 | 83.7%), English (36 | 3.7%), Mexican (13 | 1.3%), American (11 | 1.1%), and Central American (4 | 0.4%), together accounting for 90.3% of all Agency Village residents.
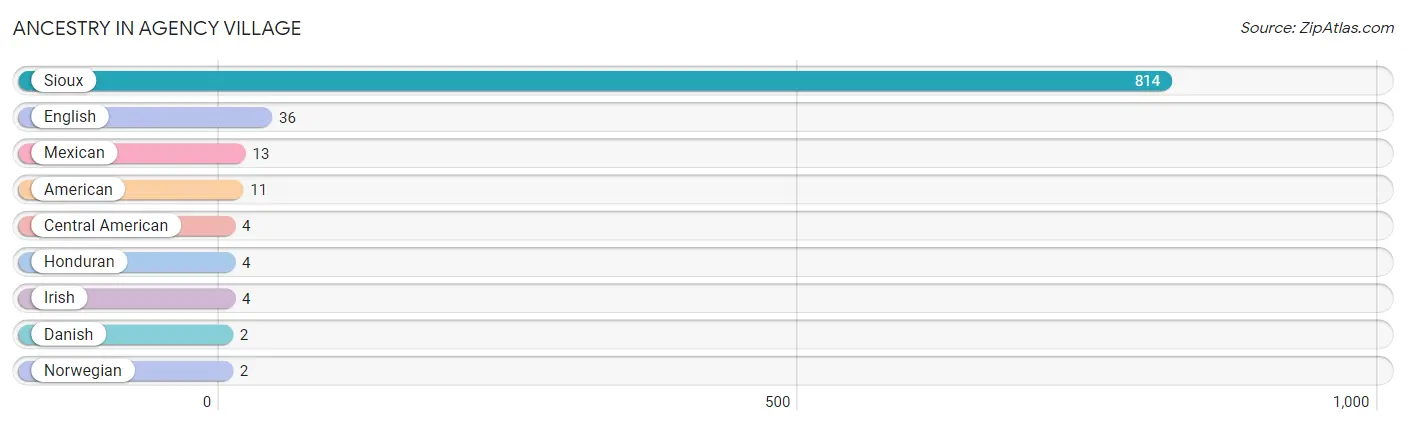
| Ancestry | # Population | % Population |
| American | 11 | 1.1% |
| Central American | 4 | 0.4% |
| Danish | 2 | 0.2% |
| English | 36 | 3.7% |
| Honduran | 4 | 0.4% |
| Irish | 4 | 0.4% |
| Mexican | 13 | 1.3% |
| Norwegian | 2 | 0.2% |
| Sioux | 814 | 83.7% | View All 9 Rows |
Immigrants in Agency Village
The most numerous immigrant groups reported in Agency Village came from Central America (4 | 0.4%), Honduras (4 | 0.4%), and Latin America (4 | 0.4%), together accounting for 1.2% of all Agency Village residents.
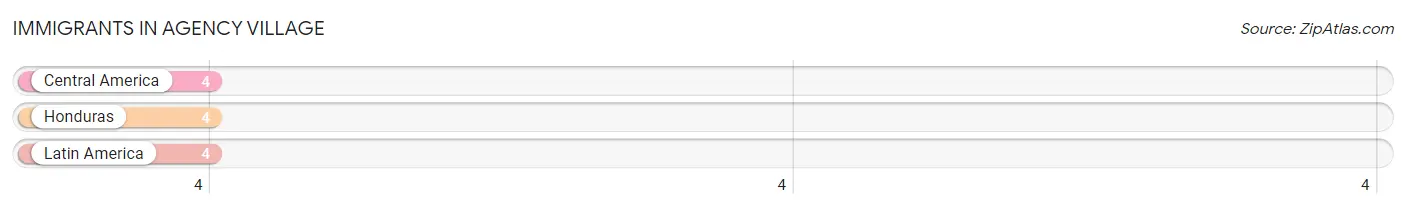
| Immigration Origin | # Population | % Population |
| Central America | 4 | 0.4% |
| Honduras | 4 | 0.4% |
| Latin America | 4 | 0.4% | View All 3 Rows |
Sex and Age in Agency Village
Sex and Age in Agency Village
The most populous age groups in Agency Village are 5 to 9 Years (103 | 17.1%) for men and 25 to 29 Years (56 | 15.2%) for women.
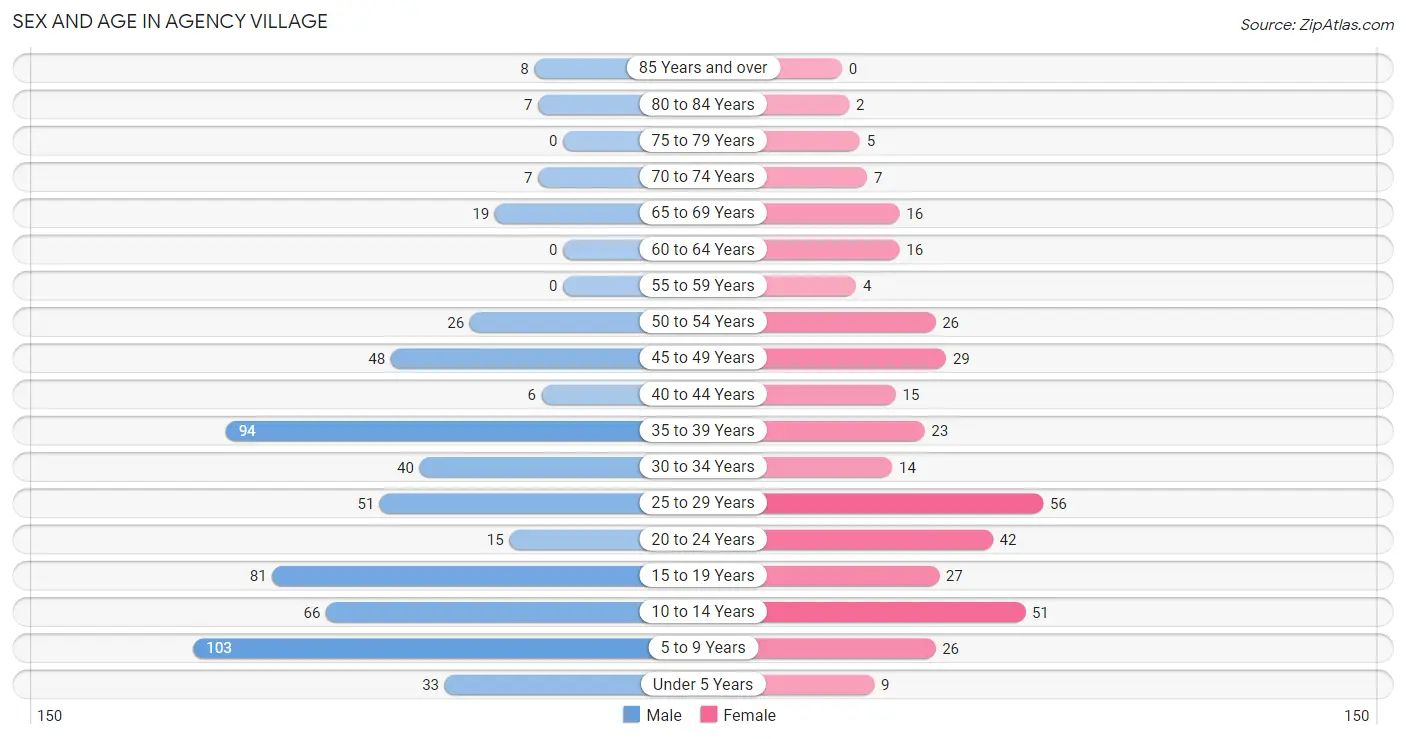
| Age Bracket | Male | Female |
| Under 5 Years | 33 (5.5%) | 9 (2.5%) |
| 5 to 9 Years | 103 (17.1%) | 26 (7.1%) |
| 10 to 14 Years | 66 (10.9%) | 51 (13.9%) |
| 15 to 19 Years | 81 (13.4%) | 27 (7.3%) |
| 20 to 24 Years | 15 (2.5%) | 42 (11.4%) |
| 25 to 29 Years | 51 (8.4%) | 56 (15.2%) |
| 30 to 34 Years | 40 (6.6%) | 14 (3.8%) |
| 35 to 39 Years | 94 (15.6%) | 23 (6.2%) |
| 40 to 44 Years | 6 (1.0%) | 15 (4.1%) |
| 45 to 49 Years | 48 (8.0%) | 29 (7.9%) |
| 50 to 54 Years | 26 (4.3%) | 26 (7.1%) |
| 55 to 59 Years | 0 (0.0%) | 4 (1.1%) |
| 60 to 64 Years | 0 (0.0%) | 16 (4.3%) |
| 65 to 69 Years | 19 (3.2%) | 16 (4.3%) |
| 70 to 74 Years | 7 (1.2%) | 7 (1.9%) |
| 75 to 79 Years | 0 (0.0%) | 5 (1.4%) |
| 80 to 84 Years | 7 (1.2%) | 2 (0.5%) |
| 85 Years and over | 8 (1.3%) | 0 (0.0%) |
| Total | 604 (100.0%) | 368 (100.0%) |
Families and Households in Agency Village
Median Family Size in Agency Village
The median family size in Agency Village is 5.14 persons per family, with single female/mother families (45 | 28.1%) accounting for the largest median family size of 7.02 persons per family. On the other hand, single male/father families (60 | 37.5%) represent the smallest median family size with 3.82 persons per family.
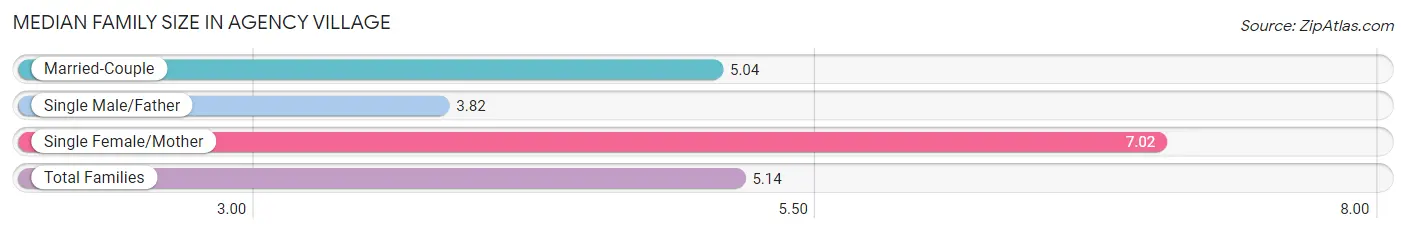
| Family Type | # Families | Family Size |
| Married-Couple | 55 (34.4%) | 5.04 |
| Single Male/Father | 60 (37.5%) | 3.82 |
| Single Female/Mother | 45 (28.1%) | 7.02 |
| Total Families | 160 (100.0%) | 5.14 |
Median Household Size in Agency Village
The median household size in Agency Village is 4.54 persons per household, with single female/mother households (45 | 22.1%) accounting for the largest median household size of 7.02 persons per household. non-family households (44 | 21.6%) represent the smallest median household size with 1.64 persons per household.
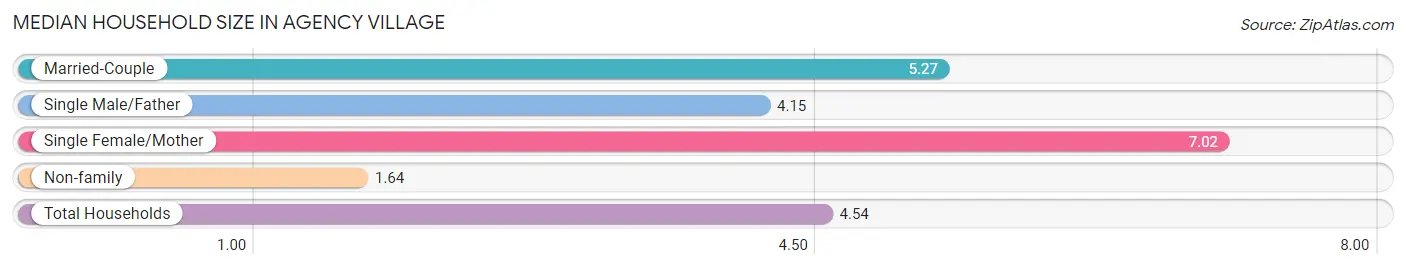
| Household Type | # Households | Household Size |
| Married-Couple | 55 (27.0%) | 5.27 |
| Single Male/Father | 60 (29.4%) | 4.15 |
| Single Female/Mother | 45 (22.1%) | 7.02 |
| Non-family | 44 (21.6%) | 1.64 |
| Total Households | 204 (100.0%) | 4.54 |
Household Size by Marriage Status in Agency Village
Out of a total of 204 households in Agency Village, 160 (78.4%) are family households, while 44 (21.6%) are nonfamily households. The most numerous type of family households are 4-person households, comprising 39, and the most common type of nonfamily households are 1-person households, comprising 23.
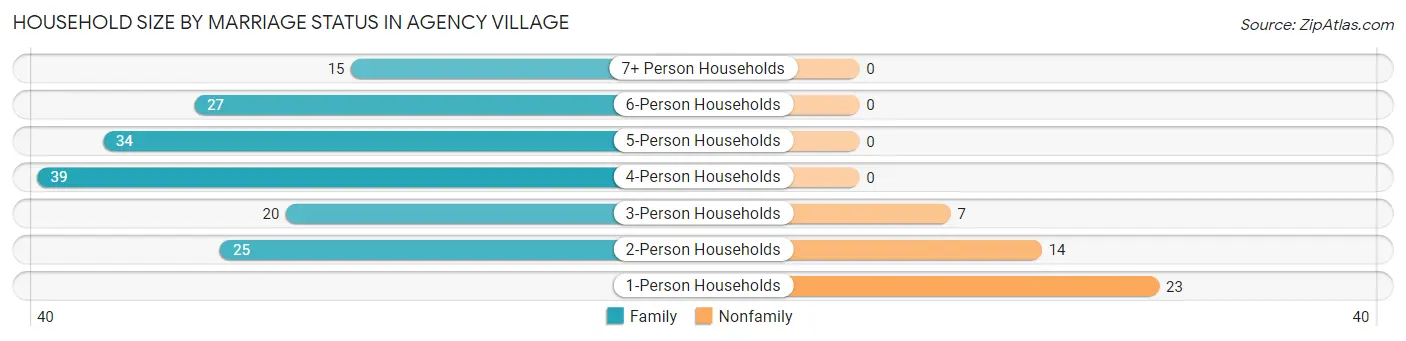
| Household Size | Family Households | Nonfamily Households |
| 1-Person Households | - | 23 (11.3%) |
| 2-Person Households | 25 (12.2%) | 14 (6.9%) |
| 3-Person Households | 20 (9.8%) | 7 (3.4%) |
| 4-Person Households | 39 (19.1%) | 0 (0.0%) |
| 5-Person Households | 34 (16.7%) | 0 (0.0%) |
| 6-Person Households | 27 (13.2%) | 0 (0.0%) |
| 7+ Person Households | 15 (7.3%) | 0 (0.0%) |
| Total | 160 (78.4%) | 44 (21.6%) |
Female Fertility in Agency Village
Fertility by Age in Agency Village
Average fertility rate in Agency Village is 23.0 births per 1,000 women. Women in the age bracket of 20 to 34 years have the highest fertility rate with 45.0 births per 1,000 women. Women in the age bracket of 20 to 34 years acount for 100.0% of all women with births.
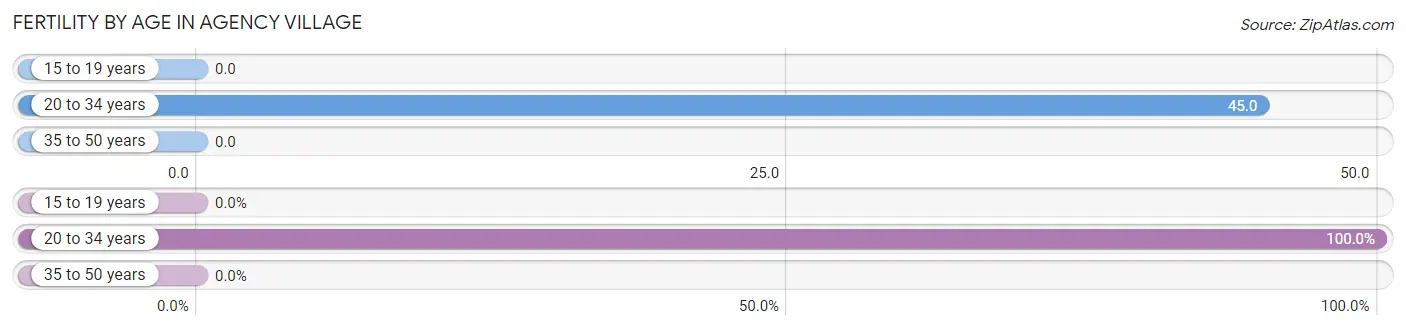
| Age Bracket | Women with Births | Births / 1,000 Women |
| 15 to 19 years | 0 (0.0%) | 0.0 |
| 20 to 34 years | 5 (100.0%) | 45.0 |
| 35 to 50 years | 0 (0.0%) | 0.0 |
| Total | 5 (100.0%) | 23.0 |
Fertility by Age by Marriage Status in Agency Village
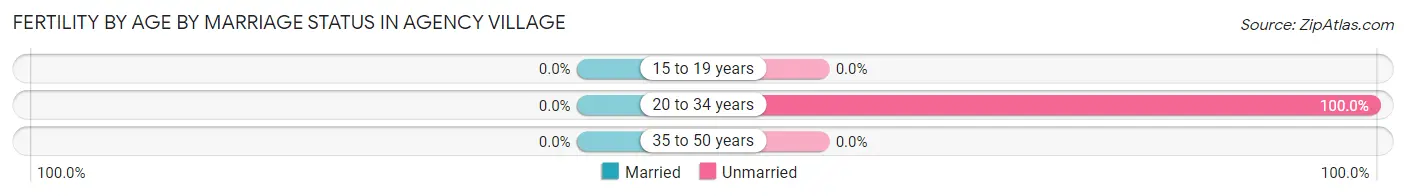
| Age Bracket | Married | Unmarried |
| 15 to 19 years | 0 (0.0%) | 0 (0.0%) |
| 20 to 34 years | 0 (0.0%) | 5 (100.0%) |
| 35 to 50 years | 0 (0.0%) | 0 (0.0%) |
| Total | 0 (0.0%) | 5 (100.0%) |
Fertility by Education in Agency Village
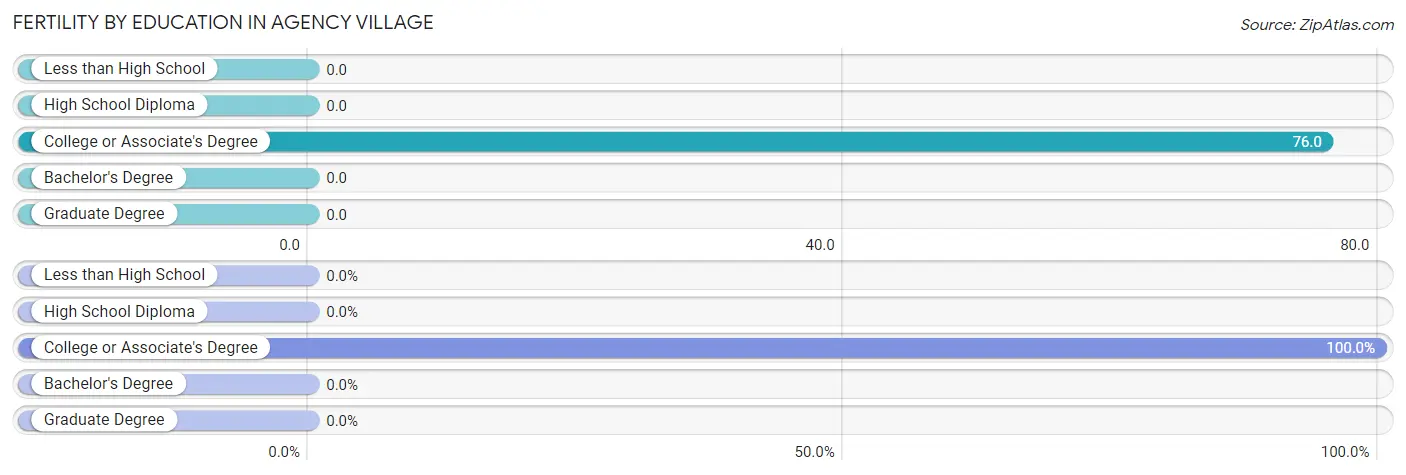
| Educational Attainment | Women with Births | Births / 1,000 Women |
| Less than High School | 0 (0.0%) | 0.0 |
| High School Diploma | 0 (0.0%) | 0.0 |
| College or Associate's Degree | 5 (100.0%) | 76.0 |
| Bachelor's Degree | 0 (0.0%) | 0.0 |
| Graduate Degree | 0 (0.0%) | 0.0 |
| Total | 5 (100.0%) | 23.0 |
Fertility by Education by Marriage Status in Agency Village
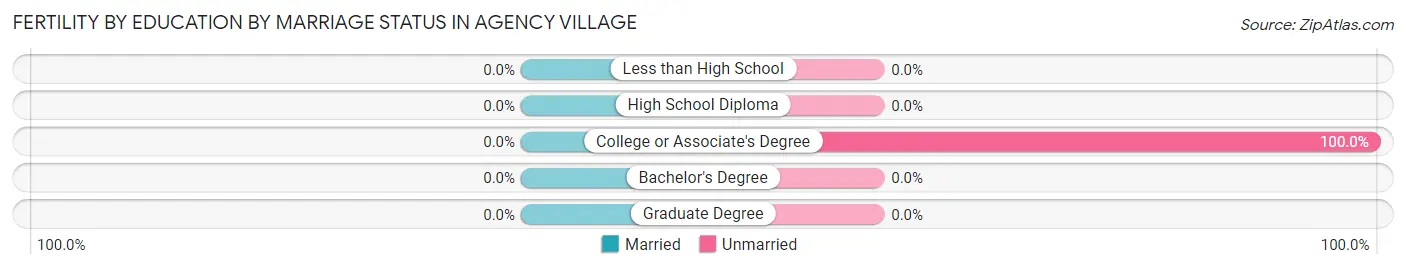
| Educational Attainment | Married | Unmarried |
| Less than High School | 0 (0.0%) | 0 (0.0%) |
| High School Diploma | 0 (0.0%) | 0 (0.0%) |
| College or Associate's Degree | 0 (0.0%) | 5 (100.0%) |
| Bachelor's Degree | 0 (0.0%) | 0 (0.0%) |
| Graduate Degree | 0 (0.0%) | 0 (0.0%) |
| Total | 0 (0.0%) | 5 (100.0%) |
Employment Characteristics in Agency Village
Employment by Class of Employer in Agency Village
Among the 352 employed individuals in Agency Village, private company employees (173 | 49.1%), local government employees (138 | 39.2%), and not-for-profit organizations (32 | 9.1%) make up the most common classes of employment.
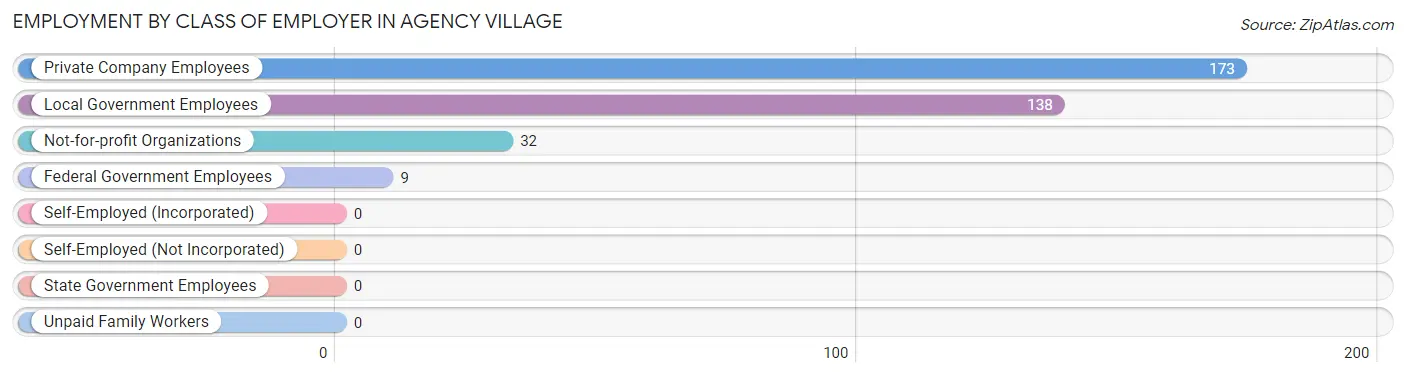
| Employer Class | # Employees | % Employees |
| Private Company Employees | 173 | 49.1% |
| Self-Employed (Incorporated) | 0 | 0.0% |
| Self-Employed (Not Incorporated) | 0 | 0.0% |
| Not-for-profit Organizations | 32 | 9.1% |
| Local Government Employees | 138 | 39.2% |
| State Government Employees | 0 | 0.0% |
| Federal Government Employees | 9 | 2.6% |
| Unpaid Family Workers | 0 | 0.0% |
| Total | 352 | 100.0% |
Employment Status by Age in Agency Village
According to the labor force statistics for Agency Village, out of the total population over 16 years of age (668), 59.0% or 394 individuals are in the labor force, with 6.3% or 25 of them unemployed. The age group with the highest labor force participation rate is 55 to 59 years, with 100.0% or 4 individuals in the labor force. Within the labor force, the 60 to 64 years age range has the highest percentage of unemployed individuals, with 43.8% or 7 of them being unemployed.
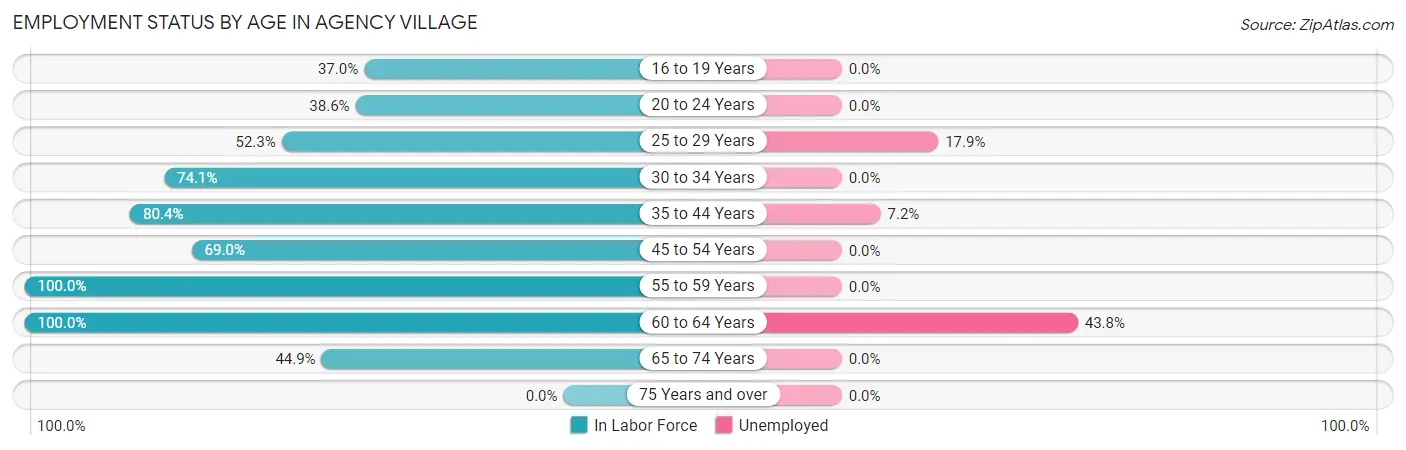
| Age Bracket | In Labor Force | Unemployed |
| 16 to 19 Years | 34 (37.0%) | 0 (0.0%) |
| 20 to 24 Years | 22 (38.6%) | 0 (0.0%) |
| 25 to 29 Years | 56 (52.3%) | 10 (17.9%) |
| 30 to 34 Years | 40 (74.1%) | 0 (0.0%) |
| 35 to 44 Years | 111 (80.4%) | 8 (7.2%) |
| 45 to 54 Years | 89 (69.0%) | 0 (0.0%) |
| 55 to 59 Years | 4 (100.0%) | 0 (0.0%) |
| 60 to 64 Years | 16 (100.0%) | 7 (43.8%) |
| 65 to 74 Years | 22 (44.9%) | 0 (0.0%) |
| 75 Years and over | 0 (0.0%) | 0 (0.0%) |
| Total | 394 (59.0%) | 25 (6.3%) |
Employment Status by Educational Attainment in Agency Village
According to labor force statistics for Agency Village, 70.5% of individuals (316) out of the total population between 25 and 64 years of age (448) are in the labor force, with 7.9% or 25 of them being unemployed. The group with the highest labor force participation rate are those with the educational attainment of bachelor's degree or higher, with 100.0% or 13 individuals in the labor force. Within the labor force, individuals with less than high school education have the highest percentage of unemployment, with 62.5% or 10 of them being unemployed.
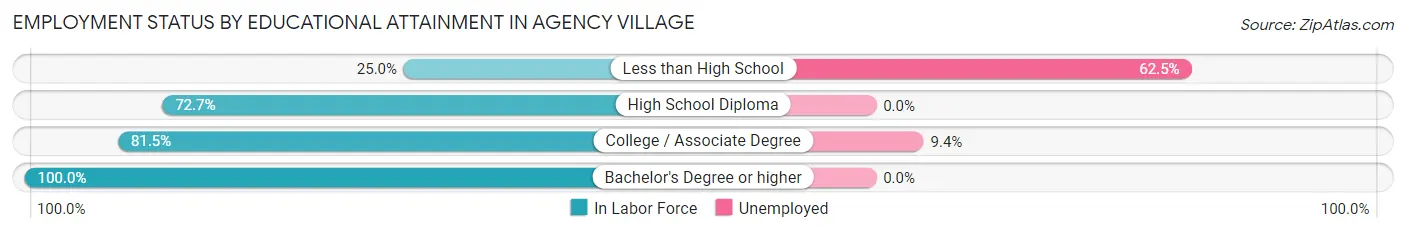
| Educational Attainment | In Labor Force | Unemployed |
| Less than High School | 16 (25.0%) | 40 (62.5%) |
| High School Diploma | 128 (72.7%) | 0 (0.0%) |
| College / Associate Degree | 159 (81.5%) | 18 (9.4%) |
| Bachelor's Degree or higher | 13 (100.0%) | 0 (0.0%) |
| Total | 316 (70.5%) | 35 (7.9%) |
Employment Occupations by Sex in Agency Village
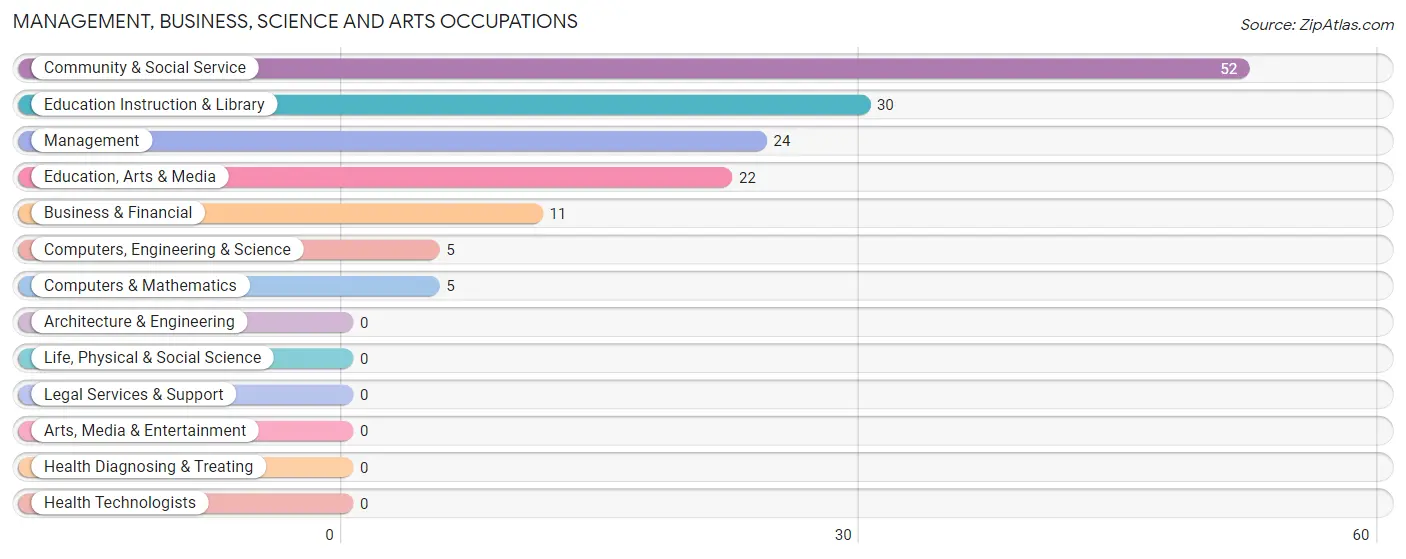
Management, Business, Science and Arts Occupations
The most common Management, Business, Science and Arts occupations in Agency Village are Community & Social Service (52 | 14.1%), Education Instruction & Library (30 | 8.1%), Management (24 | 6.5%), Education, Arts & Media (22 | 6.0%), and Business & Financial (11 | 3.0%).
Management, Business, Science and Arts Occupations by Sex
Within the Management, Business, Science and Arts occupations in Agency Village, the most male-oriented occupations are Computers, Engineering & Science (100.0%), Computers & Mathematics (100.0%), and Education Instruction & Library (83.3%), while the most female-oriented occupations are Management (70.8%), Education, Arts & Media (63.6%), and Community & Social Service (36.5%).
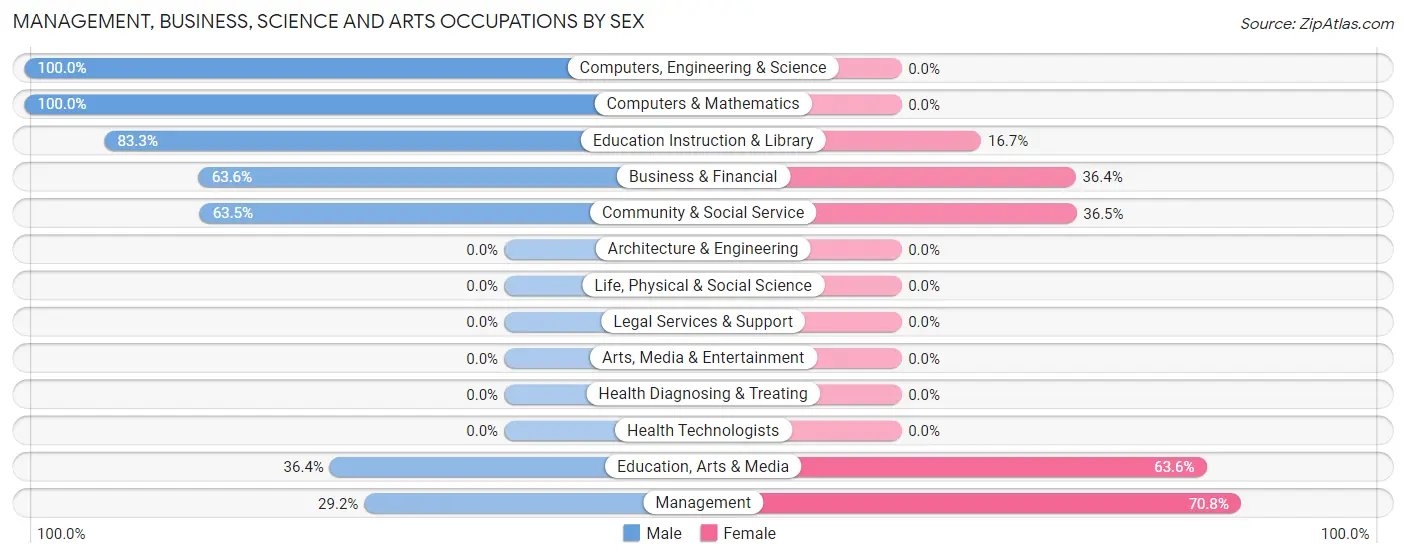
| Occupation | Male | Female |
| Management | 7 (29.2%) | 17 (70.8%) |
| Business & Financial | 7 (63.6%) | 4 (36.4%) |
| Computers, Engineering & Science | 5 (100.0%) | 0 (0.0%) |
| Computers & Mathematics | 5 (100.0%) | 0 (0.0%) |
| Architecture & Engineering | 0 (0.0%) | 0 (0.0%) |
| Life, Physical & Social Science | 0 (0.0%) | 0 (0.0%) |
| Community & Social Service | 33 (63.5%) | 19 (36.5%) |
| Education, Arts & Media | 8 (36.4%) | 14 (63.6%) |
| Legal Services & Support | 0 (0.0%) | 0 (0.0%) |
| Education Instruction & Library | 25 (83.3%) | 5 (16.7%) |
| Arts, Media & Entertainment | 0 (0.0%) | 0 (0.0%) |
| Health Diagnosing & Treating | 0 (0.0%) | 0 (0.0%) |
| Health Technologists | 0 (0.0%) | 0 (0.0%) |
| Total (Category) | 52 (56.5%) | 40 (43.5%) |
| Total (Overall) | 238 (64.5%) | 131 (35.5%) |
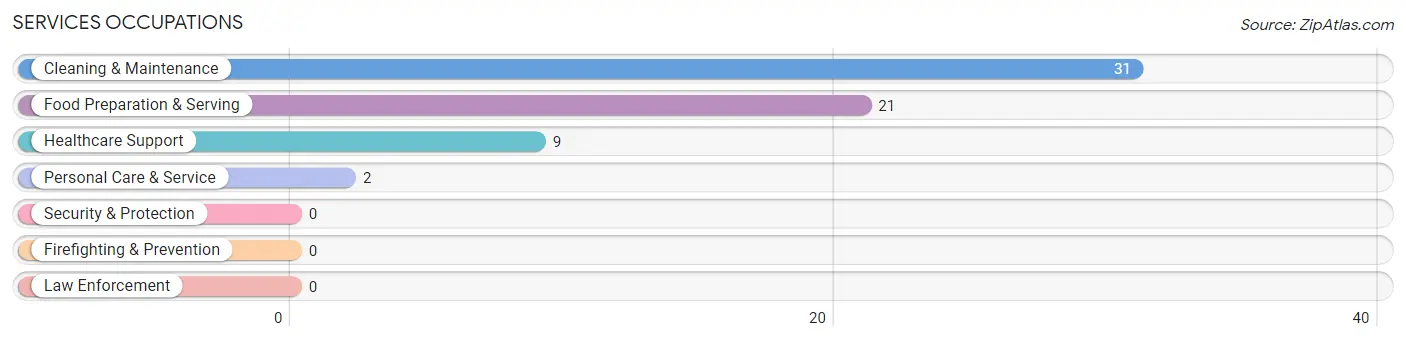
Services Occupations
The most common Services occupations in Agency Village are Cleaning & Maintenance (31 | 8.4%), Food Preparation & Serving (21 | 5.7%), Healthcare Support (9 | 2.4%), and Personal Care & Service (2 | 0.5%).
Services Occupations by Sex
Within the Services occupations in Agency Village, the most male-oriented occupations are Cleaning & Maintenance (100.0%), Personal Care & Service (100.0%), and Food Preparation & Serving (61.9%), while the most female-oriented occupations are Healthcare Support (100.0%), and Food Preparation & Serving (38.1%).
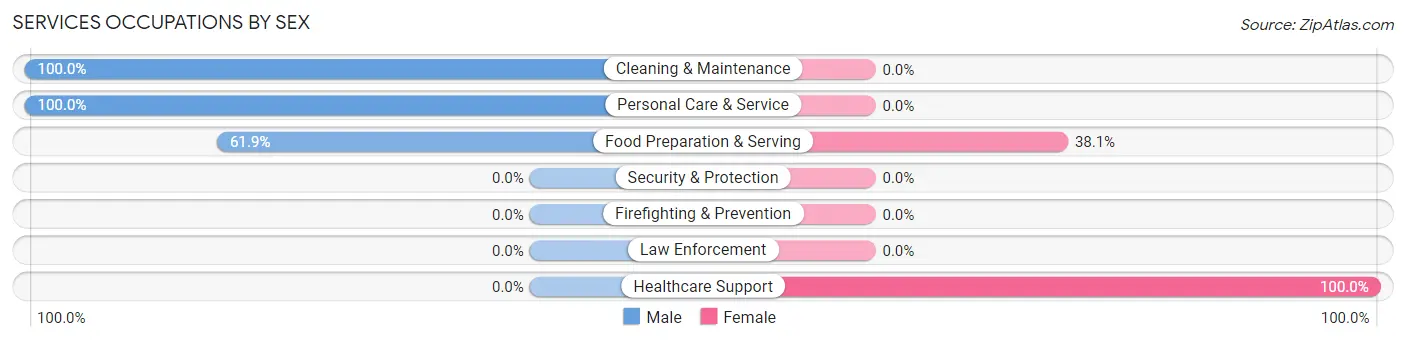
| Occupation | Male | Female |
| Healthcare Support | 0 (0.0%) | 9 (100.0%) |
| Security & Protection | 0 (0.0%) | 0 (0.0%) |
| Firefighting & Prevention | 0 (0.0%) | 0 (0.0%) |
| Law Enforcement | 0 (0.0%) | 0 (0.0%) |
| Food Preparation & Serving | 13 (61.9%) | 8 (38.1%) |
| Cleaning & Maintenance | 31 (100.0%) | 0 (0.0%) |
| Personal Care & Service | 2 (100.0%) | 0 (0.0%) |
| Total (Category) | 46 (73.0%) | 17 (27.0%) |
| Total (Overall) | 238 (64.5%) | 131 (35.5%) |
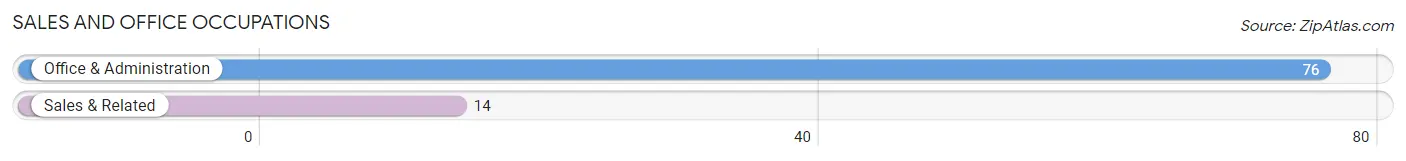
Sales and Office Occupations
The most common Sales and Office occupations in Agency Village are Office & Administration (76 | 20.6%), and Sales & Related (14 | 3.8%).
Sales and Office Occupations by Sex
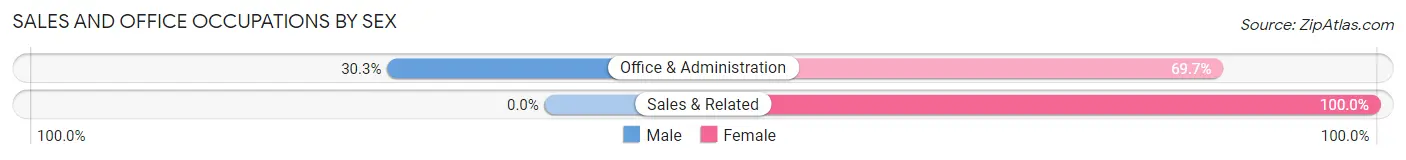
| Occupation | Male | Female |
| Sales & Related | 0 (0.0%) | 14 (100.0%) |
| Office & Administration | 23 (30.3%) | 53 (69.7%) |
| Total (Category) | 23 (25.6%) | 67 (74.4%) |
| Total (Overall) | 238 (64.5%) | 131 (35.5%) |
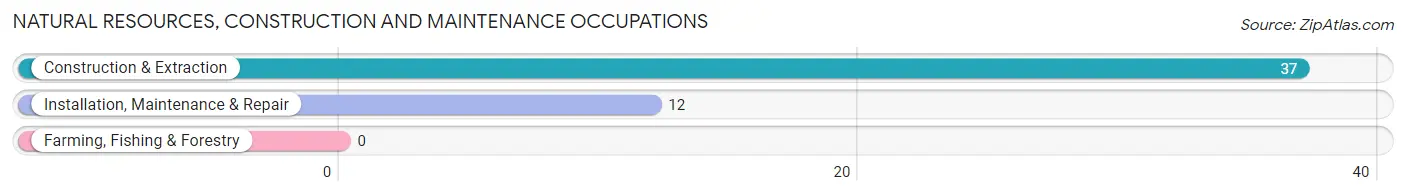
Natural Resources, Construction and Maintenance Occupations
The most common Natural Resources, Construction and Maintenance occupations in Agency Village are Construction & Extraction (37 | 10.0%), and Installation, Maintenance & Repair (12 | 3.3%).
Natural Resources, Construction and Maintenance Occupations by Sex
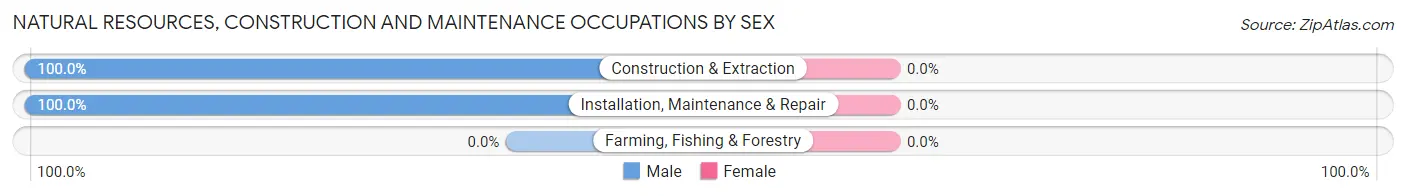
| Occupation | Male | Female |
| Farming, Fishing & Forestry | 0 (0.0%) | 0 (0.0%) |
| Construction & Extraction | 37 (100.0%) | 0 (0.0%) |
| Installation, Maintenance & Repair | 12 (100.0%) | 0 (0.0%) |
| Total (Category) | 49 (100.0%) | 0 (0.0%) |
| Total (Overall) | 238 (64.5%) | 131 (35.5%) |
Production, Transportation and Moving Occupations
The most common Production, Transportation and Moving occupations in Agency Village are Production (57 | 15.4%), Material Moving (12 | 3.3%), and Transportation (6 | 1.6%).
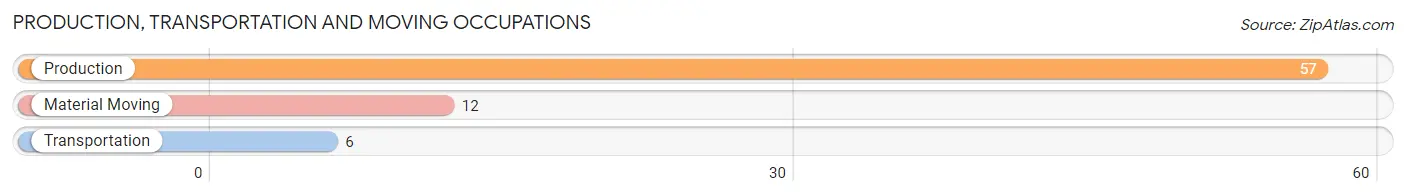
Production, Transportation and Moving Occupations by Sex
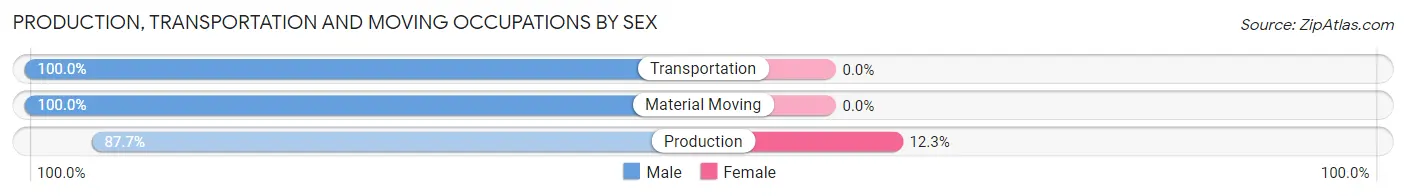
| Occupation | Male | Female |
| Production | 50 (87.7%) | 7 (12.3%) |
| Transportation | 6 (100.0%) | 0 (0.0%) |
| Material Moving | 12 (100.0%) | 0 (0.0%) |
| Total (Category) | 68 (90.7%) | 7 (9.3%) |
| Total (Overall) | 238 (64.5%) | 131 (35.5%) |
Employment Industries by Sex in Agency Village
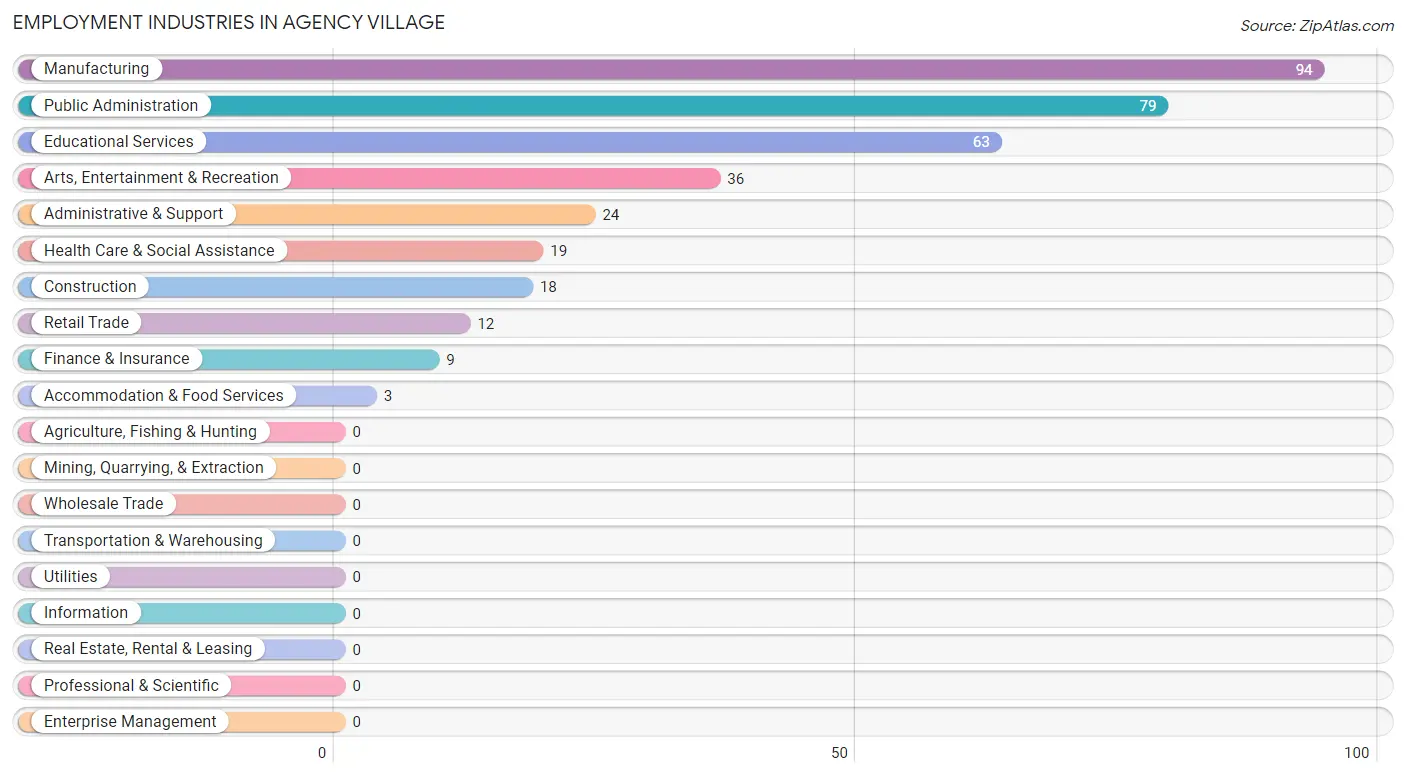
Employment Industries in Agency Village
The major employment industries in Agency Village include Manufacturing (94 | 25.5%), Public Administration (79 | 21.4%), Educational Services (63 | 17.1%), Arts, Entertainment & Recreation (36 | 9.8%), and Administrative & Support (24 | 6.5%).
Employment Industries by Sex in Agency Village
The Agency Village industries that see more men than women are Construction (100.0%), Administrative & Support (100.0%), and Manufacturing (92.5%), whereas the industries that tend to have a higher number of women are Retail Trade (100.0%), Finance & Insurance (100.0%), and Health Care & Social Assistance (100.0%).
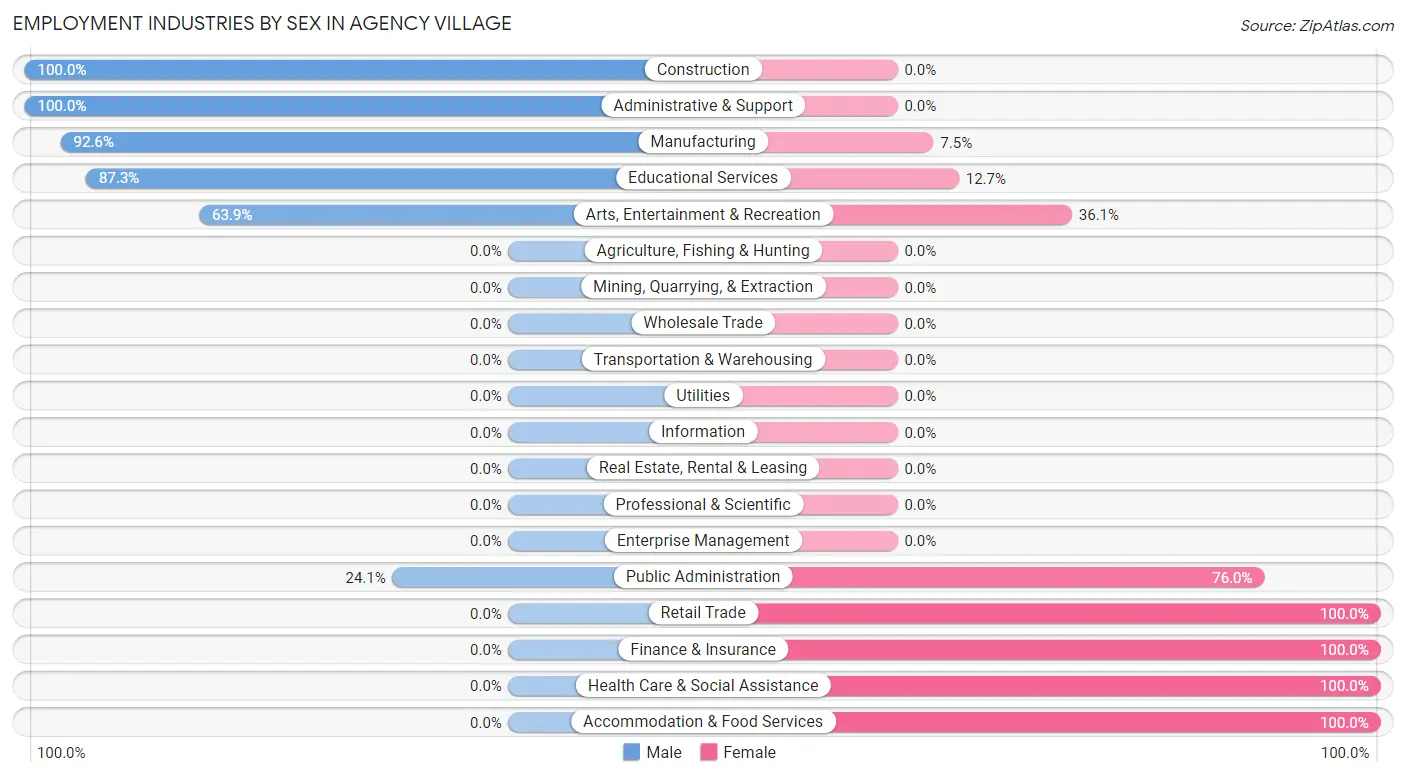
| Industry | Male | Female |
| Agriculture, Fishing & Hunting | 0 (0.0%) | 0 (0.0%) |
| Mining, Quarrying, & Extraction | 0 (0.0%) | 0 (0.0%) |
| Construction | 18 (100.0%) | 0 (0.0%) |
| Manufacturing | 87 (92.5%) | 7 (7.4%) |
| Wholesale Trade | 0 (0.0%) | 0 (0.0%) |
| Retail Trade | 0 (0.0%) | 12 (100.0%) |
| Transportation & Warehousing | 0 (0.0%) | 0 (0.0%) |
| Utilities | 0 (0.0%) | 0 (0.0%) |
| Information | 0 (0.0%) | 0 (0.0%) |
| Finance & Insurance | 0 (0.0%) | 9 (100.0%) |
| Real Estate, Rental & Leasing | 0 (0.0%) | 0 (0.0%) |
| Professional & Scientific | 0 (0.0%) | 0 (0.0%) |
| Enterprise Management | 0 (0.0%) | 0 (0.0%) |
| Administrative & Support | 24 (100.0%) | 0 (0.0%) |
| Educational Services | 55 (87.3%) | 8 (12.7%) |
| Health Care & Social Assistance | 0 (0.0%) | 19 (100.0%) |
| Arts, Entertainment & Recreation | 23 (63.9%) | 13 (36.1%) |
| Accommodation & Food Services | 0 (0.0%) | 3 (100.0%) |
| Public Administration | 19 (24.0%) | 60 (75.9%) |
| Total | 238 (64.5%) | 131 (35.5%) |
Education in Agency Village
School Enrollment in Agency Village
The most common levels of schooling among the 399 students in Agency Village are high school (113 | 28.3%), elementary school (108 | 27.1%), and middle school (99 | 24.8%).
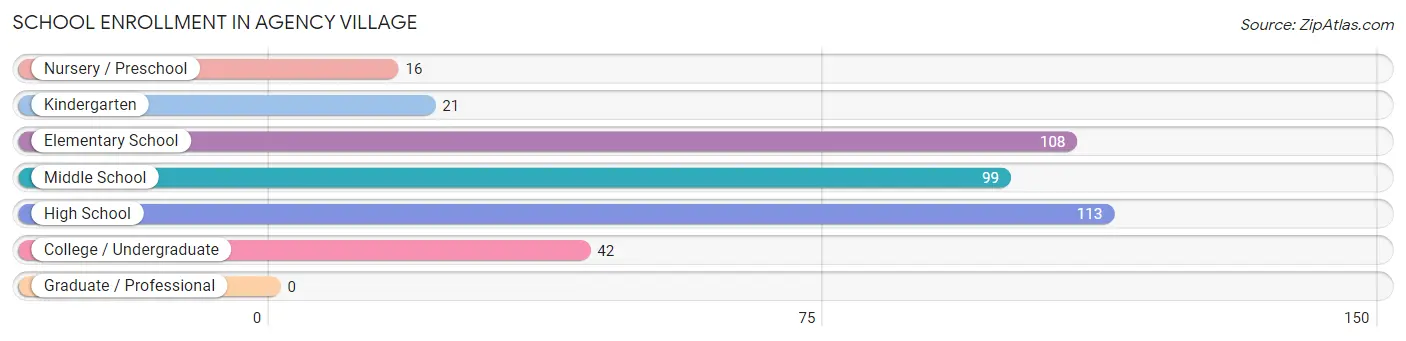
| School Level | # Students | % Students |
| Nursery / Preschool | 16 | 4.0% |
| Kindergarten | 21 | 5.3% |
| Elementary School | 108 | 27.1% |
| Middle School | 99 | 24.8% |
| High School | 113 | 28.3% |
| College / Undergraduate | 42 | 10.5% |
| Graduate / Professional | 0 | 0.0% |
| Total | 399 | 100.0% |
School Enrollment by Age by Funding Source in Agency Village
Out of a total of 399 students who are enrolled in schools in Agency Village, 9 (2.3%) attend a private institution, while the remaining 390 (97.7%) are enrolled in public schools. The age group of 20 to 24 year olds has the highest likelihood of being enrolled in private schools, with 9 (100.0% in the age bracket) enrolled. Conversely, the age group of 3 to 4 year olds has the lowest likelihood of being enrolled in a private school, with 7 (100.0% in the age bracket) attending a public institution.
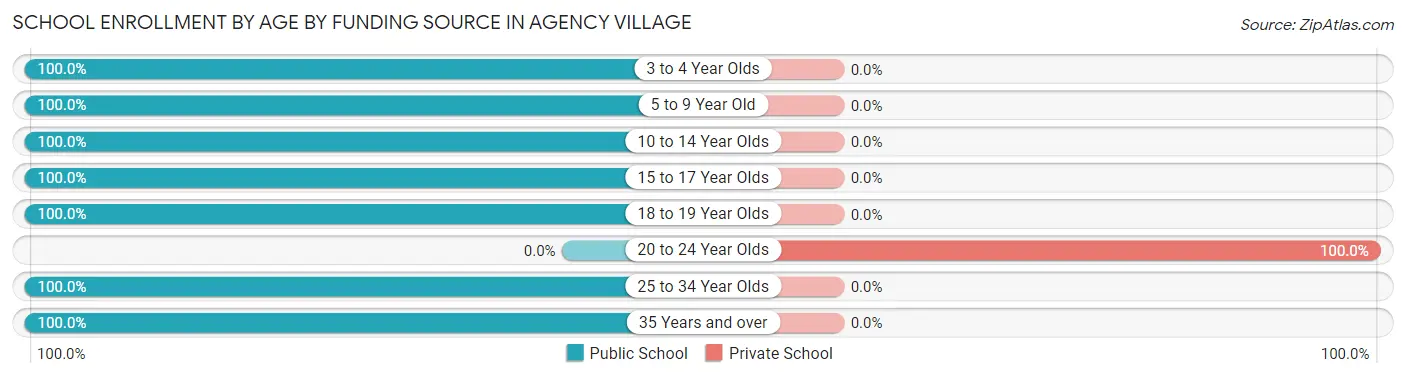
| Age Bracket | Public School | Private School |
| 3 to 4 Year Olds | 7 (100.0%) | 0 (0.0%) |
| 5 to 9 Year Old | 129 (100.0%) | 0 (0.0%) |
| 10 to 14 Year Olds | 113 (100.0%) | 0 (0.0%) |
| 15 to 17 Year Olds | 46 (100.0%) | 0 (0.0%) |
| 18 to 19 Year Olds | 62 (100.0%) | 0 (0.0%) |
| 20 to 24 Year Olds | 0 (0.0%) | 9 (100.0%) |
| 25 to 34 Year Olds | 18 (100.0%) | 0 (0.0%) |
| 35 Years and over | 15 (100.0%) | 0 (0.0%) |
| Total | 390 (97.7%) | 9 (2.3%) |
Educational Attainment by Field of Study in Agency Village
Liberal arts & history (14 | 51.8%), business (7 | 25.9%), and arts & humanities (6 | 22.2%) are the most common fields of study among 27 individuals in Agency Village who have obtained a bachelor's degree or higher.
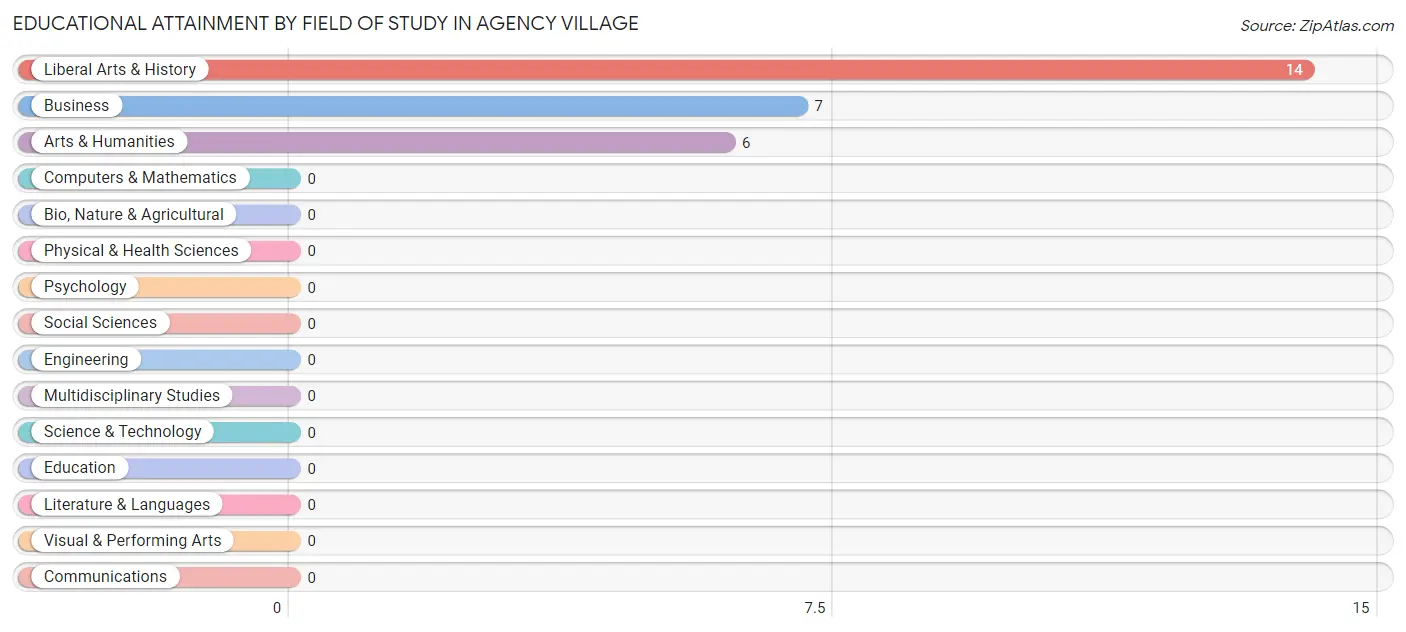
| Field of Study | # Graduates | % Graduates |
| Computers & Mathematics | 0 | 0.0% |
| Bio, Nature & Agricultural | 0 | 0.0% |
| Physical & Health Sciences | 0 | 0.0% |
| Psychology | 0 | 0.0% |
| Social Sciences | 0 | 0.0% |
| Engineering | 0 | 0.0% |
| Multidisciplinary Studies | 0 | 0.0% |
| Science & Technology | 0 | 0.0% |
| Business | 7 | 25.9% |
| Education | 0 | 0.0% |
| Literature & Languages | 0 | 0.0% |
| Liberal Arts & History | 14 | 51.8% |
| Visual & Performing Arts | 0 | 0.0% |
| Communications | 0 | 0.0% |
| Arts & Humanities | 6 | 22.2% |
| Total | 27 | 100.0% |
Transportation & Commute in Agency Village
Vehicle Availability by Sex in Agency Village
The most prevalent vehicle ownership categories in Agency Village are males with 2 vehicles (113, accounting for 51.4%) and females with 2 vehicles (31, making up 88.3%).
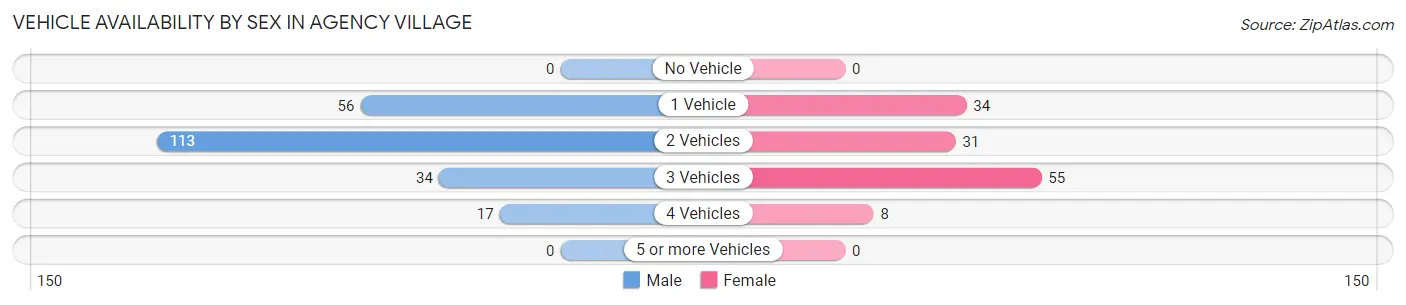
| Vehicles Available | Male | Female |
| No Vehicle | 0 (0.0%) | 0 (0.0%) |
| 1 Vehicle | 56 (25.5%) | 34 (26.6%) |
| 2 Vehicles | 113 (51.4%) | 31 (24.2%) |
| 3 Vehicles | 34 (15.4%) | 55 (43.0%) |
| 4 Vehicles | 17 (7.7%) | 8 (6.2%) |
| 5 or more Vehicles | 0 (0.0%) | 0 (0.0%) |
| Total | 220 (100.0%) | 128 (100.0%) |
Commute Time in Agency Village
The most frequently occuring commute durations in Agency Village are 5 to 9 minutes (111 commuters, 32.4%), 15 to 19 minutes (76 commuters, 22.2%), and 10 to 14 minutes (52 commuters, 15.2%).
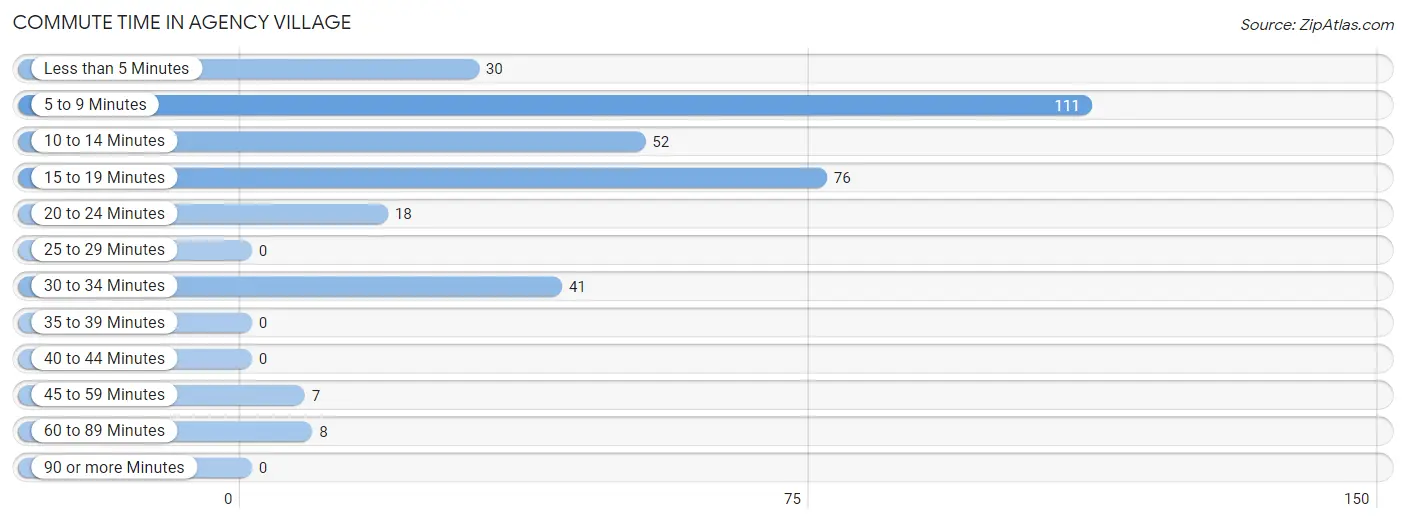
| Commute Time | # Commuters | % Commuters |
| Less than 5 Minutes | 30 | 8.7% |
| 5 to 9 Minutes | 111 | 32.4% |
| 10 to 14 Minutes | 52 | 15.2% |
| 15 to 19 Minutes | 76 | 22.2% |
| 20 to 24 Minutes | 18 | 5.2% |
| 25 to 29 Minutes | 0 | 0.0% |
| 30 to 34 Minutes | 41 | 11.9% |
| 35 to 39 Minutes | 0 | 0.0% |
| 40 to 44 Minutes | 0 | 0.0% |
| 45 to 59 Minutes | 7 | 2.0% |
| 60 to 89 Minutes | 8 | 2.3% |
| 90 or more Minutes | 0 | 0.0% |
Commute Time by Sex in Agency Village
The most common commute times in Agency Village are 5 to 9 minutes (66 commuters, 29.7%) for males and 5 to 9 minutes (45 commuters, 37.2%) for females.
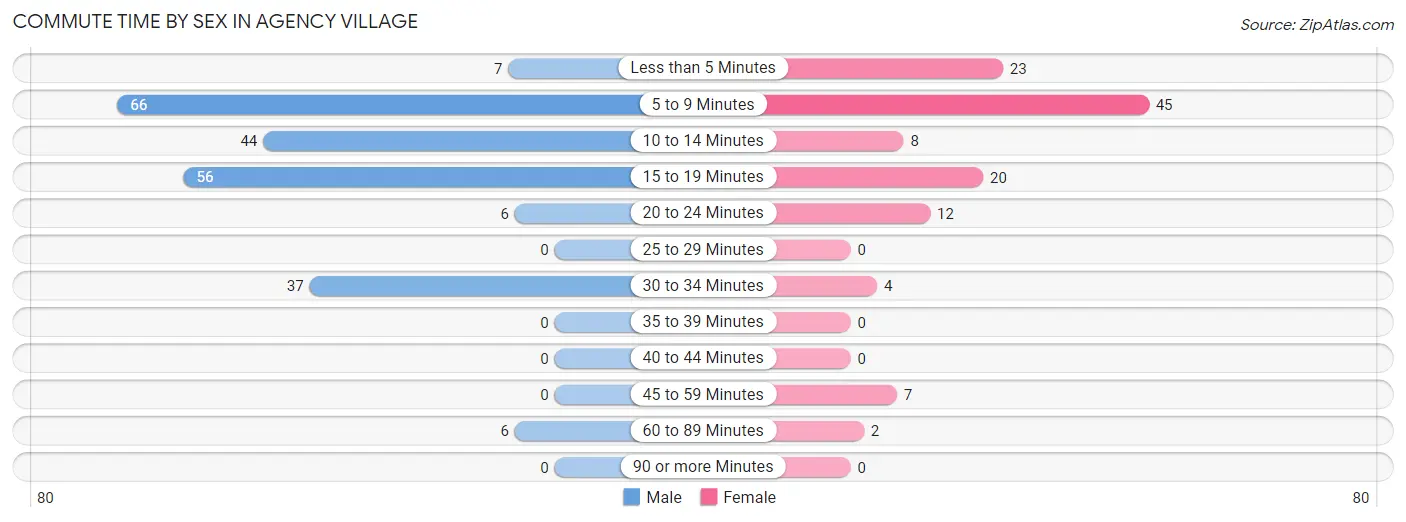
| Commute Time | Male | Female |
| Less than 5 Minutes | 7 (3.2%) | 23 (19.0%) |
| 5 to 9 Minutes | 66 (29.7%) | 45 (37.2%) |
| 10 to 14 Minutes | 44 (19.8%) | 8 (6.6%) |
| 15 to 19 Minutes | 56 (25.2%) | 20 (16.5%) |
| 20 to 24 Minutes | 6 (2.7%) | 12 (9.9%) |
| 25 to 29 Minutes | 0 (0.0%) | 0 (0.0%) |
| 30 to 34 Minutes | 37 (16.7%) | 4 (3.3%) |
| 35 to 39 Minutes | 0 (0.0%) | 0 (0.0%) |
| 40 to 44 Minutes | 0 (0.0%) | 0 (0.0%) |
| 45 to 59 Minutes | 0 (0.0%) | 7 (5.8%) |
| 60 to 89 Minutes | 6 (2.7%) | 2 (1.7%) |
| 90 or more Minutes | 0 (0.0%) | 0 (0.0%) |
Time of Departure to Work by Sex in Agency Village
The most frequent times of departure to work in Agency Village are 12:00 PM to 3:59 PM (64, 28.8%) for males and 7:30 AM to 7:59 AM (51, 42.1%) for females.
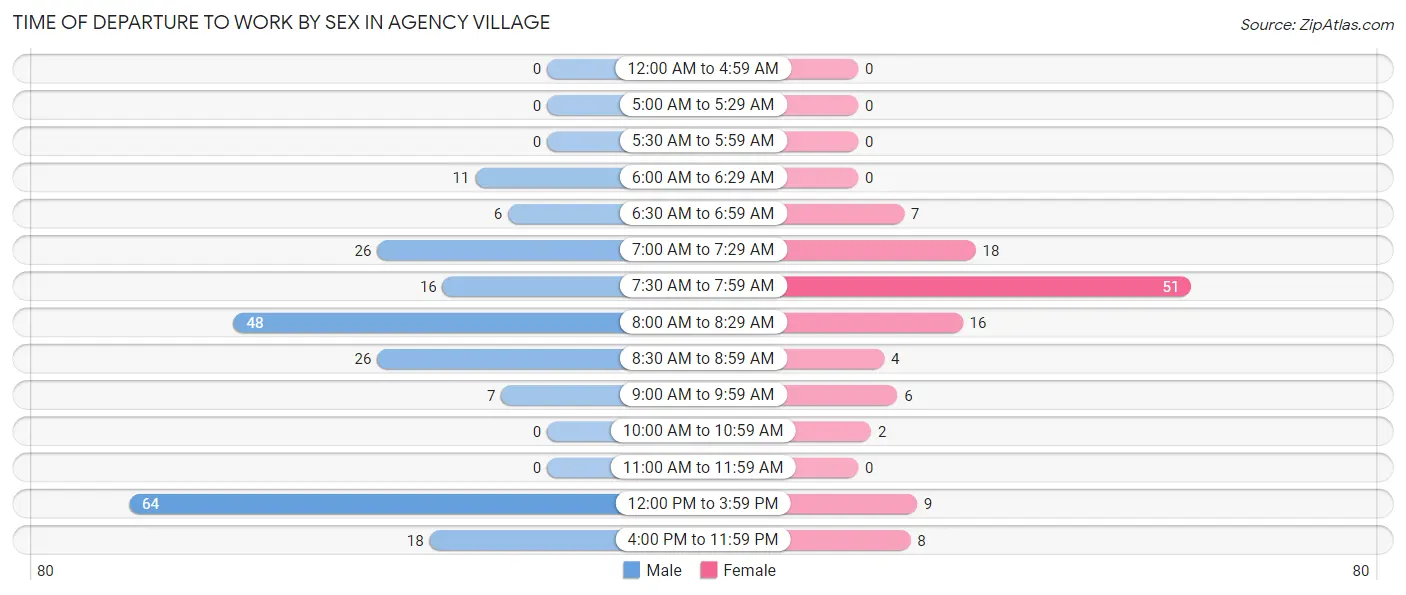
| Time of Departure | Male | Female |
| 12:00 AM to 4:59 AM | 0 (0.0%) | 0 (0.0%) |
| 5:00 AM to 5:29 AM | 0 (0.0%) | 0 (0.0%) |
| 5:30 AM to 5:59 AM | 0 (0.0%) | 0 (0.0%) |
| 6:00 AM to 6:29 AM | 11 (5.0%) | 0 (0.0%) |
| 6:30 AM to 6:59 AM | 6 (2.7%) | 7 (5.8%) |
| 7:00 AM to 7:29 AM | 26 (11.7%) | 18 (14.9%) |
| 7:30 AM to 7:59 AM | 16 (7.2%) | 51 (42.1%) |
| 8:00 AM to 8:29 AM | 48 (21.6%) | 16 (13.2%) |
| 8:30 AM to 8:59 AM | 26 (11.7%) | 4 (3.3%) |
| 9:00 AM to 9:59 AM | 7 (3.2%) | 6 (5.0%) |
| 10:00 AM to 10:59 AM | 0 (0.0%) | 2 (1.7%) |
| 11:00 AM to 11:59 AM | 0 (0.0%) | 0 (0.0%) |
| 12:00 PM to 3:59 PM | 64 (28.8%) | 9 (7.4%) |
| 4:00 PM to 11:59 PM | 18 (8.1%) | 8 (6.6%) |
| Total | 222 (100.0%) | 121 (100.0%) |
Housing Occupancy in Agency Village
Occupancy by Ownership in Agency Village
Of the total 204 dwellings in Agency Village, owner-occupied units account for 40 (19.6%), while renter-occupied units make up 164 (80.4%).
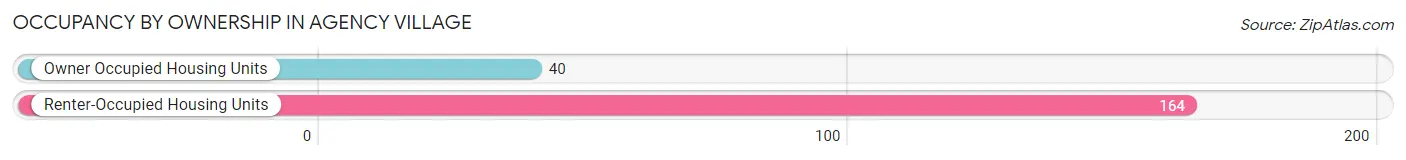
| Occupancy | # Housing Units | % Housing Units |
| Owner Occupied Housing Units | 40 | 19.6% |
| Renter-Occupied Housing Units | 164 | 80.4% |
| Total Occupied Housing Units | 204 | 100.0% |
Occupancy by Household Size in Agency Village
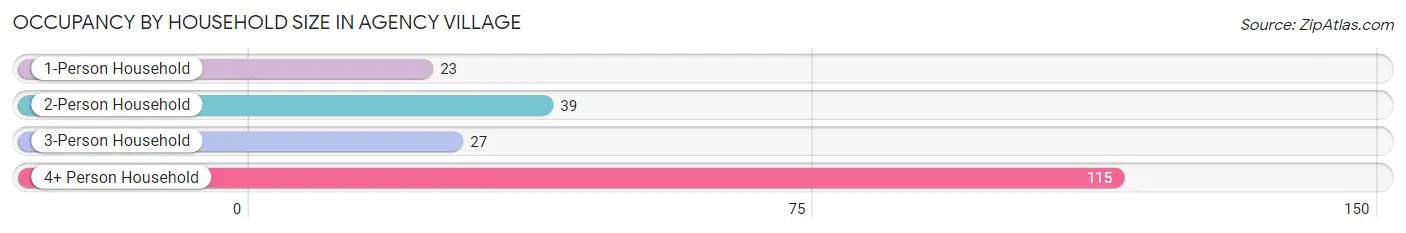
| Household Size | # Housing Units | % Housing Units |
| 1-Person Household | 23 | 11.3% |
| 2-Person Household | 39 | 19.1% |
| 3-Person Household | 27 | 13.2% |
| 4+ Person Household | 115 | 56.4% |
| Total Housing Units | 204 | 100.0% |
Occupancy by Ownership by Household Size in Agency Village
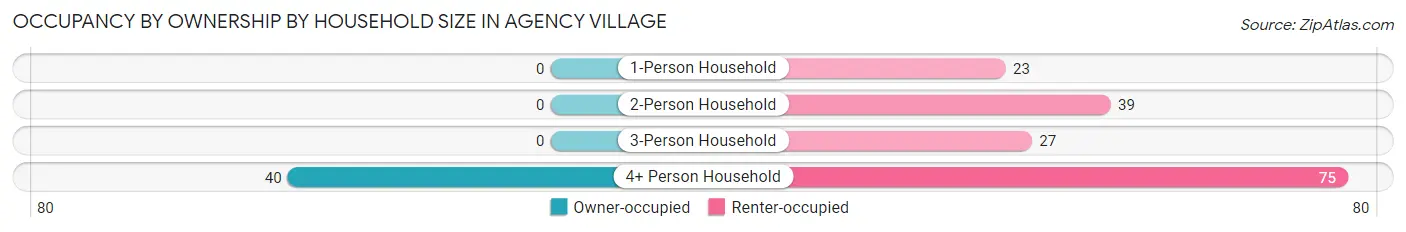
| Household Size | Owner-occupied | Renter-occupied |
| 1-Person Household | 0 (0.0%) | 23 (100.0%) |
| 2-Person Household | 0 (0.0%) | 39 (100.0%) |
| 3-Person Household | 0 (0.0%) | 27 (100.0%) |
| 4+ Person Household | 40 (34.8%) | 75 (65.2%) |
| Total Housing Units | 40 (19.6%) | 164 (80.4%) |
Occupancy by Educational Attainment in Agency Village
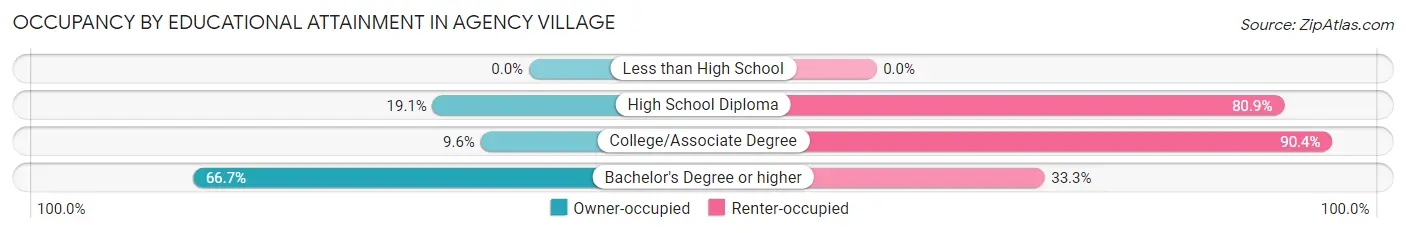
| Household Size | Owner-occupied | Renter-occupied |
| Less than High School | 0 (0.0%) | 0 (0.0%) |
| High School Diploma | 17 (19.1%) | 72 (80.9%) |
| College/Associate Degree | 9 (9.6%) | 85 (90.4%) |
| Bachelor's Degree or higher | 14 (66.7%) | 7 (33.3%) |
Occupancy by Age of Householder in Agency Village
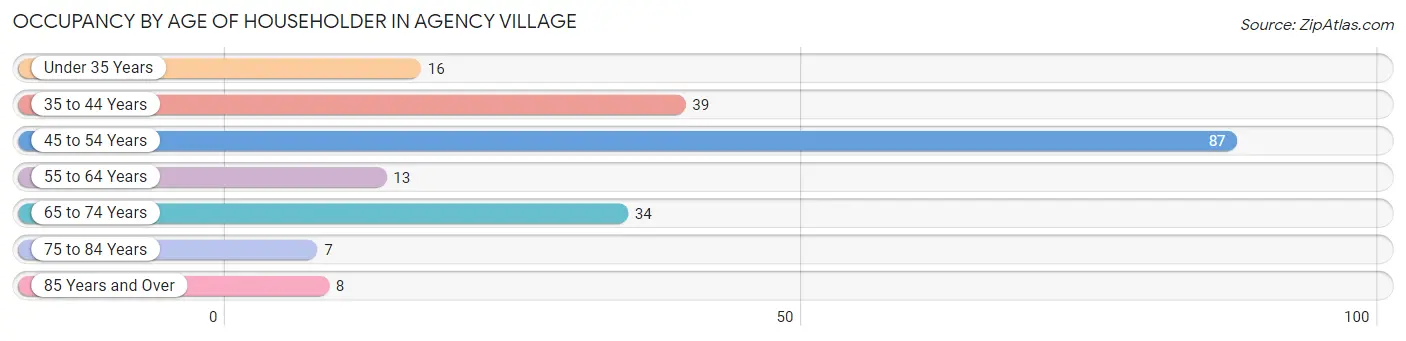
| Age Bracket | # Households | % Households |
| Under 35 Years | 16 | 7.8% |
| 35 to 44 Years | 39 | 19.1% |
| 45 to 54 Years | 87 | 42.6% |
| 55 to 64 Years | 13 | 6.4% |
| 65 to 74 Years | 34 | 16.7% |
| 75 to 84 Years | 7 | 3.4% |
| 85 Years and Over | 8 | 3.9% |
| Total | 204 | 100.0% |
Housing Finances in Agency Village
Median Income by Occupancy in Agency Village
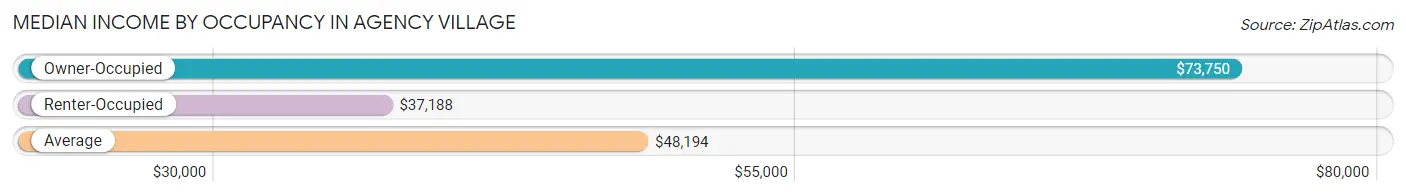
| Occupancy Type | # Households | Median Income |
| Owner-Occupied | 40 (19.6%) | $73,750 |
| Renter-Occupied | 164 (80.4%) | $37,188 |
| Average | 204 (100.0%) | $48,194 |
Occupancy by Householder Income Bracket in Agency Village
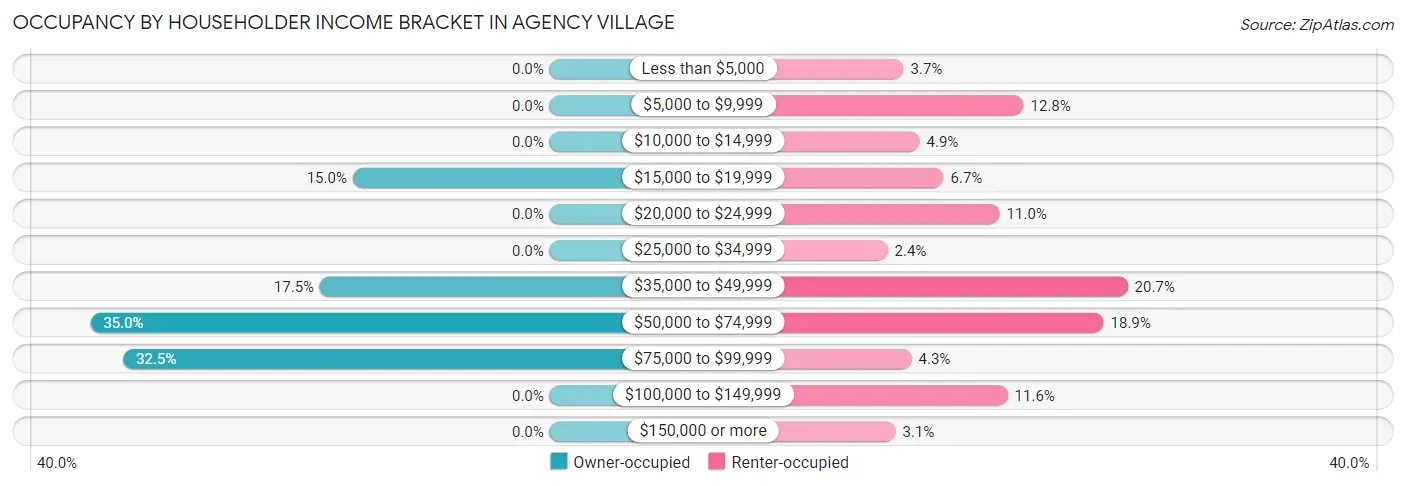
| Income Bracket | Owner-occupied | Renter-occupied |
| Less than $5,000 | 0 (0.0%) | 6 (3.7%) |
| $5,000 to $9,999 | 0 (0.0%) | 21 (12.8%) |
| $10,000 to $14,999 | 0 (0.0%) | 8 (4.9%) |
| $15,000 to $19,999 | 6 (15.0%) | 11 (6.7%) |
| $20,000 to $24,999 | 0 (0.0%) | 18 (11.0%) |
| $25,000 to $34,999 | 0 (0.0%) | 4 (2.4%) |
| $35,000 to $49,999 | 7 (17.5%) | 34 (20.7%) |
| $50,000 to $74,999 | 14 (35.0%) | 31 (18.9%) |
| $75,000 to $99,999 | 13 (32.5%) | 7 (4.3%) |
| $100,000 to $149,999 | 0 (0.0%) | 19 (11.6%) |
| $150,000 or more | 0 (0.0%) | 5 (3.0%) |
| Total | 40 (100.0%) | 164 (100.0%) |
Monthly Housing Cost Tiers in Agency Village
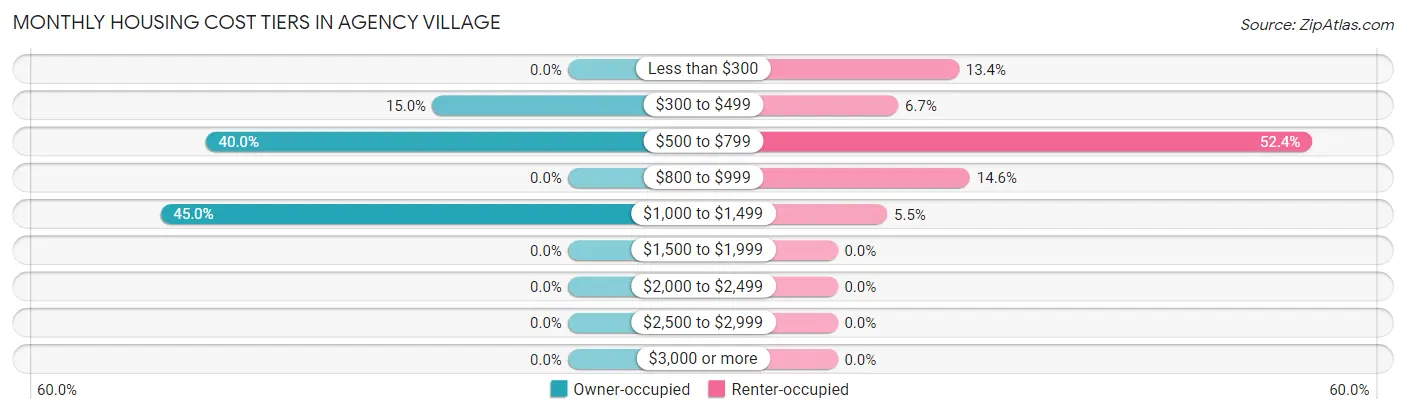
| Monthly Cost | Owner-occupied | Renter-occupied |
| Less than $300 | 0 (0.0%) | 22 (13.4%) |
| $300 to $499 | 6 (15.0%) | 11 (6.7%) |
| $500 to $799 | 16 (40.0%) | 86 (52.4%) |
| $800 to $999 | 0 (0.0%) | 24 (14.6%) |
| $1,000 to $1,499 | 18 (45.0%) | 9 (5.5%) |
| $1,500 to $1,999 | 0 (0.0%) | 0 (0.0%) |
| $2,000 to $2,499 | 0 (0.0%) | 0 (0.0%) |
| $2,500 to $2,999 | 0 (0.0%) | 0 (0.0%) |
| $3,000 or more | 0 (0.0%) | 0 (0.0%) |
| Total | 40 (100.0%) | 164 (100.0%) |
Physical Housing Characteristics in Agency Village
Housing Structures in Agency Village
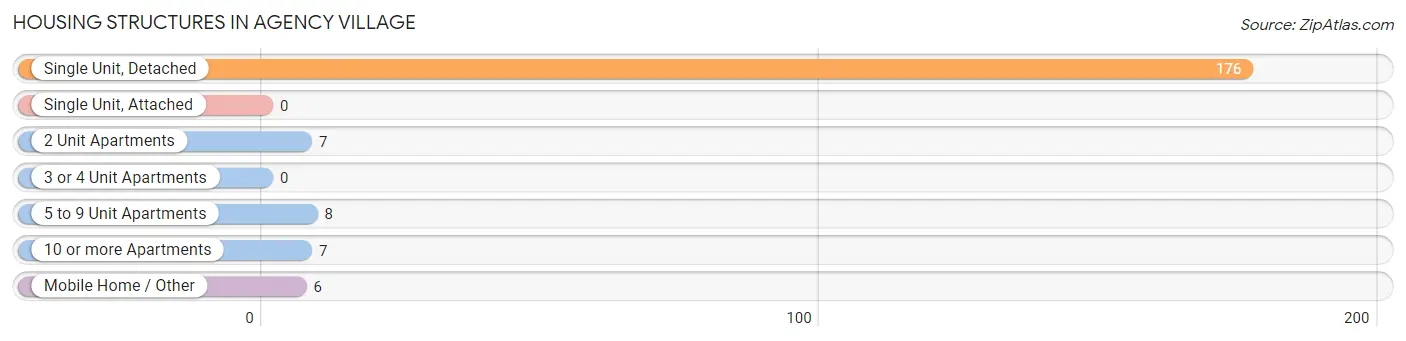
| Structure Type | # Housing Units | % Housing Units |
| Single Unit, Detached | 176 | 86.3% |
| Single Unit, Attached | 0 | 0.0% |
| 2 Unit Apartments | 7 | 3.4% |
| 3 or 4 Unit Apartments | 0 | 0.0% |
| 5 to 9 Unit Apartments | 8 | 3.9% |
| 10 or more Apartments | 7 | 3.4% |
| Mobile Home / Other | 6 | 2.9% |
| Total | 204 | 100.0% |
Housing Structures by Occupancy in Agency Village
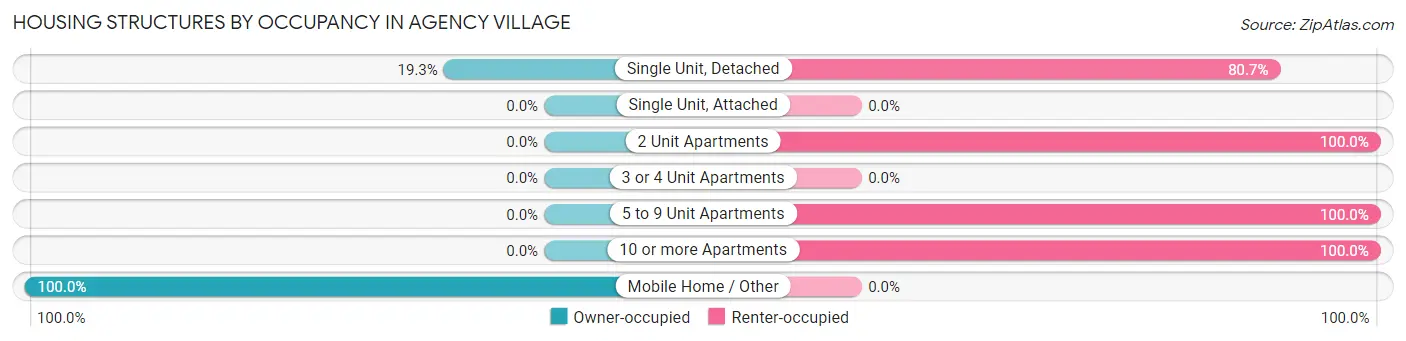
| Structure Type | Owner-occupied | Renter-occupied |
| Single Unit, Detached | 34 (19.3%) | 142 (80.7%) |
| Single Unit, Attached | 0 (0.0%) | 0 (0.0%) |
| 2 Unit Apartments | 0 (0.0%) | 7 (100.0%) |
| 3 or 4 Unit Apartments | 0 (0.0%) | 0 (0.0%) |
| 5 to 9 Unit Apartments | 0 (0.0%) | 8 (100.0%) |
| 10 or more Apartments | 0 (0.0%) | 7 (100.0%) |
| Mobile Home / Other | 6 (100.0%) | 0 (0.0%) |
| Total | 40 (19.6%) | 164 (80.4%) |
Housing Structures by Number of Rooms in Agency Village
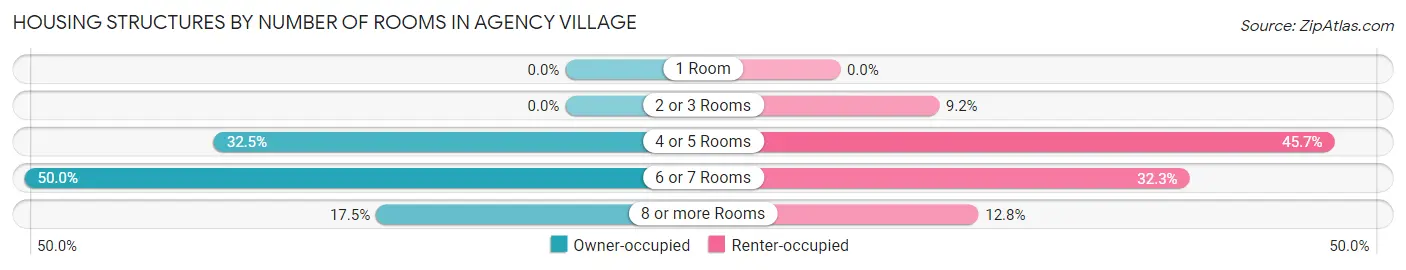
| Number of Rooms | Owner-occupied | Renter-occupied |
| 1 Room | 0 (0.0%) | 0 (0.0%) |
| 2 or 3 Rooms | 0 (0.0%) | 15 (9.1%) |
| 4 or 5 Rooms | 13 (32.5%) | 75 (45.7%) |
| 6 or 7 Rooms | 20 (50.0%) | 53 (32.3%) |
| 8 or more Rooms | 7 (17.5%) | 21 (12.8%) |
| Total | 40 (100.0%) | 164 (100.0%) |
Housing Structure by Heating Type in Agency Village
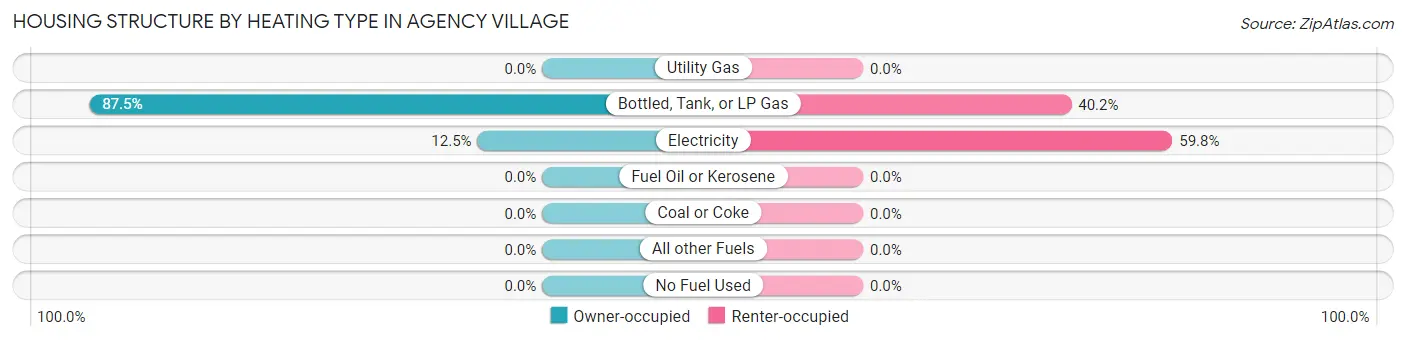
| Heating Type | Owner-occupied | Renter-occupied |
| Utility Gas | 0 (0.0%) | 0 (0.0%) |
| Bottled, Tank, or LP Gas | 35 (87.5%) | 66 (40.2%) |
| Electricity | 5 (12.5%) | 98 (59.8%) |
| Fuel Oil or Kerosene | 0 (0.0%) | 0 (0.0%) |
| Coal or Coke | 0 (0.0%) | 0 (0.0%) |
| All other Fuels | 0 (0.0%) | 0 (0.0%) |
| No Fuel Used | 0 (0.0%) | 0 (0.0%) |
| Total | 40 (100.0%) | 164 (100.0%) |
Household Vehicle Usage in Agency Village
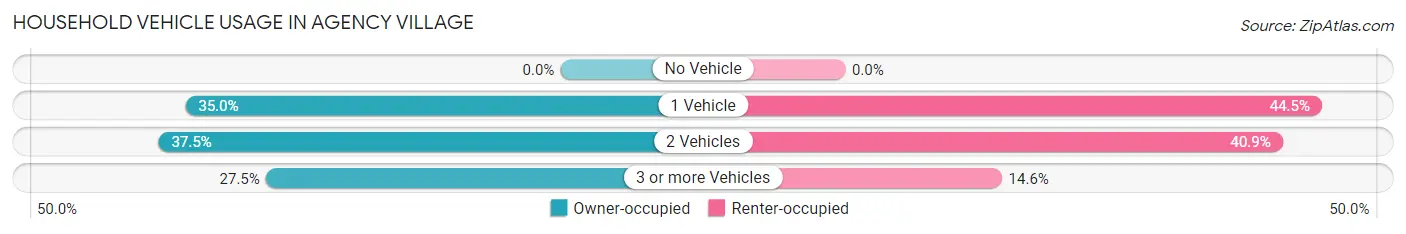
| Vehicles per Household | Owner-occupied | Renter-occupied |
| No Vehicle | 0 (0.0%) | 0 (0.0%) |
| 1 Vehicle | 14 (35.0%) | 73 (44.5%) |
| 2 Vehicles | 15 (37.5%) | 67 (40.8%) |
| 3 or more Vehicles | 11 (27.5%) | 24 (14.6%) |
| Total | 40 (100.0%) | 164 (100.0%) |
Real Estate & Mortgages in Agency Village
Real Estate and Mortgage Overview in Agency Village
| Characteristic | Without Mortgage | With Mortgage |
| Housing Units | 28 | 12 |
| Median Property Value | - | - |
| Median Household Income | $73,929 | $0 |
| Monthly Housing Costs | $600 | $0 |
| Real Estate Taxes | - | - |
Property Value by Mortgage Status in Agency Village
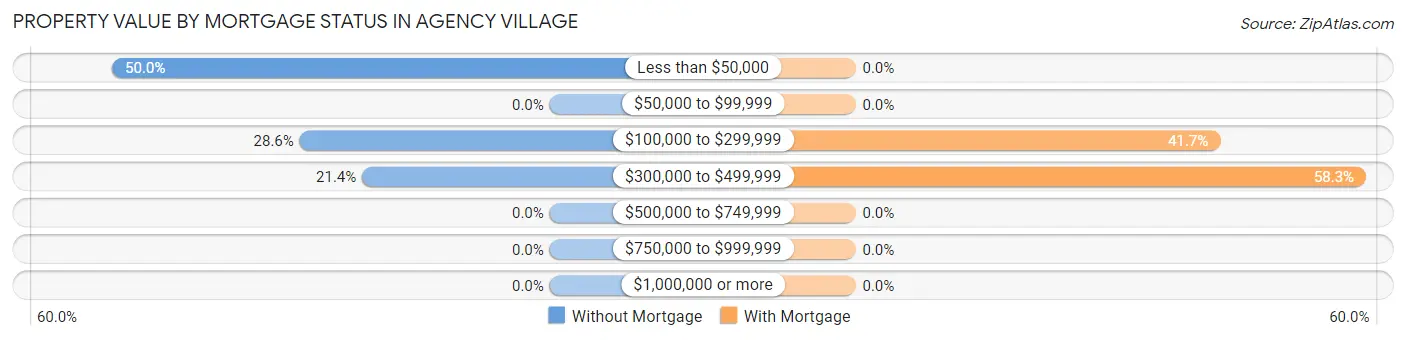
| Property Value | Without Mortgage | With Mortgage |
| Less than $50,000 | 14 (50.0%) | 0 (0.0%) |
| $50,000 to $99,999 | 0 (0.0%) | 0 (0.0%) |
| $100,000 to $299,999 | 8 (28.6%) | 5 (41.7%) |
| $300,000 to $499,999 | 6 (21.4%) | 7 (58.3%) |
| $500,000 to $749,999 | 0 (0.0%) | 0 (0.0%) |
| $750,000 to $999,999 | 0 (0.0%) | 0 (0.0%) |
| $1,000,000 or more | 0 (0.0%) | 0 (0.0%) |
| Total | 28 (100.0%) | 12 (100.0%) |
Household Income by Mortgage Status in Agency Village
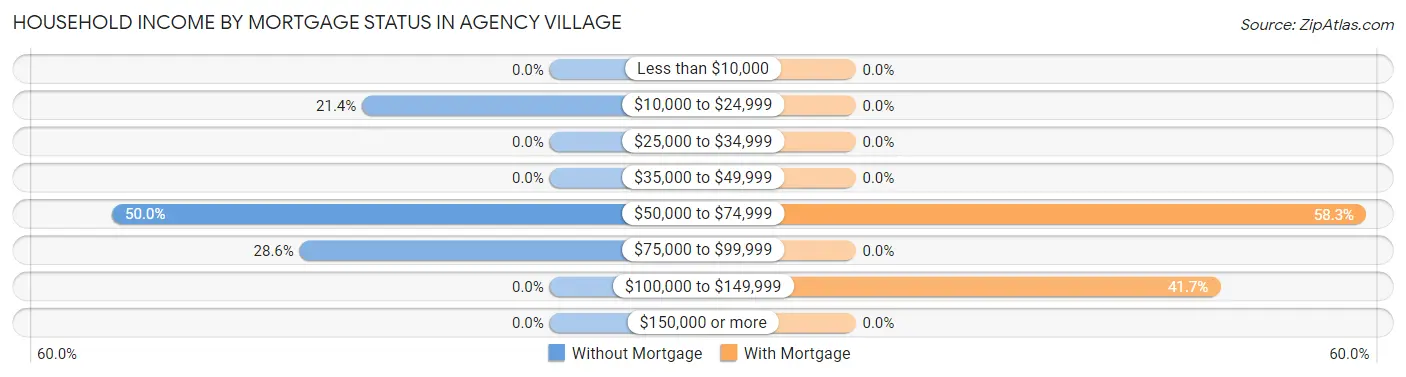
| Household Income | Without Mortgage | With Mortgage |
| Less than $10,000 | 0 (0.0%) | 0 (0.0%) |
| $10,000 to $24,999 | 6 (21.4%) | 0 (0.0%) |
| $25,000 to $34,999 | 0 (0.0%) | 0 (0.0%) |
| $35,000 to $49,999 | 0 (0.0%) | 0 (0.0%) |
| $50,000 to $74,999 | 14 (50.0%) | 7 (58.3%) |
| $75,000 to $99,999 | 8 (28.6%) | 0 (0.0%) |
| $100,000 to $149,999 | 0 (0.0%) | 5 (41.7%) |
| $150,000 or more | 0 (0.0%) | 0 (0.0%) |
| Total | 28 (100.0%) | 12 (100.0%) |
Property Value to Household Income Ratio in Agency Village
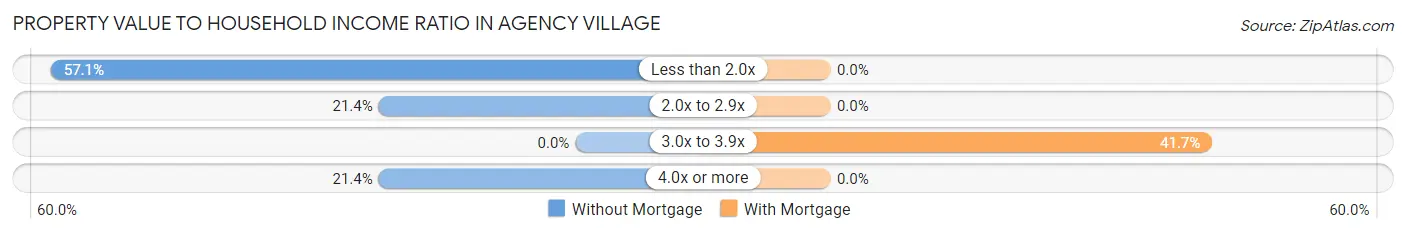
| Value-to-Income Ratio | Without Mortgage | With Mortgage |
| Less than 2.0x | 16 (57.1%) | 0 (0.0%) |
| 2.0x to 2.9x | 6 (21.4%) | 0 (0.0%) |
| 3.0x to 3.9x | 0 (0.0%) | 5 (41.7%) |
| 4.0x or more | 6 (21.4%) | 0 (0.0%) |
| Total | 28 (100.0%) | 12 (100.0%) |
Real Estate Taxes by Mortgage Status in Agency Village
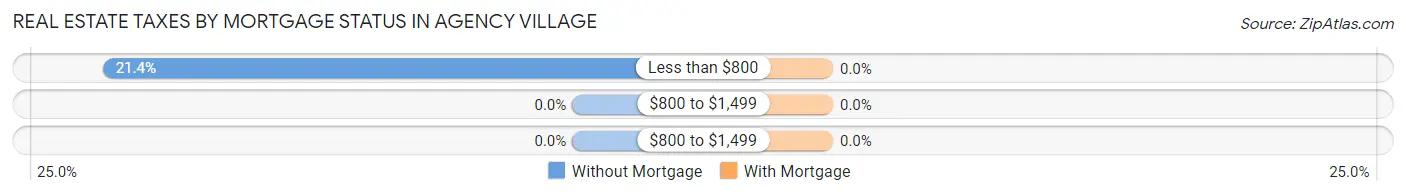
| Property Taxes | Without Mortgage | With Mortgage |
| Less than $800 | 6 (21.4%) | 0 (0.0%) |
| $800 to $1,499 | 0 (0.0%) | 0 (0.0%) |
| $800 to $1,499 | 0 (0.0%) | 0 (0.0%) |
| Total | 28 (100.0%) | 12 (100.0%) |
Health & Disability in Agency Village
Health Insurance Coverage by Age in Agency Village
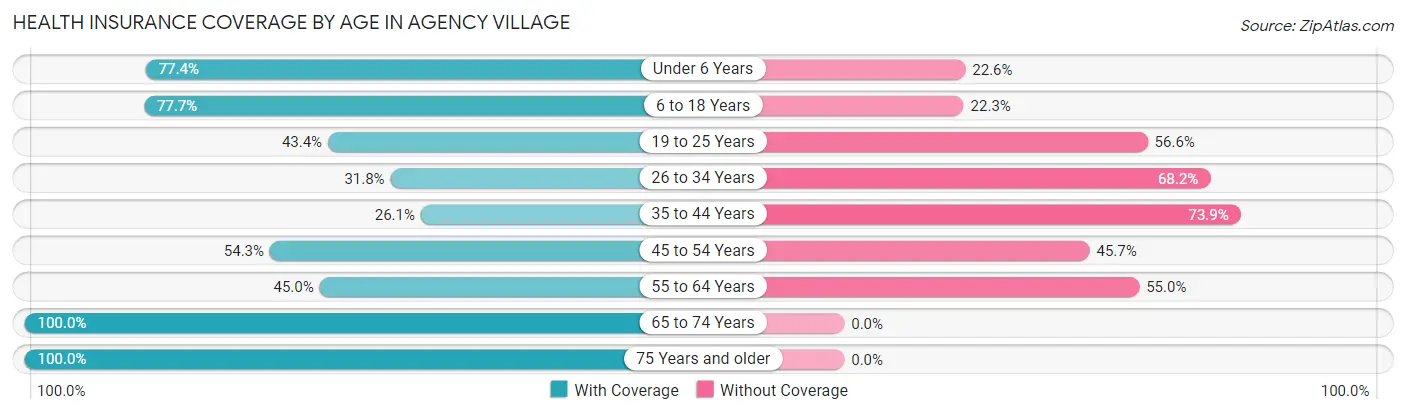
| Age Bracket | With Coverage | Without Coverage |
| Under 6 Years | 48 (77.4%) | 14 (22.6%) |
| 6 to 18 Years | 241 (77.7%) | 69 (22.3%) |
| 19 to 25 Years | 43 (43.4%) | 56 (56.6%) |
| 26 to 34 Years | 41 (31.8%) | 88 (68.2%) |
| 35 to 44 Years | 35 (26.1%) | 99 (73.9%) |
| 45 to 54 Years | 70 (54.3%) | 59 (45.7%) |
| 55 to 64 Years | 9 (45.0%) | 11 (55.0%) |
| 65 to 74 Years | 49 (100.0%) | 0 (0.0%) |
| 75 Years and older | 22 (100.0%) | 0 (0.0%) |
| Total | 558 (58.5%) | 396 (41.5%) |
Health Insurance Coverage by Citizenship Status in Agency Village
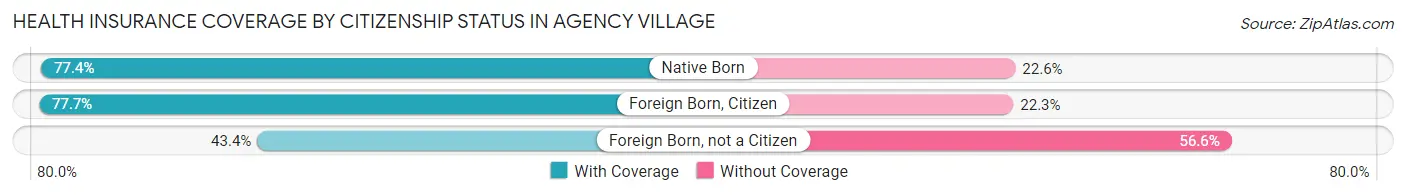
| Citizenship Status | With Coverage | Without Coverage |
| Native Born | 48 (77.4%) | 14 (22.6%) |
| Foreign Born, Citizen | 241 (77.7%) | 69 (22.3%) |
| Foreign Born, not a Citizen | 43 (43.4%) | 56 (56.6%) |
Health Insurance Coverage by Household Income in Agency Village
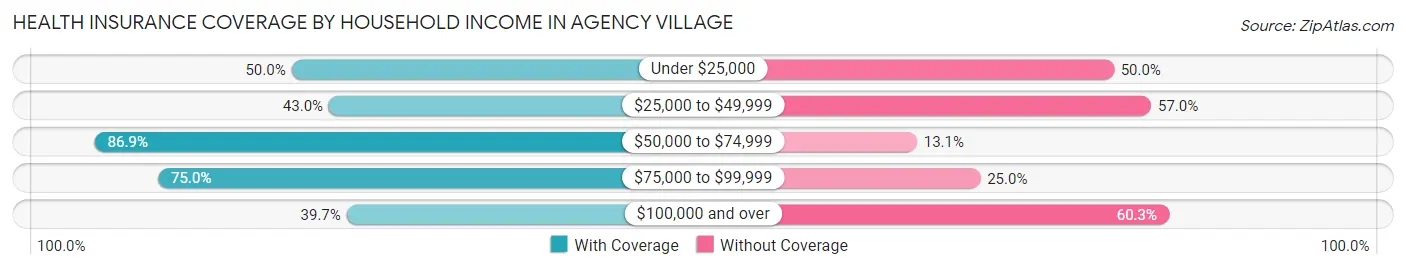
| Household Income | With Coverage | Without Coverage |
| Under $25,000 | 100 (50.0%) | 100 (50.0%) |
| $25,000 to $49,999 | 95 (43.0%) | 126 (57.0%) |
| $50,000 to $74,999 | 192 (86.9%) | 29 (13.1%) |
| $75,000 to $99,999 | 123 (75.0%) | 41 (25.0%) |
| $100,000 and over | 48 (39.7%) | 73 (60.3%) |
Public vs Private Health Insurance Coverage by Age in Agency Village
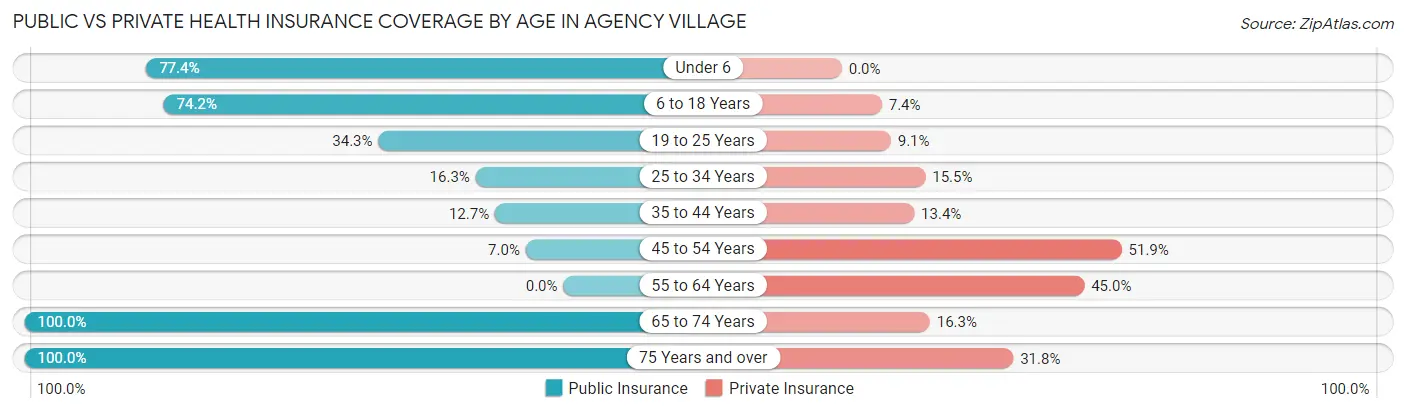
| Age Bracket | Public Insurance | Private Insurance |
| Under 6 | 48 (77.4%) | 0 (0.0%) |
| 6 to 18 Years | 230 (74.2%) | 23 (7.4%) |
| 19 to 25 Years | 34 (34.3%) | 9 (9.1%) |
| 25 to 34 Years | 21 (16.3%) | 20 (15.5%) |
| 35 to 44 Years | 17 (12.7%) | 18 (13.4%) |
| 45 to 54 Years | 9 (7.0%) | 67 (51.9%) |
| 55 to 64 Years | 0 (0.0%) | 9 (45.0%) |
| 65 to 74 Years | 49 (100.0%) | 8 (16.3%) |
| 75 Years and over | 22 (100.0%) | 7 (31.8%) |
| Total | 430 (45.1%) | 161 (16.9%) |
Disability Status by Sex by Age in Agency Village
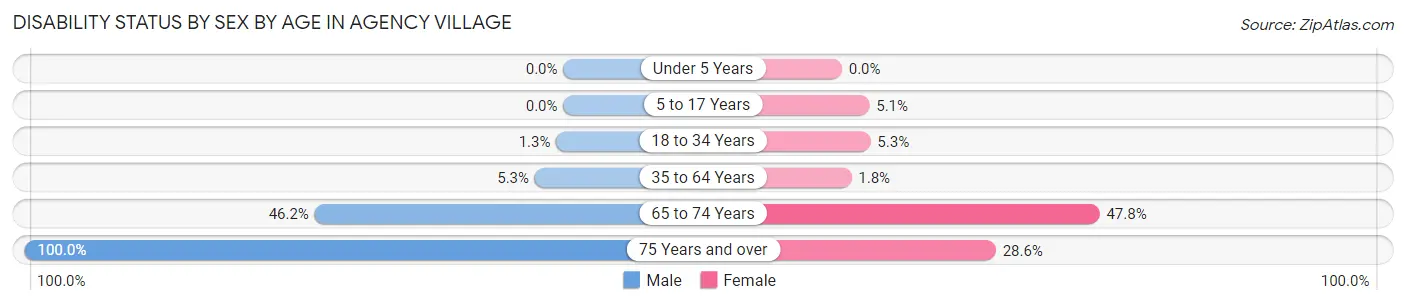
| Age Bracket | Male | Female |
| Under 5 Years | 0 (0.0%) | 0 (0.0%) |
| 5 to 17 Years | 0 (0.0%) | 5 (5.1%) |
| 18 to 34 Years | 2 (1.3%) | 6 (5.3%) |
| 35 to 64 Years | 9 (5.3%) | 2 (1.8%) |
| 65 to 74 Years | 12 (46.2%) | 11 (47.8%) |
| 75 Years and over | 15 (100.0%) | 2 (28.6%) |
Disability Class by Sex by Age in Agency Village
Disability Class: Hearing Difficulty
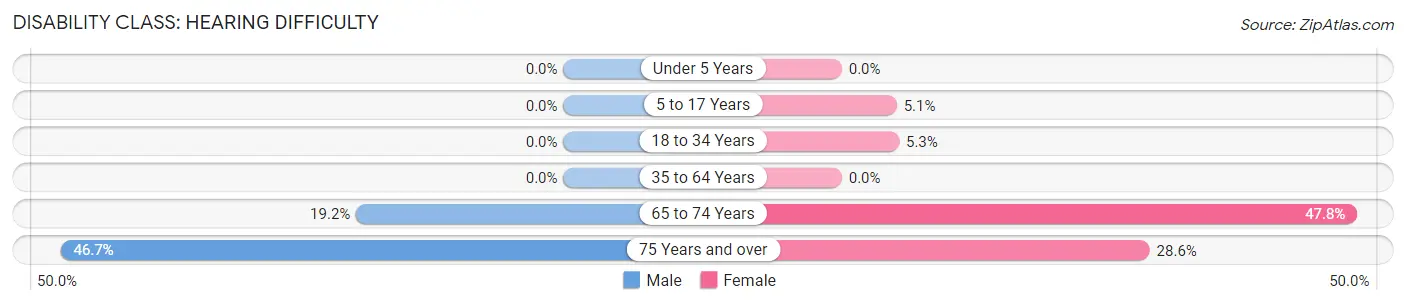
| Age Bracket | Male | Female |
| Under 5 Years | 0 (0.0%) | 0 (0.0%) |
| 5 to 17 Years | 0 (0.0%) | 5 (5.1%) |
| 18 to 34 Years | 0 (0.0%) | 6 (5.3%) |
| 35 to 64 Years | 0 (0.0%) | 0 (0.0%) |
| 65 to 74 Years | 5 (19.2%) | 11 (47.8%) |
| 75 Years and over | 7 (46.7%) | 2 (28.6%) |
Disability Class: Vision Difficulty
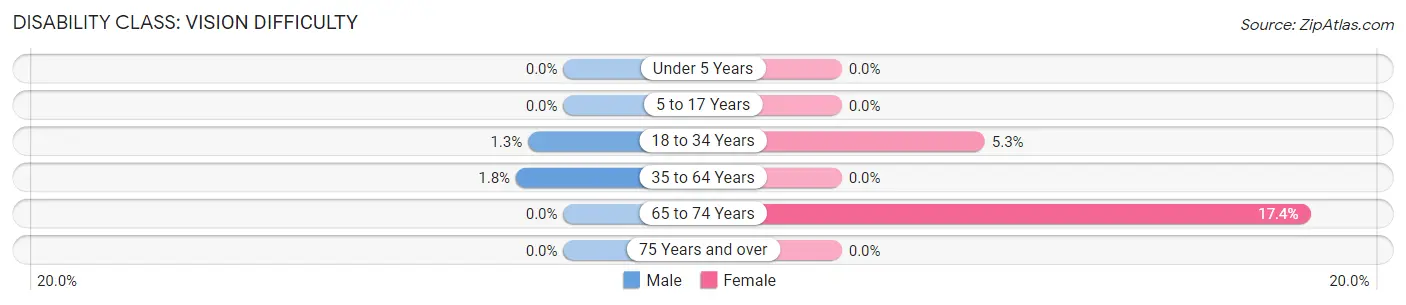
| Age Bracket | Male | Female |
| Under 5 Years | 0 (0.0%) | 0 (0.0%) |
| 5 to 17 Years | 0 (0.0%) | 0 (0.0%) |
| 18 to 34 Years | 2 (1.3%) | 6 (5.3%) |
| 35 to 64 Years | 3 (1.8%) | 0 (0.0%) |
| 65 to 74 Years | 0 (0.0%) | 4 (17.4%) |
| 75 Years and over | 0 (0.0%) | 0 (0.0%) |
Disability Class: Cognitive Difficulty
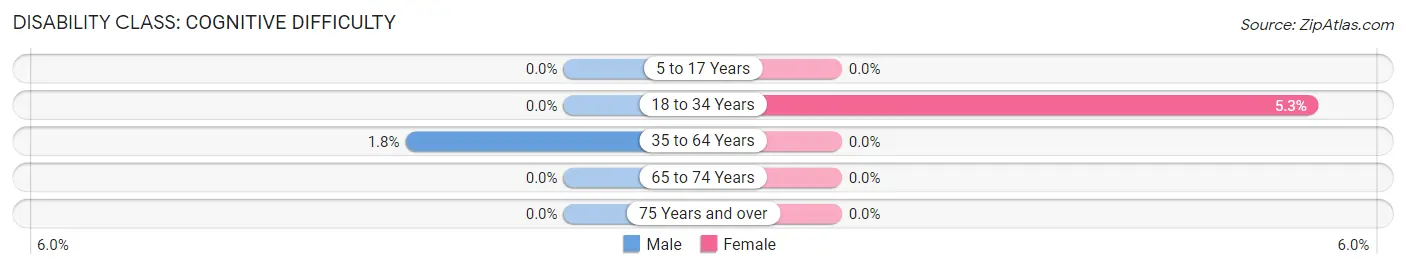
| Age Bracket | Male | Female |
| 5 to 17 Years | 0 (0.0%) | 0 (0.0%) |
| 18 to 34 Years | 0 (0.0%) | 6 (5.3%) |
| 35 to 64 Years | 3 (1.8%) | 0 (0.0%) |
| 65 to 74 Years | 0 (0.0%) | 0 (0.0%) |
| 75 Years and over | 0 (0.0%) | 0 (0.0%) |
Disability Class: Ambulatory Difficulty
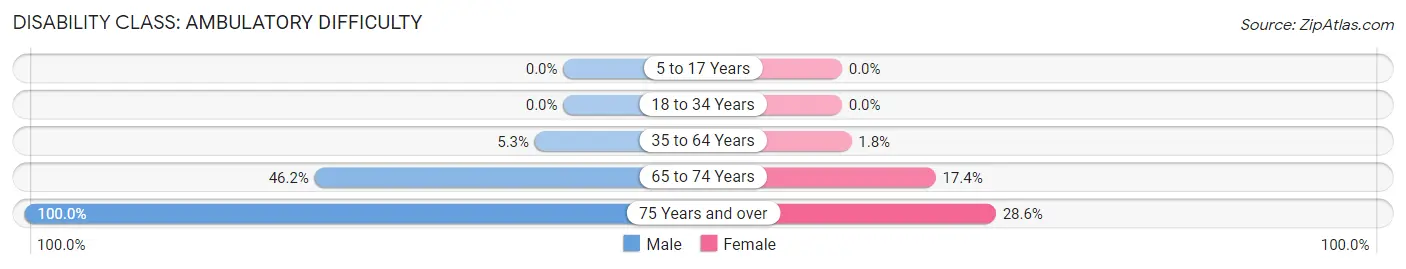
| Age Bracket | Male | Female |
| 5 to 17 Years | 0 (0.0%) | 0 (0.0%) |
| 18 to 34 Years | 0 (0.0%) | 0 (0.0%) |
| 35 to 64 Years | 9 (5.3%) | 2 (1.8%) |
| 65 to 74 Years | 12 (46.2%) | 4 (17.4%) |
| 75 Years and over | 15 (100.0%) | 2 (28.6%) |
Disability Class: Self-Care Difficulty
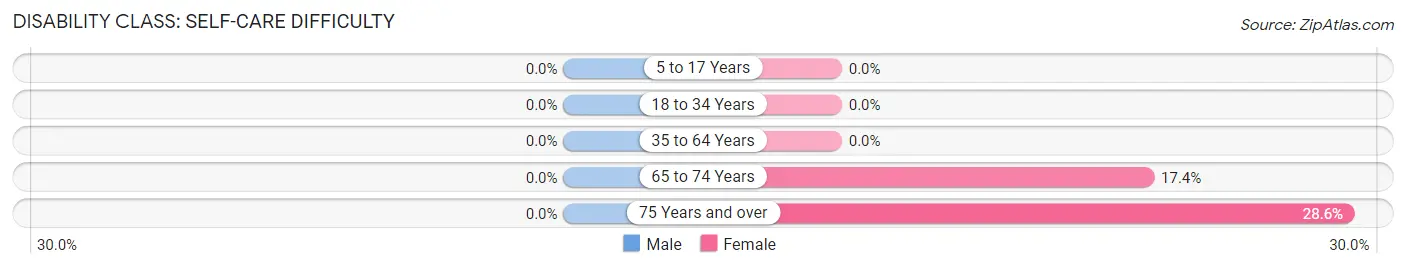
| Age Bracket | Male | Female |
| 5 to 17 Years | 0 (0.0%) | 0 (0.0%) |
| 18 to 34 Years | 0 (0.0%) | 0 (0.0%) |
| 35 to 64 Years | 0 (0.0%) | 0 (0.0%) |
| 65 to 74 Years | 0 (0.0%) | 4 (17.4%) |
| 75 Years and over | 0 (0.0%) | 2 (28.6%) |
Technology Access in Agency Village
Computing Device Access in Agency Village
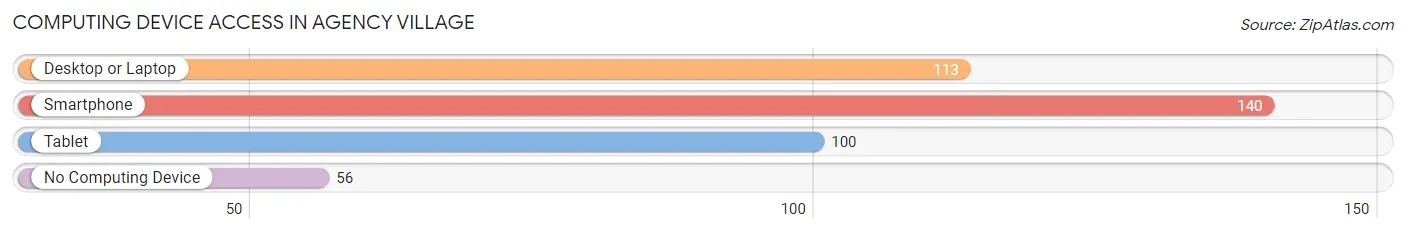
| Device Type | # Households | % Households |
| Desktop or Laptop | 113 | 55.4% |
| Smartphone | 140 | 68.6% |
| Tablet | 100 | 49.0% |
| No Computing Device | 56 | 27.5% |
| Total | 204 | 100.0% |
Internet Access in Agency Village
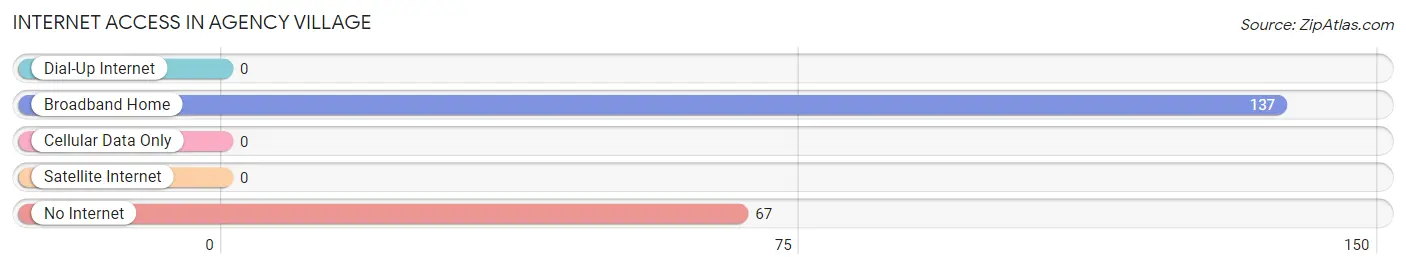
| Internet Type | # Households | % Households |
| Dial-Up Internet | 0 | 0.0% |
| Broadband Home | 137 | 67.2% |
| Cellular Data Only | 0 | 0.0% |
| Satellite Internet | 0 | 0.0% |
| No Internet | 67 | 32.8% |
| Total | 204 | 100.0% |
Agency Village Summary
Agency Village is a small unincorporated community located in the Lake Andes-Wagner Micropolitan Statistical Area in Charles Mix County, South Dakota. It is situated on the Yankton Sioux Indian Reservation, and is home to the Sisseton-Wahpeton Oyate of the Sioux Nation. The population of Agency Village was estimated to be 545 in the 2010 census.
History
Agency Village was established in 1868 as a trading post and agency for the Yankton Sioux. The post was established by the United States government to provide a place for the Yankton Sioux to trade and receive government services. The post was originally located on the east side of the Missouri River, but was moved to its current location in 1873.
The post was originally called "Agency House", but the name was changed to "Agency Village" in 1876. The name was chosen to reflect the fact that the post was the center of government services for the Yankton Sioux.
In 1877, the post was moved to its current location on the west side of the Missouri River. The post was then renamed "Agency Village".
Geography
Agency Village is located in the Lake Andes-Wagner Micropolitan Statistical Area in Charles Mix County, South Dakota. It is situated on the Yankton Sioux Indian Reservation, and is home to the Sisseton-Wahpeton Oyate of the Sioux Nation.
The community is located on the west side of the Missouri River, approximately 10 miles south of Lake Andes. It is located at an elevation of 1,845 feet.
Economy
The economy of Agency Village is largely based on agriculture and tourism. The community is home to several small businesses, including a grocery store, a gas station, and a restaurant.
The community is also home to the Sisseton-Wahpeton Oyate of the Sioux Nation, which operates a casino and resort. The casino and resort provide employment opportunities for members of the tribe, as well as visitors to the area.
Demographics
According to the 2010 census, the population of Agency Village was 545. The racial makeup of the community was 95.3% Native American, 2.7% White, 0.2% African American, 0.2% Asian, and 1.6% from other races.
The median household income in Agency Village was $20,938, and the median family income was $25,000. The per capita income was $10,938. Approximately 28.3% of the population was below the poverty line.
Common Questions
What is Per Capita Income in Agency Village?
Per Capita income in Agency Village is $14,033.
What is the Median Family Income in Agency Village?
Median Family Income in Agency Village is $46,500.
What is the Median Household income in Agency Village?
Median Household Income in Agency Village is $48,194.
What is Income or Wage Gap in Agency Village?
Income or Wage Gap in Agency Village is 53.1%.
Women in Agency Village earn 46.9 cents for every dollar earned by a man.
What is Inequality or Gini Index in Agency Village?
Inequality or Gini Index in Agency Village is 0.41.
What is the Total Population of Agency Village?
Total Population of Agency Village is 972.
What is the Total Male Population of Agency Village?
Total Male Population of Agency Village is 604.
What is the Total Female Population of Agency Village?
Total Female Population of Agency Village is 368.
What is the Ratio of Males per 100 Females in Agency Village?
There are 164.13 Males per 100 Females in Agency Village.
What is the Ratio of Females per 100 Males in Agency Village?
There are 60.93 Females per 100 Males in Agency Village.
What is the Median Population Age in Agency Village?
Median Population Age in Agency Village is 26.5 Years.
What is the Average Family Size in Agency Village
Average Family Size in Agency Village is 5.1 People.
What is the Average Household Size in Agency Village
Average Household Size in Agency Village is 4.5 People.
How Large is the Labor Force in Agency Village?
There are 394 People in the Labor Forcein in Agency Village.
What is the Percentage of People in the Labor Force in Agency Village?
59.0% of People are in the Labor Force in Agency Village.
What is the Unemployment Rate in Agency Village?
Unemployment Rate in Agency Village is 6.3%.