Oacoma, SD Map & Demographics
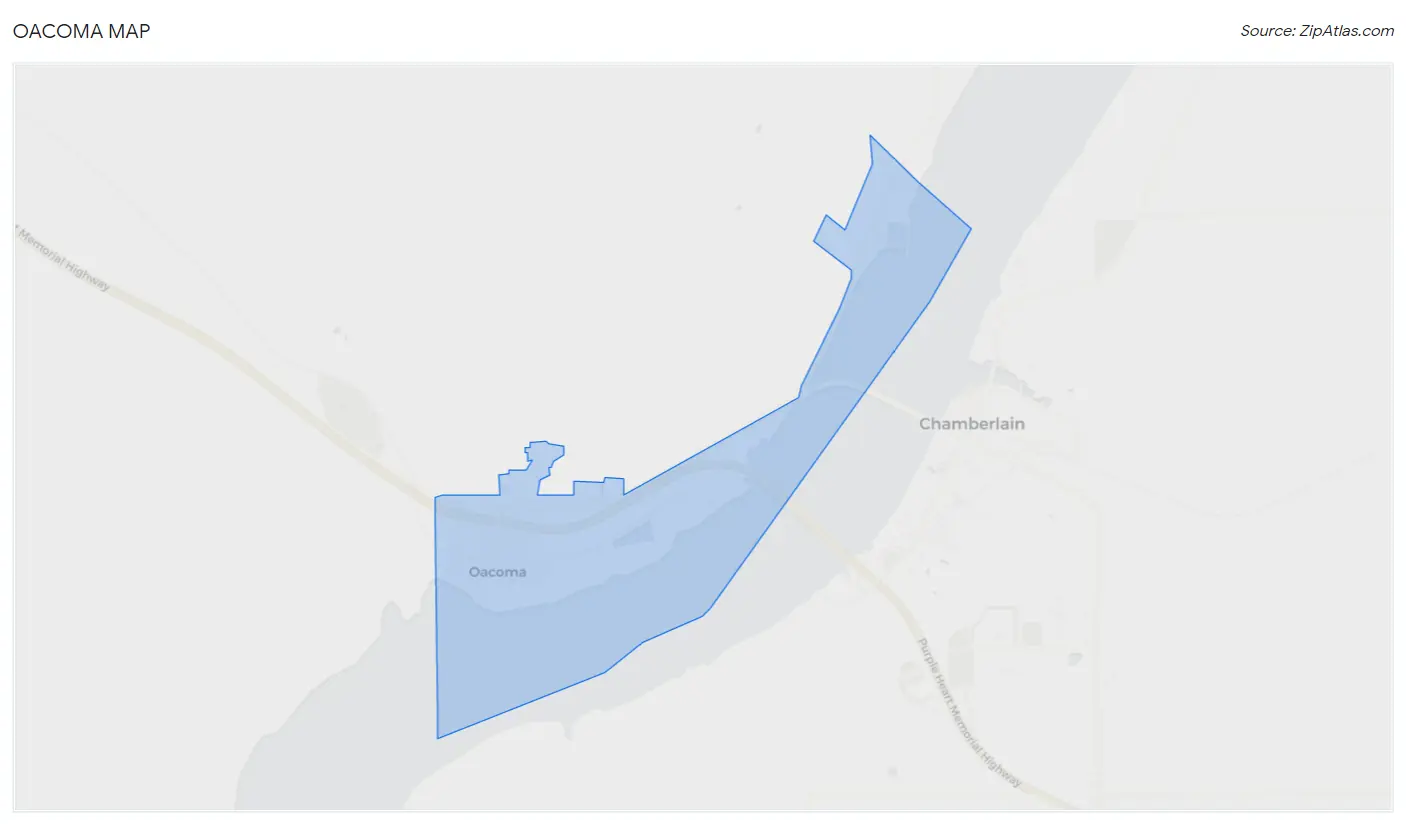
Oacoma Map
Oacoma Overview
$38,682
PER CAPITA INCOME
$78,958
AVG FAMILY INCOME
$67,083
AVG HOUSEHOLD INCOME
14.1%
WAGE / INCOME GAP [ % ]
85.9¢/ $1
WAGE / INCOME GAP [ $ ]
0.39
INEQUALITY / GINI INDEX
406
TOTAL POPULATION
225
MALE POPULATION
181
FEMALE POPULATION
124.31
MALES / 100 FEMALES
80.44
FEMALES / 100 MALES
57.3
MEDIAN AGE
2.6
AVG FAMILY SIZE
2.0
AVG HOUSEHOLD SIZE
222
LABOR FORCE [ PEOPLE ]
64.7%
PERCENT IN LABOR FORCE
5.9%
UNEMPLOYMENT RATE
Oacoma Zip Codes
Oacoma Area Codes
Income in Oacoma
Income Overview in Oacoma
Per Capita Income in Oacoma is $38,682, while median incomes of families and households are $78,958 and $67,083 respectively.
| Characteristic | Number | Measure |
| Per Capita Income | 406 | $38,682 |
| Median Family Income | 111 | $78,958 |
| Mean Family Income | 111 | $95,652 |
| Median Household Income | 203 | $67,083 |
| Mean Household Income | 203 | $76,166 |
| Income Deficit | 111 | $0 |
| Wage / Income Gap (%) | 406 | 14.11% |
| Wage / Income Gap ($) | 406 | 85.89¢ per $1 |
| Gini / Inequality Index | 406 | 0.39 |
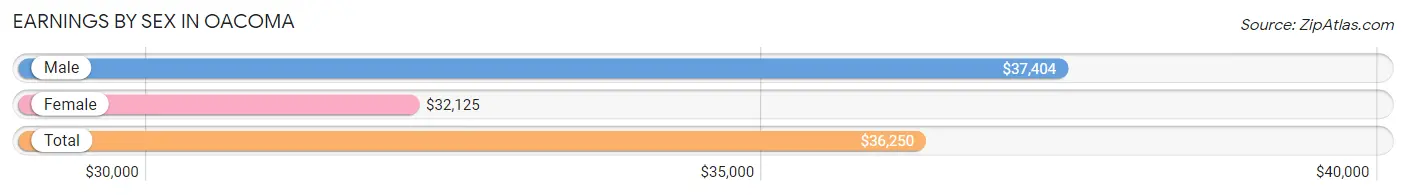
Earnings by Sex in Oacoma
Average Earnings in Oacoma are $36,250, $37,404 for men and $32,125 for women, a difference of 14.1%.
| Sex | Number | Average Earnings |
| Male | 109 (50.2%) | $37,404 |
| Female | 108 (49.8%) | $32,125 |
| Total | 217 (100.0%) | $36,250 |
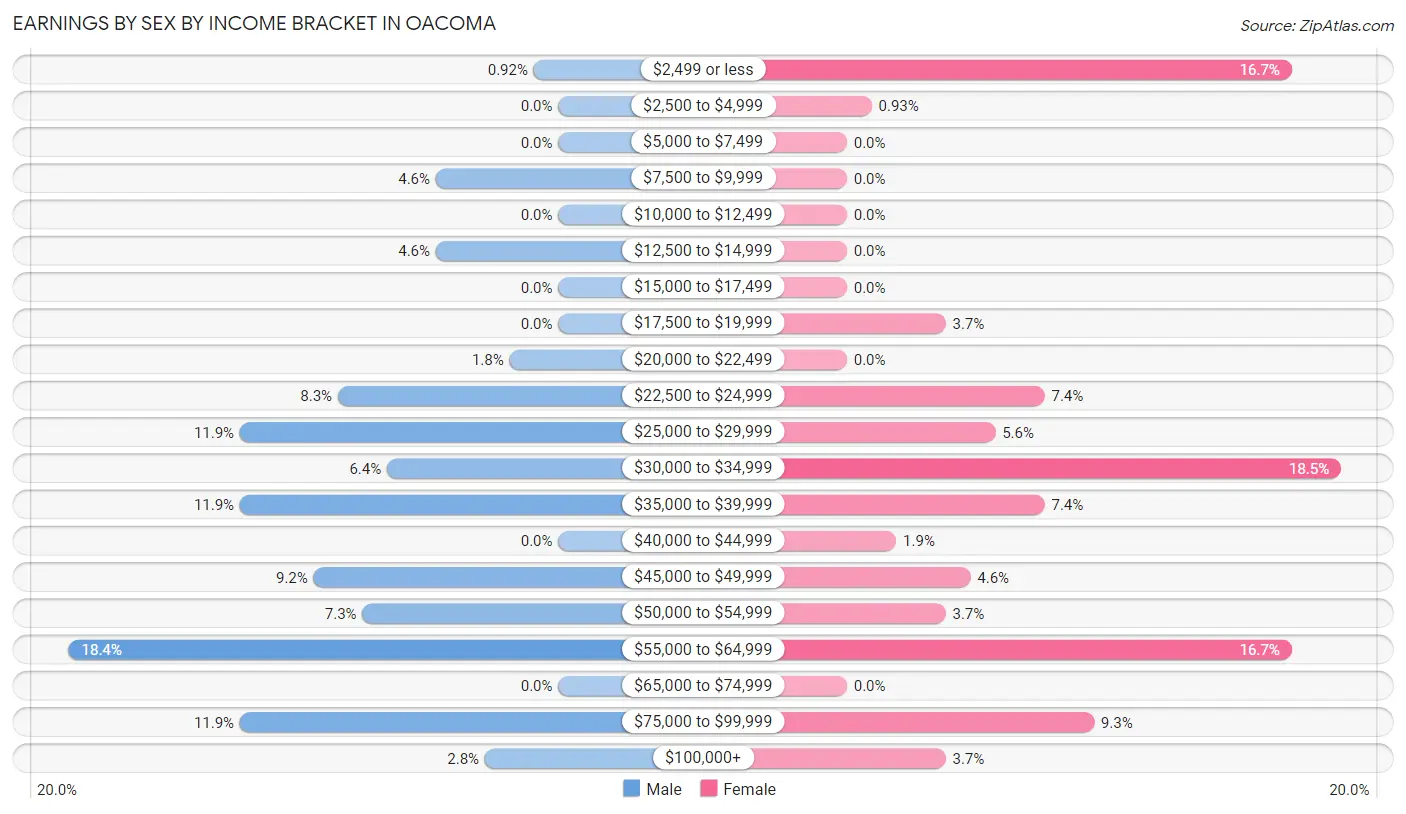
Earnings by Sex by Income Bracket in Oacoma
The most common earnings brackets in Oacoma are $55,000 to $64,999 for men (20 | 18.3%) and $30,000 to $34,999 for women (20 | 18.5%).
| Income | Male | Female |
| $2,499 or less | 1 (0.9%) | 18 (16.7%) |
| $2,500 to $4,999 | 0 (0.0%) | 1 (0.9%) |
| $5,000 to $7,499 | 0 (0.0%) | 0 (0.0%) |
| $7,500 to $9,999 | 5 (4.6%) | 0 (0.0%) |
| $10,000 to $12,499 | 0 (0.0%) | 0 (0.0%) |
| $12,500 to $14,999 | 5 (4.6%) | 0 (0.0%) |
| $15,000 to $17,499 | 0 (0.0%) | 0 (0.0%) |
| $17,500 to $19,999 | 0 (0.0%) | 4 (3.7%) |
| $20,000 to $22,499 | 2 (1.8%) | 0 (0.0%) |
| $22,500 to $24,999 | 9 (8.3%) | 8 (7.4%) |
| $25,000 to $29,999 | 13 (11.9%) | 6 (5.6%) |
| $30,000 to $34,999 | 7 (6.4%) | 20 (18.5%) |
| $35,000 to $39,999 | 13 (11.9%) | 8 (7.4%) |
| $40,000 to $44,999 | 0 (0.0%) | 2 (1.8%) |
| $45,000 to $49,999 | 10 (9.2%) | 5 (4.6%) |
| $50,000 to $54,999 | 8 (7.3%) | 4 (3.7%) |
| $55,000 to $64,999 | 20 (18.3%) | 18 (16.7%) |
| $65,000 to $74,999 | 0 (0.0%) | 0 (0.0%) |
| $75,000 to $99,999 | 13 (11.9%) | 10 (9.3%) |
| $100,000+ | 3 (2.8%) | 4 (3.7%) |
| Total | 109 (100.0%) | 108 (100.0%) |
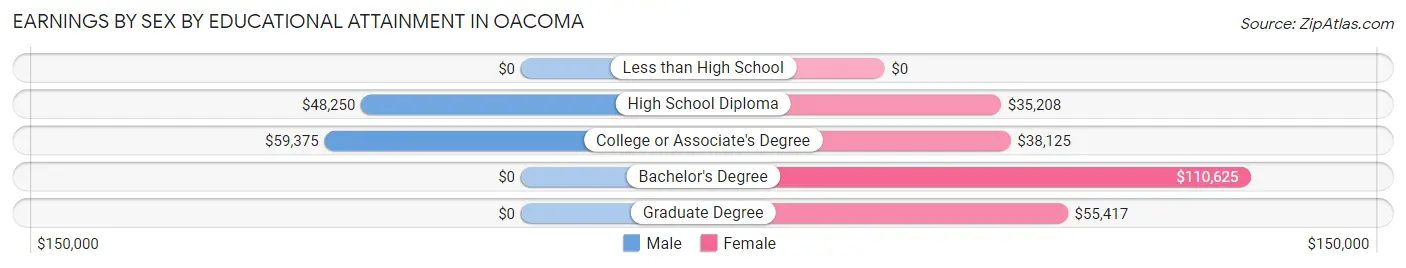
Earnings by Sex by Educational Attainment in Oacoma
Average earnings in Oacoma are $48,000 for men and $40,000 for women, a difference of 16.7%. Men with an educational attainment of college or associate's degree enjoy the highest average annual earnings of $59,375, while those with high school diploma education earn the least with $48,250. Women with an educational attainment of bachelor's degree earn the most with the average annual earnings of $110,625, while those with high school diploma education have the smallest earnings of $35,208.
| Educational Attainment | Male Income | Female Income |
| Less than High School | - | - |
| High School Diploma | $48,250 | $35,208 |
| College or Associate's Degree | $59,375 | $38,125 |
| Bachelor's Degree | - | - |
| Graduate Degree | - | - |
| Total | $48,000 | $40,000 |
Family Income in Oacoma
Family Income Brackets in Oacoma
According to the Oacoma family income data, there are 35 families falling into the $100,000 to $149,999 income range, which is the most common income bracket and makes up 31.5% of all families.
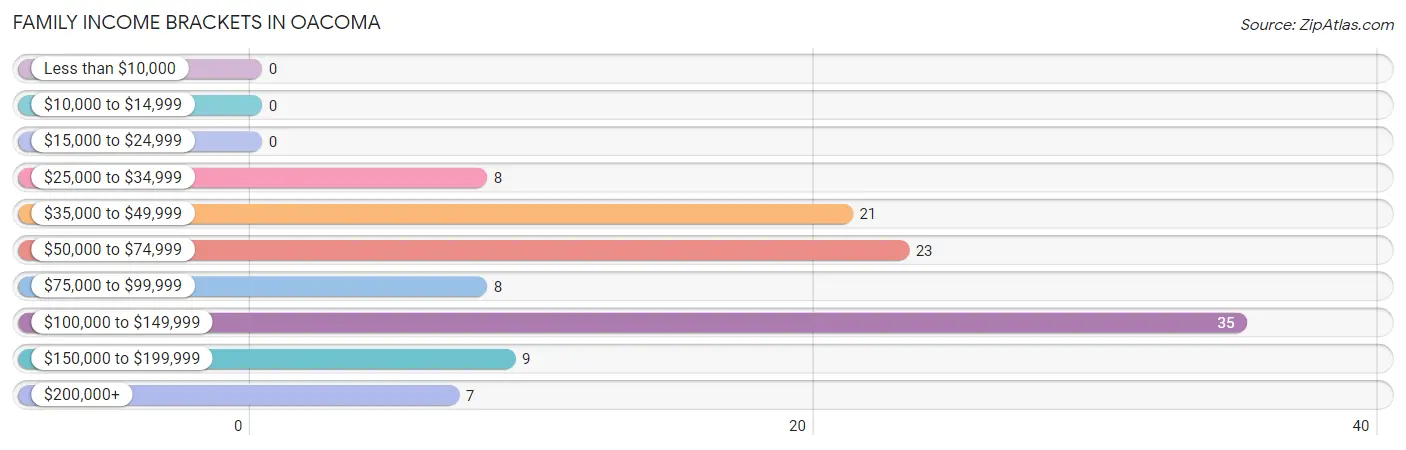
| Income Bracket | # Families | % Families |
| Less than $10,000 | 0 | 0.0% |
| $10,000 to $14,999 | 0 | 0.0% |
| $15,000 to $24,999 | 0 | 0.0% |
| $25,000 to $34,999 | 8 | 7.2% |
| $35,000 to $49,999 | 21 | 18.9% |
| $50,000 to $74,999 | 23 | 20.7% |
| $75,000 to $99,999 | 8 | 7.2% |
| $100,000 to $149,999 | 35 | 31.5% |
| $150,000 to $199,999 | 9 | 8.1% |
| $200,000+ | 7 | 6.3% |
Family Income by Famaliy Size in Oacoma
3-person families (11 | 9.9%) account for the highest median family income in Oacoma with $250,001 per family, while 3-person families (11 | 9.9%) have the highest median income of $83,334 per family member.
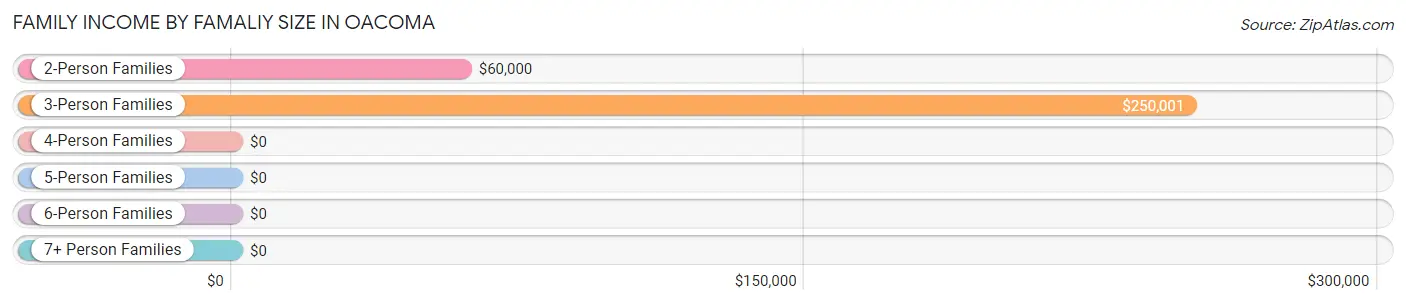
| Income Bracket | # Families | Median Income |
| 2-Person Families | 80 (72.1%) | $60,000 |
| 3-Person Families | 11 (9.9%) | $250,001 |
| 4-Person Families | 17 (15.3%) | $0 |
| 5-Person Families | 3 (2.7%) | $0 |
| 6-Person Families | 0 (0.0%) | $0 |
| 7+ Person Families | 0 (0.0%) | $0 |
| Total | 111 (100.0%) | $78,958 |
Family Income by Number of Earners in Oacoma
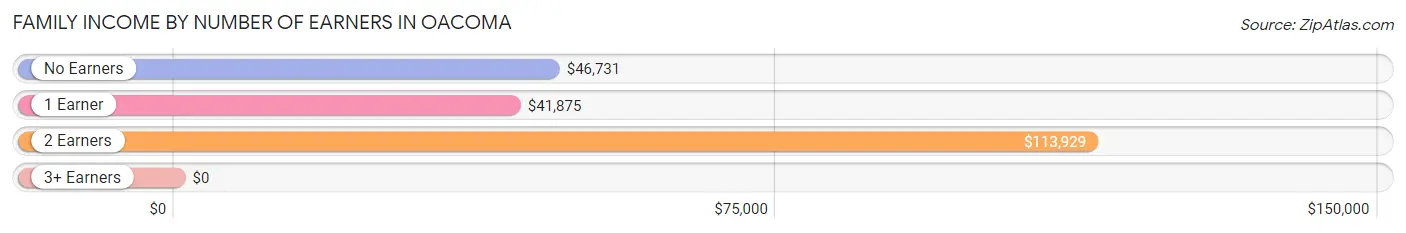
| Number of Earners | # Families | Median Income |
| No Earners | 26 (23.4%) | $46,731 |
| 1 Earner | 23 (20.7%) | $41,875 |
| 2 Earners | 48 (43.2%) | $113,929 |
| 3+ Earners | 14 (12.6%) | $0 |
| Total | 111 (100.0%) | $78,958 |
Household Income in Oacoma
Household Income Brackets in Oacoma
With 41 households falling in the category, the $100,000 to $149,999 income range is the most frequent in Oacoma, accounting for 20.2% of all households.
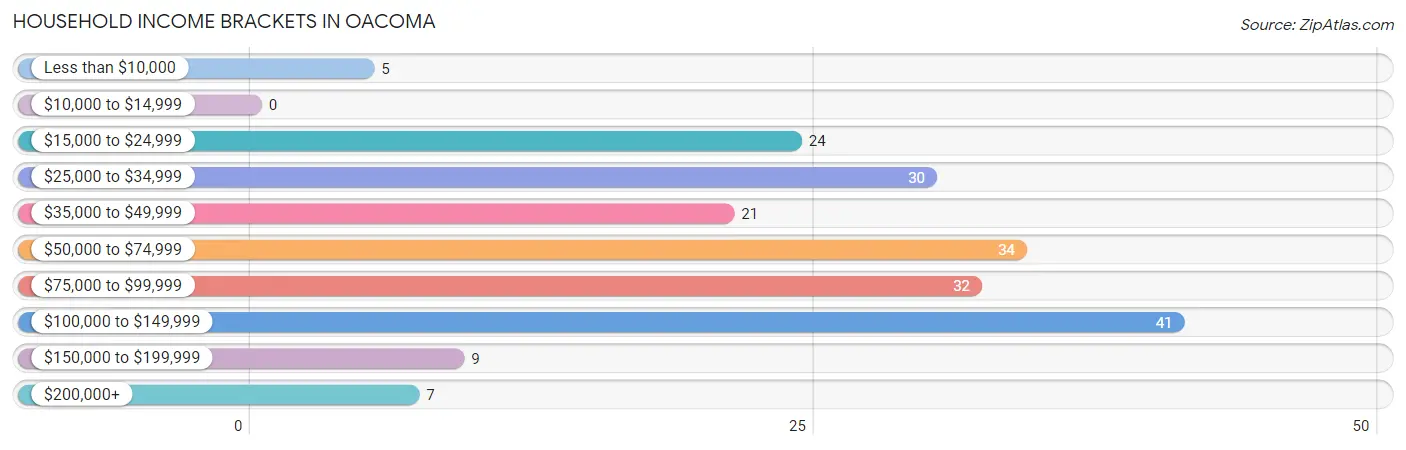
| Income Bracket | # Households | % Households |
| Less than $10,000 | 5 | 2.5% |
| $10,000 to $14,999 | 0 | 0.0% |
| $15,000 to $24,999 | 24 | 11.8% |
| $25,000 to $34,999 | 30 | 14.8% |
| $35,000 to $49,999 | 21 | 10.3% |
| $50,000 to $74,999 | 34 | 16.7% |
| $75,000 to $99,999 | 32 | 15.8% |
| $100,000 to $149,999 | 41 | 20.2% |
| $150,000 to $199,999 | 9 | 4.4% |
| $200,000+ | 7 | 3.4% |
Household Income by Householder Age in Oacoma
The median household income in Oacoma is $67,083, with the highest median household income of $90,625 found in the 45 to 64 years age bracket for the primary householder. A total of 77 households (37.9%) fall into this category. Meanwhile, the 15 to 24 years age bracket for the primary householder has the lowest median household income of $0, with 5 households (2.5%) in this group.
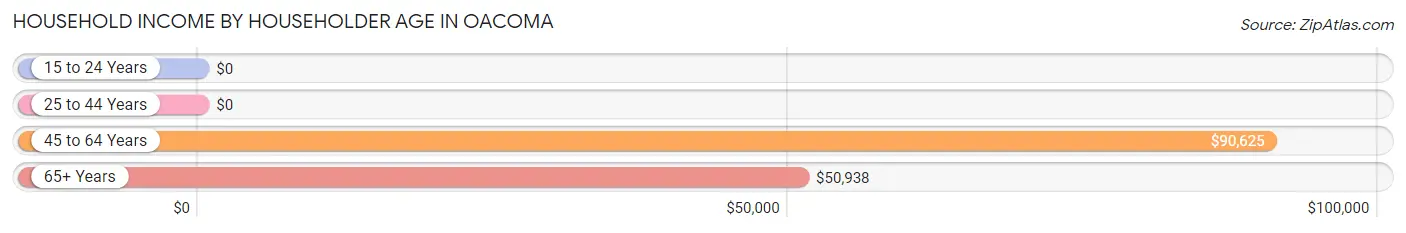
| Income Bracket | # Households | Median Income |
| 15 to 24 Years | 5 (2.5%) | $0 |
| 25 to 44 Years | 30 (14.8%) | $0 |
| 45 to 64 Years | 77 (37.9%) | $90,625 |
| 65+ Years | 91 (44.8%) | $50,938 |
| Total | 203 (100.0%) | $67,083 |
Poverty in Oacoma
Income Below Poverty by Sex and Age in Oacoma
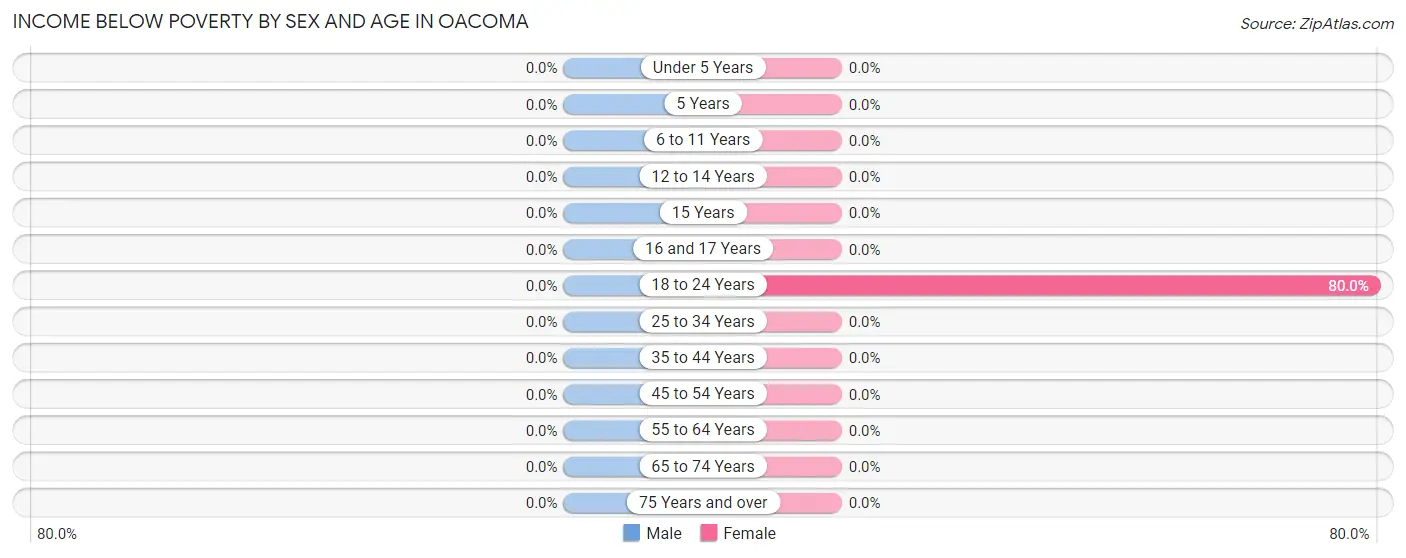
| Age Bracket | Male | Female |
| Under 5 Years | 0 (0.0%) | 0 (0.0%) |
| 5 Years | 0 (0.0%) | 0 (0.0%) |
| 6 to 11 Years | 0 (0.0%) | 0 (0.0%) |
| 12 to 14 Years | 0 (0.0%) | 0 (0.0%) |
| 15 Years | 0 (0.0%) | 0 (0.0%) |
| 16 and 17 Years | 0 (0.0%) | 0 (0.0%) |
| 18 to 24 Years | 0 (0.0%) | 16 (80.0%) |
| 25 to 34 Years | 0 (0.0%) | 0 (0.0%) |
| 35 to 44 Years | 0 (0.0%) | 0 (0.0%) |
| 45 to 54 Years | 0 (0.0%) | 0 (0.0%) |
| 55 to 64 Years | 0 (0.0%) | 0 (0.0%) |
| 65 to 74 Years | 0 (0.0%) | 0 (0.0%) |
| 75 Years and over | 0 (0.0%) | 0 (0.0%) |
| Total | 0 (0.0%) | 16 (8.8%) |
Income Above Poverty by Sex and Age in Oacoma
According to the poverty statistics in Oacoma, males aged 5 years and females aged under 5 years are the age groups that are most secure financially, with 100.0% of males and 100.0% of females in these age groups living above the poverty line.
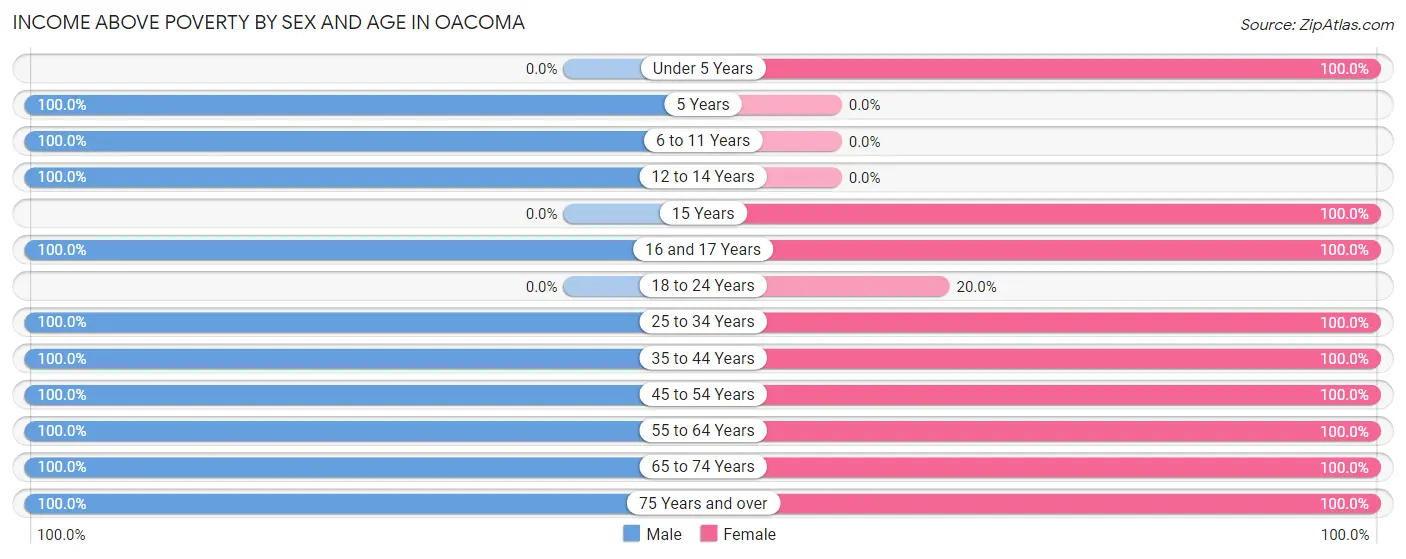
| Age Bracket | Male | Female |
| Under 5 Years | 0 (0.0%) | 19 (100.0%) |
| 5 Years | 14 (100.0%) | 0 (0.0%) |
| 6 to 11 Years | 16 (100.0%) | 0 (0.0%) |
| 12 to 14 Years | 8 (100.0%) | 0 (0.0%) |
| 15 Years | 0 (0.0%) | 6 (100.0%) |
| 16 and 17 Years | 5 (100.0%) | 6 (100.0%) |
| 18 to 24 Years | 0 (0.0%) | 4 (20.0%) |
| 25 to 34 Years | 14 (100.0%) | 12 (100.0%) |
| 35 to 44 Years | 19 (100.0%) | 11 (100.0%) |
| 45 to 54 Years | 19 (100.0%) | 21 (100.0%) |
| 55 to 64 Years | 40 (100.0%) | 60 (100.0%) |
| 65 to 74 Years | 66 (100.0%) | 21 (100.0%) |
| 75 Years and over | 24 (100.0%) | 5 (100.0%) |
| Total | 225 (100.0%) | 165 (91.2%) |
Income Below Poverty Among Married-Couple Families in Oacoma
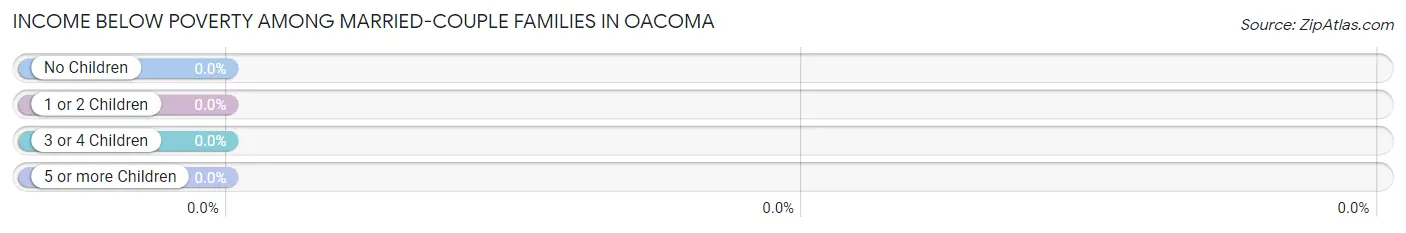
| Children | Above Poverty | Below Poverty |
| No Children | 69 (100.0%) | 0 (0.0%) |
| 1 or 2 Children | 23 (100.0%) | 0 (0.0%) |
| 3 or 4 Children | 3 (100.0%) | 0 (0.0%) |
| 5 or more Children | 0 (0.0%) | 0 (0.0%) |
| Total | 95 (100.0%) | 0 (0.0%) |
Income Below Poverty Among Single-Parent Households in Oacoma
| Children | Single Father | Single Mother |
| No Children | 0 (0.0%) | 0 (0.0%) |
| 1 or 2 Children | 0 (0.0%) | 0 (0.0%) |
| 3 or 4 Children | 0 (0.0%) | 0 (0.0%) |
| 5 or more Children | 0 (0.0%) | 0 (0.0%) |
| Total | 0 (0.0%) | 0 (0.0%) |
Income Below Poverty Among Married-Couple vs Single-Parent Households in Oacoma
| Children | Married-Couple Families | Single-Parent Households |
| No Children | 0 (0.0%) | 0 (0.0%) |
| 1 or 2 Children | 0 (0.0%) | 0 (0.0%) |
| 3 or 4 Children | 0 (0.0%) | 0 (0.0%) |
| 5 or more Children | 0 (0.0%) | 0 (0.0%) |
| Total | 0 (0.0%) | 0 (0.0%) |
Race in Oacoma
The most populous races in Oacoma are White / Caucasian (371 | 91.4%), Native / Alaskan (19 | 4.7%), and Hispanic or Latino (16 | 3.9%).
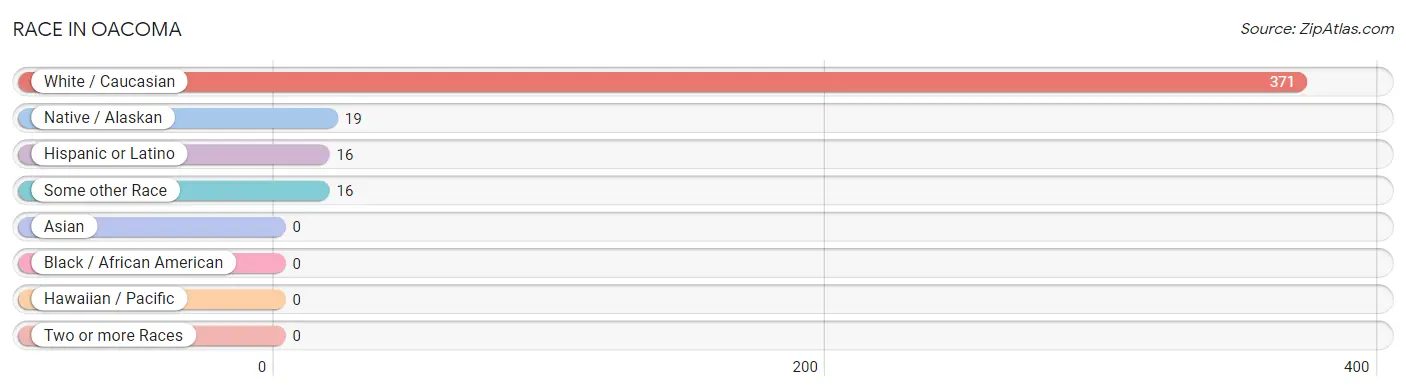
| Race | # Population | % Population |
| Asian | 0 | 0.0% |
| Black / African American | 0 | 0.0% |
| Hawaiian / Pacific | 0 | 0.0% |
| Hispanic or Latino | 16 | 3.9% |
| Native / Alaskan | 19 | 4.7% |
| White / Caucasian | 371 | 91.4% |
| Two or more Races | 0 | 0.0% |
| Some other Race | 16 | 3.9% |
| Total | 406 | 100.0% |
Ancestry in Oacoma
The most populous ancestries reported in Oacoma are German (119 | 29.3%), Irish (61 | 15.0%), American (48 | 11.8%), Norwegian (28 | 6.9%), and English (26 | 6.4%), together accounting for 69.5% of all Oacoma residents.
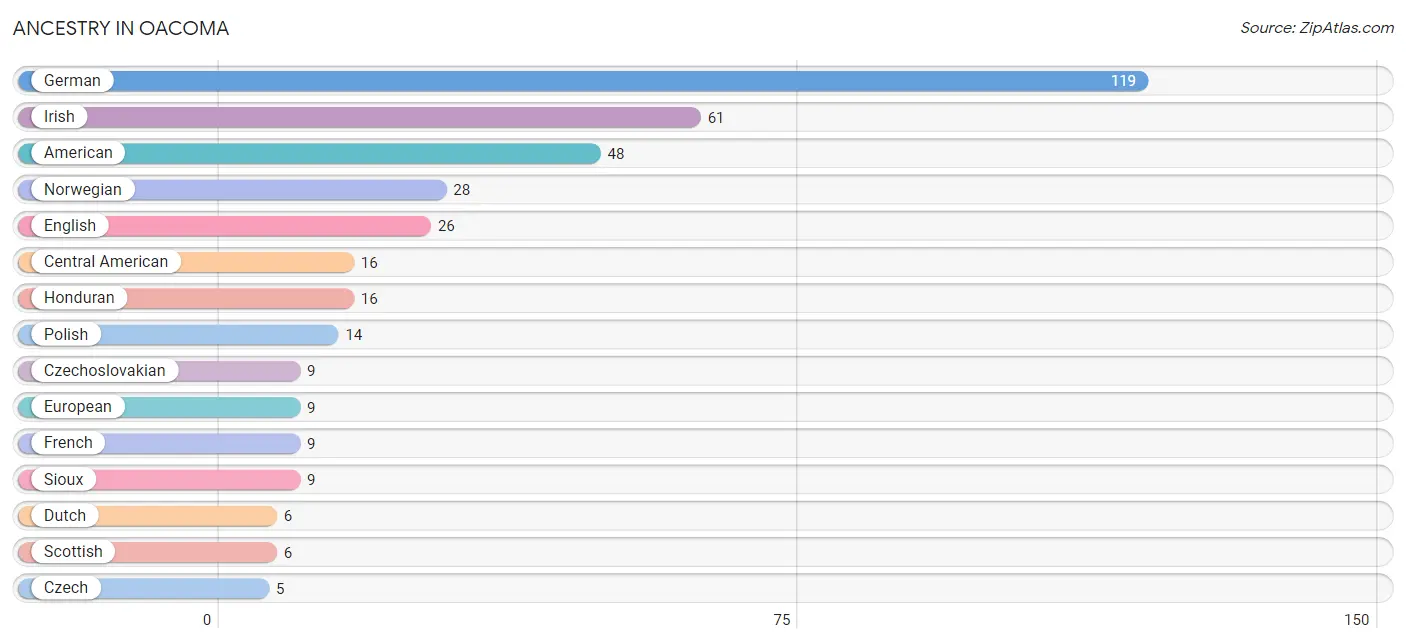
| Ancestry | # Population | % Population |
| American | 48 | 11.8% |
| Central American | 16 | 3.9% |
| Cheyenne | 4 | 1.0% |
| Czech | 5 | 1.2% |
| Czechoslovakian | 9 | 2.2% |
| Danish | 3 | 0.7% |
| Dutch | 6 | 1.5% |
| English | 26 | 6.4% |
| European | 9 | 2.2% |
| French | 9 | 2.2% |
| French Canadian | 5 | 1.2% |
| German | 119 | 29.3% |
| Honduran | 16 | 3.9% |
| Irish | 61 | 15.0% |
| Norwegian | 28 | 6.9% |
| Polish | 14 | 3.5% |
| Russian | 5 | 1.2% |
| Scottish | 6 | 1.5% |
| Sioux | 9 | 2.2% |
| Swiss | 3 | 0.7% |
| Yugoslavian | 4 | 1.0% | View All 21 Rows |
Immigrants in Oacoma
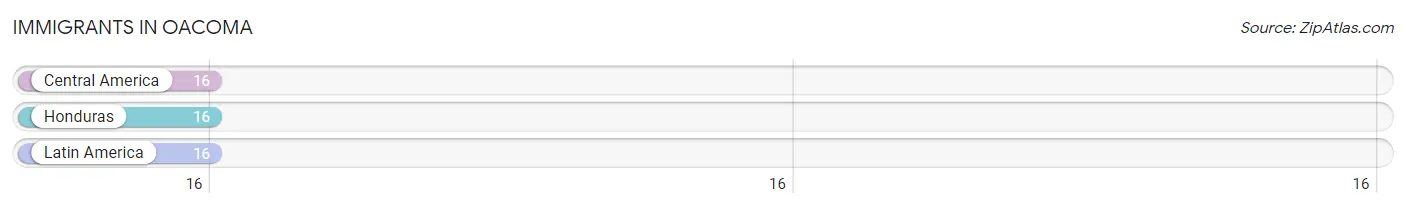
The most numerous immigrant groups reported in Oacoma came from Central America (16 | 3.9%), Honduras (16 | 3.9%), and Latin America (16 | 3.9%), together accounting for 11.8% of all Oacoma residents.
| Immigration Origin | # Population | % Population |
| Central America | 16 | 3.9% |
| Honduras | 16 | 3.9% |
| Latin America | 16 | 3.9% | View All 3 Rows |
Sex and Age in Oacoma
Sex and Age in Oacoma
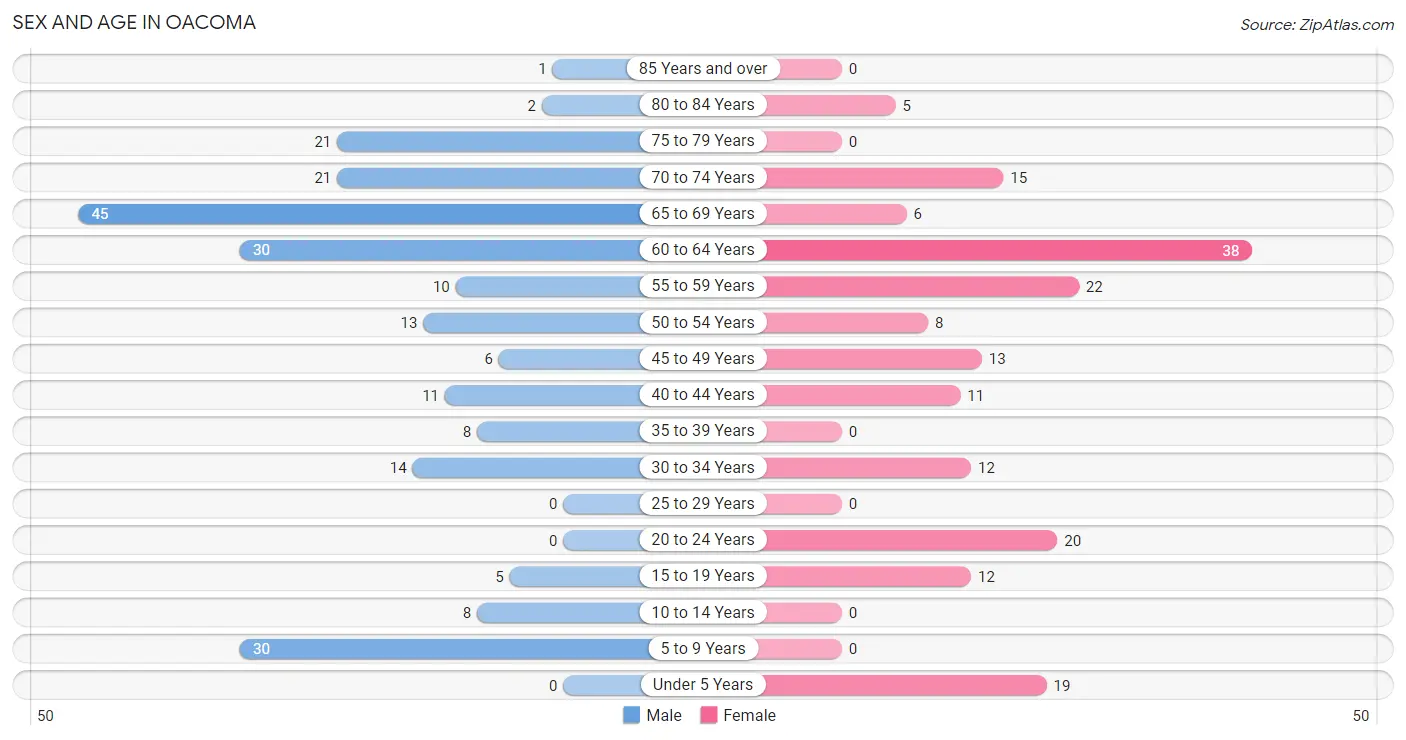
The most populous age groups in Oacoma are 65 to 69 Years (45 | 20.0%) for men and 60 to 64 Years (38 | 21.0%) for women.
| Age Bracket | Male | Female |
| Under 5 Years | 0 (0.0%) | 19 (10.5%) |
| 5 to 9 Years | 30 (13.3%) | 0 (0.0%) |
| 10 to 14 Years | 8 (3.6%) | 0 (0.0%) |
| 15 to 19 Years | 5 (2.2%) | 12 (6.6%) |
| 20 to 24 Years | 0 (0.0%) | 20 (11.1%) |
| 25 to 29 Years | 0 (0.0%) | 0 (0.0%) |
| 30 to 34 Years | 14 (6.2%) | 12 (6.6%) |
| 35 to 39 Years | 8 (3.6%) | 0 (0.0%) |
| 40 to 44 Years | 11 (4.9%) | 11 (6.1%) |
| 45 to 49 Years | 6 (2.7%) | 13 (7.2%) |
| 50 to 54 Years | 13 (5.8%) | 8 (4.4%) |
| 55 to 59 Years | 10 (4.4%) | 22 (12.1%) |
| 60 to 64 Years | 30 (13.3%) | 38 (21.0%) |
| 65 to 69 Years | 45 (20.0%) | 6 (3.3%) |
| 70 to 74 Years | 21 (9.3%) | 15 (8.3%) |
| 75 to 79 Years | 21 (9.3%) | 0 (0.0%) |
| 80 to 84 Years | 2 (0.9%) | 5 (2.8%) |
| 85 Years and over | 1 (0.4%) | 0 (0.0%) |
| Total | 225 (100.0%) | 181 (100.0%) |
Families and Households in Oacoma
Median Family Size in Oacoma
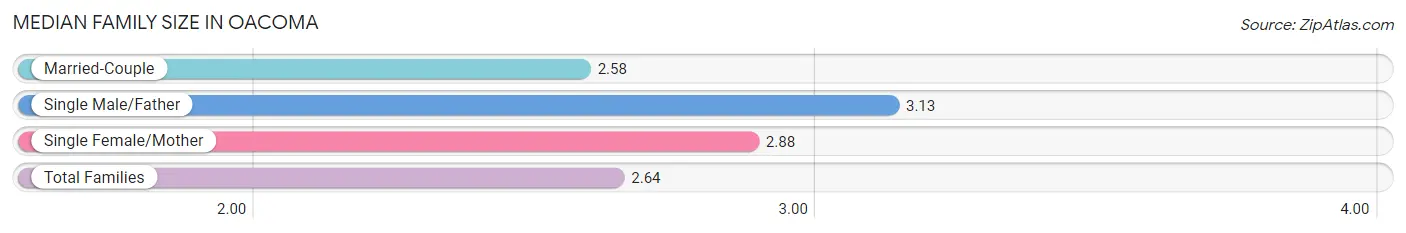
The median family size in Oacoma is 2.64 persons per family, with single male/father families (8 | 7.2%) accounting for the largest median family size of 3.13 persons per family. On the other hand, married-couple families (95 | 85.6%) represent the smallest median family size with 2.58 persons per family.
| Family Type | # Families | Family Size |
| Married-Couple | 95 (85.6%) | 2.58 |
| Single Male/Father | 8 (7.2%) | 3.13 |
| Single Female/Mother | 8 (7.2%) | 2.88 |
| Total Families | 111 (100.0%) | 2.64 |
Median Household Size in Oacoma
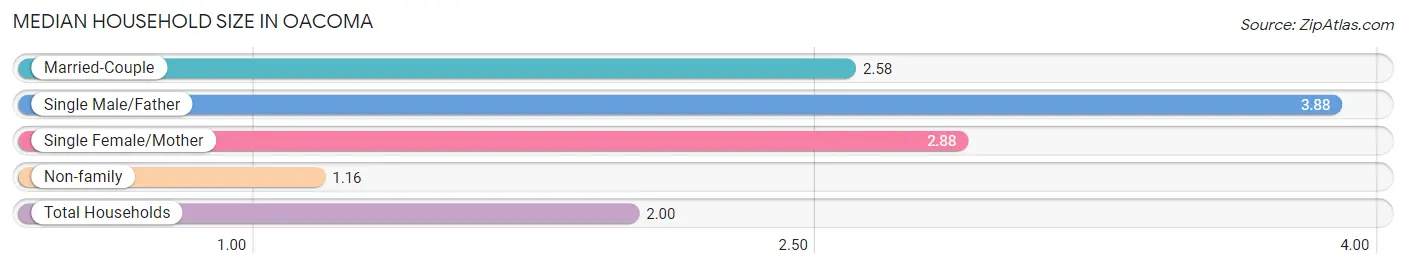
The median household size in Oacoma is 2.00 persons per household, with single male/father households (8 | 3.9%) accounting for the largest median household size of 3.88 persons per household. non-family households (92 | 45.3%) represent the smallest median household size with 1.16 persons per household.
| Household Type | # Households | Household Size |
| Married-Couple | 95 (46.8%) | 2.58 |
| Single Male/Father | 8 (3.9%) | 3.88 |
| Single Female/Mother | 8 (3.9%) | 2.88 |
| Non-family | 92 (45.3%) | 1.16 |
| Total Households | 203 (100.0%) | 2.00 |
Household Size by Marriage Status in Oacoma
Out of a total of 203 households in Oacoma, 111 (54.7%) are family households, while 92 (45.3%) are nonfamily households. The most numerous type of family households are 2-person households, comprising 79, and the most common type of nonfamily households are 1-person households, comprising 85.
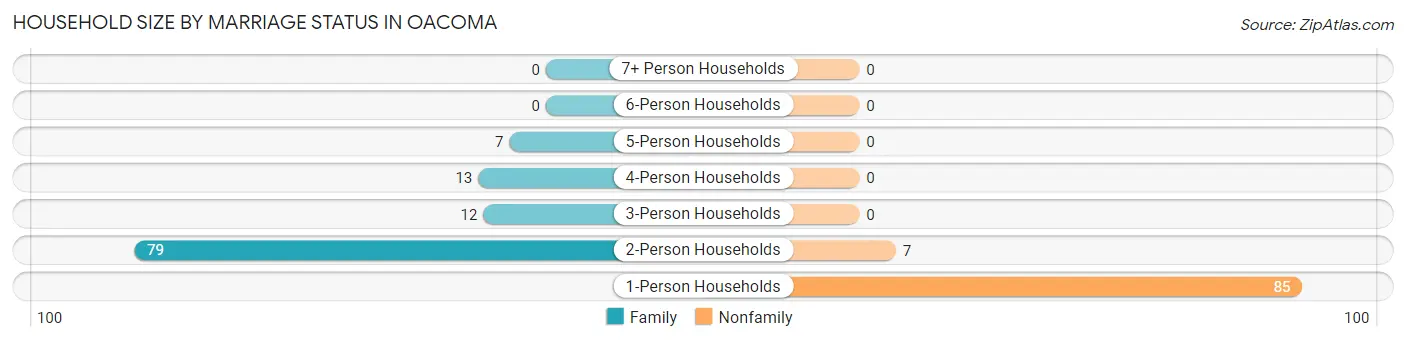
| Household Size | Family Households | Nonfamily Households |
| 1-Person Households | - | 85 (41.9%) |
| 2-Person Households | 79 (38.9%) | 7 (3.5%) |
| 3-Person Households | 12 (5.9%) | 0 (0.0%) |
| 4-Person Households | 13 (6.4%) | 0 (0.0%) |
| 5-Person Households | 7 (3.5%) | 0 (0.0%) |
| 6-Person Households | 0 (0.0%) | 0 (0.0%) |
| 7+ Person Households | 0 (0.0%) | 0 (0.0%) |
| Total | 111 (54.7%) | 92 (45.3%) |
Female Fertility in Oacoma
Fertility by Age in Oacoma
Average fertility rate in Oacoma is 59.0 births per 1,000 women. Women in the age bracket of 20 to 34 years have the highest fertility rate with 125.0 births per 1,000 women. Women in the age bracket of 20 to 34 years acount for 100.0% of all women with births.
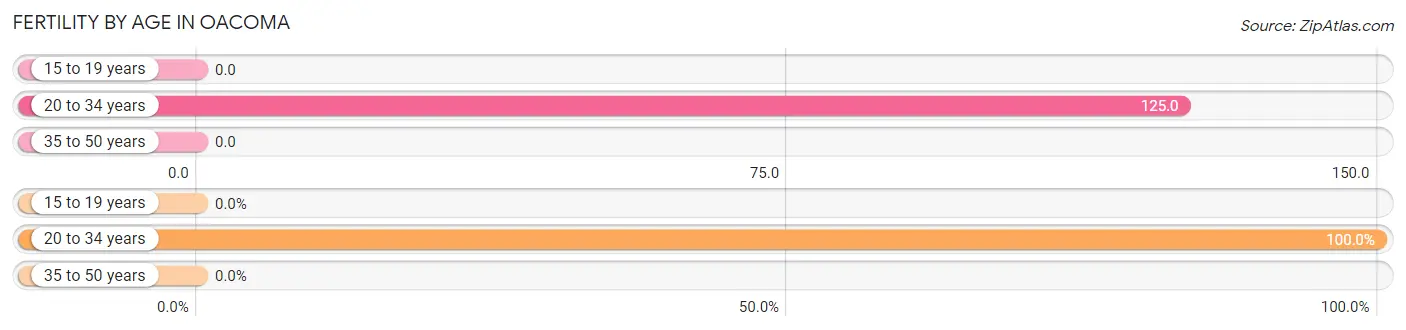
| Age Bracket | Women with Births | Births / 1,000 Women |
| 15 to 19 years | 0 (0.0%) | 0.0 |
| 20 to 34 years | 4 (100.0%) | 125.0 |
| 35 to 50 years | 0 (0.0%) | 0.0 |
| Total | 4 (100.0%) | 59.0 |
Fertility by Age by Marriage Status in Oacoma
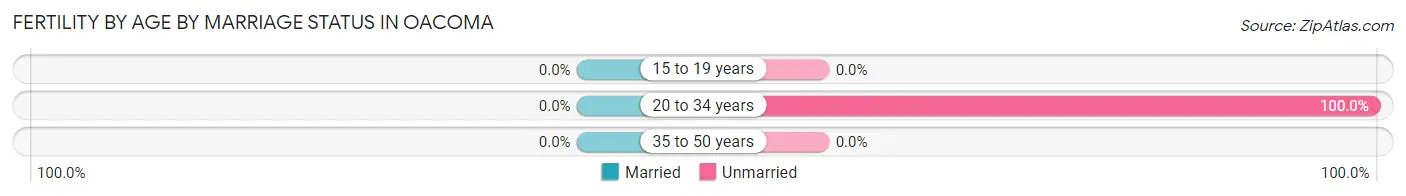
| Age Bracket | Married | Unmarried |
| 15 to 19 years | 0 (0.0%) | 0 (0.0%) |
| 20 to 34 years | 0 (0.0%) | 4 (100.0%) |
| 35 to 50 years | 0 (0.0%) | 0 (0.0%) |
| Total | 0 (0.0%) | 4 (100.0%) |
Fertility by Education in Oacoma
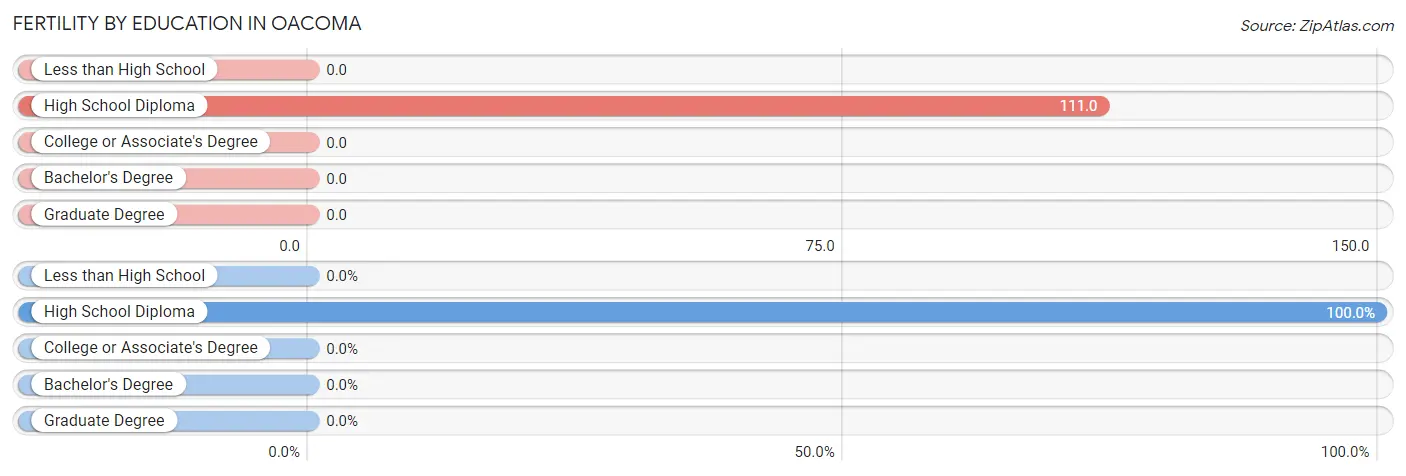
| Educational Attainment | Women with Births | Births / 1,000 Women |
| Less than High School | 0 (0.0%) | 0.0 |
| High School Diploma | 4 (100.0%) | 111.0 |
| College or Associate's Degree | 0 (0.0%) | 0.0 |
| Bachelor's Degree | 0 (0.0%) | 0.0 |
| Graduate Degree | 0 (0.0%) | 0.0 |
| Total | 4 (100.0%) | 59.0 |
Fertility by Education by Marriage Status in Oacoma
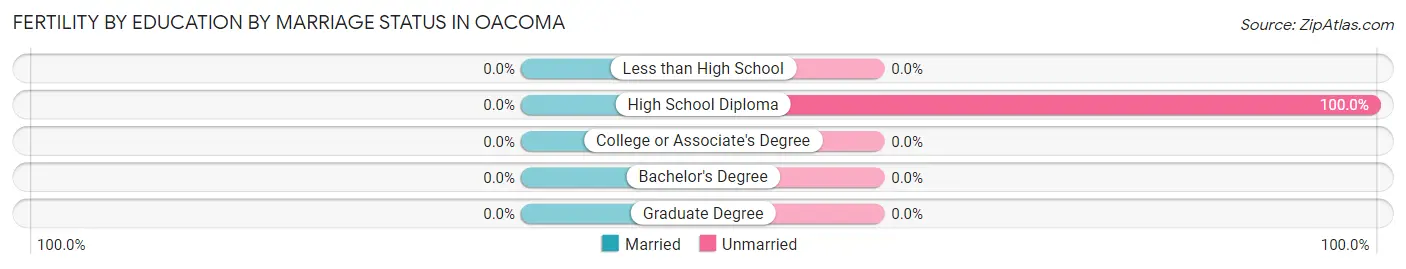
| Educational Attainment | Married | Unmarried |
| Less than High School | 0 (0.0%) | 0 (0.0%) |
| High School Diploma | 0 (0.0%) | 4 (100.0%) |
| College or Associate's Degree | 0 (0.0%) | 0 (0.0%) |
| Bachelor's Degree | 0 (0.0%) | 0 (0.0%) |
| Graduate Degree | 0 (0.0%) | 0 (0.0%) |
| Total | 0 (0.0%) | 4 (100.0%) |
Employment Characteristics in Oacoma
Employment by Class of Employer in Oacoma
Among the 201 employed individuals in Oacoma, private company employees (88 | 43.8%), not-for-profit organizations (48 | 23.9%), and self-employed (not incorporated) (24 | 11.9%) make up the most common classes of employment.
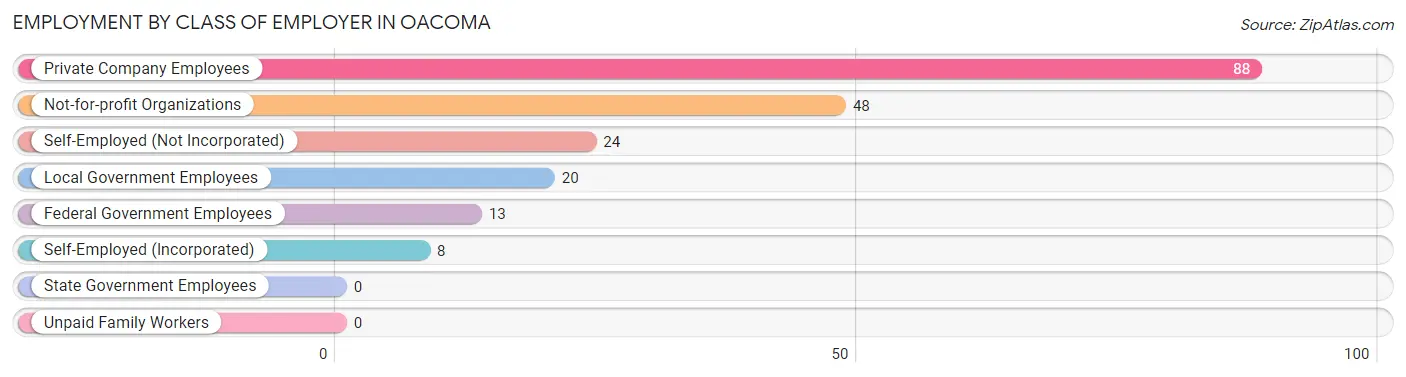
| Employer Class | # Employees | % Employees |
| Private Company Employees | 88 | 43.8% |
| Self-Employed (Incorporated) | 8 | 4.0% |
| Self-Employed (Not Incorporated) | 24 | 11.9% |
| Not-for-profit Organizations | 48 | 23.9% |
| Local Government Employees | 20 | 10.0% |
| State Government Employees | 0 | 0.0% |
| Federal Government Employees | 13 | 6.5% |
| Unpaid Family Workers | 0 | 0.0% |
| Total | 201 | 100.0% |
Employment Status by Age in Oacoma
According to the labor force statistics for Oacoma, out of the total population over 16 years of age (343), 64.7% or 222 individuals are in the labor force, with 5.9% or 13 of them unemployed. The age group with the highest labor force participation rate is 20 to 24 years, with 100.0% or 20 individuals in the labor force. Within the labor force, the 55 to 59 years age range has the highest percentage of unemployed individuals, with 30.0% or 9 of them being unemployed.
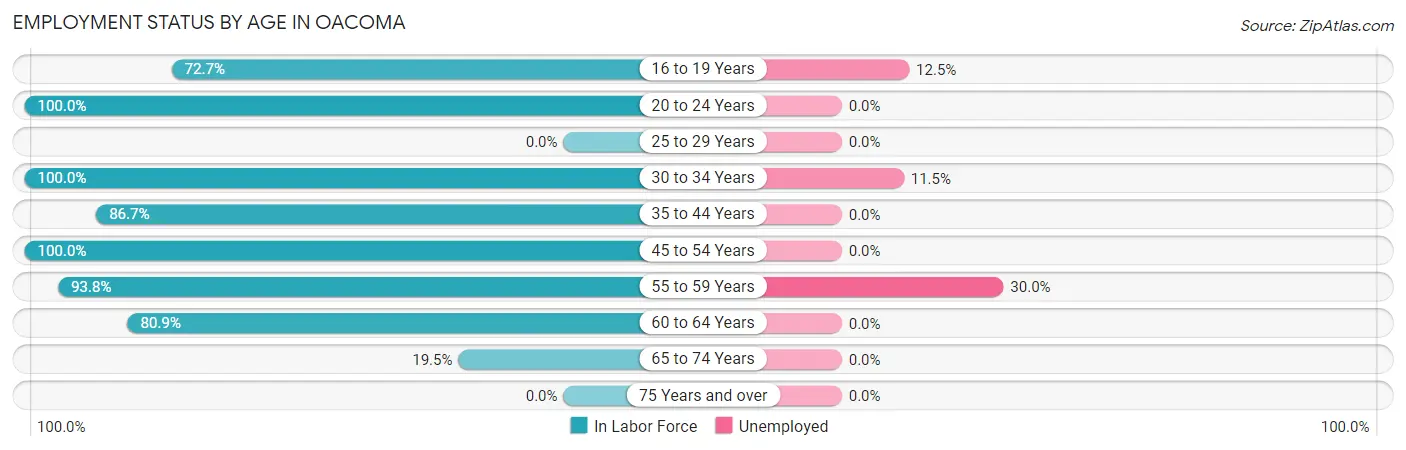
| Age Bracket | In Labor Force | Unemployed |
| 16 to 19 Years | 8 (72.7%) | 1 (12.5%) |
| 20 to 24 Years | 20 (100.0%) | 0 (0.0%) |
| 25 to 29 Years | 0 (0.0%) | 0 (0.0%) |
| 30 to 34 Years | 26 (100.0%) | 3 (11.5%) |
| 35 to 44 Years | 26 (86.7%) | 0 (0.0%) |
| 45 to 54 Years | 40 (100.0%) | 0 (0.0%) |
| 55 to 59 Years | 30 (93.8%) | 9 (30.0%) |
| 60 to 64 Years | 55 (80.9%) | 0 (0.0%) |
| 65 to 74 Years | 17 (19.5%) | 0 (0.0%) |
| 75 Years and over | 0 (0.0%) | 0 (0.0%) |
| Total | 222 (64.7%) | 13 (5.9%) |
Employment Status by Educational Attainment in Oacoma
According to labor force statistics for Oacoma, 90.3% of individuals (177) out of the total population between 25 and 64 years of age (196) are in the labor force, with 6.9% or 12 of them being unemployed. The group with the highest labor force participation rate are those with the educational attainment of bachelor's degree or higher, with 100.0% or 37 individuals in the labor force. Within the labor force, individuals with less than high school education have the highest percentage of unemployment, with 69.2% or 9 of them being unemployed.
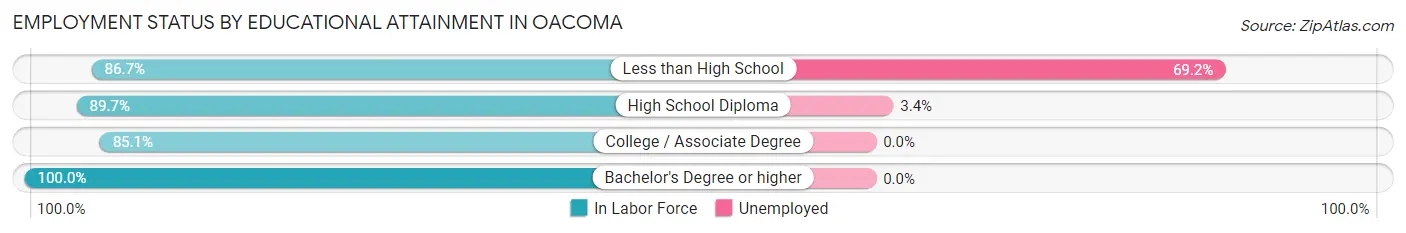
| Educational Attainment | In Labor Force | Unemployed |
| Less than High School | 13 (86.7%) | 10 (69.2%) |
| High School Diploma | 87 (89.7%) | 3 (3.4%) |
| College / Associate Degree | 40 (85.1%) | 0 (0.0%) |
| Bachelor's Degree or higher | 37 (100.0%) | 0 (0.0%) |
| Total | 177 (90.3%) | 14 (6.9%) |
Employment Occupations by Sex in Oacoma
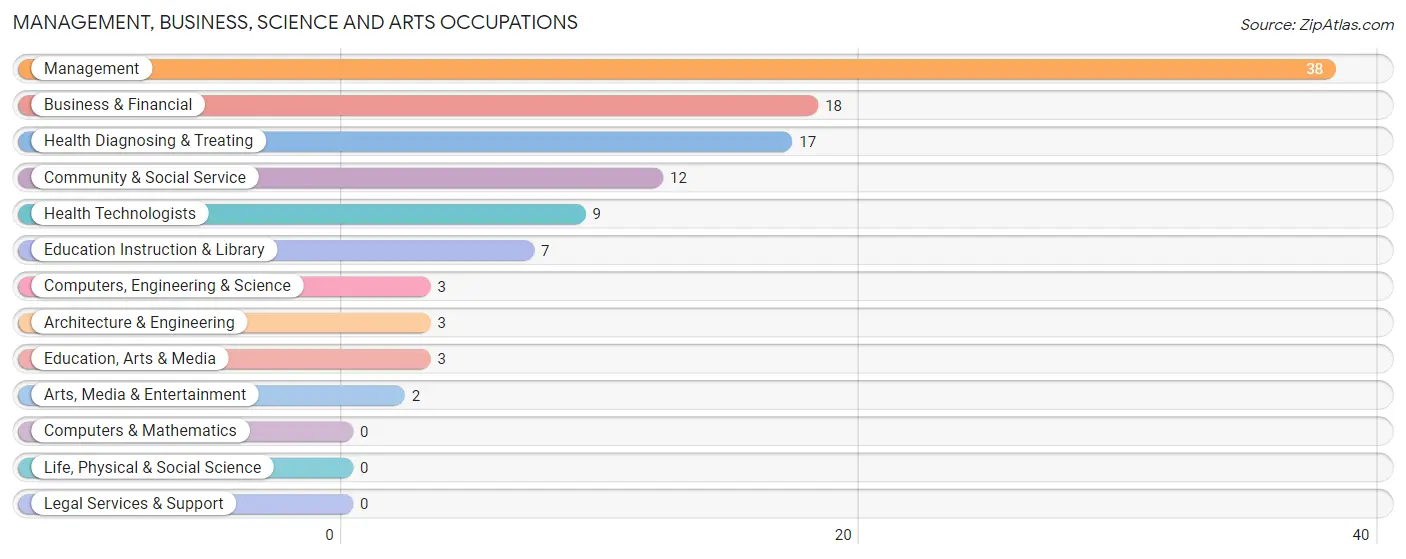
Management, Business, Science and Arts Occupations
The most common Management, Business, Science and Arts occupations in Oacoma are Management (38 | 18.4%), Business & Financial (18 | 8.7%), Health Diagnosing & Treating (17 | 8.2%), Community & Social Service (12 | 5.8%), and Health Technologists (9 | 4.3%).
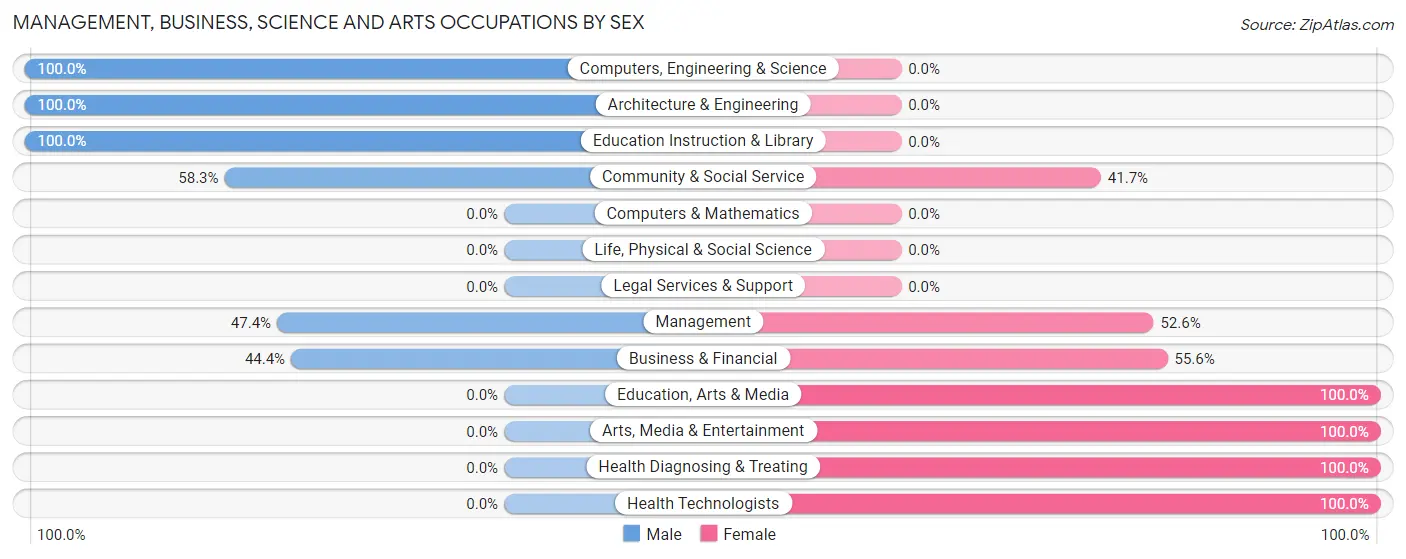
Management, Business, Science and Arts Occupations by Sex
Within the Management, Business, Science and Arts occupations in Oacoma, the most male-oriented occupations are Computers, Engineering & Science (100.0%), Architecture & Engineering (100.0%), and Education Instruction & Library (100.0%), while the most female-oriented occupations are Education, Arts & Media (100.0%), Arts, Media & Entertainment (100.0%), and Health Diagnosing & Treating (100.0%).
| Occupation | Male | Female |
| Management | 18 (47.4%) | 20 (52.6%) |
| Business & Financial | 8 (44.4%) | 10 (55.6%) |
| Computers, Engineering & Science | 3 (100.0%) | 0 (0.0%) |
| Computers & Mathematics | 0 (0.0%) | 0 (0.0%) |
| Architecture & Engineering | 3 (100.0%) | 0 (0.0%) |
| Life, Physical & Social Science | 0 (0.0%) | 0 (0.0%) |
| Community & Social Service | 7 (58.3%) | 5 (41.7%) |
| Education, Arts & Media | 0 (0.0%) | 3 (100.0%) |
| Legal Services & Support | 0 (0.0%) | 0 (0.0%) |
| Education Instruction & Library | 7 (100.0%) | 0 (0.0%) |
| Arts, Media & Entertainment | 0 (0.0%) | 2 (100.0%) |
| Health Diagnosing & Treating | 0 (0.0%) | 17 (100.0%) |
| Health Technologists | 0 (0.0%) | 9 (100.0%) |
| Total (Category) | 36 (40.9%) | 52 (59.1%) |
| Total (Overall) | 99 (47.8%) | 108 (52.2%) |
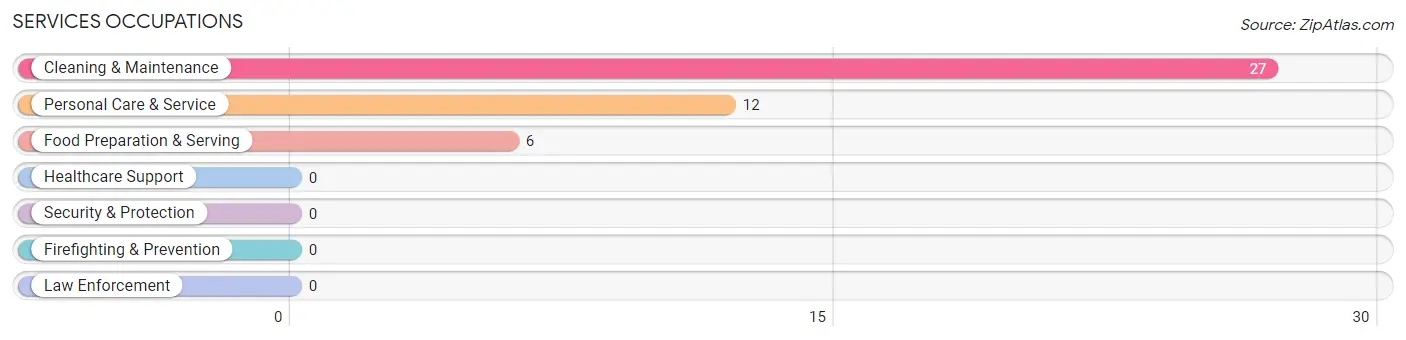
Services Occupations
The most common Services occupations in Oacoma are Cleaning & Maintenance (27 | 13.0%), Personal Care & Service (12 | 5.8%), and Food Preparation & Serving (6 | 2.9%).
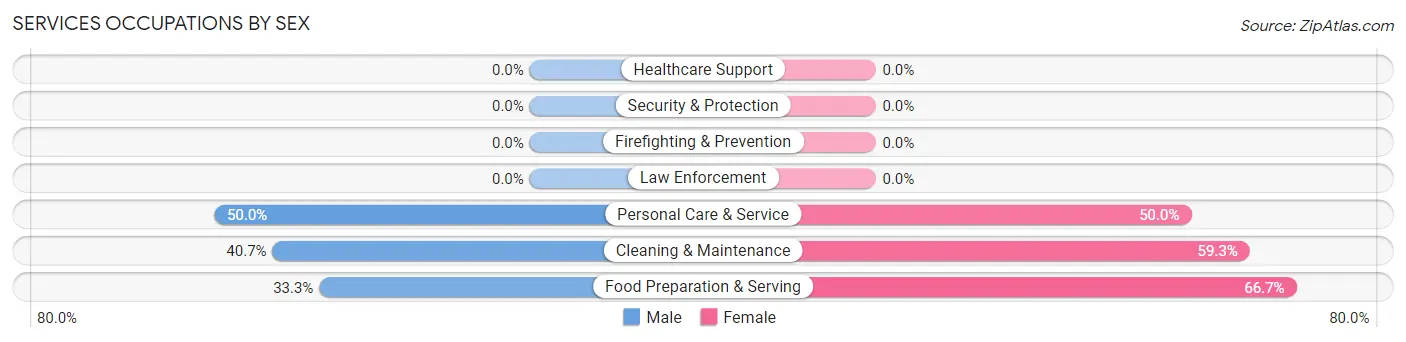
Services Occupations by Sex
Within the Services occupations in Oacoma, the most male-oriented occupations are Personal Care & Service (50.0%), Cleaning & Maintenance (40.7%), and Food Preparation & Serving (33.3%), while the most female-oriented occupations are Food Preparation & Serving (66.7%), Cleaning & Maintenance (59.3%), and Personal Care & Service (50.0%).
| Occupation | Male | Female |
| Healthcare Support | 0 (0.0%) | 0 (0.0%) |
| Security & Protection | 0 (0.0%) | 0 (0.0%) |
| Firefighting & Prevention | 0 (0.0%) | 0 (0.0%) |
| Law Enforcement | 0 (0.0%) | 0 (0.0%) |
| Food Preparation & Serving | 2 (33.3%) | 4 (66.7%) |
| Cleaning & Maintenance | 11 (40.7%) | 16 (59.3%) |
| Personal Care & Service | 6 (50.0%) | 6 (50.0%) |
| Total (Category) | 19 (42.2%) | 26 (57.8%) |
| Total (Overall) | 99 (47.8%) | 108 (52.2%) |
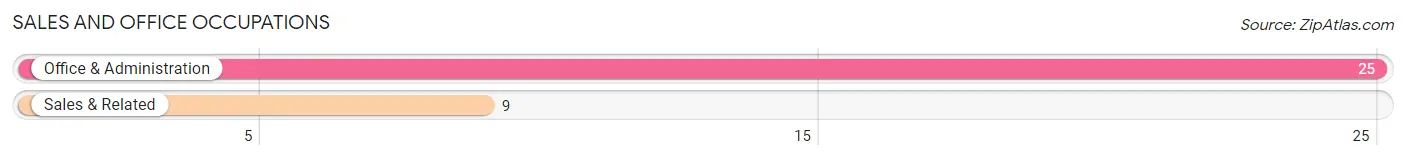
Sales and Office Occupations
The most common Sales and Office occupations in Oacoma are Office & Administration (25 | 12.1%), and Sales & Related (9 | 4.3%).
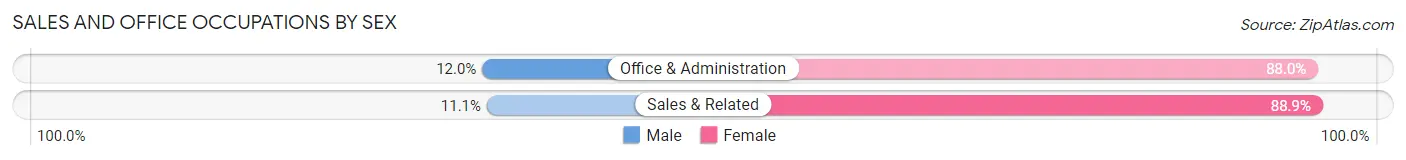
Sales and Office Occupations by Sex
| Occupation | Male | Female |
| Sales & Related | 1 (11.1%) | 8 (88.9%) |
| Office & Administration | 3 (12.0%) | 22 (88.0%) |
| Total (Category) | 4 (11.8%) | 30 (88.2%) |
| Total (Overall) | 99 (47.8%) | 108 (52.2%) |
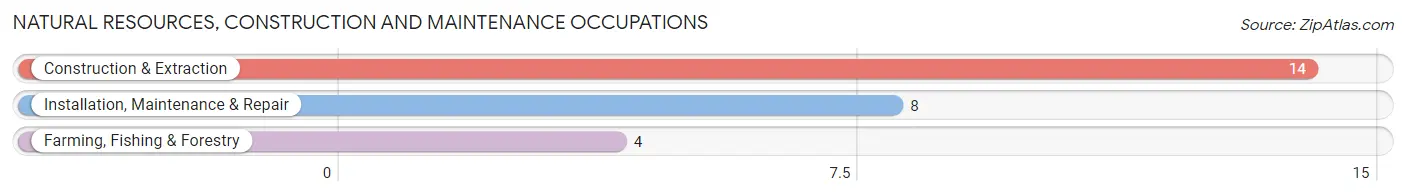
Natural Resources, Construction and Maintenance Occupations
The most common Natural Resources, Construction and Maintenance occupations in Oacoma are Construction & Extraction (14 | 6.8%), Installation, Maintenance & Repair (8 | 3.9%), and Farming, Fishing & Forestry (4 | 1.9%).
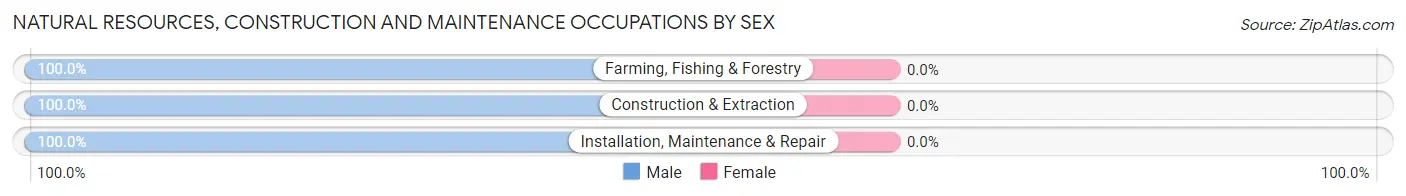
Natural Resources, Construction and Maintenance Occupations by Sex
| Occupation | Male | Female |
| Farming, Fishing & Forestry | 4 (100.0%) | 0 (0.0%) |
| Construction & Extraction | 14 (100.0%) | 0 (0.0%) |
| Installation, Maintenance & Repair | 8 (100.0%) | 0 (0.0%) |
| Total (Category) | 26 (100.0%) | 0 (0.0%) |
| Total (Overall) | 99 (47.8%) | 108 (52.2%) |
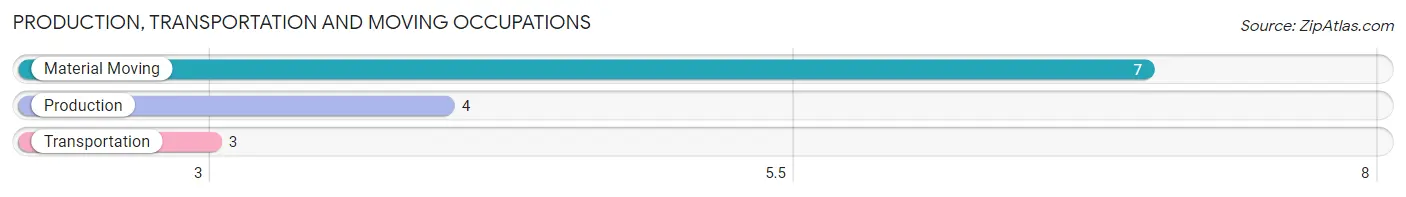
Production, Transportation and Moving Occupations
The most common Production, Transportation and Moving occupations in Oacoma are Material Moving (7 | 3.4%), Production (4 | 1.9%), and Transportation (3 | 1.5%).
Production, Transportation and Moving Occupations by Sex
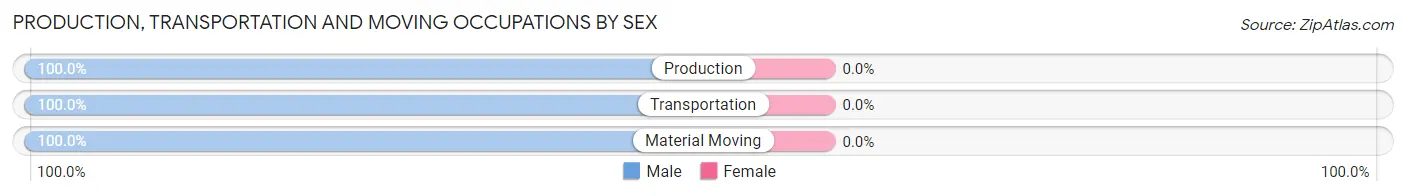
| Occupation | Male | Female |
| Production | 4 (100.0%) | 0 (0.0%) |
| Transportation | 3 (100.0%) | 0 (0.0%) |
| Material Moving | 7 (100.0%) | 0 (0.0%) |
| Total (Category) | 14 (100.0%) | 0 (0.0%) |
| Total (Overall) | 99 (47.8%) | 108 (52.2%) |
Employment Industries by Sex in Oacoma
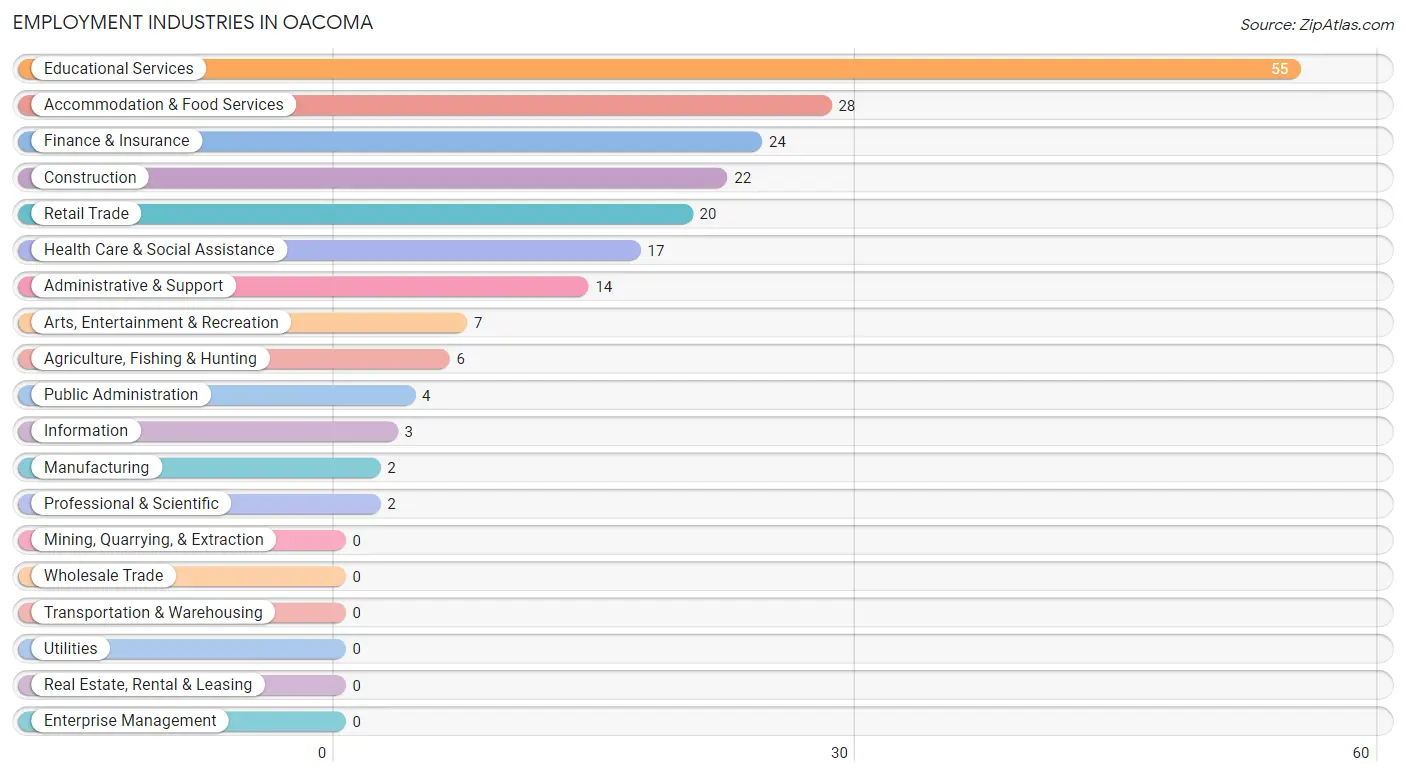
Employment Industries in Oacoma
The major employment industries in Oacoma include Educational Services (55 | 26.6%), Accommodation & Food Services (28 | 13.5%), Finance & Insurance (24 | 11.6%), Construction (22 | 10.6%), and Retail Trade (20 | 9.7%).
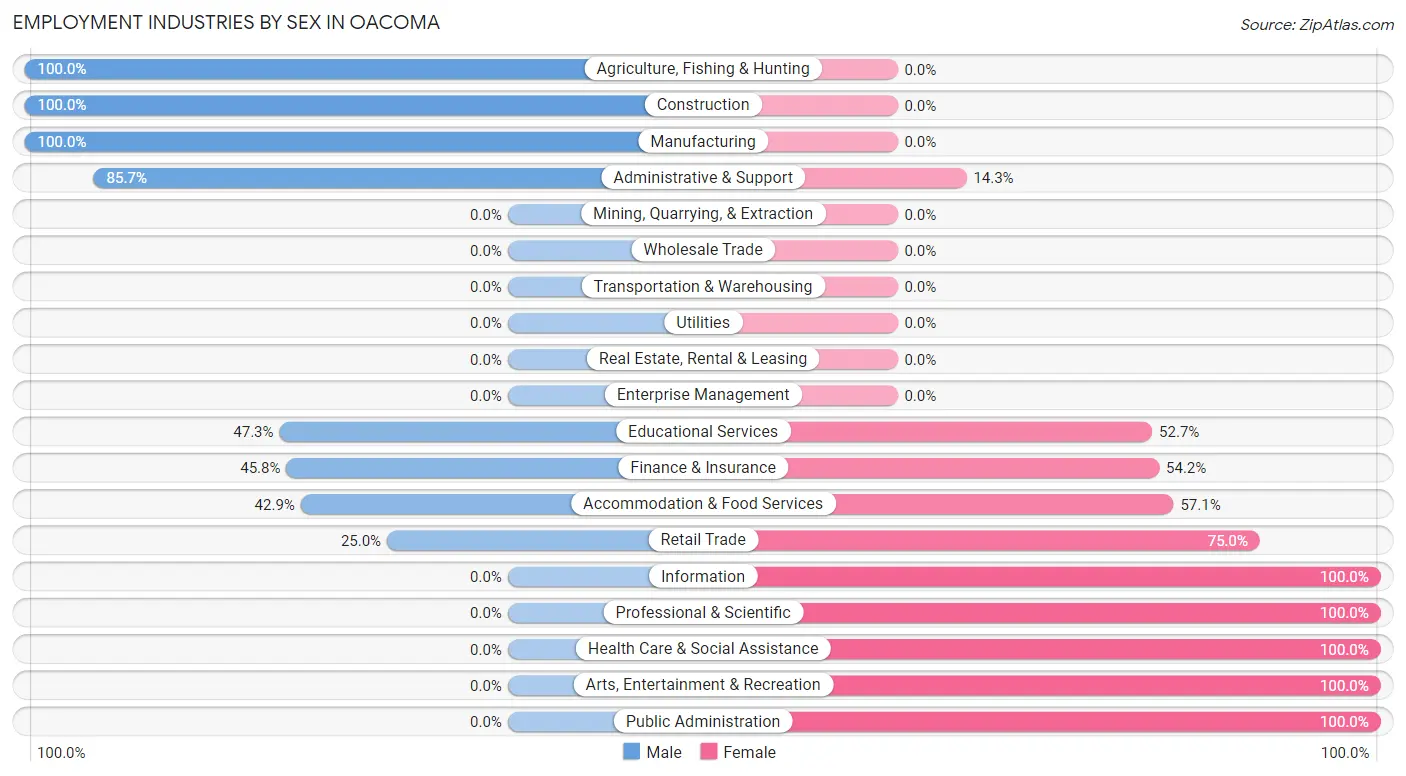
Employment Industries by Sex in Oacoma
The Oacoma industries that see more men than women are Agriculture, Fishing & Hunting (100.0%), Construction (100.0%), and Manufacturing (100.0%), whereas the industries that tend to have a higher number of women are Information (100.0%), Professional & Scientific (100.0%), and Health Care & Social Assistance (100.0%).
| Industry | Male | Female |
| Agriculture, Fishing & Hunting | 6 (100.0%) | 0 (0.0%) |
| Mining, Quarrying, & Extraction | 0 (0.0%) | 0 (0.0%) |
| Construction | 22 (100.0%) | 0 (0.0%) |
| Manufacturing | 2 (100.0%) | 0 (0.0%) |
| Wholesale Trade | 0 (0.0%) | 0 (0.0%) |
| Retail Trade | 5 (25.0%) | 15 (75.0%) |
| Transportation & Warehousing | 0 (0.0%) | 0 (0.0%) |
| Utilities | 0 (0.0%) | 0 (0.0%) |
| Information | 0 (0.0%) | 3 (100.0%) |
| Finance & Insurance | 11 (45.8%) | 13 (54.2%) |
| Real Estate, Rental & Leasing | 0 (0.0%) | 0 (0.0%) |
| Professional & Scientific | 0 (0.0%) | 2 (100.0%) |
| Enterprise Management | 0 (0.0%) | 0 (0.0%) |
| Administrative & Support | 12 (85.7%) | 2 (14.3%) |
| Educational Services | 26 (47.3%) | 29 (52.7%) |
| Health Care & Social Assistance | 0 (0.0%) | 17 (100.0%) |
| Arts, Entertainment & Recreation | 0 (0.0%) | 7 (100.0%) |
| Accommodation & Food Services | 12 (42.9%) | 16 (57.1%) |
| Public Administration | 0 (0.0%) | 4 (100.0%) |
| Total | 99 (47.8%) | 108 (52.2%) |
Education in Oacoma
School Enrollment in Oacoma
The most common levels of schooling among the 51 students in Oacoma are high school (17 | 33.3%), kindergarten (11 | 21.6%), and college / undergraduate (10 | 19.6%).
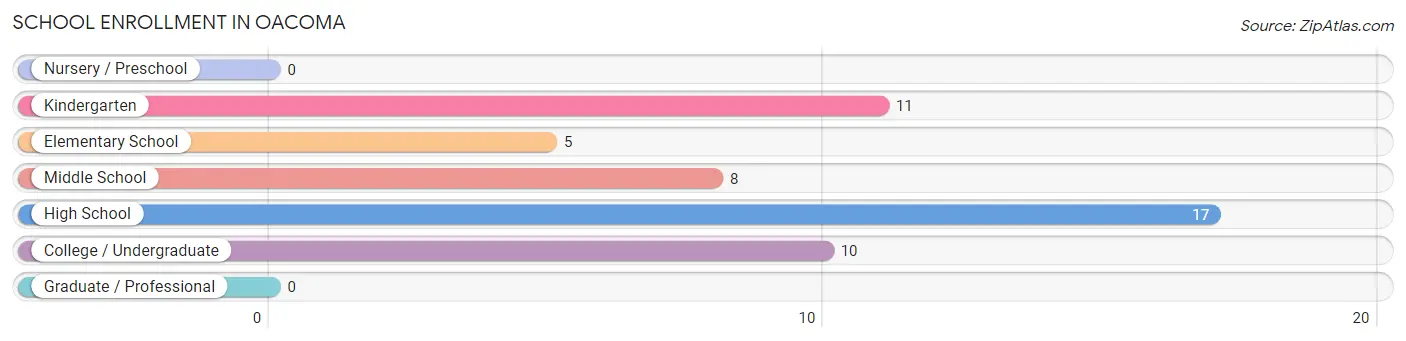
| School Level | # Students | % Students |
| Nursery / Preschool | 0 | 0.0% |
| Kindergarten | 11 | 21.6% |
| Elementary School | 5 | 9.8% |
| Middle School | 8 | 15.7% |
| High School | 17 | 33.3% |
| College / Undergraduate | 10 | 19.6% |
| Graduate / Professional | 0 | 0.0% |
| Total | 51 | 100.0% |
School Enrollment by Age by Funding Source in Oacoma
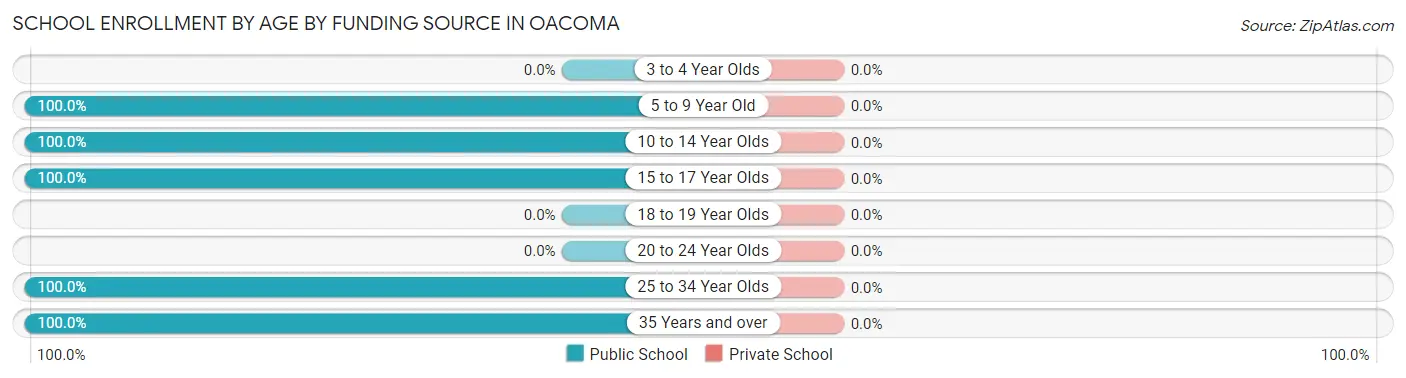
| Age Bracket | Public School | Private School |
| 3 to 4 Year Olds | 0 (0.0%) | 0 (0.0%) |
| 5 to 9 Year Old | 16 (100.0%) | 0 (0.0%) |
| 10 to 14 Year Olds | 8 (100.0%) | 0 (0.0%) |
| 15 to 17 Year Olds | 17 (100.0%) | 0 (0.0%) |
| 18 to 19 Year Olds | 0 (0.0%) | 0 (0.0%) |
| 20 to 24 Year Olds | 0 (0.0%) | 0 (0.0%) |
| 25 to 34 Year Olds | 8 (100.0%) | 0 (0.0%) |
| 35 Years and over | 2 (100.0%) | 0 (0.0%) |
| Total | 51 (100.0%) | 0 (0.0%) |
Educational Attainment by Field of Study in Oacoma
Education (44 | 66.7%), bio, nature & agricultural (17 | 25.8%), science & technology (3 | 4.5%), and arts & humanities (2 | 3.0%) are the most common fields of study among 66 individuals in Oacoma who have obtained a bachelor's degree or higher.
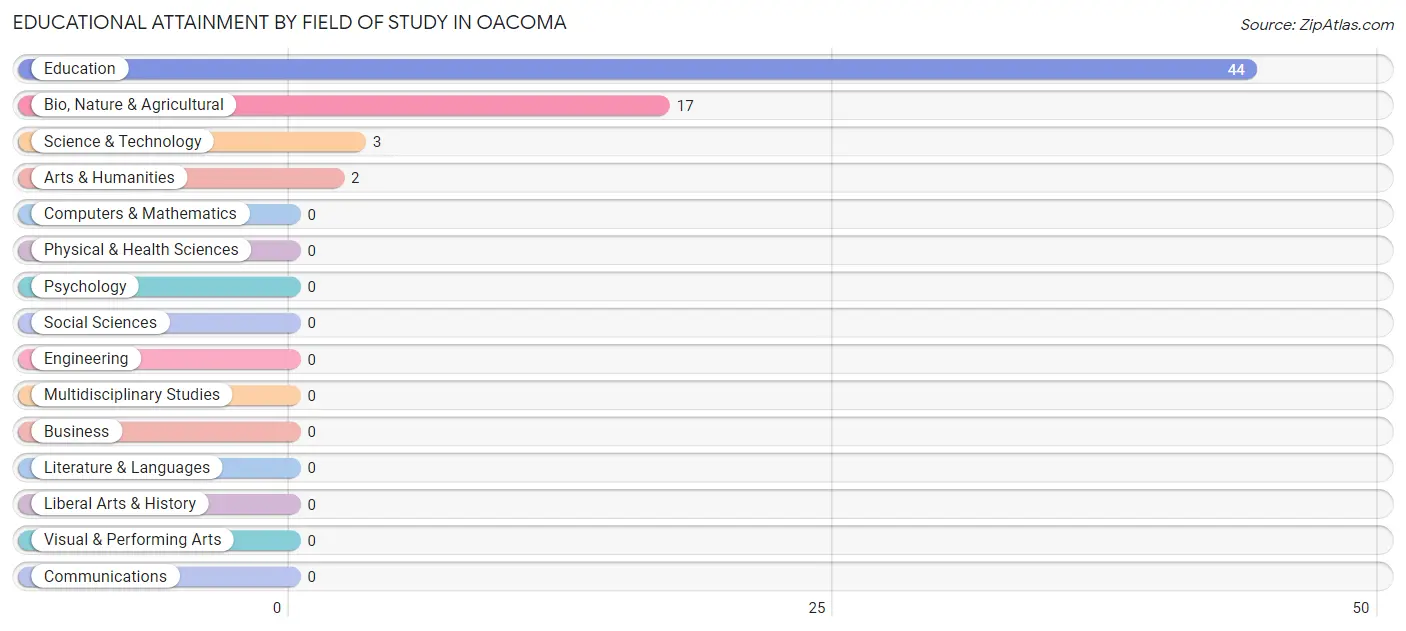
| Field of Study | # Graduates | % Graduates |
| Computers & Mathematics | 0 | 0.0% |
| Bio, Nature & Agricultural | 17 | 25.8% |
| Physical & Health Sciences | 0 | 0.0% |
| Psychology | 0 | 0.0% |
| Social Sciences | 0 | 0.0% |
| Engineering | 0 | 0.0% |
| Multidisciplinary Studies | 0 | 0.0% |
| Science & Technology | 3 | 4.5% |
| Business | 0 | 0.0% |
| Education | 44 | 66.7% |
| Literature & Languages | 0 | 0.0% |
| Liberal Arts & History | 0 | 0.0% |
| Visual & Performing Arts | 0 | 0.0% |
| Communications | 0 | 0.0% |
| Arts & Humanities | 2 | 3.0% |
| Total | 66 | 100.0% |
Transportation & Commute in Oacoma
Vehicle Availability by Sex in Oacoma
The most prevalent vehicle ownership categories in Oacoma are males with 2 vehicles (42, accounting for 41.6%) and females with 2 vehicles (34, making up 42.0%).
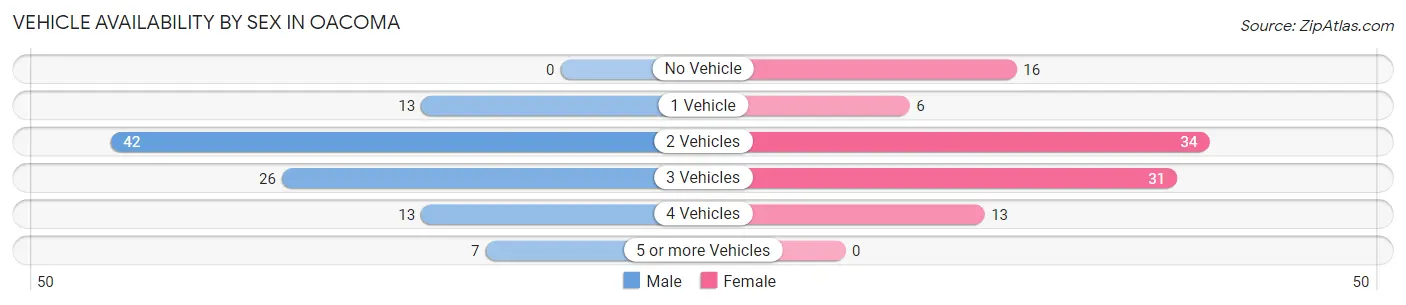
| Vehicles Available | Male | Female |
| No Vehicle | 0 (0.0%) | 16 (16.0%) |
| 1 Vehicle | 13 (12.9%) | 6 (6.0%) |
| 2 Vehicles | 42 (41.6%) | 34 (34.0%) |
| 3 Vehicles | 26 (25.7%) | 31 (31.0%) |
| 4 Vehicles | 13 (12.9%) | 13 (13.0%) |
| 5 or more Vehicles | 7 (6.9%) | 0 (0.0%) |
| Total | 101 (100.0%) | 100 (100.0%) |
Commute Time in Oacoma
The most frequently occuring commute durations in Oacoma are 10 to 14 minutes (86 commuters, 44.8%), 5 to 9 minutes (35 commuters, 18.2%), and 15 to 19 minutes (24 commuters, 12.5%).
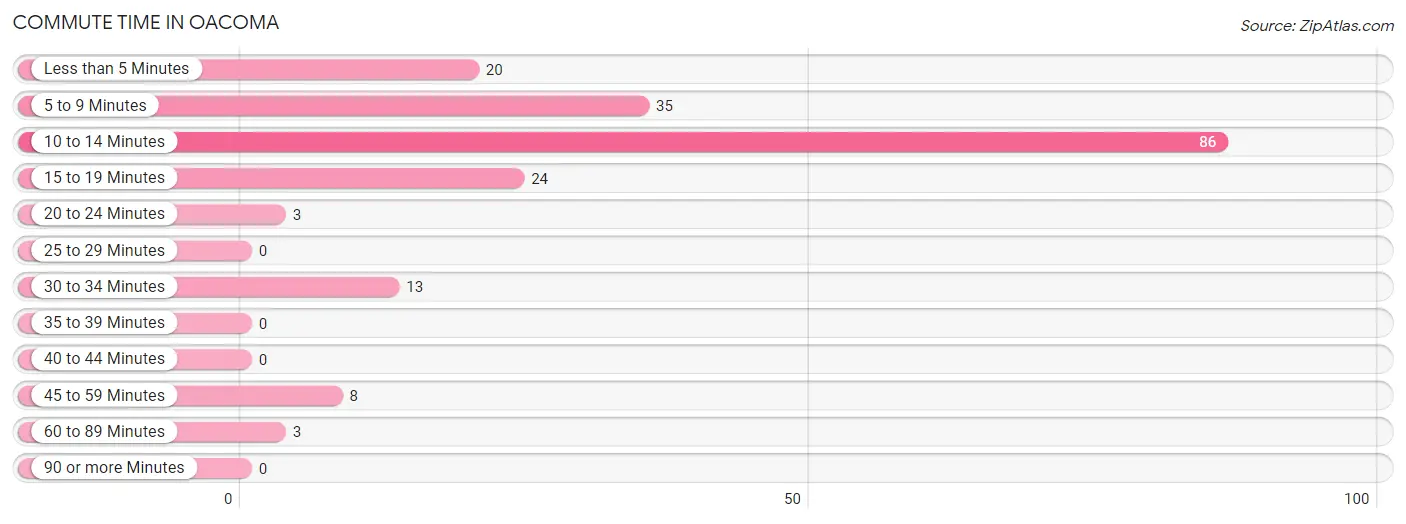
| Commute Time | # Commuters | % Commuters |
| Less than 5 Minutes | 20 | 10.4% |
| 5 to 9 Minutes | 35 | 18.2% |
| 10 to 14 Minutes | 86 | 44.8% |
| 15 to 19 Minutes | 24 | 12.5% |
| 20 to 24 Minutes | 3 | 1.6% |
| 25 to 29 Minutes | 0 | 0.0% |
| 30 to 34 Minutes | 13 | 6.8% |
| 35 to 39 Minutes | 0 | 0.0% |
| 40 to 44 Minutes | 0 | 0.0% |
| 45 to 59 Minutes | 8 | 4.2% |
| 60 to 89 Minutes | 3 | 1.6% |
| 90 or more Minutes | 0 | 0.0% |
Commute Time by Sex in Oacoma
The most common commute times in Oacoma are 10 to 14 minutes (41 commuters, 44.6%) for males and 10 to 14 minutes (45 commuters, 45.0%) for females.
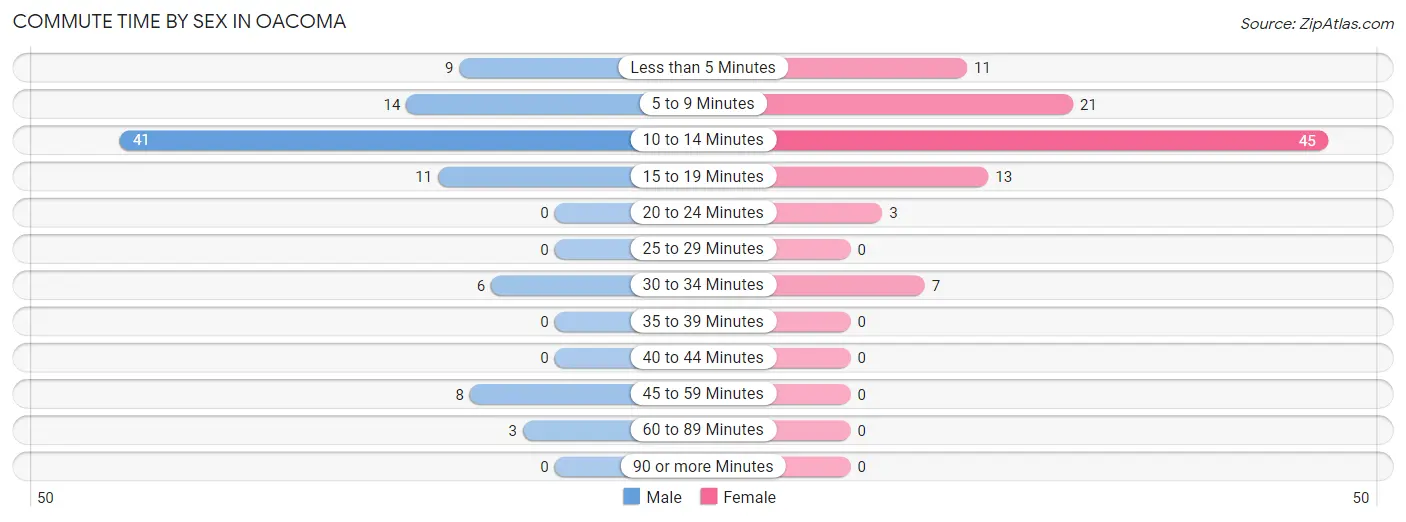
| Commute Time | Male | Female |
| Less than 5 Minutes | 9 (9.8%) | 11 (11.0%) |
| 5 to 9 Minutes | 14 (15.2%) | 21 (21.0%) |
| 10 to 14 Minutes | 41 (44.6%) | 45 (45.0%) |
| 15 to 19 Minutes | 11 (12.0%) | 13 (13.0%) |
| 20 to 24 Minutes | 0 (0.0%) | 3 (3.0%) |
| 25 to 29 Minutes | 0 (0.0%) | 0 (0.0%) |
| 30 to 34 Minutes | 6 (6.5%) | 7 (7.0%) |
| 35 to 39 Minutes | 0 (0.0%) | 0 (0.0%) |
| 40 to 44 Minutes | 0 (0.0%) | 0 (0.0%) |
| 45 to 59 Minutes | 8 (8.7%) | 0 (0.0%) |
| 60 to 89 Minutes | 3 (3.3%) | 0 (0.0%) |
| 90 or more Minutes | 0 (0.0%) | 0 (0.0%) |
Time of Departure to Work by Sex in Oacoma
The most frequent times of departure to work in Oacoma are 8:00 AM to 8:29 AM (29, 31.5%) for males and 8:00 AM to 8:29 AM (46, 46.0%) for females.
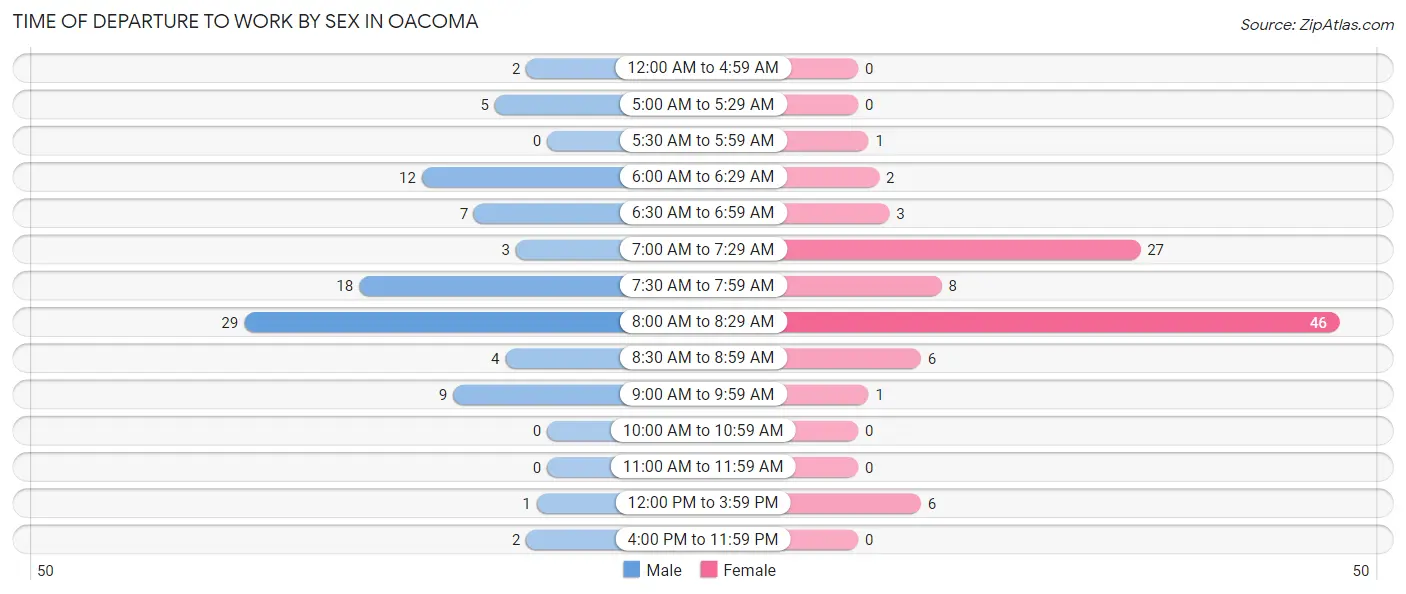
| Time of Departure | Male | Female |
| 12:00 AM to 4:59 AM | 2 (2.2%) | 0 (0.0%) |
| 5:00 AM to 5:29 AM | 5 (5.4%) | 0 (0.0%) |
| 5:30 AM to 5:59 AM | 0 (0.0%) | 1 (1.0%) |
| 6:00 AM to 6:29 AM | 12 (13.0%) | 2 (2.0%) |
| 6:30 AM to 6:59 AM | 7 (7.6%) | 3 (3.0%) |
| 7:00 AM to 7:29 AM | 3 (3.3%) | 27 (27.0%) |
| 7:30 AM to 7:59 AM | 18 (19.6%) | 8 (8.0%) |
| 8:00 AM to 8:29 AM | 29 (31.5%) | 46 (46.0%) |
| 8:30 AM to 8:59 AM | 4 (4.3%) | 6 (6.0%) |
| 9:00 AM to 9:59 AM | 9 (9.8%) | 1 (1.0%) |
| 10:00 AM to 10:59 AM | 0 (0.0%) | 0 (0.0%) |
| 11:00 AM to 11:59 AM | 0 (0.0%) | 0 (0.0%) |
| 12:00 PM to 3:59 PM | 1 (1.1%) | 6 (6.0%) |
| 4:00 PM to 11:59 PM | 2 (2.2%) | 0 (0.0%) |
| Total | 92 (100.0%) | 100 (100.0%) |
Housing Occupancy in Oacoma
Occupancy by Ownership in Oacoma
Of the total 203 dwellings in Oacoma, owner-occupied units account for 150 (73.9%), while renter-occupied units make up 53 (26.1%).
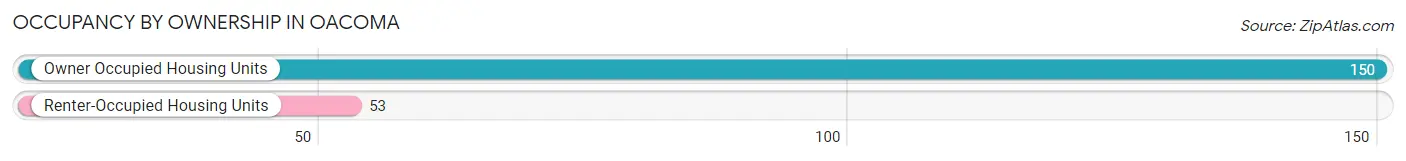
| Occupancy | # Housing Units | % Housing Units |
| Owner Occupied Housing Units | 150 | 73.9% |
| Renter-Occupied Housing Units | 53 | 26.1% |
| Total Occupied Housing Units | 203 | 100.0% |
Occupancy by Household Size in Oacoma
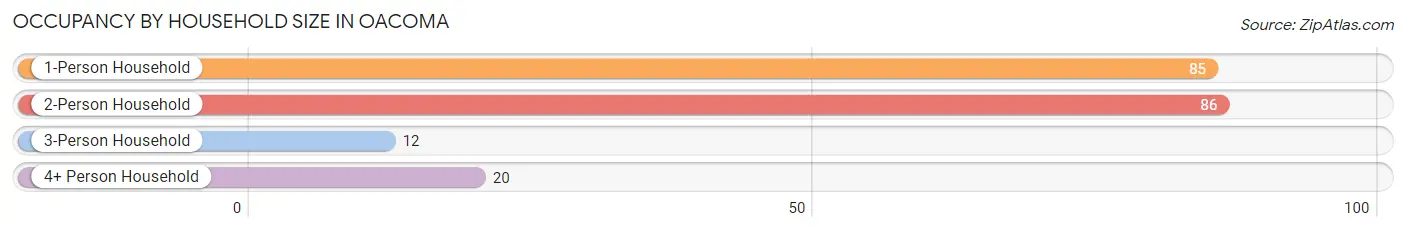
| Household Size | # Housing Units | % Housing Units |
| 1-Person Household | 85 | 41.9% |
| 2-Person Household | 86 | 42.4% |
| 3-Person Household | 12 | 5.9% |
| 4+ Person Household | 20 | 9.9% |
| Total Housing Units | 203 | 100.0% |
Occupancy by Ownership by Household Size in Oacoma
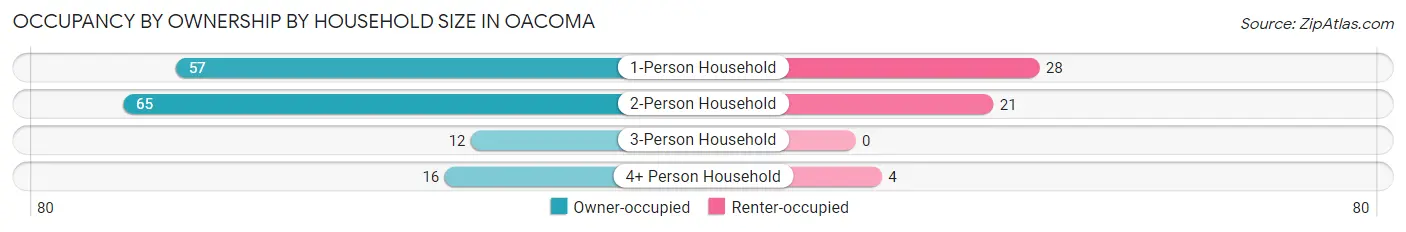
| Household Size | Owner-occupied | Renter-occupied |
| 1-Person Household | 57 (67.1%) | 28 (32.9%) |
| 2-Person Household | 65 (75.6%) | 21 (24.4%) |
| 3-Person Household | 12 (100.0%) | 0 (0.0%) |
| 4+ Person Household | 16 (80.0%) | 4 (20.0%) |
| Total Housing Units | 150 (73.9%) | 53 (26.1%) |
Occupancy by Educational Attainment in Oacoma
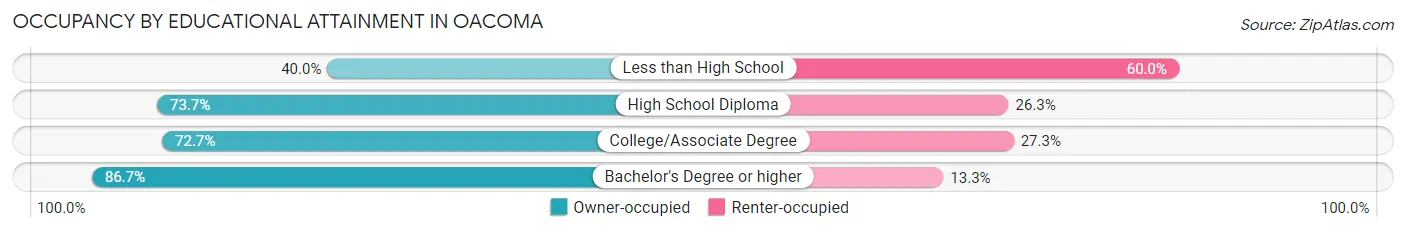
| Household Size | Owner-occupied | Renter-occupied |
| Less than High School | 6 (40.0%) | 9 (60.0%) |
| High School Diploma | 73 (73.7%) | 26 (26.3%) |
| College/Associate Degree | 32 (72.7%) | 12 (27.3%) |
| Bachelor's Degree or higher | 39 (86.7%) | 6 (13.3%) |
Occupancy by Age of Householder in Oacoma
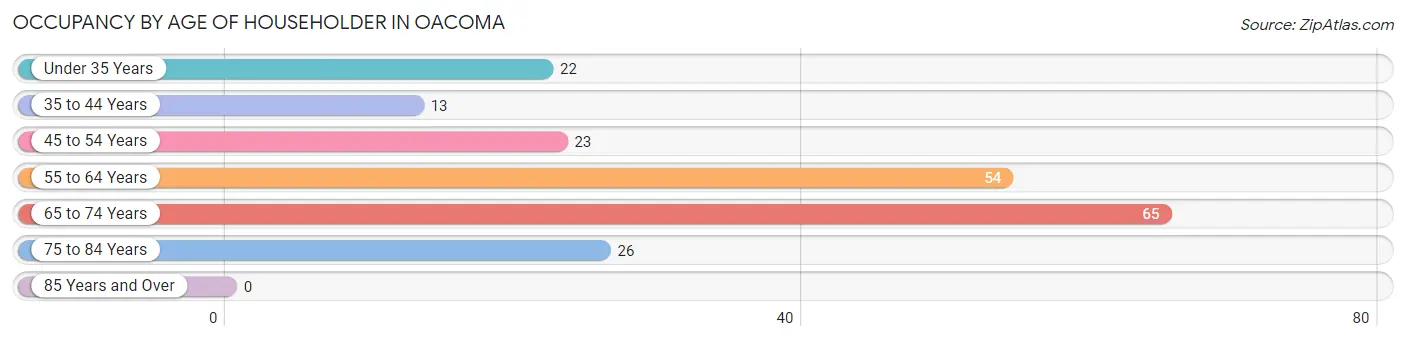
| Age Bracket | # Households | % Households |
| Under 35 Years | 22 | 10.8% |
| 35 to 44 Years | 13 | 6.4% |
| 45 to 54 Years | 23 | 11.3% |
| 55 to 64 Years | 54 | 26.6% |
| 65 to 74 Years | 65 | 32.0% |
| 75 to 84 Years | 26 | 12.8% |
| 85 Years and Over | 0 | 0.0% |
| Total | 203 | 100.0% |
Housing Finances in Oacoma
Median Income by Occupancy in Oacoma
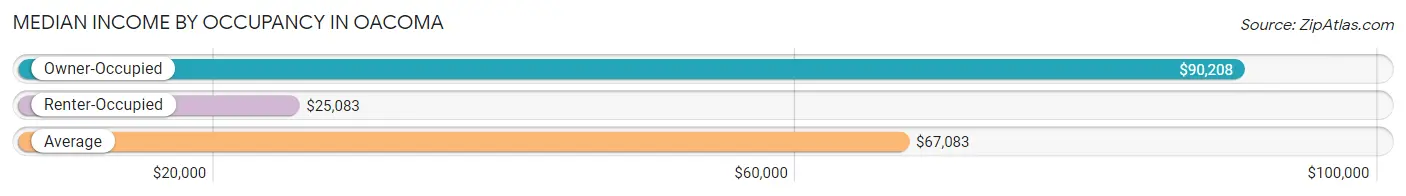
| Occupancy Type | # Households | Median Income |
| Owner-Occupied | 150 (73.9%) | $90,208 |
| Renter-Occupied | 53 (26.1%) | $25,083 |
| Average | 203 (100.0%) | $67,083 |
Occupancy by Householder Income Bracket in Oacoma
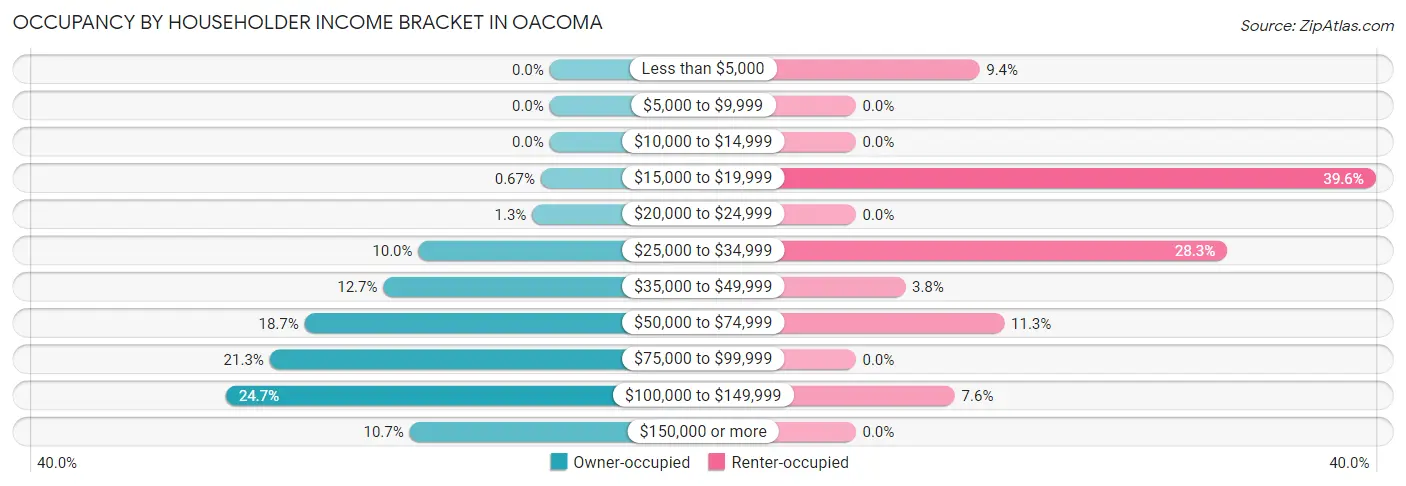
| Income Bracket | Owner-occupied | Renter-occupied |
| Less than $5,000 | 0 (0.0%) | 5 (9.4%) |
| $5,000 to $9,999 | 0 (0.0%) | 0 (0.0%) |
| $10,000 to $14,999 | 0 (0.0%) | 0 (0.0%) |
| $15,000 to $19,999 | 1 (0.7%) | 21 (39.6%) |
| $20,000 to $24,999 | 2 (1.3%) | 0 (0.0%) |
| $25,000 to $34,999 | 15 (10.0%) | 15 (28.3%) |
| $35,000 to $49,999 | 19 (12.7%) | 2 (3.8%) |
| $50,000 to $74,999 | 28 (18.7%) | 6 (11.3%) |
| $75,000 to $99,999 | 32 (21.3%) | 0 (0.0%) |
| $100,000 to $149,999 | 37 (24.7%) | 4 (7.5%) |
| $150,000 or more | 16 (10.7%) | 0 (0.0%) |
| Total | 150 (100.0%) | 53 (100.0%) |
Monthly Housing Cost Tiers in Oacoma
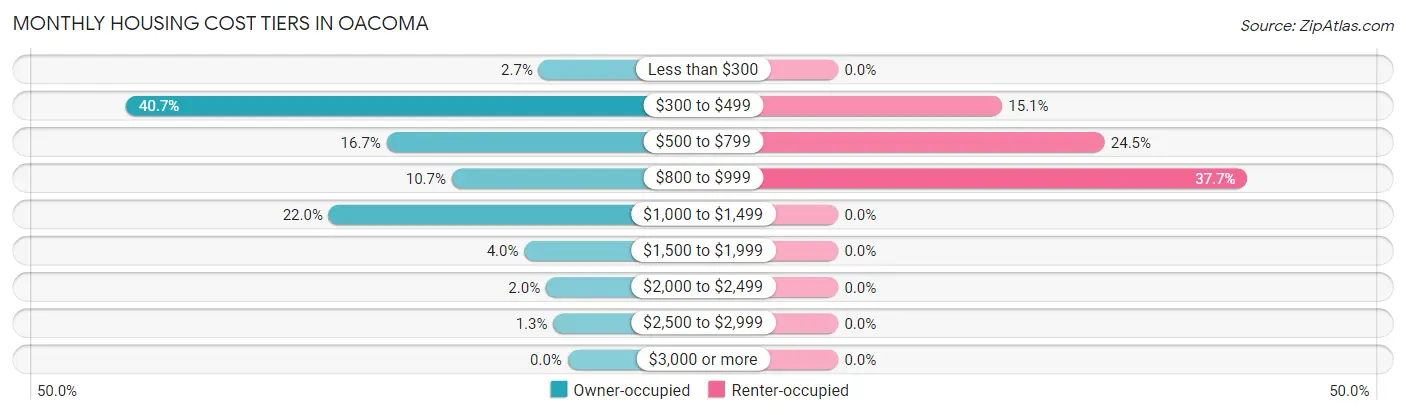
| Monthly Cost | Owner-occupied | Renter-occupied |
| Less than $300 | 4 (2.7%) | 0 (0.0%) |
| $300 to $499 | 61 (40.7%) | 8 (15.1%) |
| $500 to $799 | 25 (16.7%) | 13 (24.5%) |
| $800 to $999 | 16 (10.7%) | 20 (37.7%) |
| $1,000 to $1,499 | 33 (22.0%) | 0 (0.0%) |
| $1,500 to $1,999 | 6 (4.0%) | 0 (0.0%) |
| $2,000 to $2,499 | 3 (2.0%) | 0 (0.0%) |
| $2,500 to $2,999 | 2 (1.3%) | 0 (0.0%) |
| $3,000 or more | 0 (0.0%) | 0 (0.0%) |
| Total | 150 (100.0%) | 53 (100.0%) |
Physical Housing Characteristics in Oacoma
Housing Structures in Oacoma
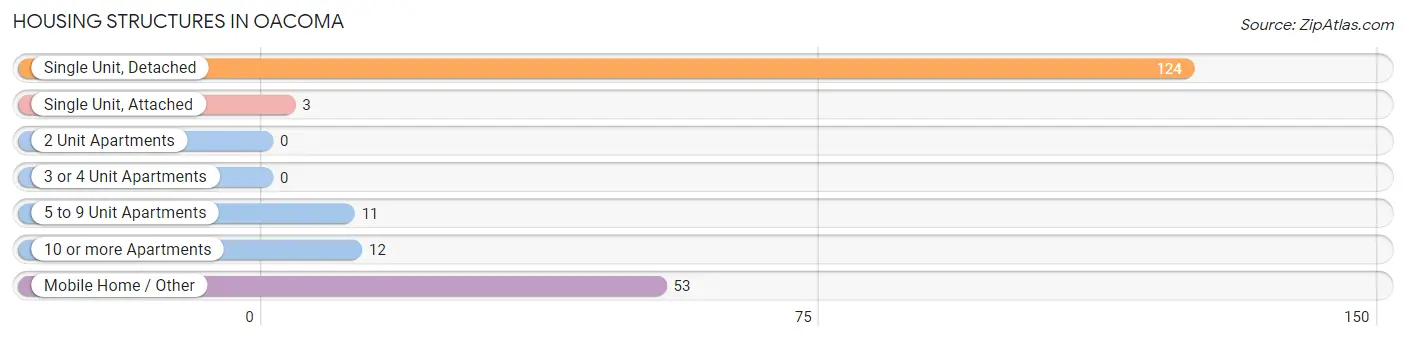
| Structure Type | # Housing Units | % Housing Units |
| Single Unit, Detached | 124 | 61.1% |
| Single Unit, Attached | 3 | 1.5% |
| 2 Unit Apartments | 0 | 0.0% |
| 3 or 4 Unit Apartments | 0 | 0.0% |
| 5 to 9 Unit Apartments | 11 | 5.4% |
| 10 or more Apartments | 12 | 5.9% |
| Mobile Home / Other | 53 | 26.1% |
| Total | 203 | 100.0% |
Housing Structures by Occupancy in Oacoma
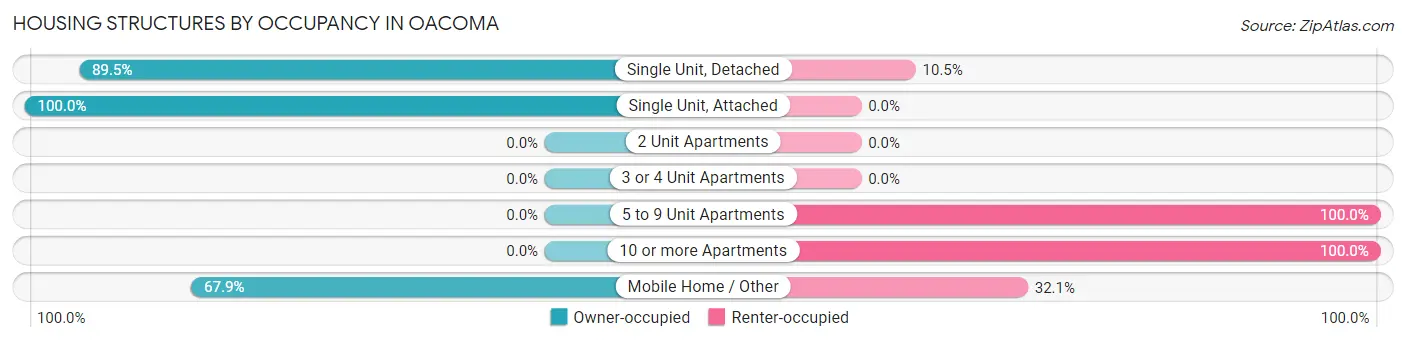
| Structure Type | Owner-occupied | Renter-occupied |
| Single Unit, Detached | 111 (89.5%) | 13 (10.5%) |
| Single Unit, Attached | 3 (100.0%) | 0 (0.0%) |
| 2 Unit Apartments | 0 (0.0%) | 0 (0.0%) |
| 3 or 4 Unit Apartments | 0 (0.0%) | 0 (0.0%) |
| 5 to 9 Unit Apartments | 0 (0.0%) | 11 (100.0%) |
| 10 or more Apartments | 0 (0.0%) | 12 (100.0%) |
| Mobile Home / Other | 36 (67.9%) | 17 (32.1%) |
| Total | 150 (73.9%) | 53 (26.1%) |
Housing Structures by Number of Rooms in Oacoma
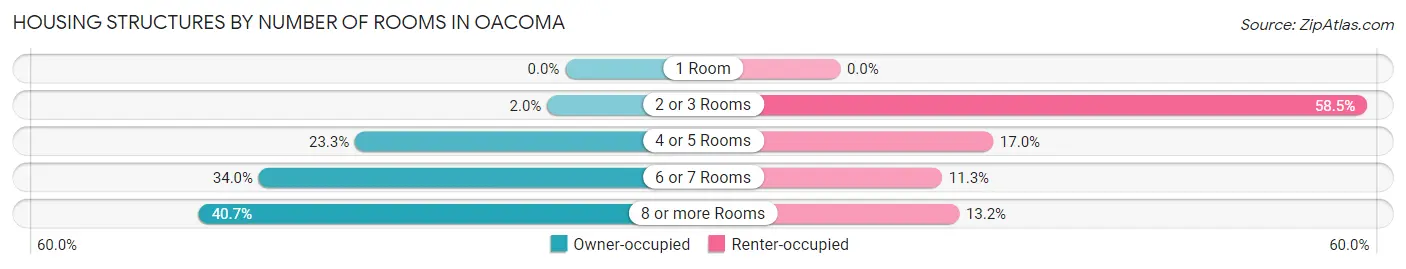
| Number of Rooms | Owner-occupied | Renter-occupied |
| 1 Room | 0 (0.0%) | 0 (0.0%) |
| 2 or 3 Rooms | 3 (2.0%) | 31 (58.5%) |
| 4 or 5 Rooms | 35 (23.3%) | 9 (17.0%) |
| 6 or 7 Rooms | 51 (34.0%) | 6 (11.3%) |
| 8 or more Rooms | 61 (40.7%) | 7 (13.2%) |
| Total | 150 (100.0%) | 53 (100.0%) |
Housing Structure by Heating Type in Oacoma
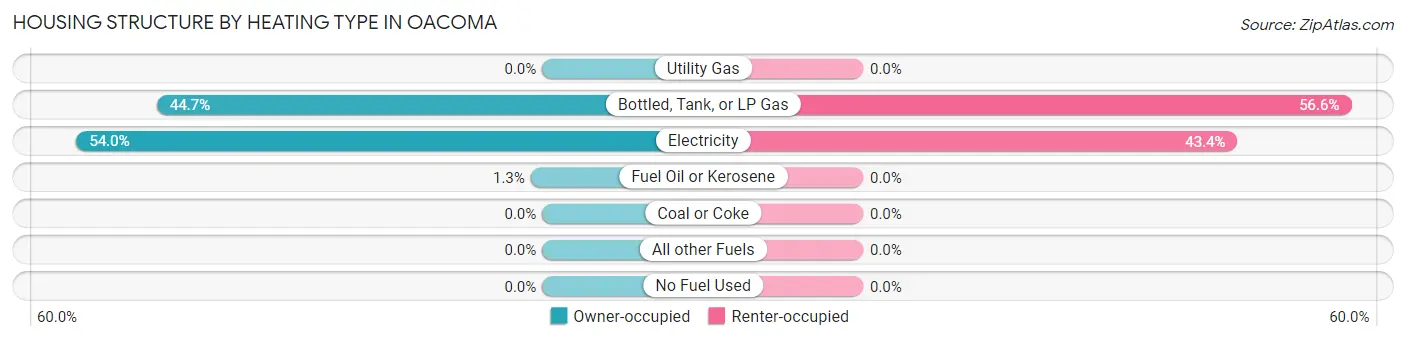
| Heating Type | Owner-occupied | Renter-occupied |
| Utility Gas | 0 (0.0%) | 0 (0.0%) |
| Bottled, Tank, or LP Gas | 67 (44.7%) | 30 (56.6%) |
| Electricity | 81 (54.0%) | 23 (43.4%) |
| Fuel Oil or Kerosene | 2 (1.3%) | 0 (0.0%) |
| Coal or Coke | 0 (0.0%) | 0 (0.0%) |
| All other Fuels | 0 (0.0%) | 0 (0.0%) |
| No Fuel Used | 0 (0.0%) | 0 (0.0%) |
| Total | 150 (100.0%) | 53 (100.0%) |
Household Vehicle Usage in Oacoma
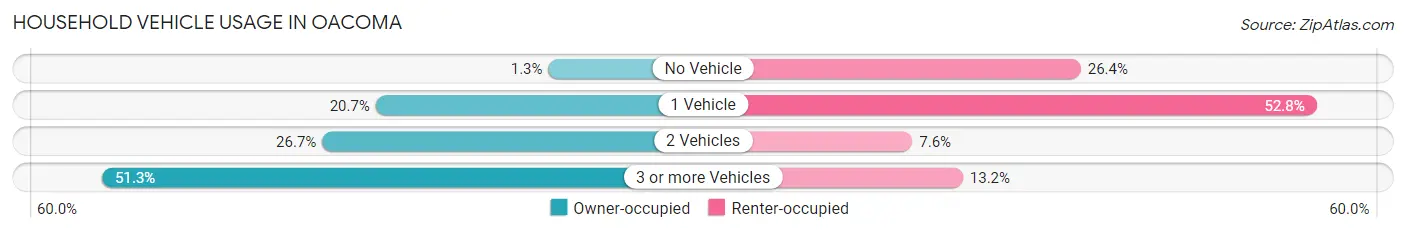
| Vehicles per Household | Owner-occupied | Renter-occupied |
| No Vehicle | 2 (1.3%) | 14 (26.4%) |
| 1 Vehicle | 31 (20.7%) | 28 (52.8%) |
| 2 Vehicles | 40 (26.7%) | 4 (7.5%) |
| 3 or more Vehicles | 77 (51.3%) | 7 (13.2%) |
| Total | 150 (100.0%) | 53 (100.0%) |
Real Estate & Mortgages in Oacoma
Real Estate and Mortgage Overview in Oacoma
| Characteristic | Without Mortgage | With Mortgage |
| Housing Units | 113 | 37 |
| Median Property Value | $134,000 | $157,800 |
| Median Household Income | $80,417 | $4 |
| Monthly Housing Costs | $474 | $0 |
| Real Estate Taxes | $1,100 | $0 |
Property Value by Mortgage Status in Oacoma
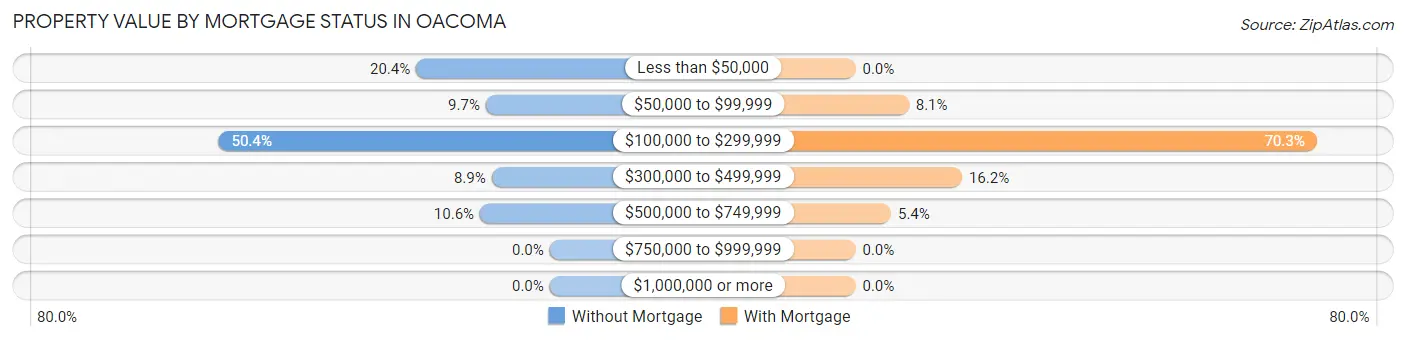
| Property Value | Without Mortgage | With Mortgage |
| Less than $50,000 | 23 (20.3%) | 0 (0.0%) |
| $50,000 to $99,999 | 11 (9.7%) | 3 (8.1%) |
| $100,000 to $299,999 | 57 (50.4%) | 26 (70.3%) |
| $300,000 to $499,999 | 10 (8.8%) | 6 (16.2%) |
| $500,000 to $749,999 | 12 (10.6%) | 2 (5.4%) |
| $750,000 to $999,999 | 0 (0.0%) | 0 (0.0%) |
| $1,000,000 or more | 0 (0.0%) | 0 (0.0%) |
| Total | 113 (100.0%) | 37 (100.0%) |
Household Income by Mortgage Status in Oacoma
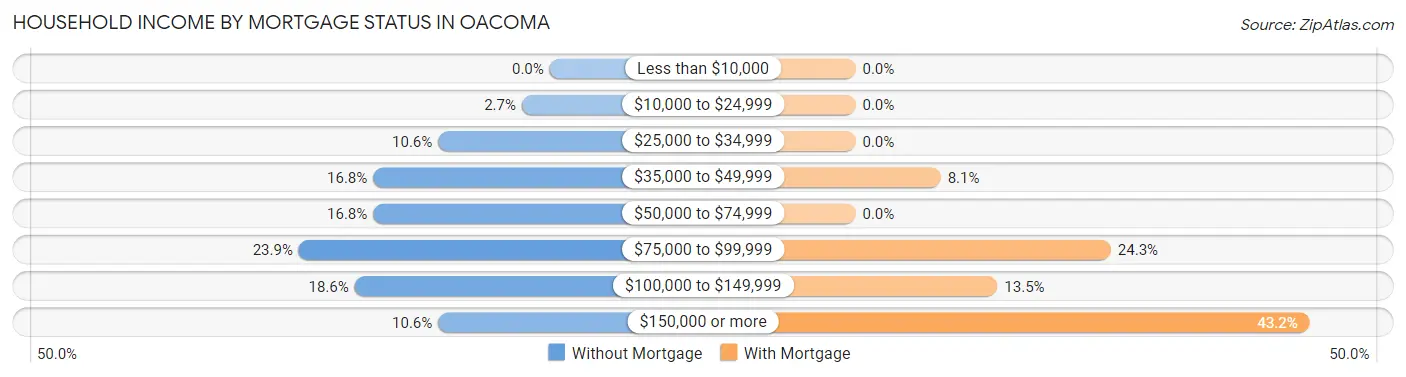
| Household Income | Without Mortgage | With Mortgage |
| Less than $10,000 | 0 (0.0%) | 0 (0.0%) |
| $10,000 to $24,999 | 3 (2.6%) | 0 (0.0%) |
| $25,000 to $34,999 | 12 (10.6%) | 0 (0.0%) |
| $35,000 to $49,999 | 19 (16.8%) | 3 (8.1%) |
| $50,000 to $74,999 | 19 (16.8%) | 0 (0.0%) |
| $75,000 to $99,999 | 27 (23.9%) | 9 (24.3%) |
| $100,000 to $149,999 | 21 (18.6%) | 5 (13.5%) |
| $150,000 or more | 12 (10.6%) | 16 (43.2%) |
| Total | 113 (100.0%) | 37 (100.0%) |
Property Value to Household Income Ratio in Oacoma
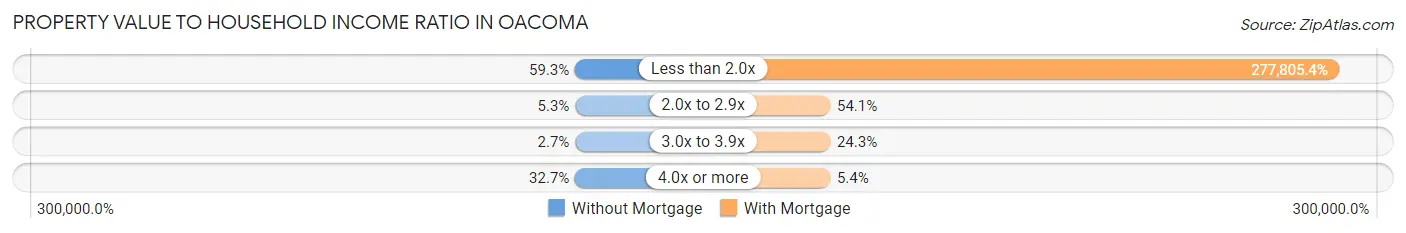
| Value-to-Income Ratio | Without Mortgage | With Mortgage |
| Less than 2.0x | 67 (59.3%) | 102,788 (277,805.4%) |
| 2.0x to 2.9x | 6 (5.3%) | 20 (54.0%) |
| 3.0x to 3.9x | 3 (2.6%) | 9 (24.3%) |
| 4.0x or more | 37 (32.7%) | 2 (5.4%) |
| Total | 113 (100.0%) | 37 (100.0%) |
Real Estate Taxes by Mortgage Status in Oacoma
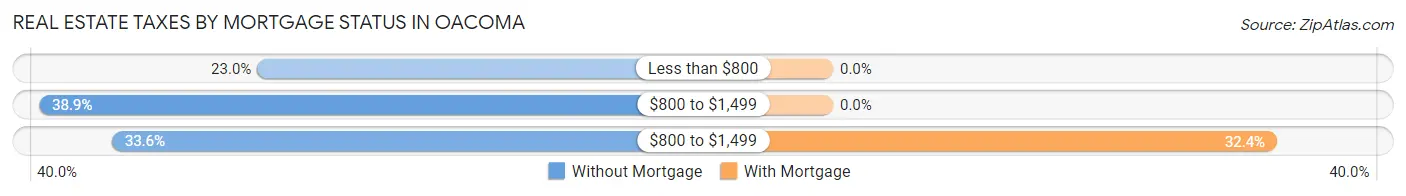
| Property Taxes | Without Mortgage | With Mortgage |
| Less than $800 | 26 (23.0%) | 0 (0.0%) |
| $800 to $1,499 | 44 (38.9%) | 0 (0.0%) |
| $800 to $1,499 | 38 (33.6%) | 12 (32.4%) |
| Total | 113 (100.0%) | 37 (100.0%) |
Health & Disability in Oacoma
Health Insurance Coverage by Age in Oacoma
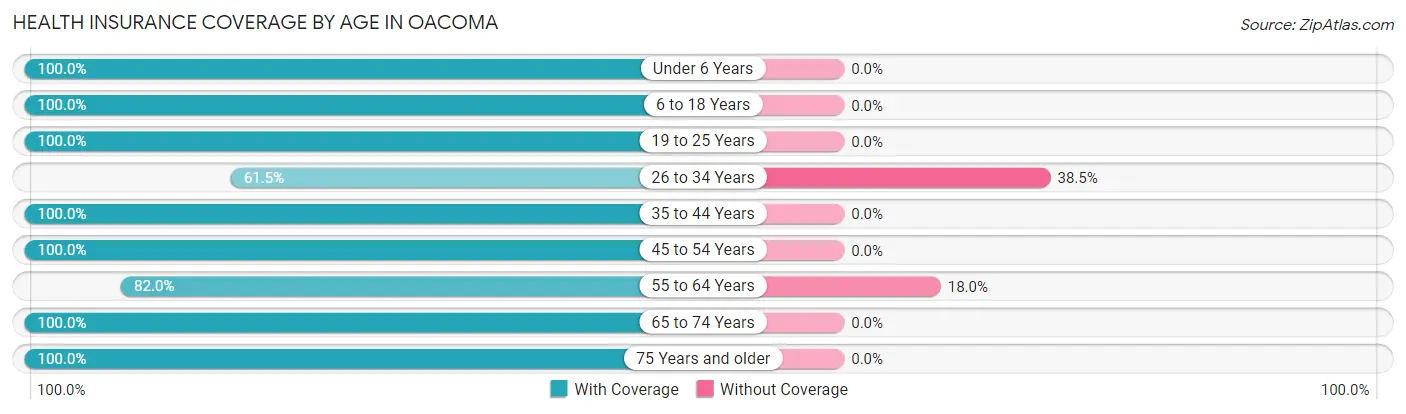
| Age Bracket | With Coverage | Without Coverage |
| Under 6 Years | 33 (100.0%) | 0 (0.0%) |
| 6 to 18 Years | 41 (100.0%) | 0 (0.0%) |
| 19 to 25 Years | 20 (100.0%) | 0 (0.0%) |
| 26 to 34 Years | 16 (61.5%) | 10 (38.5%) |
| 35 to 44 Years | 28 (100.0%) | 0 (0.0%) |
| 45 to 54 Years | 40 (100.0%) | 0 (0.0%) |
| 55 to 64 Years | 82 (82.0%) | 18 (18.0%) |
| 65 to 74 Years | 87 (100.0%) | 0 (0.0%) |
| 75 Years and older | 29 (100.0%) | 0 (0.0%) |
| Total | 376 (93.1%) | 28 (6.9%) |
Health Insurance Coverage by Citizenship Status in Oacoma
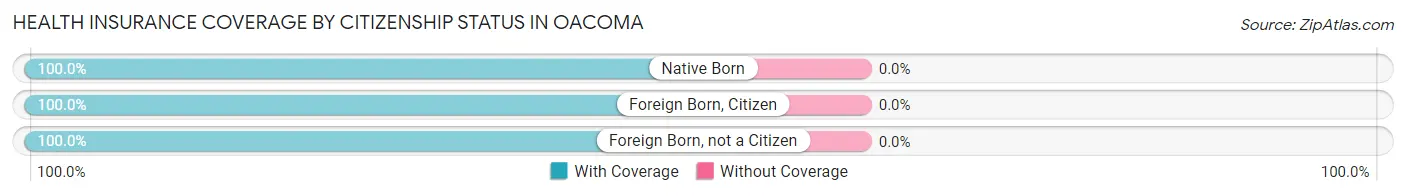
| Citizenship Status | With Coverage | Without Coverage |
| Native Born | 33 (100.0%) | 0 (0.0%) |
| Foreign Born, Citizen | 41 (100.0%) | 0 (0.0%) |
| Foreign Born, not a Citizen | 20 (100.0%) | 0 (0.0%) |
Health Insurance Coverage by Household Income in Oacoma
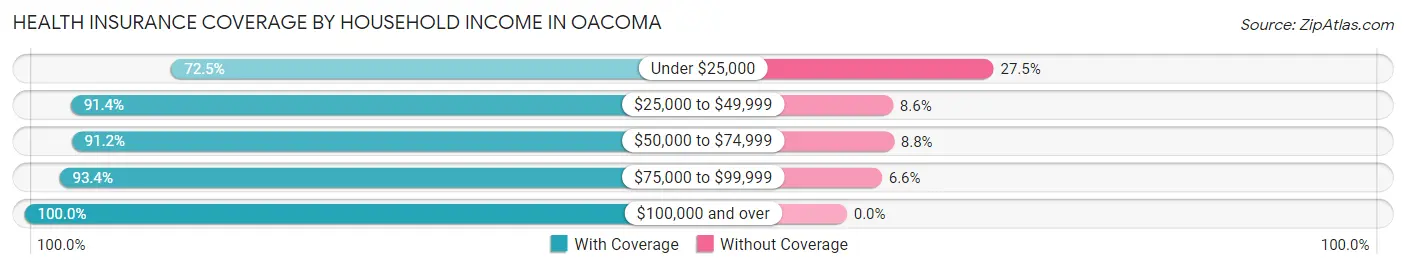
| Household Income | With Coverage | Without Coverage |
| Under $25,000 | 29 (72.5%) | 11 (27.5%) |
| $25,000 to $49,999 | 74 (91.4%) | 7 (8.6%) |
| $50,000 to $74,999 | 62 (91.2%) | 6 (8.8%) |
| $75,000 to $99,999 | 57 (93.4%) | 4 (6.6%) |
| $100,000 and over | 154 (100.0%) | 0 (0.0%) |
Public vs Private Health Insurance Coverage by Age in Oacoma
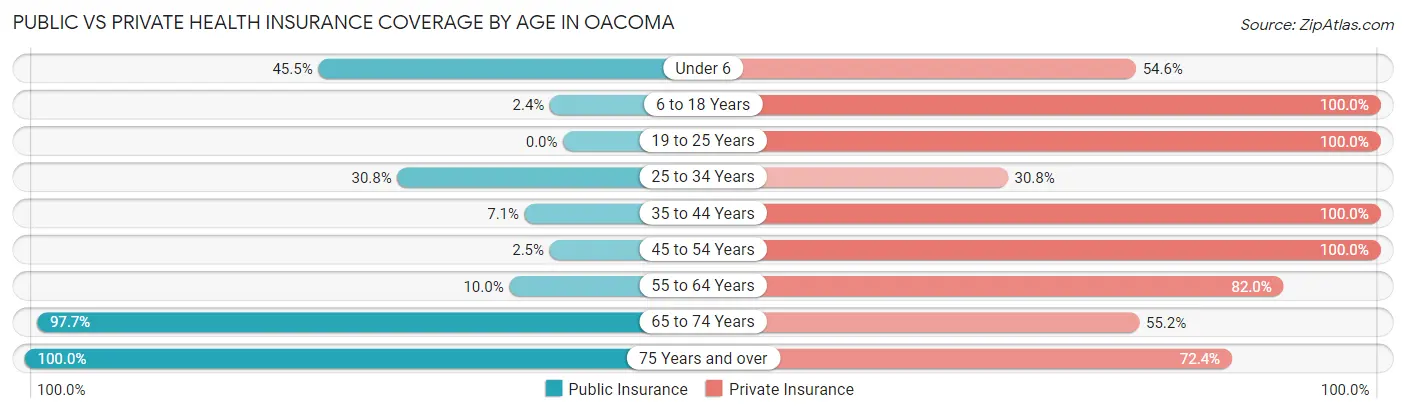
| Age Bracket | Public Insurance | Private Insurance |
| Under 6 | 15 (45.5%) | 18 (54.5%) |
| 6 to 18 Years | 1 (2.4%) | 41 (100.0%) |
| 19 to 25 Years | 0 (0.0%) | 20 (100.0%) |
| 25 to 34 Years | 8 (30.8%) | 8 (30.8%) |
| 35 to 44 Years | 2 (7.1%) | 28 (100.0%) |
| 45 to 54 Years | 1 (2.5%) | 40 (100.0%) |
| 55 to 64 Years | 10 (10.0%) | 82 (82.0%) |
| 65 to 74 Years | 85 (97.7%) | 48 (55.2%) |
| 75 Years and over | 29 (100.0%) | 21 (72.4%) |
| Total | 151 (37.4%) | 306 (75.7%) |
Disability Status by Sex by Age in Oacoma
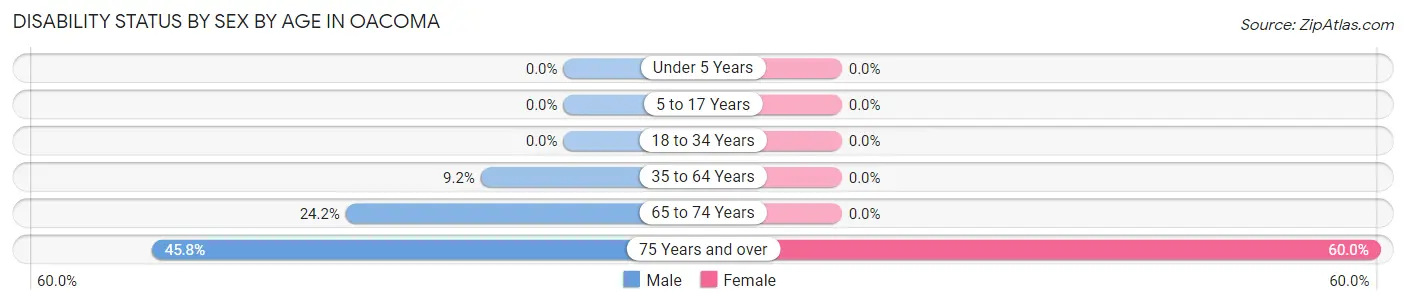
| Age Bracket | Male | Female |
| Under 5 Years | 0 (0.0%) | 0 (0.0%) |
| 5 to 17 Years | 0 (0.0%) | 0 (0.0%) |
| 18 to 34 Years | 0 (0.0%) | 0 (0.0%) |
| 35 to 64 Years | 7 (9.2%) | 0 (0.0%) |
| 65 to 74 Years | 16 (24.2%) | 0 (0.0%) |
| 75 Years and over | 11 (45.8%) | 3 (60.0%) |
Disability Class by Sex by Age in Oacoma
Disability Class: Hearing Difficulty
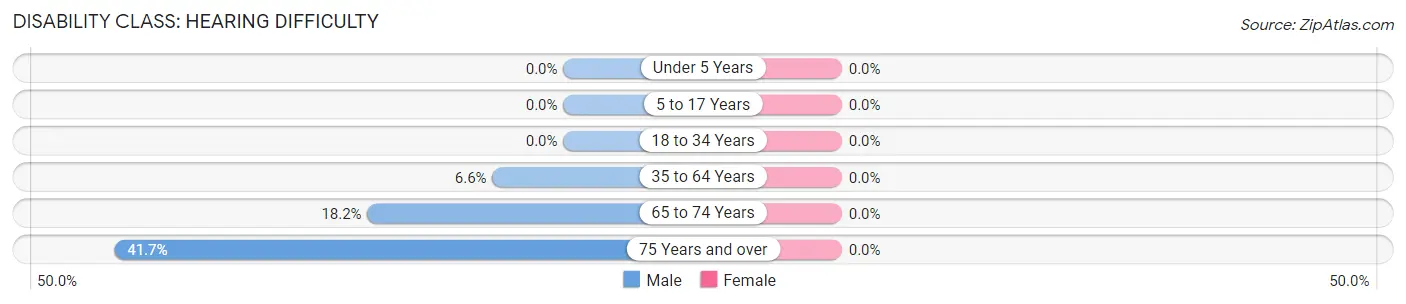
| Age Bracket | Male | Female |
| Under 5 Years | 0 (0.0%) | 0 (0.0%) |
| 5 to 17 Years | 0 (0.0%) | 0 (0.0%) |
| 18 to 34 Years | 0 (0.0%) | 0 (0.0%) |
| 35 to 64 Years | 5 (6.6%) | 0 (0.0%) |
| 65 to 74 Years | 12 (18.2%) | 0 (0.0%) |
| 75 Years and over | 10 (41.7%) | 0 (0.0%) |
Disability Class: Vision Difficulty
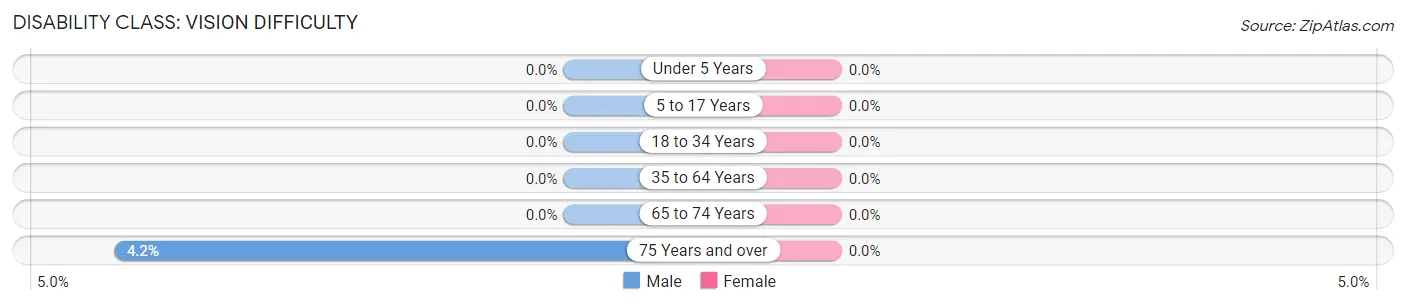
| Age Bracket | Male | Female |
| Under 5 Years | 0 (0.0%) | 0 (0.0%) |
| 5 to 17 Years | 0 (0.0%) | 0 (0.0%) |
| 18 to 34 Years | 0 (0.0%) | 0 (0.0%) |
| 35 to 64 Years | 0 (0.0%) | 0 (0.0%) |
| 65 to 74 Years | 0 (0.0%) | 0 (0.0%) |
| 75 Years and over | 1 (4.2%) | 0 (0.0%) |
Disability Class: Cognitive Difficulty
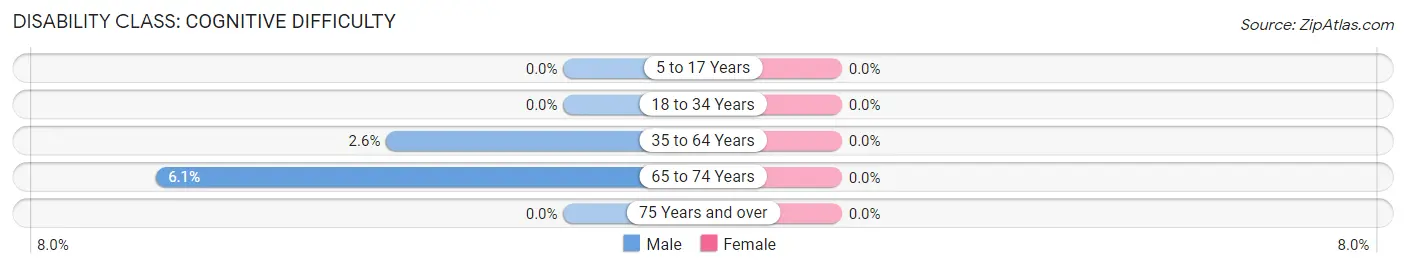
| Age Bracket | Male | Female |
| 5 to 17 Years | 0 (0.0%) | 0 (0.0%) |
| 18 to 34 Years | 0 (0.0%) | 0 (0.0%) |
| 35 to 64 Years | 2 (2.6%) | 0 (0.0%) |
| 65 to 74 Years | 4 (6.1%) | 0 (0.0%) |
| 75 Years and over | 0 (0.0%) | 0 (0.0%) |
Disability Class: Ambulatory Difficulty
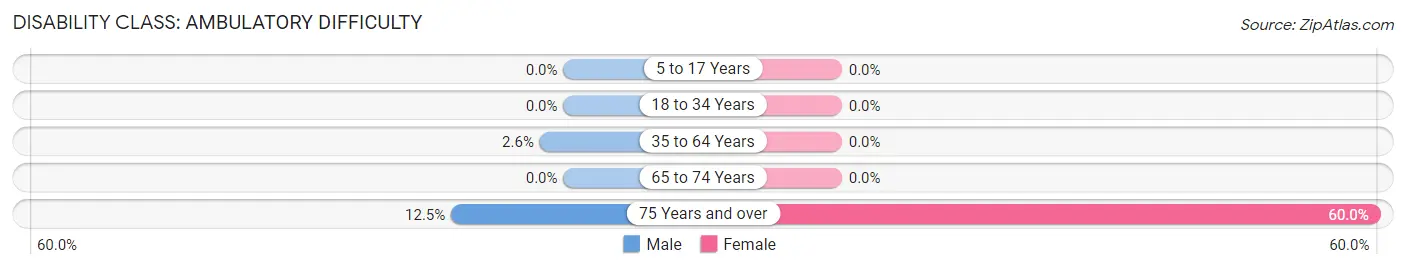
| Age Bracket | Male | Female |
| 5 to 17 Years | 0 (0.0%) | 0 (0.0%) |
| 18 to 34 Years | 0 (0.0%) | 0 (0.0%) |
| 35 to 64 Years | 2 (2.6%) | 0 (0.0%) |
| 65 to 74 Years | 0 (0.0%) | 0 (0.0%) |
| 75 Years and over | 3 (12.5%) | 3 (60.0%) |
Disability Class: Self-Care Difficulty
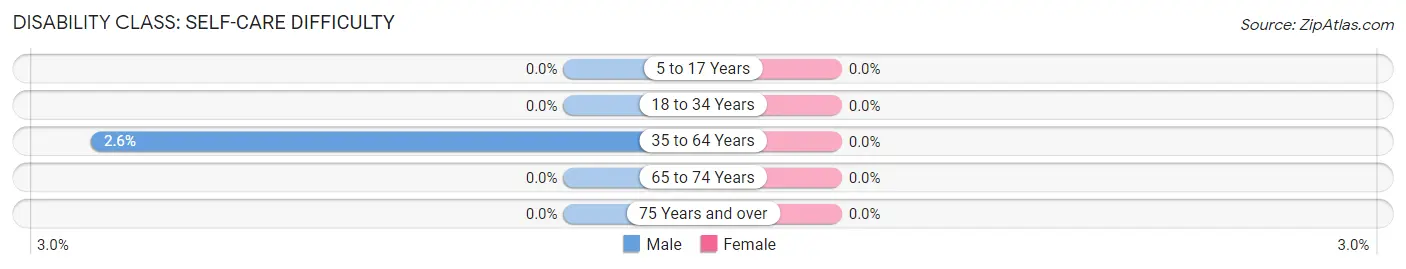
| Age Bracket | Male | Female |
| 5 to 17 Years | 0 (0.0%) | 0 (0.0%) |
| 18 to 34 Years | 0 (0.0%) | 0 (0.0%) |
| 35 to 64 Years | 2 (2.6%) | 0 (0.0%) |
| 65 to 74 Years | 0 (0.0%) | 0 (0.0%) |
| 75 Years and over | 0 (0.0%) | 0 (0.0%) |
Technology Access in Oacoma
Computing Device Access in Oacoma
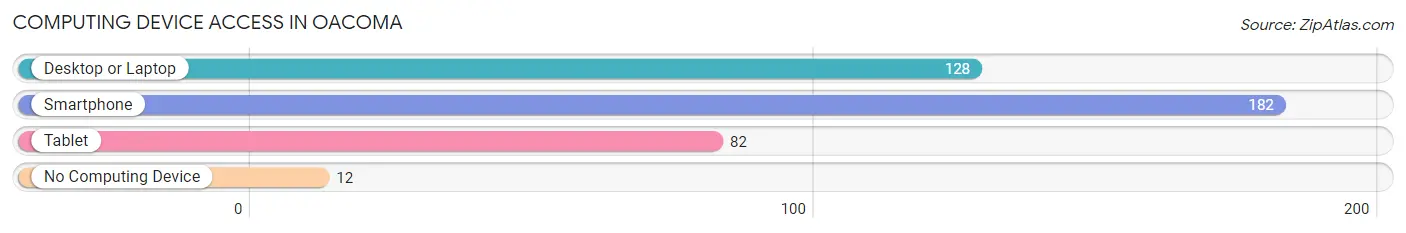
| Device Type | # Households | % Households |
| Desktop or Laptop | 128 | 63.0% |
| Smartphone | 182 | 89.7% |
| Tablet | 82 | 40.4% |
| No Computing Device | 12 | 5.9% |
| Total | 203 | 100.0% |
Internet Access in Oacoma
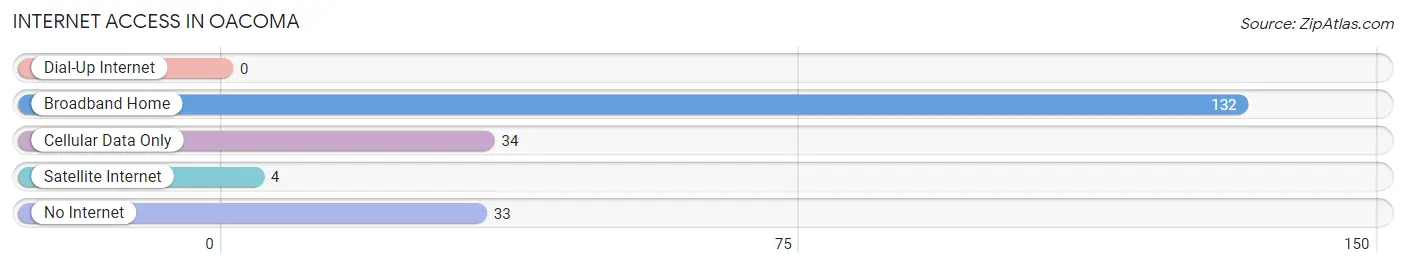
| Internet Type | # Households | % Households |
| Dial-Up Internet | 0 | 0.0% |
| Broadband Home | 132 | 65.0% |
| Cellular Data Only | 34 | 16.8% |
| Satellite Internet | 4 | 2.0% |
| No Internet | 33 | 16.3% |
| Total | 203 | 100.0% |
Oacoma Summary
Oacoma, South Dakota is a small town located in Lyman County, South Dakota, along the Missouri River. The town was founded in 1881 and is home to about 600 people. Oacoma is located in the heart of the Great Plains, and is surrounded by rolling hills and prairies.
History
Oacoma was founded in 1881 by a group of settlers from Wisconsin. The town was named after the Oacoma Indians, a Native American tribe that lived in the area. The town was originally a trading post and a ferry crossing on the Missouri River. In 1883, the first post office was established in Oacoma.
In the early 1900s, Oacoma became a popular tourist destination. The town was known for its scenic views of the Missouri River and its many attractions, such as the Oacoma Hotel, the Oacoma Opera House, and the Oacoma Amusement Park.
In the 1950s, Oacoma began to decline as a tourist destination. The town was bypassed by the interstate highway system, and the Oacoma Amusement Park closed in the 1960s. However, Oacoma still remains a popular destination for fishing, camping, and other outdoor activities.
Geography
Oacoma is located in Lyman County, South Dakota, along the Missouri River. The town is situated on the western edge of the Great Plains, and is surrounded by rolling hills and prairies. The town is located about 25 miles south of Chamberlain, South Dakota, and about 50 miles north of Pierre, South Dakota.
The climate in Oacoma is semi-arid, with hot summers and cold winters. The average annual temperature is around 50 degrees Fahrenheit, and the average annual precipitation is around 17 inches.
Economy
The economy of Oacoma is largely based on agriculture and tourism. The town is home to several farms and ranches, and is a popular destination for fishing, camping, and other outdoor activities.
The town is also home to several businesses, including a grocery store, a hardware store, a gas station, and a restaurant. The town also has a post office, a bank, and a library.
Demographics
As of the 2010 census, the population of Oacoma was 590. The racial makeup of the town was 97.2% White, 0.2% African American, 0.2% Native American, 0.2% Asian, 0.2% from other races, and 1.9% from two or more races.
The median household income in Oacoma was $37,500, and the median family income was $45,000. The per capita income in Oacoma was $18,000. About 11.2% of the population was below the poverty line.
Conclusion
Oacoma, South Dakota is a small town located in Lyman County, South Dakota, along the Missouri River. The town was founded in 1881 and is home to about 600 people. Oacoma is located in the heart of the Great Plains, and is surrounded by rolling hills and prairies. The economy of Oacoma is largely based on agriculture and tourism, and the town is a popular destination for fishing, camping, and other outdoor activities. The population of Oacoma is predominantly White, with a median household income of $37,500 and a median family income of $45,000.
Common Questions
What is Per Capita Income in Oacoma?
Per Capita income in Oacoma is $38,682.
What is the Median Family Income in Oacoma?
Median Family Income in Oacoma is $78,958.
What is the Median Household income in Oacoma?
Median Household Income in Oacoma is $67,083.
What is Income or Wage Gap in Oacoma?
Income or Wage Gap in Oacoma is 14.1%.
Women in Oacoma earn 85.9 cents for every dollar earned by a man.
What is Inequality or Gini Index in Oacoma?
Inequality or Gini Index in Oacoma is 0.39.
What is the Total Population of Oacoma?
Total Population of Oacoma is 406.
What is the Total Male Population of Oacoma?
Total Male Population of Oacoma is 225.
What is the Total Female Population of Oacoma?
Total Female Population of Oacoma is 181.
What is the Ratio of Males per 100 Females in Oacoma?
There are 124.31 Males per 100 Females in Oacoma.
What is the Ratio of Females per 100 Males in Oacoma?
There are 80.44 Females per 100 Males in Oacoma.
What is the Median Population Age in Oacoma?
Median Population Age in Oacoma is 57.3 Years.
What is the Average Family Size in Oacoma
Average Family Size in Oacoma is 2.6 People.
What is the Average Household Size in Oacoma
Average Household Size in Oacoma is 2.0 People.
How Large is the Labor Force in Oacoma?
There are 222 People in the Labor Forcein in Oacoma.
What is the Percentage of People in the Labor Force in Oacoma?
64.7% of People are in the Labor Force in Oacoma.
What is the Unemployment Rate in Oacoma?
Unemployment Rate in Oacoma is 5.9%.