Zip Codes with the Highest Percentage of Population with a Degree in Social Sciences in South Carolina
RELATED REPORTS & OPTIONS
Social Sciences
South Carolina
Compare Zip Codes
Map of Zip Codes with the Highest Percentage of Population with a Degree in Social Sciences in South Carolina
0.0%
80.0%
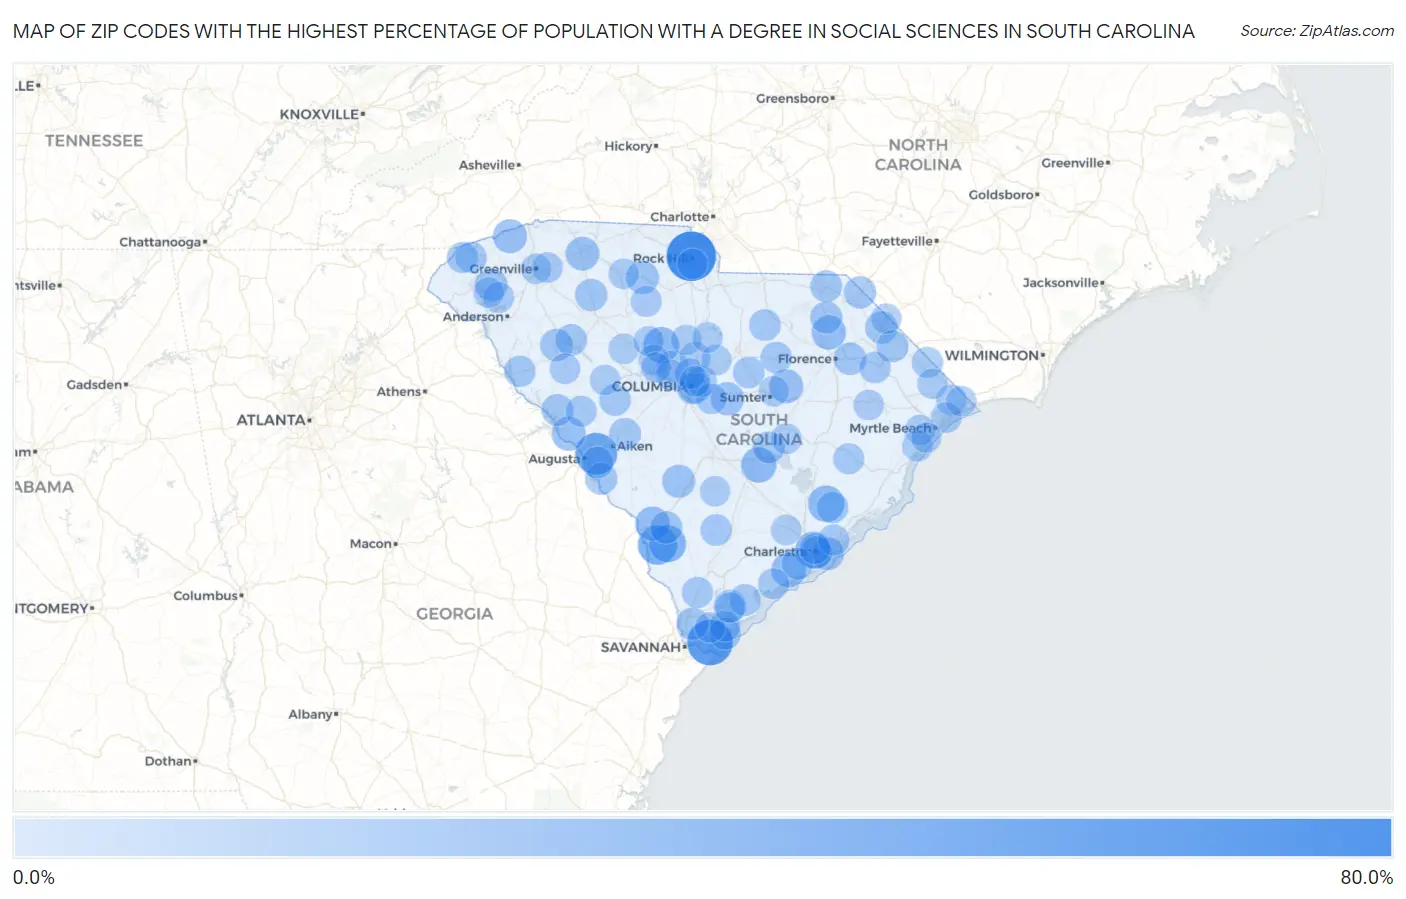
Zip Codes with the Highest Percentage of Population with a Degree in Social Sciences in South Carolina
| Zip Code | % Graduates | vs State | vs National | |
| 1. | 29733 | 63.2% | 6.8% (+56.4)#1 | 8.1% (+55.1)#85 |
| 2. | 29915 | 51.5% | 6.8% (+44.7)#2 | 8.1% (+43.4)#132 |
| 3. | 29816 | 40.9% | 6.8% (+34.2)#3 | 8.1% (+32.8)#233 |
| 4. | 29932 | 33.3% | 6.8% (+26.6)#4 | 8.1% (+25.3)#344 |
| 5. | 29923 | 27.3% | 6.8% (+20.5)#5 | 8.1% (+19.2)#525 |
| 6. | 29409 | 26.2% | 6.8% (+19.5)#6 | 8.1% (+18.2)#580 |
| 7. | 29434 | 25.0% | 6.8% (+18.2)#7 | 8.1% (+16.9)#635 |
| 8. | 29065 | 23.8% | 6.8% (+17.1)#8 | 8.1% (+15.7)#699 |
| 9. | 29163 | 22.2% | 6.8% (+15.5)#9 | 8.1% (+14.2)#797 |
| 10. | 29487 | 20.5% | 6.8% (+13.7)#10 | 8.1% (+12.4)#922 |
| 11. | 29810 | 19.6% | 6.8% (+12.8)#11 | 8.1% (+11.5)#1,011 |
| 12. | 29540 | 19.2% | 6.8% (+12.4)#12 | 8.1% (+11.1)#1,060 |
| 13. | 29635 | 18.4% | 6.8% (+11.6)#13 | 8.1% (+10.3)#1,175 |
| 14. | 29821 | 18.3% | 6.8% (+11.6)#14 | 8.1% (+10.2)#1,183 |
| 15. | 29104 | 18.3% | 6.8% (+11.5)#15 | 8.1% (+10.2)#1,187 |
| 16. | 29320 | 17.5% | 6.8% (+10.7)#16 | 8.1% (+9.43)#1,318 |
| 17. | 29044 | 16.3% | 6.8% (+9.52)#17 | 8.1% (+8.20)#1,568 |
| 18. | 29042 | 15.8% | 6.8% (+9.09)#18 | 8.1% (+7.77)#1,679 |
| 19. | 29364 | 15.8% | 6.8% (+9.04)#19 | 8.1% (+7.72)#1,697 |
| 20. | 29482 | 15.3% | 6.8% (+8.56)#20 | 8.1% (+7.24)#1,854 |
| 21. | 29935 | 14.5% | 6.8% (+7.77)#21 | 8.1% (+6.45)#2,135 |
| 22. | 29630 | 14.5% | 6.8% (+7.74)#22 | 8.1% (+6.42)#2,147 |
| 23. | 29827 | 14.2% | 6.8% (+7.42)#23 | 8.1% (+6.10)#2,282 |
| 24. | 29506 | 14.1% | 6.8% (+7.40)#24 | 8.1% (+6.08)#2,287 |
| 25. | 29401 | 14.1% | 6.8% (+7.31)#25 | 8.1% (+5.99)#2,329 |
| 26. | 29335 | 14.0% | 6.8% (+7.26)#26 | 8.1% (+5.94)#2,344 |
| 27. | 29653 | 13.9% | 6.8% (+7.17)#27 | 8.1% (+5.85)#2,381 |
| 28. | 29927 | 13.6% | 6.8% (+6.89)#28 | 8.1% (+5.57)#2,509 |
| 29. | 29570 | 13.6% | 6.8% (+6.81)#29 | 8.1% (+5.49)#2,562 |
| 30. | 29536 | 13.6% | 6.8% (+6.80)#30 | 8.1% (+5.48)#2,565 |
| 31. | 29593 | 13.2% | 6.8% (+6.49)#31 | 8.1% (+5.17)#2,709 |
| 32. | 29205 | 13.0% | 6.8% (+6.29)#32 | 8.1% (+4.97)#2,812 |
| 33. | 29845 | 12.7% | 6.8% (+5.94)#33 | 8.1% (+4.62)#3,010 |
| 34. | 29831 | 12.7% | 6.8% (+5.92)#34 | 8.1% (+4.60)#3,016 |
| 35. | 29543 | 12.7% | 6.8% (+5.92)#35 | 8.1% (+4.60)#3,020 |
| 36. | 29928 | 12.3% | 6.8% (+5.60)#36 | 8.1% (+4.28)#3,246 |
| 37. | 29596 | 12.3% | 6.8% (+5.59)#37 | 8.1% (+4.27)#3,247 |
| 38. | 29842 | 12.2% | 6.8% (+5.48)#38 | 8.1% (+4.16)#3,337 |
| 39. | 29384 | 12.2% | 6.8% (+5.43)#39 | 8.1% (+4.11)#3,366 |
| 40. | 29148 | 12.1% | 6.8% (+5.34)#40 | 8.1% (+4.02)#3,429 |
| 41. | 29455 | 12.1% | 6.8% (+5.34)#41 | 8.1% (+4.02)#3,430 |
| 42. | 29166 | 12.0% | 6.8% (+5.25)#42 | 8.1% (+3.93)#3,505 |
| 43. | 29063 | 11.9% | 6.8% (+5.20)#43 | 8.1% (+3.88)#3,535 |
| 44. | 29009 | 11.9% | 6.8% (+5.14)#44 | 8.1% (+3.82)#3,579 |
| 45. | 29805 | 11.8% | 6.8% (+5.06)#45 | 8.1% (+3.74)#3,649 |
| 46. | 29907 | 11.6% | 6.8% (+4.88)#46 | 8.1% (+3.56)#3,797 |
| 47. | 29571 | 11.4% | 6.8% (+4.70)#47 | 8.1% (+3.38)#3,955 |
| 48. | 29450 | 11.4% | 6.8% (+4.68)#48 | 8.1% (+3.36)#3,963 |
| 49. | 29128 | 11.4% | 6.8% (+4.66)#49 | 8.1% (+3.34)#3,987 |
| 50. | 29475 | 11.4% | 6.8% (+4.66)#50 | 8.1% (+3.34)#3,990 |
| 51. | 29628 | 11.2% | 6.8% (+4.46)#51 | 8.1% (+3.14)#4,158 |
| 52. | 29010 | 11.0% | 6.8% (+4.30)#52 | 8.1% (+2.98)#4,335 |
| 53. | 29201 | 10.6% | 6.8% (+3.89)#53 | 8.1% (+2.57)#4,764 |
| 54. | 29466 | 10.5% | 6.8% (+3.76)#54 | 8.1% (+2.44)#4,926 |
| 55. | 29545 | 10.4% | 6.8% (+3.68)#55 | 8.1% (+2.36)#5,027 |
| 56. | 29206 | 10.3% | 6.8% (+3.56)#56 | 8.1% (+2.24)#5,180 |
| 57. | 29676 | 10.3% | 6.8% (+3.50)#57 | 8.1% (+2.18)#5,240 |
| 58. | 29936 | 10.2% | 6.8% (+3.50)#58 | 8.1% (+2.18)#5,243 |
| 59. | 29510 | 10.2% | 6.8% (+3.50)#59 | 8.1% (+2.18)#5,245 |
| 60. | 29686 | 10.0% | 6.8% (+3.25)#60 | 8.1% (+1.93)#5,575 |
| 61. | 29438 | 10.0% | 6.8% (+3.22)#61 | 8.1% (+1.90)#5,612 |
| 62. | 29824 | 9.9% | 6.8% (+3.19)#62 | 8.1% (+1.87)#5,638 |
| 63. | 29031 | 9.8% | 6.8% (+3.03)#63 | 8.1% (+1.71)#5,840 |
| 64. | 29016 | 9.7% | 6.8% (+2.96)#64 | 8.1% (+1.64)#5,924 |
| 65. | 29403 | 9.5% | 6.8% (+2.72)#65 | 8.1% (+1.40)#6,246 |
| 66. | 29670 | 9.4% | 6.8% (+2.64)#66 | 8.1% (+1.32)#6,368 |
| 67. | 29568 | 9.4% | 6.8% (+2.60)#67 | 8.1% (+1.28)#6,423 |
| 68. | 29075 | 9.3% | 6.8% (+2.57)#68 | 8.1% (+1.25)#6,458 |
| 69. | 29926 | 9.3% | 6.8% (+2.56)#69 | 8.1% (+1.24)#6,472 |
| 70. | 29212 | 9.2% | 6.8% (+2.48)#70 | 8.1% (+1.16)#6,576 |
| 71. | 29203 | 9.2% | 6.8% (+2.43)#71 | 8.1% (+1.11)#6,659 |
| 72. | 29102 | 9.2% | 6.8% (+2.42)#72 | 8.1% (+1.10)#6,668 |
| 73. | 29646 | 9.0% | 6.8% (+2.24)#73 | 8.1% (+0.917)#6,980 |
| 74. | 29061 | 8.9% | 6.8% (+2.20)#74 | 8.1% (+0.877)#7,039 |
| 75. | 29045 | 8.9% | 6.8% (+2.14)#75 | 8.1% (+0.816)#7,141 |
| 76. | 29631 | 8.8% | 6.8% (+2.10)#76 | 8.1% (+0.776)#7,195 |
| 77. | 29572 | 8.8% | 6.8% (+2.05)#77 | 8.1% (+0.725)#7,277 |
| 78. | 29353 | 8.8% | 6.8% (+2.04)#78 | 8.1% (+0.724)#7,282 |
| 79. | 29730 | 8.8% | 6.8% (+2.01)#79 | 8.1% (+0.688)#7,331 |
| 80. | 29615 | 8.7% | 6.8% (+1.99)#80 | 8.1% (+0.670)#7,361 |
| 81. | 29910 | 8.7% | 6.8% (+1.98)#81 | 8.1% (+0.657)#7,379 |
| 82. | 29566 | 8.7% | 6.8% (+1.95)#82 | 8.1% (+0.632)#7,415 |
| 83. | 29180 | 8.7% | 6.8% (+1.93)#83 | 8.1% (+0.611)#7,467 |
| 84. | 29204 | 8.6% | 6.8% (+1.89)#84 | 8.1% (+0.572)#7,526 |
| 85. | 29130 | 8.6% | 6.8% (+1.89)#85 | 8.1% (+0.565)#7,546 |
| 86. | 29601 | 8.5% | 6.8% (+1.79)#86 | 8.1% (+0.475)#7,718 |
| 87. | 29108 | 8.5% | 6.8% (+1.76)#87 | 8.1% (+0.440)#7,775 |
| 88. | 29547 | 8.5% | 6.8% (+1.72)#88 | 8.1% (+0.403)#7,858 |
| 89. | 29153 | 8.5% | 6.8% (+1.71)#89 | 8.1% (+0.393)#7,881 |
| 90. | 29126 | 8.4% | 6.8% (+1.64)#90 | 8.1% (+0.324)#8,000 |
| 91. | 29569 | 8.4% | 6.8% (+1.64)#91 | 8.1% (+0.322)#8,005 |
| 92. | 29576 | 8.4% | 6.8% (+1.64)#92 | 8.1% (+0.322)#8,007 |
| 93. | 29138 | 8.4% | 6.8% (+1.62)#93 | 8.1% (+0.304)#8,047 |
| 94. | 29588 | 8.4% | 6.8% (+1.60)#94 | 8.1% (+0.283)#8,077 |
| 95. | 29485 | 8.3% | 6.8% (+1.56)#95 | 8.1% (+0.244)#8,157 |
| 96. | 29036 | 8.3% | 6.8% (+1.53)#96 | 8.1% (+0.215)#8,197 |
| 97. | 29432 | 8.3% | 6.8% (+1.50)#97 | 8.1% (+0.180)#8,266 |
| 98. | 29555 | 8.2% | 6.8% (+1.46)#98 | 8.1% (+0.137)#8,344 |
| 99. | 29575 | 8.2% | 6.8% (+1.41)#99 | 8.1% (+0.087)#8,444 |
| 100. | 29902 | 8.2% | 6.8% (+1.40)#100 | 8.1% (+0.084)#8,448 |
Common Questions
What are the Top 10 Zip Codes with the Highest Percentage of Population with a Degree in Social Sciences in South Carolina?
Top 10 Zip Codes with the Highest Percentage of Population with a Degree in Social Sciences in South Carolina are:
What zip code has the Highest Percentage of Population with a Degree in Social Sciences in South Carolina?
29733 has the Highest Percentage of Population with a Degree in Social Sciences in South Carolina with 63.2%.
What is the Percentage of Population with a Degree in Social Sciences in the State of South Carolina?
Percentage of Population with a Degree in Social Sciences in South Carolina is 6.8%.
What is the Percentage of Population with a Degree in Social Sciences in the United States?
Percentage of Population with a Degree in Social Sciences in the United States is 8.1%.