Fairfax, OK Map & Demographics
Fairfax Map
Fairfax Overview
$20,992
PER CAPITA INCOME
$51,563
AVG FAMILY INCOME
$38,889
AVG HOUSEHOLD INCOME
34.5%
WAGE / INCOME GAP [ % ]
65.5¢/ $1
WAGE / INCOME GAP [ $ ]
$11,942
FAMILY INCOME DEFICIT
0.44
INEQUALITY / GINI INDEX
1,172
TOTAL POPULATION
580
MALE POPULATION
592
FEMALE POPULATION
97.97
MALES / 100 FEMALES
102.07
FEMALES / 100 MALES
42.5
MEDIAN AGE
3.1
AVG FAMILY SIZE
2.5
AVG HOUSEHOLD SIZE
459
LABOR FORCE [ PEOPLE ]
50.7%
PERCENT IN LABOR FORCE
15.0%
UNEMPLOYMENT RATE
Fairfax Zip Codes
Fairfax Area Codes
Income in Fairfax
Income Overview in Fairfax
Per Capita Income in Fairfax is $20,992, while median incomes of families and households are $51,563 and $38,889 respectively.
| Characteristic | Number | Measure |
| Per Capita Income | 1,172 | $20,992 |
| Median Family Income | 293 | $51,563 |
| Mean Family Income | 293 | $61,754 |
| Median Household Income | 446 | $38,889 |
| Mean Household Income | 446 | $51,251 |
| Income Deficit | 293 | $11,942 |
| Wage / Income Gap (%) | 1,172 | 34.45% |
| Wage / Income Gap ($) | 1,172 | 65.55¢ per $1 |
| Gini / Inequality Index | 1,172 | 0.44 |
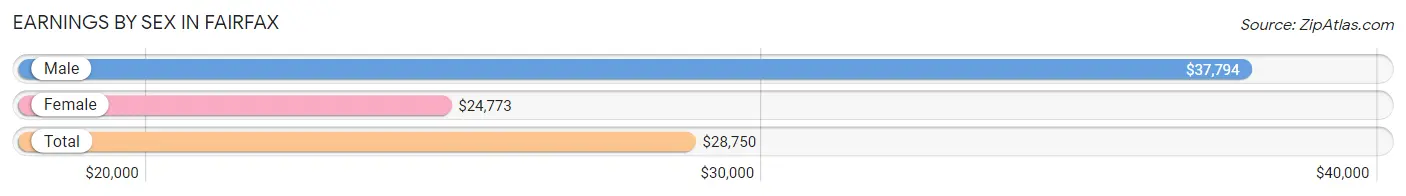
Earnings by Sex in Fairfax
Average Earnings in Fairfax are $28,750, $37,794 for men and $24,773 for women, a difference of 34.4%.
| Sex | Number | Average Earnings |
| Male | 244 (52.4%) | $37,794 |
| Female | 222 (47.6%) | $24,773 |
| Total | 466 (100.0%) | $28,750 |
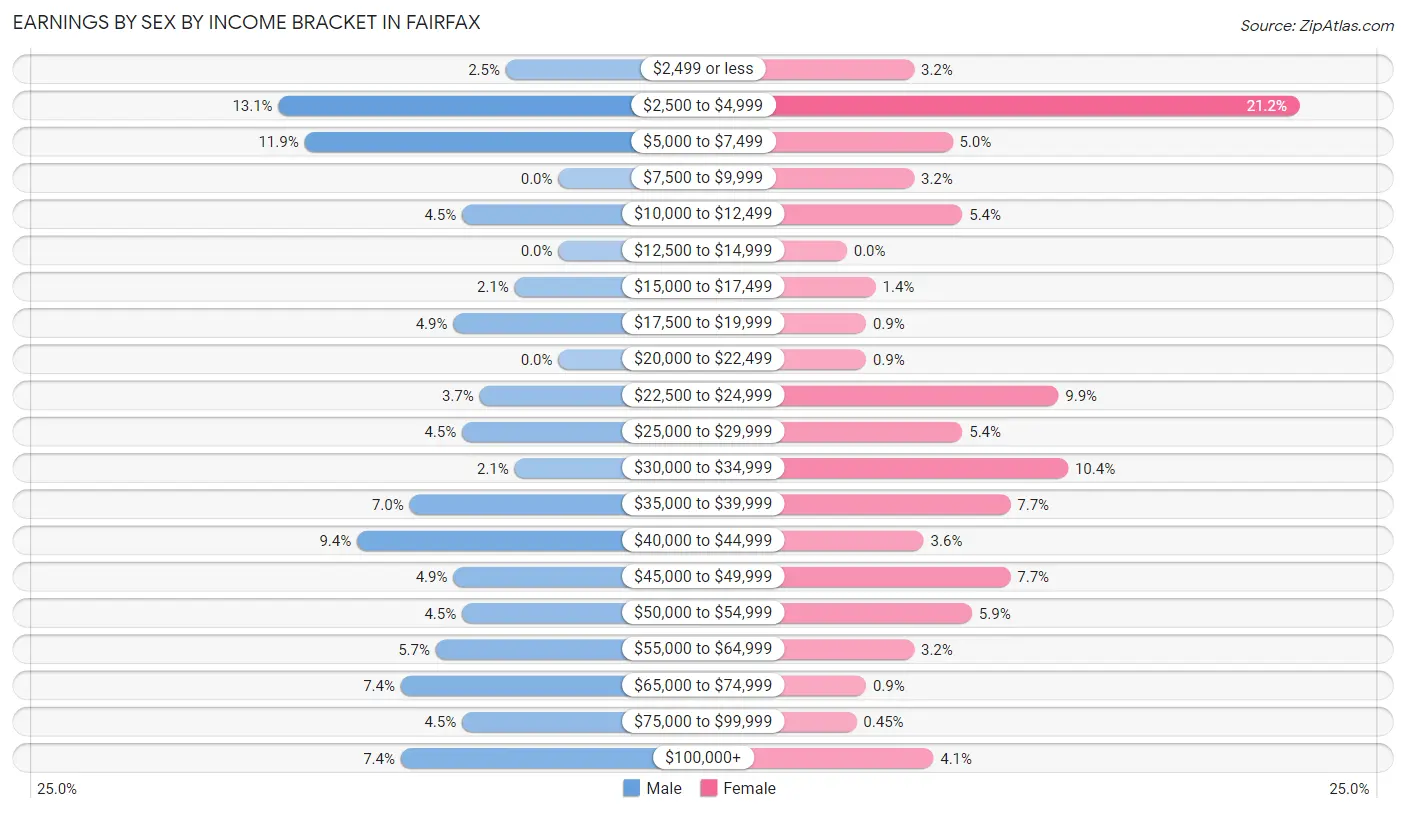
Earnings by Sex by Income Bracket in Fairfax
The most common earnings brackets in Fairfax are $2,500 to $4,999 for men (32 | 13.1%) and $2,500 to $4,999 for women (47 | 21.2%).
| Income | Male | Female |
| $2,499 or less | 6 (2.5%) | 7 (3.2%) |
| $2,500 to $4,999 | 32 (13.1%) | 47 (21.2%) |
| $5,000 to $7,499 | 29 (11.9%) | 11 (5.0%) |
| $7,500 to $9,999 | 0 (0.0%) | 7 (3.2%) |
| $10,000 to $12,499 | 11 (4.5%) | 12 (5.4%) |
| $12,500 to $14,999 | 0 (0.0%) | 0 (0.0%) |
| $15,000 to $17,499 | 5 (2.1%) | 3 (1.3%) |
| $17,500 to $19,999 | 12 (4.9%) | 2 (0.9%) |
| $20,000 to $22,499 | 0 (0.0%) | 2 (0.9%) |
| $22,500 to $24,999 | 9 (3.7%) | 22 (9.9%) |
| $25,000 to $29,999 | 11 (4.5%) | 12 (5.4%) |
| $30,000 to $34,999 | 5 (2.1%) | 23 (10.4%) |
| $35,000 to $39,999 | 17 (7.0%) | 17 (7.7%) |
| $40,000 to $44,999 | 23 (9.4%) | 8 (3.6%) |
| $45,000 to $49,999 | 12 (4.9%) | 17 (7.7%) |
| $50,000 to $54,999 | 11 (4.5%) | 13 (5.9%) |
| $55,000 to $64,999 | 14 (5.7%) | 7 (3.2%) |
| $65,000 to $74,999 | 18 (7.4%) | 2 (0.9%) |
| $75,000 to $99,999 | 11 (4.5%) | 1 (0.4%) |
| $100,000+ | 18 (7.4%) | 9 (4.1%) |
| Total | 244 (100.0%) | 222 (100.0%) |
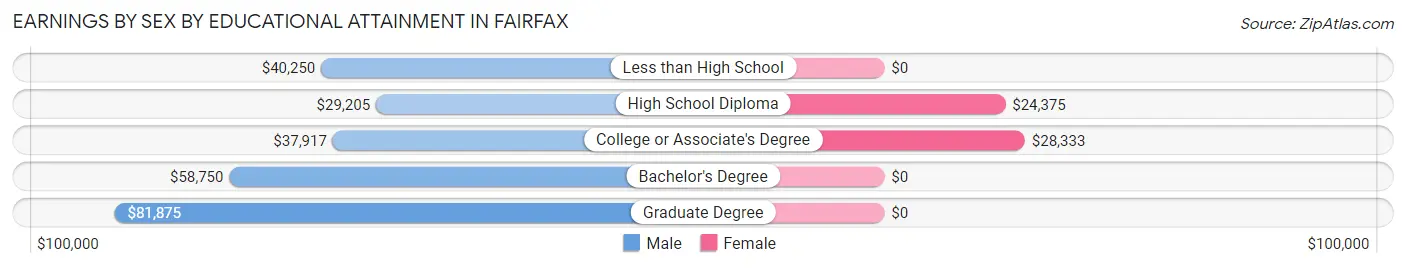
Earnings by Sex by Educational Attainment in Fairfax
Average earnings in Fairfax are $38,603 for men and $26,250 for women, a difference of 32.0%. Men with an educational attainment of graduate degree enjoy the highest average annual earnings of $81,875, while those with high school diploma education earn the least with $29,205. Women with an educational attainment of college or associate's degree earn the most with the average annual earnings of $28,333, while those with high school diploma education have the smallest earnings of $24,375.
| Educational Attainment | Male Income | Female Income |
| Less than High School | $40,250 | $0 |
| High School Diploma | $29,205 | $24,375 |
| College or Associate's Degree | $37,917 | $28,333 |
| Bachelor's Degree | $58,750 | $0 |
| Graduate Degree | $81,875 | $0 |
| Total | $38,603 | $26,250 |
Family Income in Fairfax
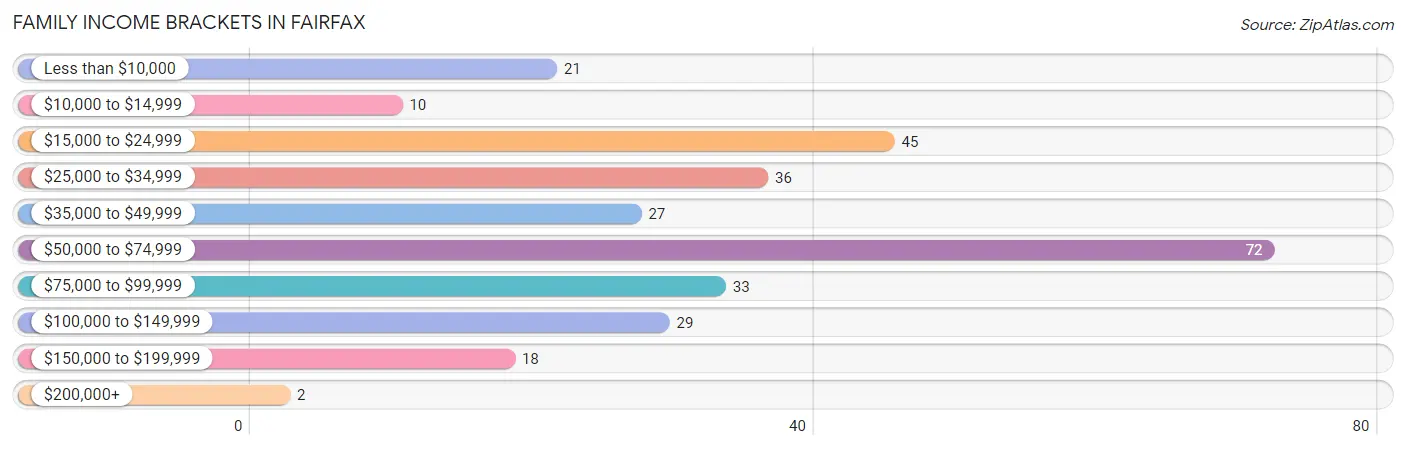
Family Income Brackets in Fairfax
According to the Fairfax family income data, there are 72 families falling into the $50,000 to $74,999 income range, which is the most common income bracket and makes up 24.6% of all families. Conversely, the $200,000+ income bracket is the least frequent group with only 2 families (0.7%) belonging to this category.
| Income Bracket | # Families | % Families |
| Less than $10,000 | 21 | 7.2% |
| $10,000 to $14,999 | 10 | 3.4% |
| $15,000 to $24,999 | 45 | 15.4% |
| $25,000 to $34,999 | 36 | 12.3% |
| $35,000 to $49,999 | 27 | 9.2% |
| $50,000 to $74,999 | 72 | 24.6% |
| $75,000 to $99,999 | 33 | 11.3% |
| $100,000 to $149,999 | 29 | 9.9% |
| $150,000 to $199,999 | 18 | 6.1% |
| $200,000+ | 2 | 0.7% |
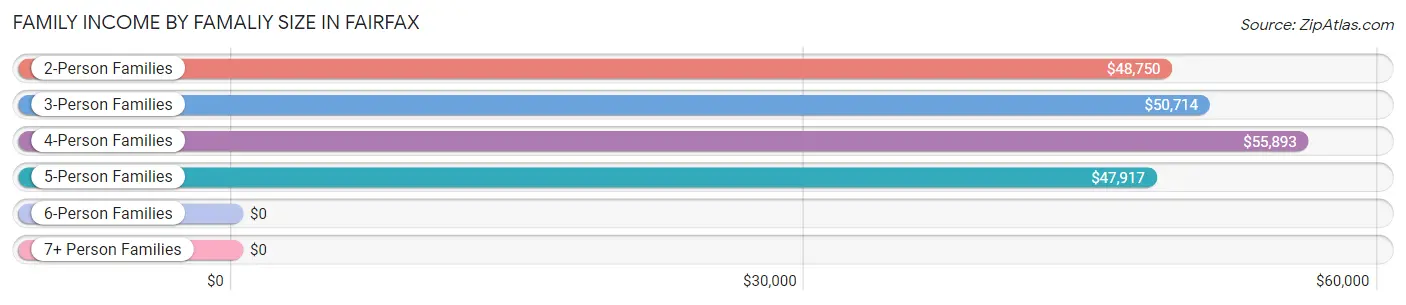
Family Income by Famaliy Size in Fairfax
4-person families (63 | 21.5%) account for the highest median family income in Fairfax with $55,893 per family, while 2-person families (154 | 52.6%) have the highest median income of $24,375 per family member.
| Income Bracket | # Families | Median Income |
| 2-Person Families | 154 (52.6%) | $48,750 |
| 3-Person Families | 56 (19.1%) | $50,714 |
| 4-Person Families | 63 (21.5%) | $55,893 |
| 5-Person Families | 9 (3.1%) | $47,917 |
| 6-Person Families | 9 (3.1%) | $0 |
| 7+ Person Families | 2 (0.7%) | $0 |
| Total | 293 (100.0%) | $51,563 |
Family Income by Number of Earners in Fairfax
The median family income in Fairfax is $51,563, with families comprising 3+ earners (8) having the highest median family income of $80,625, while families with no earners (67) have the lowest median family income of $27,875, accounting for 2.7% and 22.9% of families, respectively.

| Number of Earners | # Families | Median Income |
| No Earners | 67 (22.9%) | $27,875 |
| 1 Earner | 123 (42.0%) | $39,688 |
| 2 Earners | 95 (32.4%) | $75,341 |
| 3+ Earners | 8 (2.7%) | $80,625 |
| Total | 293 (100.0%) | $51,563 |
Household Income in Fairfax
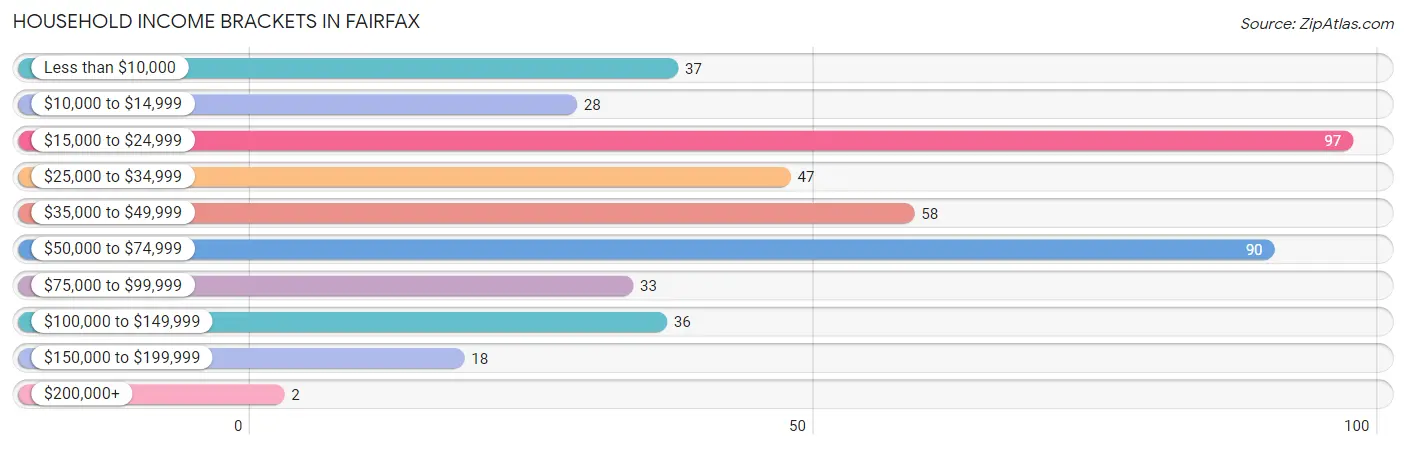
Household Income Brackets in Fairfax
With 97 households falling in the category, the $15,000 to $24,999 income range is the most frequent in Fairfax, accounting for 21.7% of all households. In contrast, only 2 households (0.4%) fall into the $200,000+ income bracket, making it the least populous group.
| Income Bracket | # Households | % Households |
| Less than $10,000 | 37 | 8.3% |
| $10,000 to $14,999 | 28 | 6.3% |
| $15,000 to $24,999 | 97 | 21.7% |
| $25,000 to $34,999 | 47 | 10.5% |
| $35,000 to $49,999 | 58 | 13.0% |
| $50,000 to $74,999 | 90 | 20.2% |
| $75,000 to $99,999 | 33 | 7.4% |
| $100,000 to $149,999 | 36 | 8.1% |
| $150,000 to $199,999 | 18 | 4.0% |
| $200,000+ | 2 | 0.4% |
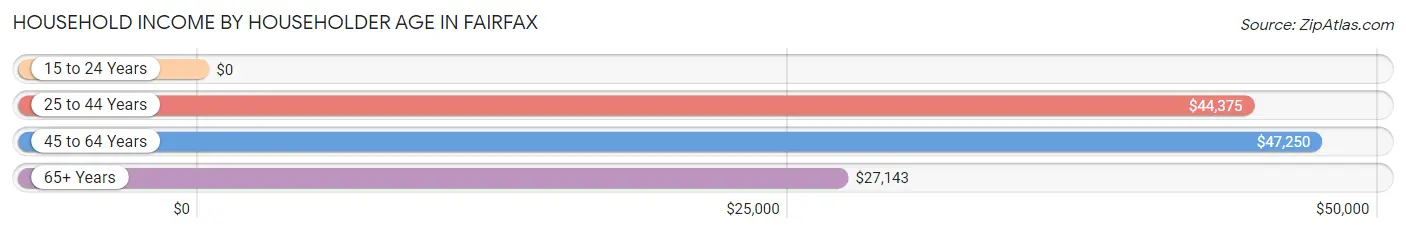
Household Income by Householder Age in Fairfax
The median household income in Fairfax is $38,889, with the highest median household income of $47,250 found in the 45 to 64 years age bracket for the primary householder. A total of 139 households (31.2%) fall into this category. Meanwhile, the 15 to 24 years age bracket for the primary householder has the lowest median household income of $0, with 4 households (0.9%) in this group.
| Income Bracket | # Households | Median Income |
| 15 to 24 Years | 4 (0.9%) | $0 |
| 25 to 44 Years | 139 (31.2%) | $44,375 |
| 45 to 64 Years | 139 (31.2%) | $47,250 |
| 65+ Years | 164 (36.8%) | $27,143 |
| Total | 446 (100.0%) | $38,889 |
Poverty in Fairfax
Income Below Poverty by Sex and Age in Fairfax
With 23.5% poverty level for males and 21.4% for females among the residents of Fairfax, 12 to 14 year old males and 16 and 17 year old females are the most vulnerable to poverty, with 16 males (55.2%) and 5 females (55.6%) in their respective age groups living below the poverty level.
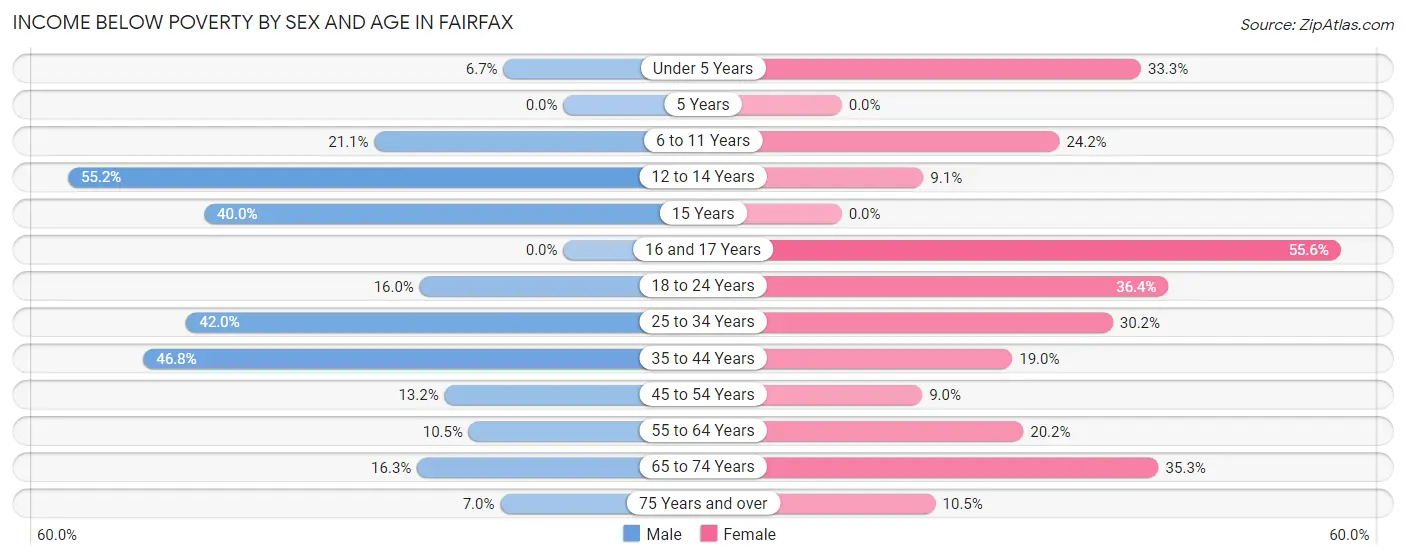
| Age Bracket | Male | Female |
| Under 5 Years | 2 (6.7%) | 14 (33.3%) |
| 5 Years | 0 (0.0%) | 0 (0.0%) |
| 6 to 11 Years | 16 (21.0%) | 8 (24.2%) |
| 12 to 14 Years | 16 (55.2%) | 2 (9.1%) |
| 15 Years | 2 (40.0%) | 0 (0.0%) |
| 16 and 17 Years | 0 (0.0%) | 5 (55.6%) |
| 18 to 24 Years | 4 (16.0%) | 12 (36.4%) |
| 25 to 34 Years | 34 (42.0%) | 16 (30.2%) |
| 35 to 44 Years | 29 (46.8%) | 15 (19.0%) |
| 45 to 54 Years | 9 (13.2%) | 6 (9.0%) |
| 55 to 64 Years | 8 (10.5%) | 19 (20.2%) |
| 65 to 74 Years | 7 (16.3%) | 18 (35.3%) |
| 75 Years and over | 4 (7.0%) | 7 (10.4%) |
| Total | 131 (23.5%) | 122 (21.4%) |
Income Above Poverty by Sex and Age in Fairfax
According to the poverty statistics in Fairfax, males aged 16 and 17 years and females aged 5 years are the age groups that are most secure financially, with 100.0% of males and 100.0% of females in these age groups living above the poverty line.
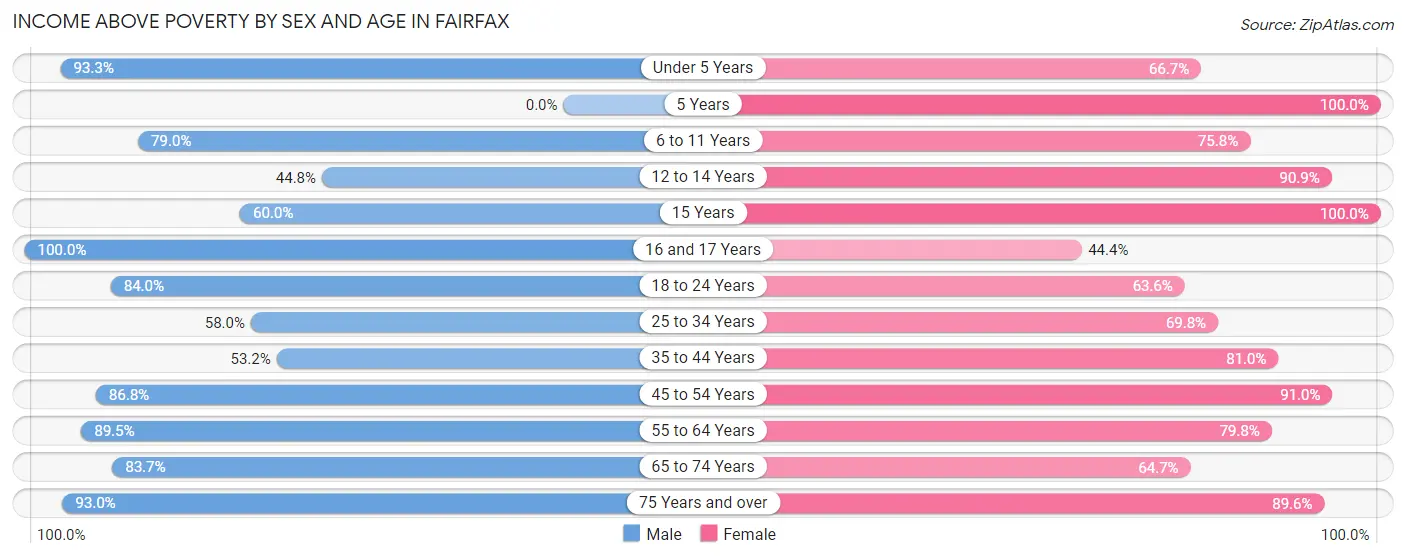
| Age Bracket | Male | Female |
| Under 5 Years | 28 (93.3%) | 28 (66.7%) |
| 5 Years | 0 (0.0%) | 7 (100.0%) |
| 6 to 11 Years | 60 (78.9%) | 25 (75.8%) |
| 12 to 14 Years | 13 (44.8%) | 20 (90.9%) |
| 15 Years | 3 (60.0%) | 14 (100.0%) |
| 16 and 17 Years | 6 (100.0%) | 4 (44.4%) |
| 18 to 24 Years | 21 (84.0%) | 21 (63.6%) |
| 25 to 34 Years | 47 (58.0%) | 37 (69.8%) |
| 35 to 44 Years | 33 (53.2%) | 64 (81.0%) |
| 45 to 54 Years | 59 (86.8%) | 61 (91.0%) |
| 55 to 64 Years | 68 (89.5%) | 75 (79.8%) |
| 65 to 74 Years | 36 (83.7%) | 33 (64.7%) |
| 75 Years and over | 53 (93.0%) | 60 (89.5%) |
| Total | 427 (76.5%) | 449 (78.6%) |
Income Below Poverty Among Married-Couple Families in Fairfax
The poverty statistics for married-couple families in Fairfax show that 13.0% or 22 of the total 169 families live below the poverty line. Families with 1 or 2 children have the highest poverty rate of 27.8%, comprising of 15 families. On the other hand, families with 3 or 4 children have the lowest poverty rate of 0.0%, which includes 0 families.
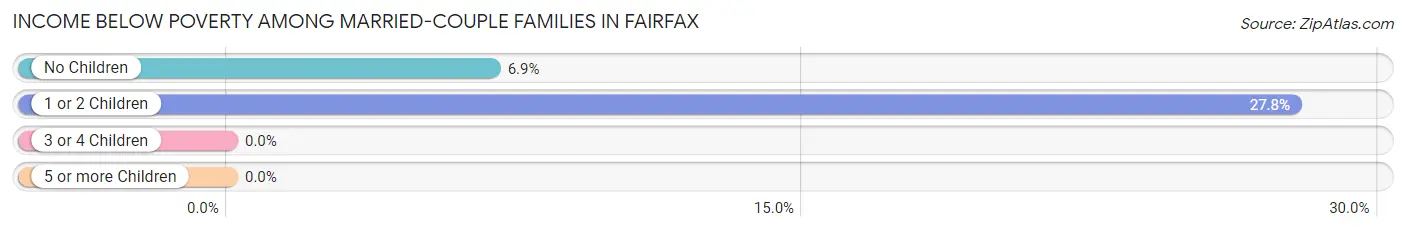
| Children | Above Poverty | Below Poverty |
| No Children | 95 (93.1%) | 7 (6.9%) |
| 1 or 2 Children | 39 (72.2%) | 15 (27.8%) |
| 3 or 4 Children | 11 (100.0%) | 0 (0.0%) |
| 5 or more Children | 2 (100.0%) | 0 (0.0%) |
| Total | 147 (87.0%) | 22 (13.0%) |
Income Below Poverty Among Single-Parent Households in Fairfax
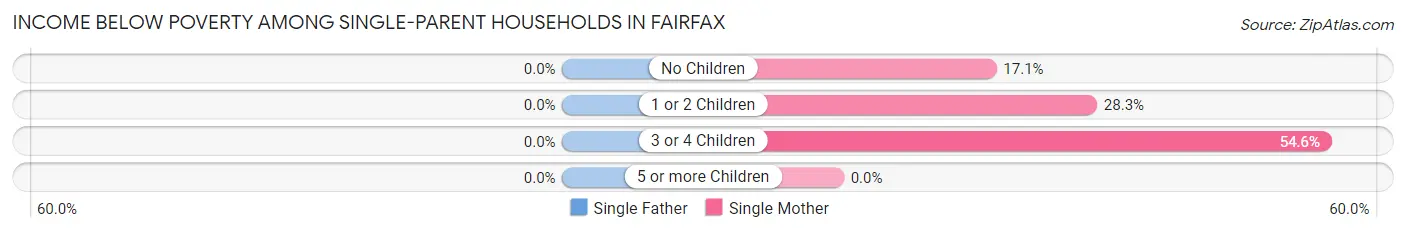
| Children | Single Father | Single Mother |
| No Children | 0 (0.0%) | 7 (17.1%) |
| 1 or 2 Children | 0 (0.0%) | 15 (28.3%) |
| 3 or 4 Children | 0 (0.0%) | 6 (54.5%) |
| 5 or more Children | 0 (0.0%) | 0 (0.0%) |
| Total | 0 (0.0%) | 28 (26.7%) |
Income Below Poverty Among Married-Couple vs Single-Parent Households in Fairfax
The poverty data for Fairfax shows that 22 of the married-couple family households (13.0%) and 28 of the single-parent households (22.6%) are living below the poverty level. Within the married-couple family households, those with 1 or 2 children have the highest poverty rate, with 15 households (27.8%) falling below the poverty line. Among the single-parent households, those with 3 or 4 children have the highest poverty rate, with 6 household (54.5%) living below poverty.
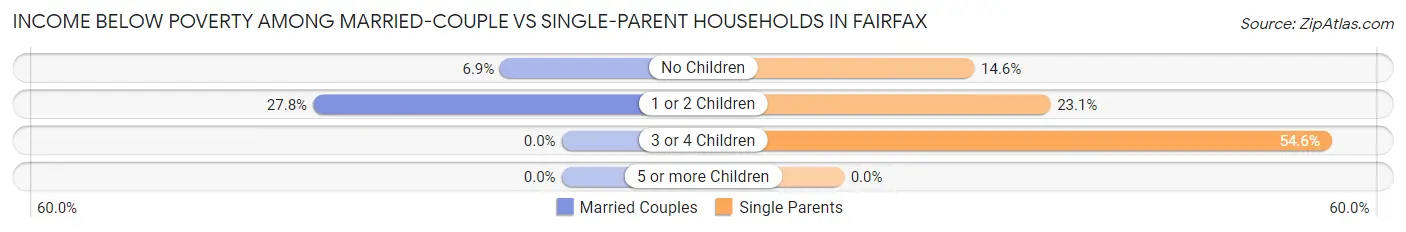
| Children | Married-Couple Families | Single-Parent Households |
| No Children | 7 (6.9%) | 7 (14.6%) |
| 1 or 2 Children | 15 (27.8%) | 15 (23.1%) |
| 3 or 4 Children | 0 (0.0%) | 6 (54.5%) |
| 5 or more Children | 0 (0.0%) | 0 (0.0%) |
| Total | 22 (13.0%) | 28 (22.6%) |
Race in Fairfax
The most populous races in Fairfax are White / Caucasian (671 | 57.3%), Native / Alaskan (254 | 21.7%), and Two or more Races (187 | 16.0%).
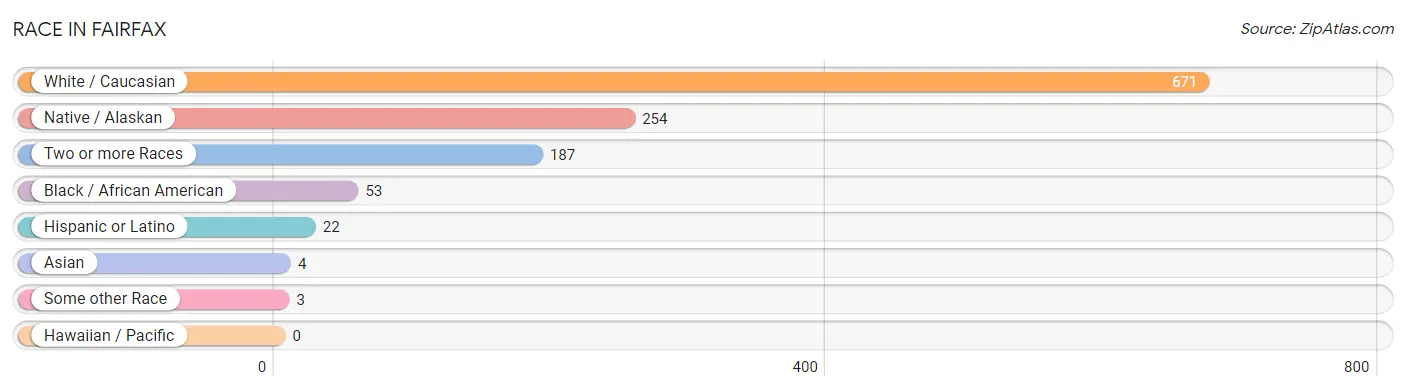
| Race | # Population | % Population |
| Asian | 4 | 0.3% |
| Black / African American | 53 | 4.5% |
| Hawaiian / Pacific | 0 | 0.0% |
| Hispanic or Latino | 22 | 1.9% |
| Native / Alaskan | 254 | 21.7% |
| White / Caucasian | 671 | 57.3% |
| Two or more Races | 187 | 16.0% |
| Some other Race | 3 | 0.3% |
| Total | 1,172 | 100.0% |
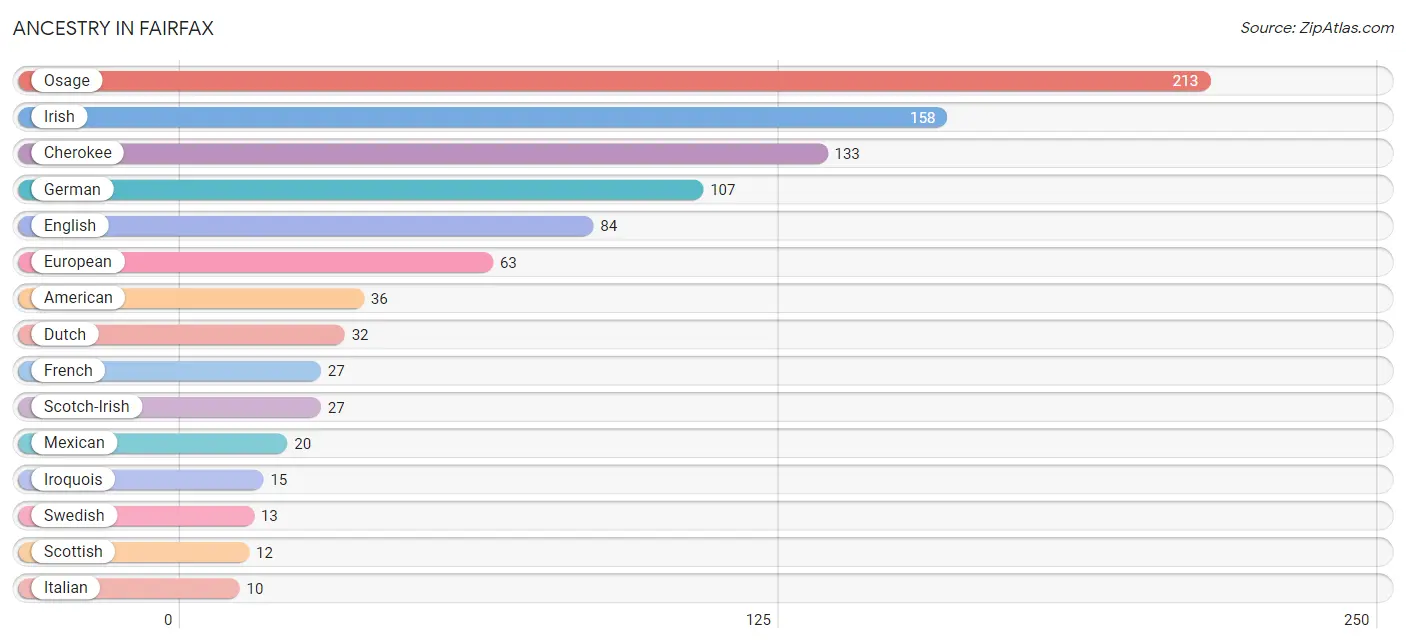
Ancestry in Fairfax
The most populous ancestries reported in Fairfax are Osage (213 | 18.2%), Irish (158 | 13.5%), Cherokee (133 | 11.4%), German (107 | 9.1%), and English (84 | 7.2%), together accounting for 59.3% of all Fairfax residents.
| Ancestry | # Population | % Population |
| American | 36 | 3.1% |
| Arapaho | 2 | 0.2% |
| Bhutanese | 9 | 0.8% |
| British | 5 | 0.4% |
| Canadian | 4 | 0.3% |
| Celtic | 7 | 0.6% |
| Cherokee | 133 | 11.4% |
| Choctaw | 7 | 0.6% |
| Creek | 2 | 0.2% |
| Czech | 3 | 0.3% |
| Delaware | 2 | 0.2% |
| Dutch | 32 | 2.7% |
| English | 84 | 7.2% |
| European | 63 | 5.4% |
| French | 27 | 2.3% |
| German | 107 | 9.1% |
| Irish | 158 | 13.5% |
| Iroquois | 15 | 1.3% |
| Italian | 10 | 0.9% |
| Korean | 4 | 0.3% |
| Mexican | 20 | 1.7% |
| Navajo | 2 | 0.2% |
| Nigerian | 3 | 0.3% |
| Norwegian | 8 | 0.7% |
| Osage | 213 | 18.2% |
| Pennsylvania German | 4 | 0.3% |
| Polish | 2 | 0.2% |
| Scandinavian | 6 | 0.5% |
| Scotch-Irish | 27 | 2.3% |
| Scottish | 12 | 1.0% |
| Sri Lankan | 5 | 0.4% |
| Subsaharan African | 3 | 0.3% |
| Swedish | 13 | 1.1% |
| Swiss | 4 | 0.3% | View All 34 Rows |
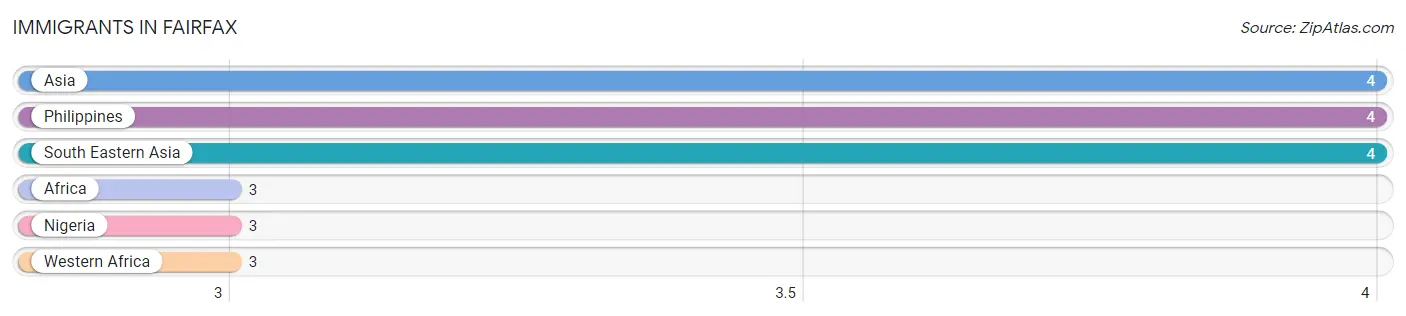
Immigrants in Fairfax
The most numerous immigrant groups reported in Fairfax came from Asia (4 | 0.3%), Philippines (4 | 0.3%), South Eastern Asia (4 | 0.3%), Africa (3 | 0.3%), and Nigeria (3 | 0.3%), together accounting for 1.5% of all Fairfax residents.
| Immigration Origin | # Population | % Population |
| Africa | 3 | 0.3% |
| Asia | 4 | 0.3% |
| Nigeria | 3 | 0.3% |
| Philippines | 4 | 0.3% |
| South Eastern Asia | 4 | 0.3% |
| Western Africa | 3 | 0.3% | View All 6 Rows |
Sex and Age in Fairfax
Sex and Age in Fairfax
The most populous age groups in Fairfax are 10 to 14 Years (82 | 14.1%) for men and 60 to 64 Years (66 | 11.2%) for women.
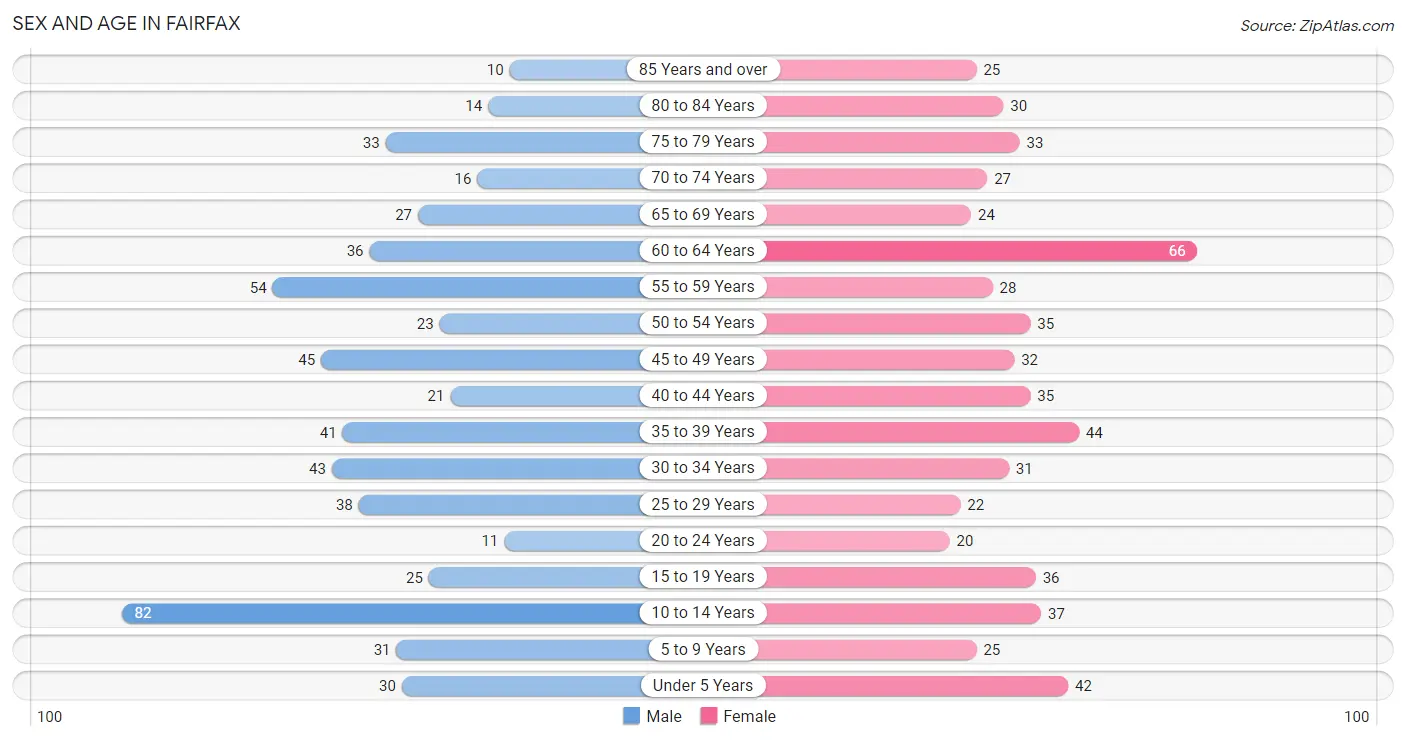
| Age Bracket | Male | Female |
| Under 5 Years | 30 (5.2%) | 42 (7.1%) |
| 5 to 9 Years | 31 (5.3%) | 25 (4.2%) |
| 10 to 14 Years | 82 (14.1%) | 37 (6.2%) |
| 15 to 19 Years | 25 (4.3%) | 36 (6.1%) |
| 20 to 24 Years | 11 (1.9%) | 20 (3.4%) |
| 25 to 29 Years | 38 (6.6%) | 22 (3.7%) |
| 30 to 34 Years | 43 (7.4%) | 31 (5.2%) |
| 35 to 39 Years | 41 (7.1%) | 44 (7.4%) |
| 40 to 44 Years | 21 (3.6%) | 35 (5.9%) |
| 45 to 49 Years | 45 (7.8%) | 32 (5.4%) |
| 50 to 54 Years | 23 (4.0%) | 35 (5.9%) |
| 55 to 59 Years | 54 (9.3%) | 28 (4.7%) |
| 60 to 64 Years | 36 (6.2%) | 66 (11.2%) |
| 65 to 69 Years | 27 (4.7%) | 24 (4.1%) |
| 70 to 74 Years | 16 (2.8%) | 27 (4.6%) |
| 75 to 79 Years | 33 (5.7%) | 33 (5.6%) |
| 80 to 84 Years | 14 (2.4%) | 30 (5.1%) |
| 85 Years and over | 10 (1.7%) | 25 (4.2%) |
| Total | 580 (100.0%) | 592 (100.0%) |
Families and Households in Fairfax
Median Family Size in Fairfax
The median family size in Fairfax is 3.09 persons per family, with single female/mother families (105 | 35.8%) accounting for the largest median family size of 3.12 persons per family. On the other hand, single male/father families (19 | 6.5%) represent the smallest median family size with 3.00 persons per family.
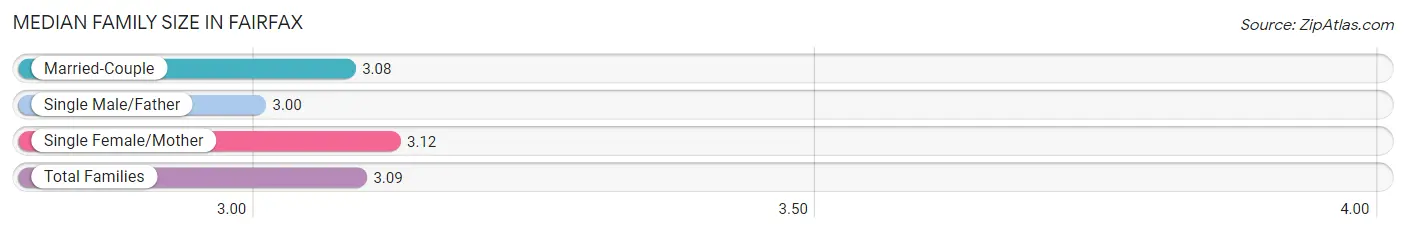
| Family Type | # Families | Family Size |
| Married-Couple | 169 (57.7%) | 3.08 |
| Single Male/Father | 19 (6.5%) | 3.00 |
| Single Female/Mother | 105 (35.8%) | 3.12 |
| Total Families | 293 (100.0%) | 3.09 |
Median Household Size in Fairfax
The median household size in Fairfax is 2.55 persons per household, with single male/father households (19 | 4.3%) accounting for the largest median household size of 3.63 persons per household. non-family households (153 | 34.3%) represent the smallest median household size with 1.04 persons per household.
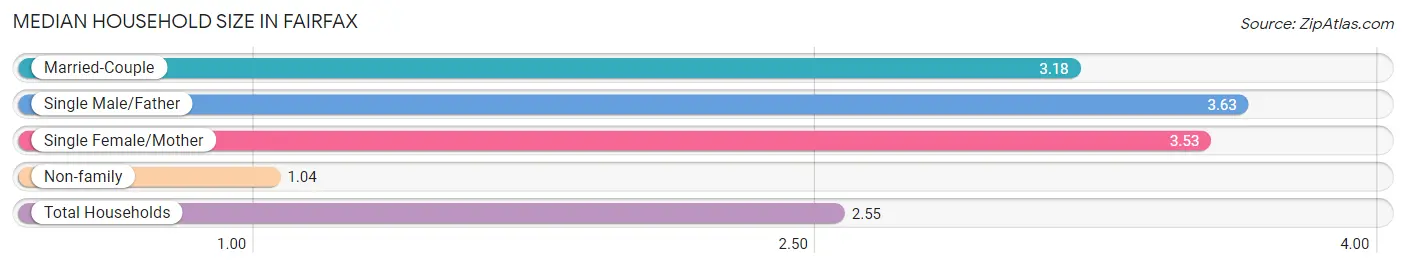
| Household Type | # Households | Household Size |
| Married-Couple | 169 (37.9%) | 3.18 |
| Single Male/Father | 19 (4.3%) | 3.63 |
| Single Female/Mother | 105 (23.5%) | 3.53 |
| Non-family | 153 (34.3%) | 1.04 |
| Total Households | 446 (100.0%) | 2.55 |
Household Size by Marriage Status in Fairfax
Out of a total of 446 households in Fairfax, 293 (65.7%) are family households, while 153 (34.3%) are nonfamily households. The most numerous type of family households are 2-person households, comprising 133, and the most common type of nonfamily households are 1-person households, comprising 150.
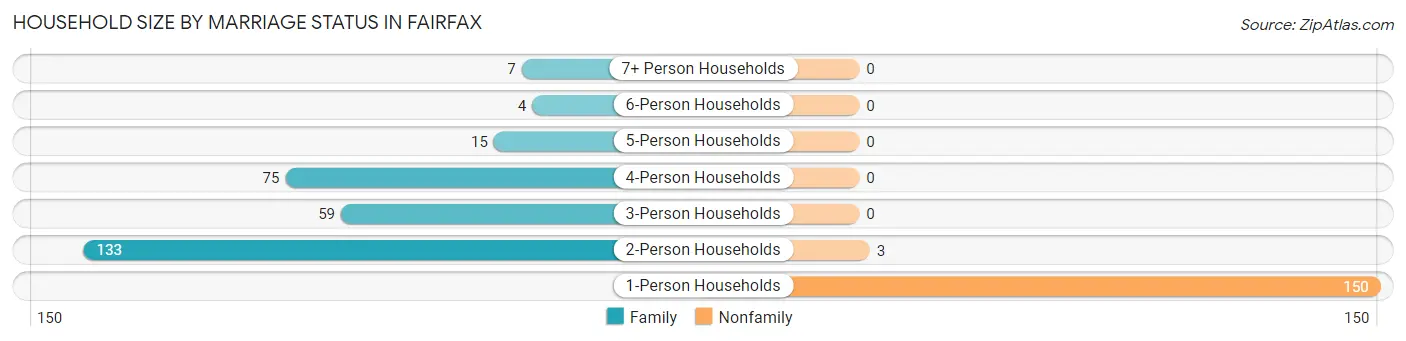
| Household Size | Family Households | Nonfamily Households |
| 1-Person Households | - | 150 (33.6%) |
| 2-Person Households | 133 (29.8%) | 3 (0.7%) |
| 3-Person Households | 59 (13.2%) | 0 (0.0%) |
| 4-Person Households | 75 (16.8%) | 0 (0.0%) |
| 5-Person Households | 15 (3.4%) | 0 (0.0%) |
| 6-Person Households | 4 (0.9%) | 0 (0.0%) |
| 7+ Person Households | 7 (1.6%) | 0 (0.0%) |
| Total | 293 (65.7%) | 153 (34.3%) |
Female Fertility in Fairfax
Fertility by Age in Fairfax
Average fertility rate in Fairfax is 61.0 births per 1,000 women. Women in the age bracket of 20 to 34 years have the highest fertility rate with 192.0 births per 1,000 women. Women in the age bracket of 20 to 34 years acount for 100.0% of all women with births.
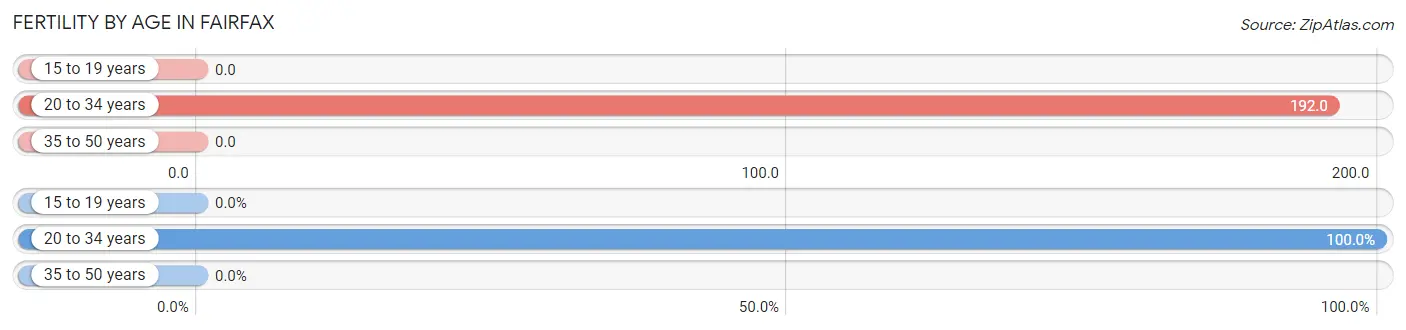
| Age Bracket | Women with Births | Births / 1,000 Women |
| 15 to 19 years | 0 (0.0%) | 0.0 |
| 20 to 34 years | 14 (100.0%) | 192.0 |
| 35 to 50 years | 0 (0.0%) | 0.0 |
| Total | 14 (100.0%) | 61.0 |
Fertility by Age by Marriage Status in Fairfax
21.4% of women with births (14) in Fairfax are married. The highest percentage of unmarried women with births falls into 20 to 34 years age bracket with 78.6% of them unmarried at the time of birth, while the lowest percentage of unmarried women with births belong to 20 to 34 years age bracket with 78.6% of them unmarried.
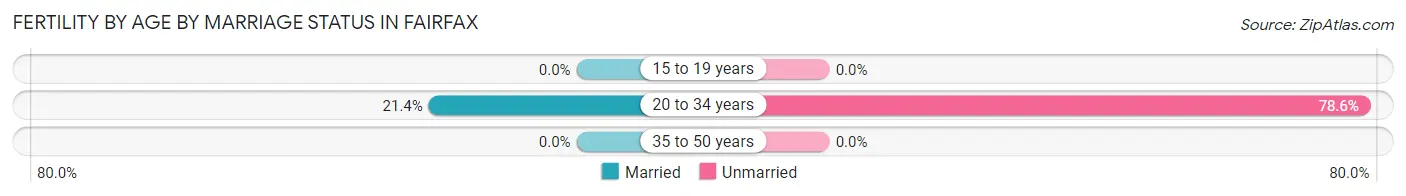
| Age Bracket | Married | Unmarried |
| 15 to 19 years | 0 (0.0%) | 0 (0.0%) |
| 20 to 34 years | 3 (21.4%) | 11 (78.6%) |
| 35 to 50 years | 0 (0.0%) | 0 (0.0%) |
| Total | 3 (21.4%) | 11 (78.6%) |
Fertility by Education in Fairfax
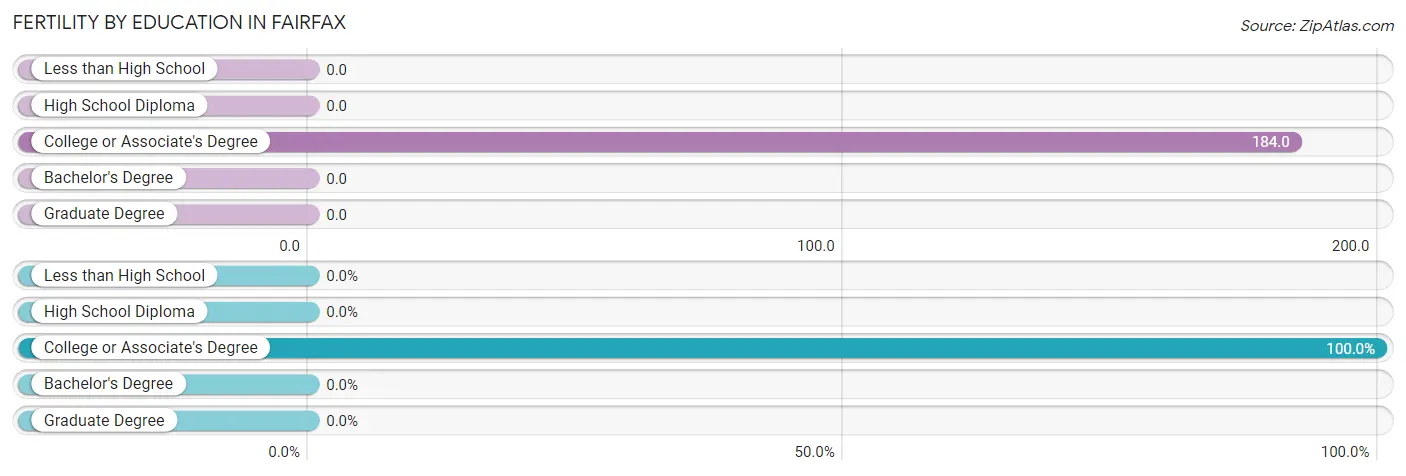
| Educational Attainment | Women with Births | Births / 1,000 Women |
| Less than High School | 0 (0.0%) | 0.0 |
| High School Diploma | 0 (0.0%) | 0.0 |
| College or Associate's Degree | 14 (100.0%) | 184.0 |
| Bachelor's Degree | 0 (0.0%) | 0.0 |
| Graduate Degree | 0 (0.0%) | 0.0 |
| Total | 14 (100.0%) | 61.0 |
Fertility by Education by Marriage Status in Fairfax
78.6% of women with births in Fairfax are unmarried. Women with the educational attainment of college or associate's degree are most likely to be married with 21.4% of them married at childbirth, while women with the educational attainment of college or associate's degree are least likely to be married with 78.6% of them unmarried at childbirth.
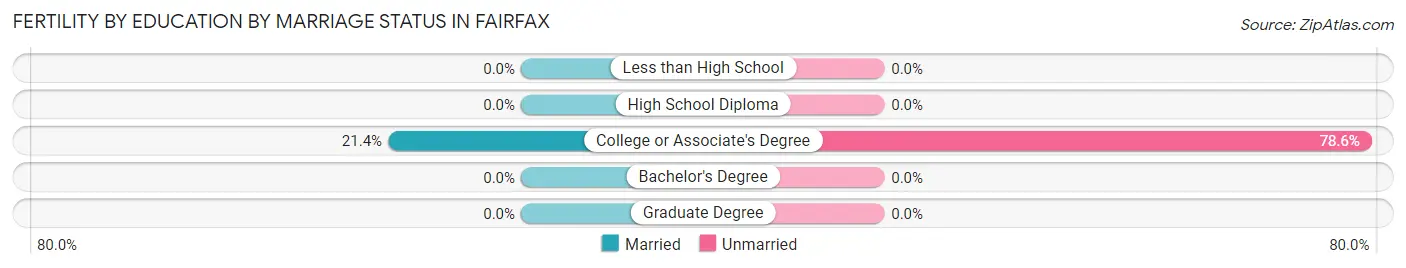
| Educational Attainment | Married | Unmarried |
| Less than High School | 0 (0.0%) | 0 (0.0%) |
| High School Diploma | 0 (0.0%) | 0 (0.0%) |
| College or Associate's Degree | 3 (21.4%) | 11 (78.6%) |
| Bachelor's Degree | 0 (0.0%) | 0 (0.0%) |
| Graduate Degree | 0 (0.0%) | 0 (0.0%) |
| Total | 3 (21.4%) | 11 (78.6%) |
Employment Characteristics in Fairfax
Employment by Class of Employer in Fairfax
Among the 390 employed individuals in Fairfax, private company employees (252 | 64.6%), not-for-profit organizations (33 | 8.5%), and federal government employees (30 | 7.7%) make up the most common classes of employment.
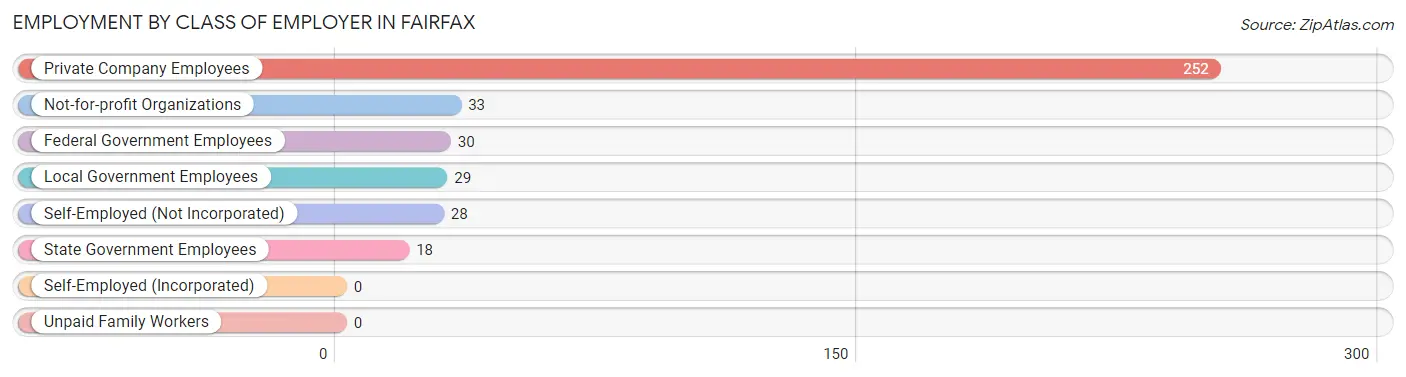
| Employer Class | # Employees | % Employees |
| Private Company Employees | 252 | 64.6% |
| Self-Employed (Incorporated) | 0 | 0.0% |
| Self-Employed (Not Incorporated) | 28 | 7.2% |
| Not-for-profit Organizations | 33 | 8.5% |
| Local Government Employees | 29 | 7.4% |
| State Government Employees | 18 | 4.6% |
| Federal Government Employees | 30 | 7.7% |
| Unpaid Family Workers | 0 | 0.0% |
| Total | 390 | 100.0% |
Employment Status by Age in Fairfax
According to the labor force statistics for Fairfax, out of the total population over 16 years of age (906), 50.7% or 459 individuals are in the labor force, with 15.0% or 69 of them unemployed. The age group with the highest labor force participation rate is 25 to 29 years, with 90.0% or 54 individuals in the labor force. Within the labor force, the 30 to 34 years age range has the highest percentage of unemployed individuals, with 56.5% or 35 of them being unemployed.
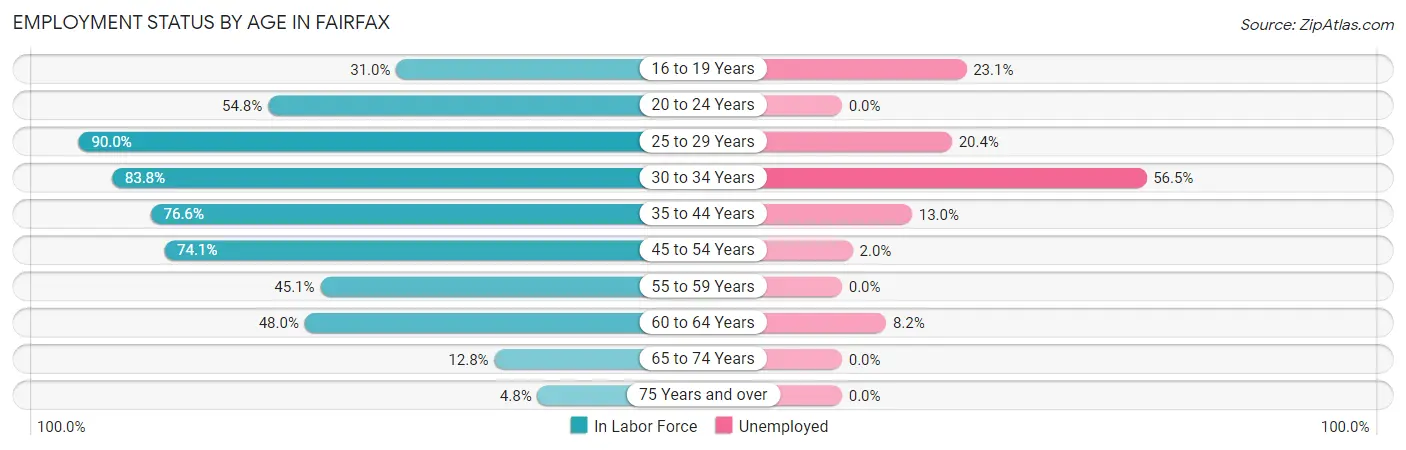
| Age Bracket | In Labor Force | Unemployed |
| 16 to 19 Years | 13 (31.0%) | 3 (23.1%) |
| 20 to 24 Years | 17 (54.8%) | 0 (0.0%) |
| 25 to 29 Years | 54 (90.0%) | 11 (20.4%) |
| 30 to 34 Years | 62 (83.8%) | 35 (56.5%) |
| 35 to 44 Years | 108 (76.6%) | 14 (13.0%) |
| 45 to 54 Years | 100 (74.1%) | 2 (2.0%) |
| 55 to 59 Years | 37 (45.1%) | 0 (0.0%) |
| 60 to 64 Years | 49 (48.0%) | 4 (8.2%) |
| 65 to 74 Years | 12 (12.8%) | 0 (0.0%) |
| 75 Years and over | 7 (4.8%) | 0 (0.0%) |
| Total | 459 (50.7%) | 69 (15.0%) |
Employment Status by Educational Attainment in Fairfax
According to labor force statistics for Fairfax, 69.0% of individuals (410) out of the total population between 25 and 64 years of age (594) are in the labor force, with 16.1% or 66 of them being unemployed. The group with the highest labor force participation rate are those with the educational attainment of bachelor's degree or higher, with 73.7% or 42 individuals in the labor force. Within the labor force, individuals with less than high school education have the highest percentage of unemployment, with 26.1% or 12 of them being unemployed.
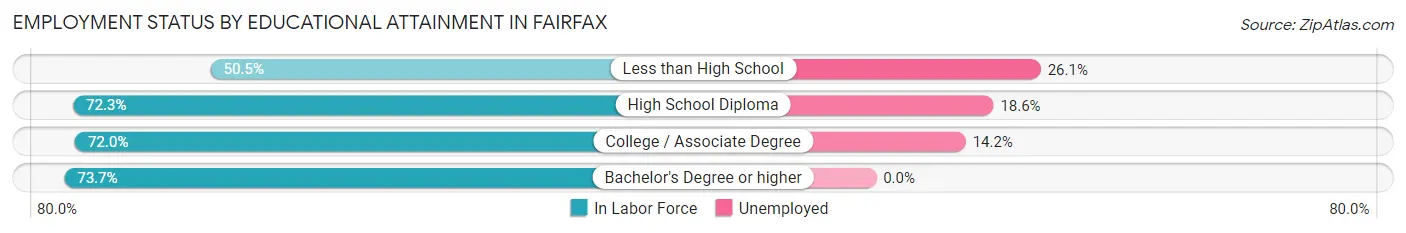
| Educational Attainment | In Labor Force | Unemployed |
| Less than High School | 46 (50.5%) | 24 (26.1%) |
| High School Diploma | 188 (72.3%) | 48 (18.6%) |
| College / Associate Degree | 134 (72.0%) | 26 (14.2%) |
| Bachelor's Degree or higher | 42 (73.7%) | 0 (0.0%) |
| Total | 410 (69.0%) | 96 (16.1%) |
Employment Occupations by Sex in Fairfax
Management, Business, Science and Arts Occupations
The most common Management, Business, Science and Arts occupations in Fairfax are Community & Social Service (45 | 11.5%), Management (35 | 9.0%), Education Instruction & Library (31 | 8.0%), Business & Financial (26 | 6.7%), and Health Diagnosing & Treating (15 | 3.8%).
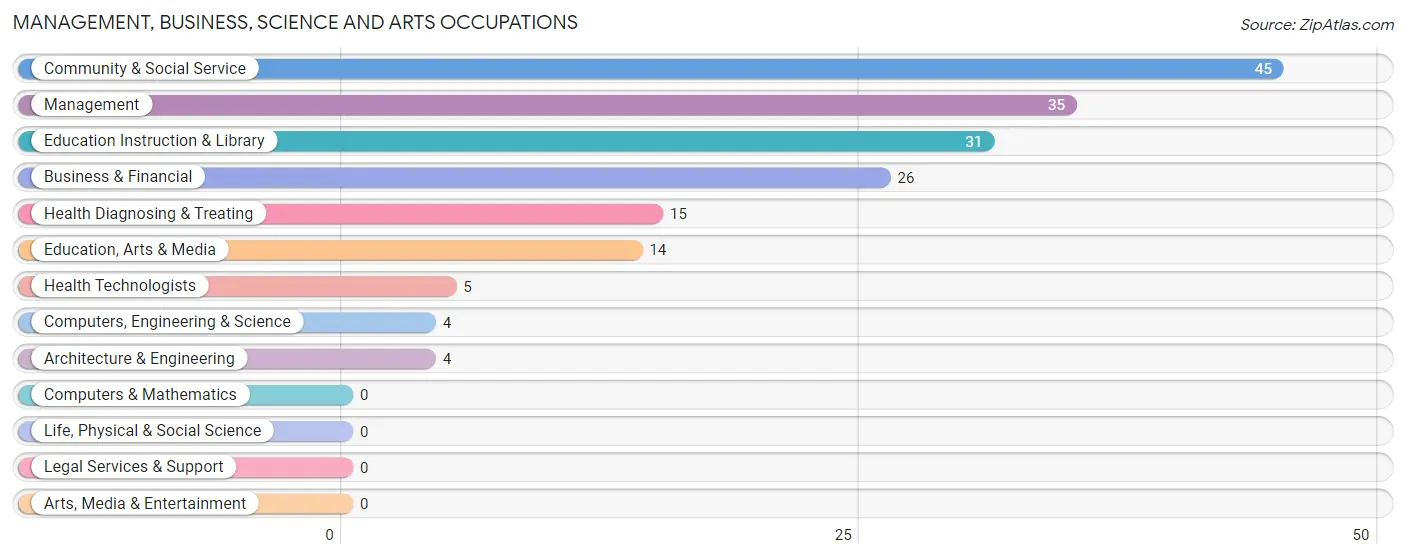
Management, Business, Science and Arts Occupations by Sex
Within the Management, Business, Science and Arts occupations in Fairfax, the most male-oriented occupations are Computers, Engineering & Science (100.0%), Architecture & Engineering (100.0%), and Management (65.7%), while the most female-oriented occupations are Business & Financial (100.0%), Education Instruction & Library (100.0%), and Health Diagnosing & Treating (100.0%).
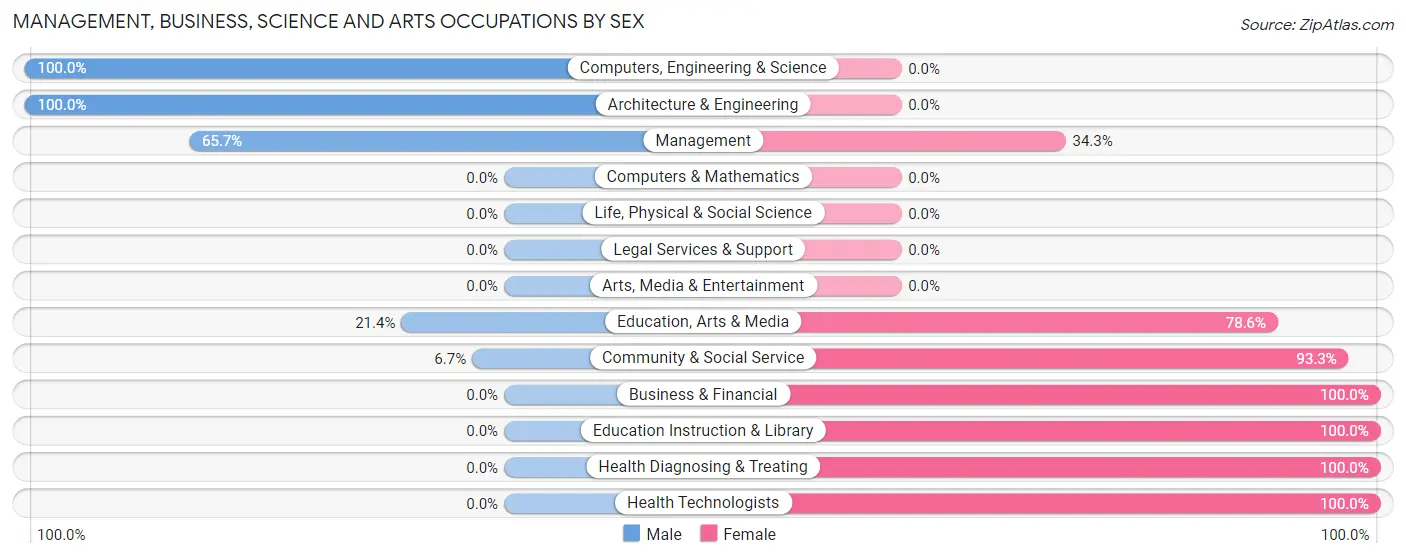
| Occupation | Male | Female |
| Management | 23 (65.7%) | 12 (34.3%) |
| Business & Financial | 0 (0.0%) | 26 (100.0%) |
| Computers, Engineering & Science | 4 (100.0%) | 0 (0.0%) |
| Computers & Mathematics | 0 (0.0%) | 0 (0.0%) |
| Architecture & Engineering | 4 (100.0%) | 0 (0.0%) |
| Life, Physical & Social Science | 0 (0.0%) | 0 (0.0%) |
| Community & Social Service | 3 (6.7%) | 42 (93.3%) |
| Education, Arts & Media | 3 (21.4%) | 11 (78.6%) |
| Legal Services & Support | 0 (0.0%) | 0 (0.0%) |
| Education Instruction & Library | 0 (0.0%) | 31 (100.0%) |
| Arts, Media & Entertainment | 0 (0.0%) | 0 (0.0%) |
| Health Diagnosing & Treating | 0 (0.0%) | 15 (100.0%) |
| Health Technologists | 0 (0.0%) | 5 (100.0%) |
| Total (Category) | 30 (24.0%) | 95 (76.0%) |
| Total (Overall) | 196 (50.3%) | 194 (49.7%) |
Services Occupations
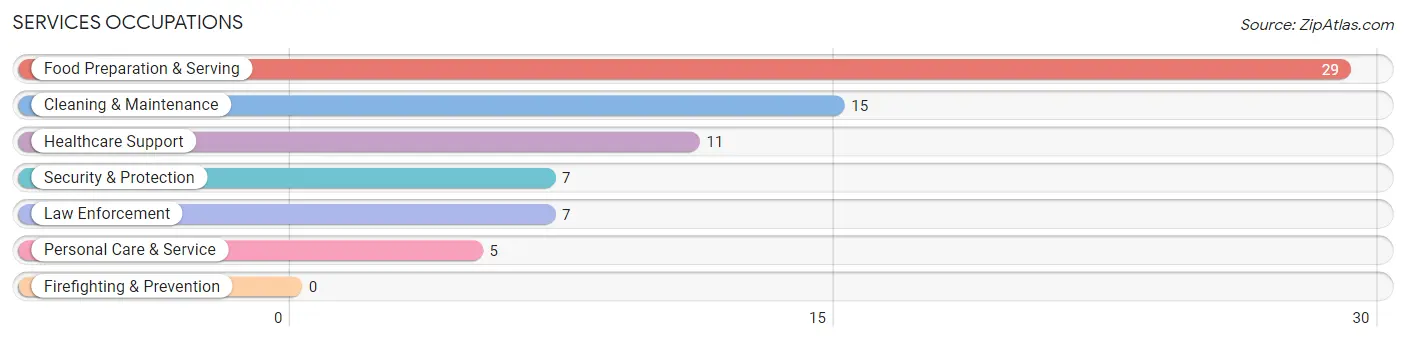
The most common Services occupations in Fairfax are Food Preparation & Serving (29 | 7.4%), Cleaning & Maintenance (15 | 3.8%), Healthcare Support (11 | 2.8%), Security & Protection (7 | 1.8%), and Law Enforcement (7 | 1.8%).
Services Occupations by Sex
Within the Services occupations in Fairfax, the most male-oriented occupations are Security & Protection (100.0%), Law Enforcement (100.0%), and Cleaning & Maintenance (46.7%), while the most female-oriented occupations are Healthcare Support (100.0%), Food Preparation & Serving (79.3%), and Personal Care & Service (60.0%).
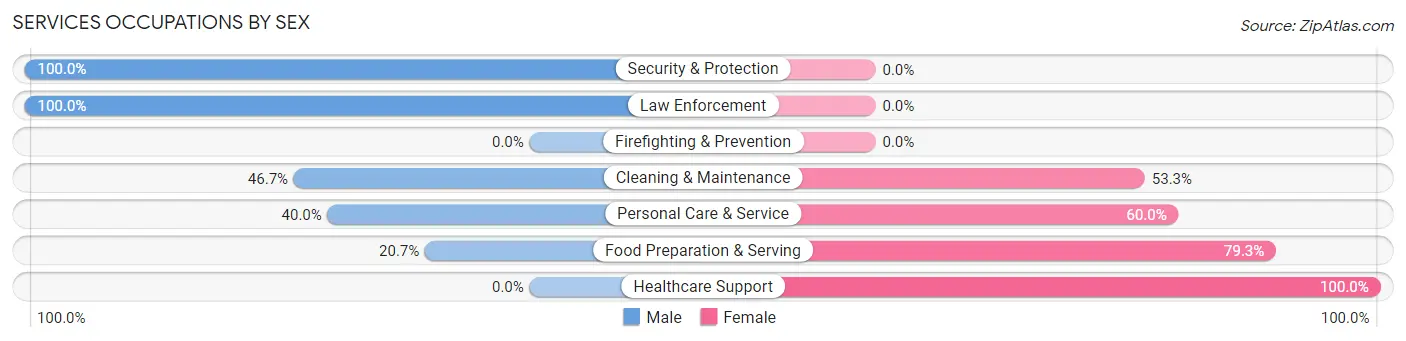
| Occupation | Male | Female |
| Healthcare Support | 0 (0.0%) | 11 (100.0%) |
| Security & Protection | 7 (100.0%) | 0 (0.0%) |
| Firefighting & Prevention | 0 (0.0%) | 0 (0.0%) |
| Law Enforcement | 7 (100.0%) | 0 (0.0%) |
| Food Preparation & Serving | 6 (20.7%) | 23 (79.3%) |
| Cleaning & Maintenance | 7 (46.7%) | 8 (53.3%) |
| Personal Care & Service | 2 (40.0%) | 3 (60.0%) |
| Total (Category) | 22 (32.8%) | 45 (67.2%) |
| Total (Overall) | 196 (50.3%) | 194 (49.7%) |
Sales and Office Occupations
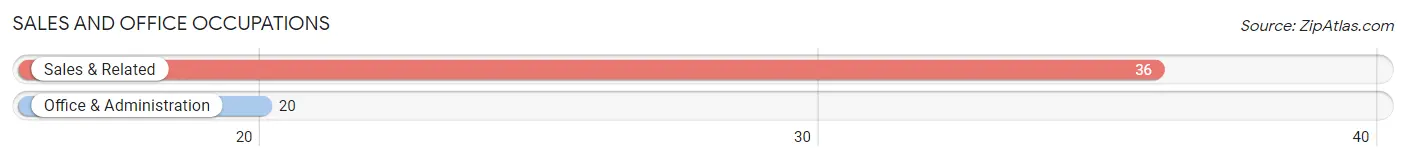
The most common Sales and Office occupations in Fairfax are Sales & Related (36 | 9.2%), and Office & Administration (20 | 5.1%).
Sales and Office Occupations by Sex
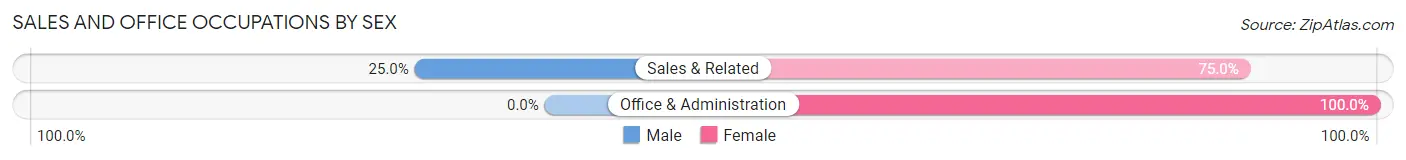
| Occupation | Male | Female |
| Sales & Related | 9 (25.0%) | 27 (75.0%) |
| Office & Administration | 0 (0.0%) | 20 (100.0%) |
| Total (Category) | 9 (16.1%) | 47 (83.9%) |
| Total (Overall) | 196 (50.3%) | 194 (49.7%) |
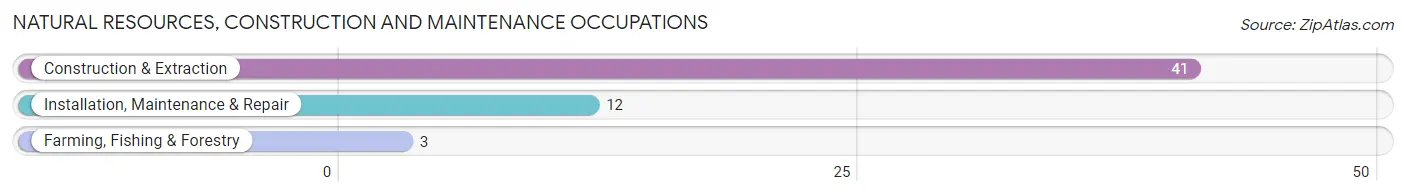
Natural Resources, Construction and Maintenance Occupations
The most common Natural Resources, Construction and Maintenance occupations in Fairfax are Construction & Extraction (41 | 10.5%), Installation, Maintenance & Repair (12 | 3.1%), and Farming, Fishing & Forestry (3 | 0.8%).
Natural Resources, Construction and Maintenance Occupations by Sex
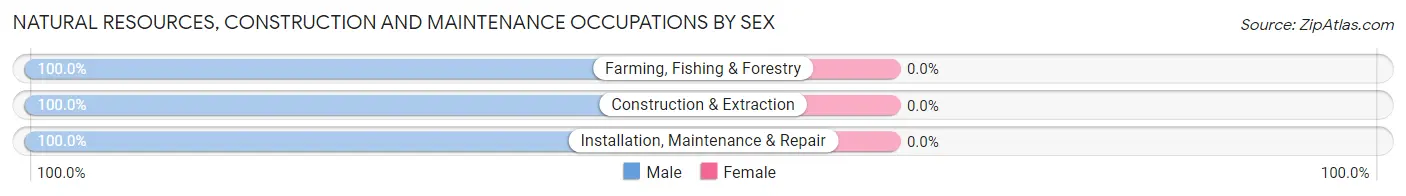
| Occupation | Male | Female |
| Farming, Fishing & Forestry | 3 (100.0%) | 0 (0.0%) |
| Construction & Extraction | 41 (100.0%) | 0 (0.0%) |
| Installation, Maintenance & Repair | 12 (100.0%) | 0 (0.0%) |
| Total (Category) | 56 (100.0%) | 0 (0.0%) |
| Total (Overall) | 196 (50.3%) | 194 (49.7%) |
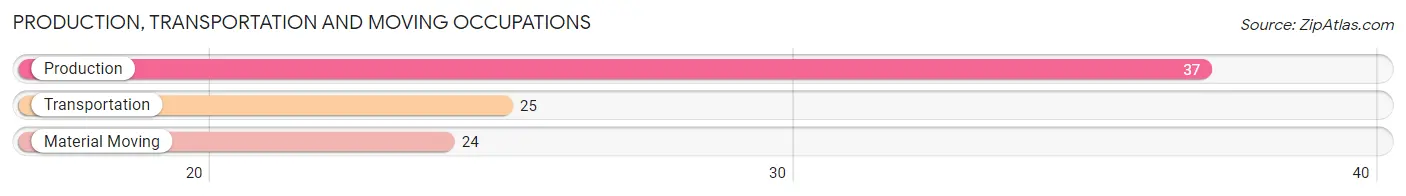
Production, Transportation and Moving Occupations
The most common Production, Transportation and Moving occupations in Fairfax are Production (37 | 9.5%), Transportation (25 | 6.4%), and Material Moving (24 | 6.1%).
Production, Transportation and Moving Occupations by Sex
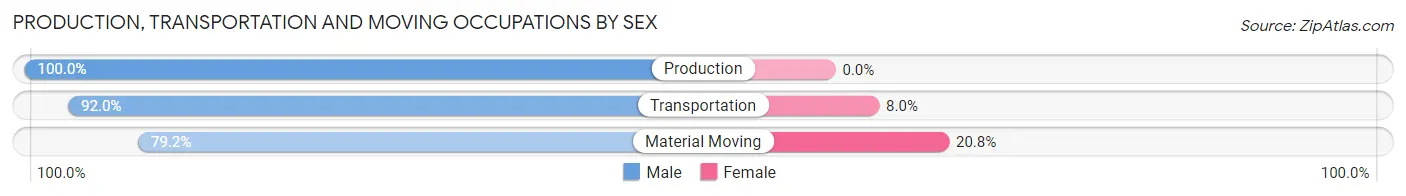
| Occupation | Male | Female |
| Production | 37 (100.0%) | 0 (0.0%) |
| Transportation | 23 (92.0%) | 2 (8.0%) |
| Material Moving | 19 (79.2%) | 5 (20.8%) |
| Total (Category) | 79 (91.9%) | 7 (8.1%) |
| Total (Overall) | 196 (50.3%) | 194 (49.7%) |
Employment Industries by Sex in Fairfax
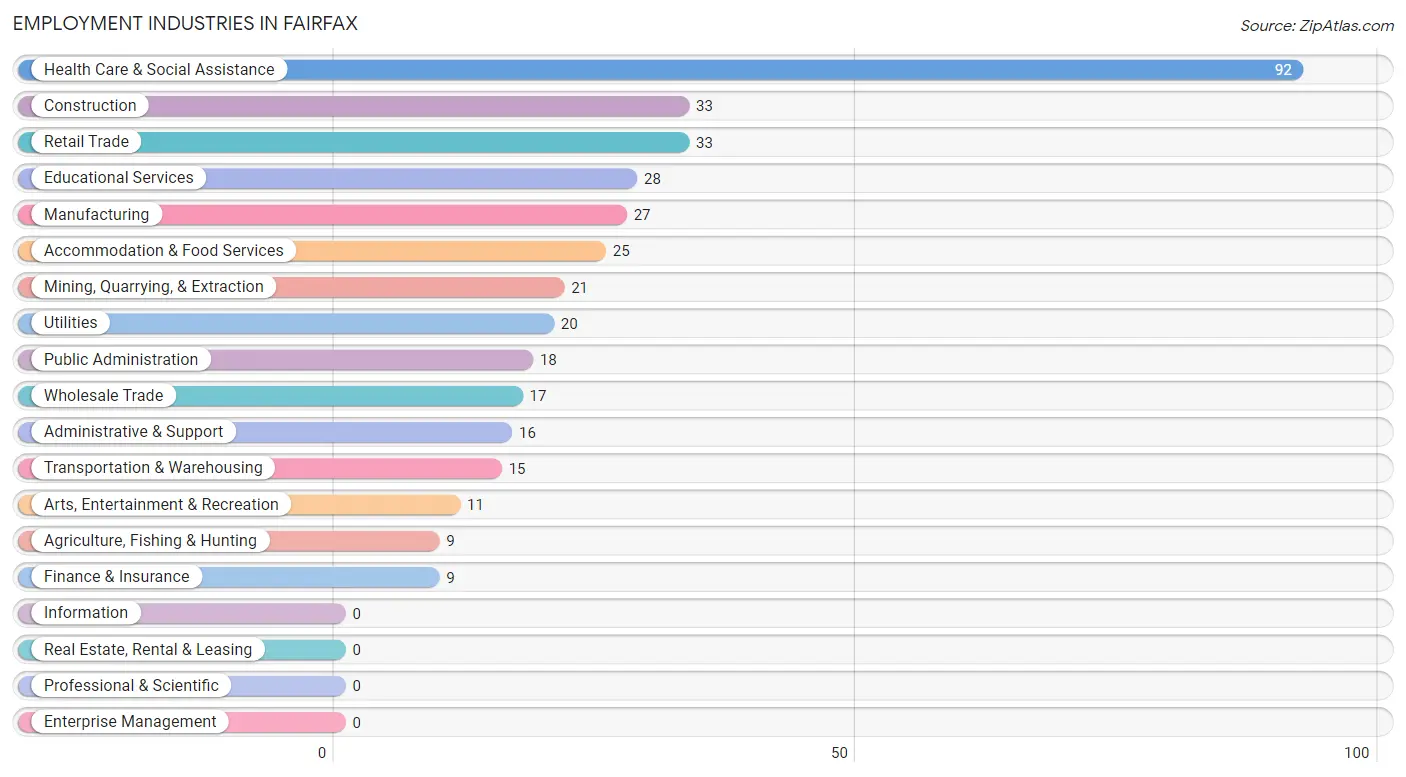
Employment Industries in Fairfax
The major employment industries in Fairfax include Health Care & Social Assistance (92 | 23.6%), Construction (33 | 8.5%), Retail Trade (33 | 8.5%), Educational Services (28 | 7.2%), and Manufacturing (27 | 6.9%).
Employment Industries by Sex in Fairfax
The Fairfax industries that see more men than women are Agriculture, Fishing & Hunting (100.0%), Mining, Quarrying, & Extraction (100.0%), and Construction (100.0%), whereas the industries that tend to have a higher number of women are Finance & Insurance (100.0%), Health Care & Social Assistance (100.0%), and Retail Trade (72.7%).
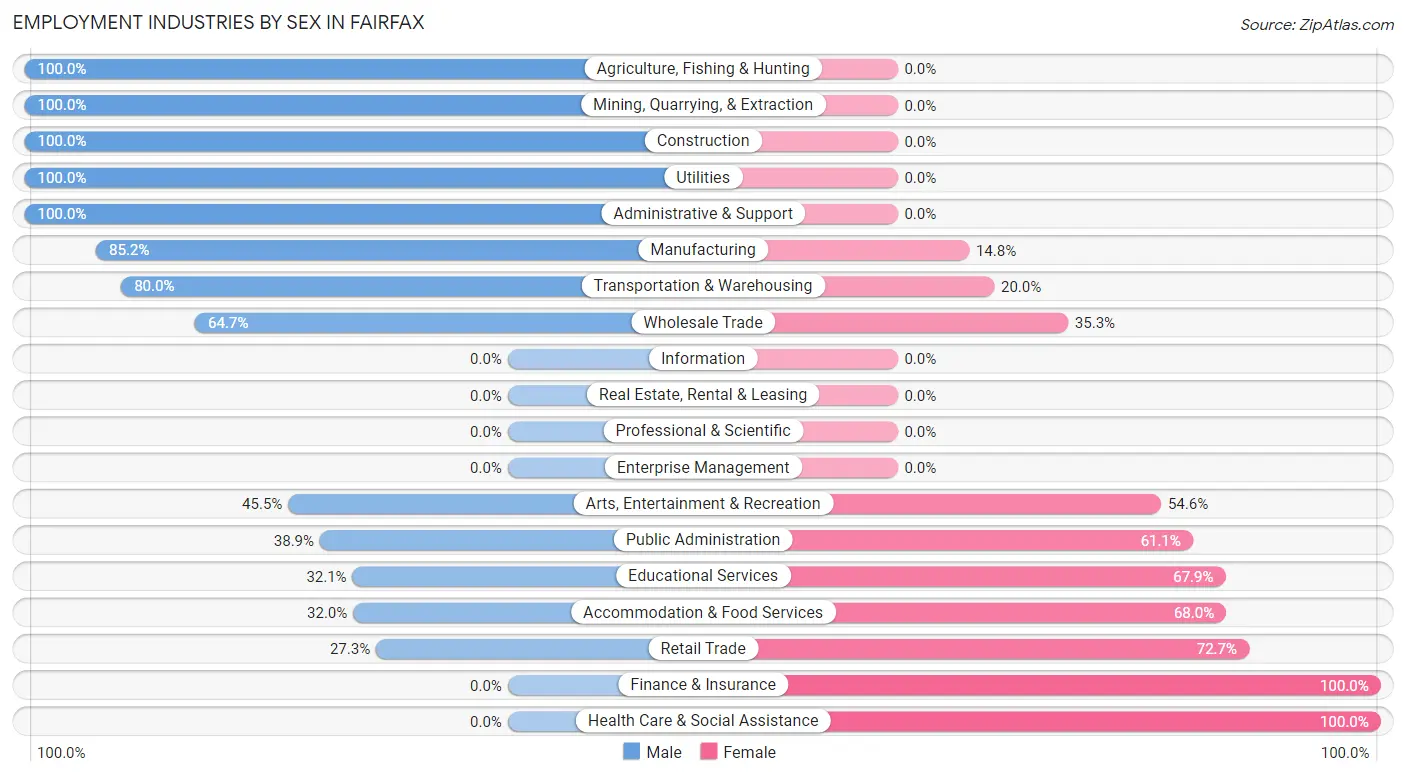
| Industry | Male | Female |
| Agriculture, Fishing & Hunting | 9 (100.0%) | 0 (0.0%) |
| Mining, Quarrying, & Extraction | 21 (100.0%) | 0 (0.0%) |
| Construction | 33 (100.0%) | 0 (0.0%) |
| Manufacturing | 23 (85.2%) | 4 (14.8%) |
| Wholesale Trade | 11 (64.7%) | 6 (35.3%) |
| Retail Trade | 9 (27.3%) | 24 (72.7%) |
| Transportation & Warehousing | 12 (80.0%) | 3 (20.0%) |
| Utilities | 20 (100.0%) | 0 (0.0%) |
| Information | 0 (0.0%) | 0 (0.0%) |
| Finance & Insurance | 0 (0.0%) | 9 (100.0%) |
| Real Estate, Rental & Leasing | 0 (0.0%) | 0 (0.0%) |
| Professional & Scientific | 0 (0.0%) | 0 (0.0%) |
| Enterprise Management | 0 (0.0%) | 0 (0.0%) |
| Administrative & Support | 16 (100.0%) | 0 (0.0%) |
| Educational Services | 9 (32.1%) | 19 (67.9%) |
| Health Care & Social Assistance | 0 (0.0%) | 92 (100.0%) |
| Arts, Entertainment & Recreation | 5 (45.5%) | 6 (54.5%) |
| Accommodation & Food Services | 8 (32.0%) | 17 (68.0%) |
| Public Administration | 7 (38.9%) | 11 (61.1%) |
| Total | 196 (50.3%) | 194 (49.7%) |
Education in Fairfax
School Enrollment in Fairfax
The most common levels of schooling among the 251 students in Fairfax are middle school (93 | 37.0%), elementary school (69 | 27.5%), and high school (37 | 14.7%).
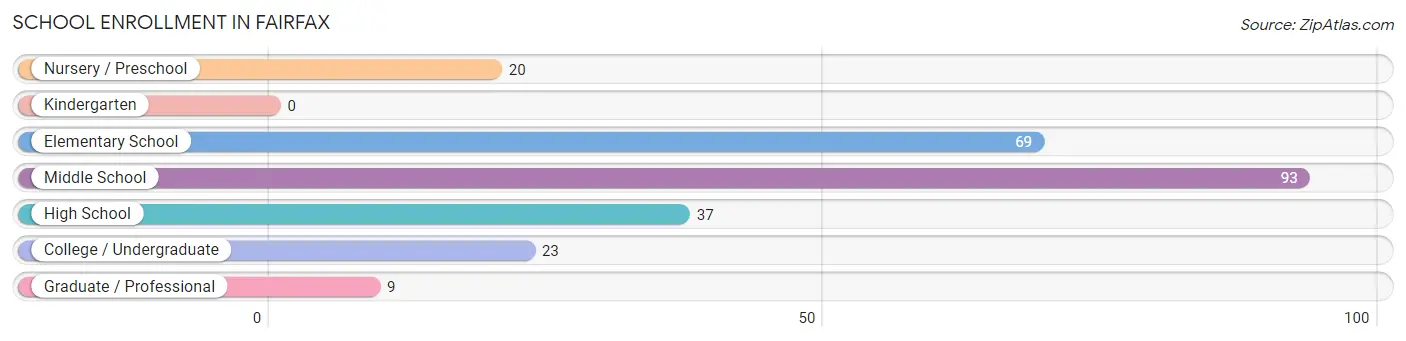
| School Level | # Students | % Students |
| Nursery / Preschool | 20 | 8.0% |
| Kindergarten | 0 | 0.0% |
| Elementary School | 69 | 27.5% |
| Middle School | 93 | 37.0% |
| High School | 37 | 14.7% |
| College / Undergraduate | 23 | 9.2% |
| Graduate / Professional | 9 | 3.6% |
| Total | 251 | 100.0% |
School Enrollment by Age by Funding Source in Fairfax
Out of a total of 251 students who are enrolled in schools in Fairfax, 15 (6.0%) attend a private institution, while the remaining 236 (94.0%) are enrolled in public schools. The age group of 18 to 19 year olds has the highest likelihood of being enrolled in private schools, with 6 (66.7% in the age bracket) enrolled. Conversely, the age group of 3 to 4 year olds has the lowest likelihood of being enrolled in a private school, with 13 (100.0% in the age bracket) attending a public institution.
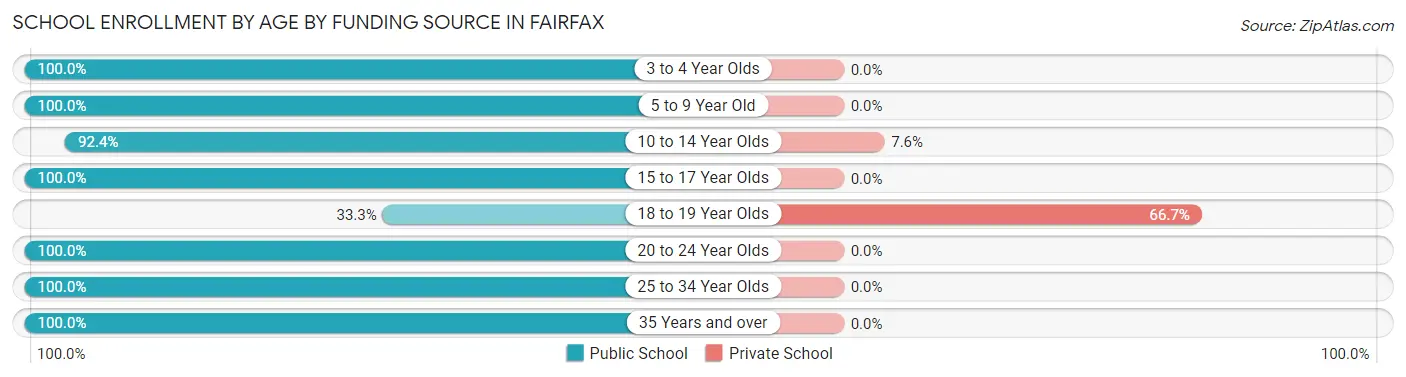
| Age Bracket | Public School | Private School |
| 3 to 4 Year Olds | 13 (100.0%) | 0 (0.0%) |
| 5 to 9 Year Old | 53 (100.0%) | 0 (0.0%) |
| 10 to 14 Year Olds | 110 (92.4%) | 9 (7.6%) |
| 15 to 17 Year Olds | 31 (100.0%) | 0 (0.0%) |
| 18 to 19 Year Olds | 3 (33.3%) | 6 (66.7%) |
| 20 to 24 Year Olds | 9 (100.0%) | 0 (0.0%) |
| 25 to 34 Year Olds | 3 (100.0%) | 0 (0.0%) |
| 35 Years and over | 14 (100.0%) | 0 (0.0%) |
| Total | 236 (94.0%) | 15 (6.0%) |
Educational Attainment by Field of Study in Fairfax
Education (38 | 33.0%), liberal arts & history (14 | 12.2%), science & technology (10 | 8.7%), social sciences (9 | 7.8%), and bio, nature & agricultural (8 | 7.0%) are the most common fields of study among 115 individuals in Fairfax who have obtained a bachelor's degree or higher.
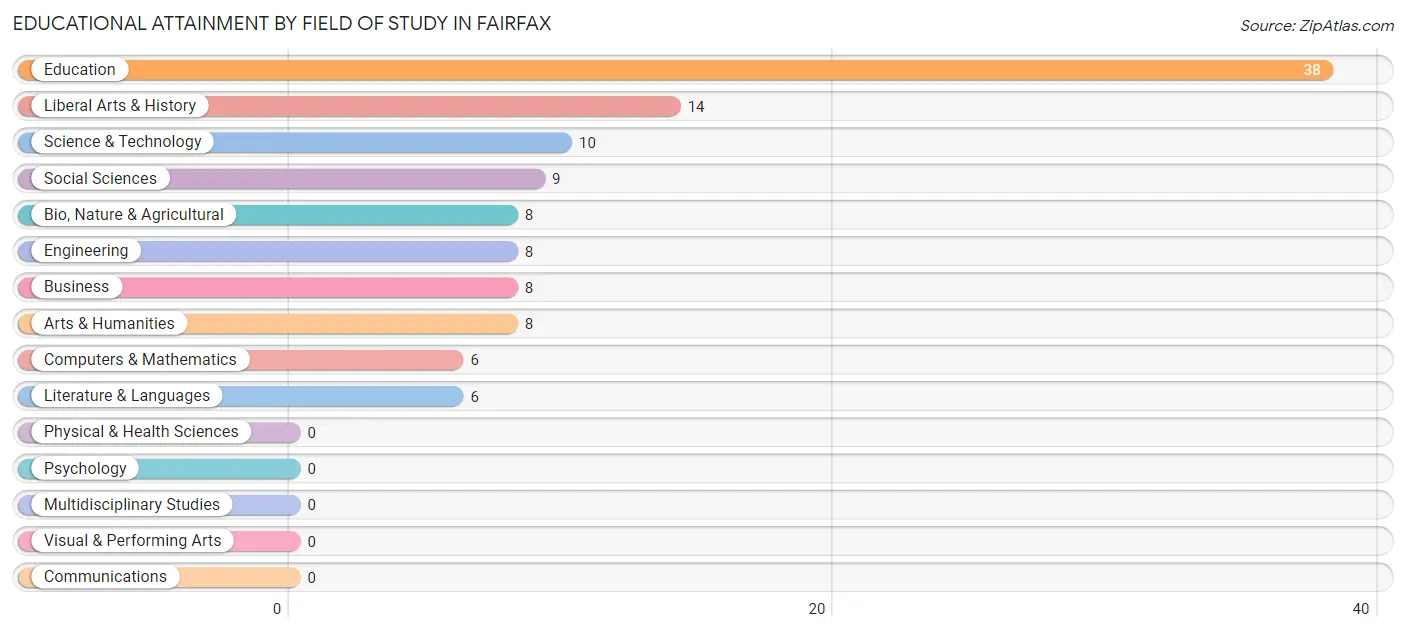
| Field of Study | # Graduates | % Graduates |
| Computers & Mathematics | 6 | 5.2% |
| Bio, Nature & Agricultural | 8 | 7.0% |
| Physical & Health Sciences | 0 | 0.0% |
| Psychology | 0 | 0.0% |
| Social Sciences | 9 | 7.8% |
| Engineering | 8 | 7.0% |
| Multidisciplinary Studies | 0 | 0.0% |
| Science & Technology | 10 | 8.7% |
| Business | 8 | 7.0% |
| Education | 38 | 33.0% |
| Literature & Languages | 6 | 5.2% |
| Liberal Arts & History | 14 | 12.2% |
| Visual & Performing Arts | 0 | 0.0% |
| Communications | 0 | 0.0% |
| Arts & Humanities | 8 | 7.0% |
| Total | 115 | 100.0% |
Transportation & Commute in Fairfax
Vehicle Availability by Sex in Fairfax
The most prevalent vehicle ownership categories in Fairfax are males with 2 vehicles (78, accounting for 39.8%) and females with 2 vehicles (68, making up 40.2%).
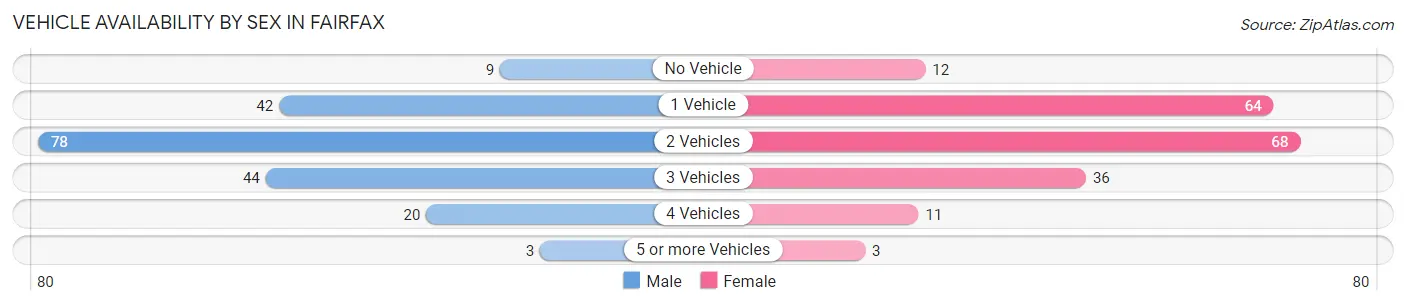
| Vehicles Available | Male | Female |
| No Vehicle | 9 (4.6%) | 12 (6.2%) |
| 1 Vehicle | 42 (21.4%) | 64 (33.0%) |
| 2 Vehicles | 78 (39.8%) | 68 (35.0%) |
| 3 Vehicles | 44 (22.5%) | 36 (18.6%) |
| 4 Vehicles | 20 (10.2%) | 11 (5.7%) |
| 5 or more Vehicles | 3 (1.5%) | 3 (1.5%) |
| Total | 196 (100.0%) | 194 (100.0%) |
Commute Time in Fairfax
The most frequently occuring commute durations in Fairfax are less than 5 minutes (81 commuters, 20.9%), 30 to 34 minutes (49 commuters, 12.7%), and 5 to 9 minutes (47 commuters, 12.1%).
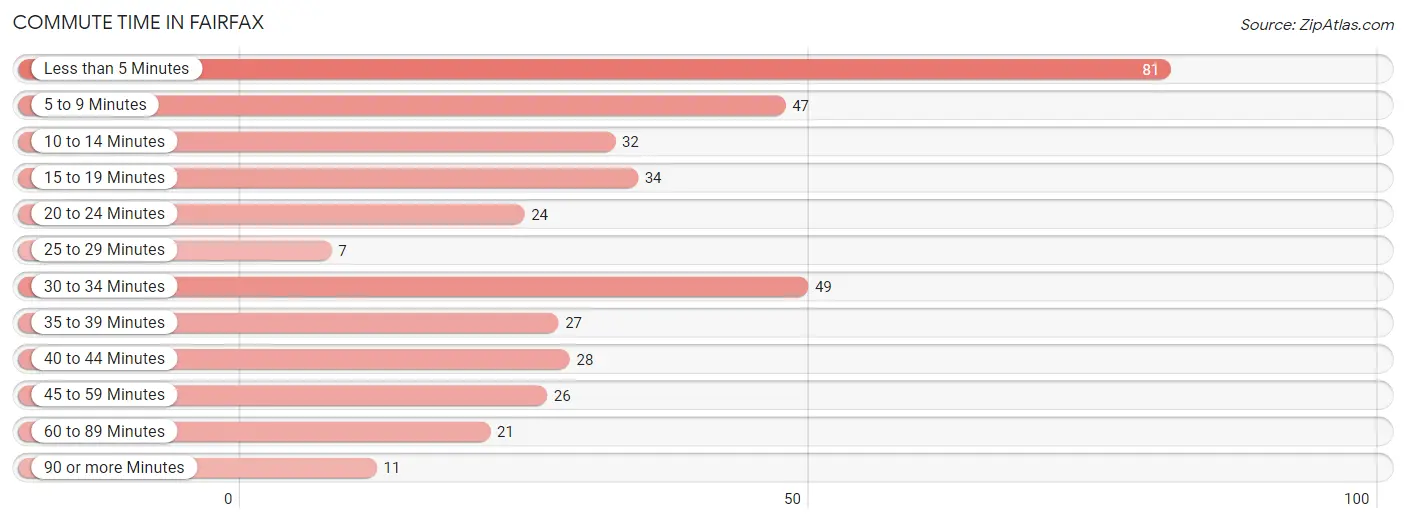
| Commute Time | # Commuters | % Commuters |
| Less than 5 Minutes | 81 | 20.9% |
| 5 to 9 Minutes | 47 | 12.1% |
| 10 to 14 Minutes | 32 | 8.3% |
| 15 to 19 Minutes | 34 | 8.8% |
| 20 to 24 Minutes | 24 | 6.2% |
| 25 to 29 Minutes | 7 | 1.8% |
| 30 to 34 Minutes | 49 | 12.7% |
| 35 to 39 Minutes | 27 | 7.0% |
| 40 to 44 Minutes | 28 | 7.2% |
| 45 to 59 Minutes | 26 | 6.7% |
| 60 to 89 Minutes | 21 | 5.4% |
| 90 or more Minutes | 11 | 2.8% |
Commute Time by Sex in Fairfax
The most common commute times in Fairfax are 40 to 44 minutes (28 commuters, 14.3%) for males and less than 5 minutes (57 commuters, 29.8%) for females.
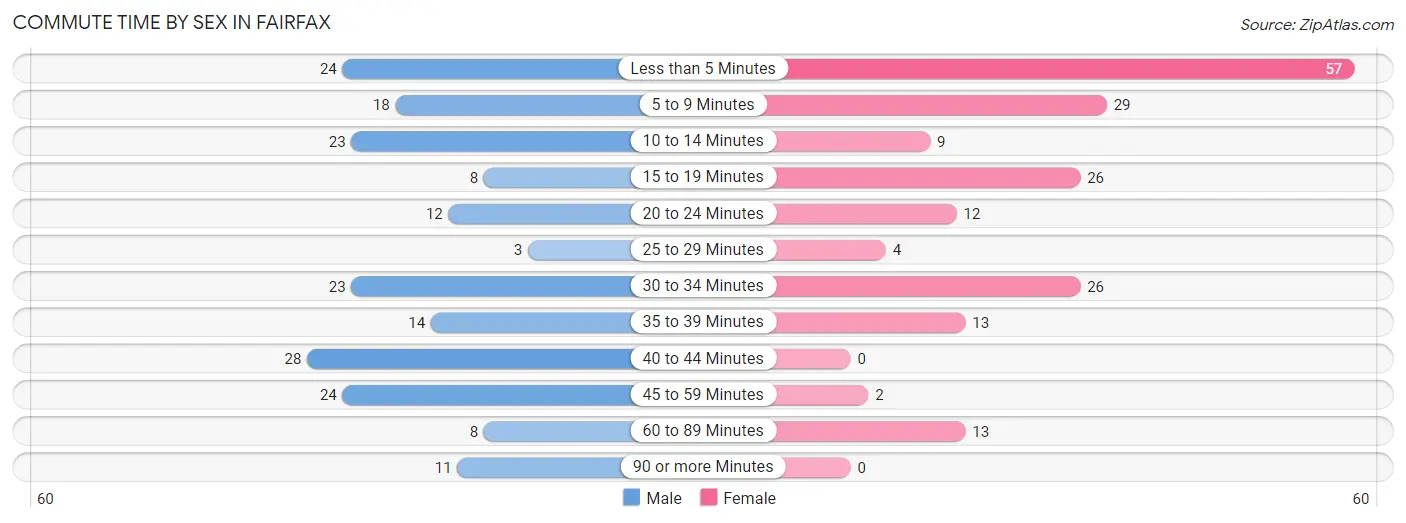
| Commute Time | Male | Female |
| Less than 5 Minutes | 24 (12.2%) | 57 (29.8%) |
| 5 to 9 Minutes | 18 (9.2%) | 29 (15.2%) |
| 10 to 14 Minutes | 23 (11.7%) | 9 (4.7%) |
| 15 to 19 Minutes | 8 (4.1%) | 26 (13.6%) |
| 20 to 24 Minutes | 12 (6.1%) | 12 (6.3%) |
| 25 to 29 Minutes | 3 (1.5%) | 4 (2.1%) |
| 30 to 34 Minutes | 23 (11.7%) | 26 (13.6%) |
| 35 to 39 Minutes | 14 (7.1%) | 13 (6.8%) |
| 40 to 44 Minutes | 28 (14.3%) | 0 (0.0%) |
| 45 to 59 Minutes | 24 (12.2%) | 2 (1.1%) |
| 60 to 89 Minutes | 8 (4.1%) | 13 (6.8%) |
| 90 or more Minutes | 11 (5.6%) | 0 (0.0%) |
Time of Departure to Work by Sex in Fairfax
The most frequent times of departure to work in Fairfax are 6:30 AM to 6:59 AM (36, 18.4%) for males and 7:30 AM to 7:59 AM (72, 37.7%) for females.
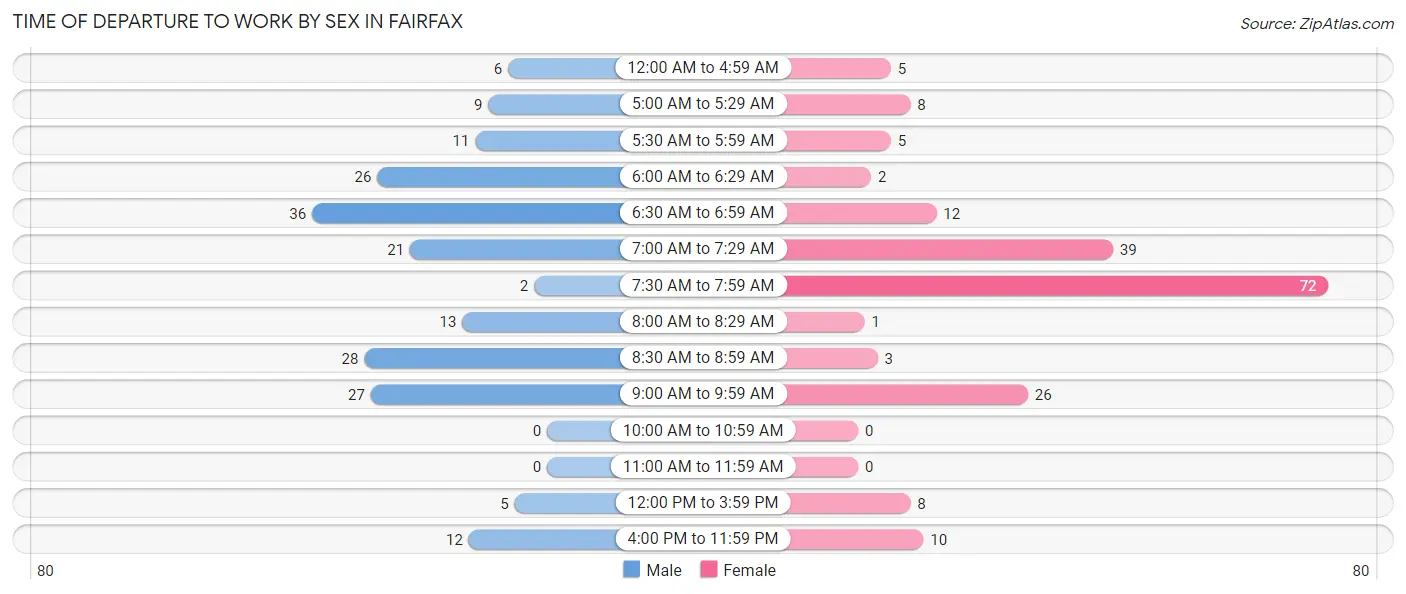
| Time of Departure | Male | Female |
| 12:00 AM to 4:59 AM | 6 (3.1%) | 5 (2.6%) |
| 5:00 AM to 5:29 AM | 9 (4.6%) | 8 (4.2%) |
| 5:30 AM to 5:59 AM | 11 (5.6%) | 5 (2.6%) |
| 6:00 AM to 6:29 AM | 26 (13.3%) | 2 (1.1%) |
| 6:30 AM to 6:59 AM | 36 (18.4%) | 12 (6.3%) |
| 7:00 AM to 7:29 AM | 21 (10.7%) | 39 (20.4%) |
| 7:30 AM to 7:59 AM | 2 (1.0%) | 72 (37.7%) |
| 8:00 AM to 8:29 AM | 13 (6.6%) | 1 (0.5%) |
| 8:30 AM to 8:59 AM | 28 (14.3%) | 3 (1.6%) |
| 9:00 AM to 9:59 AM | 27 (13.8%) | 26 (13.6%) |
| 10:00 AM to 10:59 AM | 0 (0.0%) | 0 (0.0%) |
| 11:00 AM to 11:59 AM | 0 (0.0%) | 0 (0.0%) |
| 12:00 PM to 3:59 PM | 5 (2.5%) | 8 (4.2%) |
| 4:00 PM to 11:59 PM | 12 (6.1%) | 10 (5.2%) |
| Total | 196 (100.0%) | 191 (100.0%) |
Housing Occupancy in Fairfax
Occupancy by Ownership in Fairfax
Of the total 446 dwellings in Fairfax, owner-occupied units account for 382 (85.7%), while renter-occupied units make up 64 (14.3%).
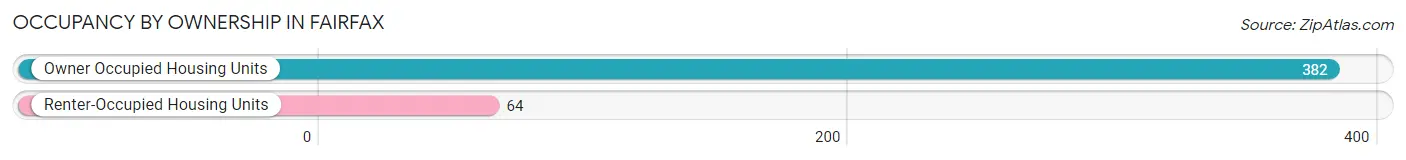
| Occupancy | # Housing Units | % Housing Units |
| Owner Occupied Housing Units | 382 | 85.7% |
| Renter-Occupied Housing Units | 64 | 14.3% |
| Total Occupied Housing Units | 446 | 100.0% |
Occupancy by Household Size in Fairfax
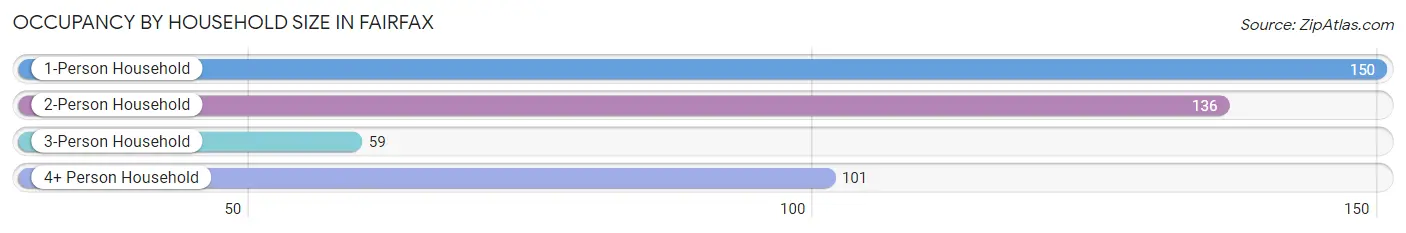
| Household Size | # Housing Units | % Housing Units |
| 1-Person Household | 150 | 33.6% |
| 2-Person Household | 136 | 30.5% |
| 3-Person Household | 59 | 13.2% |
| 4+ Person Household | 101 | 22.7% |
| Total Housing Units | 446 | 100.0% |
Occupancy by Ownership by Household Size in Fairfax
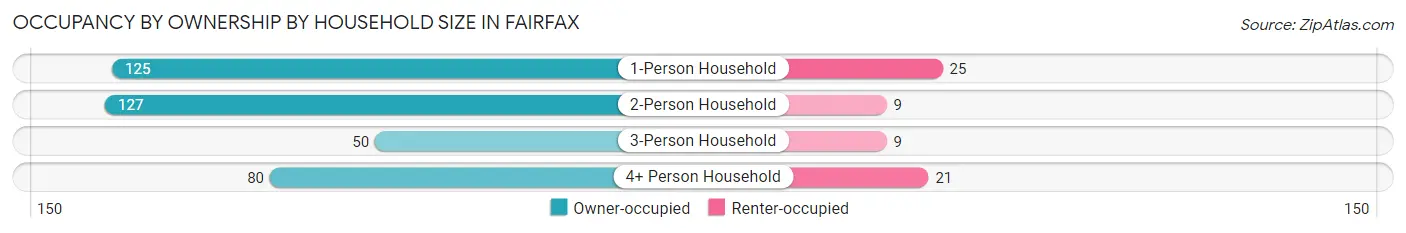
| Household Size | Owner-occupied | Renter-occupied |
| 1-Person Household | 125 (83.3%) | 25 (16.7%) |
| 2-Person Household | 127 (93.4%) | 9 (6.6%) |
| 3-Person Household | 50 (84.8%) | 9 (15.2%) |
| 4+ Person Household | 80 (79.2%) | 21 (20.8%) |
| Total Housing Units | 382 (85.7%) | 64 (14.3%) |
Occupancy by Educational Attainment in Fairfax
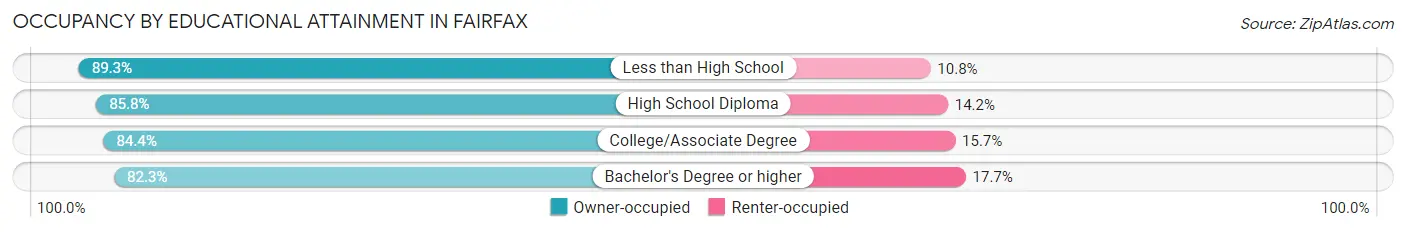
| Household Size | Owner-occupied | Renter-occupied |
| Less than High School | 83 (89.2%) | 10 (10.7%) |
| High School Diploma | 151 (85.8%) | 25 (14.2%) |
| College/Associate Degree | 97 (84.4%) | 18 (15.7%) |
| Bachelor's Degree or higher | 51 (82.3%) | 11 (17.7%) |
Occupancy by Age of Householder in Fairfax
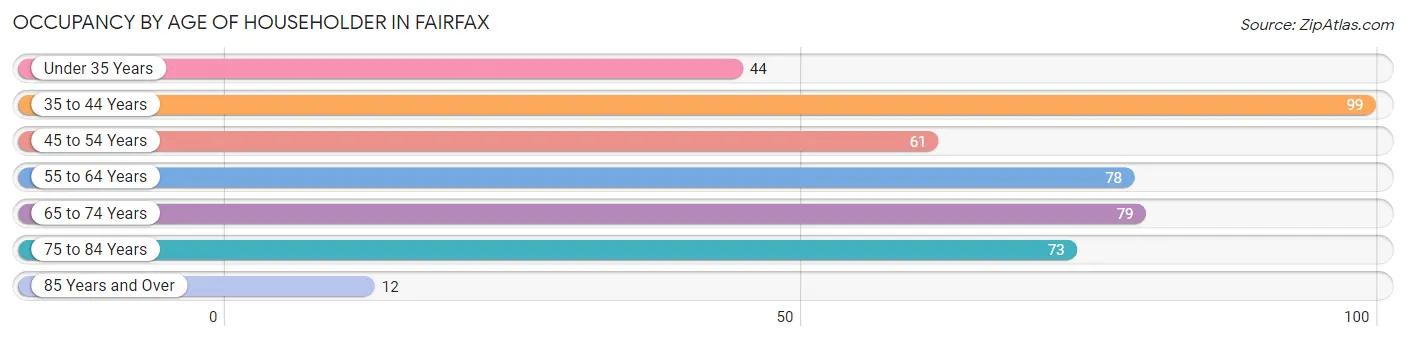
| Age Bracket | # Households | % Households |
| Under 35 Years | 44 | 9.9% |
| 35 to 44 Years | 99 | 22.2% |
| 45 to 54 Years | 61 | 13.7% |
| 55 to 64 Years | 78 | 17.5% |
| 65 to 74 Years | 79 | 17.7% |
| 75 to 84 Years | 73 | 16.4% |
| 85 Years and Over | 12 | 2.7% |
| Total | 446 | 100.0% |
Housing Finances in Fairfax
Median Income by Occupancy in Fairfax
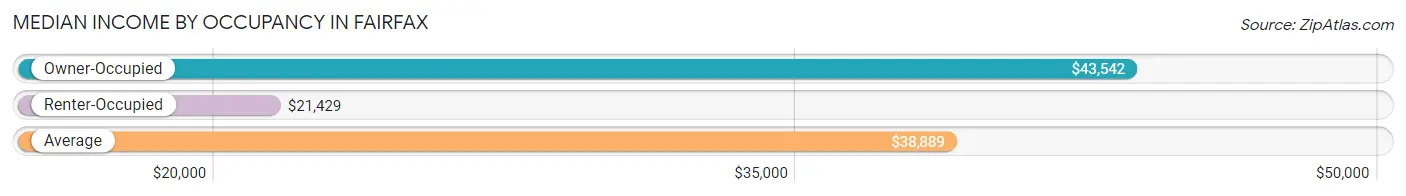
| Occupancy Type | # Households | Median Income |
| Owner-Occupied | 382 (85.7%) | $43,542 |
| Renter-Occupied | 64 (14.3%) | $21,429 |
| Average | 446 (100.0%) | $38,889 |
Occupancy by Householder Income Bracket in Fairfax
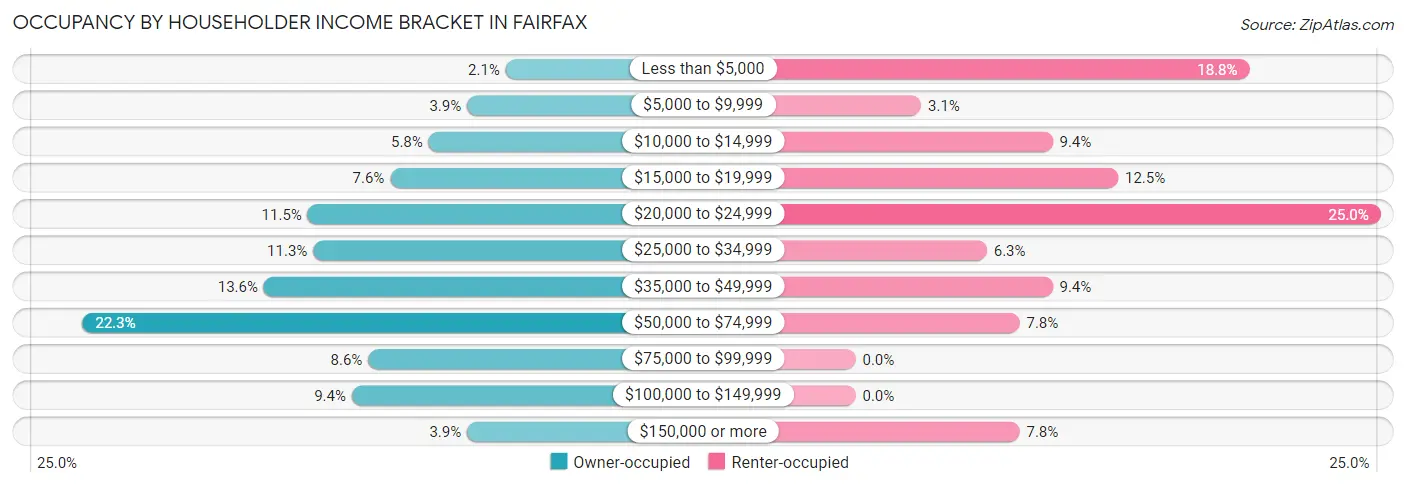
| Income Bracket | Owner-occupied | Renter-occupied |
| Less than $5,000 | 8 (2.1%) | 12 (18.8%) |
| $5,000 to $9,999 | 15 (3.9%) | 2 (3.1%) |
| $10,000 to $14,999 | 22 (5.8%) | 6 (9.4%) |
| $15,000 to $19,999 | 29 (7.6%) | 8 (12.5%) |
| $20,000 to $24,999 | 44 (11.5%) | 16 (25.0%) |
| $25,000 to $34,999 | 43 (11.3%) | 4 (6.2%) |
| $35,000 to $49,999 | 52 (13.6%) | 6 (9.4%) |
| $50,000 to $74,999 | 85 (22.3%) | 5 (7.8%) |
| $75,000 to $99,999 | 33 (8.6%) | 0 (0.0%) |
| $100,000 to $149,999 | 36 (9.4%) | 0 (0.0%) |
| $150,000 or more | 15 (3.9%) | 5 (7.8%) |
| Total | 382 (100.0%) | 64 (100.0%) |
Monthly Housing Cost Tiers in Fairfax
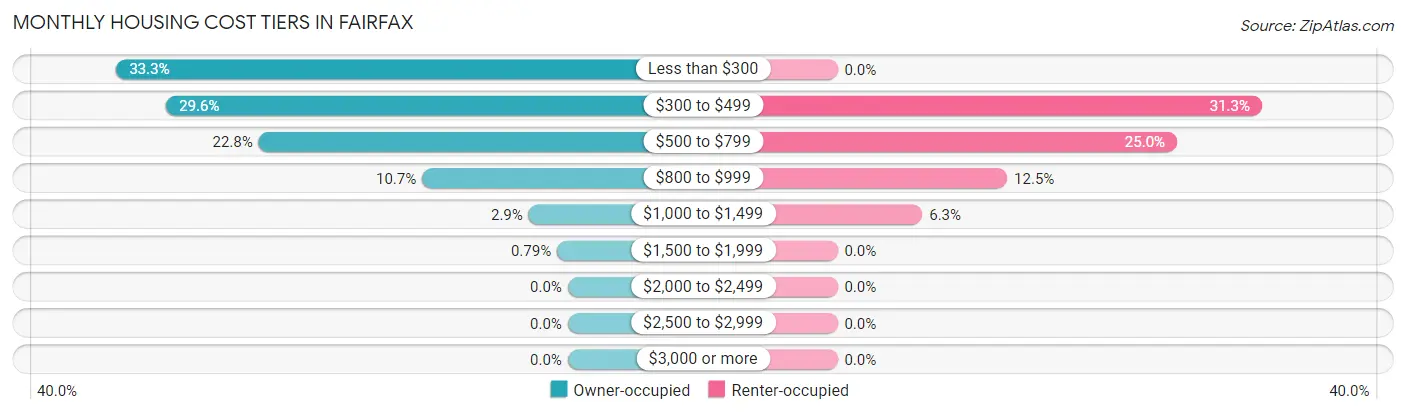
| Monthly Cost | Owner-occupied | Renter-occupied |
| Less than $300 | 127 (33.3%) | 0 (0.0%) |
| $300 to $499 | 113 (29.6%) | 20 (31.2%) |
| $500 to $799 | 87 (22.8%) | 16 (25.0%) |
| $800 to $999 | 41 (10.7%) | 8 (12.5%) |
| $1,000 to $1,499 | 11 (2.9%) | 4 (6.2%) |
| $1,500 to $1,999 | 3 (0.8%) | 0 (0.0%) |
| $2,000 to $2,499 | 0 (0.0%) | 0 (0.0%) |
| $2,500 to $2,999 | 0 (0.0%) | 0 (0.0%) |
| $3,000 or more | 0 (0.0%) | 0 (0.0%) |
| Total | 382 (100.0%) | 64 (100.0%) |
Physical Housing Characteristics in Fairfax
Housing Structures in Fairfax
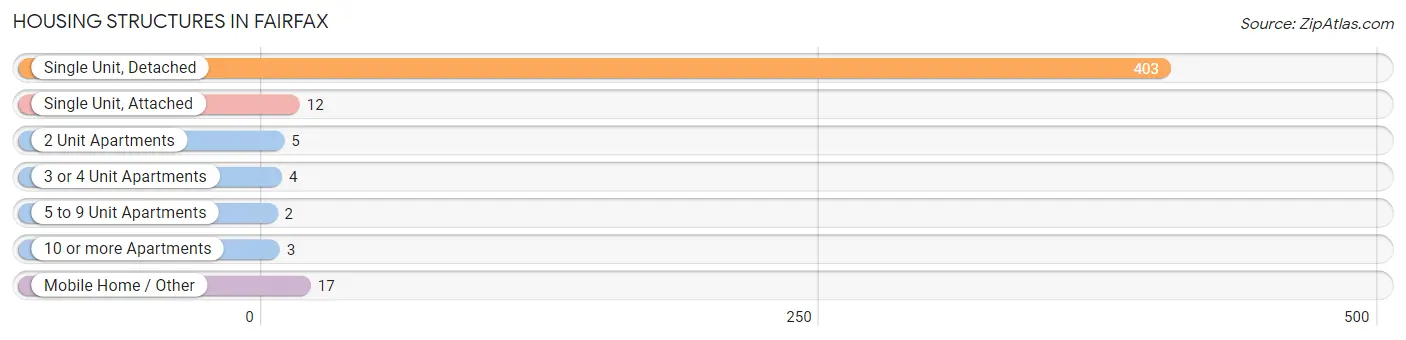
| Structure Type | # Housing Units | % Housing Units |
| Single Unit, Detached | 403 | 90.4% |
| Single Unit, Attached | 12 | 2.7% |
| 2 Unit Apartments | 5 | 1.1% |
| 3 or 4 Unit Apartments | 4 | 0.9% |
| 5 to 9 Unit Apartments | 2 | 0.4% |
| 10 or more Apartments | 3 | 0.7% |
| Mobile Home / Other | 17 | 3.8% |
| Total | 446 | 100.0% |
Housing Structures by Occupancy in Fairfax
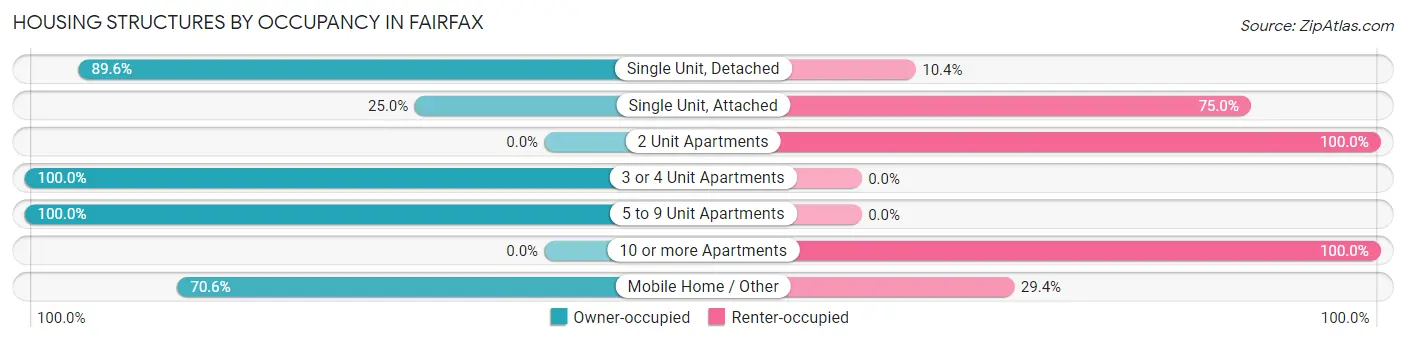
| Structure Type | Owner-occupied | Renter-occupied |
| Single Unit, Detached | 361 (89.6%) | 42 (10.4%) |
| Single Unit, Attached | 3 (25.0%) | 9 (75.0%) |
| 2 Unit Apartments | 0 (0.0%) | 5 (100.0%) |
| 3 or 4 Unit Apartments | 4 (100.0%) | 0 (0.0%) |
| 5 to 9 Unit Apartments | 2 (100.0%) | 0 (0.0%) |
| 10 or more Apartments | 0 (0.0%) | 3 (100.0%) |
| Mobile Home / Other | 12 (70.6%) | 5 (29.4%) |
| Total | 382 (85.7%) | 64 (14.3%) |
Housing Structures by Number of Rooms in Fairfax
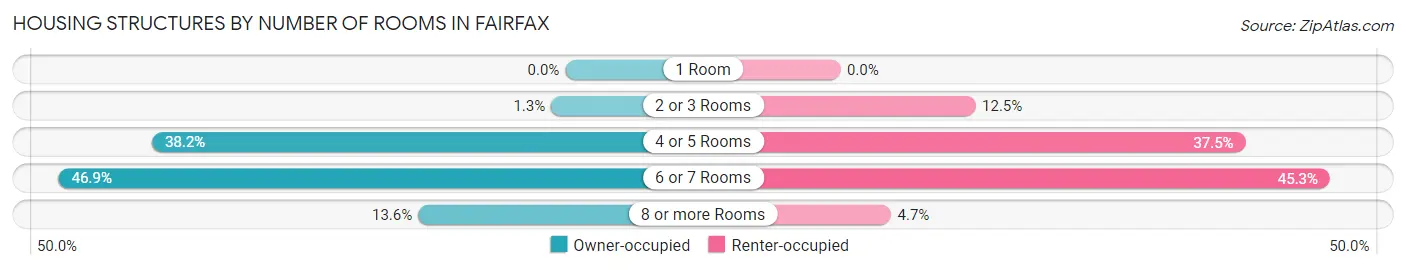
| Number of Rooms | Owner-occupied | Renter-occupied |
| 1 Room | 0 (0.0%) | 0 (0.0%) |
| 2 or 3 Rooms | 5 (1.3%) | 8 (12.5%) |
| 4 or 5 Rooms | 146 (38.2%) | 24 (37.5%) |
| 6 or 7 Rooms | 179 (46.9%) | 29 (45.3%) |
| 8 or more Rooms | 52 (13.6%) | 3 (4.7%) |
| Total | 382 (100.0%) | 64 (100.0%) |
Housing Structure by Heating Type in Fairfax
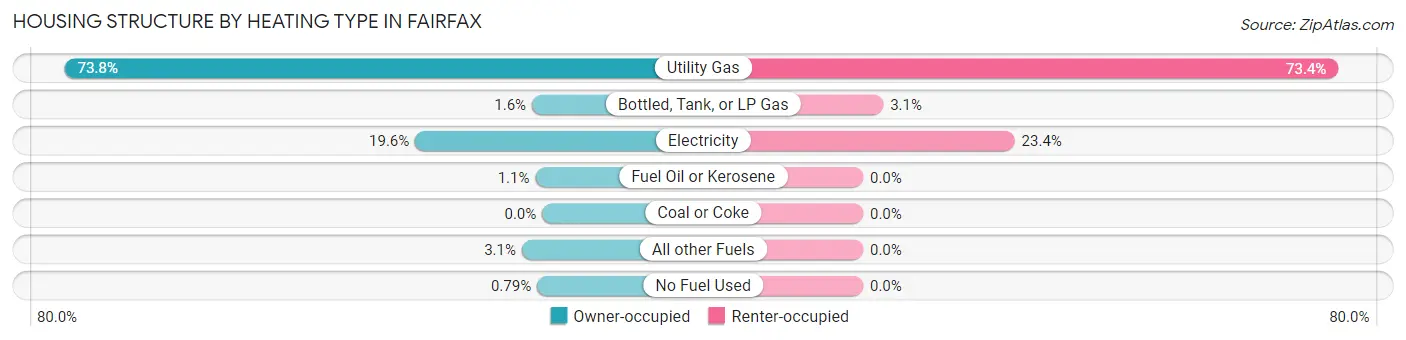
| Heating Type | Owner-occupied | Renter-occupied |
| Utility Gas | 282 (73.8%) | 47 (73.4%) |
| Bottled, Tank, or LP Gas | 6 (1.6%) | 2 (3.1%) |
| Electricity | 75 (19.6%) | 15 (23.4%) |
| Fuel Oil or Kerosene | 4 (1.1%) | 0 (0.0%) |
| Coal or Coke | 0 (0.0%) | 0 (0.0%) |
| All other Fuels | 12 (3.1%) | 0 (0.0%) |
| No Fuel Used | 3 (0.8%) | 0 (0.0%) |
| Total | 382 (100.0%) | 64 (100.0%) |
Household Vehicle Usage in Fairfax
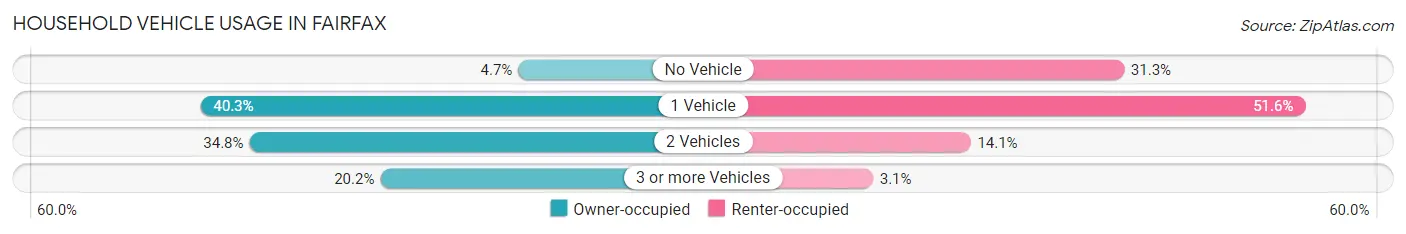
| Vehicles per Household | Owner-occupied | Renter-occupied |
| No Vehicle | 18 (4.7%) | 20 (31.2%) |
| 1 Vehicle | 154 (40.3%) | 33 (51.6%) |
| 2 Vehicles | 133 (34.8%) | 9 (14.1%) |
| 3 or more Vehicles | 77 (20.2%) | 2 (3.1%) |
| Total | 382 (100.0%) | 64 (100.0%) |
Real Estate & Mortgages in Fairfax
Real Estate and Mortgage Overview in Fairfax
| Characteristic | Without Mortgage | With Mortgage |
| Housing Units | 307 | 75 |
| Median Property Value | $45,000 | $64,400 |
| Median Household Income | $38,125 | $12 |
| Monthly Housing Costs | $327 | $0 |
| Real Estate Taxes | $260 | $6 |
Property Value by Mortgage Status in Fairfax
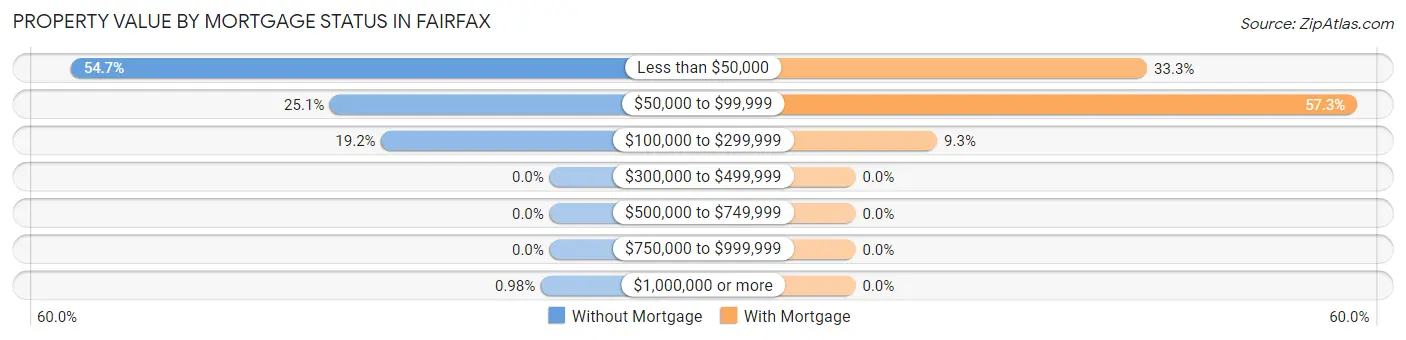
| Property Value | Without Mortgage | With Mortgage |
| Less than $50,000 | 168 (54.7%) | 25 (33.3%) |
| $50,000 to $99,999 | 77 (25.1%) | 43 (57.3%) |
| $100,000 to $299,999 | 59 (19.2%) | 7 (9.3%) |
| $300,000 to $499,999 | 0 (0.0%) | 0 (0.0%) |
| $500,000 to $749,999 | 0 (0.0%) | 0 (0.0%) |
| $750,000 to $999,999 | 0 (0.0%) | 0 (0.0%) |
| $1,000,000 or more | 3 (1.0%) | 0 (0.0%) |
| Total | 307 (100.0%) | 75 (100.0%) |
Household Income by Mortgage Status in Fairfax
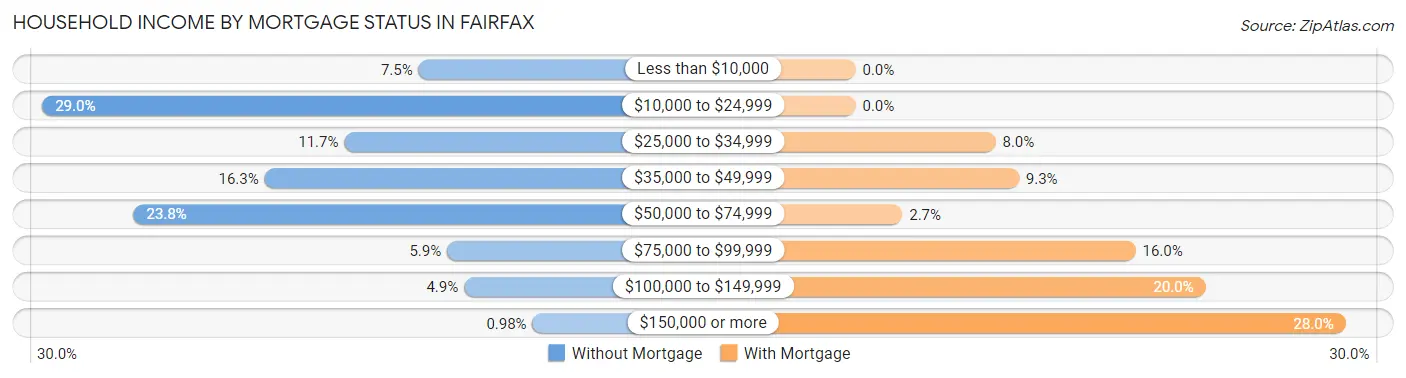
| Household Income | Without Mortgage | With Mortgage |
| Less than $10,000 | 23 (7.5%) | 0 (0.0%) |
| $10,000 to $24,999 | 89 (29.0%) | 0 (0.0%) |
| $25,000 to $34,999 | 36 (11.7%) | 6 (8.0%) |
| $35,000 to $49,999 | 50 (16.3%) | 7 (9.3%) |
| $50,000 to $74,999 | 73 (23.8%) | 2 (2.7%) |
| $75,000 to $99,999 | 18 (5.9%) | 12 (16.0%) |
| $100,000 to $149,999 | 15 (4.9%) | 15 (20.0%) |
| $150,000 or more | 3 (1.0%) | 21 (28.0%) |
| Total | 307 (100.0%) | 75 (100.0%) |
Property Value to Household Income Ratio in Fairfax
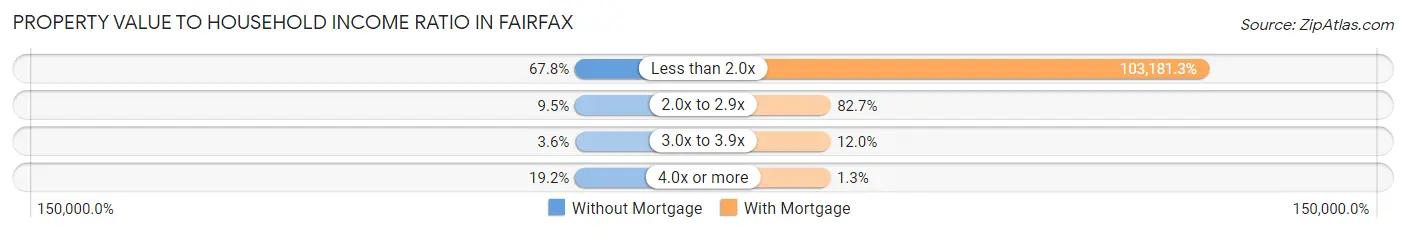
| Value-to-Income Ratio | Without Mortgage | With Mortgage |
| Less than 2.0x | 208 (67.7%) | 77,386 (103,181.3%) |
| 2.0x to 2.9x | 29 (9.5%) | 62 (82.7%) |
| 3.0x to 3.9x | 11 (3.6%) | 9 (12.0%) |
| 4.0x or more | 59 (19.2%) | 1 (1.3%) |
| Total | 307 (100.0%) | 75 (100.0%) |
Real Estate Taxes by Mortgage Status in Fairfax
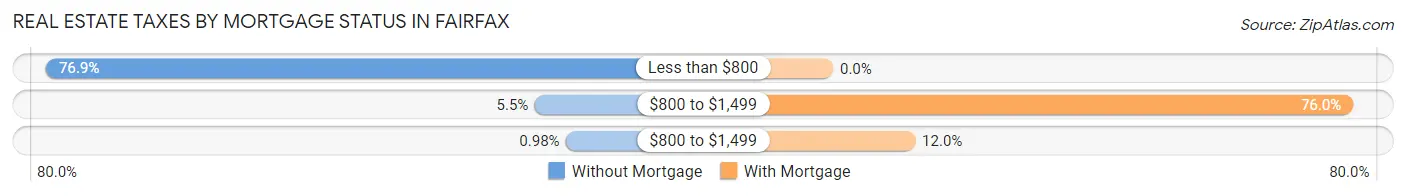
| Property Taxes | Without Mortgage | With Mortgage |
| Less than $800 | 236 (76.9%) | 0 (0.0%) |
| $800 to $1,499 | 17 (5.5%) | 57 (76.0%) |
| $800 to $1,499 | 3 (1.0%) | 9 (12.0%) |
| Total | 307 (100.0%) | 75 (100.0%) |
Health & Disability in Fairfax
Health Insurance Coverage by Age in Fairfax
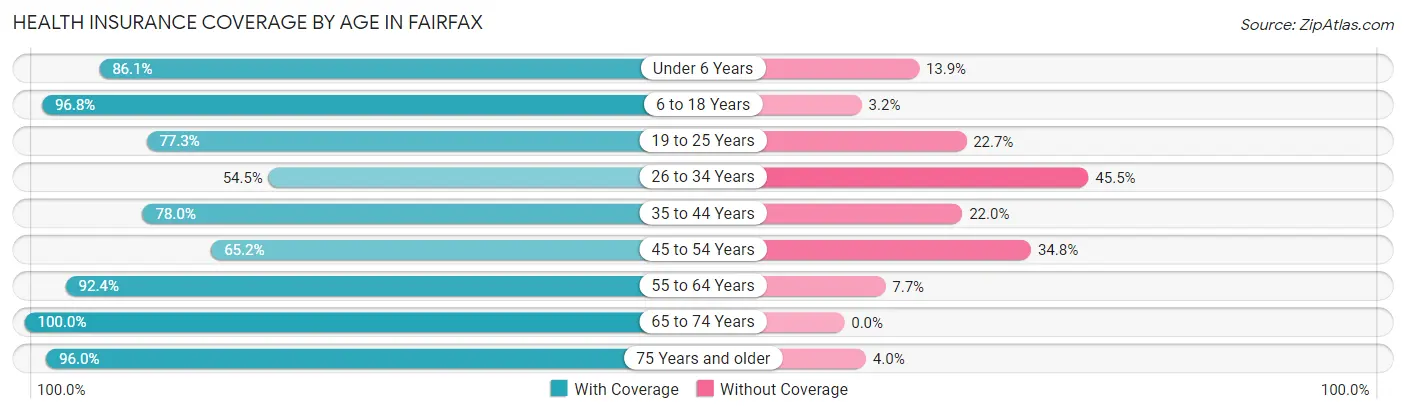
| Age Bracket | With Coverage | Without Coverage |
| Under 6 Years | 68 (86.1%) | 11 (13.9%) |
| 6 to 18 Years | 209 (96.8%) | 7 (3.2%) |
| 19 to 25 Years | 34 (77.3%) | 10 (22.7%) |
| 26 to 34 Years | 73 (54.5%) | 61 (45.5%) |
| 35 to 44 Years | 110 (78.0%) | 31 (22.0%) |
| 45 to 54 Years | 88 (65.2%) | 47 (34.8%) |
| 55 to 64 Years | 157 (92.3%) | 13 (7.6%) |
| 65 to 74 Years | 94 (100.0%) | 0 (0.0%) |
| 75 Years and older | 119 (96.0%) | 5 (4.0%) |
| Total | 952 (83.7%) | 185 (16.3%) |
Health Insurance Coverage by Citizenship Status in Fairfax
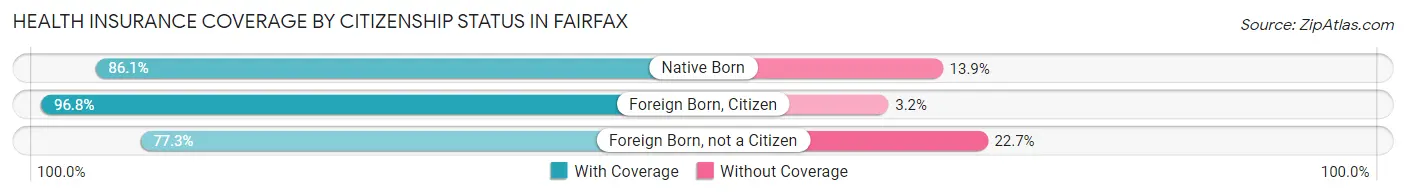
| Citizenship Status | With Coverage | Without Coverage |
| Native Born | 68 (86.1%) | 11 (13.9%) |
| Foreign Born, Citizen | 209 (96.8%) | 7 (3.2%) |
| Foreign Born, not a Citizen | 34 (77.3%) | 10 (22.7%) |
Health Insurance Coverage by Household Income in Fairfax
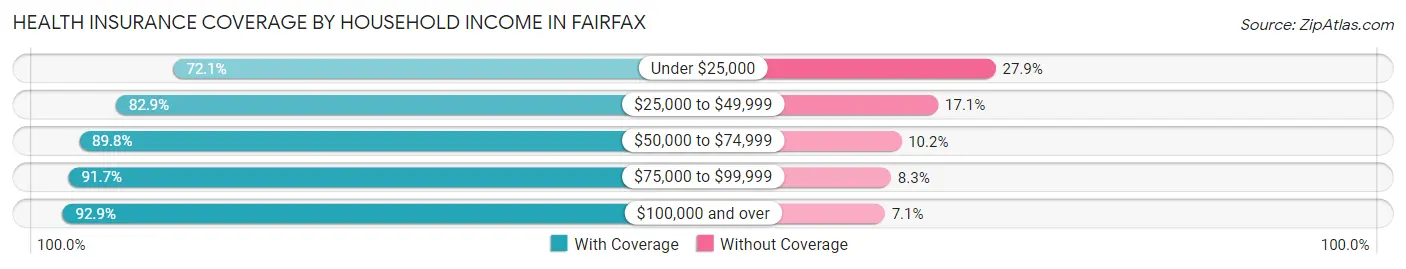
| Household Income | With Coverage | Without Coverage |
| Under $25,000 | 251 (72.1%) | 97 (27.9%) |
| $25,000 to $49,999 | 189 (82.9%) | 39 (17.1%) |
| $50,000 to $74,999 | 229 (89.8%) | 26 (10.2%) |
| $75,000 to $99,999 | 100 (91.7%) | 9 (8.3%) |
| $100,000 and over | 183 (92.9%) | 14 (7.1%) |
Public vs Private Health Insurance Coverage by Age in Fairfax
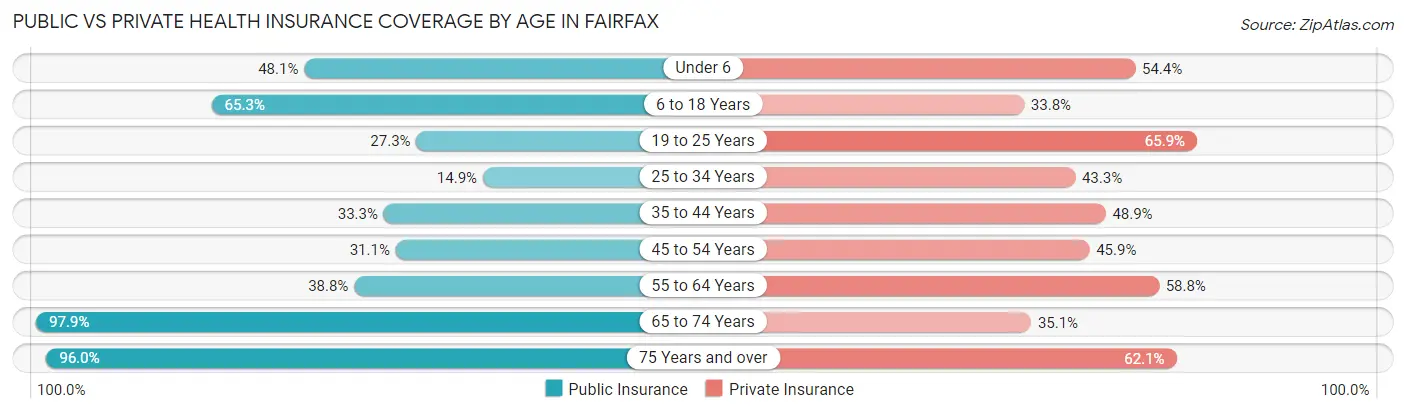
| Age Bracket | Public Insurance | Private Insurance |
| Under 6 | 38 (48.1%) | 43 (54.4%) |
| 6 to 18 Years | 141 (65.3%) | 73 (33.8%) |
| 19 to 25 Years | 12 (27.3%) | 29 (65.9%) |
| 25 to 34 Years | 20 (14.9%) | 58 (43.3%) |
| 35 to 44 Years | 47 (33.3%) | 69 (48.9%) |
| 45 to 54 Years | 42 (31.1%) | 62 (45.9%) |
| 55 to 64 Years | 66 (38.8%) | 100 (58.8%) |
| 65 to 74 Years | 92 (97.9%) | 33 (35.1%) |
| 75 Years and over | 119 (96.0%) | 77 (62.1%) |
| Total | 577 (50.7%) | 544 (47.8%) |
Disability Status by Sex by Age in Fairfax
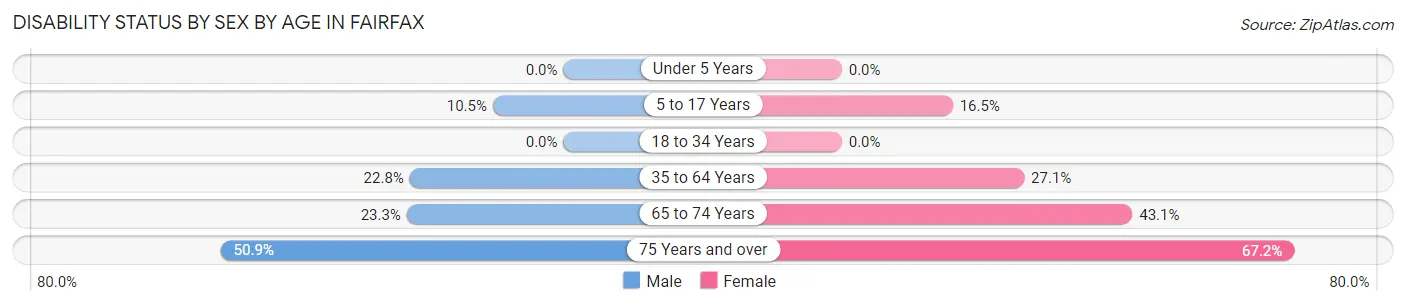
| Age Bracket | Male | Female |
| Under 5 Years | 0 (0.0%) | 0 (0.0%) |
| 5 to 17 Years | 13 (10.5%) | 14 (16.5%) |
| 18 to 34 Years | 0 (0.0%) | 0 (0.0%) |
| 35 to 64 Years | 47 (22.8%) | 65 (27.1%) |
| 65 to 74 Years | 10 (23.3%) | 22 (43.1%) |
| 75 Years and over | 29 (50.9%) | 45 (67.2%) |
Disability Class by Sex by Age in Fairfax
Disability Class: Hearing Difficulty
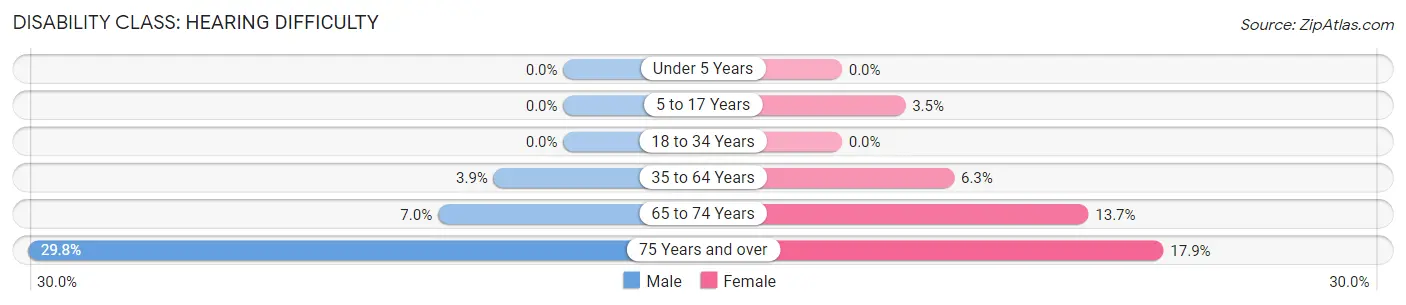
| Age Bracket | Male | Female |
| Under 5 Years | 0 (0.0%) | 0 (0.0%) |
| 5 to 17 Years | 0 (0.0%) | 3 (3.5%) |
| 18 to 34 Years | 0 (0.0%) | 0 (0.0%) |
| 35 to 64 Years | 8 (3.9%) | 15 (6.2%) |
| 65 to 74 Years | 3 (7.0%) | 7 (13.7%) |
| 75 Years and over | 17 (29.8%) | 12 (17.9%) |
Disability Class: Vision Difficulty
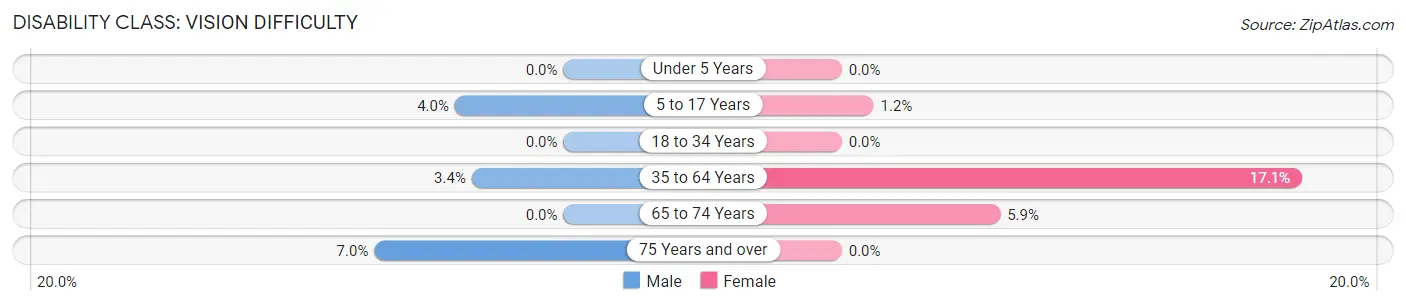
| Age Bracket | Male | Female |
| Under 5 Years | 0 (0.0%) | 0 (0.0%) |
| 5 to 17 Years | 5 (4.0%) | 1 (1.2%) |
| 18 to 34 Years | 0 (0.0%) | 0 (0.0%) |
| 35 to 64 Years | 7 (3.4%) | 41 (17.1%) |
| 65 to 74 Years | 0 (0.0%) | 3 (5.9%) |
| 75 Years and over | 4 (7.0%) | 0 (0.0%) |
Disability Class: Cognitive Difficulty
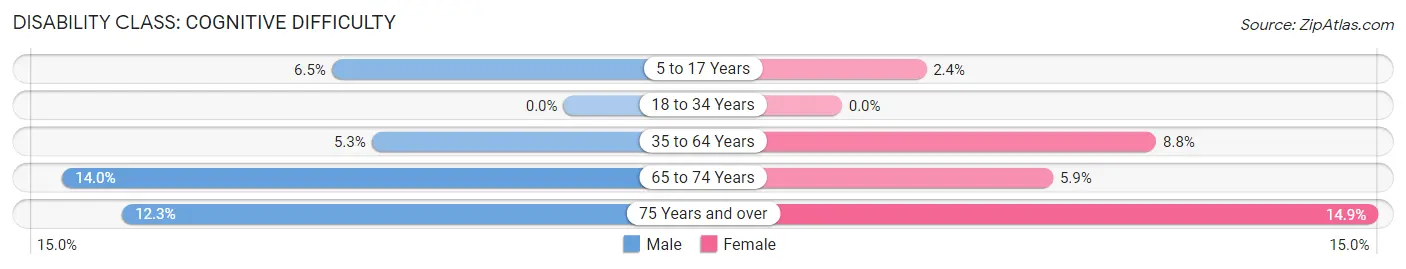
| Age Bracket | Male | Female |
| 5 to 17 Years | 8 (6.5%) | 2 (2.4%) |
| 18 to 34 Years | 0 (0.0%) | 0 (0.0%) |
| 35 to 64 Years | 11 (5.3%) | 21 (8.7%) |
| 65 to 74 Years | 6 (14.0%) | 3 (5.9%) |
| 75 Years and over | 7 (12.3%) | 10 (14.9%) |
Disability Class: Ambulatory Difficulty
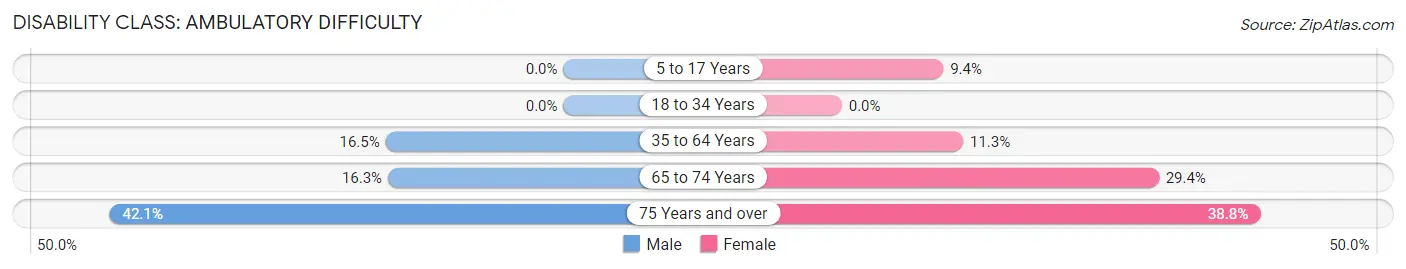
| Age Bracket | Male | Female |
| 5 to 17 Years | 0 (0.0%) | 8 (9.4%) |
| 18 to 34 Years | 0 (0.0%) | 0 (0.0%) |
| 35 to 64 Years | 34 (16.5%) | 27 (11.3%) |
| 65 to 74 Years | 7 (16.3%) | 15 (29.4%) |
| 75 Years and over | 24 (42.1%) | 26 (38.8%) |
Disability Class: Self-Care Difficulty
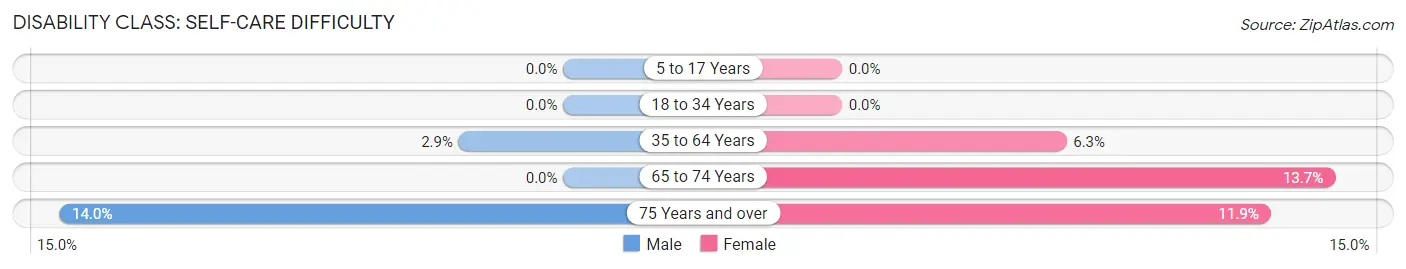
| Age Bracket | Male | Female |
| 5 to 17 Years | 0 (0.0%) | 0 (0.0%) |
| 18 to 34 Years | 0 (0.0%) | 0 (0.0%) |
| 35 to 64 Years | 6 (2.9%) | 15 (6.2%) |
| 65 to 74 Years | 0 (0.0%) | 7 (13.7%) |
| 75 Years and over | 8 (14.0%) | 8 (11.9%) |
Technology Access in Fairfax
Computing Device Access in Fairfax
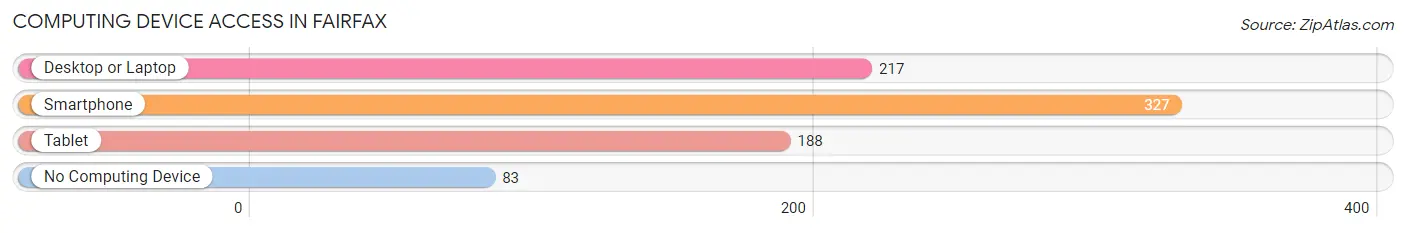
| Device Type | # Households | % Households |
| Desktop or Laptop | 217 | 48.6% |
| Smartphone | 327 | 73.3% |
| Tablet | 188 | 42.1% |
| No Computing Device | 83 | 18.6% |
| Total | 446 | 100.0% |
Internet Access in Fairfax
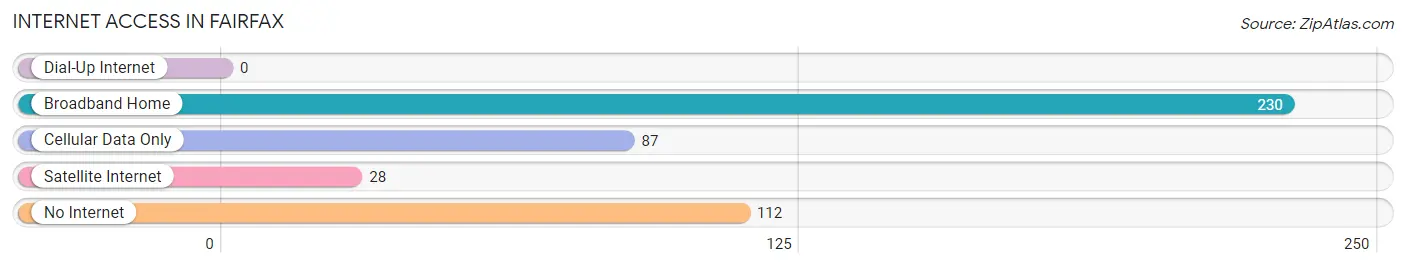
| Internet Type | # Households | % Households |
| Dial-Up Internet | 0 | 0.0% |
| Broadband Home | 230 | 51.6% |
| Cellular Data Only | 87 | 19.5% |
| Satellite Internet | 28 | 6.3% |
| No Internet | 112 | 25.1% |
| Total | 446 | 100.0% |
Fairfax Summary
Fairfax, Oklahoma is a small town located in Osage County, Oklahoma. It is situated in the northeastern part of the state, about 25 miles north of Tulsa. The town was founded in 1891 and was named after the Fairfax family, who were early settlers in the area. The population of Fairfax was 1,845 in the 2010 census.
Geography
Fairfax is located in the Osage Plains region of Oklahoma. The town is situated on the banks of the Arkansas River, which flows through the area. The town is surrounded by rolling hills and grasslands, and is located in a region of the state known for its rich agricultural land. The climate in Fairfax is generally mild, with hot summers and cold winters.
Economy
The economy of Fairfax is largely based on agriculture. The town is home to several large farms, which produce a variety of crops, including wheat, corn, soybeans, and cotton. The town also has a number of small businesses, including restaurants, retail stores, and service providers.
Demographics
As of the 2010 census, the population of Fairfax was 1,845. The racial makeup of the town was 94.3% White, 0.7% African American, 0.3% Native American, 0.2% Asian, 0.1% Pacific Islander, and 4.4% from other races. The median household income in Fairfax was $37,917, and the median family income was $45,917.
History
The area that is now Fairfax was first settled by the Osage Indians in the early 1800s. The town was founded in 1891 and was named after the Fairfax family, who were early settlers in the area. The town was incorporated in 1901 and has remained a small, rural community ever since.
In the early 1900s, Fairfax was a thriving agricultural center, with several large farms in the area. The town was also home to a number of small businesses, including a bank, a hotel, and a general store. In the 1950s, the town began to decline as many of the farms in the area were sold off and the population began to decline.
Today, Fairfax is a small, rural community with a population of just over 1,800. The town is still largely agricultural, with several large farms in the area. The town also has a number of small businesses, including restaurants, retail stores, and service providers. The town is also home to a number of historic buildings, including the Fairfax School, which was built in 1912.
Common Questions
What is Per Capita Income in Fairfax?
Per Capita income in Fairfax is $20,992.
What is the Median Family Income in Fairfax?
Median Family Income in Fairfax is $51,563.
What is the Median Household income in Fairfax?
Median Household Income in Fairfax is $38,889.
What is Income or Wage Gap in Fairfax?
Income or Wage Gap in Fairfax is 34.5%.
Women in Fairfax earn 65.5 cents for every dollar earned by a man.
What is Family Income Deficit in Fairfax?
Family Income Deficit in Fairfax is $11,942.
Families that are below poverty line in Fairfax earn $11,942 less on average than the poverty threshold level.
What is Inequality or Gini Index in Fairfax?
Inequality or Gini Index in Fairfax is 0.44.
What is the Total Population of Fairfax?
Total Population of Fairfax is 1,172.
What is the Total Male Population of Fairfax?
Total Male Population of Fairfax is 580.
What is the Total Female Population of Fairfax?
Total Female Population of Fairfax is 592.
What is the Ratio of Males per 100 Females in Fairfax?
There are 97.97 Males per 100 Females in Fairfax.
What is the Ratio of Females per 100 Males in Fairfax?
There are 102.07 Females per 100 Males in Fairfax.
What is the Median Population Age in Fairfax?
Median Population Age in Fairfax is 42.5 Years.
What is the Average Family Size in Fairfax
Average Family Size in Fairfax is 3.1 People.
What is the Average Household Size in Fairfax
Average Household Size in Fairfax is 2.5 People.
How Large is the Labor Force in Fairfax?
There are 459 People in the Labor Forcein in Fairfax.
What is the Percentage of People in the Labor Force in Fairfax?
50.7% of People are in the Labor Force in Fairfax.
What is the Unemployment Rate in Fairfax?
Unemployment Rate in Fairfax is 15.0%.