Zip Codes with the Highest Percentage of Population with a Degree in Literature and Languages in Oklahoma
RELATED REPORTS & OPTIONS
Literature and Languages
Oklahoma
Compare Zip Codes
Map of Zip Codes with the Highest Percentage of Population with a Degree in Literature and Languages in Oklahoma
0.0%
60.0%
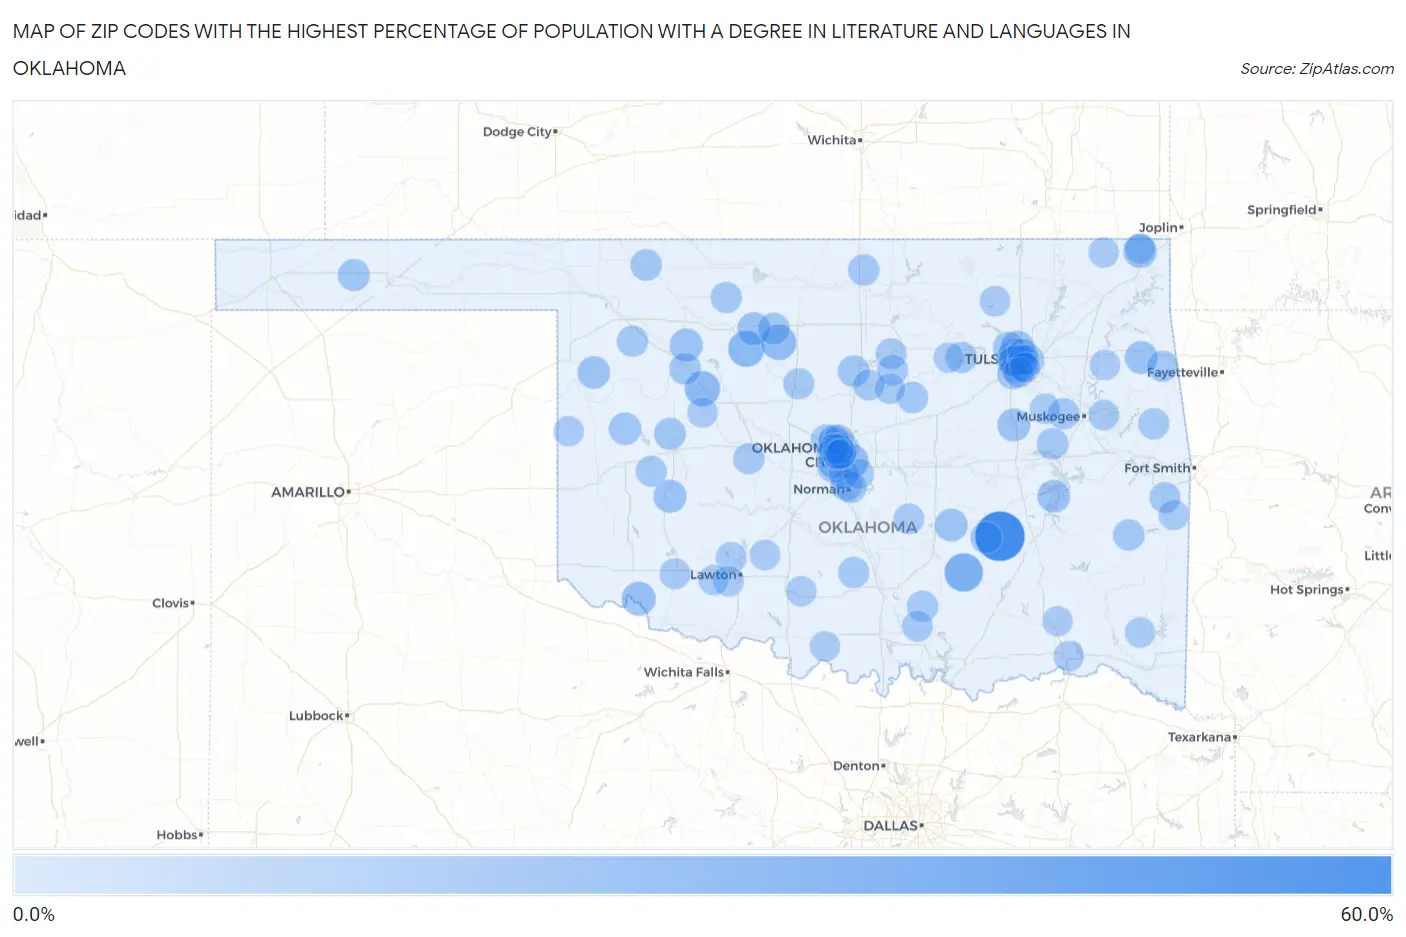
Zip Codes with the Highest Percentage of Population with a Degree in Literature and Languages in Oklahoma
| Zip Code | % Graduates | vs State | vs National | |
| 1. | 74570 | 53.2% | 2.8%(+50.3)#1 | 4.4%(+48.8)#52 |
| 2. | 74572 | 23.9% | 2.8%(+21.1)#2 | 4.4%(+19.5)#340 |
| 3. | 73747 | 17.9% | 2.8%(+15.1)#3 | 4.4%(+13.5)#579 |
| 4. | 73658 | 16.0% | 2.8%(+13.2)#4 | 4.4%(+11.6)#724 |
| 5. | 73735 | 15.7% | 2.8%(+12.9)#5 | 4.4%(+11.3)#748 |
| 6. | 73145 | 14.6% | 2.8%(+11.8)#6 | 4.4%(+10.2)#855 |
| 7. | 73539 | 12.5% | 2.8%(+9.68)#7 | 4.4%(+8.09)#1,147 |
| 8. | 74130 | 11.6% | 2.8%(+8.76)#8 | 4.4%(+7.17)#1,316 |
| 9. | 74358 | 11.1% | 2.8%(+8.29)#9 | 4.4%(+6.70)#1,445 |
| 10. | 73838 | 10.5% | 2.8%(+7.71)#10 | 4.4%(+6.12)#1,624 |
| 11. | 73768 | 10.3% | 2.8%(+7.48)#11 | 4.4%(+5.89)#1,711 |
| 12. | 73661 | 10.1% | 2.8%(+7.32)#12 | 4.4%(+5.74)#1,761 |
| 13. | 73103 | 10.1% | 2.8%(+7.30)#13 | 4.4%(+5.71)#1,772 |
| 14. | 74359 | 10.0% | 2.8%(+7.18)#14 | 4.4%(+5.59)#1,827 |
| 15. | 74447 | 9.8% | 2.8%(+6.94)#15 | 4.4%(+5.35)#1,930 |
| 16. | 74867 | 9.6% | 2.8%(+6.79)#16 | 4.4%(+5.21)#1,993 |
| 17. | 74425 | 9.5% | 2.8%(+6.70)#17 | 4.4%(+5.11)#2,026 |
| 18. | 73159 | 9.4% | 2.8%(+6.57)#18 | 4.4%(+4.98)#2,096 |
| 19. | 73832 | 9.2% | 2.8%(+6.33)#19 | 4.4%(+4.75)#2,235 |
| 20. | 73650 | 8.9% | 2.8%(+6.05)#20 | 4.4%(+4.46)#2,389 |
| 21. | 74103 | 8.1% | 2.8%(+5.23)#21 | 4.4%(+3.64)#2,942 |
| 22. | 73939 | 7.6% | 2.8%(+4.73)#22 | 4.4%(+3.14)#3,388 |
| 23. | 73069 | 7.5% | 2.8%(+4.69)#23 | 4.4%(+3.10)#3,423 |
| 24. | 74106 | 7.4% | 2.8%(+4.58)#24 | 4.4%(+3.00)#3,550 |
| 25. | 73754 | 7.4% | 2.8%(+4.56)#25 | 4.4%(+2.97)#3,569 |
| 26. | 74120 | 7.3% | 2.8%(+4.53)#26 | 4.4%(+2.94)#3,608 |
| 27. | 74531 | 7.1% | 2.8%(+4.32)#27 | 4.4%(+2.73)#3,815 |
| 28. | 73063 | 7.1% | 2.8%(+4.27)#28 | 4.4%(+2.68)#3,890 |
| 29. | 73620 | 7.1% | 2.8%(+4.23)#29 | 4.4%(+2.64)#3,941 |
| 30. | 73119 | 7.0% | 2.8%(+4.22)#30 | 4.4%(+2.63)#3,960 |
| 31. | 73663 | 6.8% | 2.8%(+3.94)#31 | 4.4%(+2.35)#4,292 |
| 32. | 73116 | 6.6% | 2.8%(+3.76)#32 | 4.4%(+2.17)#4,521 |
| 33. | 73842 | 6.5% | 2.8%(+3.63)#33 | 4.4%(+2.04)#4,719 |
| 34. | 74428 | 6.4% | 2.8%(+3.60)#34 | 4.4%(+2.01)#4,762 |
| 35. | 74114 | 6.3% | 2.8%(+3.50)#35 | 4.4%(+1.91)#4,906 |
| 36. | 74942 | 6.2% | 2.8%(+3.43)#36 | 4.4%(+1.84)#5,026 |
| 37. | 74126 | 6.1% | 2.8%(+3.31)#37 | 4.4%(+1.72)#5,213 |
| 38. | 73107 | 6.1% | 2.8%(+3.30)#38 | 4.4%(+1.71)#5,224 |
| 39. | 74824 | 6.1% | 2.8%(+3.30)#39 | 4.4%(+1.71)#5,229 |
| 40. | 74631 | 6.0% | 2.8%(+3.19)#40 | 4.4%(+1.61)#5,393 |
| 41. | 74463 | 6.0% | 2.8%(+3.15)#41 | 4.4%(+1.56)#5,458 |
| 42. | 73857 | 6.0% | 2.8%(+3.15)#42 | 4.4%(+1.56)#5,462 |
| 43. | 73726 | 6.0% | 2.8%(+3.13)#43 | 4.4%(+1.54)#5,498 |
| 44. | 74931 | 5.9% | 2.8%(+3.10)#44 | 4.4%(+1.52)#5,555 |
| 45. | 73047 | 5.9% | 2.8%(+3.07)#45 | 4.4%(+1.48)#5,603 |
| 46. | 74081 | 5.9% | 2.8%(+3.06)#46 | 4.4%(+1.47)#5,623 |
| 47. | 74105 | 5.7% | 2.8%(+2.92)#47 | 4.4%(+1.33)#5,862 |
| 48. | 73433 | 5.7% | 2.8%(+2.89)#48 | 4.4%(+1.30)#5,930 |
| 49. | 74856 | 5.7% | 2.8%(+2.86)#49 | 4.4%(+1.27)#5,980 |
| 50. | 74964 | 5.6% | 2.8%(+2.80)#50 | 4.4%(+1.21)#6,096 |
| 51. | 74104 | 5.6% | 2.8%(+2.76)#51 | 4.4%(+1.17)#6,161 |
| 52. | 74119 | 5.5% | 2.8%(+2.68)#52 | 4.4%(+1.09)#6,320 |
| 53. | 73162 | 5.5% | 2.8%(+2.66)#53 | 4.4%(+1.07)#6,371 |
| 54. | 74135 | 5.4% | 2.8%(+2.57)#54 | 4.4%(+0.976)#6,549 |
| 55. | 73111 | 5.3% | 2.8%(+2.44)#55 | 4.4%(+0.850)#6,826 |
| 56. | 74128 | 5.2% | 2.8%(+2.40)#56 | 4.4%(+0.810)#6,909 |
| 57. | 73624 | 5.2% | 2.8%(+2.37)#57 | 4.4%(+0.785)#6,955 |
| 58. | 74951 | 5.0% | 2.8%(+2.18)#58 | 4.4%(+0.590)#7,350 |
| 59. | 73734 | 5.0% | 2.8%(+2.18)#59 | 4.4%(+0.590)#7,356 |
| 60. | 73071 | 5.0% | 2.8%(+2.16)#60 | 4.4%(+0.572)#7,409 |
| 61. | 73027 | 5.0% | 2.8%(+2.15)#61 | 4.4%(+0.565)#7,424 |
| 62. | 74075 | 4.8% | 2.8%(+1.99)#62 | 4.4%(+0.399)#7,868 |
| 63. | 73507 | 4.8% | 2.8%(+1.96)#63 | 4.4%(+0.371)#7,954 |
| 64. | 74074 | 4.7% | 2.8%(+1.91)#64 | 4.4%(+0.320)#8,089 |
| 65. | 73566 | 4.6% | 2.8%(+1.77)#65 | 4.4%(+0.178)#8,473 |
| 66. | 73447 | 4.5% | 2.8%(+1.72)#66 | 4.4%(+0.136)#8,593 |
| 67. | 74115 | 4.5% | 2.8%(+1.68)#67 | 4.4%(+0.093)#8,712 |
| 68. | 73120 | 4.4% | 2.8%(+1.53)#68 | 4.4%(-0.057)#9,139 |
| 69. | 74132 | 4.3% | 2.8%(+1.52)#69 | 4.4%(-0.070)#9,181 |
| 70. | 73114 | 4.3% | 2.8%(+1.46)#70 | 4.4%(-0.125)#9,359 |
| 71. | 73160 | 4.2% | 2.8%(+1.41)#71 | 4.4%(-0.180)#9,514 |
| 72. | 74112 | 4.2% | 2.8%(+1.38)#72 | 4.4%(-0.205)#9,590 |
| 73. | 74826 | 4.2% | 2.8%(+1.38)#73 | 4.4%(-0.208)#9,601 |
| 74. | 73106 | 4.2% | 2.8%(+1.37)#74 | 4.4%(-0.214)#9,620 |
| 75. | 74369 | 4.1% | 2.8%(+1.27)#75 | 4.4%(-0.316)#9,933 |
| 76. | 73165 | 4.0% | 2.8%(+1.18)#76 | 4.4%(-0.408)#10,164 |
| 77. | 74002 | 4.0% | 2.8%(+1.16)#77 | 4.4%(-0.426)#10,217 |
| 78. | 73505 | 4.0% | 2.8%(+1.15)#78 | 4.4%(-0.435)#10,245 |
| 79. | 74136 | 4.0% | 2.8%(+1.13)#79 | 4.4%(-0.454)#10,314 |
| 80. | 73567 | 3.9% | 2.8%(+1.10)#80 | 4.4%(-0.488)#10,420 |
| 81. | 74145 | 3.9% | 2.8%(+1.10)#81 | 4.4%(-0.489)#10,426 |
| 82. | 74434 | 3.9% | 2.8%(+1.09)#82 | 4.4%(-0.498)#10,452 |
| 83. | 73118 | 3.9% | 2.8%(+1.06)#83 | 4.4%(-0.524)#10,546 |
| 84. | 74059 | 3.9% | 2.8%(+1.04)#84 | 4.4%(-0.554)#10,653 |
| 85. | 73669 | 3.8% | 2.8%(+0.963)#85 | 4.4%(-0.626)#10,876 |
| 86. | 73533 | 3.8% | 2.8%(+0.953)#86 | 4.4%(-0.636)#10,909 |
| 87. | 73660 | 3.7% | 2.8%(+0.883)#87 | 4.4%(-0.706)#11,151 |
| 88. | 73112 | 3.7% | 2.8%(+0.872)#88 | 4.4%(-0.716)#11,185 |
| 89. | 74728 | 3.7% | 2.8%(+0.863)#89 | 4.4%(-0.726)#11,218 |
| 90. | 73527 | 3.6% | 2.8%(+0.789)#90 | 4.4%(-0.799)#11,454 |
| 91. | 74352 | 3.6% | 2.8%(+0.763)#91 | 4.4%(-0.826)#11,557 |
| 92. | 74743 | 3.6% | 2.8%(+0.760)#92 | 4.4%(-0.829)#11,565 |
| 93. | 74038 | 3.6% | 2.8%(+0.750)#93 | 4.4%(-0.838)#11,590 |
| 94. | 74339 | 3.5% | 2.8%(+0.725)#94 | 4.4%(-0.864)#11,689 |
| 95. | 74436 | 3.5% | 2.8%(+0.691)#95 | 4.4%(-0.898)#11,812 |
| 96. | 74523 | 3.5% | 2.8%(+0.667)#96 | 4.4%(-0.921)#11,884 |
| 97. | 73456 | 3.5% | 2.8%(+0.662)#97 | 4.4%(-0.927)#11,910 |
| 98. | 73102 | 3.5% | 2.8%(+0.636)#98 | 4.4%(-0.953)#11,991 |
| 99. | 74953 | 3.5% | 2.8%(+0.635)#99 | 4.4%(-0.954)#11,993 |
| 100. | 73104 | 3.5% | 2.8%(+0.634)#100 | 4.4%(-0.954)#11,995 |
Common Questions
What are the Top 10 Zip Codes with the Highest Percentage of Population with a Degree in Literature and Languages in Oklahoma?
Top 10 Zip Codes with the Highest Percentage of Population with a Degree in Literature and Languages in Oklahoma are:
What zip code has the Highest Percentage of Population with a Degree in Literature and Languages in Oklahoma?
74570 has the Highest Percentage of Population with a Degree in Literature and Languages in Oklahoma with 53.2%.
What is the Percentage of Population with a Degree in Literature and Languages in the State of Oklahoma?
Percentage of Population with a Degree in Literature and Languages in Oklahoma is 2.8%.
What is the Percentage of Population with a Degree in Literature and Languages in the United States?
Percentage of Population with a Degree in Literature and Languages in the United States is 4.4%.