Zip Codes with the Highest Percentage of Population with a Degree in Literature and Languages in Oklahoma City, OK

RELATED REPORTS & OPTIONS

Literature and Languages
Population
Families and Households
Female Fertility
Female Fertility (Unmarried)
Race (Community Size)
Race (Percentage)
Ancestry (Community Size)
AfricanAlaska NativeAlbanianAmericanApacheArabArapahoArgentineanArmenianAustralianAustrianBahamianBangladeshiBarbadianBasqueBelgianBhutaneseBlackfeetBolivianBrazilianBritishBritish West IndianBulgarianBurmeseCajunCambodianCanadianCelticCentral AmericanCentral American IndianCherokeeCheyenneChickasawChileanChippewaChoctawColombianComancheCreeCreekCroatianCubanCzechCzechoslovakianDanishDelawareDominicanDutchDutch West IndianEastern EuropeanEcuadorianEgyptianEnglishEstonianEthiopianEuropeanFijianFilipinoFinnishFrenchFrench American IndianFrench CanadianGermanGerman RussianGhanaianGreekGuamanian / ChamorroGuatemalanGuyaneseHaitianHonduranHopiHungarianIcelanderIndian (Asian)IndonesianInupiatIranianIraqiIrishIroquoisIsraeliItalianJamaicanJapaneseJordanianKenyanKiowaKoreanLaotianLatvianLebaneseLiberianLithuanianLuxembourgerMalaysianMexicanMexican American IndianMongolianMoroccanNative HawaiianNavajoNew ZealanderNicaraguanNigerianNorthern EuropeanNorwegianOkinawanOsagePakistaniPalestinianPanamanianPennsylvania GermanPeruvianPimaPolishPortuguesePotawatomiPuebloPuerto RicanRomanianRussianSalvadoranSamoanScandinavianScotch-IrishScottishSeminoleSerbianSiouxSlavicSlovakSloveneSouth AfricanSouth AmericanSouth American IndianSpaniardSpanishSpanish American IndianSri LankanSubsaharan AfricanSudaneseSwedishSwissSyrianThaiTlingit-HaidaTonganTrinidadian and TobagonianTurkishU.S. Virgin IslanderUkrainianUruguayanVenezuelanVietnameseWelshWest IndianYugoslavianZimbabwean
Ancestry (Percentage)
AfricanAlaska NativeAlbanianAmericanApacheArabArapahoArgentineanArmenianAustralianAustrianBahamianBangladeshiBarbadianBasqueBelgianBhutaneseBlackfeetBolivianBrazilianBritishBritish West IndianBulgarianBurmeseCajunCambodianCanadianCelticCentral AmericanCentral American IndianCherokeeCheyenneChickasawChileanChippewaChoctawColombianComancheCreeCreekCroatianCubanCzechCzechoslovakianDanishDelawareDominicanDutchDutch West IndianEastern EuropeanEcuadorianEgyptianEnglishEstonianEthiopianEuropeanFijianFilipinoFinnishFrenchFrench American IndianFrench CanadianGermanGerman RussianGhanaianGreekGuamanian / ChamorroGuatemalanGuyaneseHaitianHonduranHopiHungarianIcelanderIndian (Asian)IndonesianInupiatIranianIraqiIrishIroquoisIsraeliItalianJamaicanJapaneseJordanianKenyanKiowaKoreanLaotianLatvianLebaneseLiberianLithuanianLuxembourgerMalaysianMexicanMexican American IndianMongolianMoroccanNative HawaiianNavajoNew ZealanderNicaraguanNigerianNorthern EuropeanNorwegianOkinawanOsagePakistaniPalestinianPanamanianPennsylvania GermanPeruvianPimaPolishPortuguesePotawatomiPuebloPuerto RicanRomanianRussianSalvadoranSamoanScandinavianScotch-IrishScottishSeminoleSerbianSiouxSlavicSlovakSloveneSouth AfricanSouth AmericanSouth American IndianSpaniardSpanishSpanish American IndianSri LankanSubsaharan AfricanSudaneseSwedishSwissSyrianThaiTlingit-HaidaTonganTrinidadian and TobagonianTurkishU.S. Virgin IslanderUkrainianUruguayanVenezuelanVietnameseWelshWest IndianYugoslavianZimbabwean
Immigrant Origin (Total)
AfricaArgentinaAsiaAustraliaAustriaBahamasBangladeshBosnia and HerzegovinaBrazilBulgariaBurma / MyanmarCambodiaCameroonCanadaCaribbeanCentral AmericaChileChinaColombiaCubaDominican RepublicEastern AfricaEastern AsiaEastern EuropeEcuadorEgyptEl SalvadorEnglandEritreaEthiopiaEuropeFranceGermanyGhanaGreeceGuatemalaHondurasHong KongIndiaIndonesiaIranIraqIrelandItalyJamaicaJapanJordanKazakhstanKenyaKoreaKuwaitLaosLatin AmericaLebanonLiberiaMalaysiaMexicoMiddle AfricaMoroccoNepalNetherlandsNicaraguaNigeriaNorthern AfricaNorthern EuropeNorwayOceaniaPakistanPanamaPeruPhilippinesPolandPortugalRussiaSaudi ArabiaScotlandSingaporeSouth AfricaSouth AmericaSouth Central AsiaSouth Eastern AsiaSouthern EuropeSpainSudanSyriaTaiwanThailandTrinidad and TobagoTurkeyUkraineVenezuelaVietnamWestern AfricaWestern AsiaWestern EuropeZaireZimbabwe
Immigrant Origin (Percentage)
AfricaArgentinaAsiaAustraliaAustriaBahamasBangladeshBosnia and HerzegovinaBrazilBulgariaBurma / MyanmarCambodiaCameroonCanadaCaribbeanCentral AmericaChileChinaColombiaCubaDominican RepublicEastern AfricaEastern AsiaEastern EuropeEcuadorEgyptEl SalvadorEnglandEritreaEthiopiaEuropeFranceGermanyGhanaGreeceGuatemalaHondurasHong KongIndiaIndonesiaIranIraqIrelandItalyJamaicaJapanJordanKazakhstanKenyaKoreaKuwaitLaosLatin AmericaLebanonLiberiaMalaysiaMexicoMiddle AfricaMoroccoNepalNetherlandsNicaraguaNigeriaNorthern AfricaNorthern EuropeNorwayOceaniaPakistanPanamaPeruPhilippinesPolandPortugalRussiaSaudi ArabiaScotlandSingaporeSouth AfricaSouth AmericaSouth Central AsiaSouth Eastern AsiaSouthern EuropeSpainSudanSyriaTaiwanThailandTrinidad and TobagoTurkeyUkraineVenezuelaVietnamWestern AfricaWestern AsiaWestern EuropeZaireZimbabwe
Income
Income (Families)
Income (Households)
Poverty
Poverty (Families)
Unemployment
Employment Occupations
Employment Industries
Employer Class
Commute Time
Commute Means
School Enrollment
Education by Degree Field
Occupancy
Finances
Physical Characteristics
Oklahoma City
Compare Zip Codes
Comparison Subject

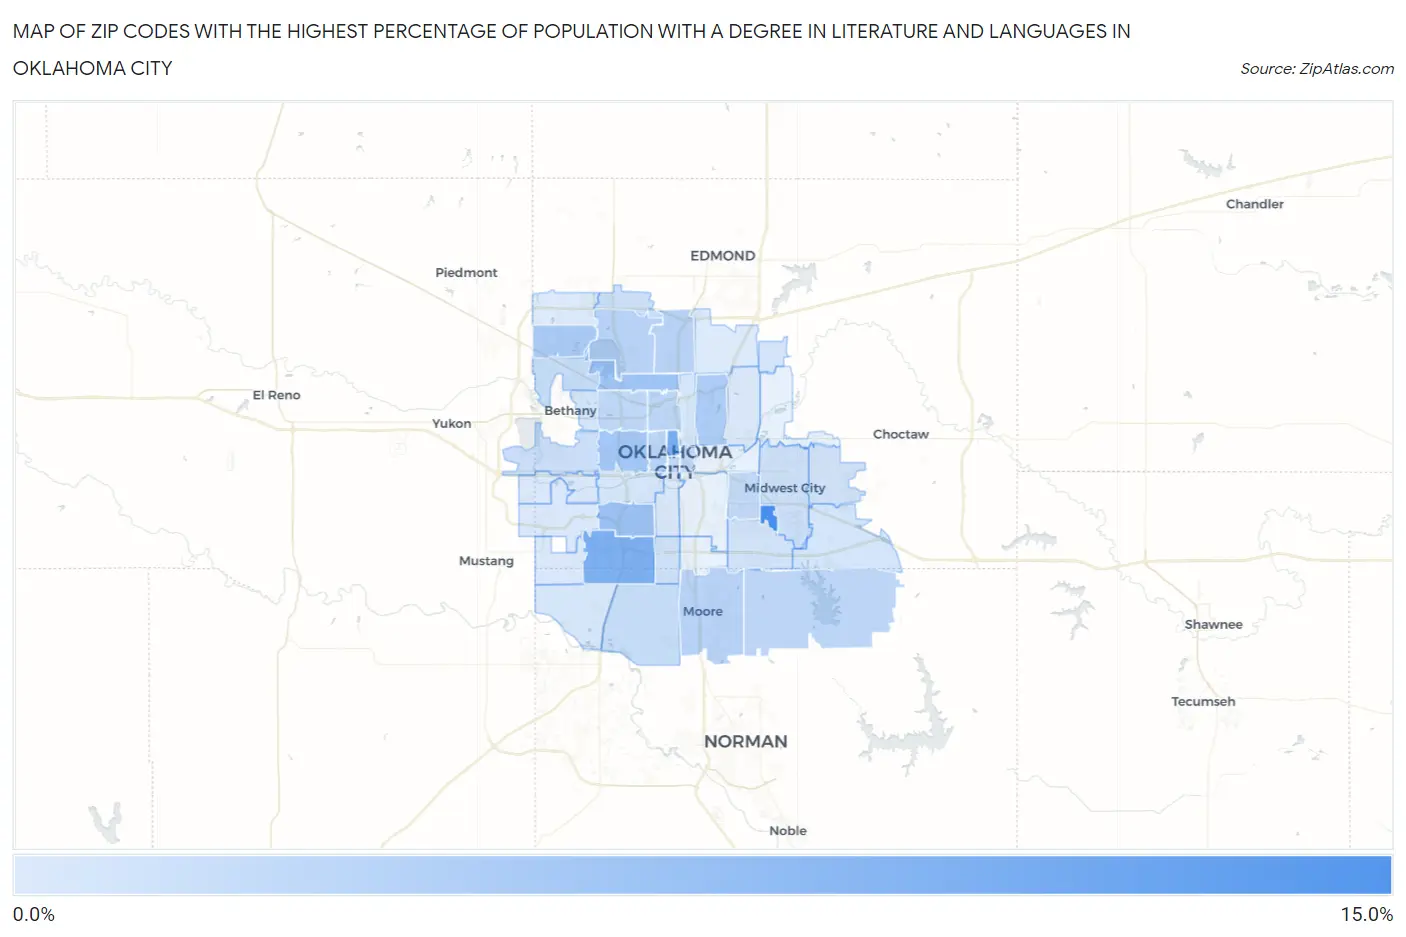
Map of Zip Codes with the Highest Percentage of Population with a Degree in Literature and Languages in Oklahoma City

0.0%
15.0%
Zip Codes with the Highest Percentage of Population with a Degree in Literature and Languages in Oklahoma City Map

Zip Codes with the Highest Percentage of Population with a Degree in Literature and Languages in Oklahoma City, OK

Zip Code % Graduates vs State vs National
1.7314514.6%2.8%(+11.8)#64.4%(+10.2)#855
2.7310310.1%2.8%(+7.30)#134.4%(+5.71)#1,772
3.731599.4%2.8%(+6.57)#184.4%(+4.98)#2,096
4.731197.0%2.8%(+4.22)#304.4%(+2.63)#3,960
5.731166.6%2.8%(+3.76)#324.4%(+2.17)#4,521
6.731076.1%2.8%(+3.30)#384.4%(+1.71)#5,224
7.731625.5%2.8%(+2.66)#534.4%(+1.07)#6,371
8.731115.3%2.8%(+2.44)#554.4%(+0.850)#6,826
9.731204.4%2.8%(+1.53)#684.4%(-0.057)#9,139
10.731144.3%2.8%(+1.46)#704.4%(-0.125)#9,359
11.731604.2%2.8%(+1.41)#714.4%(-0.180)#9,514
12.731064.2%2.8%(+1.37)#744.4%(-0.214)#9,620
13.731654.0%2.8%(+1.18)#764.4%(-0.408)#10,164
14.731183.9%2.8%(+1.06)#834.4%(-0.524)#10,546
15.731123.7%2.8%(+0.872)#884.4%(-0.716)#11,185
16.731023.5%2.8%(+0.636)#984.4%(-0.953)#11,991
17.731043.5%2.8%(+0.634)#1004.4%(-0.954)#11,995
18.731153.4%2.8%(+0.545)#1054.4%(-1.04)#12,286
19.731323.1%2.8%(+0.326)#1154.4%(-1.26)#13,067
20.731703.1%2.8%(+0.284)#1174.4%(-1.31)#13,196
21.731272.8%2.8%(-0.051)#1274.4%(-1.64)#14,370
22.731102.6%2.8%(-0.212)#1404.4%(-1.80)#14,929
23.731342.5%2.8%(-0.303)#1474.4%(-1.89)#15,240
24.731392.3%2.8%(-0.520)#1664.4%(-2.11)#16,042
25.731302.2%2.8%(-0.636)#1804.4%(-2.22)#16,455
26.731352.1%2.8%(-0.705)#1874.4%(-2.29)#16,679
27.731502.0%2.8%(-0.840)#2014.4%(-2.43)#17,153
28.731512.0%2.8%(-0.858)#2054.4%(-2.45)#17,205
29.731221.9%2.8%(-0.951)#2084.4%(-2.54)#17,499
30.731731.8%2.8%(-1.01)#2144.4%(-2.60)#17,677
31.731051.7%2.8%(-1.07)#2174.4%(-2.66)#17,864
32.731081.7%2.8%(-1.11)#2214.4%(-2.70)#17,998
33.731211.6%2.8%(-1.24)#2314.4%(-2.83)#18,397
34.731091.4%2.8%(-1.45)#2494.4%(-3.04)#19,080
35.731281.4%2.8%(-1.47)#2514.4%(-3.06)#19,113
36.731791.3%2.8%(-1.48)#2544.4%(-3.07)#19,158
37.731691.3%2.8%(-1.55)#2634.4%(-3.14)#19,379
38.731311.1%2.8%(-1.67)#2804.4%(-3.26)#19,731
39.731421.1%2.8%(-1.67)#2814.4%(-3.26)#19,732

Common Questions

What are the Top 10 Zip Codes with the Highest Percentage of Population with a Degree in Literature and Languages in Oklahoma City, OK?
Top 10 Zip Codes with the Highest Percentage of Population with a Degree in Literature and Languages in Oklahoma City, OK are:
#1
14.6%
#2
10.1%
#3
9.4%
#4
7.0%
#5
6.6%
#6
6.1%
#7
5.5%
#8
5.3%
#9
4.4%
#10
4.3%
What zip code has the Highest Percentage of Population with a Degree in Literature and Languages in Oklahoma City, OK?
73145 has the Highest Percentage of Population with a Degree in Literature and Languages in Oklahoma City, OK with 14.6%.
What is the Percentage of Population with a Degree in Literature and Languages in Oklahoma City, OK?
Percentage of Population with a Degree in Literature and Languages in Oklahoma City is 3.3%.
What is the Percentage of Population with a Degree in Literature and Languages in Oklahoma?
Percentage of Population with a Degree in Literature and Languages in Oklahoma is 2.8%.
What is the Percentage of Population with a Degree in Literature and Languages in the United States?
Percentage of Population with a Degree in Literature and Languages in the United States is 4.4%.