Zip Codes with the Highest Percentage of Population Employed in Farming, Fishing & Forestry in Claremore, OK
RELATED REPORTS & OPTIONS
Farming, Fishing & Forestry
Claremore
Compare Zip Codes
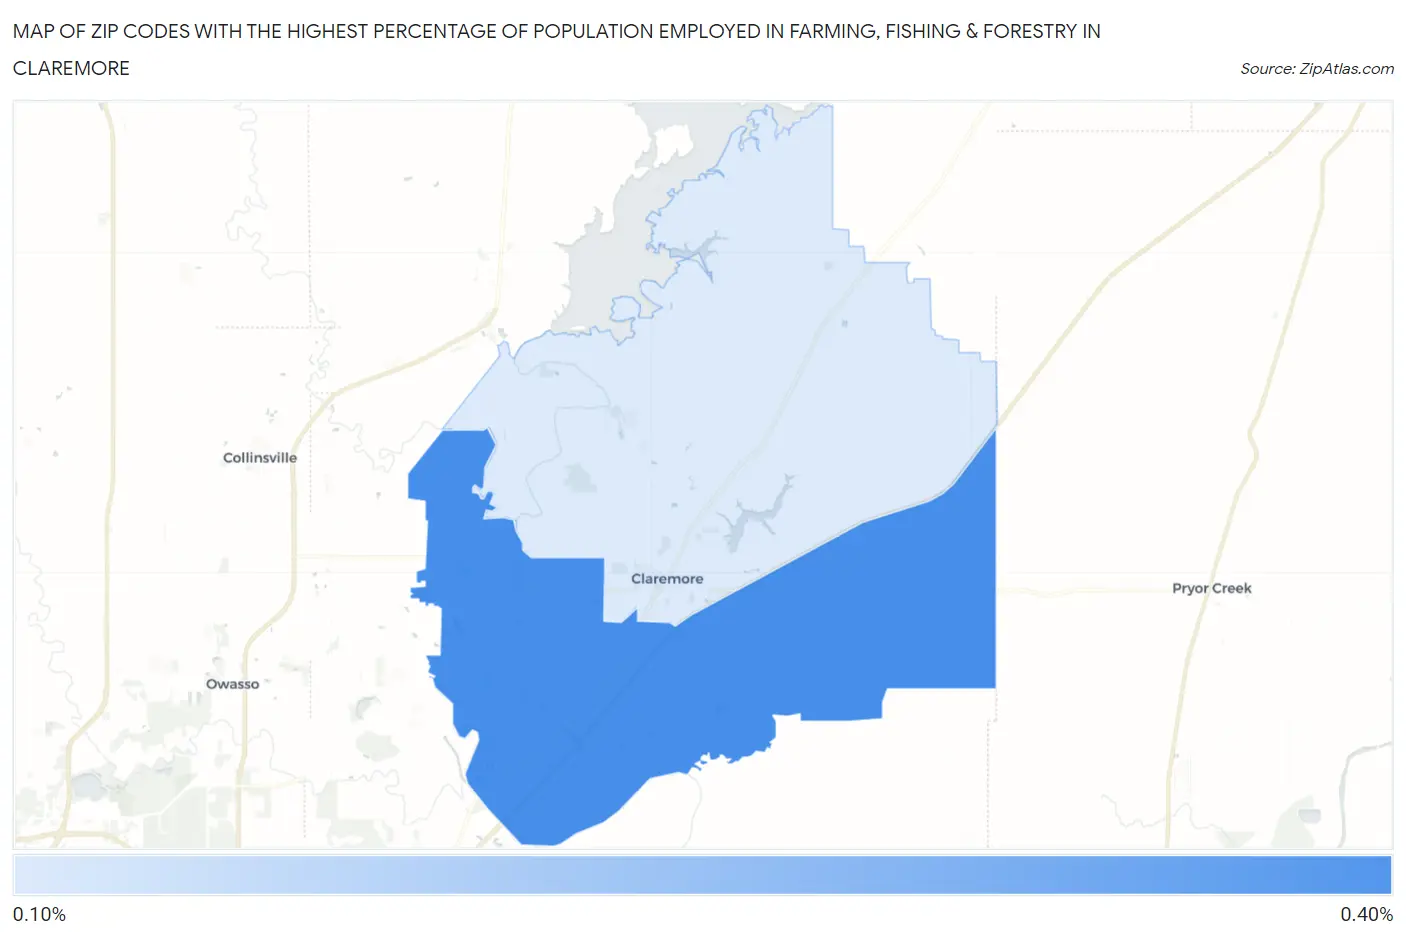
Map of Zip Codes with the Highest Percentage of Population Employed in Farming, Fishing & Forestry in Claremore
0.20%
0.39%
Zip Codes with the Highest Percentage of Population Employed in Farming, Fishing & Forestry in Claremore, OK
| Zip Code | % Employed | vs State | vs National | |
| 1. | 74019 | 0.39% | 0.66%(-0.275)#383 | 0.61%(-0.216)#13,855 |
| 2. | 74017 | 0.20% | 0.66%(-0.466)#430 | 0.61%(-0.407)#16,153 |
1
Common Questions
What are the Top Zip Codes with the Highest Percentage of Population Employed in Farming, Fishing & Forestry in Claremore, OK?
Top Zip Codes with the Highest Percentage of Population Employed in Farming, Fishing & Forestry in Claremore, OK are:
What zip code has the Highest Percentage of Population Employed in Farming, Fishing & Forestry in Claremore, OK?
74019 has the Highest Percentage of Population Employed in Farming, Fishing & Forestry in Claremore, OK with 0.39%.
What is the Percentage of Population Employed in Farming, Fishing & Forestry in Claremore, OK?
Percentage of Population Employed in Farming, Fishing & Forestry in Claremore is 0.12%.
What is the Percentage of Population Employed in Farming, Fishing & Forestry in Oklahoma?
Percentage of Population Employed in Farming, Fishing & Forestry in Oklahoma is 0.66%.
What is the Percentage of Population Employed in Farming, Fishing & Forestry in the United States?
Percentage of Population Employed in Farming, Fishing & Forestry in the United States is 0.61%.