Zip Codes with the Highest Percentage of Population Employed in Agriculture, Fishing & Hunting in Shawnee, OK
RELATED REPORTS & OPTIONS
Agriculture, Fishing & Hunting
Shawnee
Compare Zip Codes
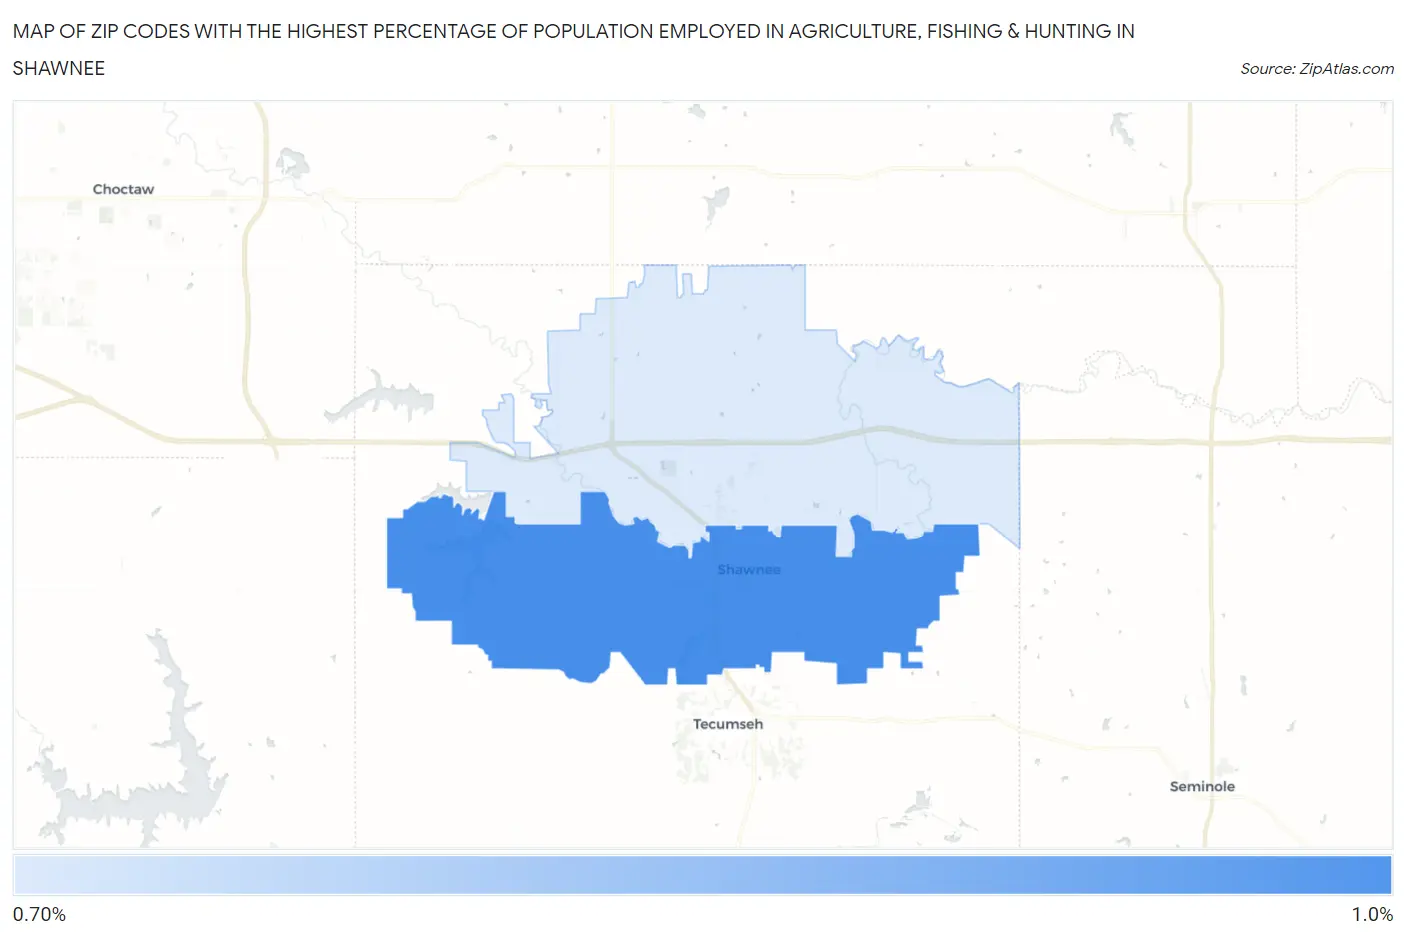
Map of Zip Codes with the Highest Percentage of Population Employed in Agriculture, Fishing & Hunting in Shawnee
0.80%
0.94%
Zip Codes with the Highest Percentage of Population Employed in Agriculture, Fishing & Hunting in Shawnee, OK
| Zip Code | % Employed | vs State | vs National | |
| 1. | 74801 | 0.94% | 1.6%(-0.618)#454 | 1.2%(-0.255)#16,477 |
| 2. | 74804 | 0.80% | 1.6%(-0.763)#473 | 1.2%(-0.401)#17,249 |
1
Common Questions
What are the Top Zip Codes with the Highest Percentage of Population Employed in Agriculture, Fishing & Hunting in Shawnee, OK?
Top Zip Codes with the Highest Percentage of Population Employed in Agriculture, Fishing & Hunting in Shawnee, OK are:
What zip code has the Highest Percentage of Population Employed in Agriculture, Fishing & Hunting in Shawnee, OK?
74801 has the Highest Percentage of Population Employed in Agriculture, Fishing & Hunting in Shawnee, OK with 0.94%.
What is the Percentage of Population Employed in Agriculture, Fishing & Hunting in Shawnee, OK?
Percentage of Population Employed in Agriculture, Fishing & Hunting in Shawnee is 0.56%.
What is the Percentage of Population Employed in Agriculture, Fishing & Hunting in Oklahoma?
Percentage of Population Employed in Agriculture, Fishing & Hunting in Oklahoma is 1.6%.
What is the Percentage of Population Employed in Agriculture, Fishing & Hunting in the United States?
Percentage of Population Employed in Agriculture, Fishing & Hunting in the United States is 1.2%.