Zip Codes with the Highest Percentage of Population Employed in Agriculture, Fishing & Hunting in Edmond, OK
RELATED REPORTS & OPTIONS
Agriculture, Fishing & Hunting
Edmond
Compare Zip Codes
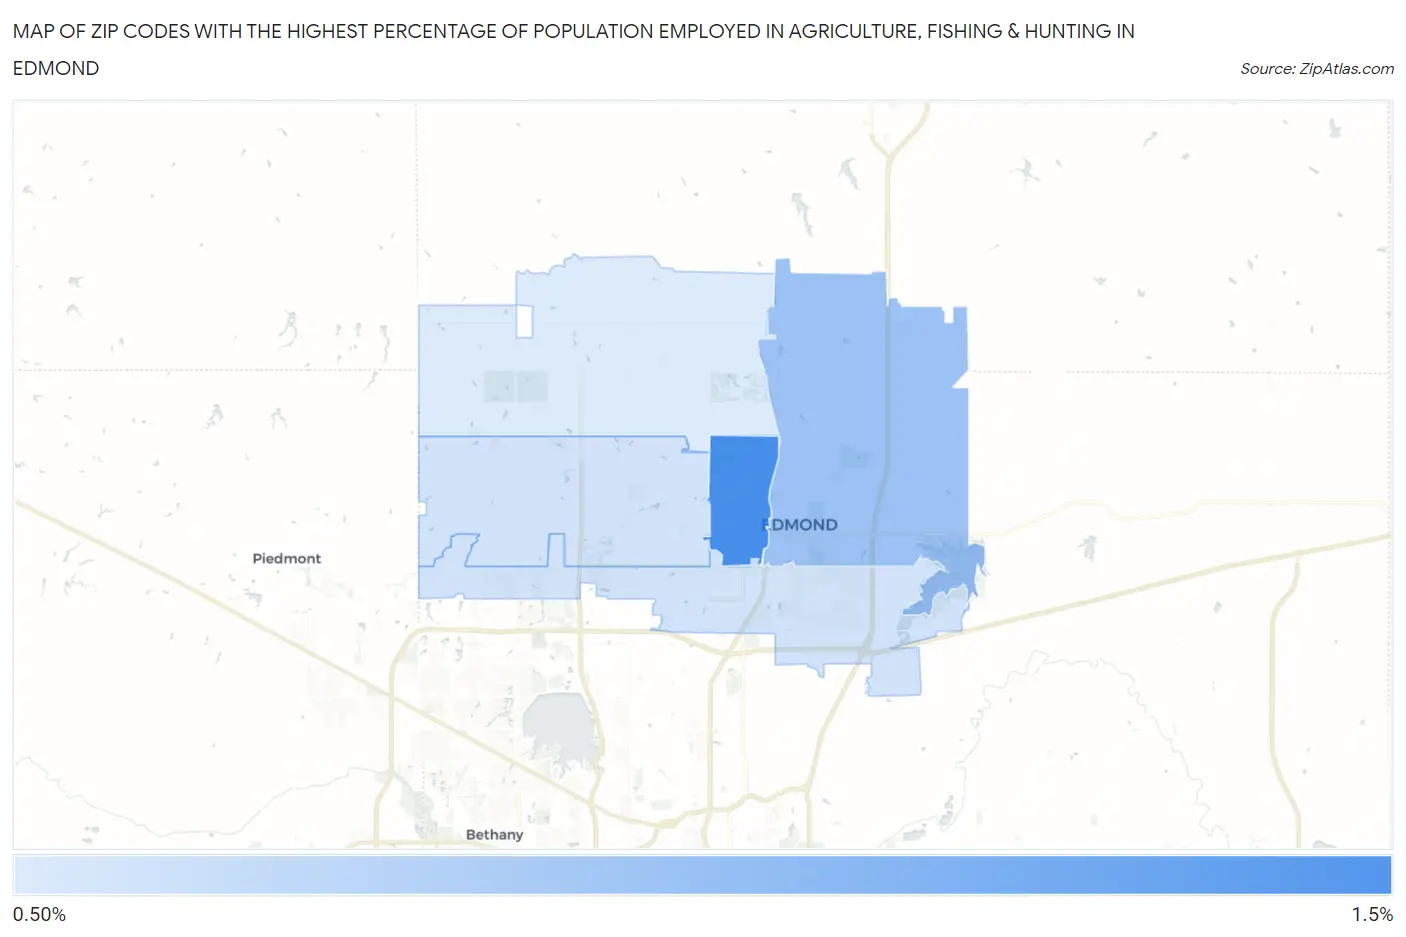
Map of Zip Codes with the Highest Percentage of Population Employed in Agriculture, Fishing & Hunting in Edmond
0.51%
1.0%
Zip Codes with the Highest Percentage of Population Employed in Agriculture, Fishing & Hunting in Edmond, OK
| Zip Code | % Employed | vs State | vs National | |
| 1. | 73003 | 1.0% | 1.6%(-0.556)#445 | 1.2%(-0.193)#16,192 |
| 2. | 73034 | 0.73% | 1.6%(-0.836)#478 | 1.2%(-0.474)#17,702 |
| 3. | 73012 | 0.55% | 1.6%(-1.01)#503 | 1.2%(-0.649)#18,841 |
| 4. | 73013 | 0.55% | 1.6%(-1.01)#505 | 1.2%(-0.651)#18,867 |
| 5. | 73025 | 0.51% | 1.6%(-1.05)#511 | 1.2%(-0.687)#19,167 |
1
Common Questions
What are the Top 3 Zip Codes with the Highest Percentage of Population Employed in Agriculture, Fishing & Hunting in Edmond, OK?
Top 3 Zip Codes with the Highest Percentage of Population Employed in Agriculture, Fishing & Hunting in Edmond, OK are:
What zip code has the Highest Percentage of Population Employed in Agriculture, Fishing & Hunting in Edmond, OK?
73003 has the Highest Percentage of Population Employed in Agriculture, Fishing & Hunting in Edmond, OK with 1.0%.
What is the Percentage of Population Employed in Agriculture, Fishing & Hunting in Edmond, OK?
Percentage of Population Employed in Agriculture, Fishing & Hunting in Edmond is 0.59%.
What is the Percentage of Population Employed in Agriculture, Fishing & Hunting in Oklahoma?
Percentage of Population Employed in Agriculture, Fishing & Hunting in Oklahoma is 1.6%.
What is the Percentage of Population Employed in Agriculture, Fishing & Hunting in the United States?
Percentage of Population Employed in Agriculture, Fishing & Hunting in the United States is 1.2%.