Zip Codes with the Highest Percentage of Population Employed in Agriculture, Fishing & Hunting in Claremore, OK
RELATED REPORTS & OPTIONS
Agriculture, Fishing & Hunting
Claremore
Compare Zip Codes
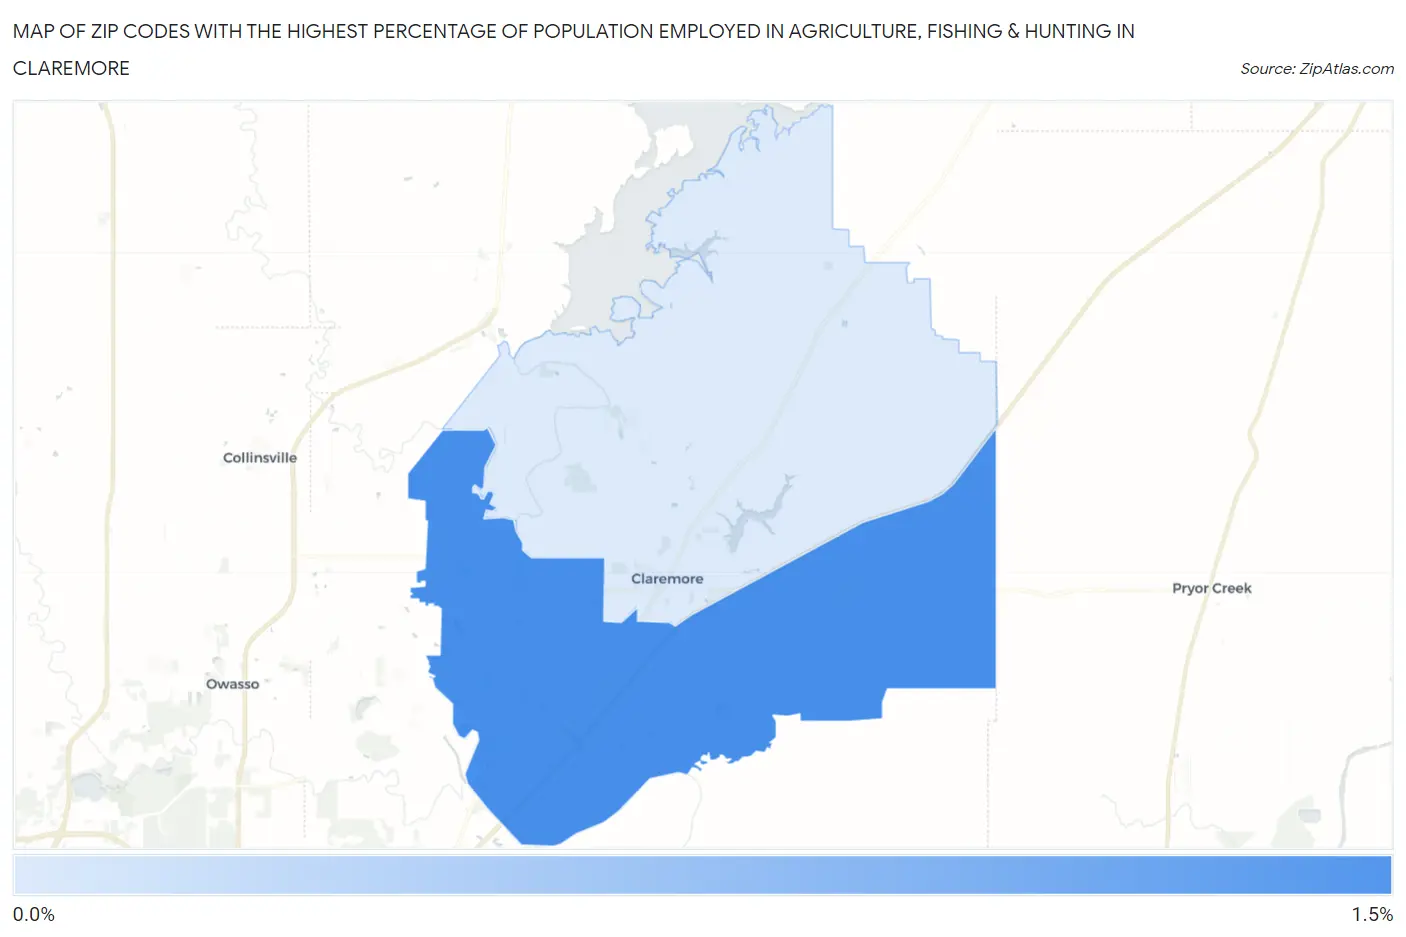
Map of Zip Codes with the Highest Percentage of Population Employed in Agriculture, Fishing & Hunting in Claremore
0.46%
1.4%
Zip Codes with the Highest Percentage of Population Employed in Agriculture, Fishing & Hunting in Claremore, OK
| Zip Code | % Employed | vs State | vs National | |
| 1. | 74019 | 1.4% | 1.6%(-0.207)#420 | 1.2%(+0.155)#14,809 |
| 2. | 74017 | 0.46% | 1.6%(-1.10)#518 | 1.2%(-0.736)#19,585 |
1
Common Questions
What are the Top Zip Codes with the Highest Percentage of Population Employed in Agriculture, Fishing & Hunting in Claremore, OK?
Top Zip Codes with the Highest Percentage of Population Employed in Agriculture, Fishing & Hunting in Claremore, OK are:
What zip code has the Highest Percentage of Population Employed in Agriculture, Fishing & Hunting in Claremore, OK?
74019 has the Highest Percentage of Population Employed in Agriculture, Fishing & Hunting in Claremore, OK with 1.4%.
What is the Percentage of Population Employed in Agriculture, Fishing & Hunting in Claremore, OK?
Percentage of Population Employed in Agriculture, Fishing & Hunting in Claremore is 0.45%.
What is the Percentage of Population Employed in Agriculture, Fishing & Hunting in Oklahoma?
Percentage of Population Employed in Agriculture, Fishing & Hunting in Oklahoma is 1.6%.
What is the Percentage of Population Employed in Agriculture, Fishing & Hunting in the United States?
Percentage of Population Employed in Agriculture, Fishing & Hunting in the United States is 1.2%.