Zip Codes with the Highest Percentage of Population Employed in Agriculture, Fishing & Hunting in Stillwater, OK
RELATED REPORTS & OPTIONS
Agriculture, Fishing & Hunting
Stillwater
Compare Zip Codes
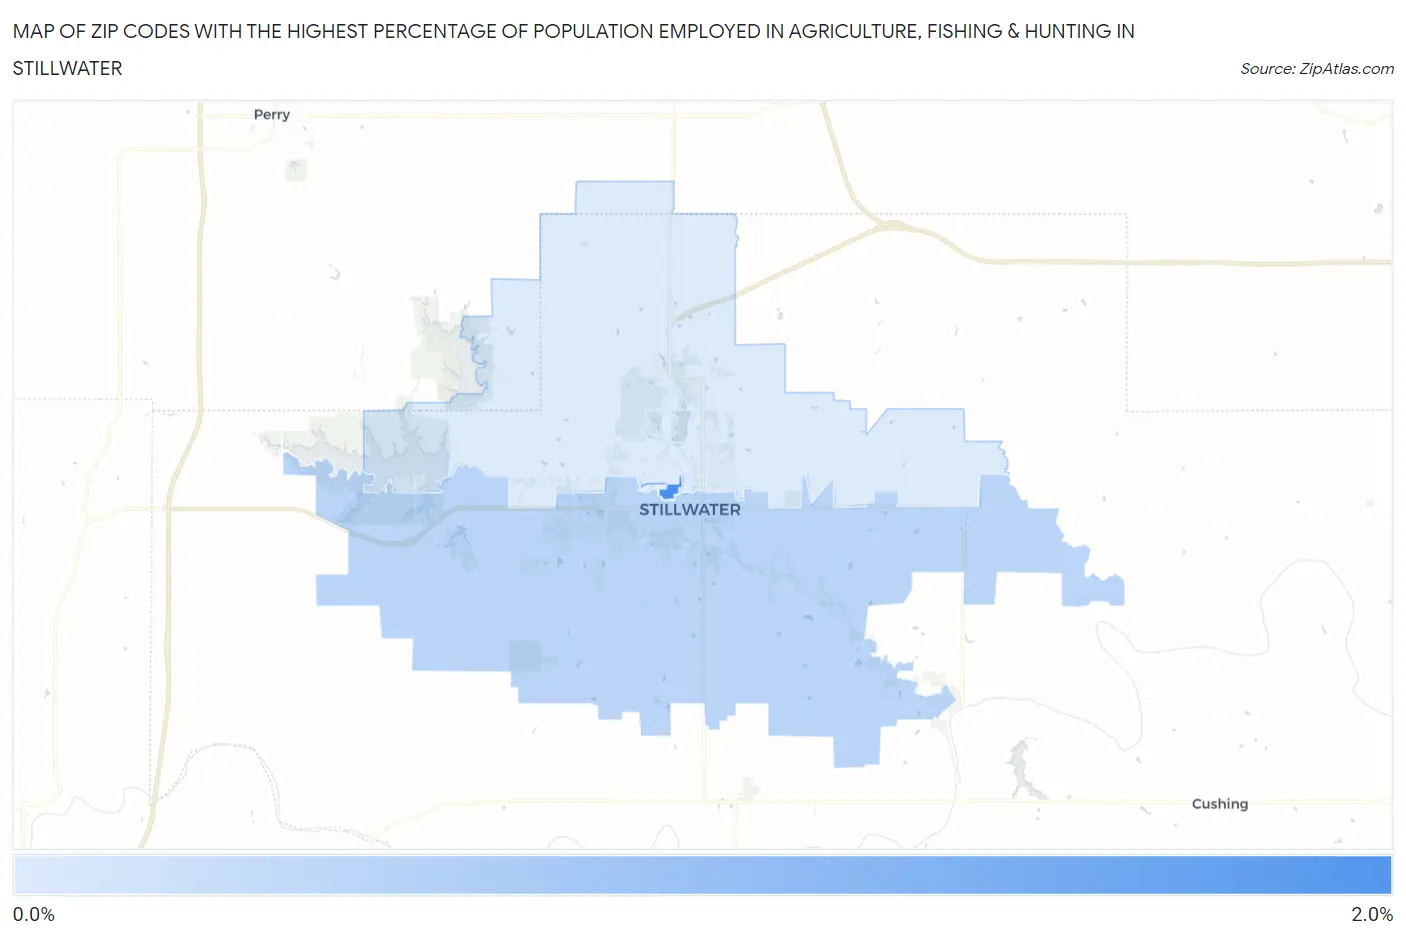
Map of Zip Codes with the Highest Percentage of Population Employed in Agriculture, Fishing & Hunting in Stillwater
0.76%
1.7%
Zip Codes with the Highest Percentage of Population Employed in Agriculture, Fishing & Hunting in Stillwater, OK
| Zip Code | % Employed | vs State | vs National | |
| 1. | 74077 | 1.7% | 1.6%(+0.138)#390 | 1.2%(+0.500)#13,649 |
| 2. | 74074 | 0.97% | 1.6%(-0.594)#452 | 1.2%(-0.231)#16,364 |
| 3. | 74075 | 0.76% | 1.6%(-0.803)#476 | 1.2%(-0.440)#17,479 |
1
Common Questions
What are the Top 3 Zip Codes with the Highest Percentage of Population Employed in Agriculture, Fishing & Hunting in Stillwater, OK?
Top 3 Zip Codes with the Highest Percentage of Population Employed in Agriculture, Fishing & Hunting in Stillwater, OK are:
What zip code has the Highest Percentage of Population Employed in Agriculture, Fishing & Hunting in Stillwater, OK?
74077 has the Highest Percentage of Population Employed in Agriculture, Fishing & Hunting in Stillwater, OK with 1.7%.
What is the Percentage of Population Employed in Agriculture, Fishing & Hunting in Stillwater, OK?
Percentage of Population Employed in Agriculture, Fishing & Hunting in Stillwater is 0.86%.
What is the Percentage of Population Employed in Agriculture, Fishing & Hunting in Oklahoma?
Percentage of Population Employed in Agriculture, Fishing & Hunting in Oklahoma is 1.6%.
What is the Percentage of Population Employed in Agriculture, Fishing & Hunting in the United States?
Percentage of Population Employed in Agriculture, Fishing & Hunting in the United States is 1.2%.