Zip Codes with the Lowest Percentage of Owner-Occupied Units in Oklahoma City, OK

RELATED REPORTS & OPTIONS

Lowest Owner-Occupied
Population
Families and Households
Female Fertility
Female Fertility (Unmarried)
Race (Community Size)
Race (Percentage)
Ancestry (Community Size)
AfricanAlaska NativeAlbanianAmericanApacheArabArapahoArgentineanArmenianAustralianAustrianBahamianBangladeshiBarbadianBasqueBelgianBhutaneseBlackfeetBolivianBrazilianBritishBritish West IndianBulgarianBurmeseCajunCambodianCanadianCelticCentral AmericanCentral American IndianCherokeeCheyenneChickasawChileanChippewaChoctawColombianComancheCreeCreekCroatianCubanCzechCzechoslovakianDanishDelawareDominicanDutchDutch West IndianEastern EuropeanEcuadorianEgyptianEnglishEstonianEthiopianEuropeanFijianFilipinoFinnishFrenchFrench American IndianFrench CanadianGermanGerman RussianGhanaianGreekGuamanian / ChamorroGuatemalanGuyaneseHaitianHonduranHopiHungarianIcelanderIndian (Asian)IndonesianInupiatIranianIraqiIrishIroquoisIsraeliItalianJamaicanJapaneseJordanianKenyanKiowaKoreanLaotianLatvianLebaneseLiberianLithuanianLuxembourgerMalaysianMexicanMexican American IndianMongolianMoroccanNative HawaiianNavajoNew ZealanderNicaraguanNigerianNorthern EuropeanNorwegianOkinawanOsagePakistaniPalestinianPanamanianPennsylvania GermanPeruvianPimaPolishPortuguesePotawatomiPuebloPuerto RicanRomanianRussianSalvadoranSamoanScandinavianScotch-IrishScottishSeminoleSerbianSiouxSlavicSlovakSloveneSouth AfricanSouth AmericanSouth American IndianSpaniardSpanishSpanish American IndianSri LankanSubsaharan AfricanSudaneseSwedishSwissSyrianThaiTlingit-HaidaTonganTrinidadian and TobagonianTurkishU.S. Virgin IslanderUkrainianUruguayanVenezuelanVietnameseWelshWest IndianYugoslavianZimbabwean
Ancestry (Percentage)
AfricanAlaska NativeAlbanianAmericanApacheArabArapahoArgentineanArmenianAustralianAustrianBahamianBangladeshiBarbadianBasqueBelgianBhutaneseBlackfeetBolivianBrazilianBritishBritish West IndianBulgarianBurmeseCajunCambodianCanadianCelticCentral AmericanCentral American IndianCherokeeCheyenneChickasawChileanChippewaChoctawColombianComancheCreeCreekCroatianCubanCzechCzechoslovakianDanishDelawareDominicanDutchDutch West IndianEastern EuropeanEcuadorianEgyptianEnglishEstonianEthiopianEuropeanFijianFilipinoFinnishFrenchFrench American IndianFrench CanadianGermanGerman RussianGhanaianGreekGuamanian / ChamorroGuatemalanGuyaneseHaitianHonduranHopiHungarianIcelanderIndian (Asian)IndonesianInupiatIranianIraqiIrishIroquoisIsraeliItalianJamaicanJapaneseJordanianKenyanKiowaKoreanLaotianLatvianLebaneseLiberianLithuanianLuxembourgerMalaysianMexicanMexican American IndianMongolianMoroccanNative HawaiianNavajoNew ZealanderNicaraguanNigerianNorthern EuropeanNorwegianOkinawanOsagePakistaniPalestinianPanamanianPennsylvania GermanPeruvianPimaPolishPortuguesePotawatomiPuebloPuerto RicanRomanianRussianSalvadoranSamoanScandinavianScotch-IrishScottishSeminoleSerbianSiouxSlavicSlovakSloveneSouth AfricanSouth AmericanSouth American IndianSpaniardSpanishSpanish American IndianSri LankanSubsaharan AfricanSudaneseSwedishSwissSyrianThaiTlingit-HaidaTonganTrinidadian and TobagonianTurkishU.S. Virgin IslanderUkrainianUruguayanVenezuelanVietnameseWelshWest IndianYugoslavianZimbabwean
Immigrant Origin (Total)
AfricaArgentinaAsiaAustraliaAustriaBahamasBangladeshBosnia and HerzegovinaBrazilBulgariaBurma / MyanmarCambodiaCameroonCanadaCaribbeanCentral AmericaChileChinaColombiaCubaDominican RepublicEastern AfricaEastern AsiaEastern EuropeEcuadorEgyptEl SalvadorEnglandEritreaEthiopiaEuropeFranceGermanyGhanaGreeceGuatemalaHondurasHong KongIndiaIndonesiaIranIraqIrelandItalyJamaicaJapanJordanKazakhstanKenyaKoreaKuwaitLaosLatin AmericaLebanonLiberiaMalaysiaMexicoMiddle AfricaMoroccoNepalNetherlandsNicaraguaNigeriaNorthern AfricaNorthern EuropeNorwayOceaniaPakistanPanamaPeruPhilippinesPolandPortugalRussiaSaudi ArabiaScotlandSingaporeSouth AfricaSouth AmericaSouth Central AsiaSouth Eastern AsiaSouthern EuropeSpainSudanSyriaTaiwanThailandTrinidad and TobagoTurkeyUkraineVenezuelaVietnamWestern AfricaWestern AsiaWestern EuropeZaireZimbabwe
Immigrant Origin (Percentage)
AfricaArgentinaAsiaAustraliaAustriaBahamasBangladeshBosnia and HerzegovinaBrazilBulgariaBurma / MyanmarCambodiaCameroonCanadaCaribbeanCentral AmericaChileChinaColombiaCubaDominican RepublicEastern AfricaEastern AsiaEastern EuropeEcuadorEgyptEl SalvadorEnglandEritreaEthiopiaEuropeFranceGermanyGhanaGreeceGuatemalaHondurasHong KongIndiaIndonesiaIranIraqIrelandItalyJamaicaJapanJordanKazakhstanKenyaKoreaKuwaitLaosLatin AmericaLebanonLiberiaMalaysiaMexicoMiddle AfricaMoroccoNepalNetherlandsNicaraguaNigeriaNorthern AfricaNorthern EuropeNorwayOceaniaPakistanPanamaPeruPhilippinesPolandPortugalRussiaSaudi ArabiaScotlandSingaporeSouth AfricaSouth AmericaSouth Central AsiaSouth Eastern AsiaSouthern EuropeSpainSudanSyriaTaiwanThailandTrinidad and TobagoTurkeyUkraineVenezuelaVietnamWestern AfricaWestern AsiaWestern EuropeZaireZimbabwe
Income
Income (Families)
Income (Households)
Poverty
Poverty (Families)
Unemployment
Employment Occupations
Employment Industries
Employer Class
Commute Time
Commute Means
School Enrollment
Education by Degree Field
Occupancy
Finances
Physical Characteristics
Oklahoma City
Compare Zip Codes
Comparison Subject

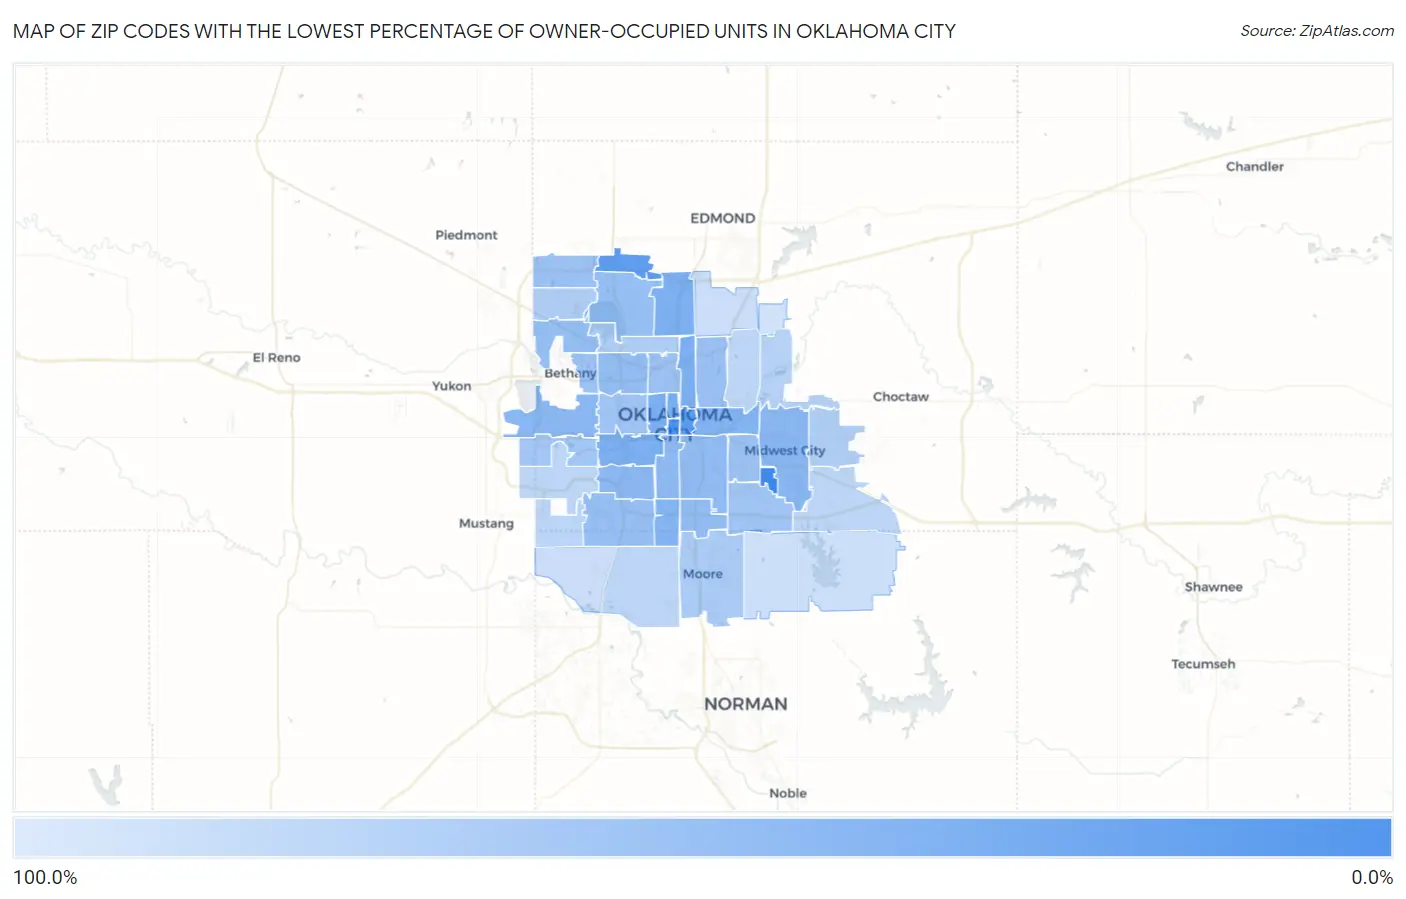
Map of Zip Codes with the Lowest Percentage of Owner-Occupied Units in Oklahoma City

100.0%
0.0%
Zip Codes with the Lowest Percentage of Owner-Occupied Units in Oklahoma City Map

Zip Codes with the Lowest Percentage of Owner-Occupied Units in Oklahoma City, OK

Zip Code % Owner-Occupied vs State vs National
1.731451.3%65.9%(-64.6)#264.8%(-63.5)#37
2.731028.3%65.9%(-57.7)#364.8%(-56.6)#134
3.7310417.0%65.9%(-49.0)#464.8%(-47.8)#305
4.7313418.5%65.9%(-47.5)#564.8%(-46.4)#334
5.7310333.2%65.9%(-32.8)#964.8%(-31.6)#947
6.7310836.5%65.9%(-29.5)#1364.8%(-28.3)#1,211
7.7310636.6%65.9%(-29.4)#1464.8%(-28.2)#1,220
8.7310537.4%65.9%(-28.5)#1764.8%(-27.4)#1,285
9.7311437.6%65.9%(-28.4)#1864.8%(-27.3)#1,300
10.7311740.4%65.9%(-25.5)#2064.8%(-24.4)#1,550
11.7313942.4%65.9%(-23.6)#2264.8%(-22.4)#1,738
12.7311044.0%65.9%(-22.0)#2564.8%(-20.8)#1,908
13.7312744.4%65.9%(-21.5)#2664.8%(-20.4)#1,954
14.7311946.3%65.9%(-19.6)#3164.8%(-18.5)#2,217
15.7310948.4%65.9%(-17.5)#3864.8%(-16.4)#2,539
16.7312948.7%65.9%(-17.2)#3964.8%(-16.1)#2,584
17.7314951.0%65.9%(-14.9)#4164.8%(-13.8)#2,978
18.7311251.5%65.9%(-14.4)#4464.8%(-13.3)#3,064
19.7312052.1%65.9%(-13.8)#4764.8%(-12.7)#3,169
20.7313252.8%65.9%(-13.2)#4964.8%(-12.1)#3,297
21.7315954.6%65.9%(-11.3)#5564.8%(-10.2)#3,676
22.7311155.2%65.9%(-10.8)#5964.8%(-9.66)#3,800
23.7314256.7%65.9%(-9.24)#6764.8%(-8.12)#4,198
24.7311857.0%65.9%(-8.97)#6964.8%(-7.85)#4,269
25.7312257.4%65.9%(-8.53)#7064.8%(-7.41)#4,395
26.7311557.8%65.9%(-8.10)#7464.8%(-6.98)#4,498
27.7313560.1%65.9%(-5.81)#8864.8%(-4.69)#5,148
28.7310761.3%65.9%(-4.65)#9464.8%(-3.53)#5,519
29.7312862.4%65.9%(-3.58)#10264.8%(-2.45)#5,925
30.7316066.6%65.9%(+0.618)#13364.8%(+1.74)#7,791
31.7311671.8%65.9%(+5.90)#20964.8%(+7.02)#10,988
32.7313072.3%65.9%(+6.39)#21564.8%(+7.52)#11,323
33.7316272.5%65.9%(+6.53)#21764.8%(+7.65)#11,414
34.7314176.2%65.9%(+10.3)#30964.8%(+11.4)#14,443
35.7316979.8%65.9%(+13.9)#38564.8%(+15.0)#17,719
36.7312181.2%65.9%(+15.3)#42264.8%(+16.4)#19,070
37.7317081.2%65.9%(+15.3)#42464.8%(+16.4)#19,112
38.7315082.8%65.9%(+16.9)#46764.8%(+18.0)#20,712
39.7317984.9%65.9%(+19.0)#50564.8%(+20.1)#22,734
40.7317393.2%65.9%(+27.3)#61664.8%(+28.4)#28,998
41.7313194.5%65.9%(+28.6)#62764.8%(+29.7)#29,590
42.7316594.9%65.9%(+29.0)#62964.8%(+30.1)#29,745
43.73151100.0%65.9%(+34.1)#63464.8%(+35.2)#30,809

Common Questions

What are the Top 10 Zip Codes with the Lowest Percentage of Owner-Occupied Units in Oklahoma City, OK?
Top 10 Zip Codes with the Lowest Percentage of Owner-Occupied Units in Oklahoma City, OK are:
#1
1.3%
#2
8.3%
#3
17.0%
#4
18.5%
#5
33.2%
#6
36.5%
#7
36.6%
#8
37.4%
#9
37.6%
#10
40.4%
What zip code has the Lowest Percentage of Owner-Occupied Units in Oklahoma City, OK?
73145 has the Lowest Percentage of Owner-Occupied Units in Oklahoma City, OK with 1.3%.
What is the Percentage of Owner-Occupied Units in Oklahoma City, OK?
Percentage of Owner-Occupied Units in Oklahoma City is 59.5%.
What is the Percentage of Owner-Occupied Units in Oklahoma?
Percentage of Owner-Occupied Units in Oklahoma is 65.9%.
What is the Percentage of Owner-Occupied Units in the United States?
Percentage of Owner-Occupied Units in the United States is 64.8%.