Zip Codes with the Highest Percentage of Population Employed in Accommodation & Food Services in Rio Rancho, NM
RELATED REPORTS & OPTIONS
Accommodation & Food Services
Rio Rancho
Compare Zip Codes
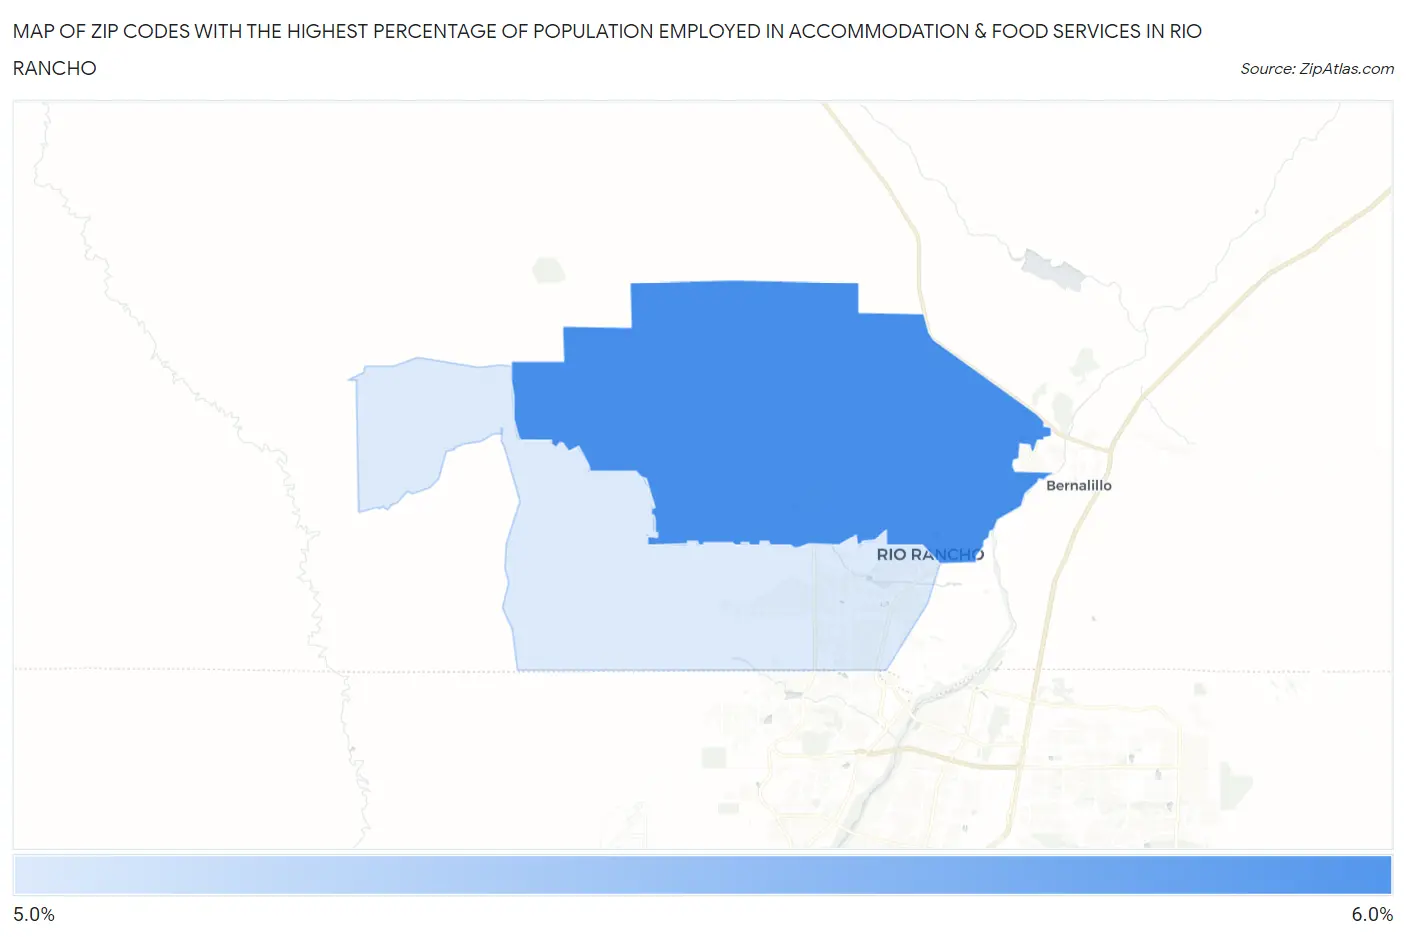
Map of Zip Codes with the Highest Percentage of Population Employed in Accommodation & Food Services in Rio Rancho
5.5%
5.5%
Zip Codes with the Highest Percentage of Population Employed in Accommodation & Food Services in Rio Rancho, NM
| Zip Code | % Employed | vs State | vs National | |
| 1. | 87144 | 5.5% | 7.9%(-2.38)#155 | 6.9%(-1.33)#14,897 |
| 2. | 87124 | 5.5% | 7.9%(-2.43)#159 | 6.9%(-1.37)#15,027 |
1
Common Questions
What are the Top Zip Codes with the Highest Percentage of Population Employed in Accommodation & Food Services in Rio Rancho, NM?
Top Zip Codes with the Highest Percentage of Population Employed in Accommodation & Food Services in Rio Rancho, NM are:
What zip code has the Highest Percentage of Population Employed in Accommodation & Food Services in Rio Rancho, NM?
87144 has the Highest Percentage of Population Employed in Accommodation & Food Services in Rio Rancho, NM with 5.5%.
What is the Percentage of Population Employed in Accommodation & Food Services in Rio Rancho, NM?
Percentage of Population Employed in Accommodation & Food Services in Rio Rancho is 5.5%.
What is the Percentage of Population Employed in Accommodation & Food Services in New Mexico?
Percentage of Population Employed in Accommodation & Food Services in New Mexico is 7.9%.
What is the Percentage of Population Employed in Accommodation & Food Services in the United States?
Percentage of Population Employed in Accommodation & Food Services in the United States is 6.9%.