Zip Codes with the Highest Percentage of Population Employed in Accommodation & Food Services in Hobbs, NM
RELATED REPORTS & OPTIONS
Accommodation & Food Services
Hobbs
Compare Zip Codes
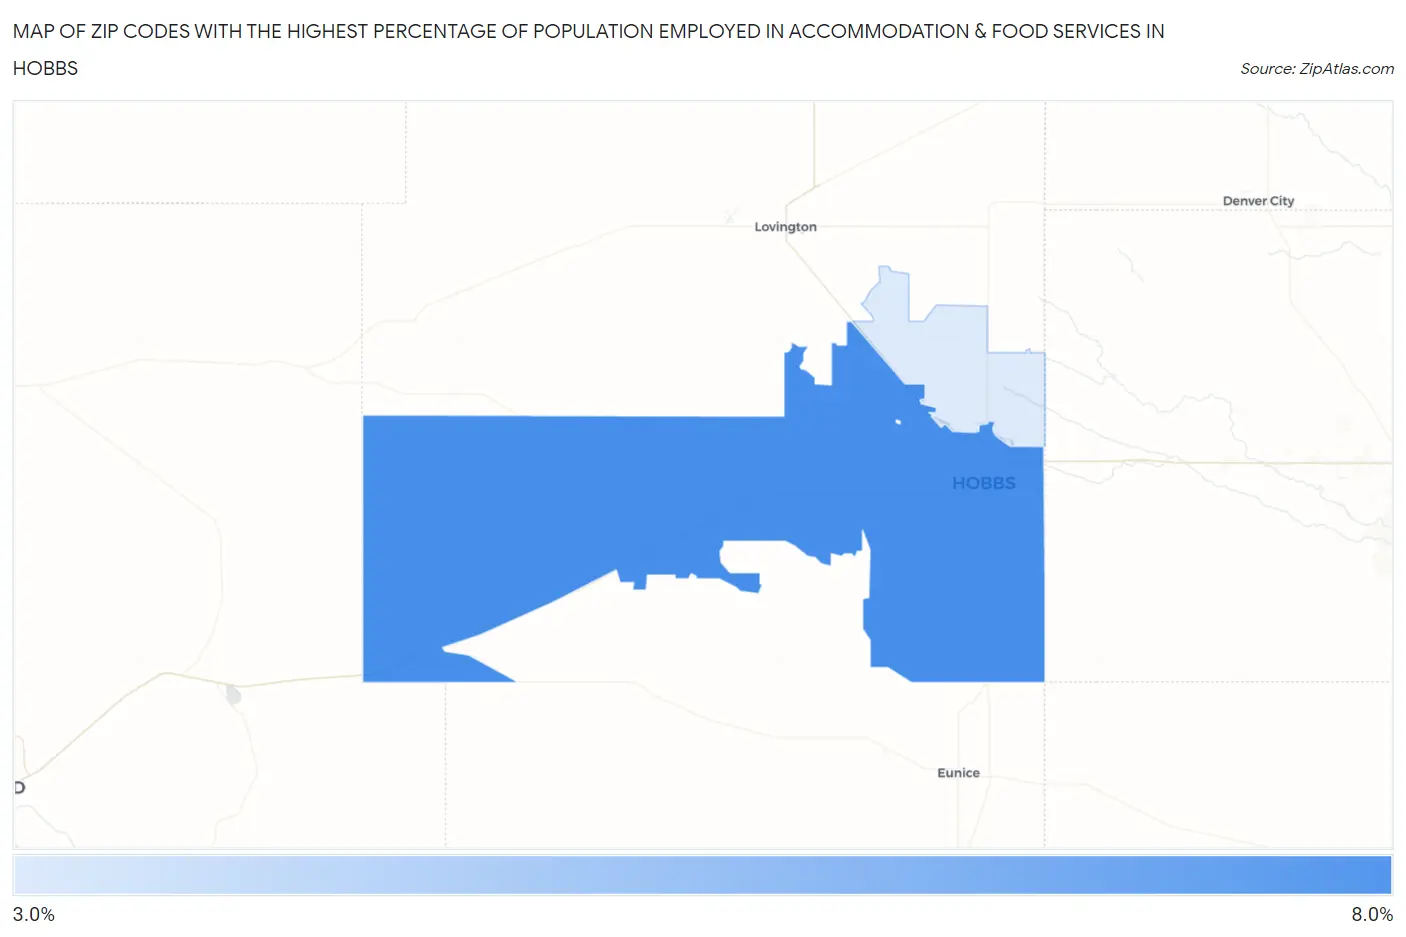
Map of Zip Codes with the Highest Percentage of Population Employed in Accommodation & Food Services in Hobbs
3.8%
7.4%
Zip Codes with the Highest Percentage of Population Employed in Accommodation & Food Services in Hobbs, NM
| Zip Code | % Employed | vs State | vs National | |
| 1. | 88240 | 7.4% | 7.9%(-0.499)#116 | 6.9%(+0.554)#9,154 |
| 2. | 88242 | 3.8% | 7.9%(-4.18)#181 | 6.9%(-3.13)#20,944 |
1
Common Questions
What are the Top Zip Codes with the Highest Percentage of Population Employed in Accommodation & Food Services in Hobbs, NM?
Top Zip Codes with the Highest Percentage of Population Employed in Accommodation & Food Services in Hobbs, NM are:
What zip code has the Highest Percentage of Population Employed in Accommodation & Food Services in Hobbs, NM?
88240 has the Highest Percentage of Population Employed in Accommodation & Food Services in Hobbs, NM with 7.4%.
What is the Percentage of Population Employed in Accommodation & Food Services in Hobbs, NM?
Percentage of Population Employed in Accommodation & Food Services in Hobbs is 6.8%.
What is the Percentage of Population Employed in Accommodation & Food Services in New Mexico?
Percentage of Population Employed in Accommodation & Food Services in New Mexico is 7.9%.
What is the Percentage of Population Employed in Accommodation & Food Services in the United States?
Percentage of Population Employed in Accommodation & Food Services in the United States is 6.9%.