Zip Codes with the Highest Percentage of Population Employed in Accommodation & Food Services in Santa Fe, NM
RELATED REPORTS & OPTIONS
Accommodation & Food Services
Santa Fe
Compare Zip Codes
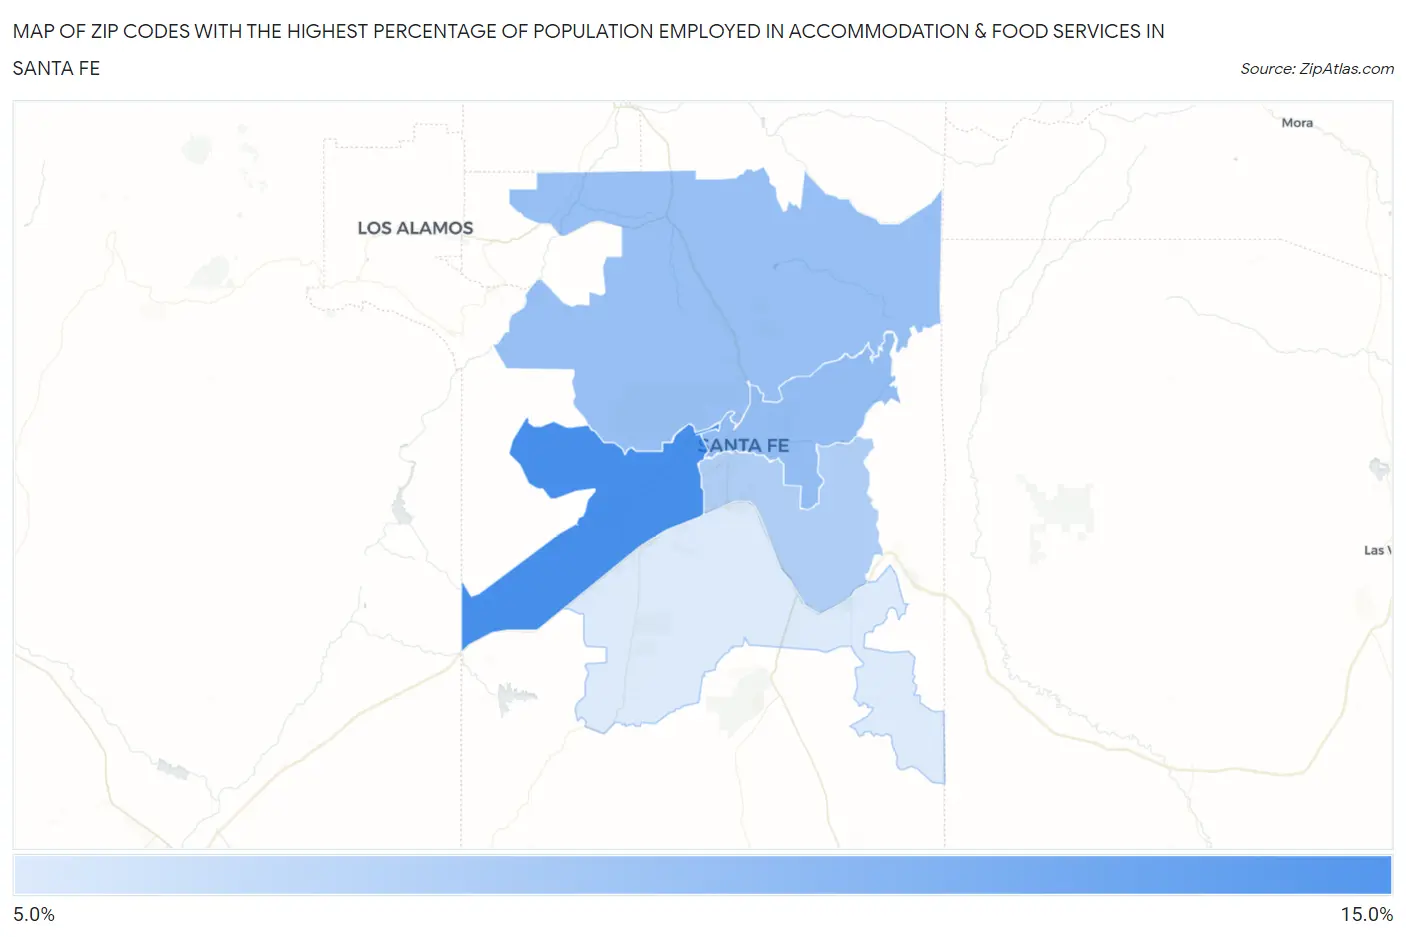
Map of Zip Codes with the Highest Percentage of Population Employed in Accommodation & Food Services in Santa Fe
6.1%
11.3%
Zip Codes with the Highest Percentage of Population Employed in Accommodation & Food Services in Santa Fe, NM
| Zip Code | % Employed | vs State | vs National | |
| 1. | 87507 | 11.3% | 7.9%(+3.33)#53 | 6.9%(+4.39)#3,344 |
| 2. | 87501 | 8.6% | 7.9%(+0.638)#94 | 6.9%(+1.69)#6,684 |
| 3. | 87506 | 8.4% | 7.9%(+0.469)#97 | 6.9%(+1.52)#6,995 |
| 4. | 87505 | 7.7% | 7.9%(-0.280)#110 | 6.9%(+0.773)#8,615 |
| 5. | 87508 | 6.1% | 7.9%(-1.86)#145 | 6.9%(-0.806)#13,227 |
1
Common Questions
What are the Top 3 Zip Codes with the Highest Percentage of Population Employed in Accommodation & Food Services in Santa Fe, NM?
Top 3 Zip Codes with the Highest Percentage of Population Employed in Accommodation & Food Services in Santa Fe, NM are:
What zip code has the Highest Percentage of Population Employed in Accommodation & Food Services in Santa Fe, NM?
87507 has the Highest Percentage of Population Employed in Accommodation & Food Services in Santa Fe, NM with 11.3%.
What is the Percentage of Population Employed in Accommodation & Food Services in Santa Fe, NM?
Percentage of Population Employed in Accommodation & Food Services in Santa Fe is 9.7%.
What is the Percentage of Population Employed in Accommodation & Food Services in New Mexico?
Percentage of Population Employed in Accommodation & Food Services in New Mexico is 7.9%.
What is the Percentage of Population Employed in Accommodation & Food Services in the United States?
Percentage of Population Employed in Accommodation & Food Services in the United States is 6.9%.