Hightsville, NC Map & Demographics
Hightsville Map
Hightsville Overview
$36,458
PER CAPITA INCOME
$15,682
AVG HOUSEHOLD INCOME
0.38
INEQUALITY / GINI INDEX
750
TOTAL POPULATION
657
MALE POPULATION
93
FEMALE POPULATION
706.45
MALES / 100 FEMALES
14.16
FEMALES / 100 MALES
41.3
MEDIAN AGE
1.8
AVG FAMILY SIZE
1.3
AVG HOUSEHOLD SIZE
127
LABOR FORCE [ PEOPLE ]
17.6%
PERCENT IN LABOR FORCE
Income in Hightsville
Income Overview in Hightsville
| Characteristic | Number | Measure |
| Per Capita Income | 750 | $36,458 |
| Median Family Income | 46 | $0 |
| Mean Family Income | 46 | $0 |
| Median Household Income | 208 | $15,682 |
| Mean Household Income | 208 | $22,043 |
| Income Deficit | 46 | $0 |
| Wage / Income Gap (%) | 750 | 0.00% |
| Wage / Income Gap ($) | 750 | 100.00¢ per $1 |
| Gini / Inequality Index | 750 | 0.38 |
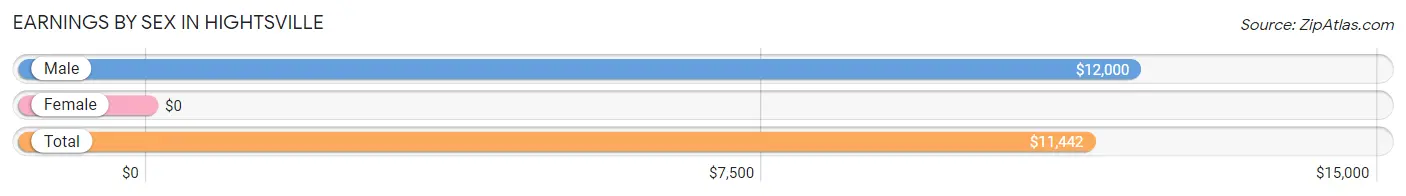
Earnings by Sex in Hightsville
| Sex | Number | Average Earnings |
| Male | 414 (93.4%) | $12,000 |
| Female | 29 (6.6%) | $0 |
| Total | 443 (100.0%) | $11,442 |
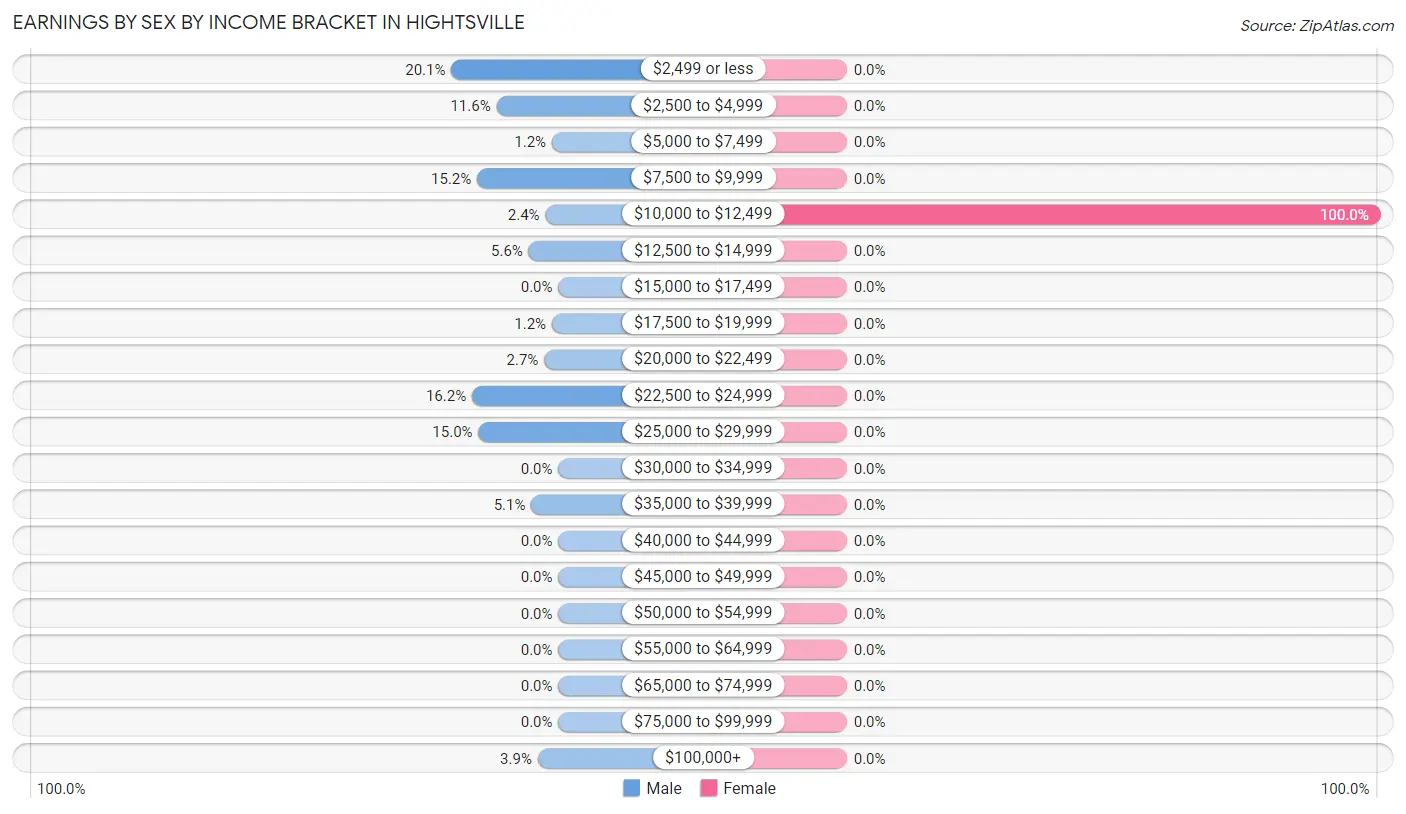
Earnings by Sex by Income Bracket in Hightsville
The most common earnings brackets in Hightsville are $2,499 or less for men (83 | 20.1%) and $10,000 to $12,499 for women (29 | 100.0%).
| Income | Male | Female |
| $2,499 or less | 83 (20.1%) | 0 (0.0%) |
| $2,500 to $4,999 | 48 (11.6%) | 0 (0.0%) |
| $5,000 to $7,499 | 5 (1.2%) | 0 (0.0%) |
| $7,500 to $9,999 | 63 (15.2%) | 0 (0.0%) |
| $10,000 to $12,499 | 10 (2.4%) | 29 (100.0%) |
| $12,500 to $14,999 | 23 (5.6%) | 0 (0.0%) |
| $15,000 to $17,499 | 0 (0.0%) | 0 (0.0%) |
| $17,500 to $19,999 | 5 (1.2%) | 0 (0.0%) |
| $20,000 to $22,499 | 11 (2.7%) | 0 (0.0%) |
| $22,500 to $24,999 | 67 (16.2%) | 0 (0.0%) |
| $25,000 to $29,999 | 62 (15.0%) | 0 (0.0%) |
| $30,000 to $34,999 | 0 (0.0%) | 0 (0.0%) |
| $35,000 to $39,999 | 21 (5.1%) | 0 (0.0%) |
| $40,000 to $44,999 | 0 (0.0%) | 0 (0.0%) |
| $45,000 to $49,999 | 0 (0.0%) | 0 (0.0%) |
| $50,000 to $54,999 | 0 (0.0%) | 0 (0.0%) |
| $55,000 to $64,999 | 0 (0.0%) | 0 (0.0%) |
| $65,000 to $74,999 | 0 (0.0%) | 0 (0.0%) |
| $75,000 to $99,999 | 0 (0.0%) | 0 (0.0%) |
| $100,000+ | 16 (3.9%) | 0 (0.0%) |
| Total | 414 (100.0%) | 29 (100.0%) |
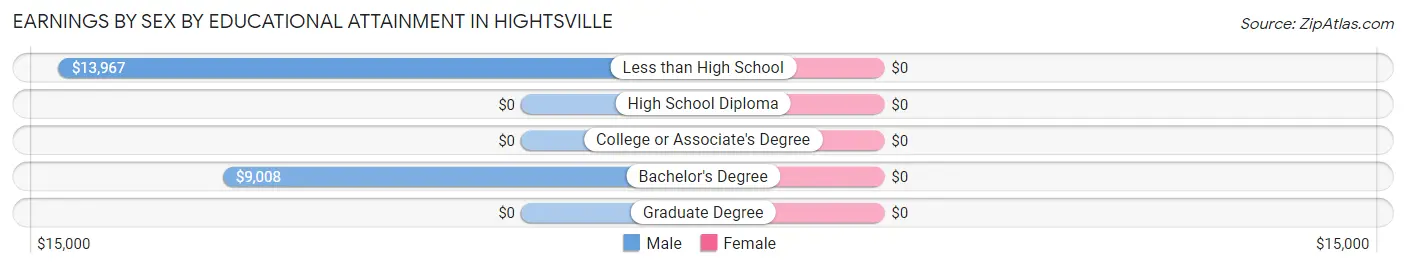
Earnings by Sex by Educational Attainment in Hightsville
| Educational Attainment | Male Income | Female Income |
| Less than High School | $13,967 | $0 |
| High School Diploma | - | - |
| College or Associate's Degree | - | - |
| Bachelor's Degree | $9,008 | $0 |
| Graduate Degree | - | - |
| Total | $9,623 | $0 |
Family Income in Hightsville
Family Income Brackets in Hightsville
According to the Hightsville family income data, there are 35 families falling into the $25,000 to $34,999 income range, which is the most common income bracket and makes up 76.1% of all families.
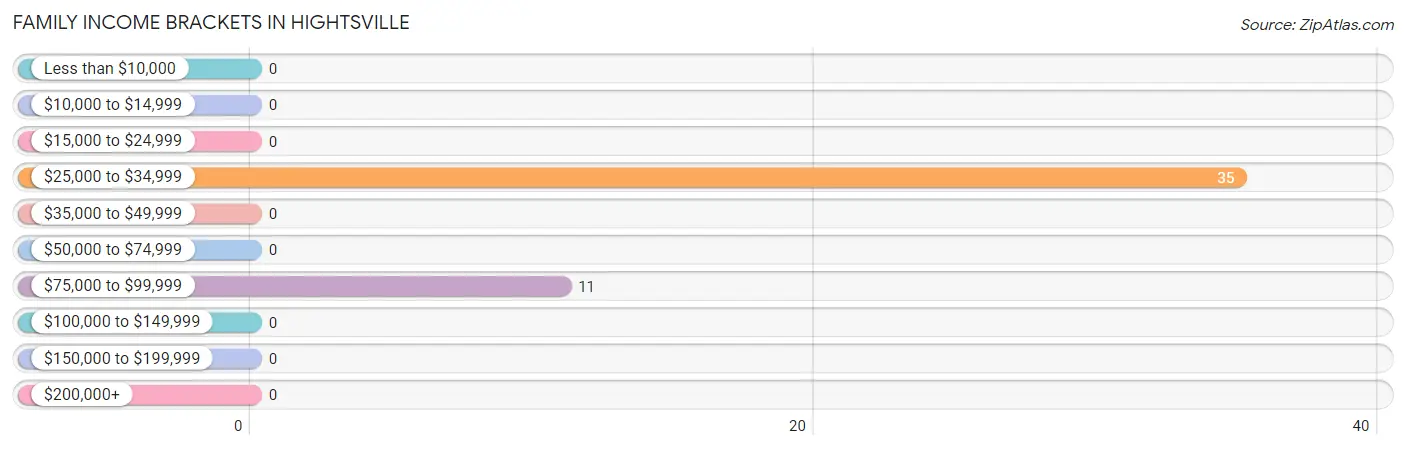
| Income Bracket | # Families | % Families |
| Less than $10,000 | 0 | 0.0% |
| $10,000 to $14,999 | 0 | 0.0% |
| $15,000 to $24,999 | 0 | 0.0% |
| $25,000 to $34,999 | 35 | 76.1% |
| $35,000 to $49,999 | 0 | 0.0% |
| $50,000 to $74,999 | 0 | 0.0% |
| $75,000 to $99,999 | 11 | 23.9% |
| $100,000 to $149,999 | 0 | 0.0% |
| $150,000 to $199,999 | 0 | 0.0% |
| $200,000+ | 0 | 0.0% |
Family Income by Famaliy Size in Hightsville
| Income Bracket | # Families | Median Income |
| 2-Person Families | 46 (100.0%) | $0 |
| 3-Person Families | 0 (0.0%) | $0 |
| 4-Person Families | 0 (0.0%) | $0 |
| 5-Person Families | 0 (0.0%) | $0 |
| 6-Person Families | 0 (0.0%) | $0 |
| 7+ Person Families | 0 (0.0%) | $0 |
| Total | 46 (100.0%) | $0 |
Family Income by Number of Earners in Hightsville
| Number of Earners | # Families | Median Income |
| No Earners | 11 (23.9%) | $0 |
| 1 Earner | 35 (76.1%) | $0 |
| 2 Earners | 0 (0.0%) | $0 |
| 3+ Earners | 0 (0.0%) | $0 |
| Total | 46 (100.0%) | $0 |
Household Income in Hightsville
Household Income Brackets in Hightsville
With 76 households falling in the category, the $15,000 to $24,999 income range is the most frequent in Hightsville, accounting for 36.5% of all households.
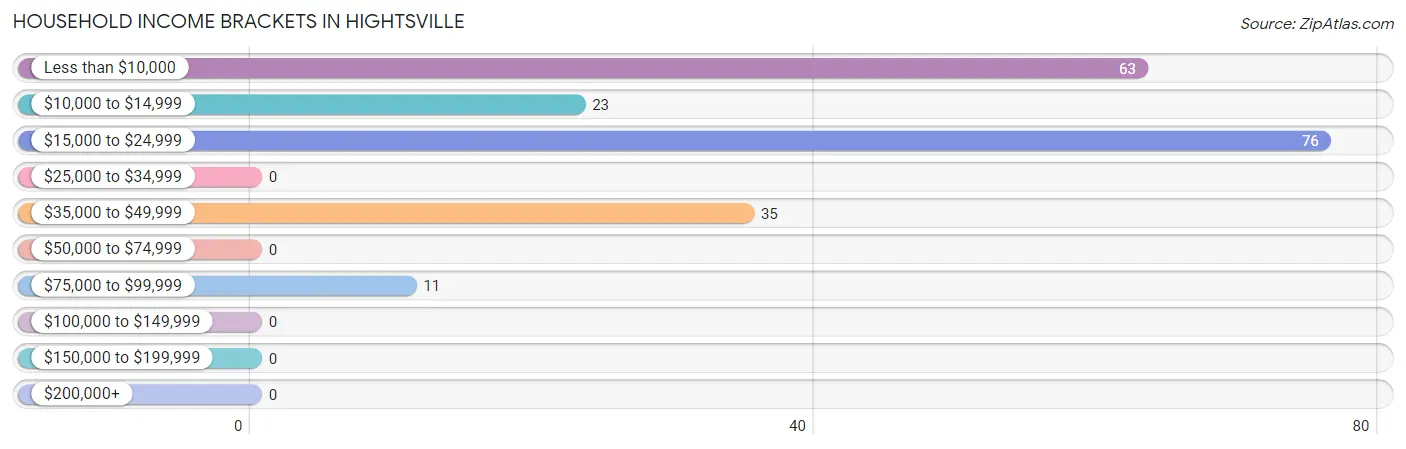
| Income Bracket | # Households | % Households |
| Less than $10,000 | 63 | 30.3% |
| $10,000 to $14,999 | 23 | 11.1% |
| $15,000 to $24,999 | 76 | 36.5% |
| $25,000 to $34,999 | 0 | 0.0% |
| $35,000 to $49,999 | 35 | 16.8% |
| $50,000 to $74,999 | 0 | 0.0% |
| $75,000 to $99,999 | 11 | 5.3% |
| $100,000 to $149,999 | 0 | 0.0% |
| $150,000 to $199,999 | 0 | 0.0% |
| $200,000+ | 0 | 0.0% |
Household Income by Householder Age in Hightsville
| Income Bracket | # Households | Median Income |
| 15 to 24 Years | 35 (16.8%) | $0 |
| 25 to 44 Years | 63 (30.3%) | $0 |
| 45 to 64 Years | 23 (11.1%) | $0 |
| 65+ Years | 87 (41.8%) | $0 |
| Total | 208 (100.0%) | $15,682 |
Poverty in Hightsville
Income Below Poverty by Sex and Age in Hightsville
With 34.6% poverty level for males and 55.9% for females among the residents of Hightsville, 35 to 44 year old males and 18 to 24 year old females are the most vulnerable to poverty, with 63 males (100.0%) and 29 females (100.0%) in their respective age groups living below the poverty level.
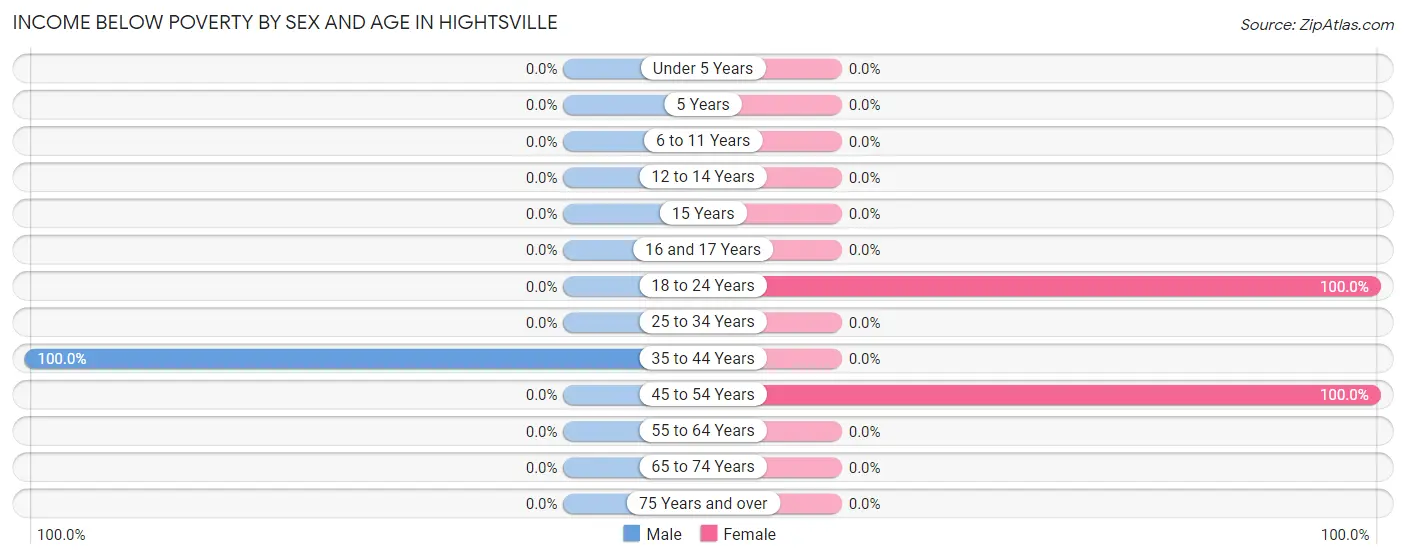
| Age Bracket | Male | Female |
| Under 5 Years | 0 (0.0%) | 0 (0.0%) |
| 5 Years | 0 (0.0%) | 0 (0.0%) |
| 6 to 11 Years | 0 (0.0%) | 0 (0.0%) |
| 12 to 14 Years | 0 (0.0%) | 0 (0.0%) |
| 15 Years | 0 (0.0%) | 0 (0.0%) |
| 16 and 17 Years | 0 (0.0%) | 0 (0.0%) |
| 18 to 24 Years | 0 (0.0%) | 29 (100.0%) |
| 25 to 34 Years | 0 (0.0%) | 0 (0.0%) |
| 35 to 44 Years | 63 (100.0%) | 0 (0.0%) |
| 45 to 54 Years | 0 (0.0%) | 23 (100.0%) |
| 55 to 64 Years | 0 (0.0%) | 0 (0.0%) |
| 65 to 74 Years | 0 (0.0%) | 0 (0.0%) |
| 75 Years and over | 0 (0.0%) | 0 (0.0%) |
| Total | 63 (34.6%) | 52 (55.9%) |
Income Above Poverty by Sex and Age in Hightsville
According to the poverty statistics in Hightsville, males aged under 5 years and females aged 65 to 74 years are the age groups that are most secure financially, with 100.0% of males and 100.0% of females in these age groups living above the poverty line.
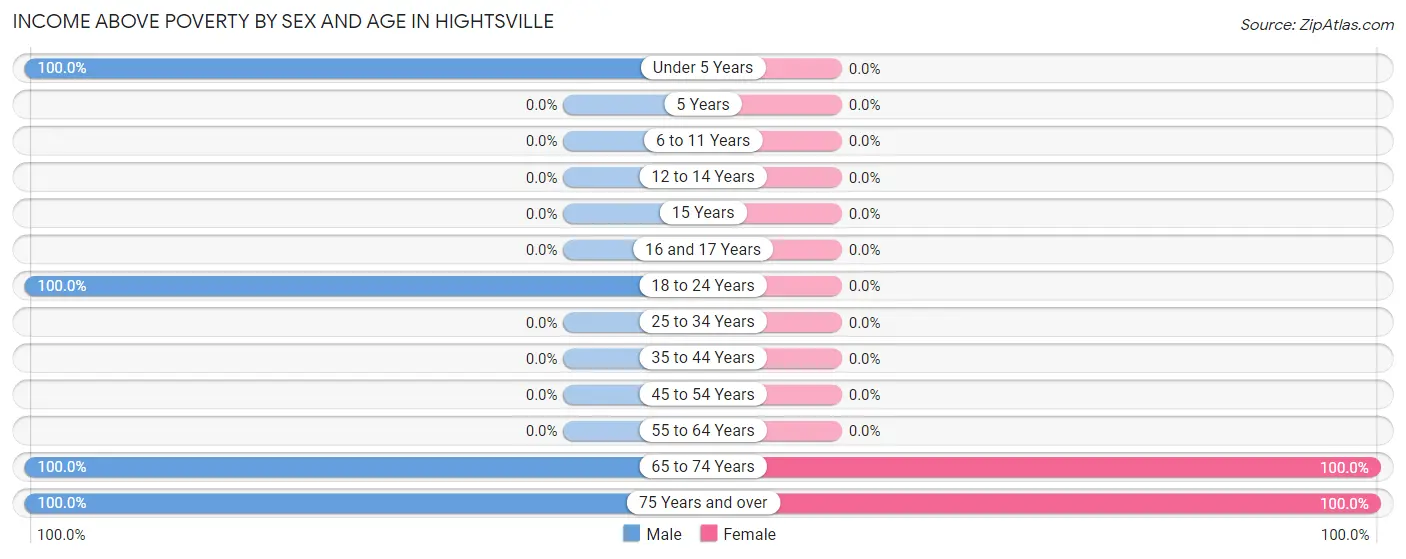
| Age Bracket | Male | Female |
| Under 5 Years | 27 (100.0%) | 0 (0.0%) |
| 5 Years | 0 (0.0%) | 0 (0.0%) |
| 6 to 11 Years | 0 (0.0%) | 0 (0.0%) |
| 12 to 14 Years | 0 (0.0%) | 0 (0.0%) |
| 15 Years | 0 (0.0%) | 0 (0.0%) |
| 16 and 17 Years | 0 (0.0%) | 0 (0.0%) |
| 18 to 24 Years | 35 (100.0%) | 0 (0.0%) |
| 25 to 34 Years | 0 (0.0%) | 0 (0.0%) |
| 35 to 44 Years | 0 (0.0%) | 0 (0.0%) |
| 45 to 54 Years | 0 (0.0%) | 0 (0.0%) |
| 55 to 64 Years | 0 (0.0%) | 0 (0.0%) |
| 65 to 74 Years | 46 (100.0%) | 20 (100.0%) |
| 75 Years and over | 11 (100.0%) | 21 (100.0%) |
| Total | 119 (65.4%) | 41 (44.1%) |
Income Below Poverty Among Married-Couple Families in Hightsville
| Children | Above Poverty | Below Poverty |
| No Children | 11 (100.0%) | 0 (0.0%) |
| 1 or 2 Children | 0 (0.0%) | 0 (0.0%) |
| 3 or 4 Children | 0 (0.0%) | 0 (0.0%) |
| 5 or more Children | 0 (0.0%) | 0 (0.0%) |
| Total | 11 (100.0%) | 0 (0.0%) |
Income Below Poverty Among Single-Parent Households in Hightsville
| Children | Single Father | Single Mother |
| No Children | 0 (0.0%) | 0 (0.0%) |
| 1 or 2 Children | 0 (0.0%) | 0 (0.0%) |
| 3 or 4 Children | 0 (0.0%) | 0 (0.0%) |
| 5 or more Children | 0 (0.0%) | 0 (0.0%) |
| Total | 0 (0.0%) | 0 (0.0%) |
Income Below Poverty Among Married-Couple vs Single-Parent Households in Hightsville
| Children | Married-Couple Families | Single-Parent Households |
| No Children | 0 (0.0%) | 0 (0.0%) |
| 1 or 2 Children | 0 (0.0%) | 0 (0.0%) |
| 3 or 4 Children | 0 (0.0%) | 0 (0.0%) |
| 5 or more Children | 0 (0.0%) | 0 (0.0%) |
| Total | 0 (0.0%) | 0 (0.0%) |
Race in Hightsville
The most populous races in Hightsville are White / Caucasian (482 | 64.3%), Black / African American (140 | 18.7%), and Hispanic or Latino (87 | 11.6%).
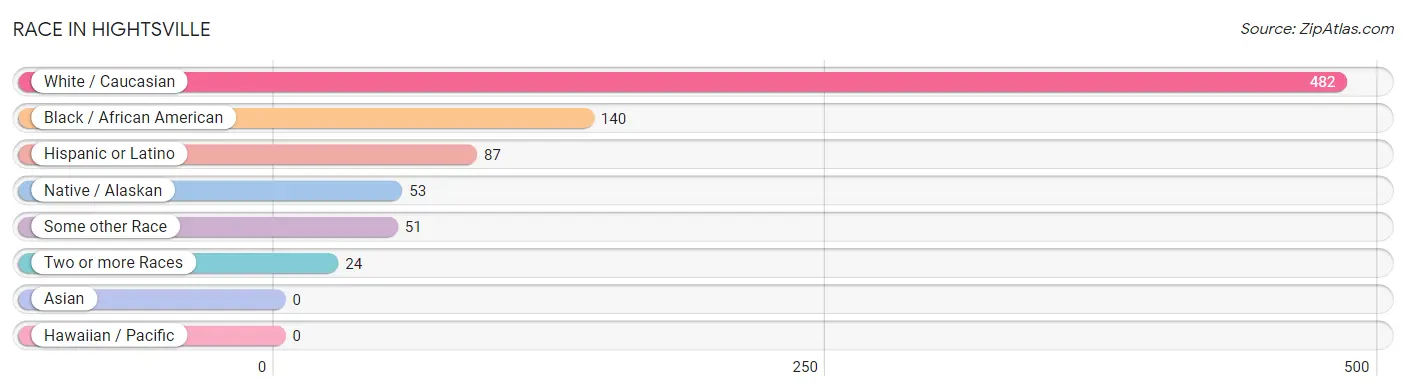
| Race | # Population | % Population |
| Asian | 0 | 0.0% |
| Black / African American | 140 | 18.7% |
| Hawaiian / Pacific | 0 | 0.0% |
| Hispanic or Latino | 87 | 11.6% |
| Native / Alaskan | 53 | 7.1% |
| White / Caucasian | 482 | 64.3% |
| Two or more Races | 24 | 3.2% |
| Some other Race | 51 | 6.8% |
| Total | 750 | 100.0% |
Ancestry in Hightsville
The most populous ancestries reported in Hightsville are Arab (92 | 12.3%), Irish (78 | 10.4%), Egyptian (63 | 8.4%), Mexican (60 | 8.0%), and Italian (56 | 7.5%), together accounting for 46.5% of all Hightsville residents.
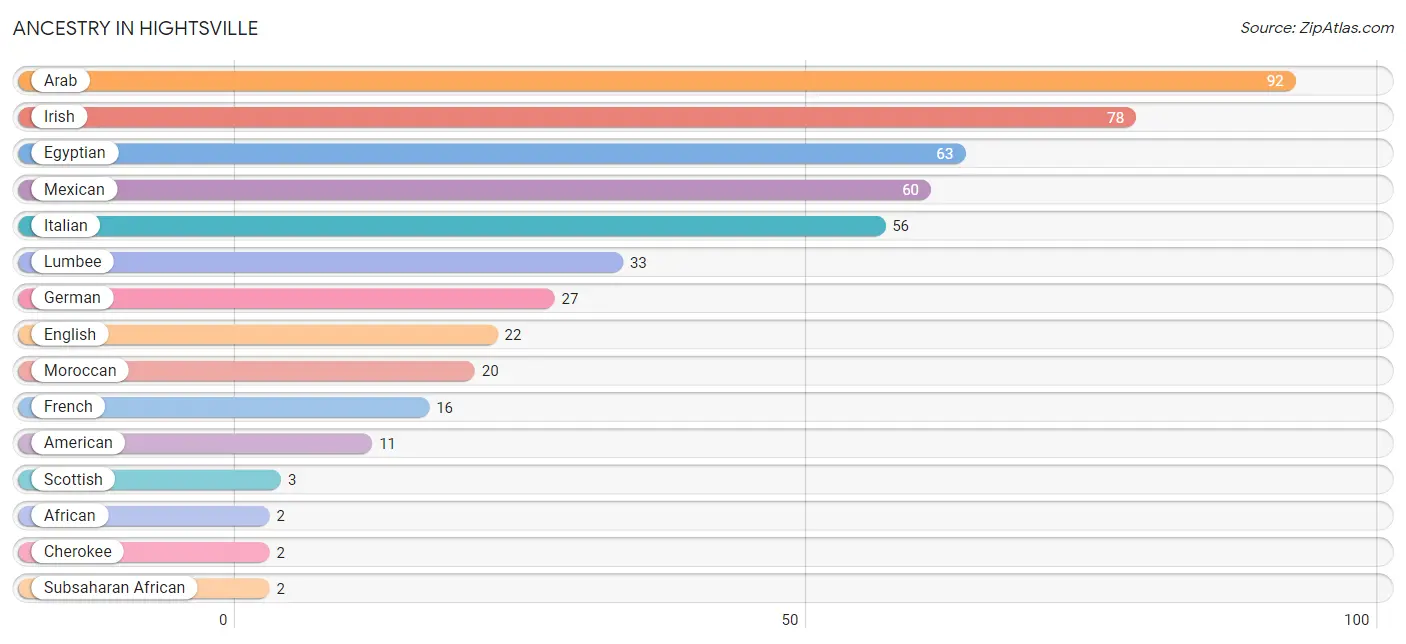
| Ancestry | # Population | % Population |
| African | 2 | 0.3% |
| American | 11 | 1.5% |
| Arab | 92 | 12.3% |
| Cherokee | 2 | 0.3% |
| Egyptian | 63 | 8.4% |
| English | 22 | 2.9% |
| French | 16 | 2.1% |
| German | 27 | 3.6% |
| Irish | 78 | 10.4% |
| Italian | 56 | 7.5% |
| Lumbee | 33 | 4.4% |
| Mexican | 60 | 8.0% |
| Moroccan | 20 | 2.7% |
| Northern European | 1 | 0.1% |
| Scottish | 3 | 0.4% |
| Subsaharan African | 2 | 0.3% | View All 16 Rows |
Immigrants in Hightsville
The most numerous immigrant groups reported in Hightsville came from Africa (63 | 8.4%), Egypt (63 | 8.4%), Northern Africa (63 | 8.4%), Europe (1 | 0.1%), and Germany (1 | 0.1%), together accounting for 25.5% of all Hightsville residents.
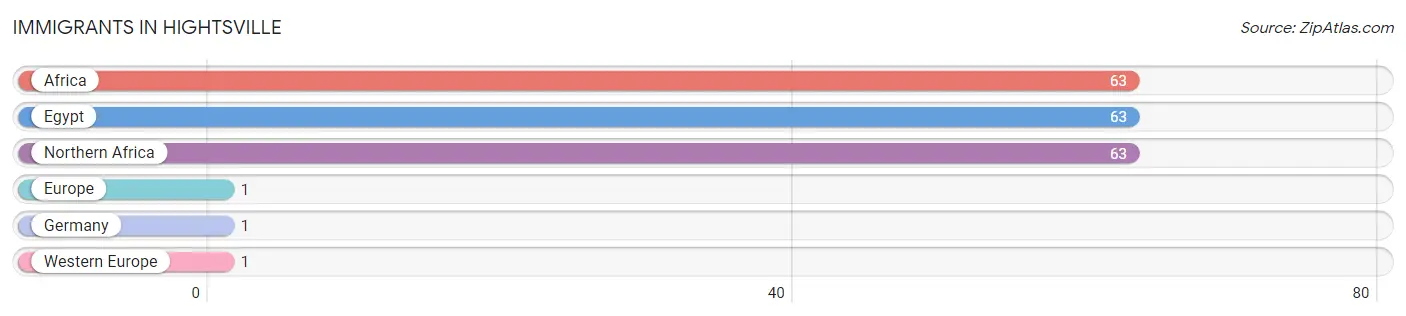
| Immigration Origin | # Population | % Population |
| Africa | 63 | 8.4% |
| Egypt | 63 | 8.4% |
| Europe | 1 | 0.1% |
| Germany | 1 | 0.1% |
| Northern Africa | 63 | 8.4% |
| Western Europe | 1 | 0.1% | View All 6 Rows |
Sex and Age in Hightsville
Sex and Age in Hightsville
The most populous age groups in Hightsville are 40 to 44 Years (177 | 26.9%) for men and 15 to 19 Years (29 | 31.2%) for women.
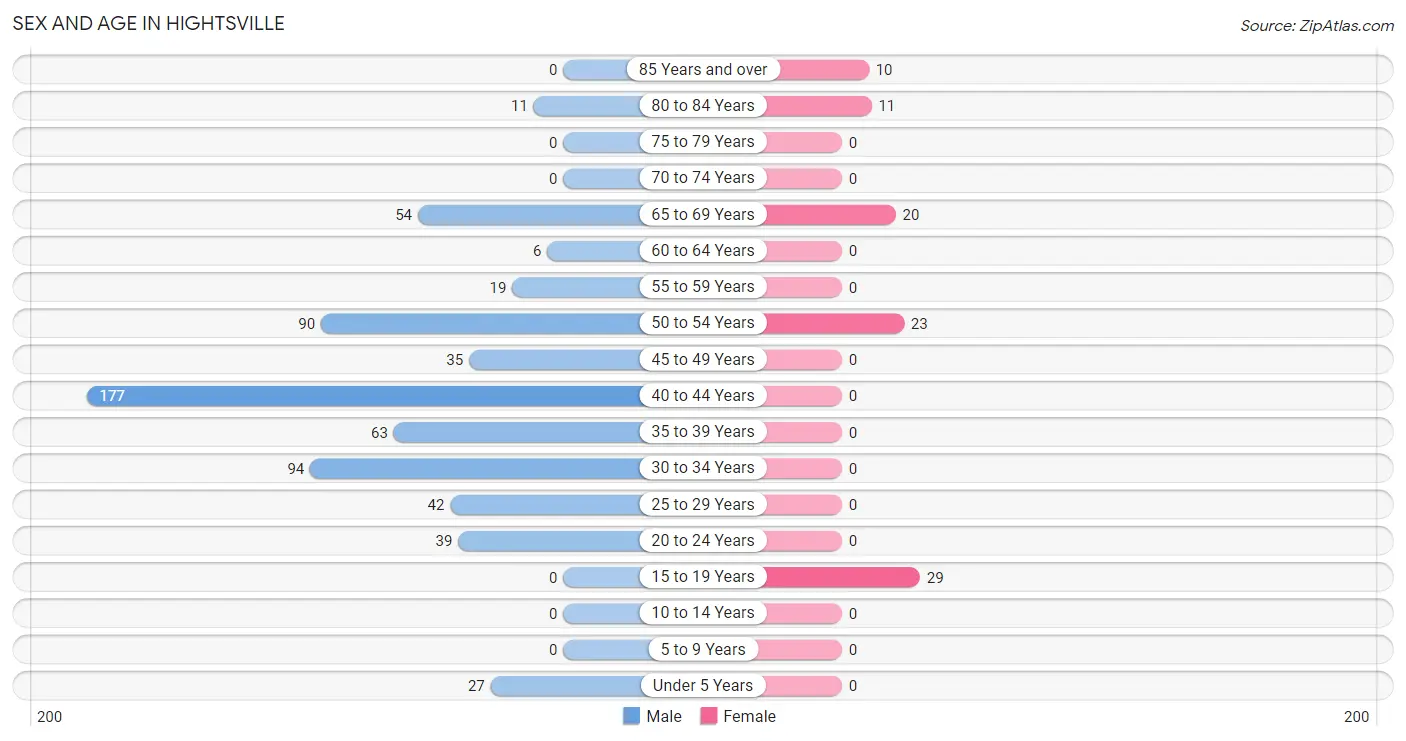
| Age Bracket | Male | Female |
| Under 5 Years | 27 (4.1%) | 0 (0.0%) |
| 5 to 9 Years | 0 (0.0%) | 0 (0.0%) |
| 10 to 14 Years | 0 (0.0%) | 0 (0.0%) |
| 15 to 19 Years | 0 (0.0%) | 29 (31.2%) |
| 20 to 24 Years | 39 (5.9%) | 0 (0.0%) |
| 25 to 29 Years | 42 (6.4%) | 0 (0.0%) |
| 30 to 34 Years | 94 (14.3%) | 0 (0.0%) |
| 35 to 39 Years | 63 (9.6%) | 0 (0.0%) |
| 40 to 44 Years | 177 (26.9%) | 0 (0.0%) |
| 45 to 49 Years | 35 (5.3%) | 0 (0.0%) |
| 50 to 54 Years | 90 (13.7%) | 23 (24.7%) |
| 55 to 59 Years | 19 (2.9%) | 0 (0.0%) |
| 60 to 64 Years | 6 (0.9%) | 0 (0.0%) |
| 65 to 69 Years | 54 (8.2%) | 20 (21.5%) |
| 70 to 74 Years | 0 (0.0%) | 0 (0.0%) |
| 75 to 79 Years | 0 (0.0%) | 0 (0.0%) |
| 80 to 84 Years | 11 (1.7%) | 11 (11.8%) |
| 85 Years and over | 0 (0.0%) | 10 (10.7%) |
| Total | 657 (100.0%) | 93 (100.0%) |
Families and Households in Hightsville
Median Family Size in Hightsville
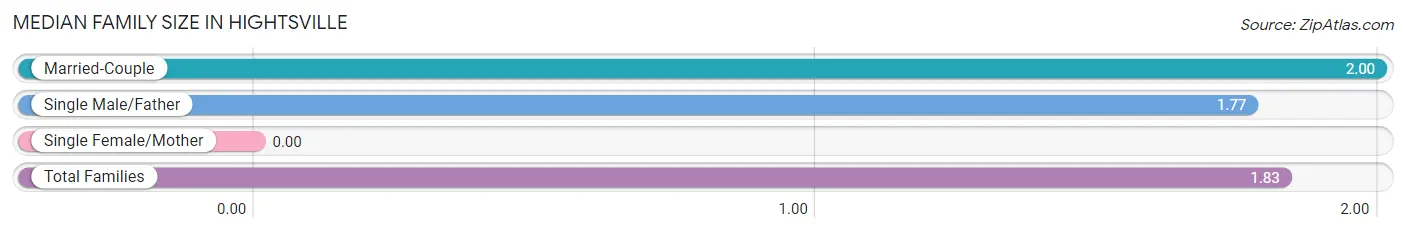
| Family Type | # Families | Family Size |
| Married-Couple | 11 (23.9%) | 2.00 |
| Single Male/Father | 35 (76.1%) | 1.77 |
| Single Female/Mother | 0 (0.0%) | - |
| Total Families | 46 (100.0%) | 1.83 |
Median Household Size in Hightsville
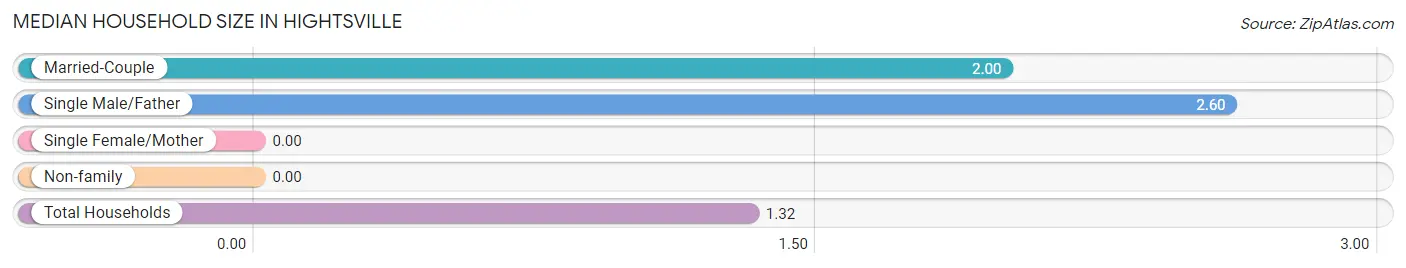
| Household Type | # Households | Household Size |
| Married-Couple | 11 (5.3%) | 2.00 |
| Single Male/Father | 35 (16.8%) | 2.60 |
| Single Female/Mother | 0 (0.0%) | - |
| Non-family | 162 (77.9%) | - |
| Total Households | 208 (100.0%) | 1.32 |
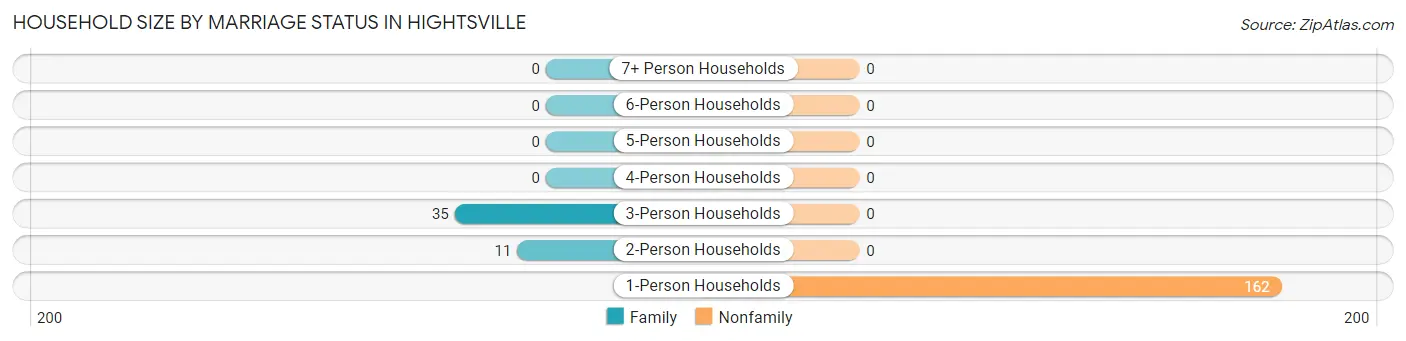
Household Size by Marriage Status in Hightsville
Out of a total of 208 households in Hightsville, 46 (22.1%) are family households, while 162 (77.9%) are nonfamily households. The most numerous type of family households are 3-person households, comprising 35, and the most common type of nonfamily households are 1-person households, comprising 162.
| Household Size | Family Households | Nonfamily Households |
| 1-Person Households | - | 162 (77.9%) |
| 2-Person Households | 11 (5.3%) | 0 (0.0%) |
| 3-Person Households | 35 (16.8%) | 0 (0.0%) |
| 4-Person Households | 0 (0.0%) | 0 (0.0%) |
| 5-Person Households | 0 (0.0%) | 0 (0.0%) |
| 6-Person Households | 0 (0.0%) | 0 (0.0%) |
| 7+ Person Households | 0 (0.0%) | 0 (0.0%) |
| Total | 46 (22.1%) | 162 (77.9%) |
Female Fertility in Hightsville
Fertility by Age in Hightsville
| Age Bracket | Women with Births | Births / 1,000 Women |
| 15 to 19 years | 0 (0.0%) | 0.0 |
| 20 to 34 years | 0 (0.0%) | 0.0 |
| 35 to 50 years | 0 (0.0%) | 0.0 |
| Total | 0 (0.0%) | 0.0 |
Fertility by Age by Marriage Status in Hightsville
| Age Bracket | Married | Unmarried |
| 15 to 19 years | 0 (0.0%) | 0 (0.0%) |
| 20 to 34 years | 0 (0.0%) | 0 (0.0%) |
| 35 to 50 years | 0 (0.0%) | 0 (0.0%) |
| Total | 0 (0.0%) | 0 (0.0%) |
Fertility by Education in Hightsville
| Educational Attainment | Women with Births | Births / 1,000 Women |
| Less than High School | 0 (0.0%) | 0.0 |
| High School Diploma | 0 (0.0%) | 0.0 |
| College or Associate's Degree | 0 (0.0%) | 0.0 |
| Bachelor's Degree | 0 (0.0%) | 0.0 |
| Graduate Degree | 0 (0.0%) | 0.0 |
| Total | 0 (0.0%) | 0.0 |
Fertility by Education by Marriage Status in Hightsville
| Educational Attainment | Married | Unmarried |
| Less than High School | 0 (0.0%) | 0 (0.0%) |
| High School Diploma | 0 (0.0%) | 0 (0.0%) |
| College or Associate's Degree | 0 (0.0%) | 0 (0.0%) |
| Bachelor's Degree | 0 (0.0%) | 0 (0.0%) |
| Graduate Degree | 0 (0.0%) | 0 (0.0%) |
| Total | 0 (0.0%) | 0 (0.0%) |
Employment Characteristics in Hightsville
Employment by Class of Employer in Hightsville
Among the 127 employed individuals in Hightsville, private company employees (64 | 50.4%), and self-employed (not incorporated) (63 | 49.6%) make up the most common classes of employment.
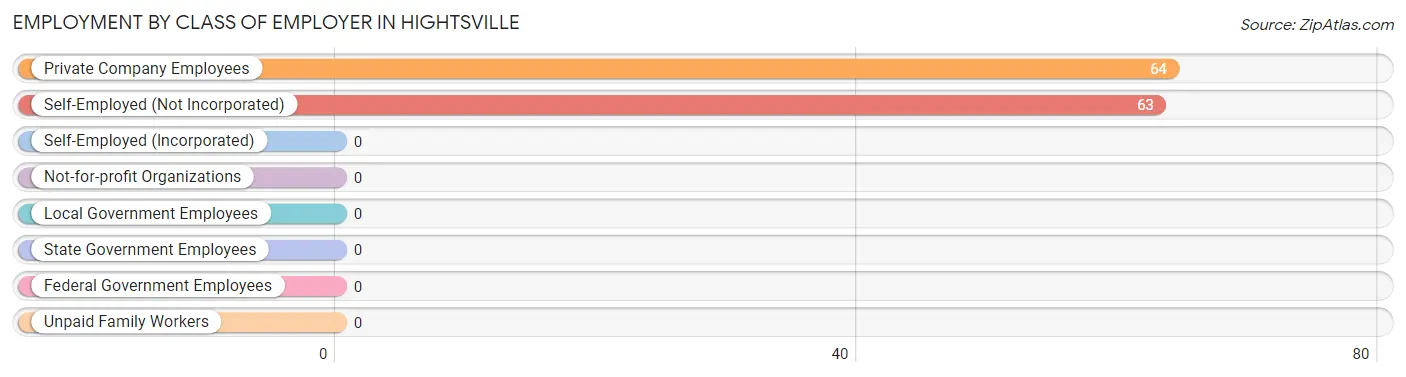
| Employer Class | # Employees | % Employees |
| Private Company Employees | 64 | 50.4% |
| Self-Employed (Incorporated) | 0 | 0.0% |
| Self-Employed (Not Incorporated) | 63 | 49.6% |
| Not-for-profit Organizations | 0 | 0.0% |
| Local Government Employees | 0 | 0.0% |
| State Government Employees | 0 | 0.0% |
| Federal Government Employees | 0 | 0.0% |
| Unpaid Family Workers | 0 | 0.0% |
| Total | 127 | 100.0% |
Employment Status by Age in Hightsville
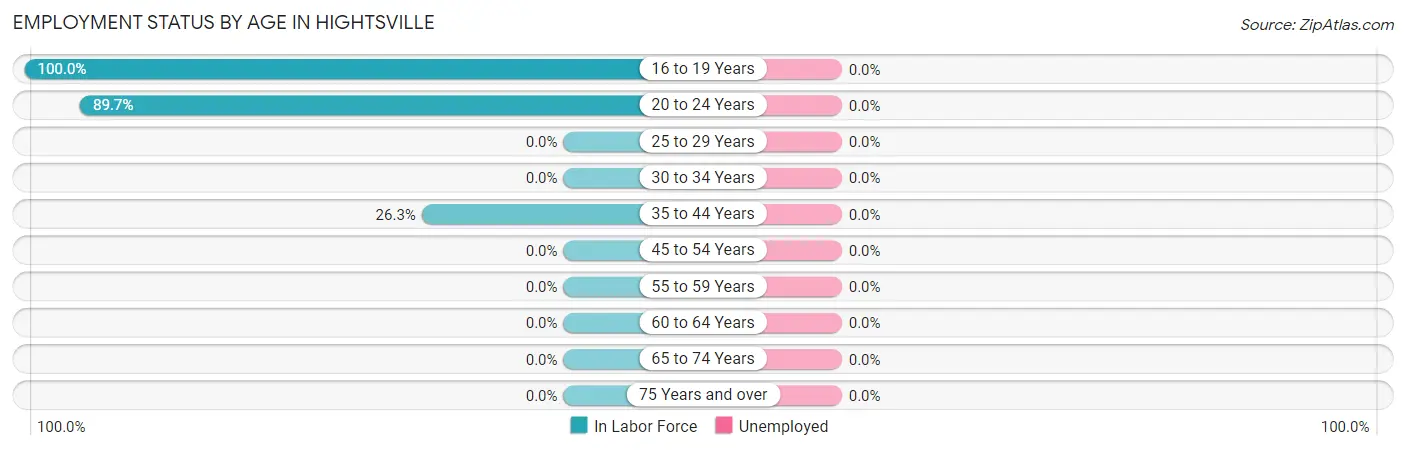
| Age Bracket | In Labor Force | Unemployed |
| 16 to 19 Years | 29 (100.0%) | 0 (0.0%) |
| 20 to 24 Years | 35 (89.7%) | 0 (0.0%) |
| 25 to 29 Years | 0 (0.0%) | 0 (0.0%) |
| 30 to 34 Years | 0 (0.0%) | 0 (0.0%) |
| 35 to 44 Years | 63 (26.3%) | 0 (0.0%) |
| 45 to 54 Years | 0 (0.0%) | 0 (0.0%) |
| 55 to 59 Years | 0 (0.0%) | 0 (0.0%) |
| 60 to 64 Years | 0 (0.0%) | 0 (0.0%) |
| 65 to 74 Years | 0 (0.0%) | 0 (0.0%) |
| 75 Years and over | 0 (0.0%) | 0 (0.0%) |
| Total | 127 (17.6%) | 0 (0.0%) |
Employment Status by Educational Attainment in Hightsville
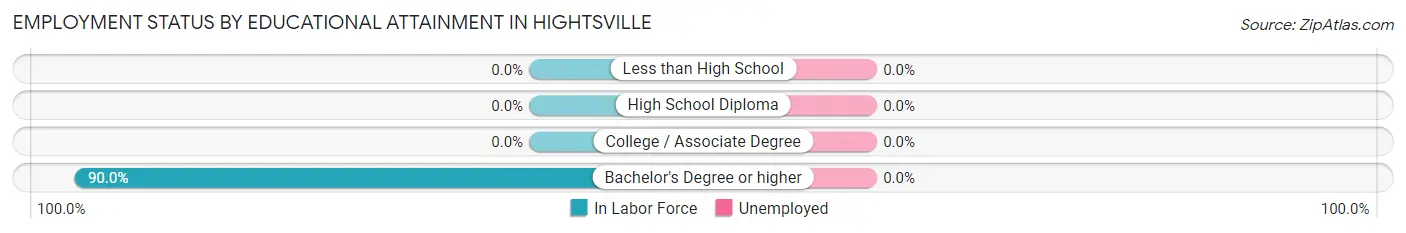
| Educational Attainment | In Labor Force | Unemployed |
| Less than High School | 0 (0.0%) | 0 (0.0%) |
| High School Diploma | 0 (0.0%) | 0 (0.0%) |
| College / Associate Degree | 0 (0.0%) | 0 (0.0%) |
| Bachelor's Degree or higher | 63 (90.0%) | 0 (0.0%) |
| Total | 63 (11.5%) | 0 (0.0%) |
Employment Occupations by Sex in Hightsville
Management, Business, Science and Arts Occupations
Management, Business, Science and Arts Occupations by Sex
| Occupation | Male | Female |
| Management | 0 (0.0%) | 0 (0.0%) |
| Business & Financial | 0 (0.0%) | 0 (0.0%) |
| Computers, Engineering & Science | 0 (0.0%) | 0 (0.0%) |
| Computers & Mathematics | 0 (0.0%) | 0 (0.0%) |
| Architecture & Engineering | 0 (0.0%) | 0 (0.0%) |
| Life, Physical & Social Science | 0 (0.0%) | 0 (0.0%) |
| Community & Social Service | 0 (0.0%) | 0 (0.0%) |
| Education, Arts & Media | 0 (0.0%) | 0 (0.0%) |
| Legal Services & Support | 0 (0.0%) | 0 (0.0%) |
| Education Instruction & Library | 0 (0.0%) | 0 (0.0%) |
| Arts, Media & Entertainment | 0 (0.0%) | 0 (0.0%) |
| Health Diagnosing & Treating | 0 (0.0%) | 0 (0.0%) |
| Health Technologists | 0 (0.0%) | 0 (0.0%) |
| Total (Category) | 0 (0.0%) | 0 (0.0%) |
| Total (Overall) | 98 (77.2%) | 29 (22.8%) |
Services Occupations
Services Occupations by Sex
| Occupation | Male | Female |
| Healthcare Support | 0 (0.0%) | 0 (0.0%) |
| Security & Protection | 0 (0.0%) | 0 (0.0%) |
| Firefighting & Prevention | 0 (0.0%) | 0 (0.0%) |
| Law Enforcement | 0 (0.0%) | 0 (0.0%) |
| Food Preparation & Serving | 0 (0.0%) | 0 (0.0%) |
| Cleaning & Maintenance | 0 (0.0%) | 0 (0.0%) |
| Personal Care & Service | 0 (0.0%) | 0 (0.0%) |
| Total (Category) | 0 (0.0%) | 0 (0.0%) |
| Total (Overall) | 98 (77.2%) | 29 (22.8%) |
Sales and Office Occupations
The most common Sales and Office occupations in Hightsville are , and Sales & Related (29 | 22.8%).
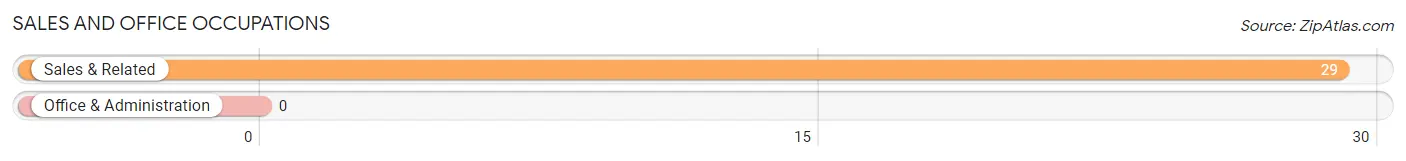
Sales and Office Occupations by Sex
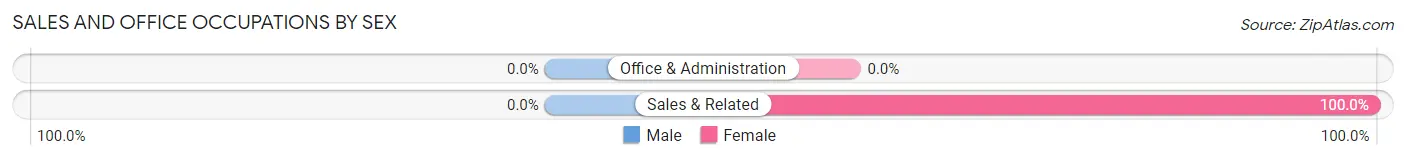
| Occupation | Male | Female |
| Sales & Related | 0 (0.0%) | 29 (100.0%) |
| Office & Administration | 0 (0.0%) | 0 (0.0%) |
| Total (Category) | 0 (0.0%) | 29 (100.0%) |
| Total (Overall) | 98 (77.2%) | 29 (22.8%) |
Natural Resources, Construction and Maintenance Occupations
The most common Natural Resources, Construction and Maintenance occupations in Hightsville are , and Construction & Extraction (35 | 27.6%).
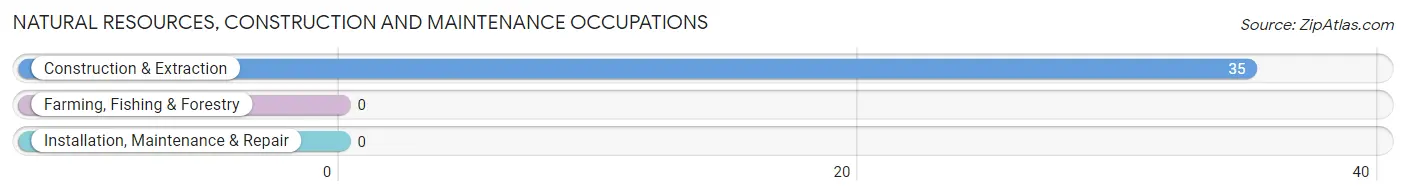
Natural Resources, Construction and Maintenance Occupations by Sex
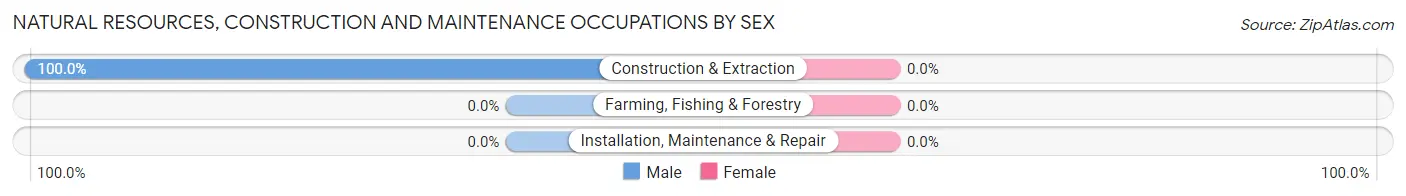
| Occupation | Male | Female |
| Farming, Fishing & Forestry | 0 (0.0%) | 0 (0.0%) |
| Construction & Extraction | 35 (100.0%) | 0 (0.0%) |
| Installation, Maintenance & Repair | 0 (0.0%) | 0 (0.0%) |
| Total (Category) | 35 (100.0%) | 0 (0.0%) |
| Total (Overall) | 98 (77.2%) | 29 (22.8%) |
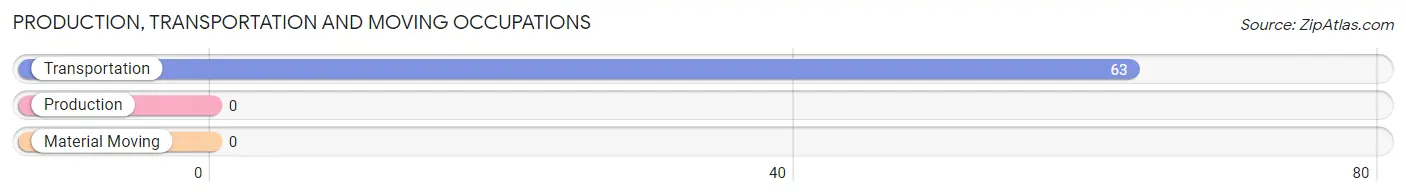
Production, Transportation and Moving Occupations
The most common Production, Transportation and Moving occupations in Hightsville are , and Transportation (63 | 49.6%).
Production, Transportation and Moving Occupations by Sex
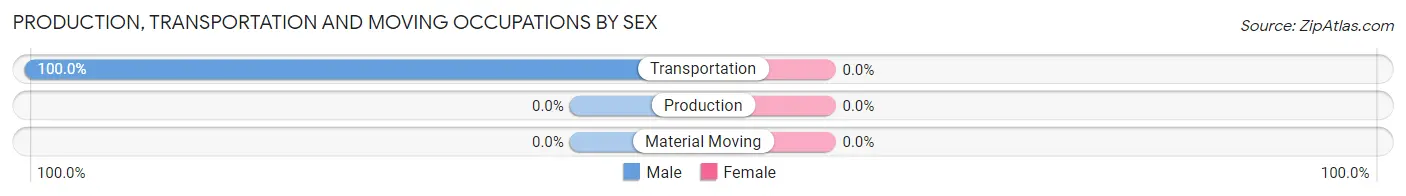
| Occupation | Male | Female |
| Production | 0 (0.0%) | 0 (0.0%) |
| Transportation | 63 (100.0%) | 0 (0.0%) |
| Material Moving | 0 (0.0%) | 0 (0.0%) |
| Total (Category) | 63 (100.0%) | 0 (0.0%) |
| Total (Overall) | 98 (77.2%) | 29 (22.8%) |
Employment Industries by Sex in Hightsville
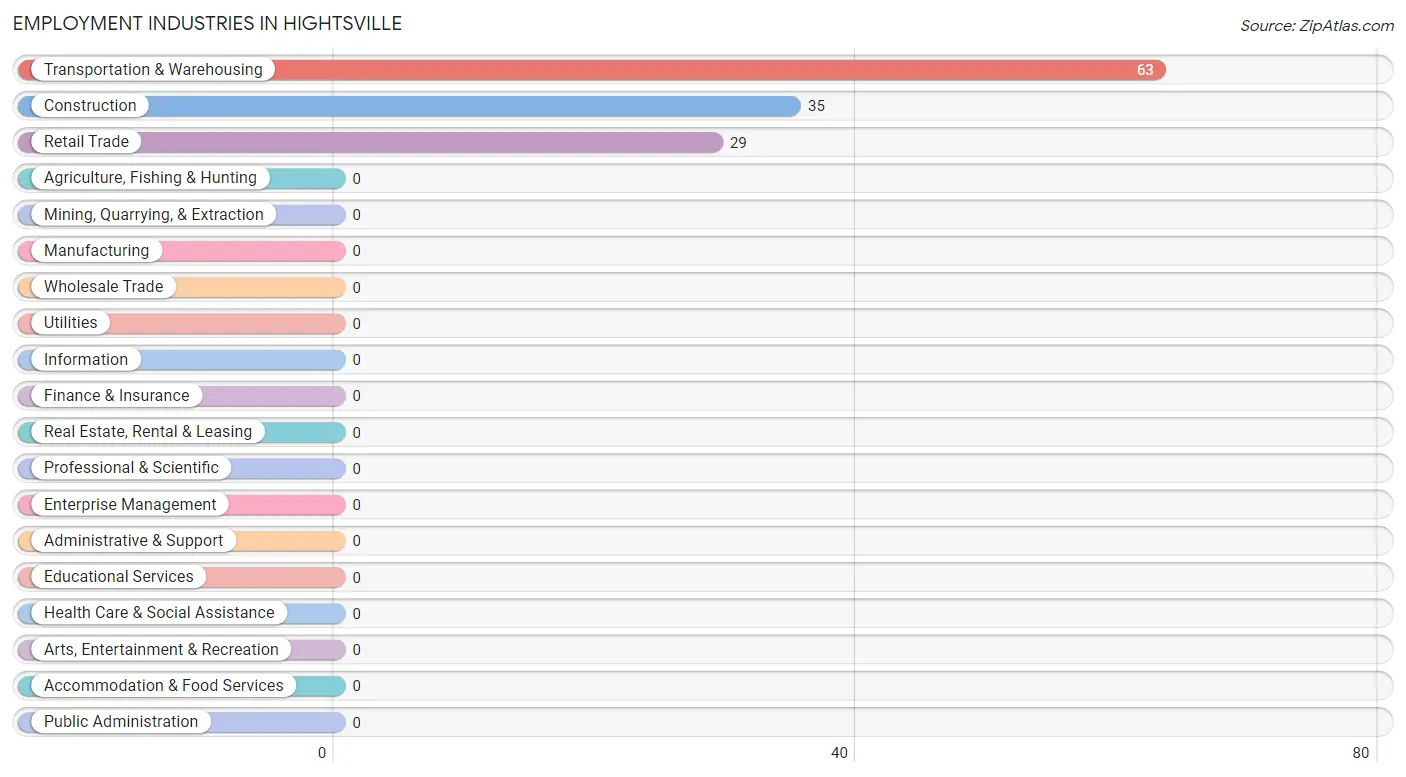
Employment Industries in Hightsville
The major employment industries in Hightsville include Transportation & Warehousing (63 | 49.6%), Construction (35 | 27.6%), and Retail Trade (29 | 22.8%).
Employment Industries by Sex in Hightsville
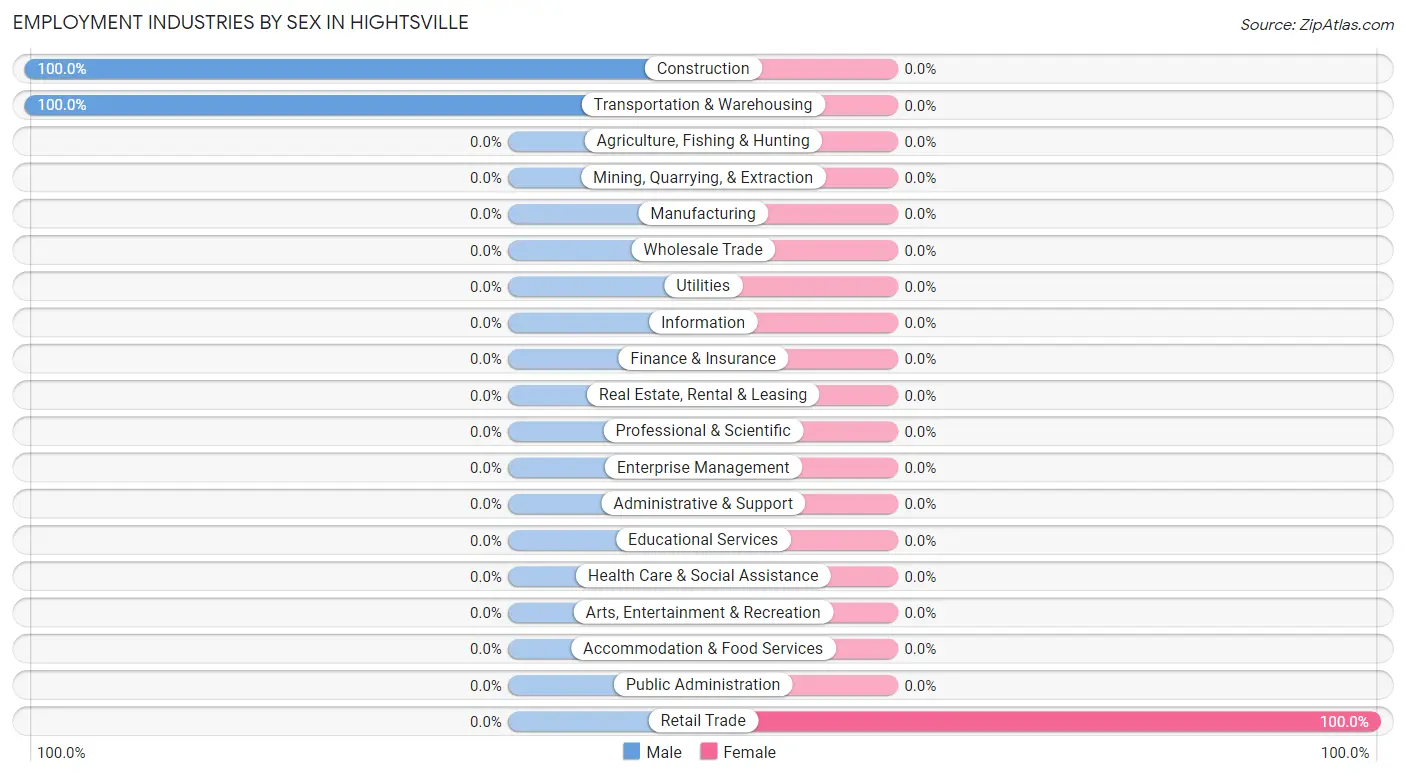
| Industry | Male | Female |
| Agriculture, Fishing & Hunting | 0 (0.0%) | 0 (0.0%) |
| Mining, Quarrying, & Extraction | 0 (0.0%) | 0 (0.0%) |
| Construction | 35 (100.0%) | 0 (0.0%) |
| Manufacturing | 0 (0.0%) | 0 (0.0%) |
| Wholesale Trade | 0 (0.0%) | 0 (0.0%) |
| Retail Trade | 0 (0.0%) | 29 (100.0%) |
| Transportation & Warehousing | 63 (100.0%) | 0 (0.0%) |
| Utilities | 0 (0.0%) | 0 (0.0%) |
| Information | 0 (0.0%) | 0 (0.0%) |
| Finance & Insurance | 0 (0.0%) | 0 (0.0%) |
| Real Estate, Rental & Leasing | 0 (0.0%) | 0 (0.0%) |
| Professional & Scientific | 0 (0.0%) | 0 (0.0%) |
| Enterprise Management | 0 (0.0%) | 0 (0.0%) |
| Administrative & Support | 0 (0.0%) | 0 (0.0%) |
| Educational Services | 0 (0.0%) | 0 (0.0%) |
| Health Care & Social Assistance | 0 (0.0%) | 0 (0.0%) |
| Arts, Entertainment & Recreation | 0 (0.0%) | 0 (0.0%) |
| Accommodation & Food Services | 0 (0.0%) | 0 (0.0%) |
| Public Administration | 0 (0.0%) | 0 (0.0%) |
| Total | 98 (77.2%) | 29 (22.8%) |
Education in Hightsville
School Enrollment in Hightsville
The most common levels of schooling among the 32 students in Hightsville are college / undergraduate (28 | 87.5%), and high school (4 | 12.5%).
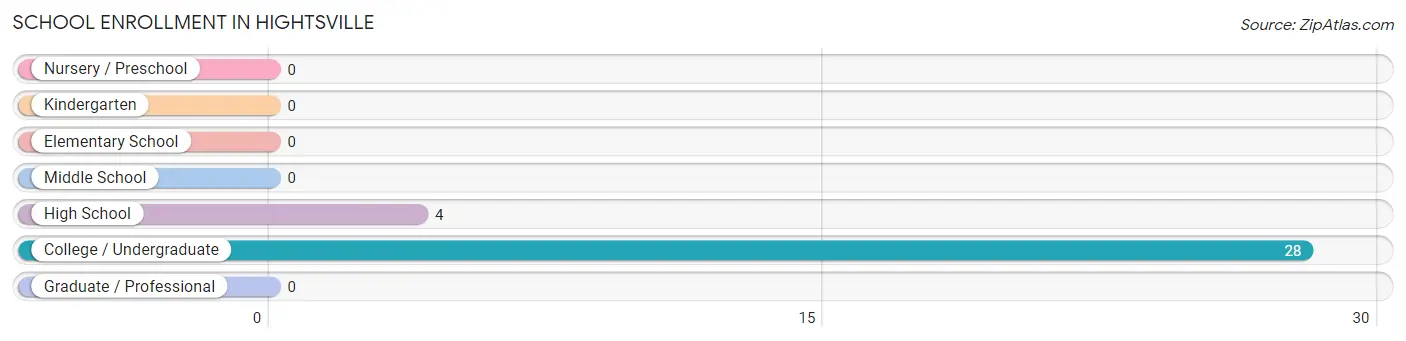
| School Level | # Students | % Students |
| Nursery / Preschool | 0 | 0.0% |
| Kindergarten | 0 | 0.0% |
| Elementary School | 0 | 0.0% |
| Middle School | 0 | 0.0% |
| High School | 4 | 12.5% |
| College / Undergraduate | 28 | 87.5% |
| Graduate / Professional | 0 | 0.0% |
| Total | 32 | 100.0% |
School Enrollment by Age by Funding Source in Hightsville
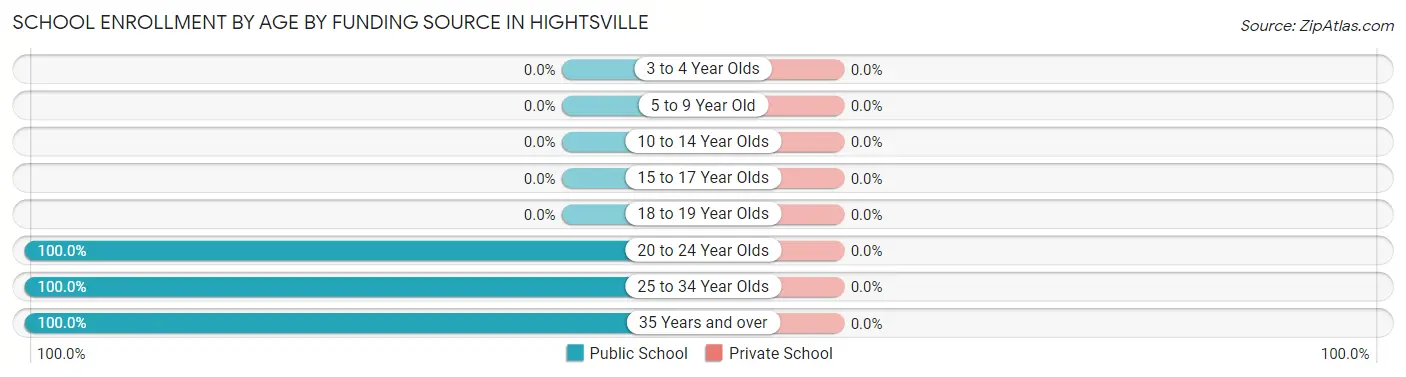
| Age Bracket | Public School | Private School |
| 3 to 4 Year Olds | 0 (0.0%) | 0 (0.0%) |
| 5 to 9 Year Old | 0 (0.0%) | 0 (0.0%) |
| 10 to 14 Year Olds | 0 (0.0%) | 0 (0.0%) |
| 15 to 17 Year Olds | 0 (0.0%) | 0 (0.0%) |
| 18 to 19 Year Olds | 0 (0.0%) | 0 (0.0%) |
| 20 to 24 Year Olds | 4 (100.0%) | 0 (0.0%) |
| 25 to 34 Year Olds | 10 (100.0%) | 0 (0.0%) |
| 35 Years and over | 18 (100.0%) | 0 (0.0%) |
| Total | 32 (100.0%) | 0 (0.0%) |
Educational Attainment by Field of Study in Hightsville
Education (74 | 74.0%), business (19 | 19.0%), literature & languages (5 | 5.0%), and psychology (2 | 2.0%) are the most common fields of study among 100 individuals in Hightsville who have obtained a bachelor's degree or higher.
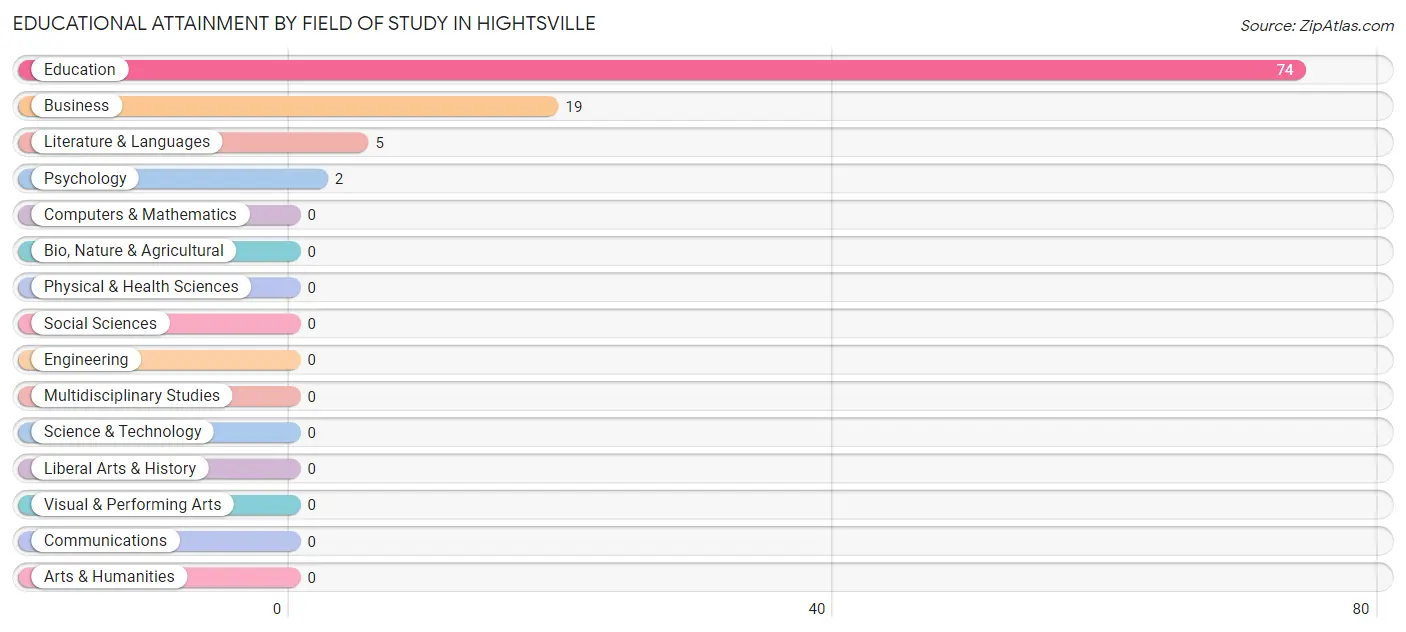
| Field of Study | # Graduates | % Graduates |
| Computers & Mathematics | 0 | 0.0% |
| Bio, Nature & Agricultural | 0 | 0.0% |
| Physical & Health Sciences | 0 | 0.0% |
| Psychology | 2 | 2.0% |
| Social Sciences | 0 | 0.0% |
| Engineering | 0 | 0.0% |
| Multidisciplinary Studies | 0 | 0.0% |
| Science & Technology | 0 | 0.0% |
| Business | 19 | 19.0% |
| Education | 74 | 74.0% |
| Literature & Languages | 5 | 5.0% |
| Liberal Arts & History | 0 | 0.0% |
| Visual & Performing Arts | 0 | 0.0% |
| Communications | 0 | 0.0% |
| Arts & Humanities | 0 | 0.0% |
| Total | 100 | 100.0% |
Transportation & Commute in Hightsville
Vehicle Availability by Sex in Hightsville
The most prevalent vehicle ownership categories in Hightsville are males with 1 vehicle (98, accounting for 100.0%) and females with 1 vehicle (29, making up 337.9%).
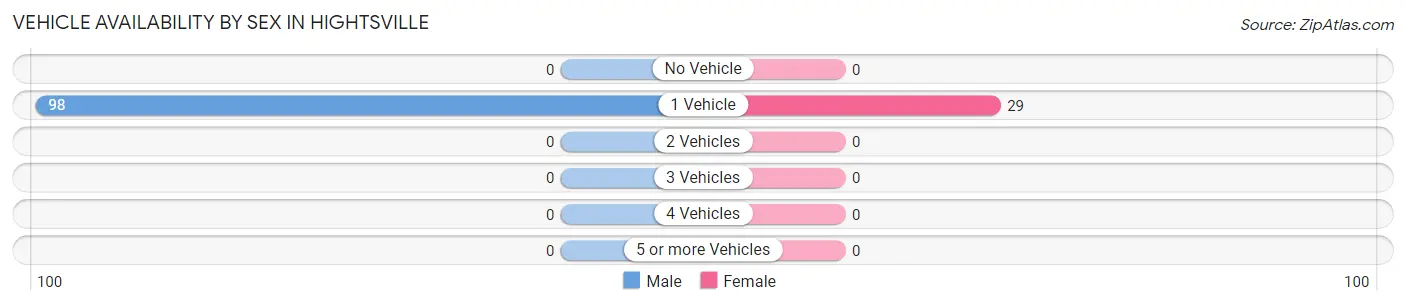
| Vehicles Available | Male | Female |
| No Vehicle | 0 (0.0%) | 0 (0.0%) |
| 1 Vehicle | 98 (100.0%) | 29 (100.0%) |
| 2 Vehicles | 0 (0.0%) | 0 (0.0%) |
| 3 Vehicles | 0 (0.0%) | 0 (0.0%) |
| 4 Vehicles | 0 (0.0%) | 0 (0.0%) |
| 5 or more Vehicles | 0 (0.0%) | 0 (0.0%) |
| Total | 98 (100.0%) | 29 (100.0%) |
Commute Time in Hightsville
The most frequently occuring commute durations in Hightsville are 20 to 24 minutes (64 commuters, 50.4%), 10 to 14 minutes (63 commuters, 49.6%), and less than 5 minutes (0 commuters, 0.0%).
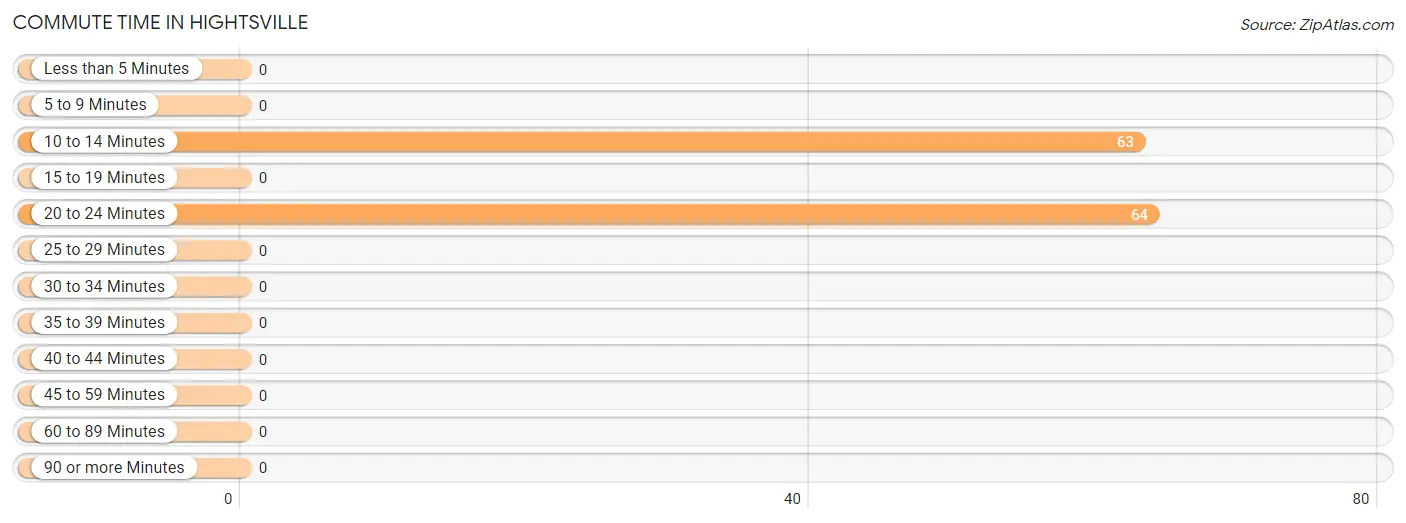
| Commute Time | # Commuters | % Commuters |
| Less than 5 Minutes | 0 | 0.0% |
| 5 to 9 Minutes | 0 | 0.0% |
| 10 to 14 Minutes | 63 | 49.6% |
| 15 to 19 Minutes | 0 | 0.0% |
| 20 to 24 Minutes | 64 | 50.4% |
| 25 to 29 Minutes | 0 | 0.0% |
| 30 to 34 Minutes | 0 | 0.0% |
| 35 to 39 Minutes | 0 | 0.0% |
| 40 to 44 Minutes | 0 | 0.0% |
| 45 to 59 Minutes | 0 | 0.0% |
| 60 to 89 Minutes | 0 | 0.0% |
| 90 or more Minutes | 0 | 0.0% |
Commute Time by Sex in Hightsville
The most common commute times in Hightsville are 10 to 14 minutes (63 commuters, 64.3%) for males and 20 to 24 minutes (29 commuters, 100.0%) for females.
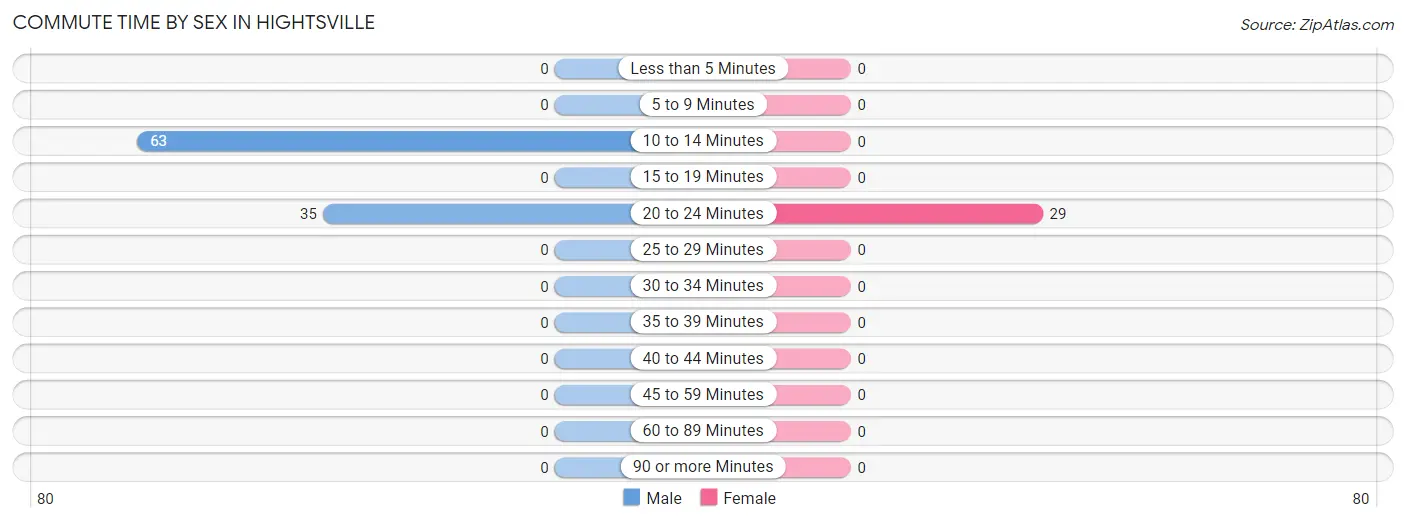
| Commute Time | Male | Female |
| Less than 5 Minutes | 0 (0.0%) | 0 (0.0%) |
| 5 to 9 Minutes | 0 (0.0%) | 0 (0.0%) |
| 10 to 14 Minutes | 63 (64.3%) | 0 (0.0%) |
| 15 to 19 Minutes | 0 (0.0%) | 0 (0.0%) |
| 20 to 24 Minutes | 35 (35.7%) | 29 (100.0%) |
| 25 to 29 Minutes | 0 (0.0%) | 0 (0.0%) |
| 30 to 34 Minutes | 0 (0.0%) | 0 (0.0%) |
| 35 to 39 Minutes | 0 (0.0%) | 0 (0.0%) |
| 40 to 44 Minutes | 0 (0.0%) | 0 (0.0%) |
| 45 to 59 Minutes | 0 (0.0%) | 0 (0.0%) |
| 60 to 89 Minutes | 0 (0.0%) | 0 (0.0%) |
| 90 or more Minutes | 0 (0.0%) | 0 (0.0%) |
Time of Departure to Work by Sex in Hightsville
The most frequent times of departure to work in Hightsville are 8:00 AM to 8:29 AM (63, 64.3%) for males and 4:00 PM to 11:59 PM (29, 100.0%) for females.
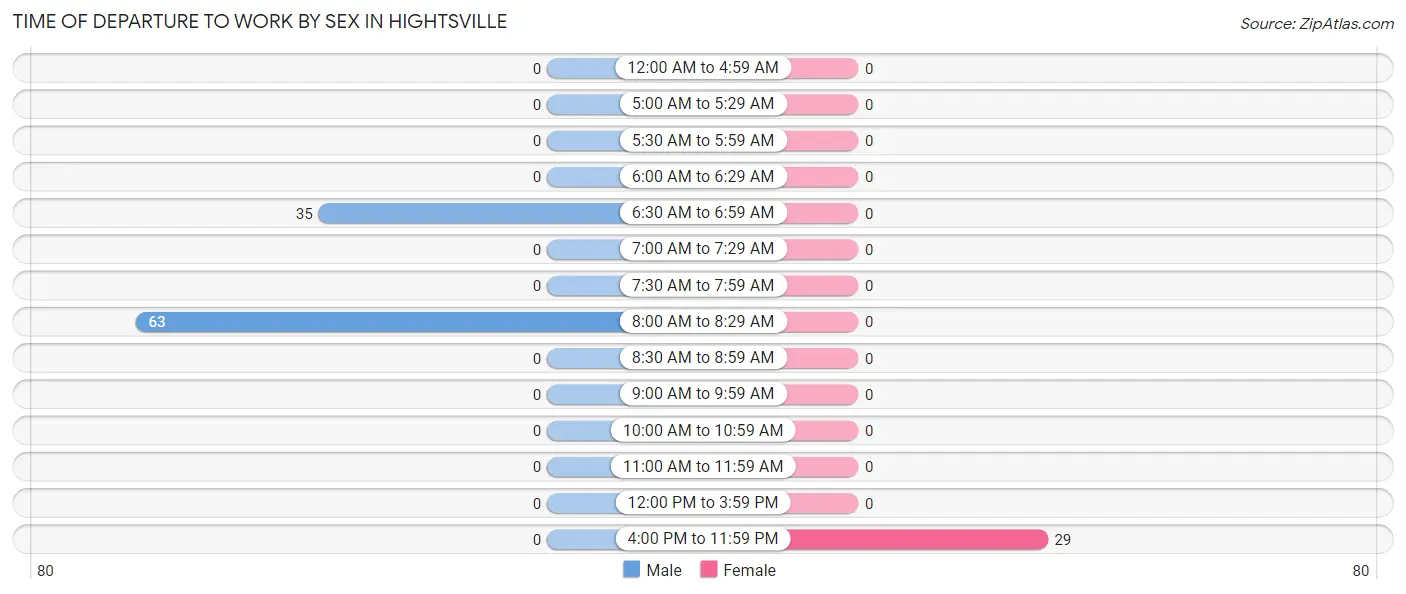
| Time of Departure | Male | Female |
| 12:00 AM to 4:59 AM | 0 (0.0%) | 0 (0.0%) |
| 5:00 AM to 5:29 AM | 0 (0.0%) | 0 (0.0%) |
| 5:30 AM to 5:59 AM | 0 (0.0%) | 0 (0.0%) |
| 6:00 AM to 6:29 AM | 0 (0.0%) | 0 (0.0%) |
| 6:30 AM to 6:59 AM | 35 (35.7%) | 0 (0.0%) |
| 7:00 AM to 7:29 AM | 0 (0.0%) | 0 (0.0%) |
| 7:30 AM to 7:59 AM | 0 (0.0%) | 0 (0.0%) |
| 8:00 AM to 8:29 AM | 63 (64.3%) | 0 (0.0%) |
| 8:30 AM to 8:59 AM | 0 (0.0%) | 0 (0.0%) |
| 9:00 AM to 9:59 AM | 0 (0.0%) | 0 (0.0%) |
| 10:00 AM to 10:59 AM | 0 (0.0%) | 0 (0.0%) |
| 11:00 AM to 11:59 AM | 0 (0.0%) | 0 (0.0%) |
| 12:00 PM to 3:59 PM | 0 (0.0%) | 0 (0.0%) |
| 4:00 PM to 11:59 PM | 0 (0.0%) | 29 (100.0%) |
| Total | 98 (100.0%) | 29 (100.0%) |
Housing Occupancy in Hightsville
Occupancy by Ownership in Hightsville
Of the total 208 dwellings in Hightsville, owner-occupied units account for 150 (72.1%), while renter-occupied units make up 58 (27.9%).
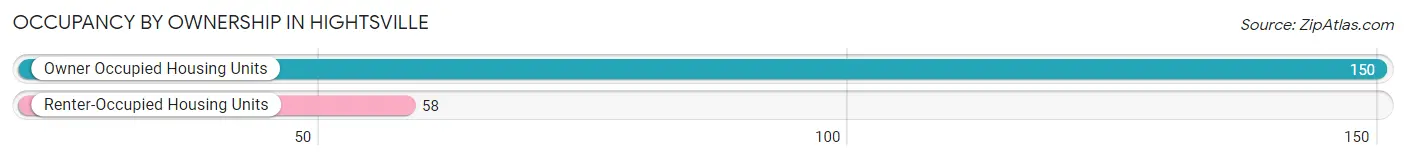
| Occupancy | # Housing Units | % Housing Units |
| Owner Occupied Housing Units | 150 | 72.1% |
| Renter-Occupied Housing Units | 58 | 27.9% |
| Total Occupied Housing Units | 208 | 100.0% |
Occupancy by Household Size in Hightsville
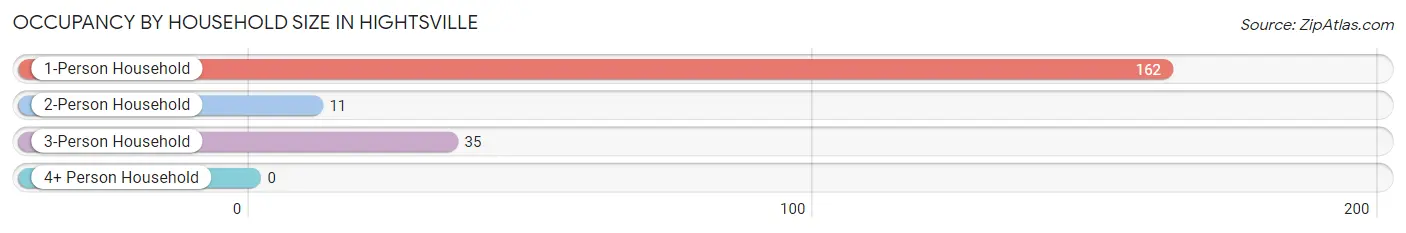
| Household Size | # Housing Units | % Housing Units |
| 1-Person Household | 162 | 77.9% |
| 2-Person Household | 11 | 5.3% |
| 3-Person Household | 35 | 16.8% |
| 4+ Person Household | 0 | 0.0% |
| Total Housing Units | 208 | 100.0% |
Occupancy by Ownership by Household Size in Hightsville
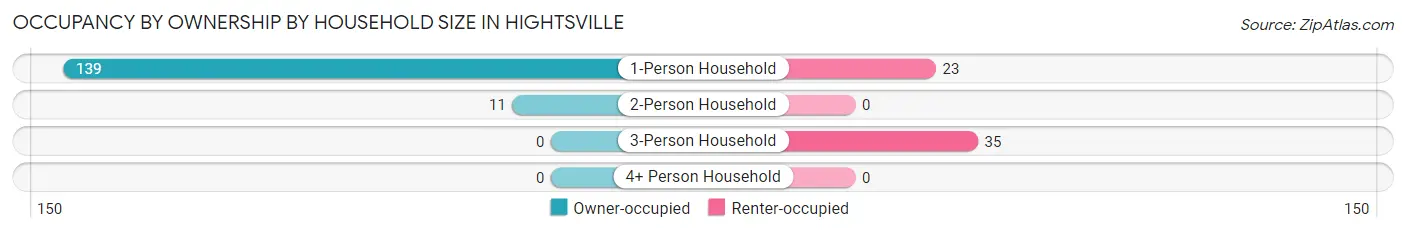
| Household Size | Owner-occupied | Renter-occupied |
| 1-Person Household | 139 (85.8%) | 23 (14.2%) |
| 2-Person Household | 11 (100.0%) | 0 (0.0%) |
| 3-Person Household | 0 (0.0%) | 35 (100.0%) |
| 4+ Person Household | 0 (0.0%) | 0 (0.0%) |
| Total Housing Units | 150 (72.1%) | 58 (27.9%) |
Occupancy by Educational Attainment in Hightsville
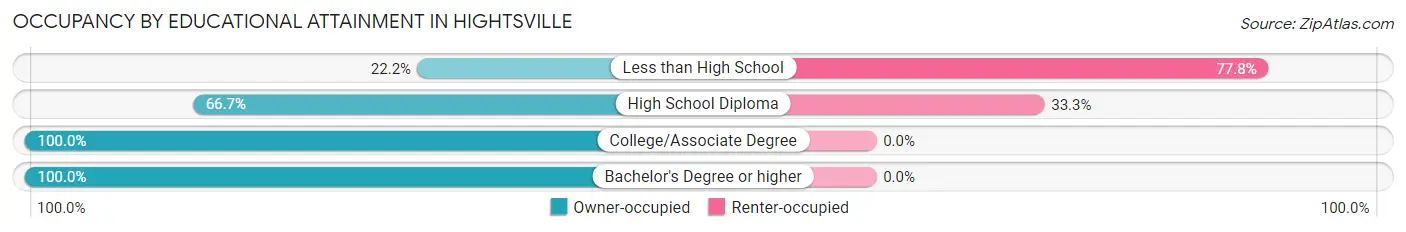
| Household Size | Owner-occupied | Renter-occupied |
| Less than High School | 10 (22.2%) | 35 (77.8%) |
| High School Diploma | 46 (66.7%) | 23 (33.3%) |
| College/Associate Degree | 20 (100.0%) | 0 (0.0%) |
| Bachelor's Degree or higher | 74 (100.0%) | 0 (0.0%) |
Occupancy by Age of Householder in Hightsville
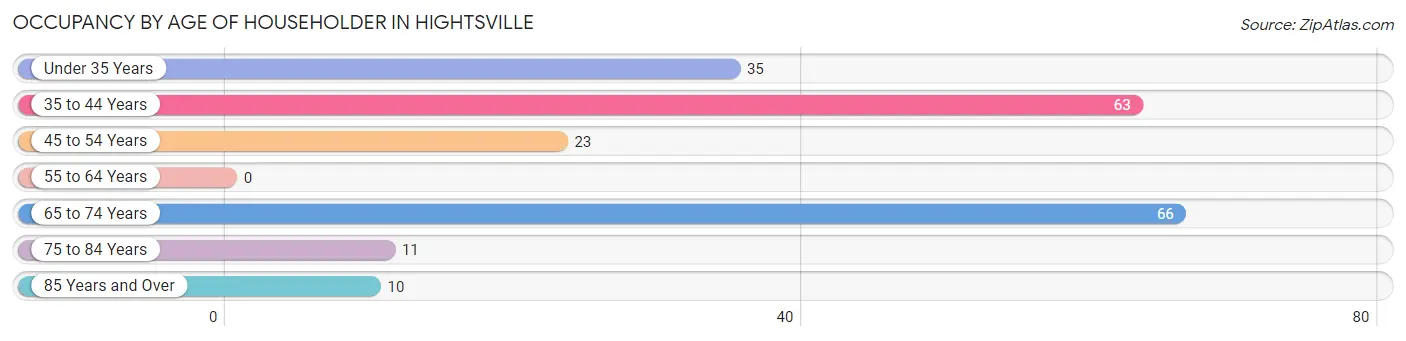
| Age Bracket | # Households | % Households |
| Under 35 Years | 35 | 16.8% |
| 35 to 44 Years | 63 | 30.3% |
| 45 to 54 Years | 23 | 11.1% |
| 55 to 64 Years | 0 | 0.0% |
| 65 to 74 Years | 66 | 31.7% |
| 75 to 84 Years | 11 | 5.3% |
| 85 Years and Over | 10 | 4.8% |
| Total | 208 | 100.0% |
Housing Finances in Hightsville
Median Income by Occupancy in Hightsville
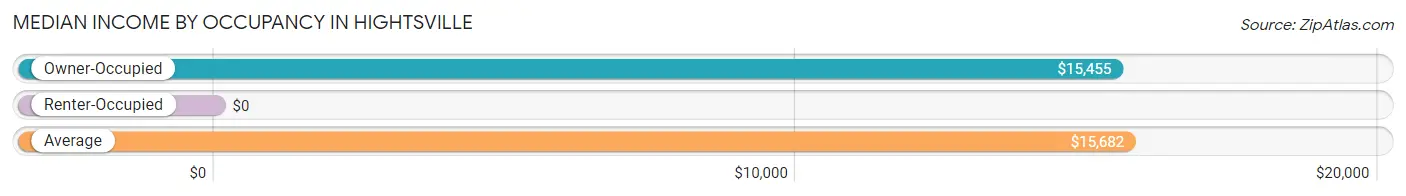
| Occupancy Type | # Households | Median Income |
| Owner-Occupied | 150 (72.1%) | $15,455 |
| Renter-Occupied | 58 (27.9%) | $0 |
| Average | 208 (100.0%) | $15,682 |
Occupancy by Householder Income Bracket in Hightsville
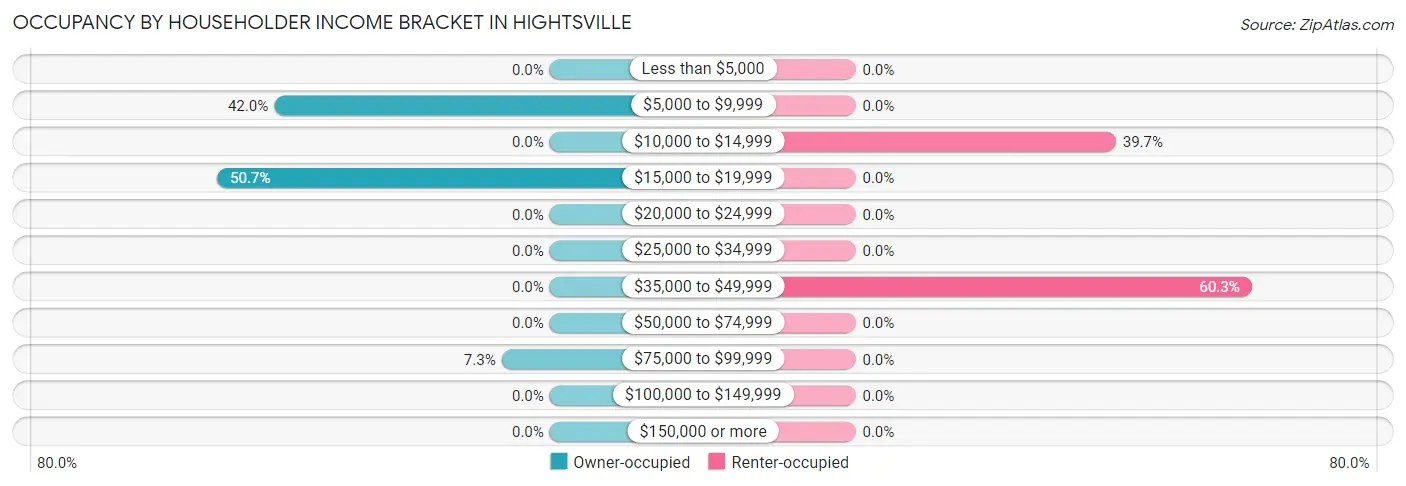
| Income Bracket | Owner-occupied | Renter-occupied |
| Less than $5,000 | 0 (0.0%) | 0 (0.0%) |
| $5,000 to $9,999 | 63 (42.0%) | 0 (0.0%) |
| $10,000 to $14,999 | 0 (0.0%) | 23 (39.7%) |
| $15,000 to $19,999 | 76 (50.7%) | 0 (0.0%) |
| $20,000 to $24,999 | 0 (0.0%) | 0 (0.0%) |
| $25,000 to $34,999 | 0 (0.0%) | 0 (0.0%) |
| $35,000 to $49,999 | 0 (0.0%) | 35 (60.3%) |
| $50,000 to $74,999 | 0 (0.0%) | 0 (0.0%) |
| $75,000 to $99,999 | 11 (7.3%) | 0 (0.0%) |
| $100,000 to $149,999 | 0 (0.0%) | 0 (0.0%) |
| $150,000 or more | 0 (0.0%) | 0 (0.0%) |
| Total | 150 (100.0%) | 58 (100.0%) |
Monthly Housing Cost Tiers in Hightsville
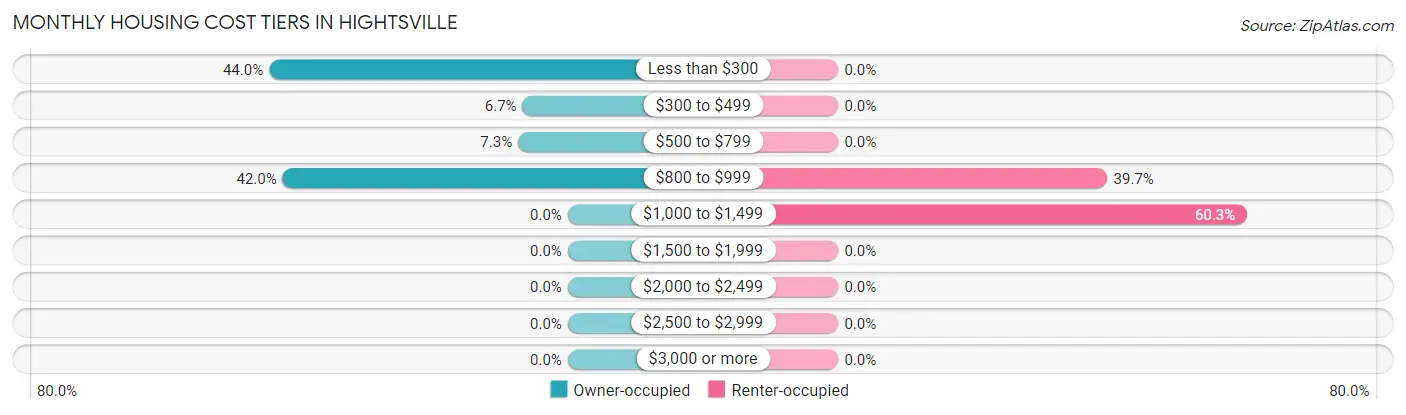
| Monthly Cost | Owner-occupied | Renter-occupied |
| Less than $300 | 66 (44.0%) | 0 (0.0%) |
| $300 to $499 | 10 (6.7%) | 0 (0.0%) |
| $500 to $799 | 11 (7.3%) | 0 (0.0%) |
| $800 to $999 | 63 (42.0%) | 23 (39.7%) |
| $1,000 to $1,499 | 0 (0.0%) | 35 (60.3%) |
| $1,500 to $1,999 | 0 (0.0%) | 0 (0.0%) |
| $2,000 to $2,499 | 0 (0.0%) | 0 (0.0%) |
| $2,500 to $2,999 | 0 (0.0%) | 0 (0.0%) |
| $3,000 or more | 0 (0.0%) | 0 (0.0%) |
| Total | 150 (100.0%) | 58 (100.0%) |
Physical Housing Characteristics in Hightsville
Housing Structures in Hightsville
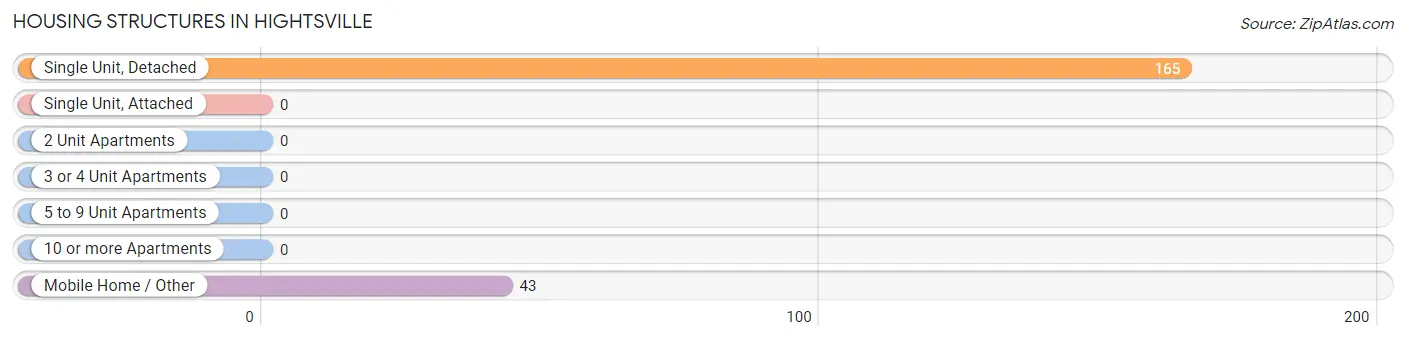
| Structure Type | # Housing Units | % Housing Units |
| Single Unit, Detached | 165 | 79.3% |
| Single Unit, Attached | 0 | 0.0% |
| 2 Unit Apartments | 0 | 0.0% |
| 3 or 4 Unit Apartments | 0 | 0.0% |
| 5 to 9 Unit Apartments | 0 | 0.0% |
| 10 or more Apartments | 0 | 0.0% |
| Mobile Home / Other | 43 | 20.7% |
| Total | 208 | 100.0% |
Housing Structures by Occupancy in Hightsville
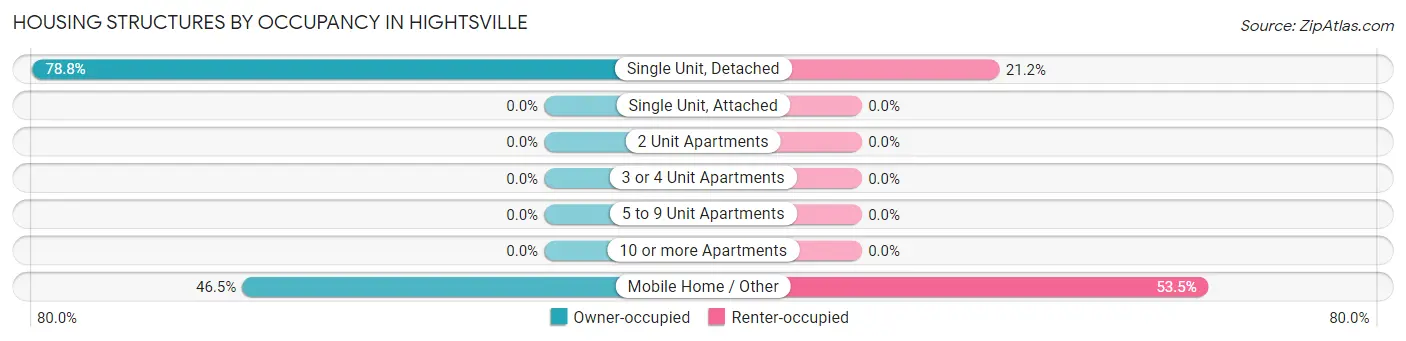
| Structure Type | Owner-occupied | Renter-occupied |
| Single Unit, Detached | 130 (78.8%) | 35 (21.2%) |
| Single Unit, Attached | 0 (0.0%) | 0 (0.0%) |
| 2 Unit Apartments | 0 (0.0%) | 0 (0.0%) |
| 3 or 4 Unit Apartments | 0 (0.0%) | 0 (0.0%) |
| 5 to 9 Unit Apartments | 0 (0.0%) | 0 (0.0%) |
| 10 or more Apartments | 0 (0.0%) | 0 (0.0%) |
| Mobile Home / Other | 20 (46.5%) | 23 (53.5%) |
| Total | 150 (72.1%) | 58 (27.9%) |
Housing Structures by Number of Rooms in Hightsville
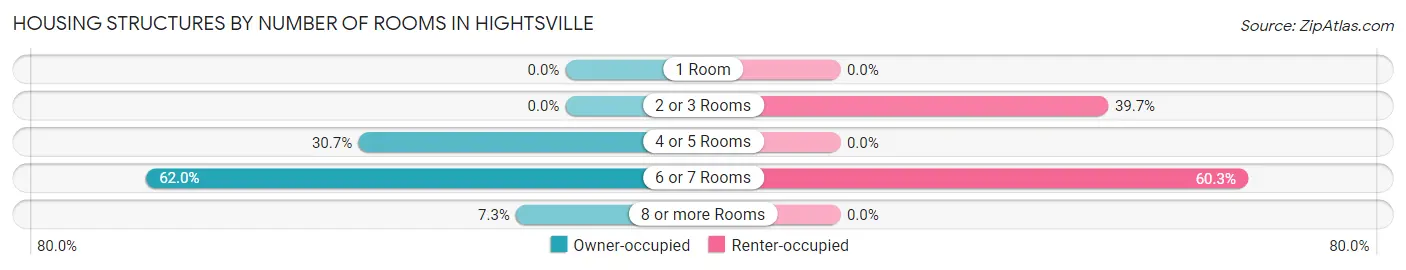
| Number of Rooms | Owner-occupied | Renter-occupied |
| 1 Room | 0 (0.0%) | 0 (0.0%) |
| 2 or 3 Rooms | 0 (0.0%) | 23 (39.7%) |
| 4 or 5 Rooms | 46 (30.7%) | 0 (0.0%) |
| 6 or 7 Rooms | 93 (62.0%) | 35 (60.3%) |
| 8 or more Rooms | 11 (7.3%) | 0 (0.0%) |
| Total | 150 (100.0%) | 58 (100.0%) |
Housing Structure by Heating Type in Hightsville
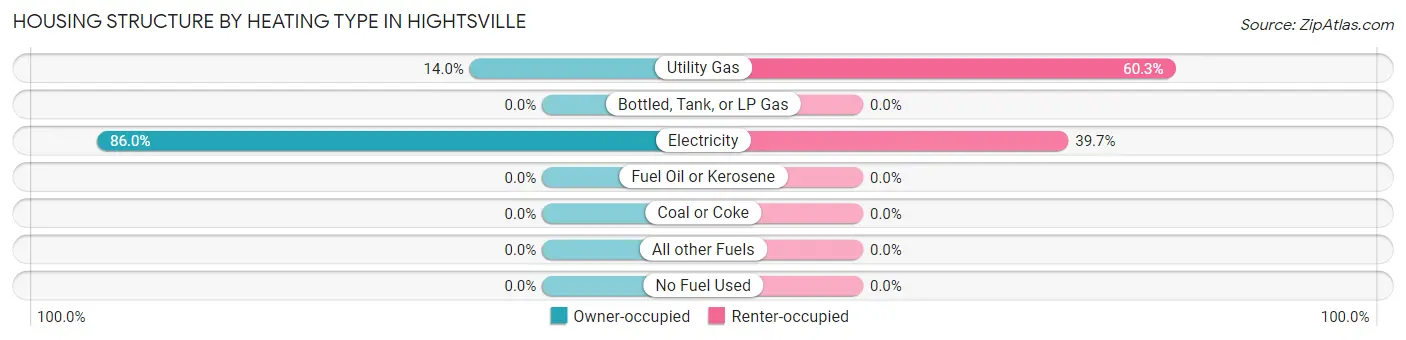
| Heating Type | Owner-occupied | Renter-occupied |
| Utility Gas | 21 (14.0%) | 35 (60.3%) |
| Bottled, Tank, or LP Gas | 0 (0.0%) | 0 (0.0%) |
| Electricity | 129 (86.0%) | 23 (39.7%) |
| Fuel Oil or Kerosene | 0 (0.0%) | 0 (0.0%) |
| Coal or Coke | 0 (0.0%) | 0 (0.0%) |
| All other Fuels | 0 (0.0%) | 0 (0.0%) |
| No Fuel Used | 0 (0.0%) | 0 (0.0%) |
| Total | 150 (100.0%) | 58 (100.0%) |
Household Vehicle Usage in Hightsville
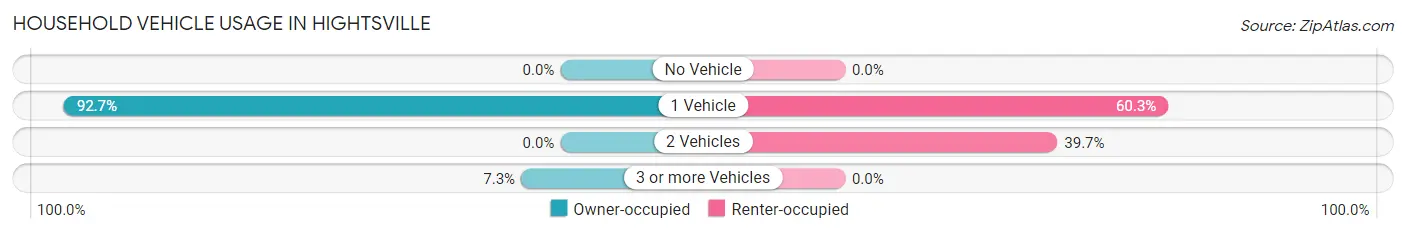
| Vehicles per Household | Owner-occupied | Renter-occupied |
| No Vehicle | 0 (0.0%) | 0 (0.0%) |
| 1 Vehicle | 139 (92.7%) | 35 (60.3%) |
| 2 Vehicles | 0 (0.0%) | 23 (39.7%) |
| 3 or more Vehicles | 11 (7.3%) | 0 (0.0%) |
| Total | 150 (100.0%) | 58 (100.0%) |
Real Estate & Mortgages in Hightsville
Real Estate and Mortgage Overview in Hightsville
| Characteristic | Without Mortgage | With Mortgage |
| Housing Units | 87 | 63 |
| Median Property Value | - | - |
| Median Household Income | - | - |
| Monthly Housing Costs | $247 | $0 |
| Real Estate Taxes | - | - |
Property Value by Mortgage Status in Hightsville
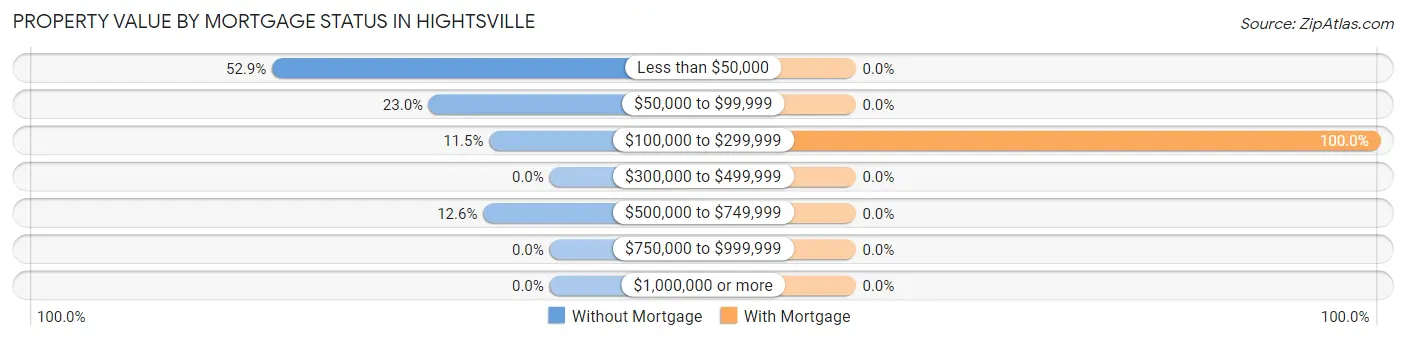
| Property Value | Without Mortgage | With Mortgage |
| Less than $50,000 | 46 (52.9%) | 0 (0.0%) |
| $50,000 to $99,999 | 20 (23.0%) | 0 (0.0%) |
| $100,000 to $299,999 | 10 (11.5%) | 63 (100.0%) |
| $300,000 to $499,999 | 0 (0.0%) | 0 (0.0%) |
| $500,000 to $749,999 | 11 (12.6%) | 0 (0.0%) |
| $750,000 to $999,999 | 0 (0.0%) | 0 (0.0%) |
| $1,000,000 or more | 0 (0.0%) | 0 (0.0%) |
| Total | 87 (100.0%) | 63 (100.0%) |
Household Income by Mortgage Status in Hightsville
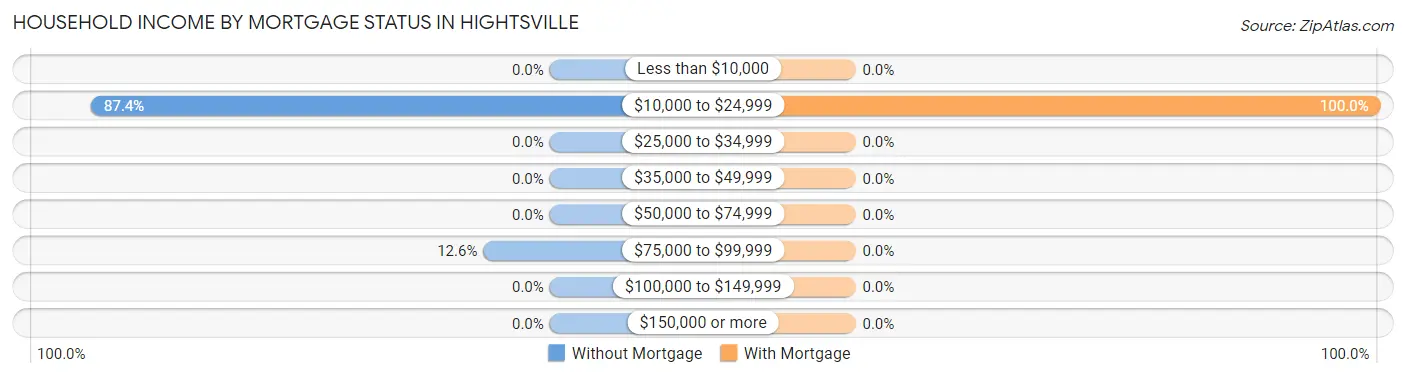
| Household Income | Without Mortgage | With Mortgage |
| Less than $10,000 | 0 (0.0%) | 0 (0.0%) |
| $10,000 to $24,999 | 76 (87.4%) | 63 (100.0%) |
| $25,000 to $34,999 | 0 (0.0%) | 0 (0.0%) |
| $35,000 to $49,999 | 0 (0.0%) | 0 (0.0%) |
| $50,000 to $74,999 | 0 (0.0%) | 0 (0.0%) |
| $75,000 to $99,999 | 11 (12.6%) | 0 (0.0%) |
| $100,000 to $149,999 | 0 (0.0%) | 0 (0.0%) |
| $150,000 or more | 0 (0.0%) | 0 (0.0%) |
| Total | 87 (100.0%) | 63 (100.0%) |
Property Value to Household Income Ratio in Hightsville
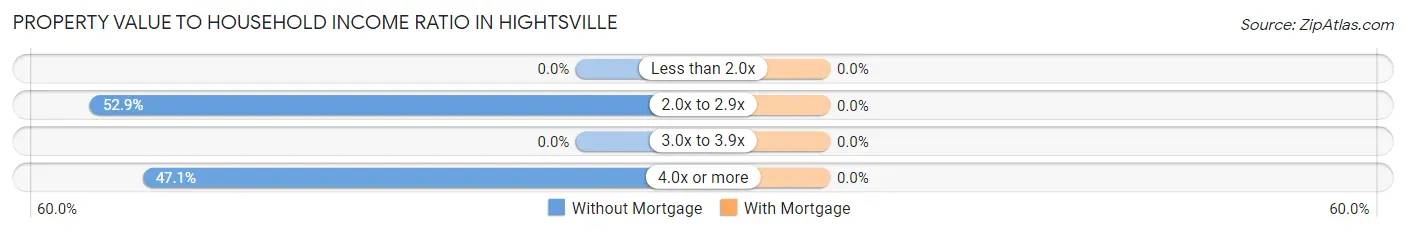
| Value-to-Income Ratio | Without Mortgage | With Mortgage |
| Less than 2.0x | 0 (0.0%) | 0 (0.0%) |
| 2.0x to 2.9x | 46 (52.9%) | 0 (0.0%) |
| 3.0x to 3.9x | 0 (0.0%) | 0 (0.0%) |
| 4.0x or more | 41 (47.1%) | 0 (0.0%) |
| Total | 87 (100.0%) | 63 (100.0%) |
Real Estate Taxes by Mortgage Status in Hightsville
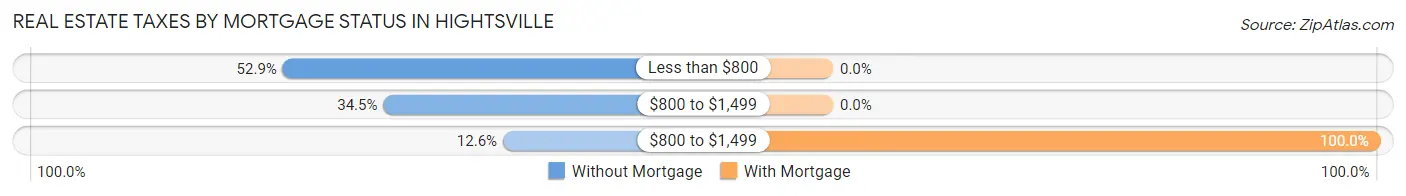
| Property Taxes | Without Mortgage | With Mortgage |
| Less than $800 | 46 (52.9%) | 0 (0.0%) |
| $800 to $1,499 | 30 (34.5%) | 0 (0.0%) |
| $800 to $1,499 | 11 (12.6%) | 63 (100.0%) |
| Total | 87 (100.0%) | 63 (100.0%) |
Health & Disability in Hightsville
Health Insurance Coverage by Age in Hightsville
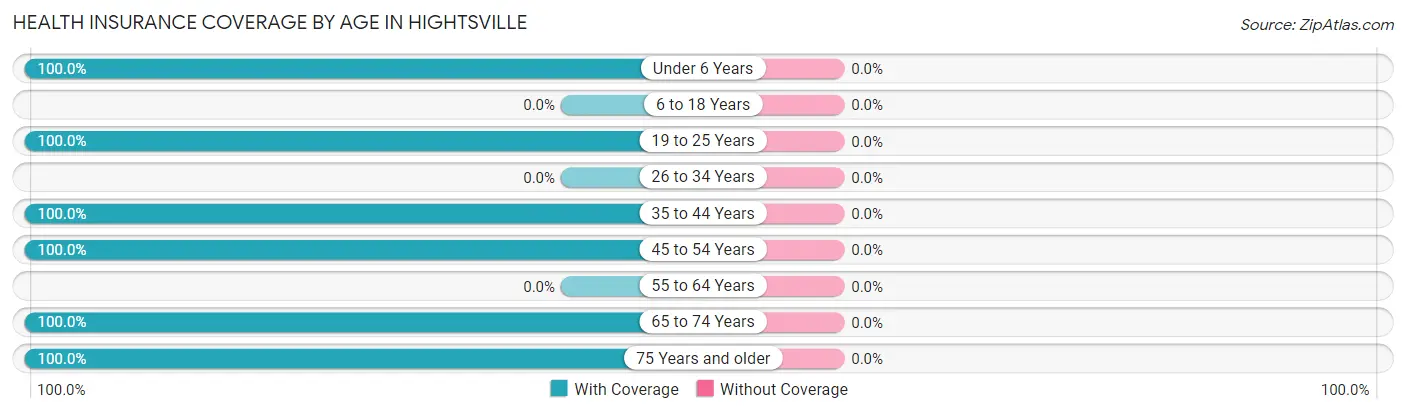
| Age Bracket | With Coverage | Without Coverage |
| Under 6 Years | 27 (100.0%) | 0 (0.0%) |
| 6 to 18 Years | 0 (0.0%) | 0 (0.0%) |
| 19 to 25 Years | 64 (100.0%) | 0 (0.0%) |
| 26 to 34 Years | 0 (0.0%) | 0 (0.0%) |
| 35 to 44 Years | 63 (100.0%) | 0 (0.0%) |
| 45 to 54 Years | 23 (100.0%) | 0 (0.0%) |
| 55 to 64 Years | 0 (0.0%) | 0 (0.0%) |
| 65 to 74 Years | 66 (100.0%) | 0 (0.0%) |
| 75 Years and older | 32 (100.0%) | 0 (0.0%) |
| Total | 275 (100.0%) | 0 (0.0%) |
Health Insurance Coverage by Citizenship Status in Hightsville
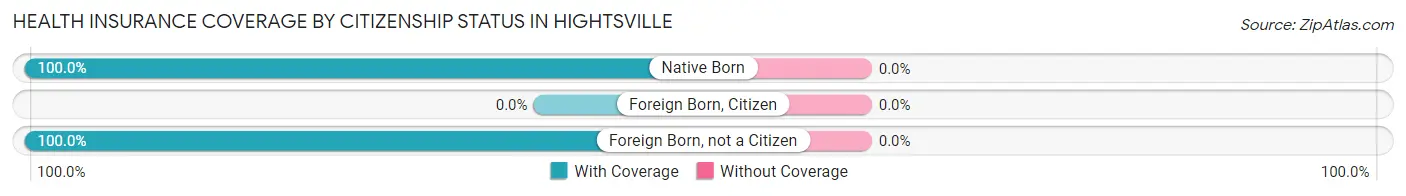
| Citizenship Status | With Coverage | Without Coverage |
| Native Born | 27 (100.0%) | 0 (0.0%) |
| Foreign Born, Citizen | 0 (0.0%) | 0 (0.0%) |
| Foreign Born, not a Citizen | 64 (100.0%) | 0 (0.0%) |
Health Insurance Coverage by Household Income in Hightsville
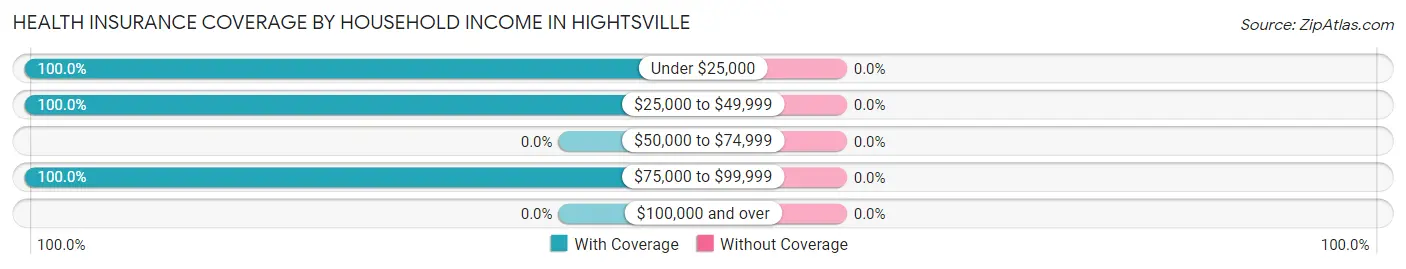
| Household Income | With Coverage | Without Coverage |
| Under $25,000 | 162 (100.0%) | 0 (0.0%) |
| $25,000 to $49,999 | 91 (100.0%) | 0 (0.0%) |
| $50,000 to $74,999 | 0 (0.0%) | 0 (0.0%) |
| $75,000 to $99,999 | 22 (100.0%) | 0 (0.0%) |
| $100,000 and over | 0 (0.0%) | 0 (0.0%) |
Public vs Private Health Insurance Coverage by Age in Hightsville
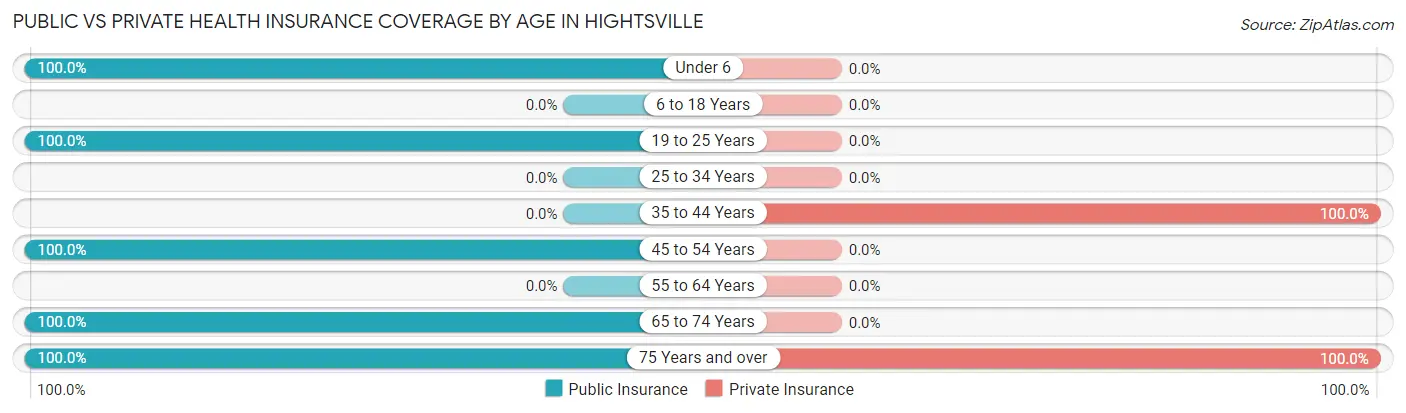
| Age Bracket | Public Insurance | Private Insurance |
| Under 6 | 27 (100.0%) | 0 (0.0%) |
| 6 to 18 Years | 0 (0.0%) | 0 (0.0%) |
| 19 to 25 Years | 64 (100.0%) | 0 (0.0%) |
| 25 to 34 Years | 0 (0.0%) | 0 (0.0%) |
| 35 to 44 Years | 0 (0.0%) | 63 (100.0%) |
| 45 to 54 Years | 23 (100.0%) | 0 (0.0%) |
| 55 to 64 Years | 0 (0.0%) | 0 (0.0%) |
| 65 to 74 Years | 66 (100.0%) | 0 (0.0%) |
| 75 Years and over | 32 (100.0%) | 32 (100.0%) |
| Total | 212 (77.1%) | 95 (34.5%) |
Disability Status by Sex by Age in Hightsville
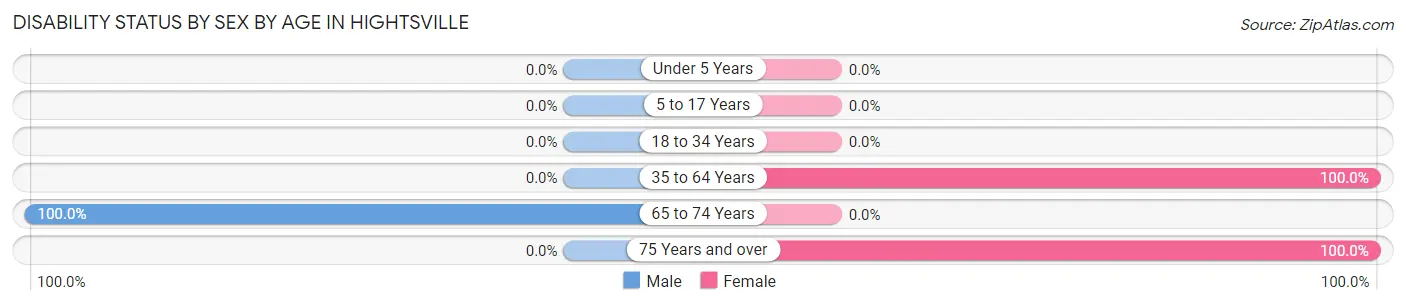
| Age Bracket | Male | Female |
| Under 5 Years | 0 (0.0%) | 0 (0.0%) |
| 5 to 17 Years | 0 (0.0%) | 0 (0.0%) |
| 18 to 34 Years | 0 (0.0%) | 0 (0.0%) |
| 35 to 64 Years | 0 (0.0%) | 23 (100.0%) |
| 65 to 74 Years | 46 (100.0%) | 0 (0.0%) |
| 75 Years and over | 0 (0.0%) | 21 (100.0%) |
Disability Class by Sex by Age in Hightsville
Disability Class: Hearing Difficulty
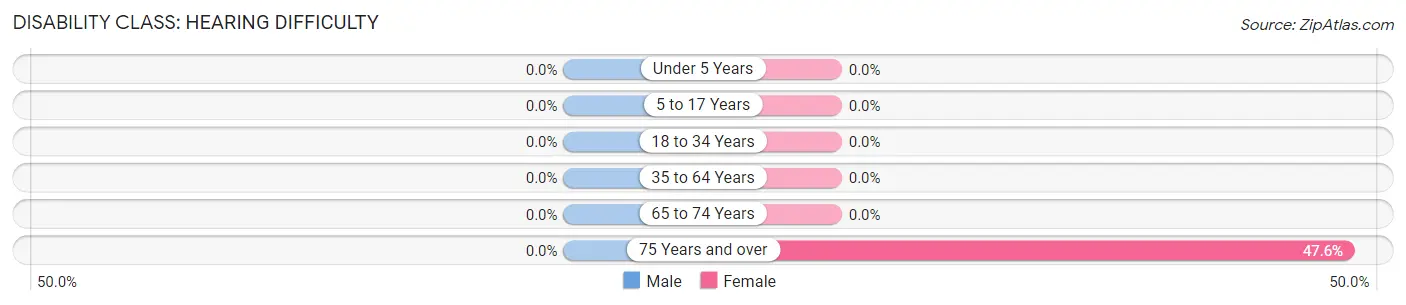
| Age Bracket | Male | Female |
| Under 5 Years | 0 (0.0%) | 0 (0.0%) |
| 5 to 17 Years | 0 (0.0%) | 0 (0.0%) |
| 18 to 34 Years | 0 (0.0%) | 0 (0.0%) |
| 35 to 64 Years | 0 (0.0%) | 0 (0.0%) |
| 65 to 74 Years | 0 (0.0%) | 0 (0.0%) |
| 75 Years and over | 0 (0.0%) | 10 (47.6%) |
Disability Class: Vision Difficulty
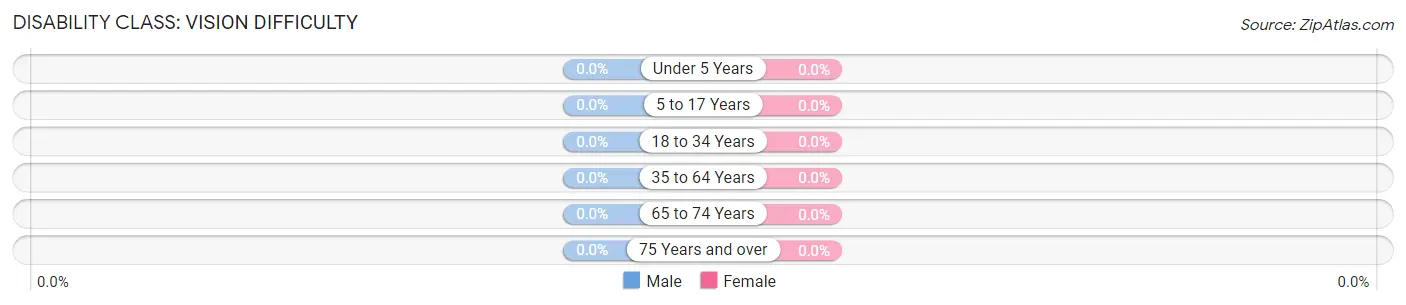
| Age Bracket | Male | Female |
| Under 5 Years | 0 (0.0%) | 0 (0.0%) |
| 5 to 17 Years | 0 (0.0%) | 0 (0.0%) |
| 18 to 34 Years | 0 (0.0%) | 0 (0.0%) |
| 35 to 64 Years | 0 (0.0%) | 0 (0.0%) |
| 65 to 74 Years | 0 (0.0%) | 0 (0.0%) |
| 75 Years and over | 0 (0.0%) | 0 (0.0%) |
Disability Class: Cognitive Difficulty
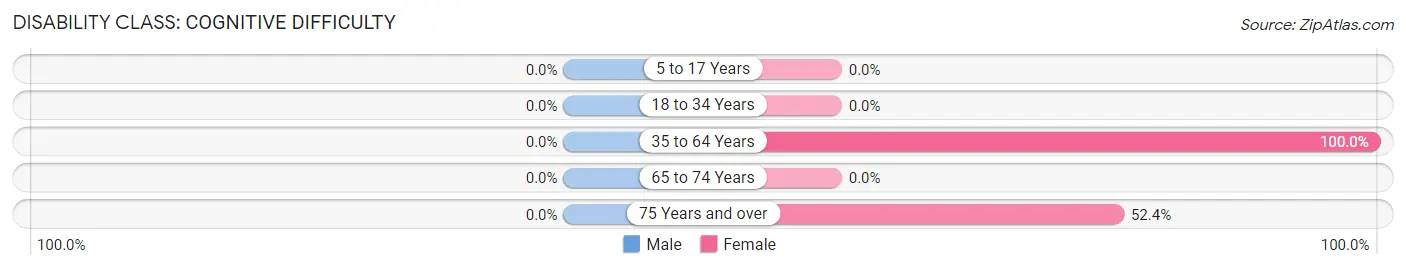
| Age Bracket | Male | Female |
| 5 to 17 Years | 0 (0.0%) | 0 (0.0%) |
| 18 to 34 Years | 0 (0.0%) | 0 (0.0%) |
| 35 to 64 Years | 0 (0.0%) | 23 (100.0%) |
| 65 to 74 Years | 0 (0.0%) | 0 (0.0%) |
| 75 Years and over | 0 (0.0%) | 11 (52.4%) |
Disability Class: Ambulatory Difficulty
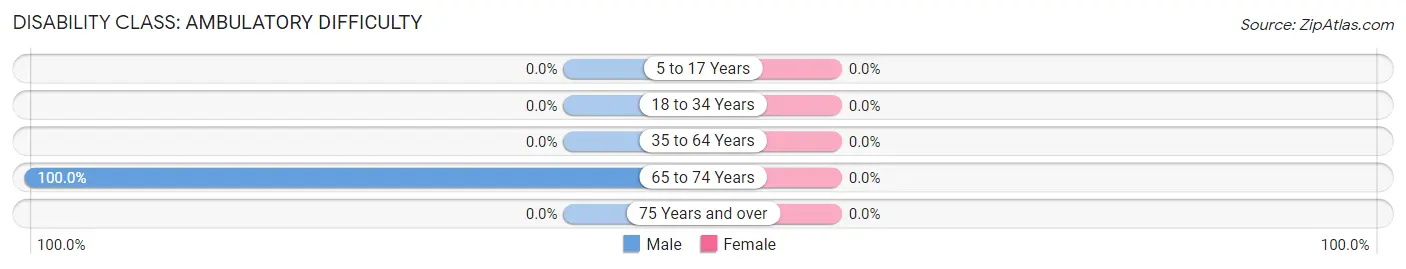
| Age Bracket | Male | Female |
| 5 to 17 Years | 0 (0.0%) | 0 (0.0%) |
| 18 to 34 Years | 0 (0.0%) | 0 (0.0%) |
| 35 to 64 Years | 0 (0.0%) | 0 (0.0%) |
| 65 to 74 Years | 46 (100.0%) | 0 (0.0%) |
| 75 Years and over | 0 (0.0%) | 0 (0.0%) |
Disability Class: Self-Care Difficulty
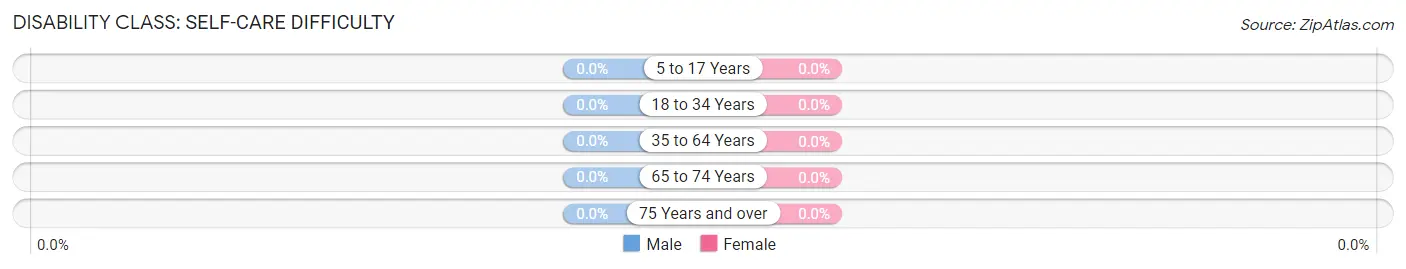
| Age Bracket | Male | Female |
| 5 to 17 Years | 0 (0.0%) | 0 (0.0%) |
| 18 to 34 Years | 0 (0.0%) | 0 (0.0%) |
| 35 to 64 Years | 0 (0.0%) | 0 (0.0%) |
| 65 to 74 Years | 0 (0.0%) | 0 (0.0%) |
| 75 Years and over | 0 (0.0%) | 0 (0.0%) |
Technology Access in Hightsville
Computing Device Access in Hightsville
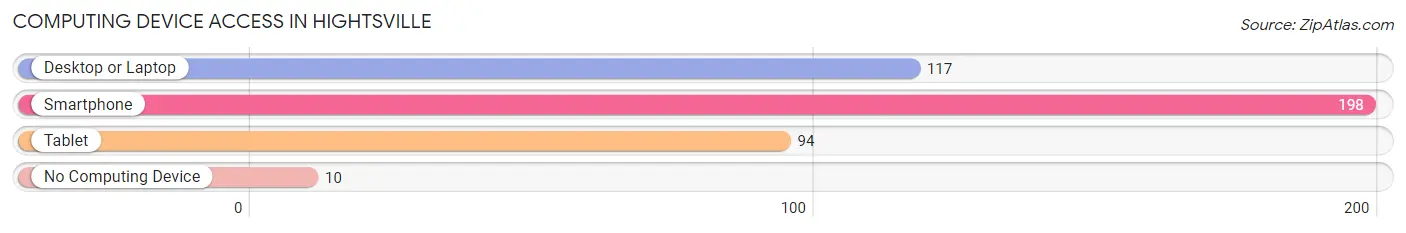
| Device Type | # Households | % Households |
| Desktop or Laptop | 117 | 56.2% |
| Smartphone | 198 | 95.2% |
| Tablet | 94 | 45.2% |
| No Computing Device | 10 | 4.8% |
| Total | 208 | 100.0% |
Internet Access in Hightsville
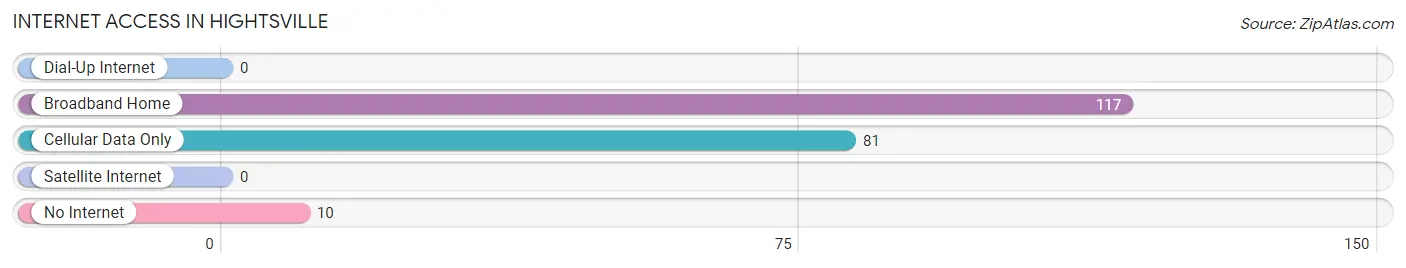
| Internet Type | # Households | % Households |
| Dial-Up Internet | 0 | 0.0% |
| Broadband Home | 117 | 56.2% |
| Cellular Data Only | 81 | 38.9% |
| Satellite Internet | 0 | 0.0% |
| No Internet | 10 | 4.8% |
| Total | 208 | 100.0% |
Hightsville Summary
Hightsville is a small town located in North Carolina, United States. It is situated in the northern part of the state, in the foothills of the Blue Ridge Mountains. The town is located in Caswell County, and is part of the Burlington-Graham Metropolitan Statistical Area. The population of Hightsville was estimated to be 1,845 in 2019.
Geography
Hightsville is located in the northern part of North Carolina, in the foothills of the Blue Ridge Mountains. The town is situated in Caswell County, and is part of the Burlington-Graham Metropolitan Statistical Area. The town is located at an elevation of 845 feet above sea level. The town is located near the Haw River, which flows through the area. The town is also located near the border of Virginia.
The climate in Hightsville is classified as humid subtropical, with hot and humid summers and mild winters. The average annual temperature is around 61°F, with an average high of around 79°F in the summer and an average low of around 43°F in the winter. The average annual precipitation is around 44 inches.
History
Hightsville was founded in 1845 by William Hight, who was a local farmer. The town was originally known as Hightstown, but the name was changed to Hightsville in 1851. The town was incorporated in 1871.
The town was a center of the textile industry in the late 19th and early 20th centuries. The town was home to several cotton mills, which provided employment for many of the town's residents. The town also had a railroad station, which connected it to other towns in the area.
The town was also home to several schools, including Hightsville High School, which was established in 1891. The school was closed in the 1970s, but the building still stands today.
Economy
The economy of Hightsville is largely based on agriculture and manufacturing. The town is home to several farms, which produce a variety of crops, including corn, soybeans, and tobacco. The town is also home to several manufacturing companies, which produce a variety of products, including furniture, textiles, and automotive parts.
The town is also home to several retail stores, restaurants, and other businesses. The town is also home to several churches, which provide services to the community.
Demographics
The population of Hightsville was estimated to be 1,845 in 2019. The town has a population that is predominantly white, with a small percentage of African Americans and other races. The median household income in the town is around $37,000, and the median home value is around $130,000. The town has a poverty rate of around 15%, which is higher than the national average.
Conclusion
Hightsville is a small town located in North Carolina, United States. It is situated in the northern part of the state, in the foothills of the Blue Ridge Mountains. The town is located in Caswell County, and is part of the Burlington-Graham Metropolitan Statistical Area. The population of Hightsville was estimated to be 1,845 in 2019. The town has a predominantly white population, with a small percentage of African Americans and other races. The economy of Hightsville is largely based on agriculture and manufacturing. The town is home to several farms, which produce a variety of crops, and several manufacturing companies, which produce a variety of products. The town is also home to several retail stores, restaurants, and other businesses. The median household income in the town is around $37,000, and the median home value is around $130,000.
Common Questions
What is Per Capita Income in Hightsville?
Per Capita income in Hightsville is $36,458.
What is the Median Household income in Hightsville?
Median Household Income in Hightsville is $15,682.
What is Inequality or Gini Index in Hightsville?
Inequality or Gini Index in Hightsville is 0.38.
What is the Total Population of Hightsville?
Total Population of Hightsville is 750.
What is the Total Male Population of Hightsville?
Total Male Population of Hightsville is 657.
What is the Total Female Population of Hightsville?
Total Female Population of Hightsville is 93.
What is the Ratio of Males per 100 Females in Hightsville?
There are 706.45 Males per 100 Females in Hightsville.
What is the Ratio of Females per 100 Males in Hightsville?
There are 14.16 Females per 100 Males in Hightsville.
What is the Median Population Age in Hightsville?
Median Population Age in Hightsville is 41.3 Years.
What is the Average Family Size in Hightsville
Average Family Size in Hightsville is 1.8 People.
What is the Average Household Size in Hightsville
Average Household Size in Hightsville is 1.3 People.
How Large is the Labor Force in Hightsville?
There are 127 People in the Labor Forcein in Hightsville.
What is the Percentage of People in the Labor Force in Hightsville?
17.6% of People are in the Labor Force in Hightsville.