Keener, NC Map & Demographics
Keener Map
Keener Overview
$28,981
PER CAPITA INCOME
$36,798
AVG FAMILY INCOME
$40,347
AVG HOUSEHOLD INCOME
0.25
INEQUALITY / GINI INDEX
237
TOTAL POPULATION
42
MALE POPULATION
195
FEMALE POPULATION
21.54
MALES / 100 FEMALES
464.29
FEMALES / 100 MALES
29.7
MEDIAN AGE
2.2
AVG FAMILY SIZE
1.7
AVG HOUSEHOLD SIZE
93
LABOR FORCE [ PEOPLE ]
59.6%
PERCENT IN LABOR FORCE
Income in Keener
Income Overview in Keener
Per Capita Income in Keener is $28,981, while median incomes of families and households are $36,798 and $40,347 respectively.
| Characteristic | Number | Measure |
| Per Capita Income | 237 | $28,981 |
| Median Family Income | 82 | $36,798 |
| Mean Family Income | 82 | $58,282 |
| Median Household Income | 137 | $40,347 |
| Mean Household Income | 137 | $51,867 |
| Income Deficit | 82 | $0 |
| Wage / Income Gap (%) | 237 | 0.00% |
| Wage / Income Gap ($) | 237 | 100.00¢ per $1 |
| Gini / Inequality Index | 237 | 0.25 |
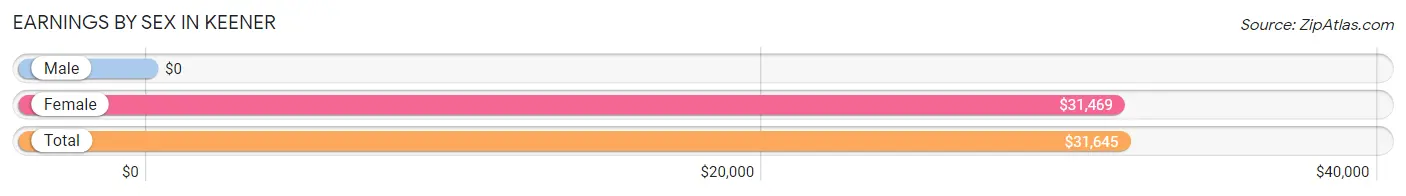
Earnings by Sex in Keener
| Sex | Number | Average Earnings |
| Male | 8 (7.2%) | $0 |
| Female | 103 (92.8%) | $31,469 |
| Total | 111 (100.0%) | $31,645 |
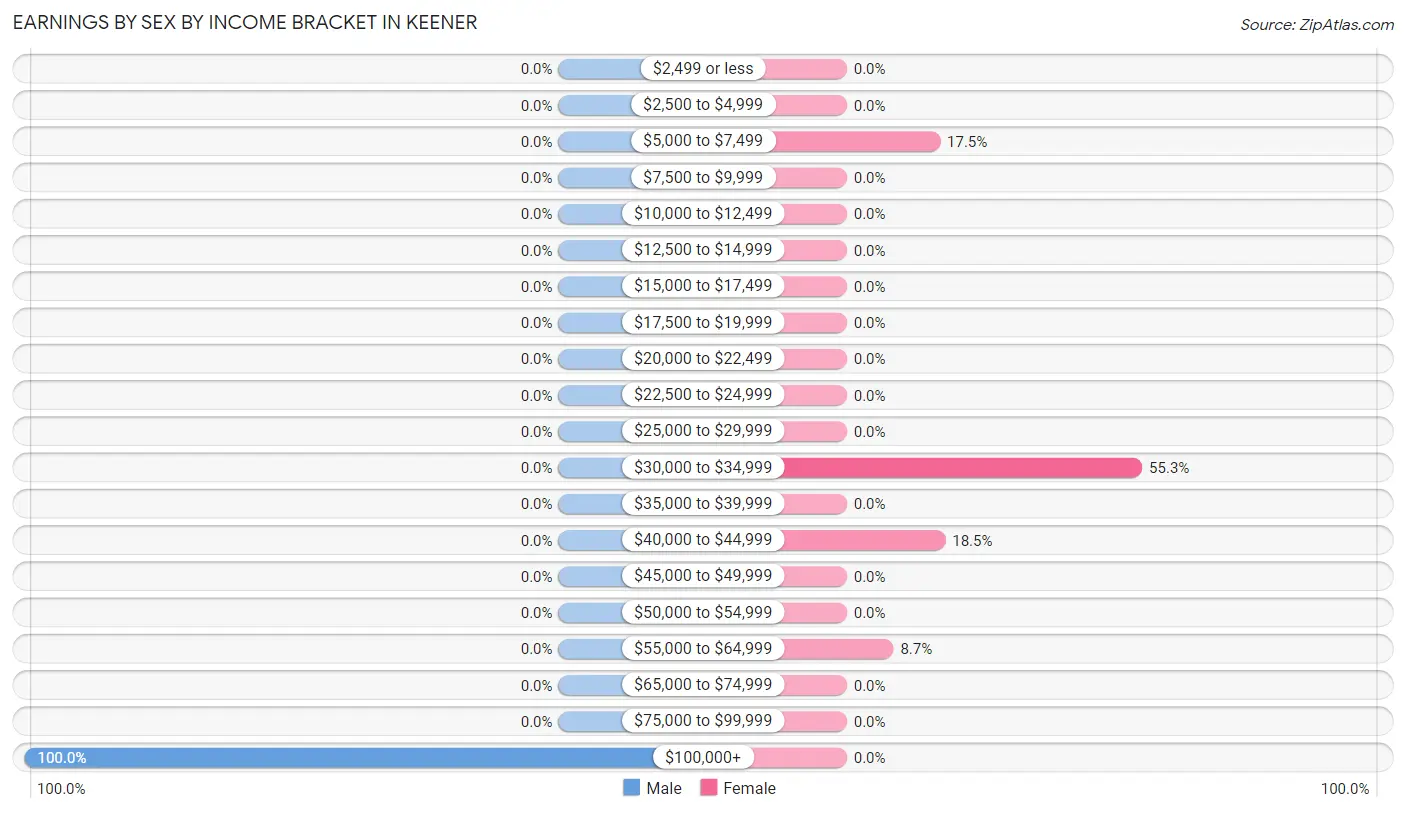
Earnings by Sex by Income Bracket in Keener
The most common earnings brackets in Keener are $100,000+ for men (8 | 100.0%) and $30,000 to $34,999 for women (57 | 55.3%).
| Income | Male | Female |
| $2,499 or less | 0 (0.0%) | 0 (0.0%) |
| $2,500 to $4,999 | 0 (0.0%) | 0 (0.0%) |
| $5,000 to $7,499 | 0 (0.0%) | 18 (17.5%) |
| $7,500 to $9,999 | 0 (0.0%) | 0 (0.0%) |
| $10,000 to $12,499 | 0 (0.0%) | 0 (0.0%) |
| $12,500 to $14,999 | 0 (0.0%) | 0 (0.0%) |
| $15,000 to $17,499 | 0 (0.0%) | 0 (0.0%) |
| $17,500 to $19,999 | 0 (0.0%) | 0 (0.0%) |
| $20,000 to $22,499 | 0 (0.0%) | 0 (0.0%) |
| $22,500 to $24,999 | 0 (0.0%) | 0 (0.0%) |
| $25,000 to $29,999 | 0 (0.0%) | 0 (0.0%) |
| $30,000 to $34,999 | 0 (0.0%) | 57 (55.3%) |
| $35,000 to $39,999 | 0 (0.0%) | 0 (0.0%) |
| $40,000 to $44,999 | 0 (0.0%) | 19 (18.4%) |
| $45,000 to $49,999 | 0 (0.0%) | 0 (0.0%) |
| $50,000 to $54,999 | 0 (0.0%) | 0 (0.0%) |
| $55,000 to $64,999 | 0 (0.0%) | 9 (8.7%) |
| $65,000 to $74,999 | 0 (0.0%) | 0 (0.0%) |
| $75,000 to $99,999 | 0 (0.0%) | 0 (0.0%) |
| $100,000+ | 8 (100.0%) | 0 (0.0%) |
| Total | 8 (100.0%) | 103 (100.0%) |
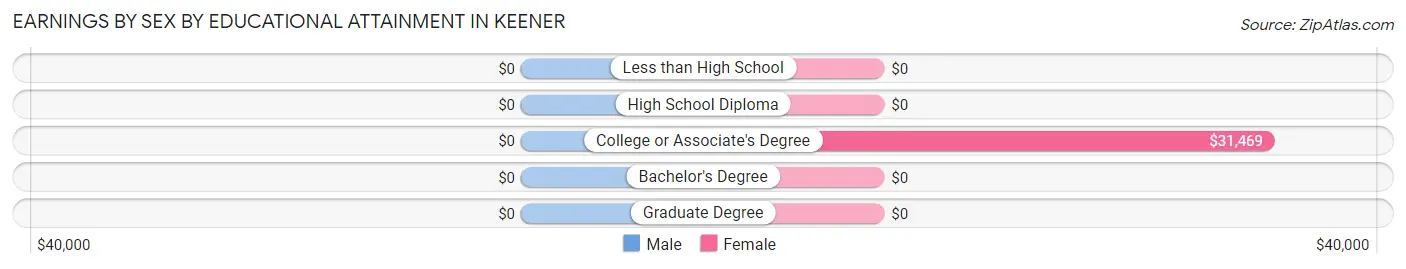
Earnings by Sex by Educational Attainment in Keener
| Educational Attainment | Male Income | Female Income |
| Less than High School | - | - |
| High School Diploma | - | - |
| College or Associate's Degree | - | - |
| Bachelor's Degree | - | - |
| Graduate Degree | - | - |
| Total | - | - |
Family Income in Keener
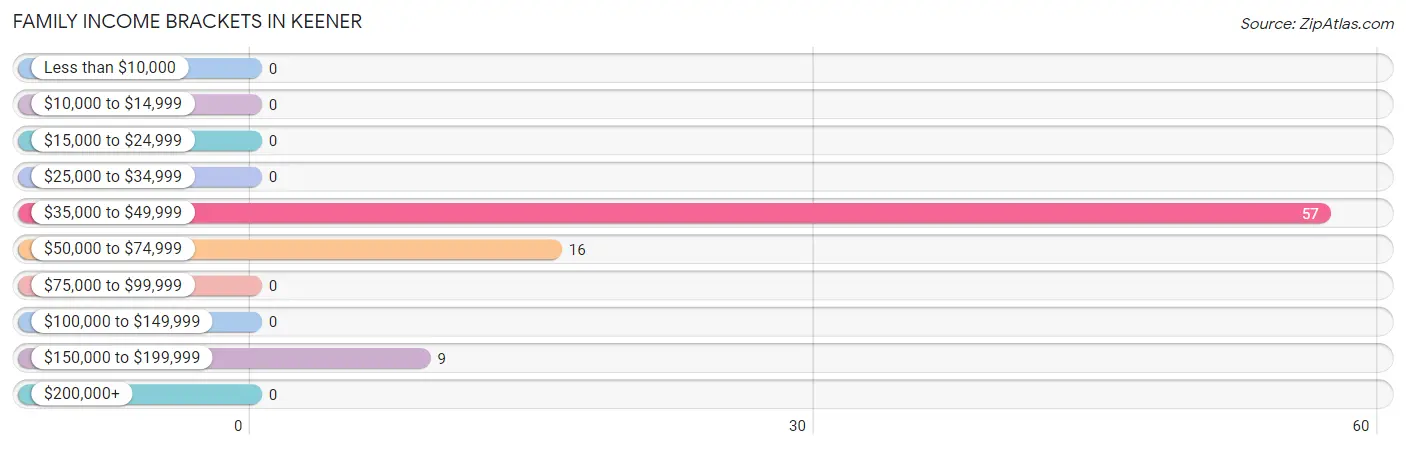
Family Income Brackets in Keener
According to the Keener family income data, there are 57 families falling into the $35,000 to $49,999 income range, which is the most common income bracket and makes up 69.5% of all families.
| Income Bracket | # Families | % Families |
| Less than $10,000 | 0 | 0.0% |
| $10,000 to $14,999 | 0 | 0.0% |
| $15,000 to $24,999 | 0 | 0.0% |
| $25,000 to $34,999 | 0 | 0.0% |
| $35,000 to $49,999 | 57 | 69.5% |
| $50,000 to $74,999 | 16 | 19.5% |
| $75,000 to $99,999 | 0 | 0.0% |
| $100,000 to $149,999 | 0 | 0.0% |
| $150,000 to $199,999 | 9 | 11.0% |
| $200,000+ | 0 | 0.0% |
Family Income by Famaliy Size in Keener
| Income Bracket | # Families | Median Income |
| 2-Person Families | 73 (89.0%) | $0 |
| 3-Person Families | 0 (0.0%) | $0 |
| 4-Person Families | 9 (11.0%) | $0 |
| 5-Person Families | 0 (0.0%) | $0 |
| 6-Person Families | 0 (0.0%) | $0 |
| 7+ Person Families | 0 (0.0%) | $0 |
| Total | 82 (100.0%) | $36,798 |
Family Income by Number of Earners in Keener
| Number of Earners | # Families | Median Income |
| No Earners | 16 (19.5%) | $0 |
| 1 Earner | 57 (69.5%) | $0 |
| 2 Earners | 9 (11.0%) | $0 |
| 3+ Earners | 0 (0.0%) | $0 |
| Total | 82 (100.0%) | $36,798 |
Household Income in Keener
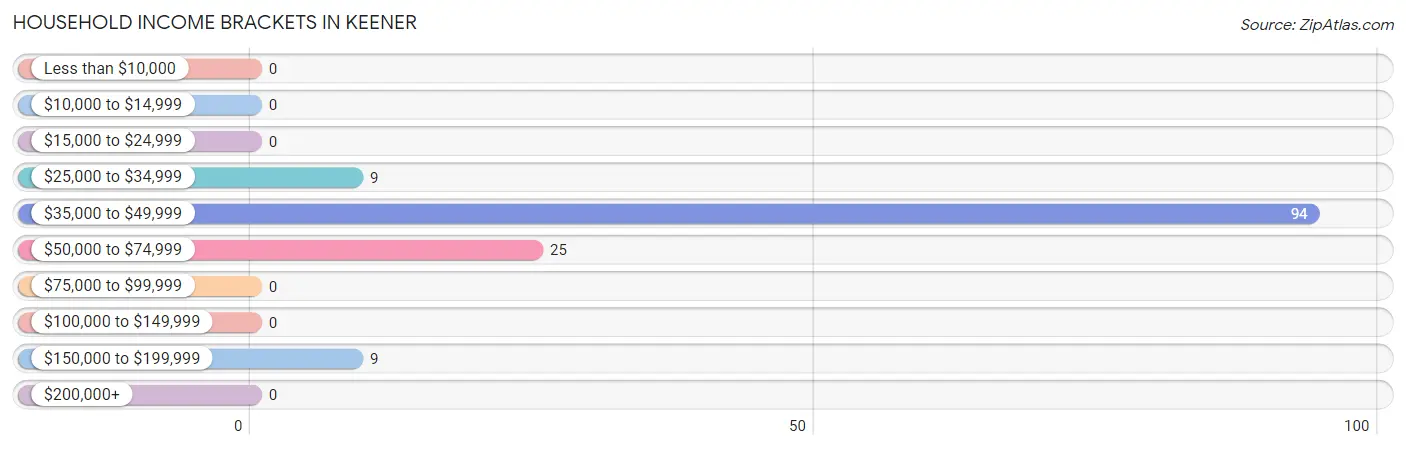
Household Income Brackets in Keener
With 94 households falling in the category, the $35,000 to $49,999 income range is the most frequent in Keener, accounting for 68.6% of all households.
| Income Bracket | # Households | % Households |
| Less than $10,000 | 0 | 0.0% |
| $10,000 to $14,999 | 0 | 0.0% |
| $15,000 to $24,999 | 0 | 0.0% |
| $25,000 to $34,999 | 9 | 6.6% |
| $35,000 to $49,999 | 94 | 68.6% |
| $50,000 to $74,999 | 25 | 18.2% |
| $75,000 to $99,999 | 0 | 0.0% |
| $100,000 to $149,999 | 0 | 0.0% |
| $150,000 to $199,999 | 9 | 6.6% |
| $200,000+ | 0 | 0.0% |
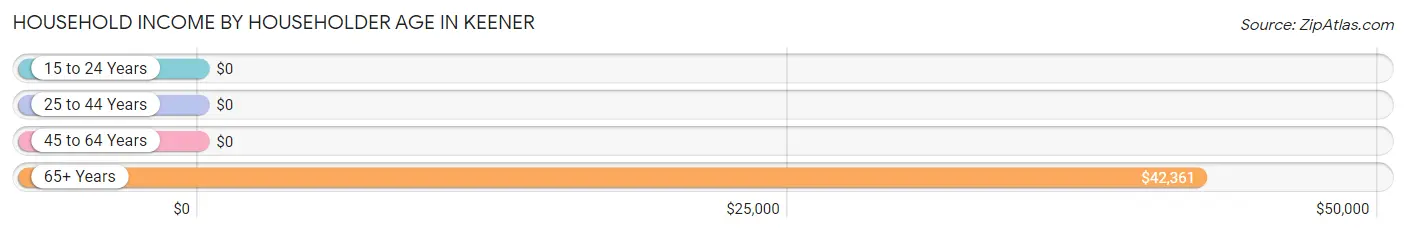
Household Income by Householder Age in Keener
The median household income in Keener is $40,347, with the highest median household income of $42,361 found in the 65+ years age bracket for the primary householder. A total of 52 households (38.0%) fall into this category.
| Income Bracket | # Households | Median Income |
| 15 to 24 Years | 0 (0.0%) | $0 |
| 25 to 44 Years | 66 (48.2%) | $0 |
| 45 to 64 Years | 19 (13.9%) | $0 |
| 65+ Years | 52 (38.0%) | $42,361 |
| Total | 137 (100.0%) | $40,347 |
Poverty in Keener
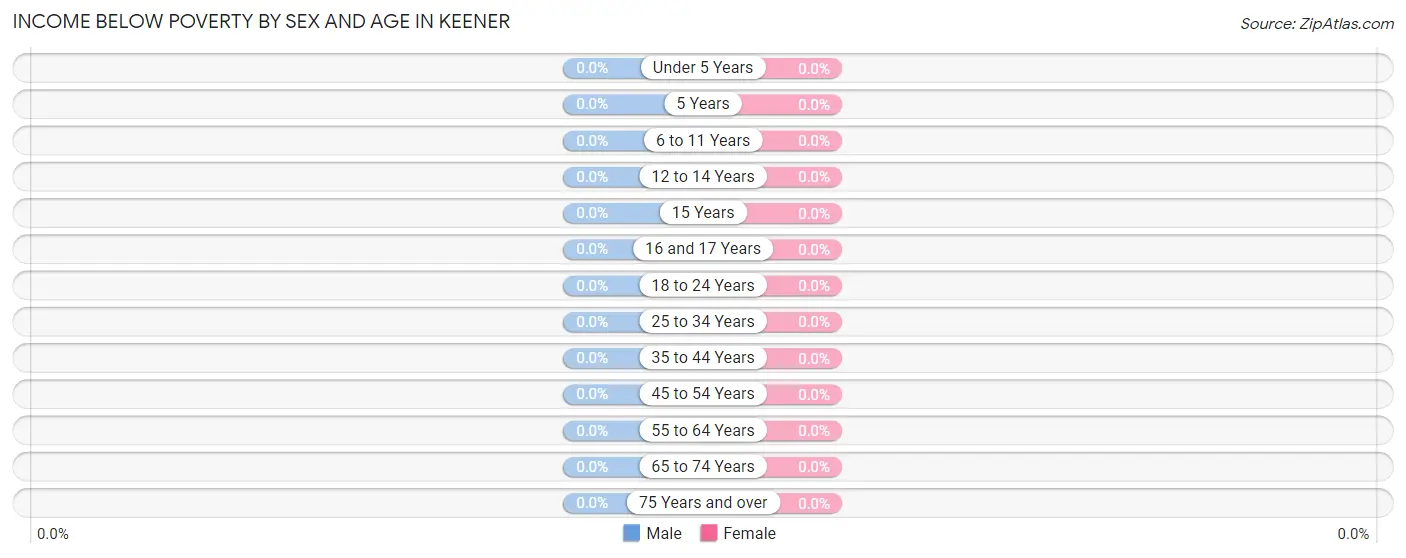
Income Below Poverty by Sex and Age in Keener
| Age Bracket | Male | Female |
| Under 5 Years | 0 (0.0%) | 0 (0.0%) |
| 5 Years | 0 (0.0%) | 0 (0.0%) |
| 6 to 11 Years | 0 (0.0%) | 0 (0.0%) |
| 12 to 14 Years | 0 (0.0%) | 0 (0.0%) |
| 15 Years | 0 (0.0%) | 0 (0.0%) |
| 16 and 17 Years | 0 (0.0%) | 0 (0.0%) |
| 18 to 24 Years | 0 (0.0%) | 0 (0.0%) |
| 25 to 34 Years | 0 (0.0%) | 0 (0.0%) |
| 35 to 44 Years | 0 (0.0%) | 0 (0.0%) |
| 45 to 54 Years | 0 (0.0%) | 0 (0.0%) |
| 55 to 64 Years | 0 (0.0%) | 0 (0.0%) |
| 65 to 74 Years | 0 (0.0%) | 0 (0.0%) |
| 75 Years and over | 0 (0.0%) | 0 (0.0%) |
| Total | 0 (0.0%) | 0 (0.0%) |
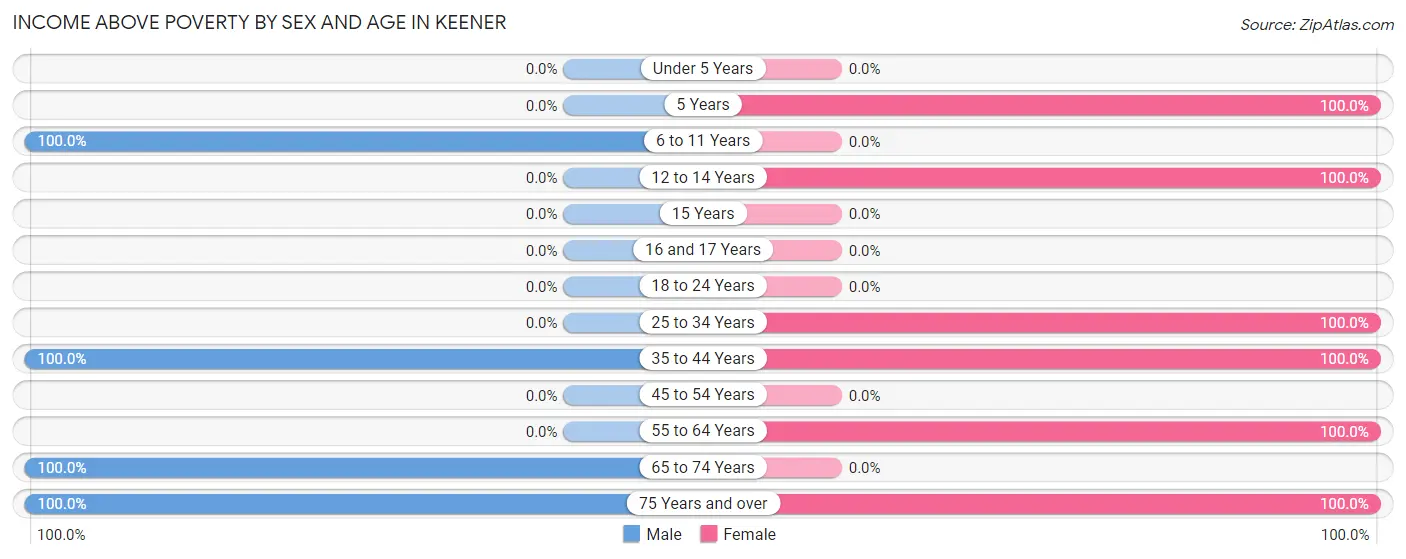
Income Above Poverty by Sex and Age in Keener
According to the poverty statistics in Keener, males aged 6 to 11 years and females aged 5 years are the age groups that are most secure financially, with 100.0% of males and 100.0% of females in these age groups living above the poverty line.
| Age Bracket | Male | Female |
| Under 5 Years | 0 (0.0%) | 0 (0.0%) |
| 5 Years | 0 (0.0%) | 61 (100.0%) |
| 6 to 11 Years | 9 (100.0%) | 0 (0.0%) |
| 12 to 14 Years | 0 (0.0%) | 11 (100.0%) |
| 15 Years | 0 (0.0%) | 0 (0.0%) |
| 16 and 17 Years | 0 (0.0%) | 0 (0.0%) |
| 18 to 24 Years | 0 (0.0%) | 0 (0.0%) |
| 25 to 34 Years | 0 (0.0%) | 57 (100.0%) |
| 35 to 44 Years | 8 (100.0%) | 9 (100.0%) |
| 45 to 54 Years | 0 (0.0%) | 0 (0.0%) |
| 55 to 64 Years | 0 (0.0%) | 19 (100.0%) |
| 65 to 74 Years | 9 (100.0%) | 0 (0.0%) |
| 75 Years and over | 16 (100.0%) | 38 (100.0%) |
| Total | 42 (100.0%) | 195 (100.0%) |
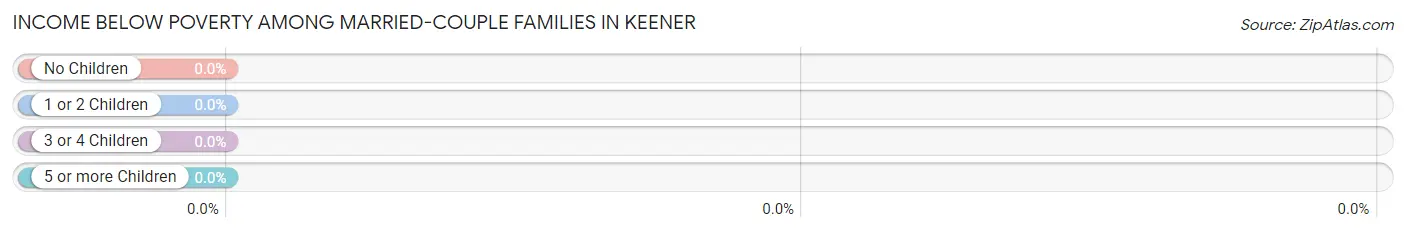
Income Below Poverty Among Married-Couple Families in Keener
| Children | Above Poverty | Below Poverty |
| No Children | 16 (100.0%) | 0 (0.0%) |
| 1 or 2 Children | 9 (100.0%) | 0 (0.0%) |
| 3 or 4 Children | 0 (0.0%) | 0 (0.0%) |
| 5 or more Children | 0 (0.0%) | 0 (0.0%) |
| Total | 25 (100.0%) | 0 (0.0%) |
Income Below Poverty Among Single-Parent Households in Keener
| Children | Single Father | Single Mother |
| No Children | 0 (0.0%) | 0 (0.0%) |
| 1 or 2 Children | 0 (0.0%) | 0 (0.0%) |
| 3 or 4 Children | 0 (0.0%) | 0 (0.0%) |
| 5 or more Children | 0 (0.0%) | 0 (0.0%) |
| Total | 0 (0.0%) | 0 (0.0%) |
Income Below Poverty Among Married-Couple vs Single-Parent Households in Keener
| Children | Married-Couple Families | Single-Parent Households |
| No Children | 0 (0.0%) | 0 (0.0%) |
| 1 or 2 Children | 0 (0.0%) | 0 (0.0%) |
| 3 or 4 Children | 0 (0.0%) | 0 (0.0%) |
| 5 or more Children | 0 (0.0%) | 0 (0.0%) |
| Total | 0 (0.0%) | 0 (0.0%) |
Race in Keener
The most populous races in Keener are Black / African American (137 | 57.8%), White / Caucasian (91 | 38.4%), and Two or more Races (9 | 3.8%).
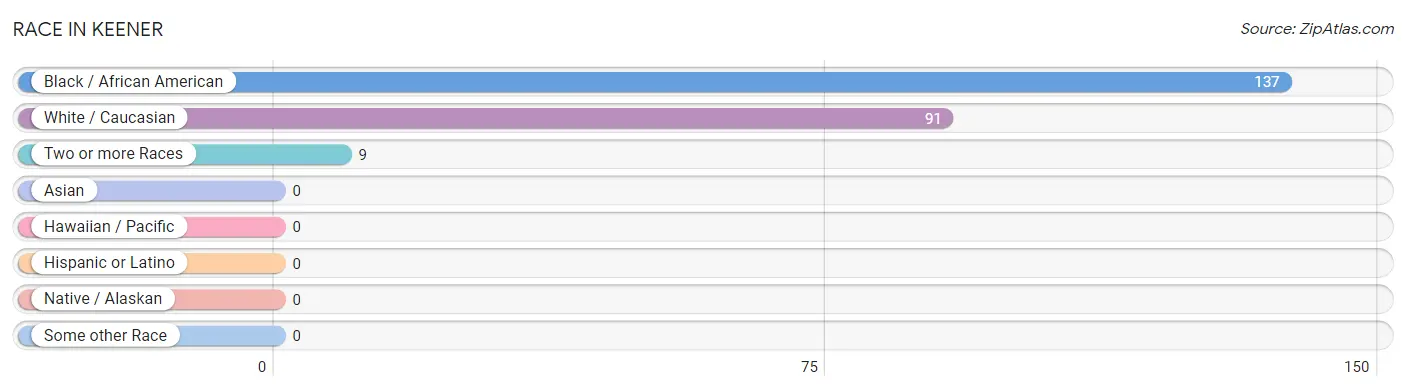
| Race | # Population | % Population |
| Asian | 0 | 0.0% |
| Black / African American | 137 | 57.8% |
| Hawaiian / Pacific | 0 | 0.0% |
| Hispanic or Latino | 0 | 0.0% |
| Native / Alaskan | 0 | 0.0% |
| White / Caucasian | 91 | 38.4% |
| Two or more Races | 9 | 3.8% |
| Some other Race | 0 | 0.0% |
| Total | 237 | 100.0% |
Ancestry in Keener
The most populous ancestries reported in Keener are American (64 | 27.0%), and English (9 | 3.8%), together accounting for 30.8% of all Keener residents.
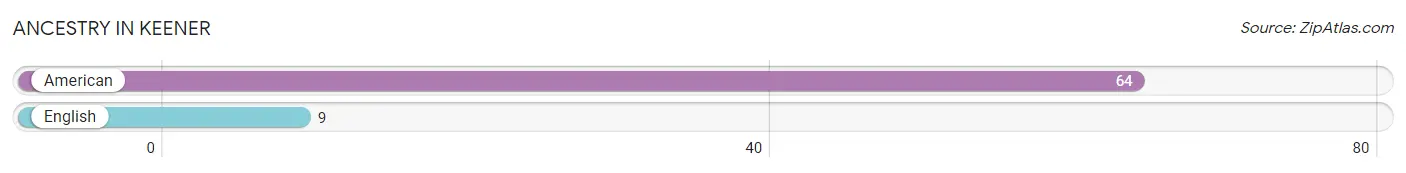
| Ancestry | # Population | % Population |
| American | 64 | 27.0% |
| English | 9 | 3.8% | View All 2 Rows |
Immigrants in Keener

| Immigration Origin | # Population | % Population | View All 0 Rows |
Sex and Age in Keener
Sex and Age in Keener
The most populous age groups in Keener are 75 to 79 Years (16 | 38.1%) for men and 5 to 9 Years (61 | 31.3%) for women.
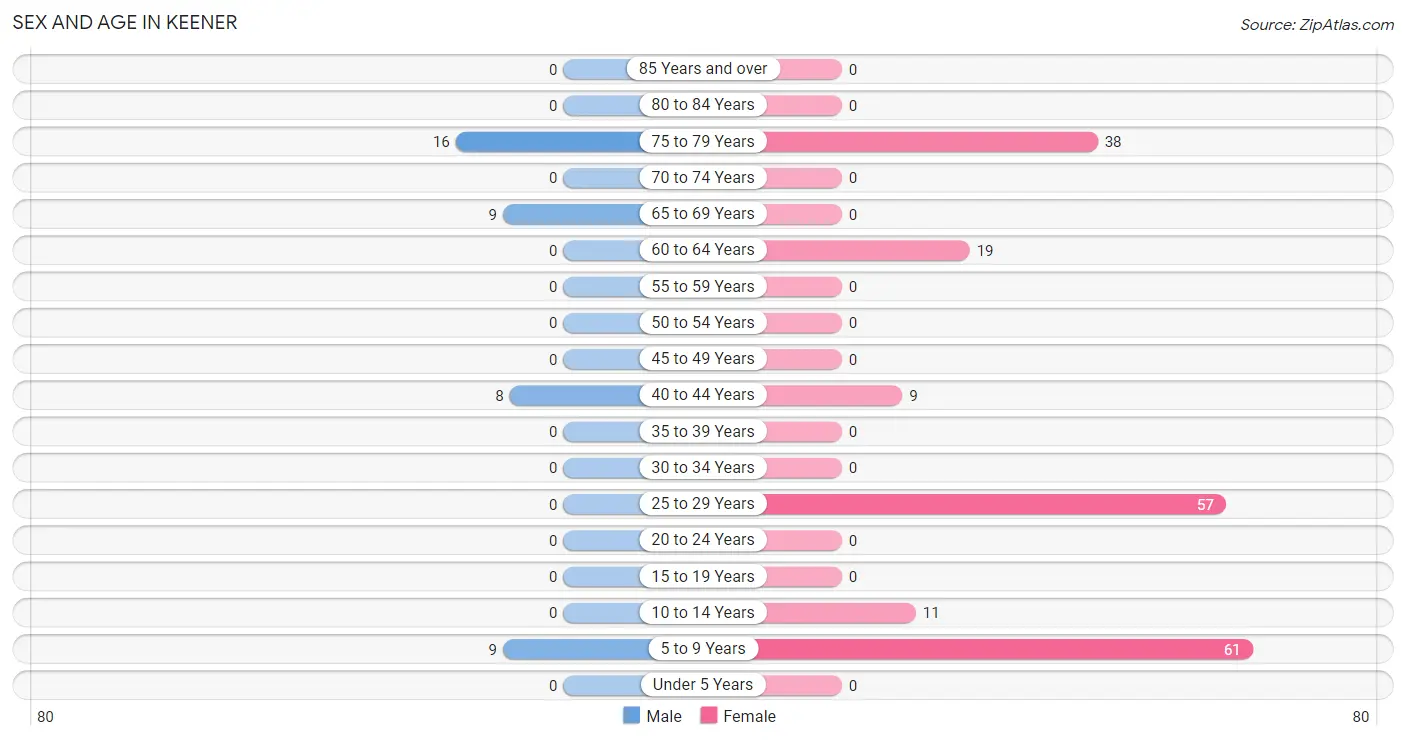
| Age Bracket | Male | Female |
| Under 5 Years | 0 (0.0%) | 0 (0.0%) |
| 5 to 9 Years | 9 (21.4%) | 61 (31.3%) |
| 10 to 14 Years | 0 (0.0%) | 11 (5.6%) |
| 15 to 19 Years | 0 (0.0%) | 0 (0.0%) |
| 20 to 24 Years | 0 (0.0%) | 0 (0.0%) |
| 25 to 29 Years | 0 (0.0%) | 57 (29.2%) |
| 30 to 34 Years | 0 (0.0%) | 0 (0.0%) |
| 35 to 39 Years | 0 (0.0%) | 0 (0.0%) |
| 40 to 44 Years | 8 (19.1%) | 9 (4.6%) |
| 45 to 49 Years | 0 (0.0%) | 0 (0.0%) |
| 50 to 54 Years | 0 (0.0%) | 0 (0.0%) |
| 55 to 59 Years | 0 (0.0%) | 0 (0.0%) |
| 60 to 64 Years | 0 (0.0%) | 19 (9.7%) |
| 65 to 69 Years | 9 (21.4%) | 0 (0.0%) |
| 70 to 74 Years | 0 (0.0%) | 0 (0.0%) |
| 75 to 79 Years | 16 (38.1%) | 38 (19.5%) |
| 80 to 84 Years | 0 (0.0%) | 0 (0.0%) |
| 85 Years and over | 0 (0.0%) | 0 (0.0%) |
| Total | 42 (100.0%) | 195 (100.0%) |
Families and Households in Keener
Median Family Size in Keener
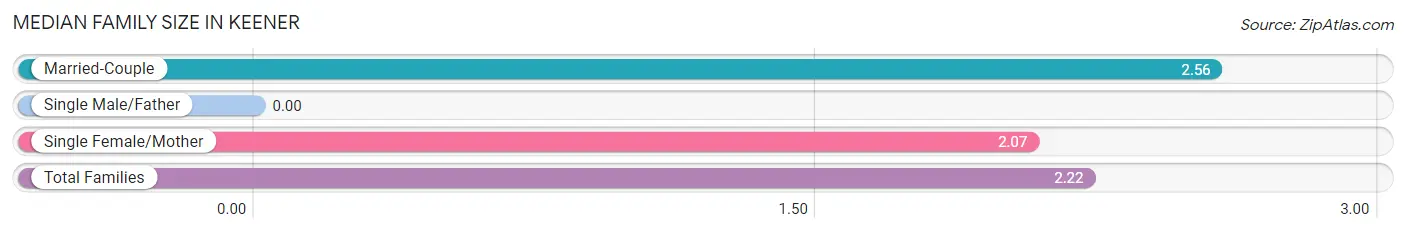
| Family Type | # Families | Family Size |
| Married-Couple | 25 (30.5%) | 2.56 |
| Single Male/Father | 0 (0.0%) | - |
| Single Female/Mother | 57 (69.5%) | 2.07 |
| Total Families | 82 (100.0%) | 2.22 |
Median Household Size in Keener
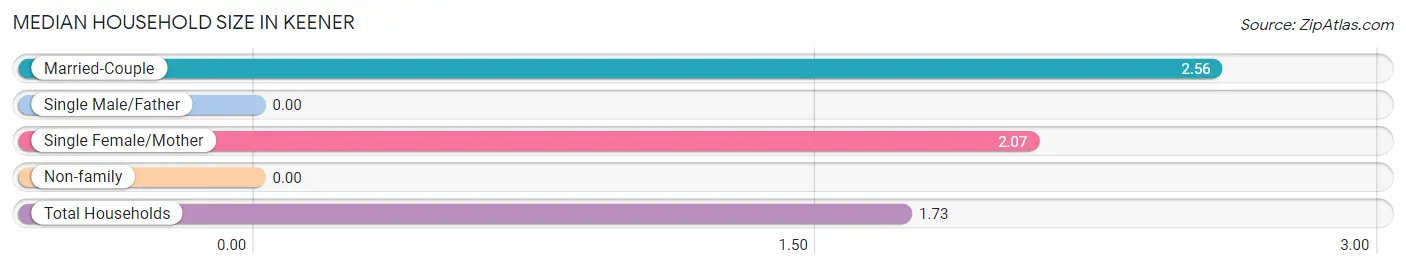
| Household Type | # Households | Household Size |
| Married-Couple | 25 (18.2%) | 2.56 |
| Single Male/Father | 0 (0.0%) | - |
| Single Female/Mother | 57 (41.6%) | 2.07 |
| Non-family | 55 (40.2%) | - |
| Total Households | 137 (100.0%) | 1.73 |
Household Size by Marriage Status in Keener
Out of a total of 137 households in Keener, 82 (59.9%) are family households, while 55 (40.2%) are nonfamily households. The most numerous type of family households are 2-person households, comprising 73, and the most common type of nonfamily households are 1-person households, comprising 55.
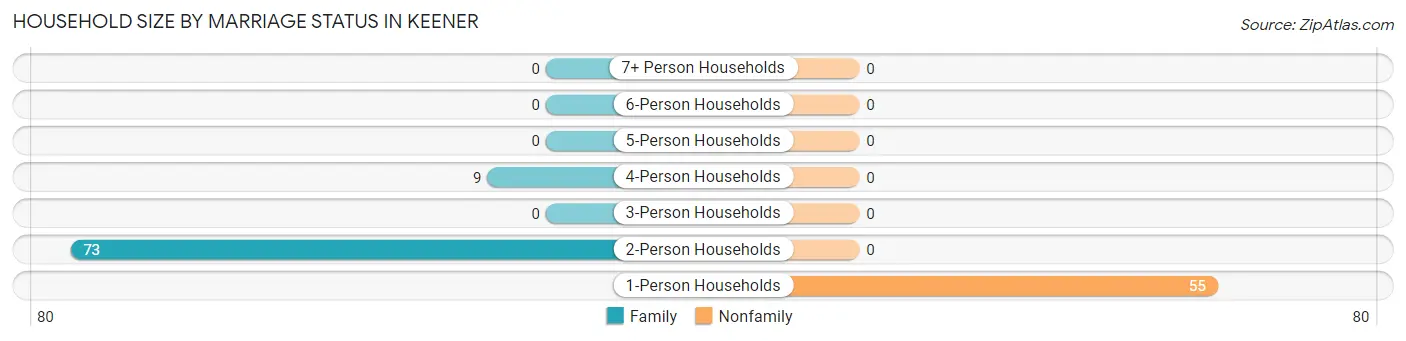
| Household Size | Family Households | Nonfamily Households |
| 1-Person Households | - | 55 (40.2%) |
| 2-Person Households | 73 (53.3%) | 0 (0.0%) |
| 3-Person Households | 0 (0.0%) | 0 (0.0%) |
| 4-Person Households | 9 (6.6%) | 0 (0.0%) |
| 5-Person Households | 0 (0.0%) | 0 (0.0%) |
| 6-Person Households | 0 (0.0%) | 0 (0.0%) |
| 7+ Person Households | 0 (0.0%) | 0 (0.0%) |
| Total | 82 (59.9%) | 55 (40.2%) |
Female Fertility in Keener
Fertility by Age in Keener
| Age Bracket | Women with Births | Births / 1,000 Women |
| 15 to 19 years | 0 (0.0%) | 0.0 |
| 20 to 34 years | 0 (0.0%) | 0.0 |
| 35 to 50 years | 0 (0.0%) | 0.0 |
| Total | 0 (0.0%) | 0.0 |
Fertility by Age by Marriage Status in Keener
| Age Bracket | Married | Unmarried |
| 15 to 19 years | 0 (0.0%) | 0 (0.0%) |
| 20 to 34 years | 0 (0.0%) | 0 (0.0%) |
| 35 to 50 years | 0 (0.0%) | 0 (0.0%) |
| Total | 0 (0.0%) | 0 (0.0%) |
Fertility by Education in Keener
| Educational Attainment | Women with Births | Births / 1,000 Women |
| Less than High School | 0 (0.0%) | 0.0 |
| High School Diploma | 0 (0.0%) | 0.0 |
| College or Associate's Degree | 0 (0.0%) | 0.0 |
| Bachelor's Degree | 0 (0.0%) | 0.0 |
| Graduate Degree | 0 (0.0%) | 0.0 |
| Total | 0 (0.0%) | 0.0 |
Fertility by Education by Marriage Status in Keener
| Educational Attainment | Married | Unmarried |
| Less than High School | 0 (0.0%) | 0 (0.0%) |
| High School Diploma | 0 (0.0%) | 0 (0.0%) |
| College or Associate's Degree | 0 (0.0%) | 0 (0.0%) |
| Bachelor's Degree | 0 (0.0%) | 0 (0.0%) |
| Graduate Degree | 0 (0.0%) | 0 (0.0%) |
| Total | 0 (0.0%) | 0 (0.0%) |
Employment Characteristics in Keener
Employment by Class of Employer in Keener
Among the 93 employed individuals in Keener, private company employees (74 | 79.6%), and state government employees (19 | 20.4%) make up the most common classes of employment.
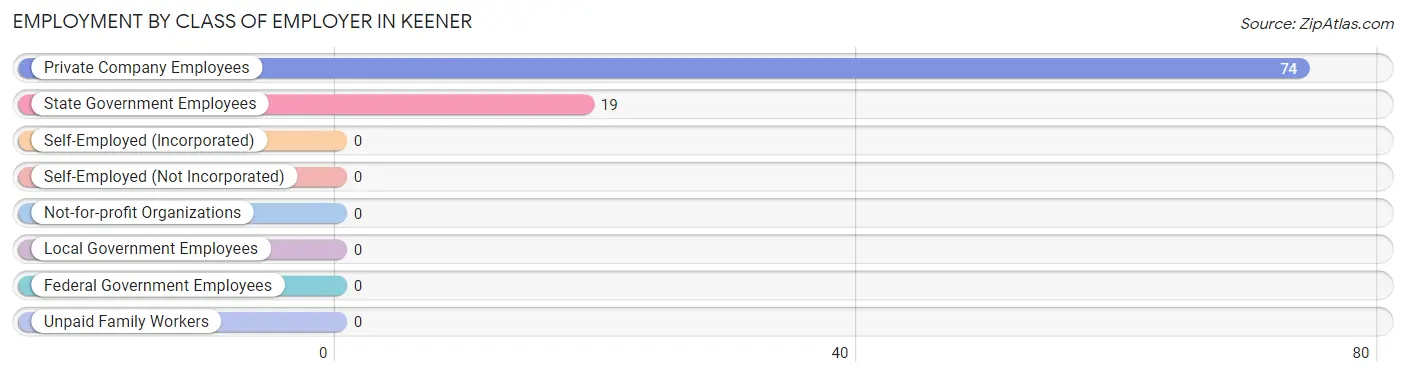
| Employer Class | # Employees | % Employees |
| Private Company Employees | 74 | 79.6% |
| Self-Employed (Incorporated) | 0 | 0.0% |
| Self-Employed (Not Incorporated) | 0 | 0.0% |
| Not-for-profit Organizations | 0 | 0.0% |
| Local Government Employees | 0 | 0.0% |
| State Government Employees | 19 | 20.4% |
| Federal Government Employees | 0 | 0.0% |
| Unpaid Family Workers | 0 | 0.0% |
| Total | 93 | 100.0% |
Employment Status by Age in Keener
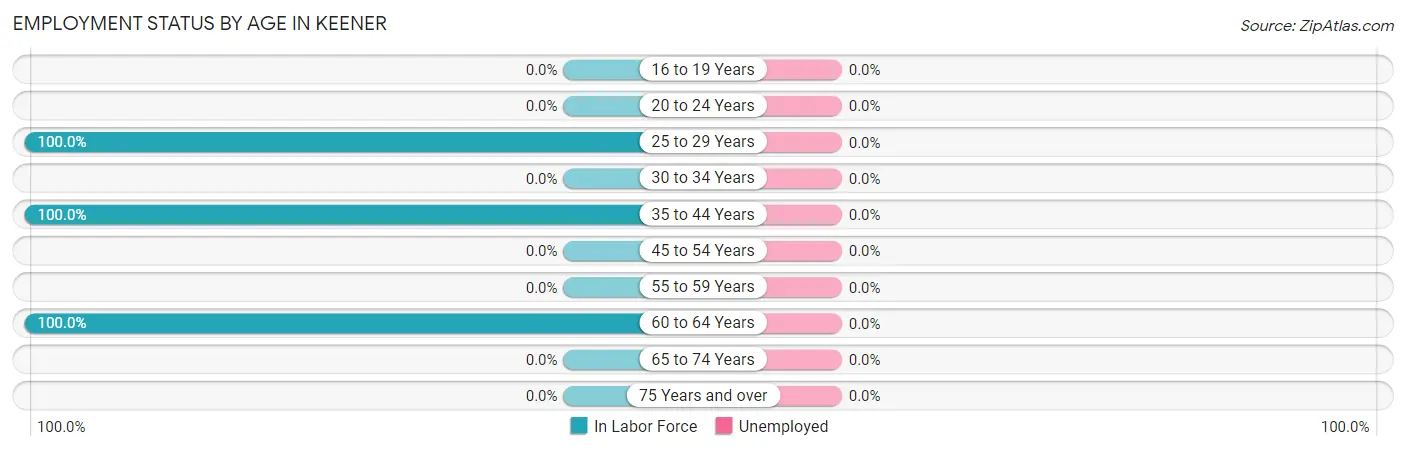
| Age Bracket | In Labor Force | Unemployed |
| 16 to 19 Years | 0 (0.0%) | 0 (0.0%) |
| 20 to 24 Years | 0 (0.0%) | 0 (0.0%) |
| 25 to 29 Years | 57 (100.0%) | 0 (0.0%) |
| 30 to 34 Years | 0 (0.0%) | 0 (0.0%) |
| 35 to 44 Years | 17 (100.0%) | 0 (0.0%) |
| 45 to 54 Years | 0 (0.0%) | 0 (0.0%) |
| 55 to 59 Years | 0 (0.0%) | 0 (0.0%) |
| 60 to 64 Years | 19 (100.0%) | 0 (0.0%) |
| 65 to 74 Years | 0 (0.0%) | 0 (0.0%) |
| 75 Years and over | 0 (0.0%) | 0 (0.0%) |
| Total | 93 (59.6%) | 0 (0.0%) |
Employment Status by Educational Attainment in Keener
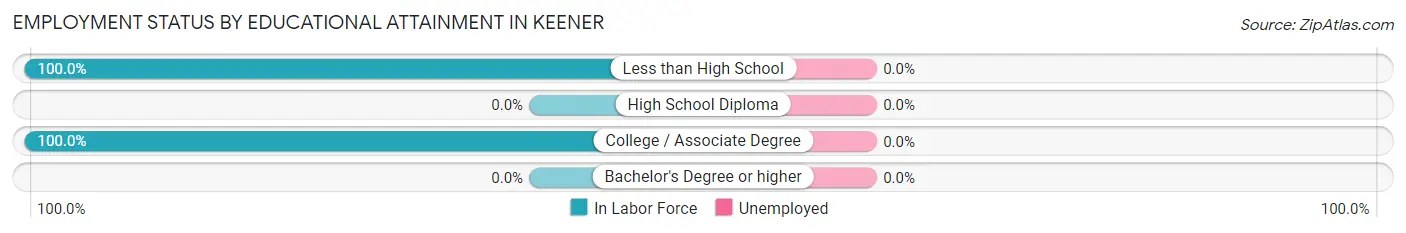
| Educational Attainment | In Labor Force | Unemployed |
| Less than High School | 8 (100.0%) | 0 (0.0%) |
| High School Diploma | 0 (0.0%) | 0 (0.0%) |
| College / Associate Degree | 85 (100.0%) | 0 (0.0%) |
| Bachelor's Degree or higher | 0 (0.0%) | 0 (0.0%) |
| Total | 93 (100.0%) | 0 (0.0%) |
Employment Occupations by Sex in Keener
Management, Business, Science and Arts Occupations
The most common Management, Business, Science and Arts occupations in Keener are Health Diagnosing & Treating (9 | 9.7%), and Management (8 | 8.6%).
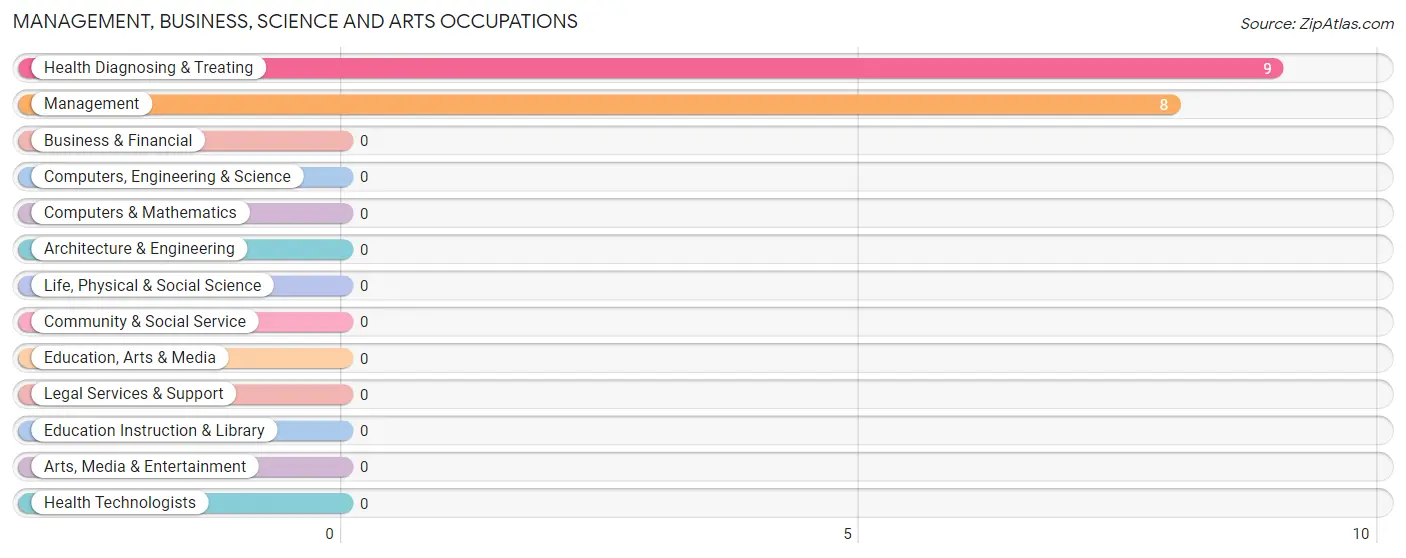
Management, Business, Science and Arts Occupations by Sex
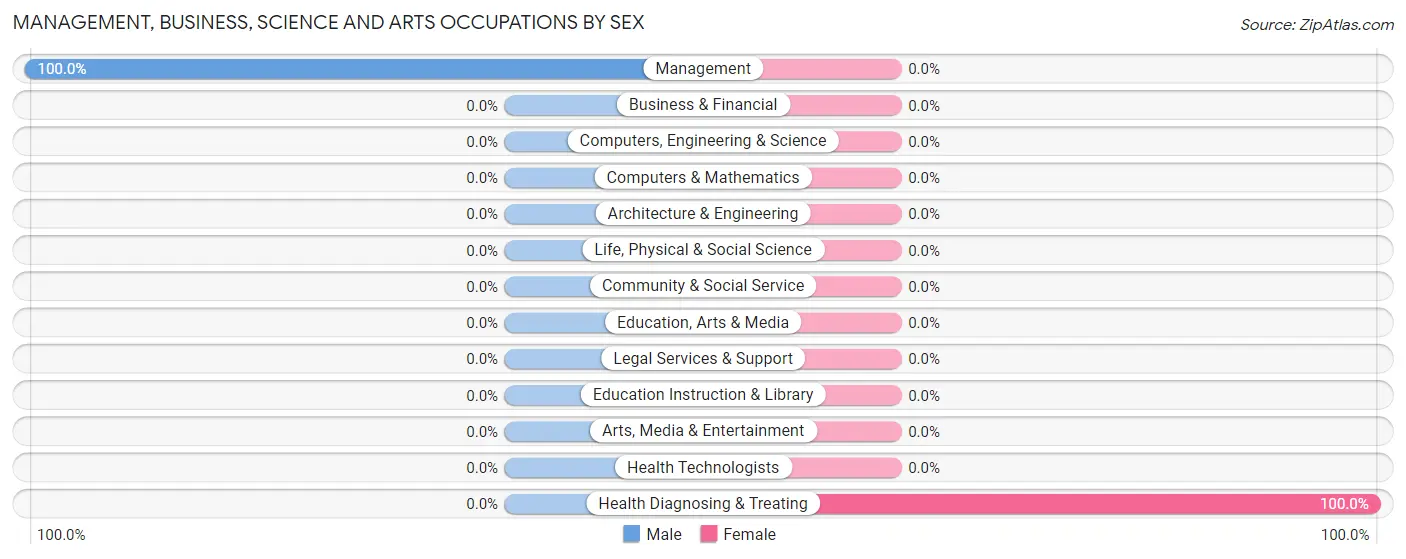
| Occupation | Male | Female |
| Management | 8 (100.0%) | 0 (0.0%) |
| Business & Financial | 0 (0.0%) | 0 (0.0%) |
| Computers, Engineering & Science | 0 (0.0%) | 0 (0.0%) |
| Computers & Mathematics | 0 (0.0%) | 0 (0.0%) |
| Architecture & Engineering | 0 (0.0%) | 0 (0.0%) |
| Life, Physical & Social Science | 0 (0.0%) | 0 (0.0%) |
| Community & Social Service | 0 (0.0%) | 0 (0.0%) |
| Education, Arts & Media | 0 (0.0%) | 0 (0.0%) |
| Legal Services & Support | 0 (0.0%) | 0 (0.0%) |
| Education Instruction & Library | 0 (0.0%) | 0 (0.0%) |
| Arts, Media & Entertainment | 0 (0.0%) | 0 (0.0%) |
| Health Diagnosing & Treating | 0 (0.0%) | 9 (100.0%) |
| Health Technologists | 0 (0.0%) | 0 (0.0%) |
| Total (Category) | 8 (47.1%) | 9 (52.9%) |
| Total (Overall) | 8 (8.6%) | 85 (91.4%) |
Services Occupations
Services Occupations by Sex
| Occupation | Male | Female |
| Healthcare Support | 0 (0.0%) | 0 (0.0%) |
| Security & Protection | 0 (0.0%) | 0 (0.0%) |
| Firefighting & Prevention | 0 (0.0%) | 0 (0.0%) |
| Law Enforcement | 0 (0.0%) | 0 (0.0%) |
| Food Preparation & Serving | 0 (0.0%) | 0 (0.0%) |
| Cleaning & Maintenance | 0 (0.0%) | 0 (0.0%) |
| Personal Care & Service | 0 (0.0%) | 0 (0.0%) |
| Total (Category) | 0 (0.0%) | 0 (0.0%) |
| Total (Overall) | 8 (8.6%) | 85 (91.4%) |
Sales and Office Occupations
The most common Sales and Office occupations in Keener are , and Office & Administration (76 | 81.7%).
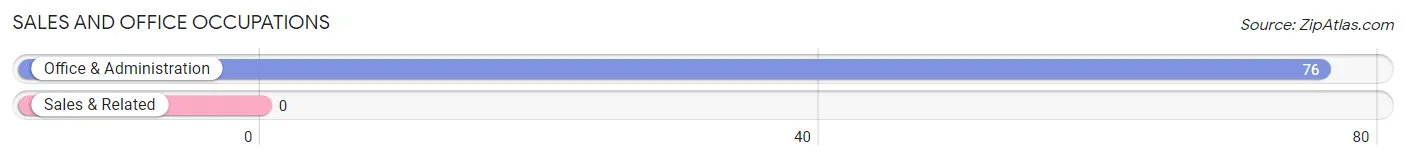
Sales and Office Occupations by Sex
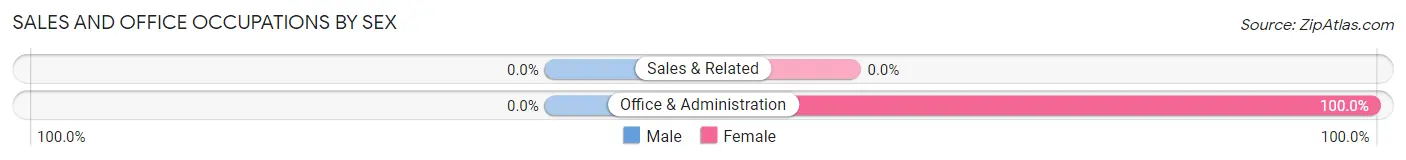
| Occupation | Male | Female |
| Sales & Related | 0 (0.0%) | 0 (0.0%) |
| Office & Administration | 0 (0.0%) | 76 (100.0%) |
| Total (Category) | 0 (0.0%) | 76 (100.0%) |
| Total (Overall) | 8 (8.6%) | 85 (91.4%) |
Natural Resources, Construction and Maintenance Occupations
Natural Resources, Construction and Maintenance Occupations by Sex
| Occupation | Male | Female |
| Farming, Fishing & Forestry | 0 (0.0%) | 0 (0.0%) |
| Construction & Extraction | 0 (0.0%) | 0 (0.0%) |
| Installation, Maintenance & Repair | 0 (0.0%) | 0 (0.0%) |
| Total (Category) | 0 (0.0%) | 0 (0.0%) |
| Total (Overall) | 8 (8.6%) | 85 (91.4%) |
Production, Transportation and Moving Occupations
Production, Transportation and Moving Occupations by Sex
| Occupation | Male | Female |
| Production | 0 (0.0%) | 0 (0.0%) |
| Transportation | 0 (0.0%) | 0 (0.0%) |
| Material Moving | 0 (0.0%) | 0 (0.0%) |
| Total (Category) | 0 (0.0%) | 0 (0.0%) |
| Total (Overall) | 8 (8.6%) | 85 (91.4%) |
Employment Industries by Sex in Keener
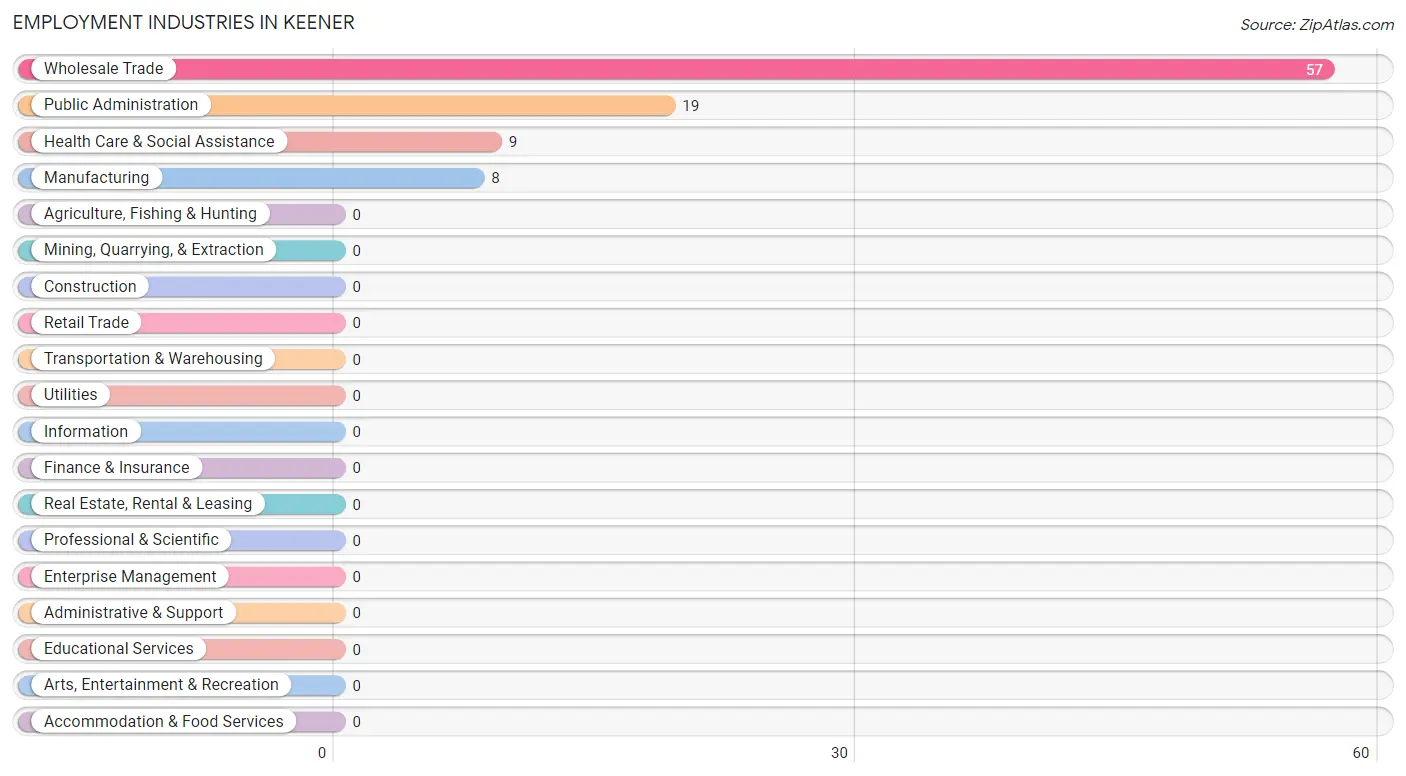
Employment Industries in Keener
The major employment industries in Keener include Wholesale Trade (57 | 61.3%), Public Administration (19 | 20.4%), Health Care & Social Assistance (9 | 9.7%), and Manufacturing (8 | 8.6%).
Employment Industries by Sex in Keener
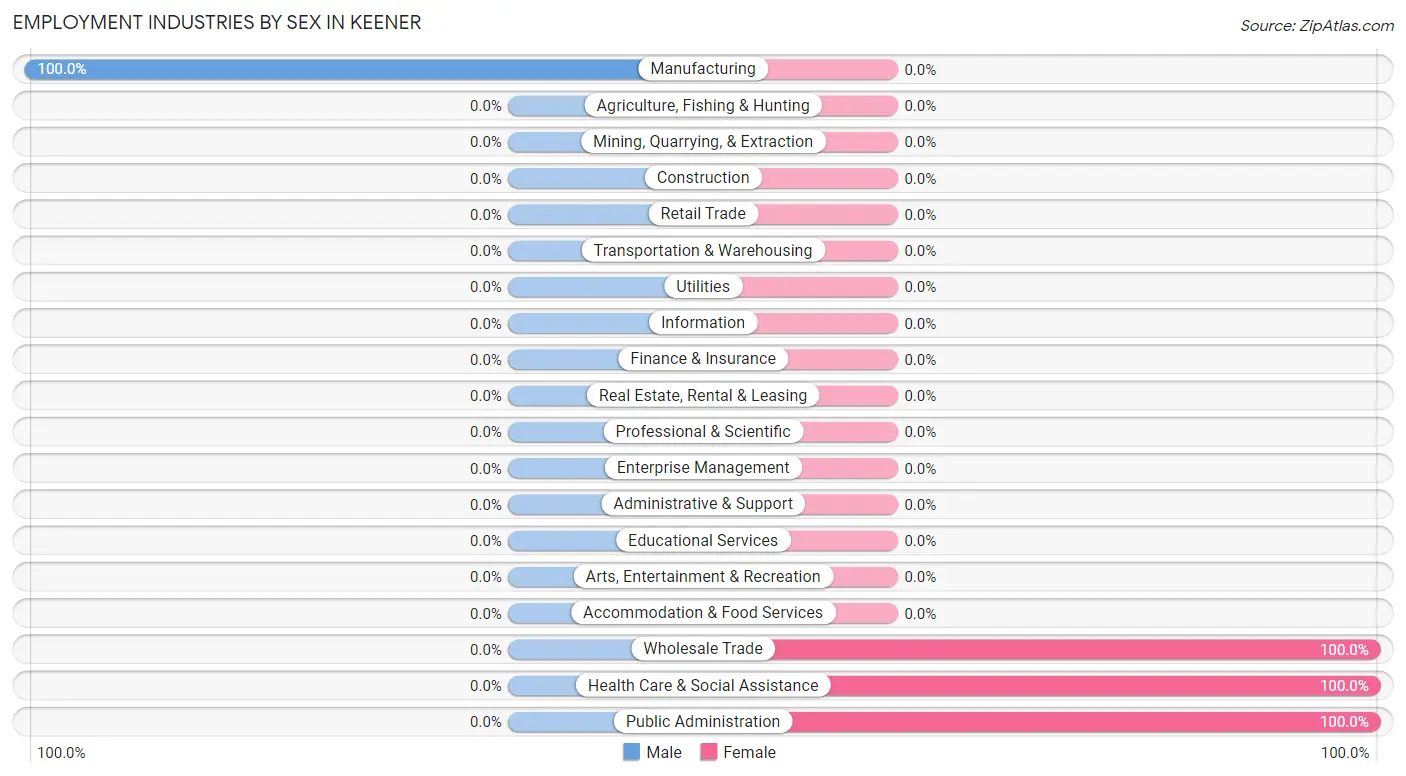
| Industry | Male | Female |
| Agriculture, Fishing & Hunting | 0 (0.0%) | 0 (0.0%) |
| Mining, Quarrying, & Extraction | 0 (0.0%) | 0 (0.0%) |
| Construction | 0 (0.0%) | 0 (0.0%) |
| Manufacturing | 8 (100.0%) | 0 (0.0%) |
| Wholesale Trade | 0 (0.0%) | 57 (100.0%) |
| Retail Trade | 0 (0.0%) | 0 (0.0%) |
| Transportation & Warehousing | 0 (0.0%) | 0 (0.0%) |
| Utilities | 0 (0.0%) | 0 (0.0%) |
| Information | 0 (0.0%) | 0 (0.0%) |
| Finance & Insurance | 0 (0.0%) | 0 (0.0%) |
| Real Estate, Rental & Leasing | 0 (0.0%) | 0 (0.0%) |
| Professional & Scientific | 0 (0.0%) | 0 (0.0%) |
| Enterprise Management | 0 (0.0%) | 0 (0.0%) |
| Administrative & Support | 0 (0.0%) | 0 (0.0%) |
| Educational Services | 0 (0.0%) | 0 (0.0%) |
| Health Care & Social Assistance | 0 (0.0%) | 9 (100.0%) |
| Arts, Entertainment & Recreation | 0 (0.0%) | 0 (0.0%) |
| Accommodation & Food Services | 0 (0.0%) | 0 (0.0%) |
| Public Administration | 0 (0.0%) | 19 (100.0%) |
| Total | 8 (8.6%) | 85 (91.4%) |
Education in Keener
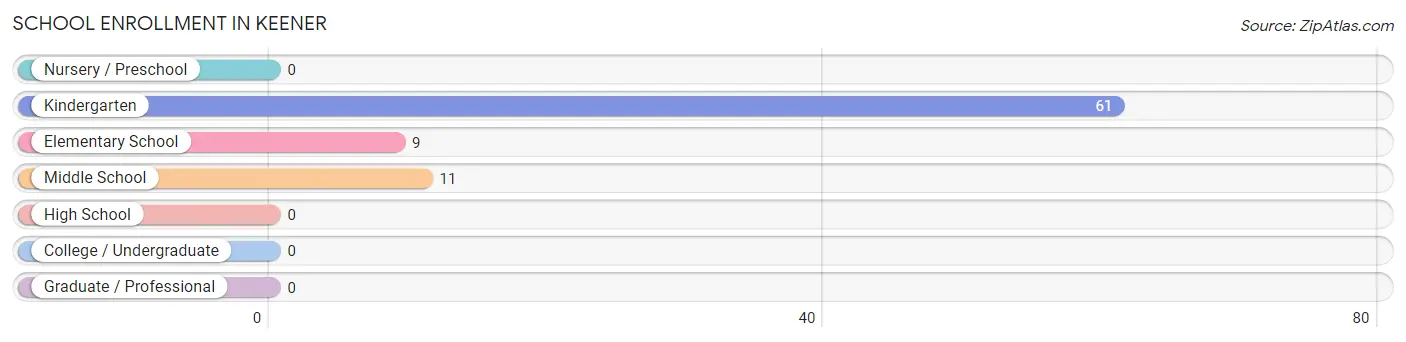
School Enrollment in Keener
The most common levels of schooling among the 81 students in Keener are kindergarten (61 | 75.3%), middle school (11 | 13.6%), and elementary school (9 | 11.1%).
| School Level | # Students | % Students |
| Nursery / Preschool | 0 | 0.0% |
| Kindergarten | 61 | 75.3% |
| Elementary School | 9 | 11.1% |
| Middle School | 11 | 13.6% |
| High School | 0 | 0.0% |
| College / Undergraduate | 0 | 0.0% |
| Graduate / Professional | 0 | 0.0% |
| Total | 81 | 100.0% |
School Enrollment by Age by Funding Source in Keener
Out of a total of 81 students who are enrolled in schools in Keener, 20 (24.7%) attend a private institution, while the remaining 61 (75.3%) are enrolled in public schools. The age group of 10 to 14 year olds has the highest likelihood of being enrolled in private schools, with 11 (100.0% in the age bracket) enrolled. Conversely, the age group of 5 to 9 year old has the lowest likelihood of being enrolled in a private school, with 61 (87.1% in the age bracket) attending a public institution.
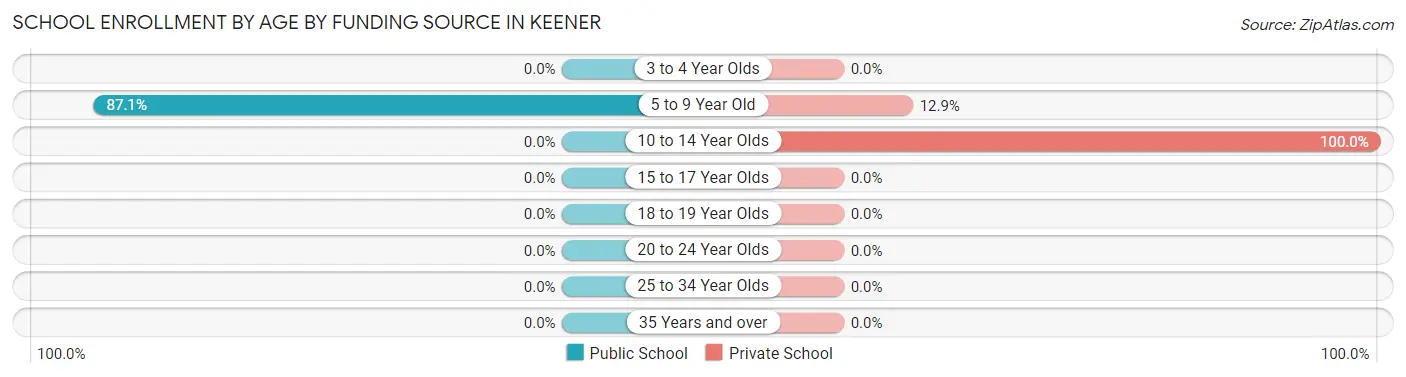
| Age Bracket | Public School | Private School |
| 3 to 4 Year Olds | 0 (0.0%) | 0 (0.0%) |
| 5 to 9 Year Old | 61 (87.1%) | 9 (12.9%) |
| 10 to 14 Year Olds | 0 (0.0%) | 11 (100.0%) |
| 15 to 17 Year Olds | 0 (0.0%) | 0 (0.0%) |
| 18 to 19 Year Olds | 0 (0.0%) | 0 (0.0%) |
| 20 to 24 Year Olds | 0 (0.0%) | 0 (0.0%) |
| 25 to 34 Year Olds | 0 (0.0%) | 0 (0.0%) |
| 35 Years and over | 0 (0.0%) | 0 (0.0%) |
| Total | 61 (75.3%) | 20 (24.7%) |
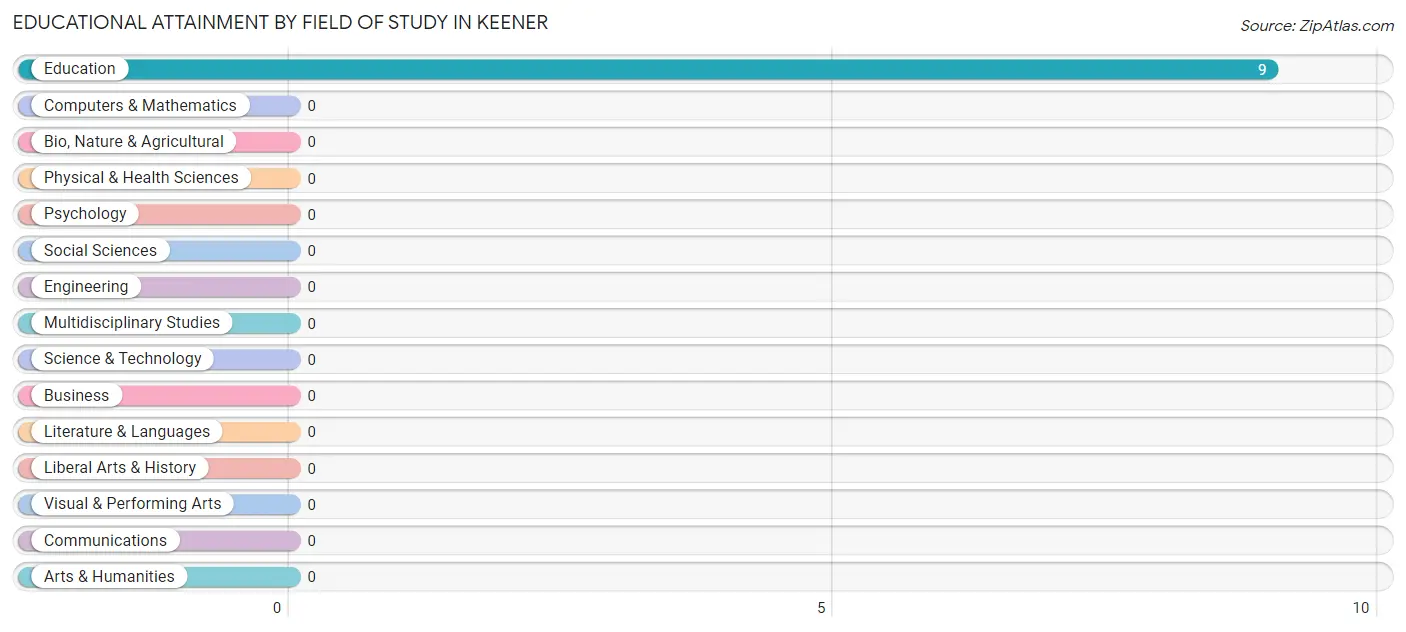
Educational Attainment by Field of Study in Keener
, and education (9 | 100.0%) are the most common fields of study among 9 individuals in Keener who have obtained a bachelor's degree or higher.
| Field of Study | # Graduates | % Graduates |
| Computers & Mathematics | 0 | 0.0% |
| Bio, Nature & Agricultural | 0 | 0.0% |
| Physical & Health Sciences | 0 | 0.0% |
| Psychology | 0 | 0.0% |
| Social Sciences | 0 | 0.0% |
| Engineering | 0 | 0.0% |
| Multidisciplinary Studies | 0 | 0.0% |
| Science & Technology | 0 | 0.0% |
| Business | 0 | 0.0% |
| Education | 9 | 100.0% |
| Literature & Languages | 0 | 0.0% |
| Liberal Arts & History | 0 | 0.0% |
| Visual & Performing Arts | 0 | 0.0% |
| Communications | 0 | 0.0% |
| Arts & Humanities | 0 | 0.0% |
| Total | 9 | 100.0% |
Transportation & Commute in Keener
Vehicle Availability by Sex in Keener
The most prevalent vehicle ownership categories in Keener are males with 4 vehicles (8, accounting for 100.0%) and females with 4 vehicles (9, making up 9.4%).
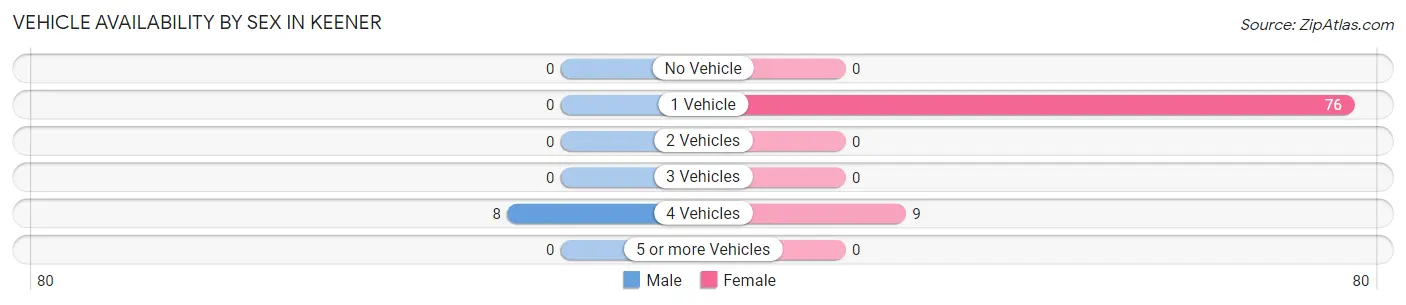
| Vehicles Available | Male | Female |
| No Vehicle | 0 (0.0%) | 0 (0.0%) |
| 1 Vehicle | 0 (0.0%) | 76 (89.4%) |
| 2 Vehicles | 0 (0.0%) | 0 (0.0%) |
| 3 Vehicles | 0 (0.0%) | 0 (0.0%) |
| 4 Vehicles | 8 (100.0%) | 9 (10.6%) |
| 5 or more Vehicles | 0 (0.0%) | 0 (0.0%) |
| Total | 8 (100.0%) | 85 (100.0%) |
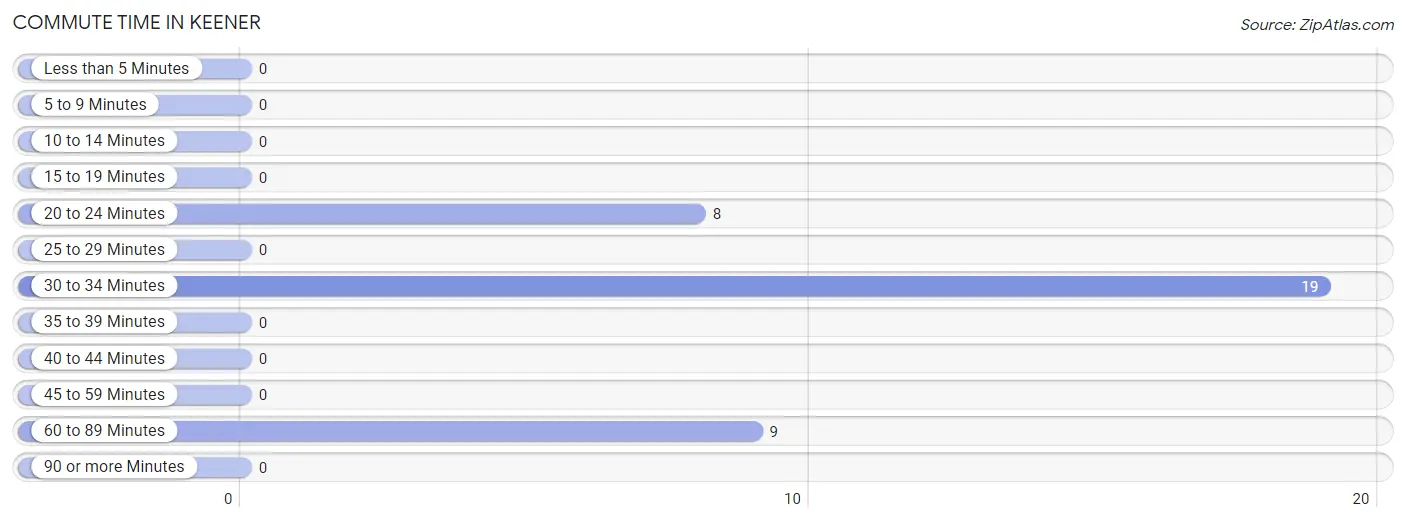
Commute Time in Keener
The most frequently occuring commute durations in Keener are 30 to 34 minutes (19 commuters, 52.8%), 60 to 89 minutes (9 commuters, 25.0%), and 20 to 24 minutes (8 commuters, 22.2%).
| Commute Time | # Commuters | % Commuters |
| Less than 5 Minutes | 0 | 0.0% |
| 5 to 9 Minutes | 0 | 0.0% |
| 10 to 14 Minutes | 0 | 0.0% |
| 15 to 19 Minutes | 0 | 0.0% |
| 20 to 24 Minutes | 8 | 22.2% |
| 25 to 29 Minutes | 0 | 0.0% |
| 30 to 34 Minutes | 19 | 52.8% |
| 35 to 39 Minutes | 0 | 0.0% |
| 40 to 44 Minutes | 0 | 0.0% |
| 45 to 59 Minutes | 0 | 0.0% |
| 60 to 89 Minutes | 9 | 25.0% |
| 90 or more Minutes | 0 | 0.0% |
Commute Time by Sex in Keener
The most common commute times in Keener are 20 to 24 minutes (8 commuters, 100.0%) for males and 30 to 34 minutes (19 commuters, 67.9%) for females.
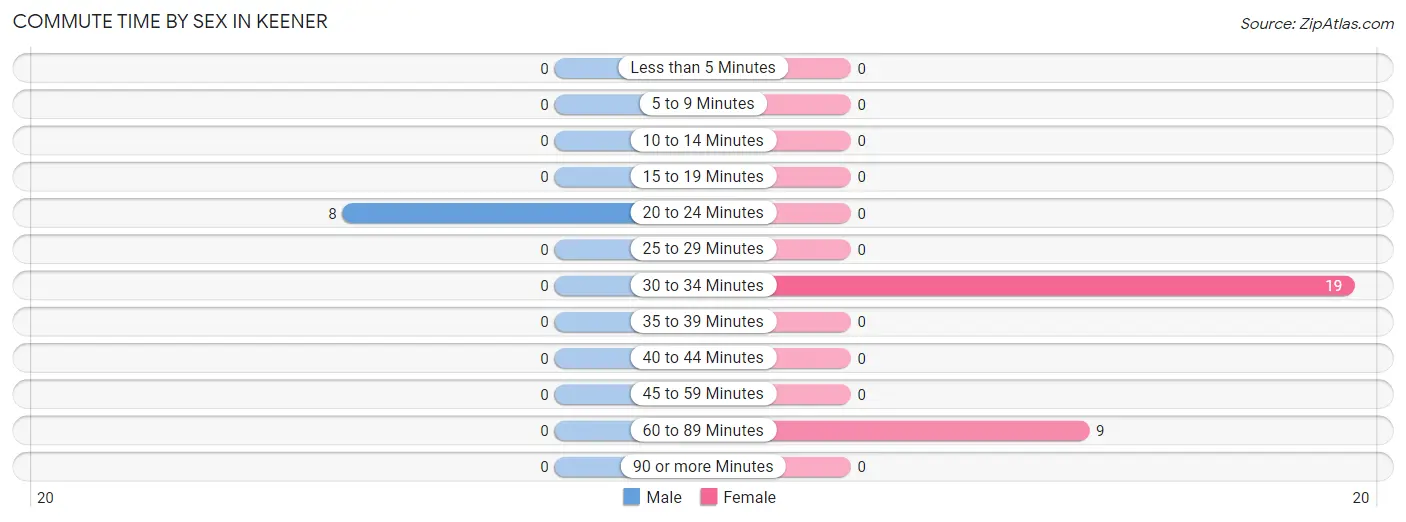
| Commute Time | Male | Female |
| Less than 5 Minutes | 0 (0.0%) | 0 (0.0%) |
| 5 to 9 Minutes | 0 (0.0%) | 0 (0.0%) |
| 10 to 14 Minutes | 0 (0.0%) | 0 (0.0%) |
| 15 to 19 Minutes | 0 (0.0%) | 0 (0.0%) |
| 20 to 24 Minutes | 8 (100.0%) | 0 (0.0%) |
| 25 to 29 Minutes | 0 (0.0%) | 0 (0.0%) |
| 30 to 34 Minutes | 0 (0.0%) | 19 (67.9%) |
| 35 to 39 Minutes | 0 (0.0%) | 0 (0.0%) |
| 40 to 44 Minutes | 0 (0.0%) | 0 (0.0%) |
| 45 to 59 Minutes | 0 (0.0%) | 0 (0.0%) |
| 60 to 89 Minutes | 0 (0.0%) | 9 (32.1%) |
| 90 or more Minutes | 0 (0.0%) | 0 (0.0%) |
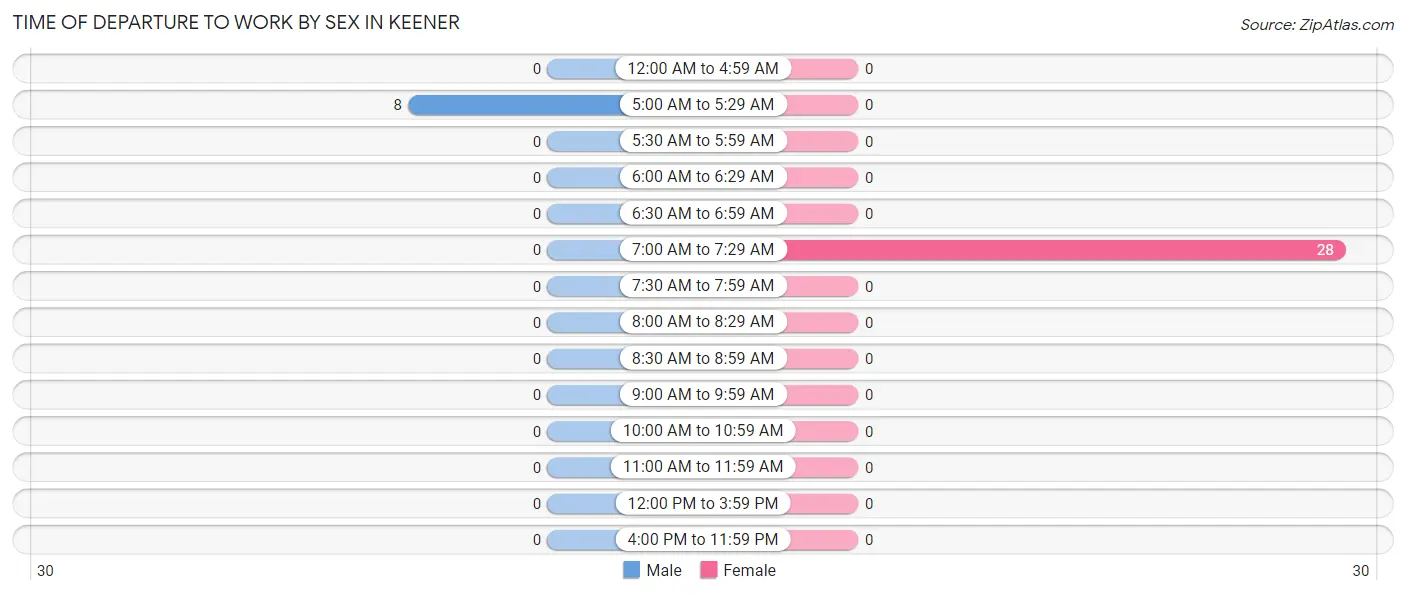
Time of Departure to Work by Sex in Keener
The most frequent times of departure to work in Keener are 5:00 AM to 5:29 AM (8, 100.0%) for males and 7:00 AM to 7:29 AM (28, 100.0%) for females.
| Time of Departure | Male | Female |
| 12:00 AM to 4:59 AM | 0 (0.0%) | 0 (0.0%) |
| 5:00 AM to 5:29 AM | 8 (100.0%) | 0 (0.0%) |
| 5:30 AM to 5:59 AM | 0 (0.0%) | 0 (0.0%) |
| 6:00 AM to 6:29 AM | 0 (0.0%) | 0 (0.0%) |
| 6:30 AM to 6:59 AM | 0 (0.0%) | 0 (0.0%) |
| 7:00 AM to 7:29 AM | 0 (0.0%) | 28 (100.0%) |
| 7:30 AM to 7:59 AM | 0 (0.0%) | 0 (0.0%) |
| 8:00 AM to 8:29 AM | 0 (0.0%) | 0 (0.0%) |
| 8:30 AM to 8:59 AM | 0 (0.0%) | 0 (0.0%) |
| 9:00 AM to 9:59 AM | 0 (0.0%) | 0 (0.0%) |
| 10:00 AM to 10:59 AM | 0 (0.0%) | 0 (0.0%) |
| 11:00 AM to 11:59 AM | 0 (0.0%) | 0 (0.0%) |
| 12:00 PM to 3:59 PM | 0 (0.0%) | 0 (0.0%) |
| 4:00 PM to 11:59 PM | 0 (0.0%) | 0 (0.0%) |
| Total | 8 (100.0%) | 28 (100.0%) |
Housing Occupancy in Keener
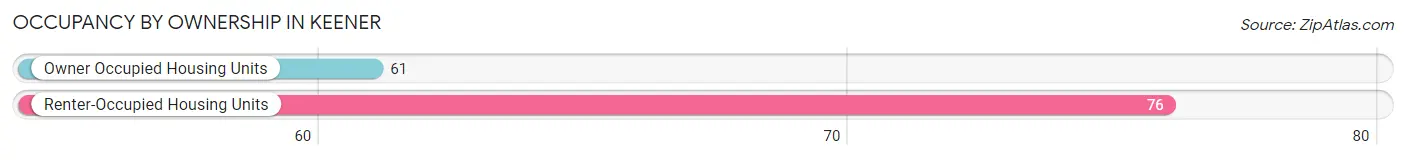
Occupancy by Ownership in Keener
Of the total 137 dwellings in Keener, owner-occupied units account for 61 (44.5%), while renter-occupied units make up 76 (55.5%).
| Occupancy | # Housing Units | % Housing Units |
| Owner Occupied Housing Units | 61 | 44.5% |
| Renter-Occupied Housing Units | 76 | 55.5% |
| Total Occupied Housing Units | 137 | 100.0% |
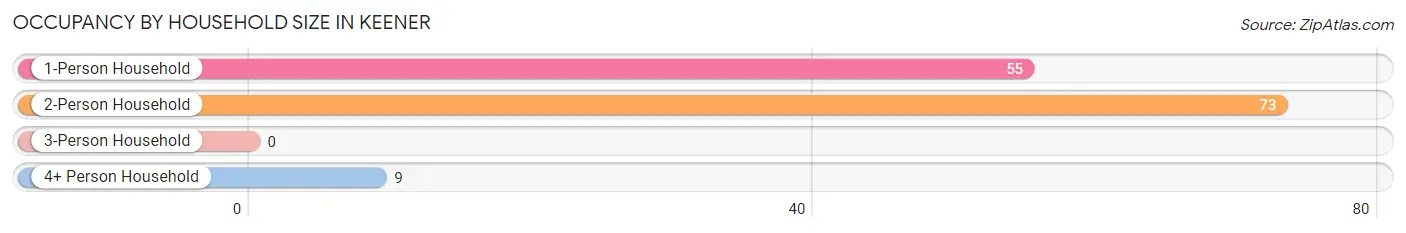
Occupancy by Household Size in Keener
| Household Size | # Housing Units | % Housing Units |
| 1-Person Household | 55 | 40.2% |
| 2-Person Household | 73 | 53.3% |
| 3-Person Household | 0 | 0.0% |
| 4+ Person Household | 9 | 6.6% |
| Total Housing Units | 137 | 100.0% |
Occupancy by Ownership by Household Size in Keener
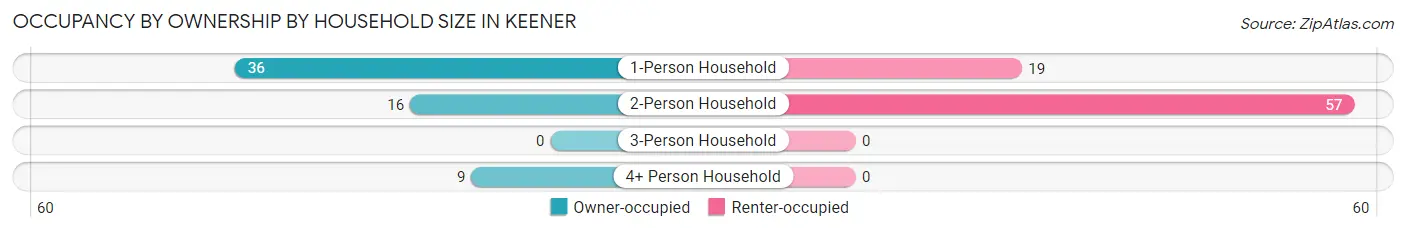
| Household Size | Owner-occupied | Renter-occupied |
| 1-Person Household | 36 (65.4%) | 19 (34.5%) |
| 2-Person Household | 16 (21.9%) | 57 (78.1%) |
| 3-Person Household | 0 (0.0%) | 0 (0.0%) |
| 4+ Person Household | 9 (100.0%) | 0 (0.0%) |
| Total Housing Units | 61 (44.5%) | 76 (55.5%) |
Occupancy by Educational Attainment in Keener
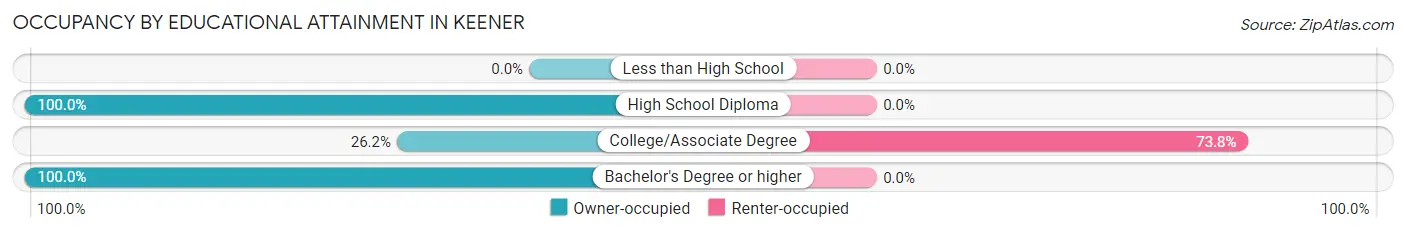
| Household Size | Owner-occupied | Renter-occupied |
| Less than High School | 0 (0.0%) | 0 (0.0%) |
| High School Diploma | 25 (100.0%) | 0 (0.0%) |
| College/Associate Degree | 27 (26.2%) | 76 (73.8%) |
| Bachelor's Degree or higher | 9 (100.0%) | 0 (0.0%) |
Occupancy by Age of Householder in Keener
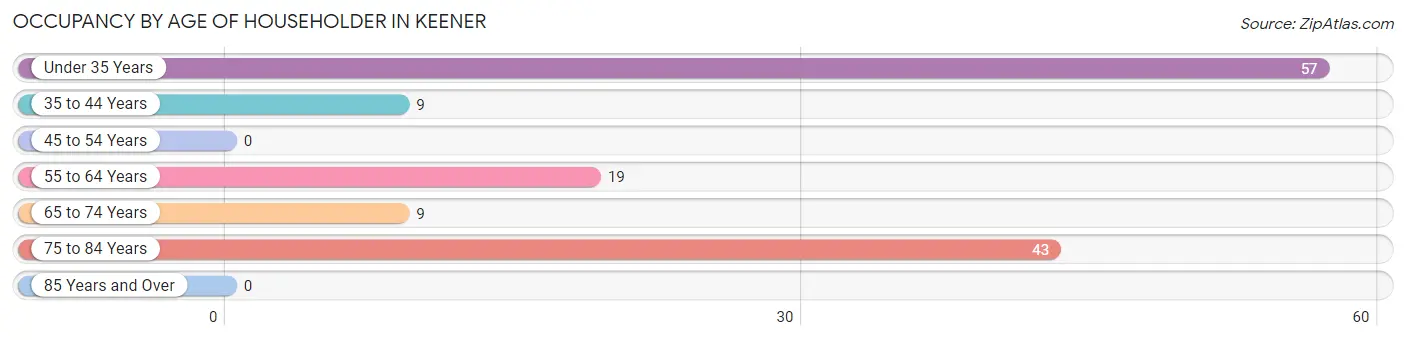
| Age Bracket | # Households | % Households |
| Under 35 Years | 57 | 41.6% |
| 35 to 44 Years | 9 | 6.6% |
| 45 to 54 Years | 0 | 0.0% |
| 55 to 64 Years | 19 | 13.9% |
| 65 to 74 Years | 9 | 6.6% |
| 75 to 84 Years | 43 | 31.4% |
| 85 Years and Over | 0 | 0.0% |
| Total | 137 | 100.0% |
Housing Finances in Keener
Median Income by Occupancy in Keener
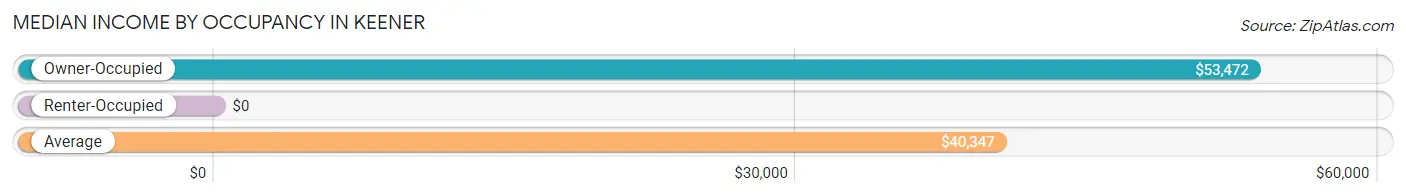
| Occupancy Type | # Households | Median Income |
| Owner-Occupied | 61 (44.5%) | $53,472 |
| Renter-Occupied | 76 (55.5%) | $0 |
| Average | 137 (100.0%) | $40,347 |
Occupancy by Householder Income Bracket in Keener
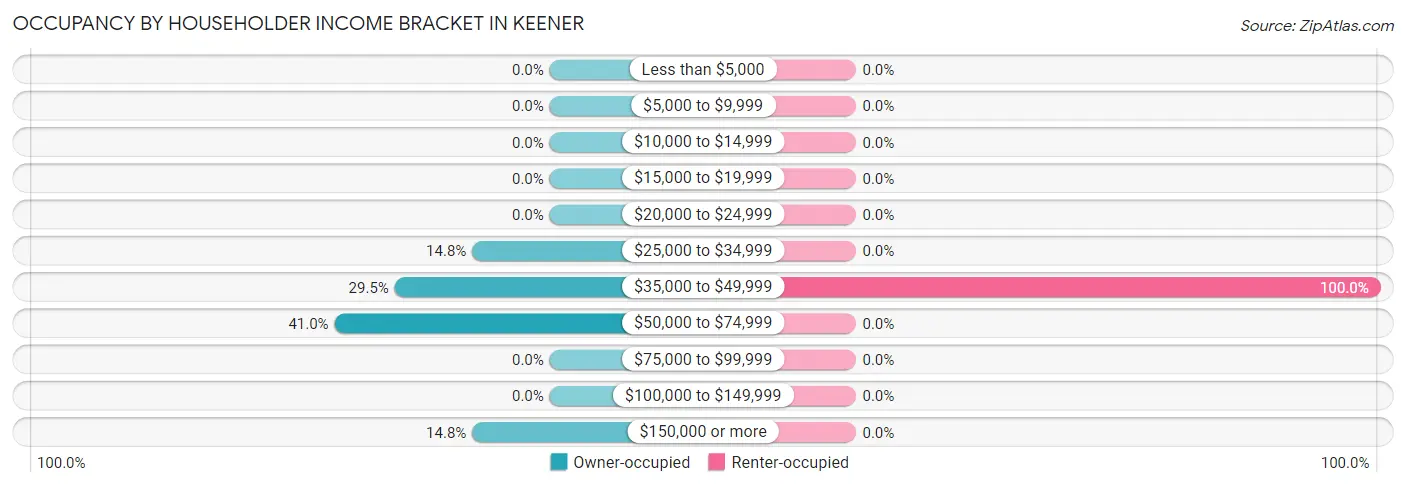
| Income Bracket | Owner-occupied | Renter-occupied |
| Less than $5,000 | 0 (0.0%) | 0 (0.0%) |
| $5,000 to $9,999 | 0 (0.0%) | 0 (0.0%) |
| $10,000 to $14,999 | 0 (0.0%) | 0 (0.0%) |
| $15,000 to $19,999 | 0 (0.0%) | 0 (0.0%) |
| $20,000 to $24,999 | 0 (0.0%) | 0 (0.0%) |
| $25,000 to $34,999 | 9 (14.7%) | 0 (0.0%) |
| $35,000 to $49,999 | 18 (29.5%) | 76 (100.0%) |
| $50,000 to $74,999 | 25 (41.0%) | 0 (0.0%) |
| $75,000 to $99,999 | 0 (0.0%) | 0 (0.0%) |
| $100,000 to $149,999 | 0 (0.0%) | 0 (0.0%) |
| $150,000 or more | 9 (14.7%) | 0 (0.0%) |
| Total | 61 (100.0%) | 76 (100.0%) |
Monthly Housing Cost Tiers in Keener
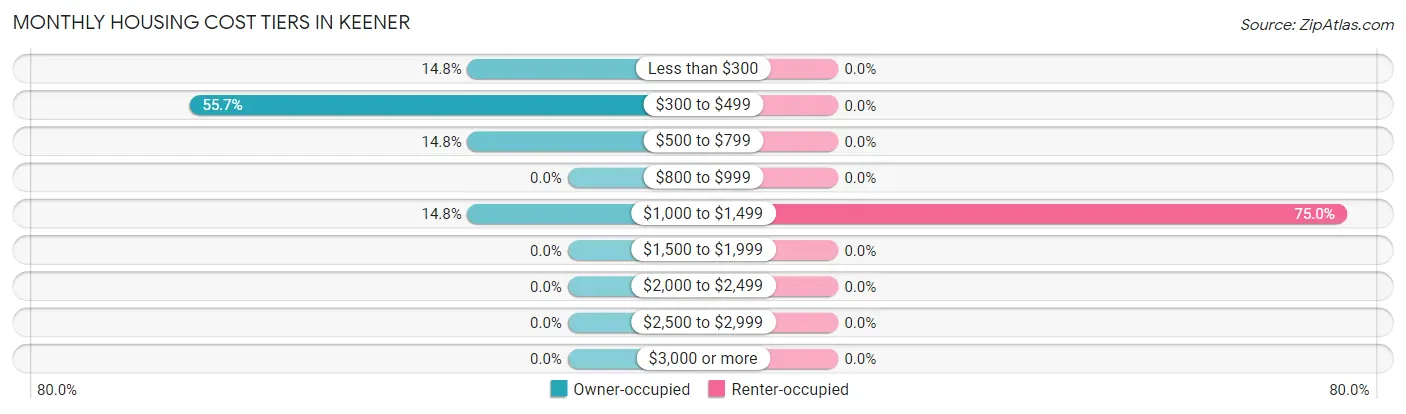
| Monthly Cost | Owner-occupied | Renter-occupied |
| Less than $300 | 9 (14.7%) | 0 (0.0%) |
| $300 to $499 | 34 (55.7%) | 0 (0.0%) |
| $500 to $799 | 9 (14.7%) | 0 (0.0%) |
| $800 to $999 | 0 (0.0%) | 0 (0.0%) |
| $1,000 to $1,499 | 9 (14.7%) | 57 (75.0%) |
| $1,500 to $1,999 | 0 (0.0%) | 0 (0.0%) |
| $2,000 to $2,499 | 0 (0.0%) | 0 (0.0%) |
| $2,500 to $2,999 | 0 (0.0%) | 0 (0.0%) |
| $3,000 or more | 0 (0.0%) | 0 (0.0%) |
| Total | 61 (100.0%) | 76 (100.0%) |
Physical Housing Characteristics in Keener
Housing Structures in Keener
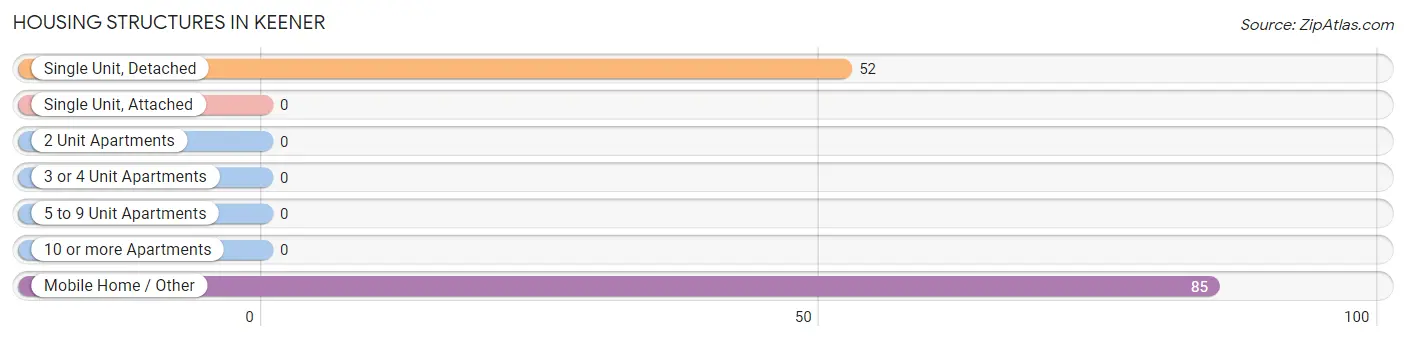
| Structure Type | # Housing Units | % Housing Units |
| Single Unit, Detached | 52 | 38.0% |
| Single Unit, Attached | 0 | 0.0% |
| 2 Unit Apartments | 0 | 0.0% |
| 3 or 4 Unit Apartments | 0 | 0.0% |
| 5 to 9 Unit Apartments | 0 | 0.0% |
| 10 or more Apartments | 0 | 0.0% |
| Mobile Home / Other | 85 | 62.0% |
| Total | 137 | 100.0% |
Housing Structures by Occupancy in Keener
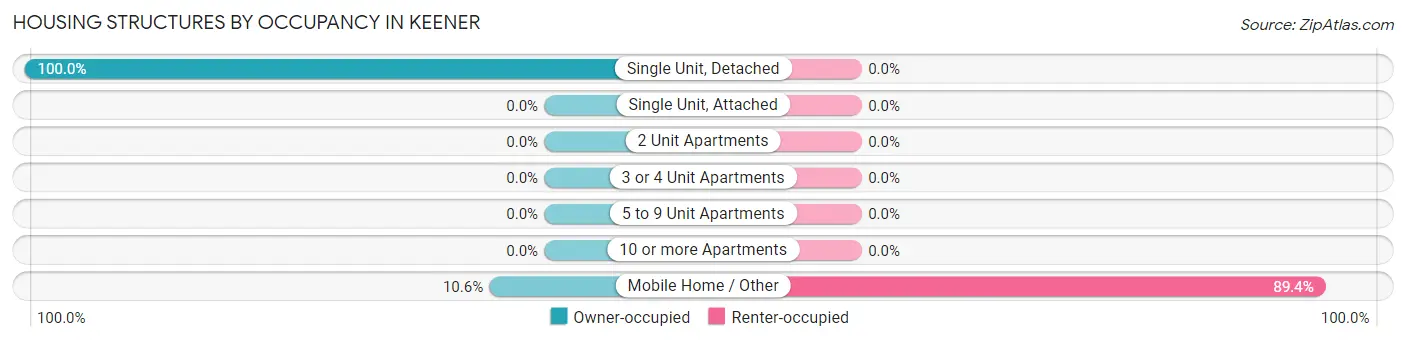
| Structure Type | Owner-occupied | Renter-occupied |
| Single Unit, Detached | 52 (100.0%) | 0 (0.0%) |
| Single Unit, Attached | 0 (0.0%) | 0 (0.0%) |
| 2 Unit Apartments | 0 (0.0%) | 0 (0.0%) |
| 3 or 4 Unit Apartments | 0 (0.0%) | 0 (0.0%) |
| 5 to 9 Unit Apartments | 0 (0.0%) | 0 (0.0%) |
| 10 or more Apartments | 0 (0.0%) | 0 (0.0%) |
| Mobile Home / Other | 9 (10.6%) | 76 (89.4%) |
| Total | 61 (44.5%) | 76 (55.5%) |
Housing Structures by Number of Rooms in Keener
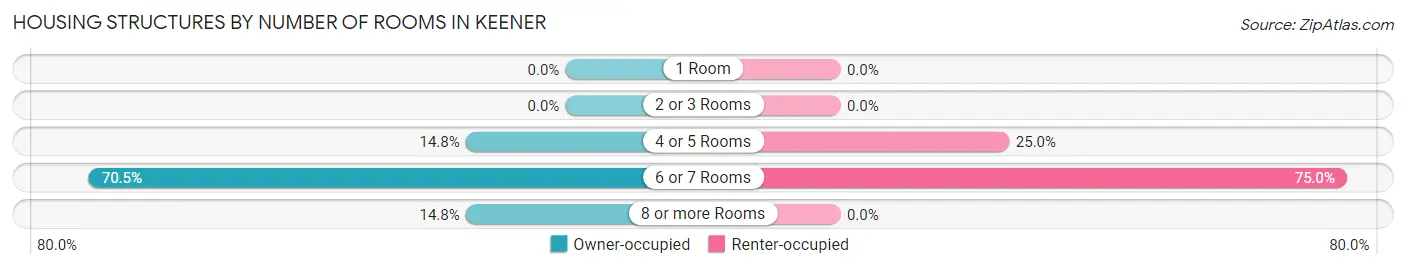
| Number of Rooms | Owner-occupied | Renter-occupied |
| 1 Room | 0 (0.0%) | 0 (0.0%) |
| 2 or 3 Rooms | 0 (0.0%) | 0 (0.0%) |
| 4 or 5 Rooms | 9 (14.7%) | 19 (25.0%) |
| 6 or 7 Rooms | 43 (70.5%) | 57 (75.0%) |
| 8 or more Rooms | 9 (14.7%) | 0 (0.0%) |
| Total | 61 (100.0%) | 76 (100.0%) |
Housing Structure by Heating Type in Keener
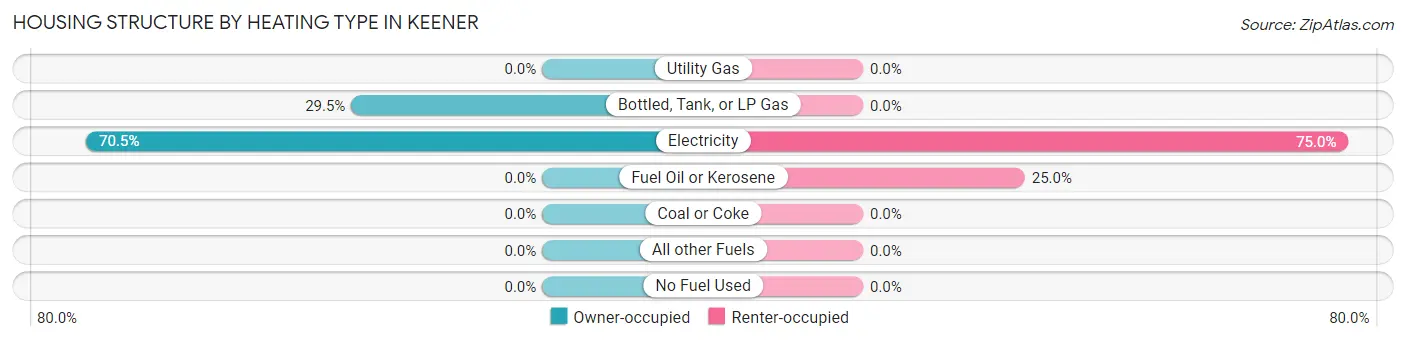
| Heating Type | Owner-occupied | Renter-occupied |
| Utility Gas | 0 (0.0%) | 0 (0.0%) |
| Bottled, Tank, or LP Gas | 18 (29.5%) | 0 (0.0%) |
| Electricity | 43 (70.5%) | 57 (75.0%) |
| Fuel Oil or Kerosene | 0 (0.0%) | 19 (25.0%) |
| Coal or Coke | 0 (0.0%) | 0 (0.0%) |
| All other Fuels | 0 (0.0%) | 0 (0.0%) |
| No Fuel Used | 0 (0.0%) | 0 (0.0%) |
| Total | 61 (100.0%) | 76 (100.0%) |
Household Vehicle Usage in Keener
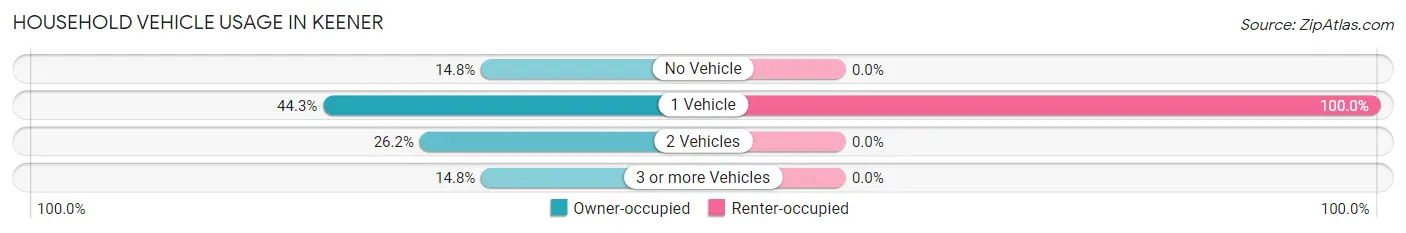
| Vehicles per Household | Owner-occupied | Renter-occupied |
| No Vehicle | 9 (14.7%) | 0 (0.0%) |
| 1 Vehicle | 27 (44.3%) | 76 (100.0%) |
| 2 Vehicles | 16 (26.2%) | 0 (0.0%) |
| 3 or more Vehicles | 9 (14.7%) | 0 (0.0%) |
| Total | 61 (100.0%) | 76 (100.0%) |
Real Estate & Mortgages in Keener
Real Estate and Mortgage Overview in Keener
| Characteristic | Without Mortgage | With Mortgage |
| Housing Units | 52 | 9 |
| Median Property Value | $101,400 | $0 |
| Median Household Income | $42,361 | $9 |
| Monthly Housing Costs | $325 | $0 |
| Real Estate Taxes | - | - |
Property Value by Mortgage Status in Keener
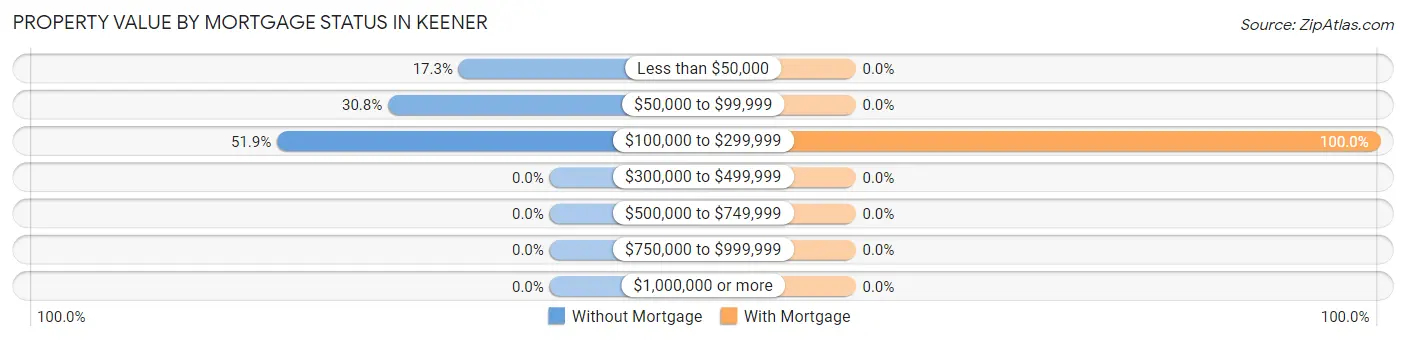
| Property Value | Without Mortgage | With Mortgage |
| Less than $50,000 | 9 (17.3%) | 0 (0.0%) |
| $50,000 to $99,999 | 16 (30.8%) | 0 (0.0%) |
| $100,000 to $299,999 | 27 (51.9%) | 9 (100.0%) |
| $300,000 to $499,999 | 0 (0.0%) | 0 (0.0%) |
| $500,000 to $749,999 | 0 (0.0%) | 0 (0.0%) |
| $750,000 to $999,999 | 0 (0.0%) | 0 (0.0%) |
| $1,000,000 or more | 0 (0.0%) | 0 (0.0%) |
| Total | 52 (100.0%) | 9 (100.0%) |
Household Income by Mortgage Status in Keener
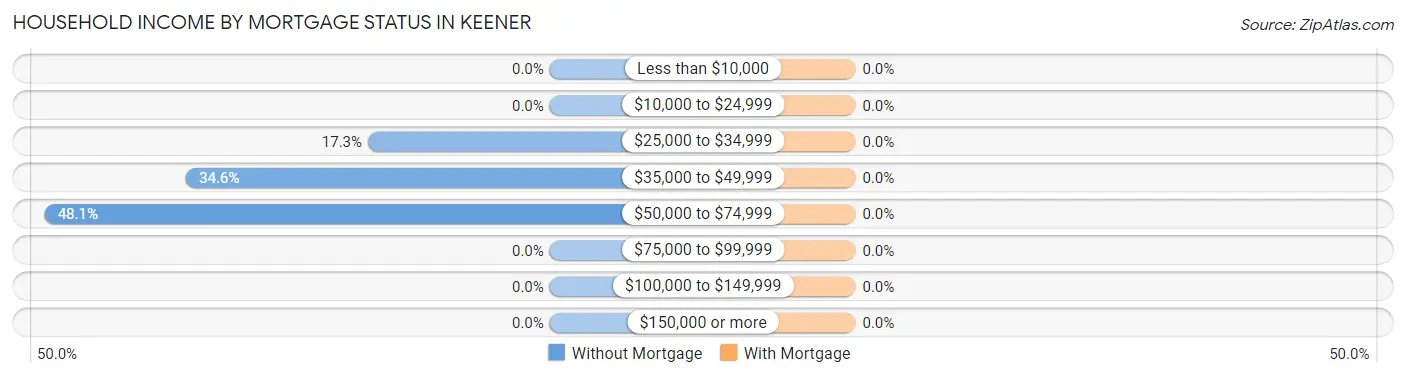
| Household Income | Without Mortgage | With Mortgage |
| Less than $10,000 | 0 (0.0%) | 0 (0.0%) |
| $10,000 to $24,999 | 0 (0.0%) | 0 (0.0%) |
| $25,000 to $34,999 | 9 (17.3%) | 0 (0.0%) |
| $35,000 to $49,999 | 18 (34.6%) | 0 (0.0%) |
| $50,000 to $74,999 | 25 (48.1%) | 0 (0.0%) |
| $75,000 to $99,999 | 0 (0.0%) | 0 (0.0%) |
| $100,000 to $149,999 | 0 (0.0%) | 0 (0.0%) |
| $150,000 or more | 0 (0.0%) | 0 (0.0%) |
| Total | 52 (100.0%) | 9 (100.0%) |
Property Value to Household Income Ratio in Keener
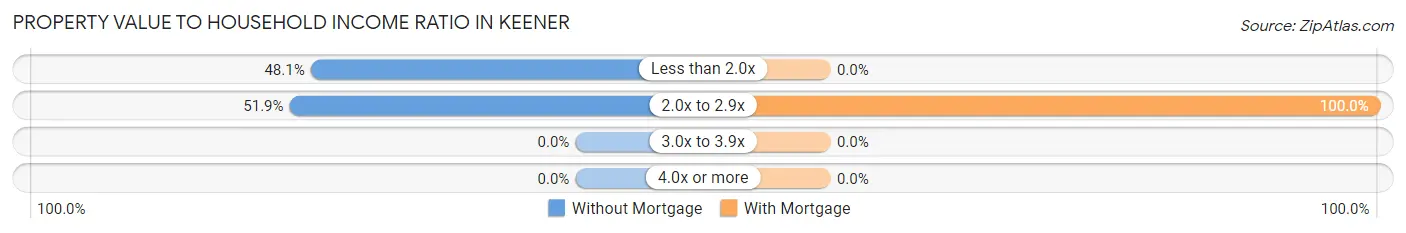
| Value-to-Income Ratio | Without Mortgage | With Mortgage |
| Less than 2.0x | 25 (48.1%) | 0 (0.0%) |
| 2.0x to 2.9x | 27 (51.9%) | 9 (100.0%) |
| 3.0x to 3.9x | 0 (0.0%) | 0 (0.0%) |
| 4.0x or more | 0 (0.0%) | 0 (0.0%) |
| Total | 52 (100.0%) | 9 (100.0%) |
Real Estate Taxes by Mortgage Status in Keener
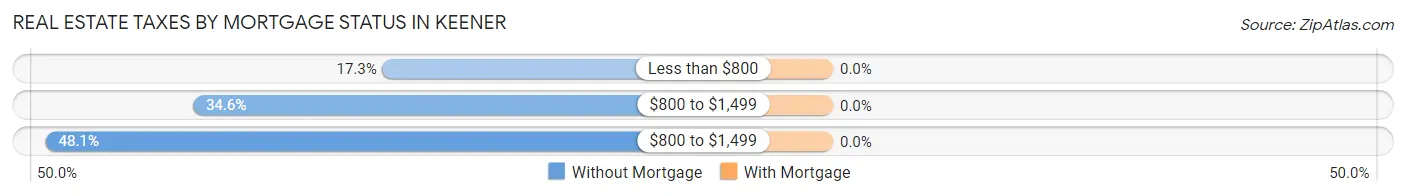
| Property Taxes | Without Mortgage | With Mortgage |
| Less than $800 | 9 (17.3%) | 0 (0.0%) |
| $800 to $1,499 | 18 (34.6%) | 0 (0.0%) |
| $800 to $1,499 | 25 (48.1%) | 0 (0.0%) |
| Total | 52 (100.0%) | 9 (100.0%) |
Health & Disability in Keener
Health Insurance Coverage by Age in Keener
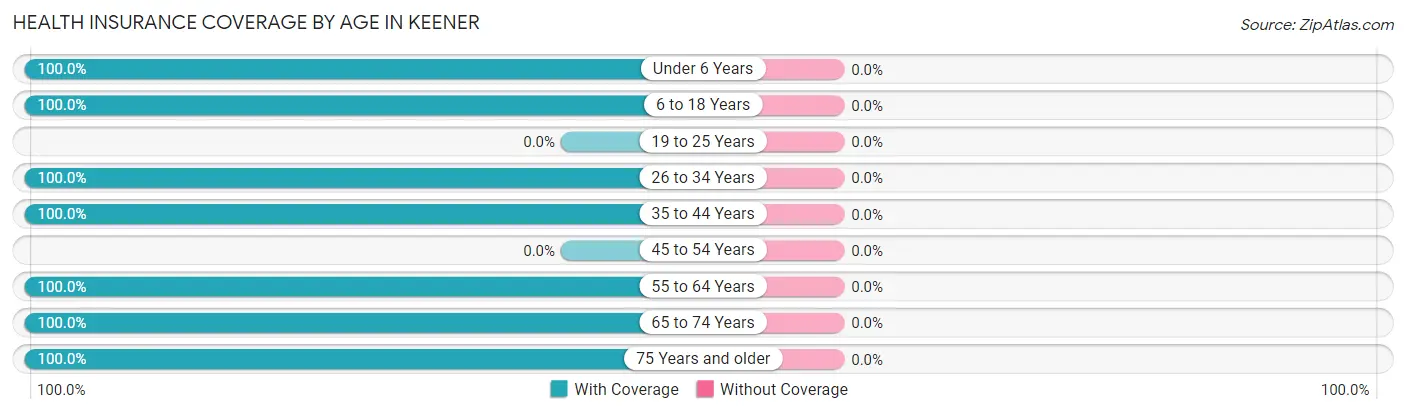
| Age Bracket | With Coverage | Without Coverage |
| Under 6 Years | 61 (100.0%) | 0 (0.0%) |
| 6 to 18 Years | 20 (100.0%) | 0 (0.0%) |
| 19 to 25 Years | 0 (0.0%) | 0 (0.0%) |
| 26 to 34 Years | 57 (100.0%) | 0 (0.0%) |
| 35 to 44 Years | 17 (100.0%) | 0 (0.0%) |
| 45 to 54 Years | 0 (0.0%) | 0 (0.0%) |
| 55 to 64 Years | 19 (100.0%) | 0 (0.0%) |
| 65 to 74 Years | 9 (100.0%) | 0 (0.0%) |
| 75 Years and older | 54 (100.0%) | 0 (0.0%) |
| Total | 237 (100.0%) | 0 (0.0%) |
Health Insurance Coverage by Citizenship Status in Keener
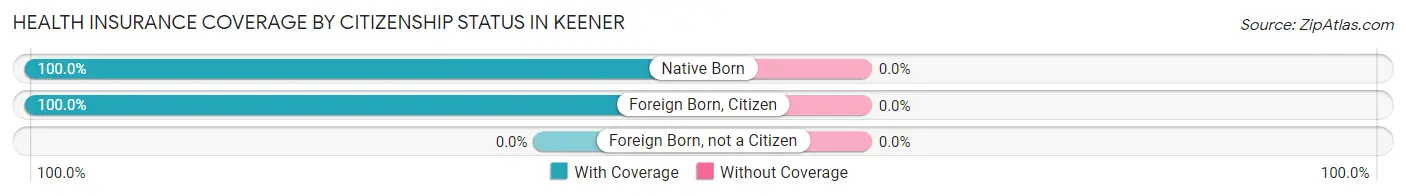
| Citizenship Status | With Coverage | Without Coverage |
| Native Born | 61 (100.0%) | 0 (0.0%) |
| Foreign Born, Citizen | 20 (100.0%) | 0 (0.0%) |
| Foreign Born, not a Citizen | 0 (0.0%) | 0 (0.0%) |
Health Insurance Coverage by Household Income in Keener
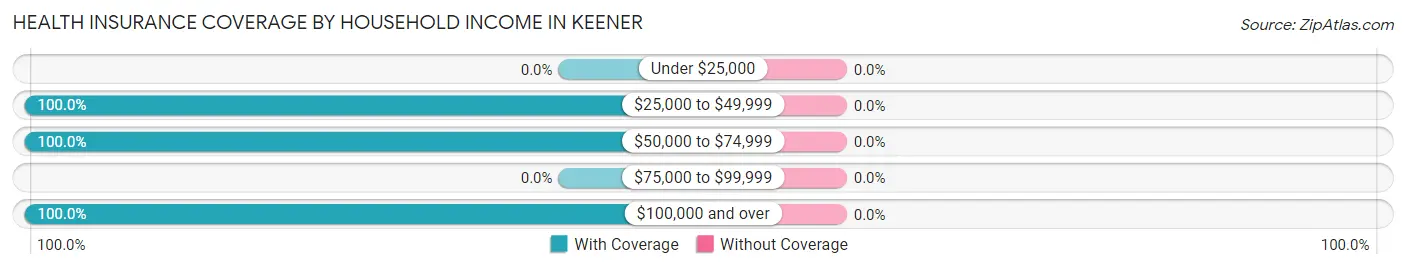
| Household Income | With Coverage | Without Coverage |
| Under $25,000 | 0 (0.0%) | 0 (0.0%) |
| $25,000 to $49,999 | 164 (100.0%) | 0 (0.0%) |
| $50,000 to $74,999 | 36 (100.0%) | 0 (0.0%) |
| $75,000 to $99,999 | 0 (0.0%) | 0 (0.0%) |
| $100,000 and over | 37 (100.0%) | 0 (0.0%) |
Public vs Private Health Insurance Coverage by Age in Keener
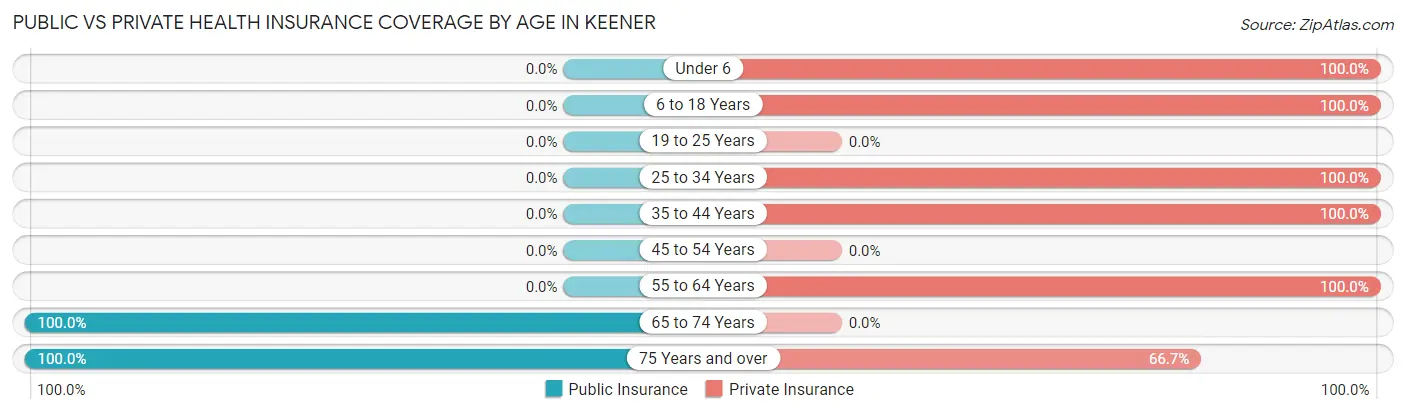
| Age Bracket | Public Insurance | Private Insurance |
| Under 6 | 0 (0.0%) | 61 (100.0%) |
| 6 to 18 Years | 0 (0.0%) | 20 (100.0%) |
| 19 to 25 Years | 0 (0.0%) | 0 (0.0%) |
| 25 to 34 Years | 0 (0.0%) | 57 (100.0%) |
| 35 to 44 Years | 0 (0.0%) | 17 (100.0%) |
| 45 to 54 Years | 0 (0.0%) | 0 (0.0%) |
| 55 to 64 Years | 0 (0.0%) | 19 (100.0%) |
| 65 to 74 Years | 9 (100.0%) | 0 (0.0%) |
| 75 Years and over | 54 (100.0%) | 36 (66.7%) |
| Total | 63 (26.6%) | 210 (88.6%) |
Disability Status by Sex by Age in Keener
| Age Bracket | Male | Female |
| Under 5 Years | 0 (0.0%) | 0 (0.0%) |
| 5 to 17 Years | 0 (0.0%) | 0 (0.0%) |
| 18 to 34 Years | 0 (0.0%) | 0 (0.0%) |
| 35 to 64 Years | 0 (0.0%) | 0 (0.0%) |
| 65 to 74 Years | 0 (0.0%) | 0 (0.0%) |
| 75 Years and over | 0 (0.0%) | 0 (0.0%) |
Disability Class by Sex by Age in Keener
Disability Class: Hearing Difficulty
| Age Bracket | Male | Female |
| Under 5 Years | 0 (0.0%) | 0 (0.0%) |
| 5 to 17 Years | 0 (0.0%) | 0 (0.0%) |
| 18 to 34 Years | 0 (0.0%) | 0 (0.0%) |
| 35 to 64 Years | 0 (0.0%) | 0 (0.0%) |
| 65 to 74 Years | 0 (0.0%) | 0 (0.0%) |
| 75 Years and over | 0 (0.0%) | 0 (0.0%) |
Disability Class: Vision Difficulty
| Age Bracket | Male | Female |
| Under 5 Years | 0 (0.0%) | 0 (0.0%) |
| 5 to 17 Years | 0 (0.0%) | 0 (0.0%) |
| 18 to 34 Years | 0 (0.0%) | 0 (0.0%) |
| 35 to 64 Years | 0 (0.0%) | 0 (0.0%) |
| 65 to 74 Years | 0 (0.0%) | 0 (0.0%) |
| 75 Years and over | 0 (0.0%) | 0 (0.0%) |
Disability Class: Cognitive Difficulty
| Age Bracket | Male | Female |
| 5 to 17 Years | 0 (0.0%) | 0 (0.0%) |
| 18 to 34 Years | 0 (0.0%) | 0 (0.0%) |
| 35 to 64 Years | 0 (0.0%) | 0 (0.0%) |
| 65 to 74 Years | 0 (0.0%) | 0 (0.0%) |
| 75 Years and over | 0 (0.0%) | 0 (0.0%) |
Disability Class: Ambulatory Difficulty
| Age Bracket | Male | Female |
| 5 to 17 Years | 0 (0.0%) | 0 (0.0%) |
| 18 to 34 Years | 0 (0.0%) | 0 (0.0%) |
| 35 to 64 Years | 0 (0.0%) | 0 (0.0%) |
| 65 to 74 Years | 0 (0.0%) | 0 (0.0%) |
| 75 Years and over | 0 (0.0%) | 0 (0.0%) |
Disability Class: Self-Care Difficulty
| Age Bracket | Male | Female |
| 5 to 17 Years | 0 (0.0%) | 0 (0.0%) |
| 18 to 34 Years | 0 (0.0%) | 0 (0.0%) |
| 35 to 64 Years | 0 (0.0%) | 0 (0.0%) |
| 65 to 74 Years | 0 (0.0%) | 0 (0.0%) |
| 75 Years and over | 0 (0.0%) | 0 (0.0%) |
Technology Access in Keener
Computing Device Access in Keener
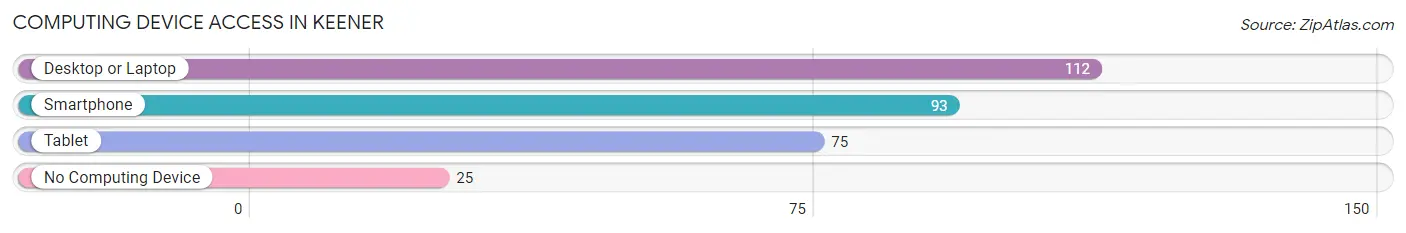
| Device Type | # Households | % Households |
| Desktop or Laptop | 112 | 81.8% |
| Smartphone | 93 | 67.9% |
| Tablet | 75 | 54.7% |
| No Computing Device | 25 | 18.2% |
| Total | 137 | 100.0% |
Internet Access in Keener
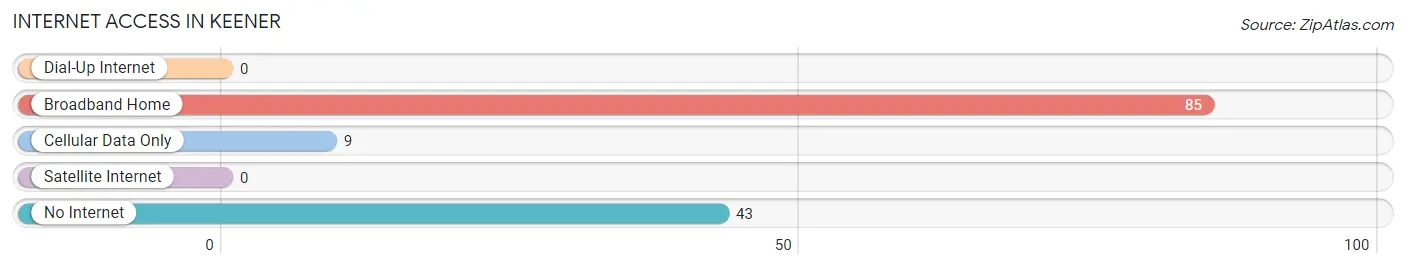
| Internet Type | # Households | % Households |
| Dial-Up Internet | 0 | 0.0% |
| Broadband Home | 85 | 62.0% |
| Cellular Data Only | 9 | 6.6% |
| Satellite Internet | 0 | 0.0% |
| No Internet | 43 | 31.4% |
| Total | 137 | 100.0% |
Keener Summary
Keener, North Carolina is a small town located in the foothills of the Blue Ridge Mountains in the western part of the state. It is situated in Wilkes County, and is part of the North Wilkesboro Micropolitan Statistical Area. The town has a population of just over 1,000 people, and is known for its rural charm and small-town atmosphere.
History
Keener was founded in 1845 by a group of settlers from the nearby town of Wilkesboro. The town was named after a local settler, John Keener, who was a prominent figure in the area. The town was originally a farming community, and the main crops grown were corn, wheat, and tobacco. In the late 19th century, the town began to grow and develop, and by the early 20th century, it had become a thriving community.
Geography
Keener is located in the foothills of the Blue Ridge Mountains, and is situated in Wilkes County. The town is located at an elevation of 1,400 feet, and is surrounded by rolling hills and lush forests. The town is located near the Yadkin River, and is just a few miles from the North Carolina-Virginia border.
Economy
Keener’s economy is largely based on agriculture and tourism. The town is home to several farms, which produce a variety of crops, including corn, wheat, and tobacco. The town is also home to several small businesses, including restaurants, shops, and other services. Tourism is also an important part of the local economy, as the town is a popular destination for outdoor activities such as hiking, fishing, and camping.
Demographics
As of the 2010 census, Keener had a population of 1,072 people. The racial makeup of the town was 95.3% White, 1.2% African American, 0.7% Native American, 0.3% Asian, and 2.5% from other races. The median household income was $30,938, and the median family income was $37,813. The town’s population is largely rural, with most of the population living in small towns and rural areas.
Keener is a small town with a rich history and a unique culture. The town is known for its rural charm and small-town atmosphere, and is a popular destination for outdoor activities. The town’s economy is largely based on agriculture and tourism, and the town is home to several small businesses. The town’s population is largely rural, and the median household income is slightly below the national average.
Common Questions
What is Per Capita Income in Keener?
Per Capita income in Keener is $28,981.
What is the Median Family Income in Keener?
Median Family Income in Keener is $36,798.
What is the Median Household income in Keener?
Median Household Income in Keener is $40,347.
What is Inequality or Gini Index in Keener?
Inequality or Gini Index in Keener is 0.25.
What is the Total Population of Keener?
Total Population of Keener is 237.
What is the Total Male Population of Keener?
Total Male Population of Keener is 42.
What is the Total Female Population of Keener?
Total Female Population of Keener is 195.
What is the Ratio of Males per 100 Females in Keener?
There are 21.54 Males per 100 Females in Keener.
What is the Ratio of Females per 100 Males in Keener?
There are 464.29 Females per 100 Males in Keener.
What is the Median Population Age in Keener?
Median Population Age in Keener is 29.7 Years.
What is the Average Family Size in Keener
Average Family Size in Keener is 2.2 People.
What is the Average Household Size in Keener
Average Household Size in Keener is 1.7 People.
How Large is the Labor Force in Keener?
There are 93 People in the Labor Forcein in Keener.
What is the Percentage of People in the Labor Force in Keener?
59.6% of People are in the Labor Force in Keener.