Eastover, NC Map & Demographics
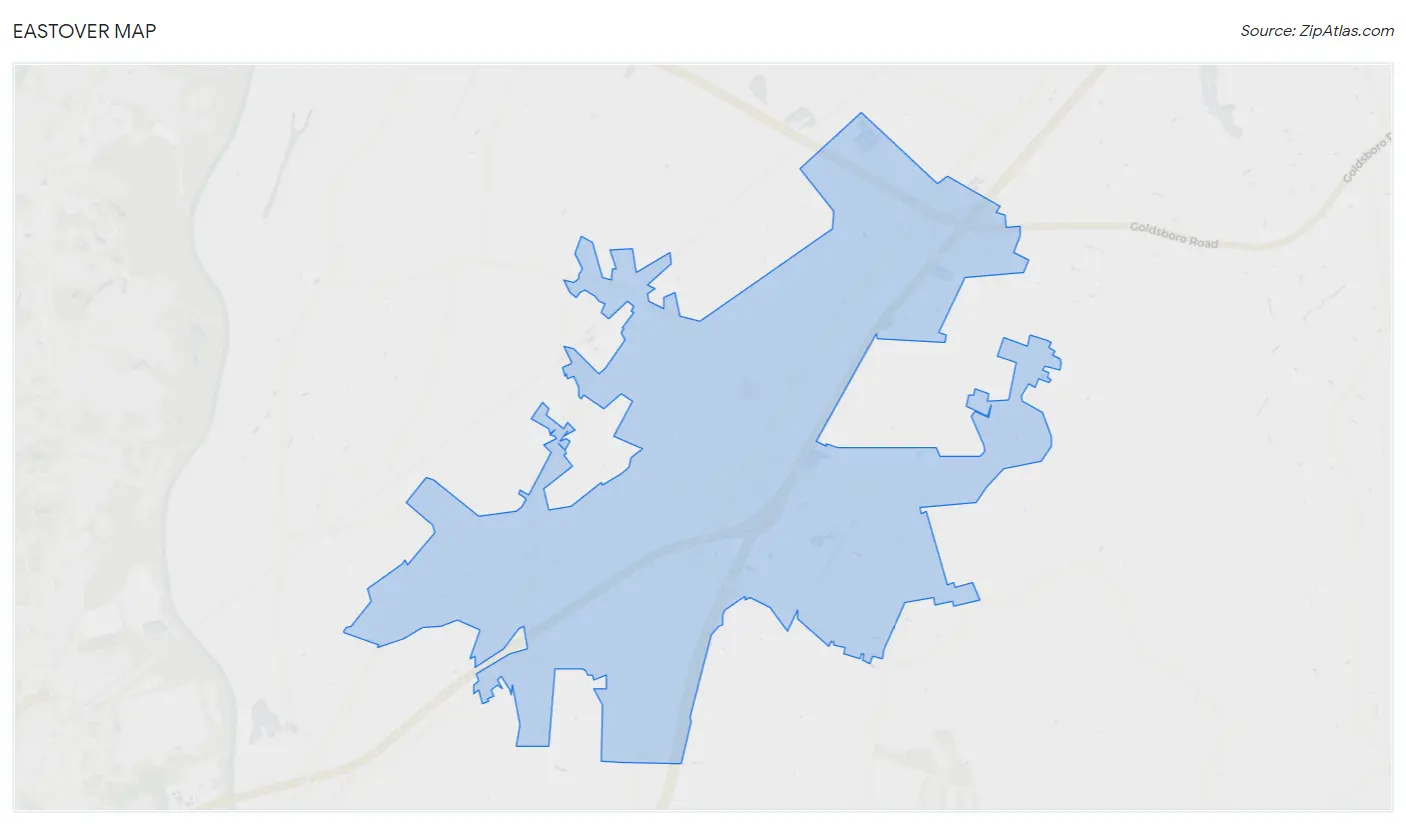
Eastover Map
Eastover Overview
$35,489
PER CAPITA INCOME
$79,044
AVG FAMILY INCOME
$68,646
AVG HOUSEHOLD INCOME
13.2%
WAGE / INCOME GAP [ % ]
86.8¢/ $1
WAGE / INCOME GAP [ $ ]
$13,306
FAMILY INCOME DEFICIT
0.44
INEQUALITY / GINI INDEX
3,659
TOTAL POPULATION
2,021
MALE POPULATION
1,638
FEMALE POPULATION
123.38
MALES / 100 FEMALES
81.05
FEMALES / 100 MALES
48.1
MEDIAN AGE
3.0
AVG FAMILY SIZE
2.5
AVG HOUSEHOLD SIZE
1,571
LABOR FORCE [ PEOPLE ]
51.9%
PERCENT IN LABOR FORCE
6.2%
UNEMPLOYMENT RATE
Eastover Area Codes
Income in Eastover
Income Overview in Eastover
Per Capita Income in Eastover is $35,489, while median incomes of families and households are $79,044 and $68,646 respectively.
| Characteristic | Number | Measure |
| Per Capita Income | 3,659 | $35,489 |
| Median Family Income | 1,058 | $79,044 |
| Mean Family Income | 1,058 | $96,138 |
| Median Household Income | 1,419 | $68,646 |
| Mean Household Income | 1,419 | $89,975 |
| Income Deficit | 1,058 | $13,306 |
| Wage / Income Gap (%) | 3,659 | 13.21% |
| Wage / Income Gap ($) | 3,659 | 86.79¢ per $1 |
| Gini / Inequality Index | 3,659 | 0.44 |
Earnings by Sex in Eastover
Average Earnings in Eastover are $33,960, $35,875 for men and $31,136 for women, a difference of 13.2%.
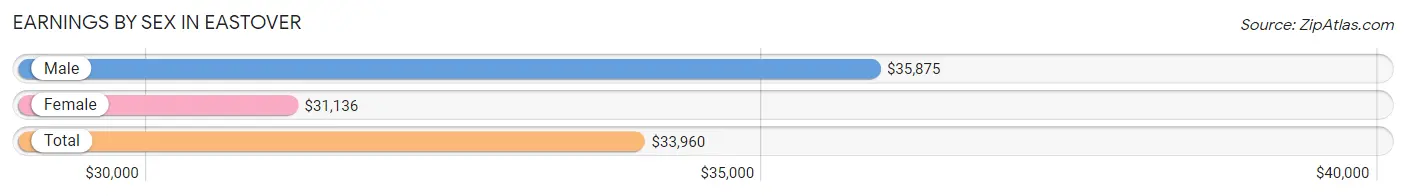
| Sex | Number | Average Earnings |
| Male | 930 (57.3%) | $35,875 |
| Female | 694 (42.7%) | $31,136 |
| Total | 1,624 (100.0%) | $33,960 |
Earnings by Sex by Income Bracket in Eastover
The most common earnings brackets in Eastover are $100,000+ for men (125 | 13.4%) and $100,000+ for women (111 | 16.0%).
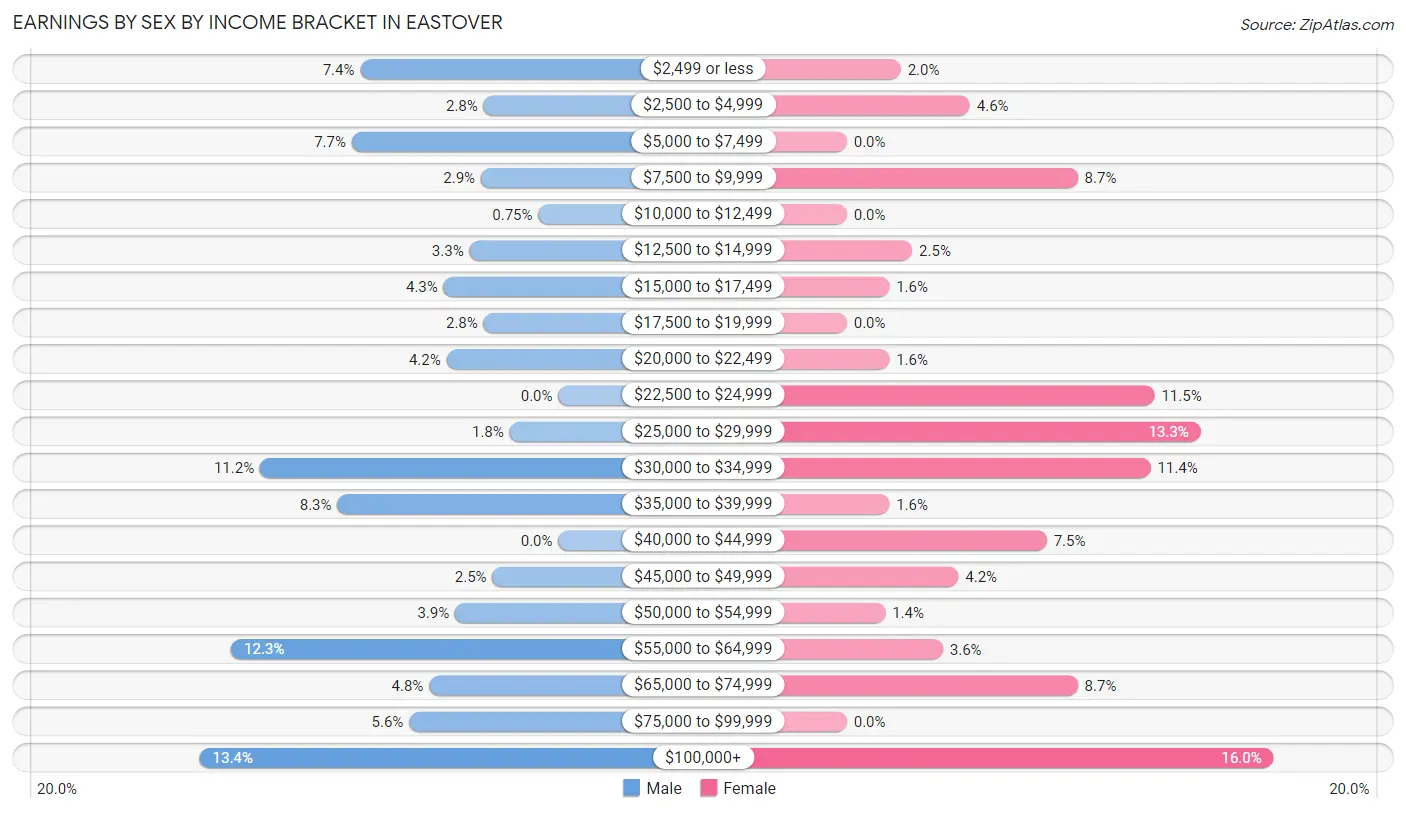
| Income | Male | Female |
| $2,499 or less | 69 (7.4%) | 14 (2.0%) |
| $2,500 to $4,999 | 26 (2.8%) | 32 (4.6%) |
| $5,000 to $7,499 | 72 (7.7%) | 0 (0.0%) |
| $7,500 to $9,999 | 27 (2.9%) | 60 (8.6%) |
| $10,000 to $12,499 | 7 (0.7%) | 0 (0.0%) |
| $12,500 to $14,999 | 31 (3.3%) | 17 (2.5%) |
| $15,000 to $17,499 | 40 (4.3%) | 11 (1.6%) |
| $17,500 to $19,999 | 26 (2.8%) | 0 (0.0%) |
| $20,000 to $22,499 | 39 (4.2%) | 11 (1.6%) |
| $22,500 to $24,999 | 0 (0.0%) | 80 (11.5%) |
| $25,000 to $29,999 | 17 (1.8%) | 92 (13.3%) |
| $30,000 to $34,999 | 104 (11.2%) | 79 (11.4%) |
| $35,000 to $39,999 | 77 (8.3%) | 11 (1.6%) |
| $40,000 to $44,999 | 0 (0.0%) | 52 (7.5%) |
| $45,000 to $49,999 | 23 (2.5%) | 29 (4.2%) |
| $50,000 to $54,999 | 36 (3.9%) | 10 (1.4%) |
| $55,000 to $64,999 | 114 (12.3%) | 25 (3.6%) |
| $65,000 to $74,999 | 45 (4.8%) | 60 (8.6%) |
| $75,000 to $99,999 | 52 (5.6%) | 0 (0.0%) |
| $100,000+ | 125 (13.4%) | 111 (16.0%) |
| Total | 930 (100.0%) | 694 (100.0%) |
Earnings by Sex by Educational Attainment in Eastover
Average earnings in Eastover are $39,145 for men and $32,462 for women, a difference of 17.1%. Men with an educational attainment of college or associate's degree enjoy the highest average annual earnings of $57,019, while those with high school diploma education earn the least with $19,423. Women with an educational attainment of graduate degree earn the most with the average annual earnings of $64,821, while those with college or associate's degree education have the smallest earnings of $24,756.
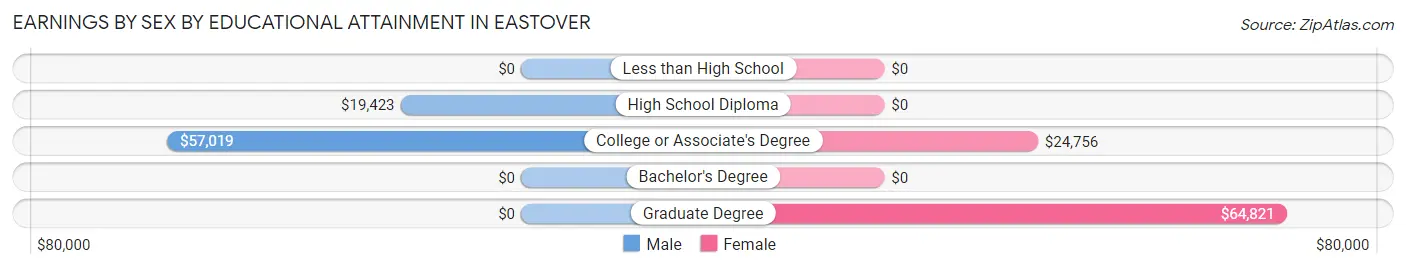
| Educational Attainment | Male Income | Female Income |
| Less than High School | - | - |
| High School Diploma | $19,423 | $0 |
| College or Associate's Degree | $57,019 | $24,756 |
| Bachelor's Degree | - | - |
| Graduate Degree | - | - |
| Total | $39,145 | $32,462 |
Family Income in Eastover
Family Income Brackets in Eastover
According to the Eastover family income data, there are 204 families falling into the $50,000 to $74,999 income range, which is the most common income bracket and makes up 19.3% of all families. Conversely, the $10,000 to $14,999 income bracket is the least frequent group with only 16 families (1.5%) belonging to this category.
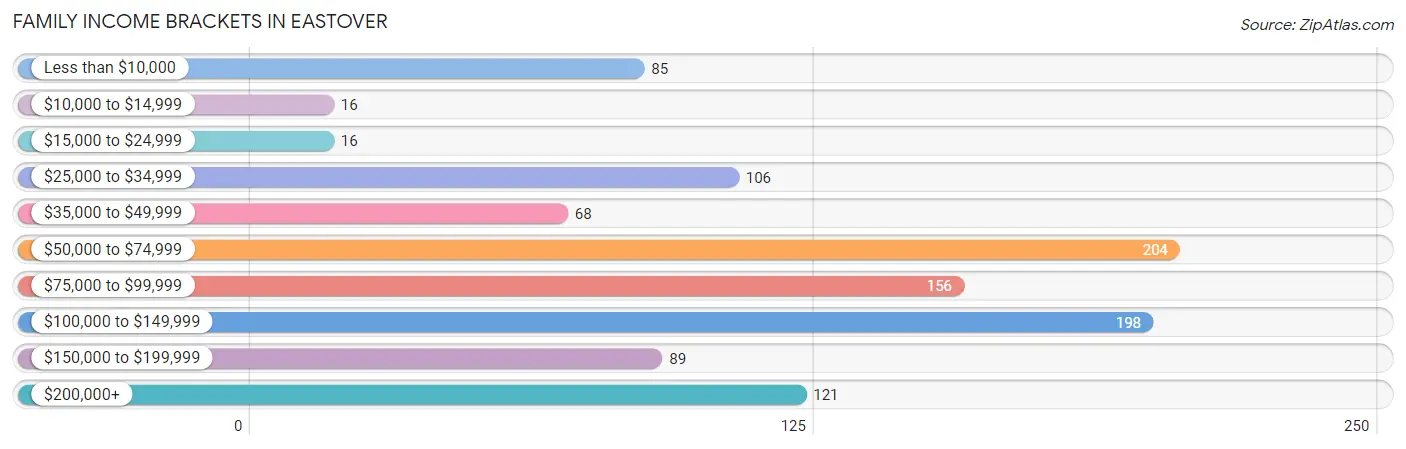
| Income Bracket | # Families | % Families |
| Less than $10,000 | 85 | 8.0% |
| $10,000 to $14,999 | 16 | 1.5% |
| $15,000 to $24,999 | 16 | 1.5% |
| $25,000 to $34,999 | 106 | 10.0% |
| $35,000 to $49,999 | 68 | 6.4% |
| $50,000 to $74,999 | 204 | 19.3% |
| $75,000 to $99,999 | 156 | 14.7% |
| $100,000 to $149,999 | 198 | 18.7% |
| $150,000 to $199,999 | 89 | 8.4% |
| $200,000+ | 121 | 11.4% |
Family Income by Famaliy Size in Eastover
3-person families (196 | 18.5%) account for the highest median family income in Eastover with $89,569 per family, while 2-person families (613 | 57.9%) have the highest median income of $35,282 per family member.
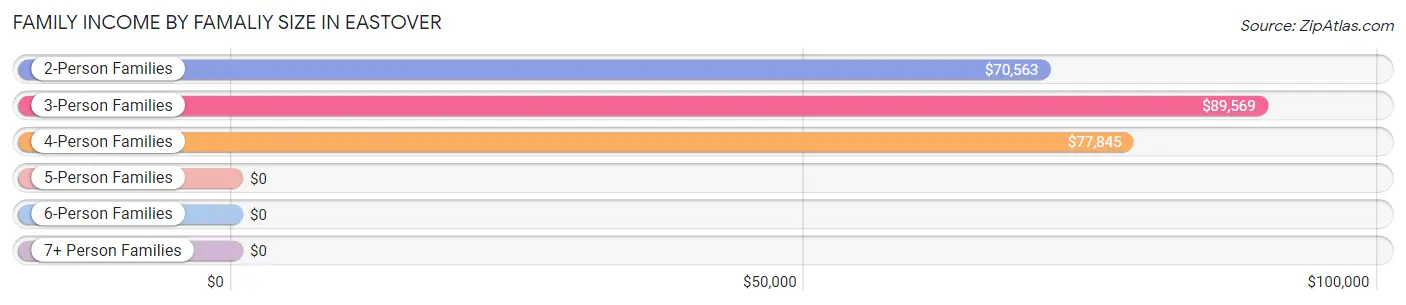
| Income Bracket | # Families | Median Income |
| 2-Person Families | 613 (57.9%) | $70,563 |
| 3-Person Families | 196 (18.5%) | $89,569 |
| 4-Person Families | 152 (14.4%) | $77,845 |
| 5-Person Families | 59 (5.6%) | $0 |
| 6-Person Families | 38 (3.6%) | $0 |
| 7+ Person Families | 0 (0.0%) | $0 |
| Total | 1,058 (100.0%) | $79,044 |
Family Income by Number of Earners in Eastover
The median family income in Eastover is $79,044, with families comprising 3+ earners (94) having the highest median family income of $145,735, while families with no earners (312) have the lowest median family income of $39,100, accounting for 8.9% and 29.5% of families, respectively.
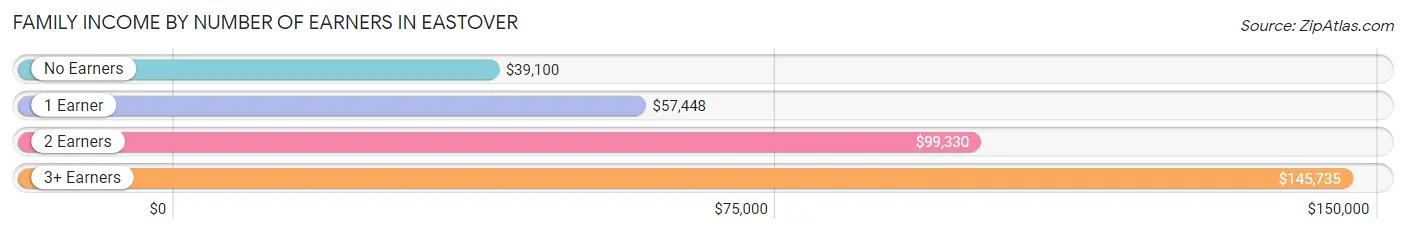
| Number of Earners | # Families | Median Income |
| No Earners | 312 (29.5%) | $39,100 |
| 1 Earner | 271 (25.6%) | $57,448 |
| 2 Earners | 381 (36.0%) | $99,330 |
| 3+ Earners | 94 (8.9%) | $145,735 |
| Total | 1,058 (100.0%) | $79,044 |
Household Income in Eastover
Household Income Brackets in Eastover
With 241 households falling in the category, the $100,000 to $149,999 income range is the most frequent in Eastover, accounting for 17.0% of all households. In contrast, only 33 households (2.3%) fall into the $10,000 to $14,999 income bracket, making it the least populous group.
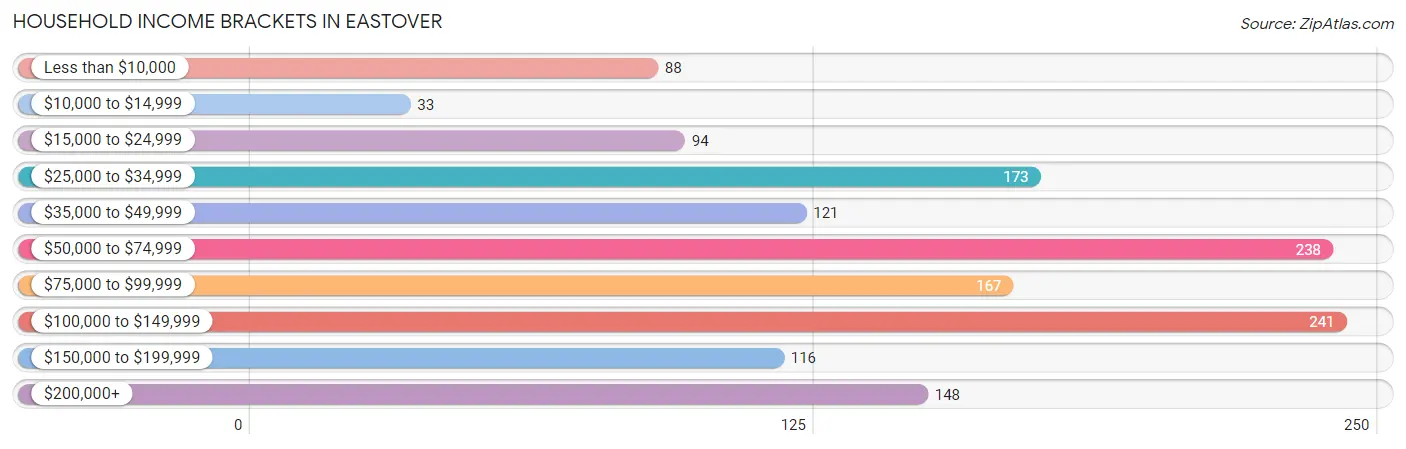
| Income Bracket | # Households | % Households |
| Less than $10,000 | 88 | 6.2% |
| $10,000 to $14,999 | 33 | 2.3% |
| $15,000 to $24,999 | 94 | 6.6% |
| $25,000 to $34,999 | 173 | 12.2% |
| $35,000 to $49,999 | 121 | 8.5% |
| $50,000 to $74,999 | 238 | 16.8% |
| $75,000 to $99,999 | 167 | 11.8% |
| $100,000 to $149,999 | 241 | 17.0% |
| $150,000 to $199,999 | 116 | 8.2% |
| $200,000+ | 148 | 10.4% |
Household Income by Householder Age in Eastover
The median household income in Eastover is $68,646, with the highest median household income of $97,683 found in the 25 to 44 years age bracket for the primary householder. A total of 284 households (20.0%) fall into this category. Meanwhile, the 45 to 64 years age bracket for the primary householder has the lowest median household income of $0, with 524 households (36.9%) in this group.
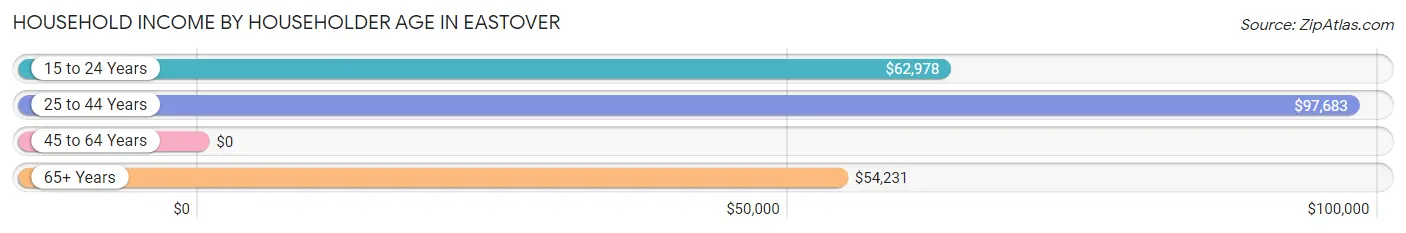
| Income Bracket | # Households | Median Income |
| 15 to 24 Years | 69 (4.9%) | $62,978 |
| 25 to 44 Years | 284 (20.0%) | $97,683 |
| 45 to 64 Years | 524 (36.9%) | $0 |
| 65+ Years | 542 (38.2%) | $54,231 |
| Total | 1,419 (100.0%) | $68,646 |
Poverty in Eastover
Income Below Poverty by Sex and Age in Eastover
With 8.0% poverty level for males and 11.7% for females among the residents of Eastover, 45 to 54 year old males and 35 to 44 year old females are the most vulnerable to poverty, with 59 males (28.1%) and 64 females (30.0%) in their respective age groups living below the poverty level.
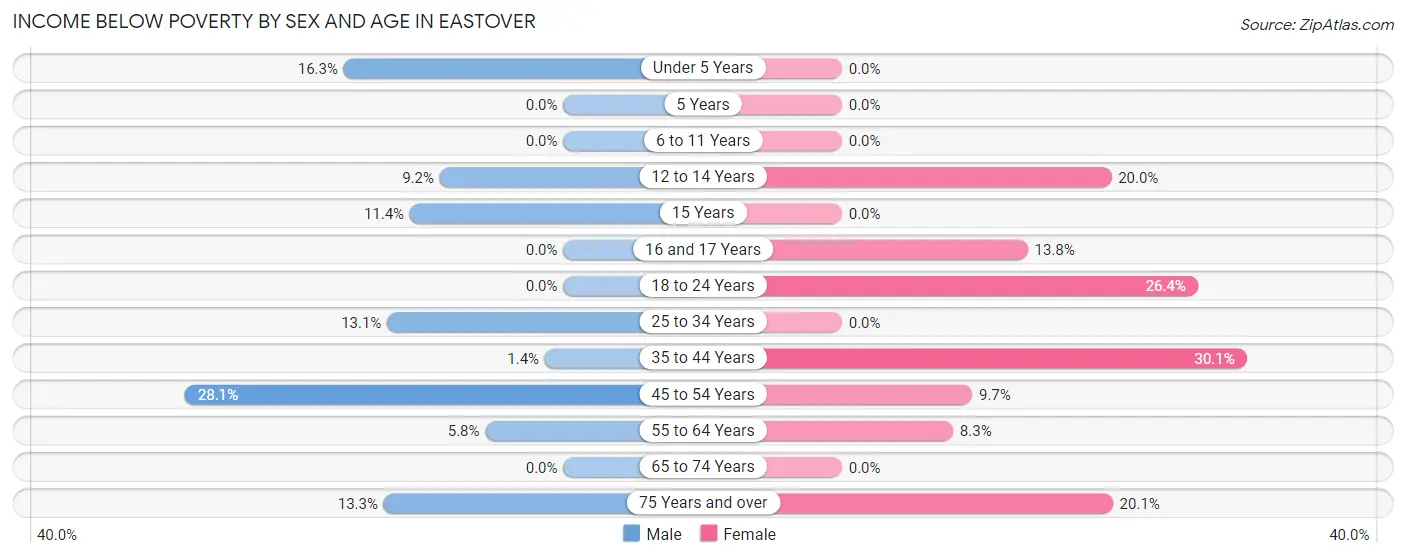
| Age Bracket | Male | Female |
| Under 5 Years | 15 (16.3%) | 0 (0.0%) |
| 5 Years | 0 (0.0%) | 0 (0.0%) |
| 6 to 11 Years | 0 (0.0%) | 0 (0.0%) |
| 12 to 14 Years | 11 (9.2%) | 11 (20.0%) |
| 15 Years | 9 (11.4%) | 0 (0.0%) |
| 16 and 17 Years | 0 (0.0%) | 8 (13.8%) |
| 18 to 24 Years | 0 (0.0%) | 28 (26.4%) |
| 25 to 34 Years | 31 (13.1%) | 0 (0.0%) |
| 35 to 44 Years | 2 (1.4%) | 64 (30.0%) |
| 45 to 54 Years | 59 (28.1%) | 26 (9.7%) |
| 55 to 64 Years | 14 (5.8%) | 17 (8.3%) |
| 65 to 74 Years | 0 (0.0%) | 0 (0.0%) |
| 75 Years and over | 16 (13.3%) | 35 (20.1%) |
| Total | 157 (8.0%) | 189 (11.7%) |
Income Above Poverty by Sex and Age in Eastover
According to the poverty statistics in Eastover, males aged 5 years and females aged under 5 years are the age groups that are most secure financially, with 100.0% of males and 100.0% of females in these age groups living above the poverty line.
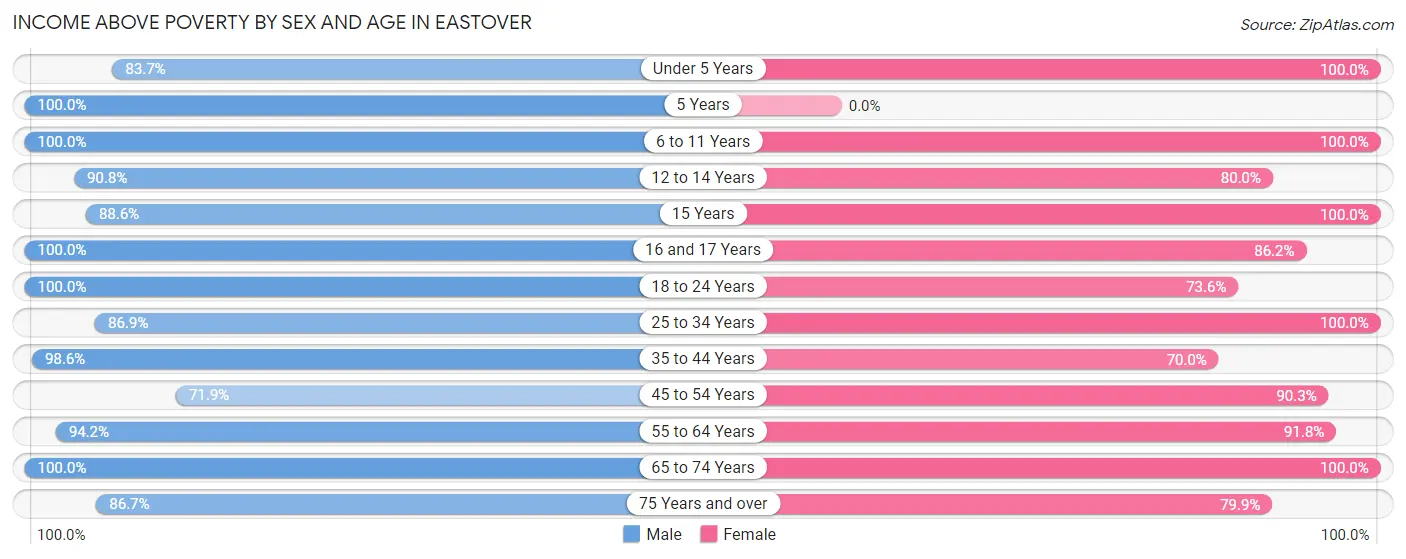
| Age Bracket | Male | Female |
| Under 5 Years | 77 (83.7%) | 31 (100.0%) |
| 5 Years | 47 (100.0%) | 0 (0.0%) |
| 6 to 11 Years | 64 (100.0%) | 109 (100.0%) |
| 12 to 14 Years | 109 (90.8%) | 44 (80.0%) |
| 15 Years | 70 (88.6%) | 35 (100.0%) |
| 16 and 17 Years | 139 (100.0%) | 50 (86.2%) |
| 18 to 24 Years | 193 (100.0%) | 78 (73.6%) |
| 25 to 34 Years | 206 (86.9%) | 39 (100.0%) |
| 35 to 44 Years | 144 (98.6%) | 149 (70.0%) |
| 45 to 54 Years | 151 (71.9%) | 243 (90.3%) |
| 55 to 64 Years | 228 (94.2%) | 189 (91.7%) |
| 65 to 74 Years | 280 (100.0%) | 316 (100.0%) |
| 75 Years and over | 104 (86.7%) | 139 (79.9%) |
| Total | 1,812 (92.0%) | 1,422 (88.3%) |
Income Below Poverty Among Married-Couple Families in Eastover
The poverty statistics for married-couple families in Eastover show that 9.0% or 74 of the total 824 families live below the poverty line. Families with no children have the highest poverty rate of 11.6%, comprising of 66 families. On the other hand, families with 3 or 4 children have the lowest poverty rate of 0.0%, which includes 0 families.
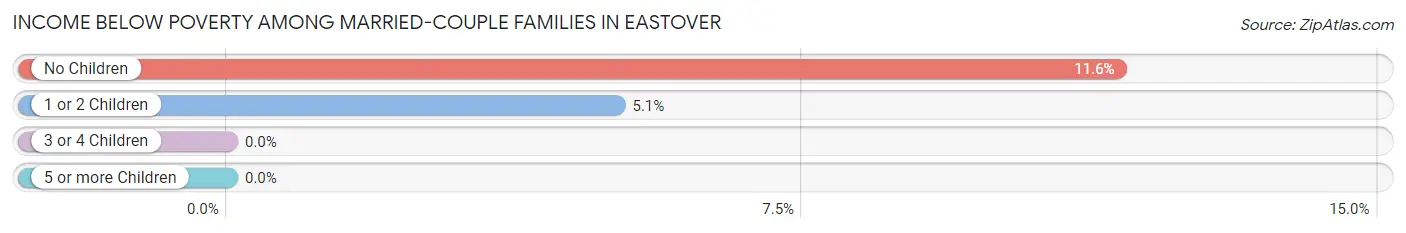
| Children | Above Poverty | Below Poverty |
| No Children | 503 (88.4%) | 66 (11.6%) |
| 1 or 2 Children | 150 (94.9%) | 8 (5.1%) |
| 3 or 4 Children | 97 (100.0%) | 0 (0.0%) |
| 5 or more Children | 0 (0.0%) | 0 (0.0%) |
| Total | 750 (91.0%) | 74 (9.0%) |
Income Below Poverty Among Single-Parent Households in Eastover
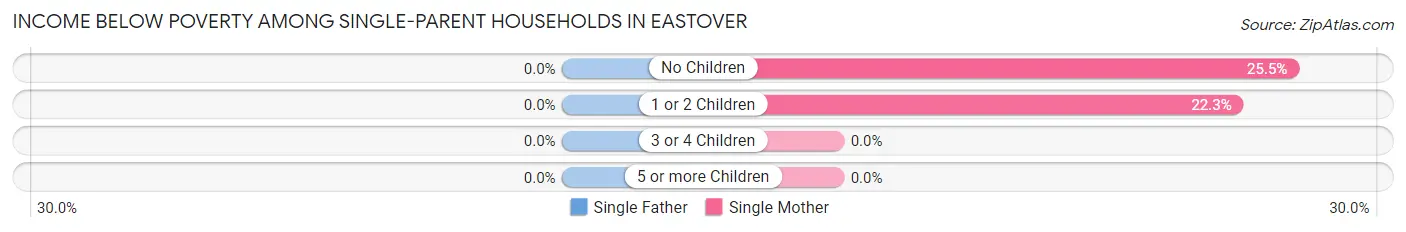
| Children | Single Father | Single Mother |
| No Children | 0 (0.0%) | 14 (25.5%) |
| 1 or 2 Children | 0 (0.0%) | 21 (22.3%) |
| 3 or 4 Children | 0 (0.0%) | 0 (0.0%) |
| 5 or more Children | 0 (0.0%) | 0 (0.0%) |
| Total | 0 (0.0%) | 35 (17.9%) |
Income Below Poverty Among Married-Couple vs Single-Parent Households in Eastover
The poverty data for Eastover shows that 74 of the married-couple family households (9.0%) and 35 of the single-parent households (15.0%) are living below the poverty level. Within the married-couple family households, those with no children have the highest poverty rate, with 66 households (11.6%) falling below the poverty line. Among the single-parent households, those with 1 or 2 children have the highest poverty rate, with 21 household (20.6%) living below poverty.
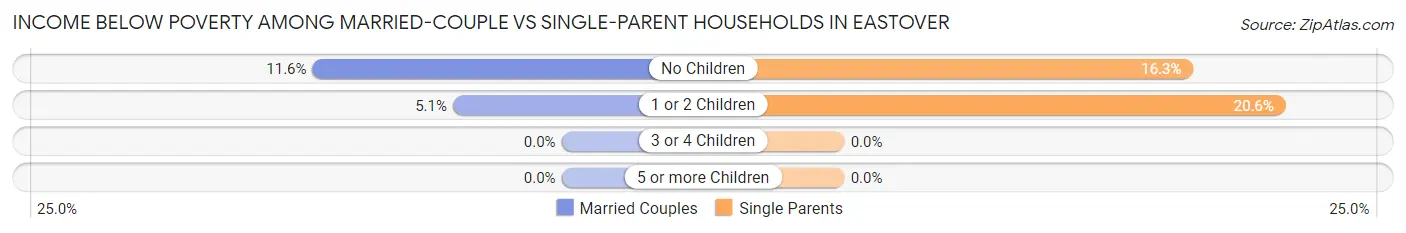
| Children | Married-Couple Families | Single-Parent Households |
| No Children | 66 (11.6%) | 14 (16.3%) |
| 1 or 2 Children | 8 (5.1%) | 21 (20.6%) |
| 3 or 4 Children | 0 (0.0%) | 0 (0.0%) |
| 5 or more Children | 0 (0.0%) | 0 (0.0%) |
| Total | 74 (9.0%) | 35 (15.0%) |
Race in Eastover
The most populous races in Eastover are White / Caucasian (2,891 | 79.0%), Two or more Races (347 | 9.5%), and Black / African American (300 | 8.2%).
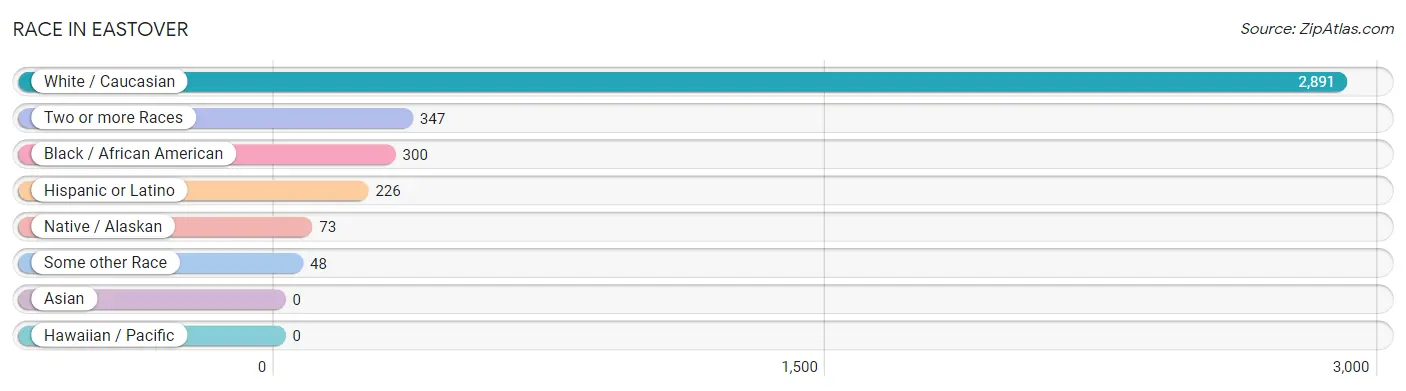
| Race | # Population | % Population |
| Asian | 0 | 0.0% |
| Black / African American | 300 | 8.2% |
| Hawaiian / Pacific | 0 | 0.0% |
| Hispanic or Latino | 226 | 6.2% |
| Native / Alaskan | 73 | 2.0% |
| White / Caucasian | 2,891 | 79.0% |
| Two or more Races | 347 | 9.5% |
| Some other Race | 48 | 1.3% |
| Total | 3,659 | 100.0% |
Ancestry in Eastover
The most populous ancestries reported in Eastover are English (603 | 16.5%), American (433 | 11.8%), Irish (299 | 8.2%), German (287 | 7.8%), and European (249 | 6.8%), together accounting for 51.1% of all Eastover residents.
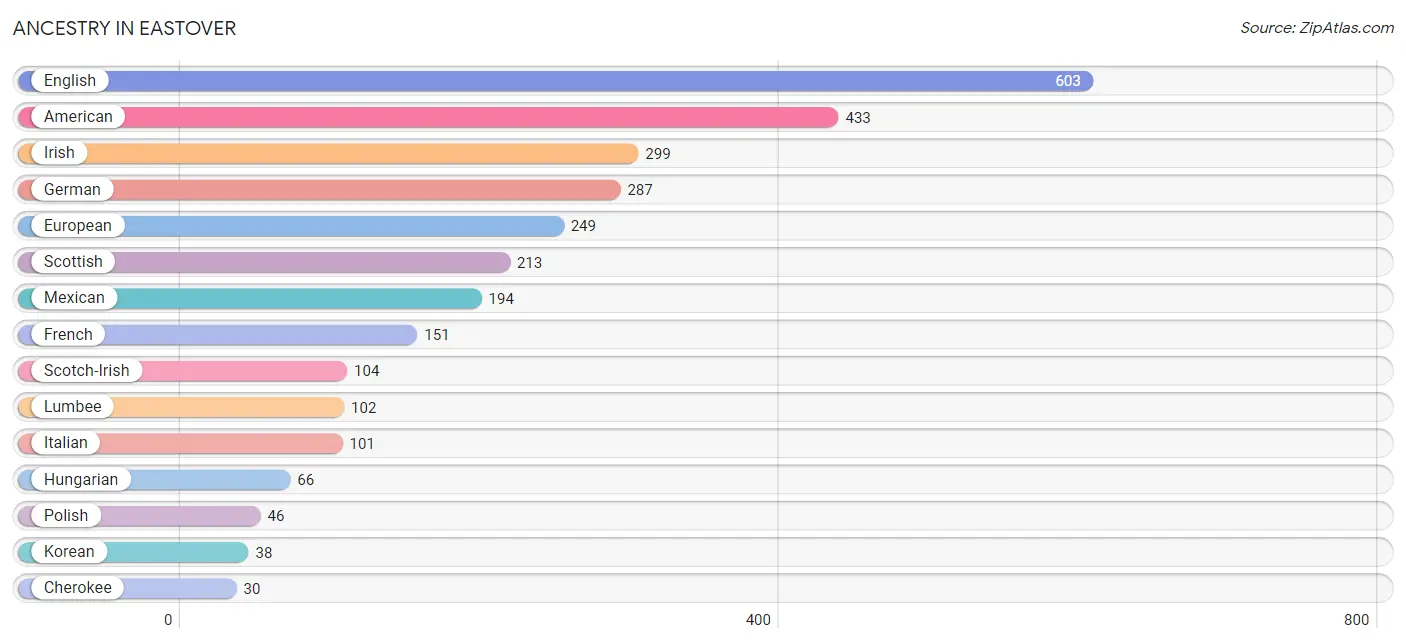
| Ancestry | # Population | % Population |
| American | 433 | 11.8% |
| British | 26 | 0.7% |
| Cherokee | 30 | 0.8% |
| Dutch | 12 | 0.3% |
| Ecuadorian | 13 | 0.4% |
| English | 603 | 16.5% |
| European | 249 | 6.8% |
| French | 151 | 4.1% |
| German | 287 | 7.8% |
| Hungarian | 66 | 1.8% |
| Irish | 299 | 8.2% |
| Italian | 101 | 2.8% |
| Jamaican | 7 | 0.2% |
| Korean | 38 | 1.0% |
| Lumbee | 102 | 2.8% |
| Mexican | 194 | 5.3% |
| Norwegian | 8 | 0.2% |
| Polish | 46 | 1.3% |
| Portuguese | 11 | 0.3% |
| Scotch-Irish | 104 | 2.8% |
| Scottish | 213 | 5.8% |
| South American | 13 | 0.4% |
| Spanish | 17 | 0.5% |
| Swedish | 20 | 0.5% | View All 24 Rows |
Immigrants in Eastover
The most numerous immigrant groups reported in Eastover came from Latin America (67 | 1.8%), Central America (47 | 1.3%), Mexico (47 | 1.3%), Ecuador (13 | 0.4%), and South America (13 | 0.4%), together accounting for 5.1% of all Eastover residents.
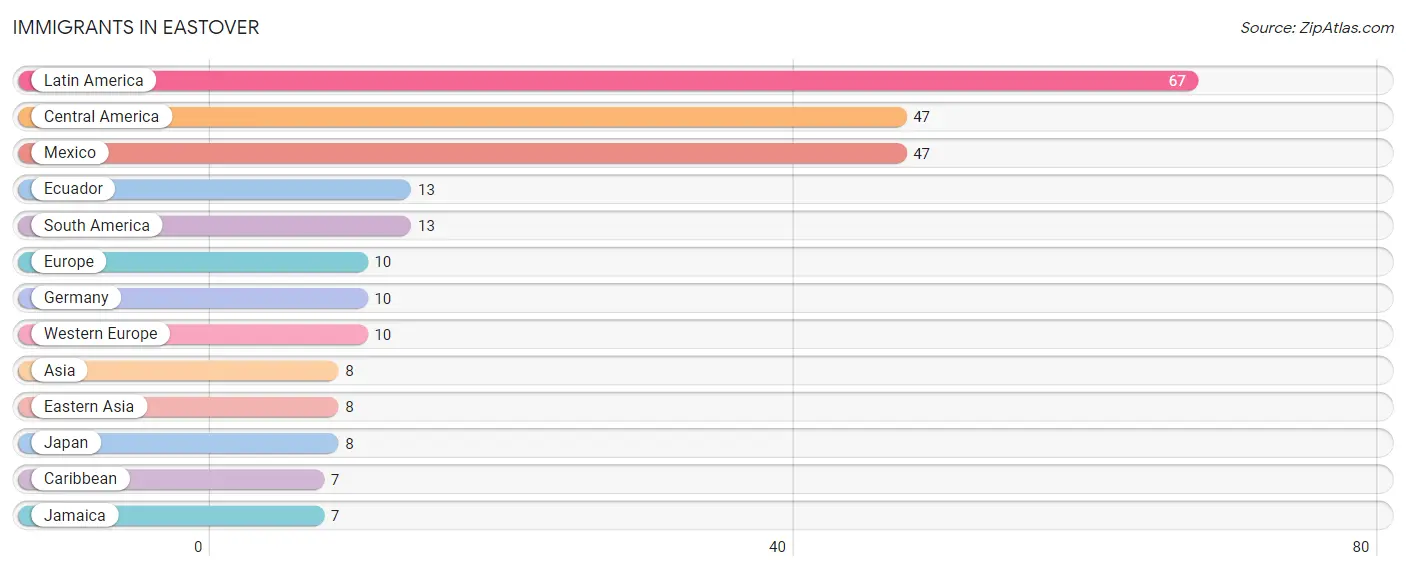
| Immigration Origin | # Population | % Population |
| Asia | 8 | 0.2% |
| Caribbean | 7 | 0.2% |
| Central America | 47 | 1.3% |
| Eastern Asia | 8 | 0.2% |
| Ecuador | 13 | 0.4% |
| Europe | 10 | 0.3% |
| Germany | 10 | 0.3% |
| Jamaica | 7 | 0.2% |
| Japan | 8 | 0.2% |
| Latin America | 67 | 1.8% |
| Mexico | 47 | 1.3% |
| South America | 13 | 0.4% |
| Western Europe | 10 | 0.3% | View All 13 Rows |
Sex and Age in Eastover
Sex and Age in Eastover
The most populous age groups in Eastover are 15 to 19 Years (268 | 13.3%) for men and 70 to 74 Years (166 | 10.1%) for women.
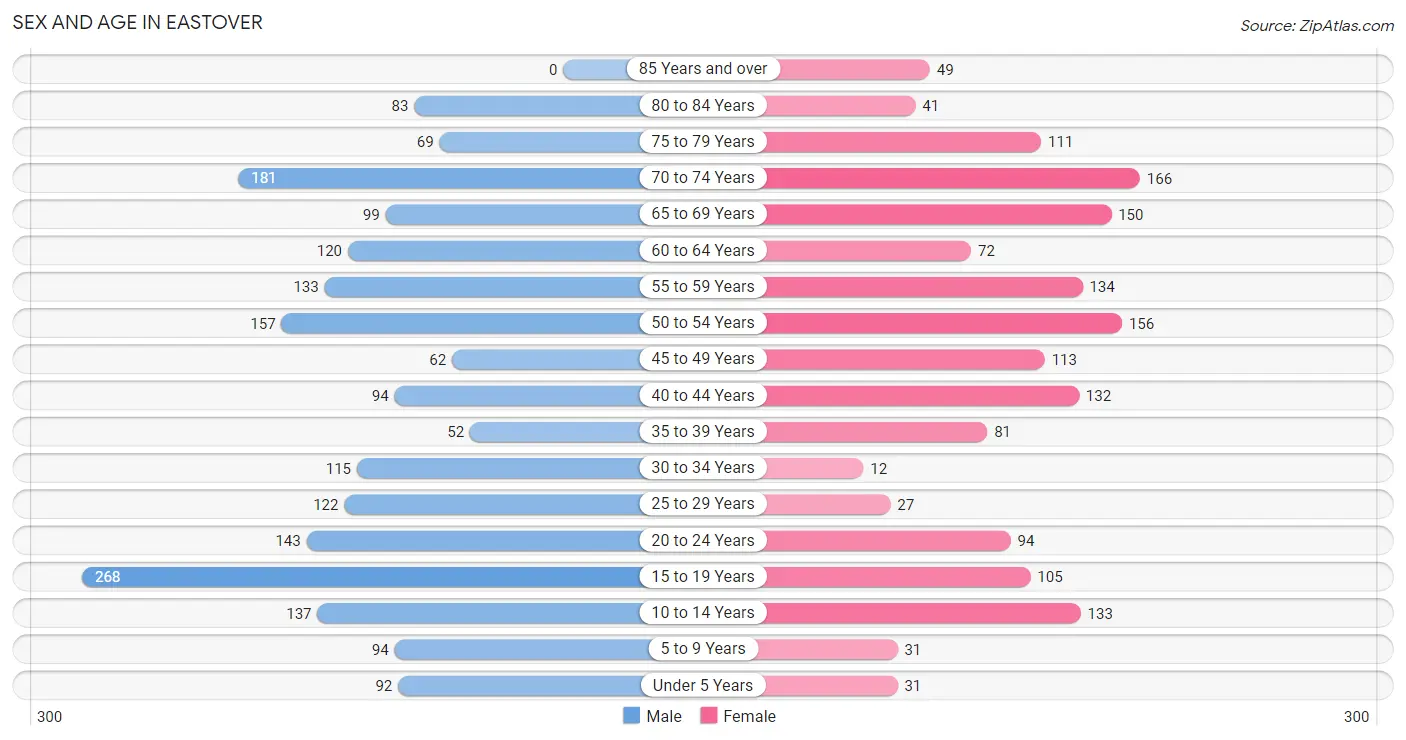
| Age Bracket | Male | Female |
| Under 5 Years | 92 (4.5%) | 31 (1.9%) |
| 5 to 9 Years | 94 (4.6%) | 31 (1.9%) |
| 10 to 14 Years | 137 (6.8%) | 133 (8.1%) |
| 15 to 19 Years | 268 (13.3%) | 105 (6.4%) |
| 20 to 24 Years | 143 (7.1%) | 94 (5.7%) |
| 25 to 29 Years | 122 (6.0%) | 27 (1.7%) |
| 30 to 34 Years | 115 (5.7%) | 12 (0.7%) |
| 35 to 39 Years | 52 (2.6%) | 81 (5.0%) |
| 40 to 44 Years | 94 (4.6%) | 132 (8.1%) |
| 45 to 49 Years | 62 (3.1%) | 113 (6.9%) |
| 50 to 54 Years | 157 (7.8%) | 156 (9.5%) |
| 55 to 59 Years | 133 (6.6%) | 134 (8.2%) |
| 60 to 64 Years | 120 (5.9%) | 72 (4.4%) |
| 65 to 69 Years | 99 (4.9%) | 150 (9.2%) |
| 70 to 74 Years | 181 (9.0%) | 166 (10.1%) |
| 75 to 79 Years | 69 (3.4%) | 111 (6.8%) |
| 80 to 84 Years | 83 (4.1%) | 41 (2.5%) |
| 85 Years and over | 0 (0.0%) | 49 (3.0%) |
| Total | 2,021 (100.0%) | 1,638 (100.0%) |
Families and Households in Eastover
Median Family Size in Eastover
The median family size in Eastover is 2.96 persons per family, with married-couple families (824 | 77.9%) accounting for the largest median family size of 2.99 persons per family. On the other hand, single male/father families (39 | 3.7%) represent the smallest median family size with 2.23 persons per family.
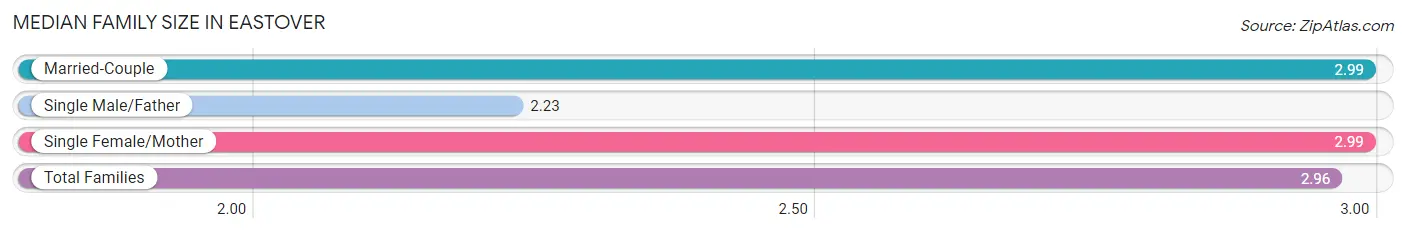
| Family Type | # Families | Family Size |
| Married-Couple | 824 (77.9%) | 2.99 |
| Single Male/Father | 39 (3.7%) | 2.23 |
| Single Female/Mother | 195 (18.4%) | 2.99 |
| Total Families | 1,058 (100.0%) | 2.96 |
Median Household Size in Eastover
The median household size in Eastover is 2.52 persons per household, with single female/mother households (195 | 13.7%) accounting for the largest median household size of 3.12 persons per household. non-family households (361 | 25.4%) represent the smallest median household size with 1.12 persons per household.
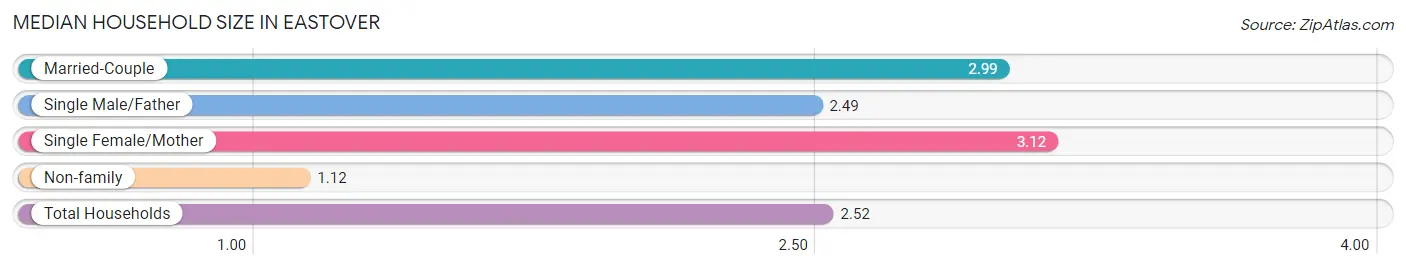
| Household Type | # Households | Household Size |
| Married-Couple | 824 (58.1%) | 2.99 |
| Single Male/Father | 39 (2.8%) | 2.49 |
| Single Female/Mother | 195 (13.7%) | 3.12 |
| Non-family | 361 (25.4%) | 1.12 |
| Total Households | 1,419 (100.0%) | 2.52 |
Household Size by Marriage Status in Eastover
Out of a total of 1,419 households in Eastover, 1,058 (74.6%) are family households, while 361 (25.4%) are nonfamily households. The most numerous type of family households are 2-person households, comprising 589, and the most common type of nonfamily households are 1-person households, comprising 333.
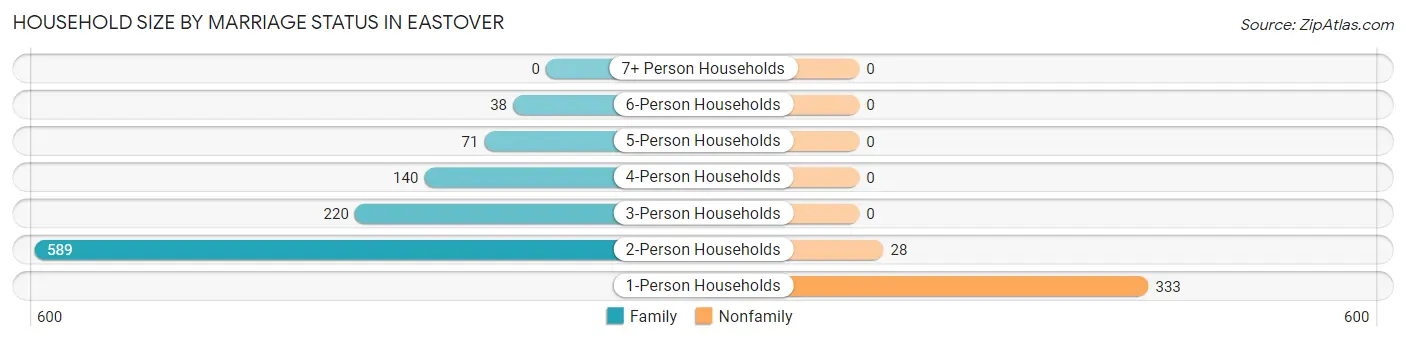
| Household Size | Family Households | Nonfamily Households |
| 1-Person Households | - | 333 (23.5%) |
| 2-Person Households | 589 (41.5%) | 28 (2.0%) |
| 3-Person Households | 220 (15.5%) | 0 (0.0%) |
| 4-Person Households | 140 (9.9%) | 0 (0.0%) |
| 5-Person Households | 71 (5.0%) | 0 (0.0%) |
| 6-Person Households | 38 (2.7%) | 0 (0.0%) |
| 7+ Person Households | 0 (0.0%) | 0 (0.0%) |
| Total | 1,058 (74.6%) | 361 (25.4%) |
Female Fertility in Eastover
Fertility by Age in Eastover
Average fertility rate in Eastover is 56.0 births per 1,000 women. Women in the age bracket of 20 to 34 years have the highest fertility rate with 241.0 births per 1,000 women. Women in the age bracket of 20 to 34 years acount for 100.0% of all women with births.
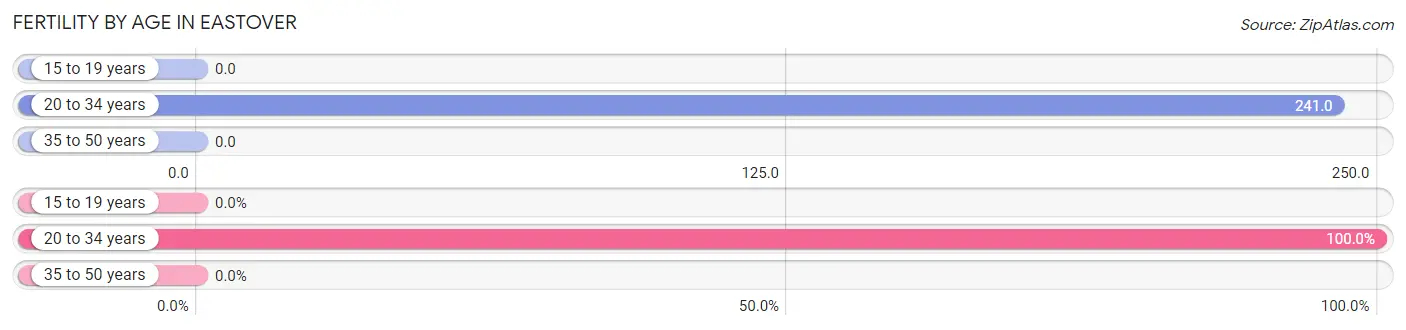
| Age Bracket | Women with Births | Births / 1,000 Women |
| 15 to 19 years | 0 (0.0%) | 0.0 |
| 20 to 34 years | 32 (100.0%) | 241.0 |
| 35 to 50 years | 0 (0.0%) | 0.0 |
| Total | 32 (100.0%) | 56.0 |
Fertility by Age by Marriage Status in Eastover
62.5% of women with births (32) in Eastover are married. The highest percentage of unmarried women with births falls into 20 to 34 years age bracket with 37.5% of them unmarried at the time of birth, while the lowest percentage of unmarried women with births belong to 20 to 34 years age bracket with 37.5% of them unmarried.
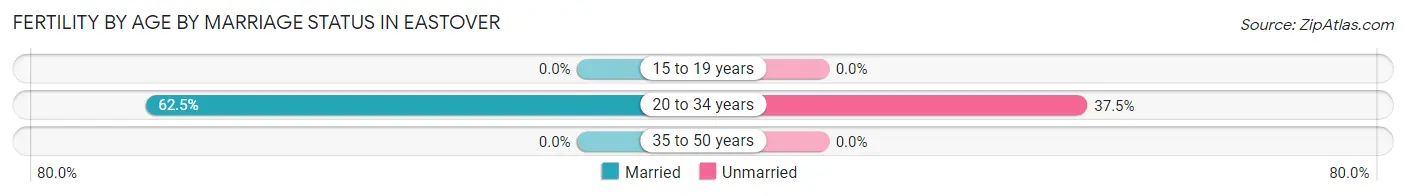
| Age Bracket | Married | Unmarried |
| 15 to 19 years | 0 (0.0%) | 0 (0.0%) |
| 20 to 34 years | 20 (62.5%) | 12 (37.5%) |
| 35 to 50 years | 0 (0.0%) | 0 (0.0%) |
| Total | 20 (62.5%) | 12 (37.5%) |
Fertility by Education in Eastover
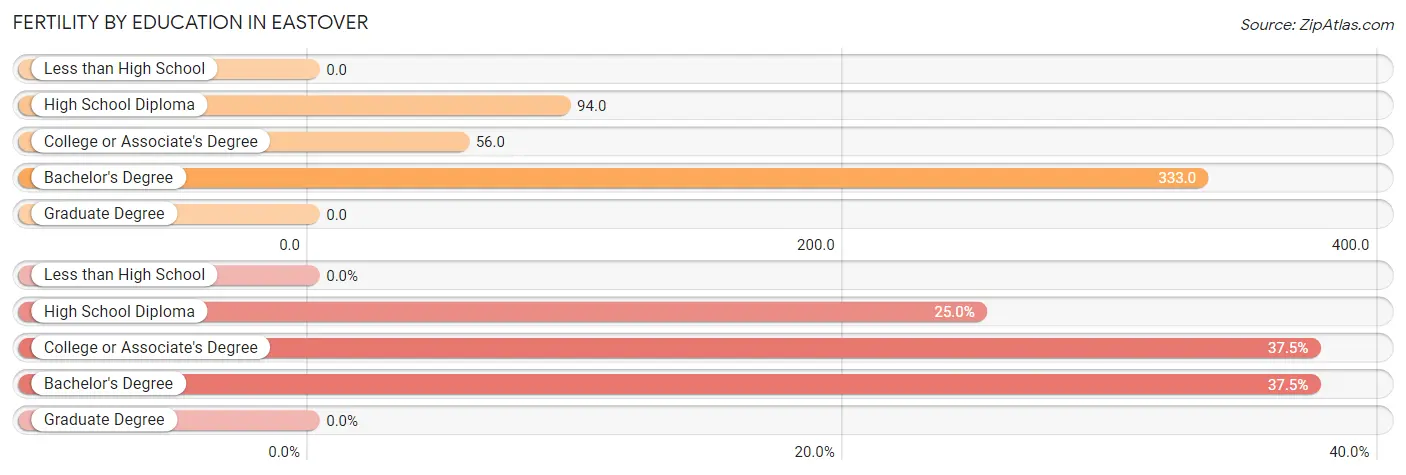
| Educational Attainment | Women with Births | Births / 1,000 Women |
| Less than High School | 0 (0.0%) | 0.0 |
| High School Diploma | 8 (25.0%) | 94.0 |
| College or Associate's Degree | 12 (37.5%) | 56.0 |
| Bachelor's Degree | 12 (37.5%) | 333.0 |
| Graduate Degree | 0 (0.0%) | 0.0 |
| Total | 32 (100.0%) | 56.0 |
Fertility by Education by Marriage Status in Eastover
37.5% of women with births in Eastover are unmarried. Women with the educational attainment of high school diploma are most likely to be married with 100.0% of them married at childbirth, while women with the educational attainment of college or associate's degree are least likely to be married with 100.0% of them unmarried at childbirth.
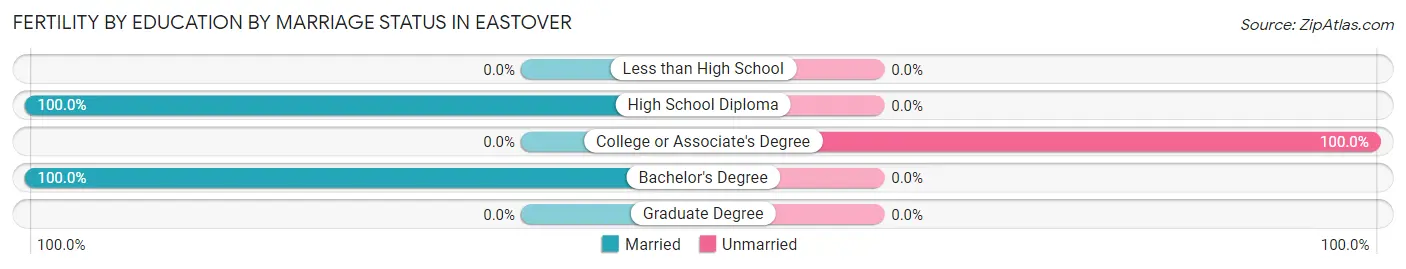
| Educational Attainment | Married | Unmarried |
| Less than High School | 0 (0.0%) | 0 (0.0%) |
| High School Diploma | 8 (100.0%) | 0 (0.0%) |
| College or Associate's Degree | 0 (0.0%) | 12 (100.0%) |
| Bachelor's Degree | 12 (100.0%) | 0 (0.0%) |
| Graduate Degree | 0 (0.0%) | 0 (0.0%) |
| Total | 20 (62.5%) | 12 (37.5%) |
Employment Characteristics in Eastover
Employment by Class of Employer in Eastover
Among the 1,465 employed individuals in Eastover, private company employees (728 | 49.7%), federal government employees (192 | 13.1%), and not-for-profit organizations (181 | 12.3%) make up the most common classes of employment.
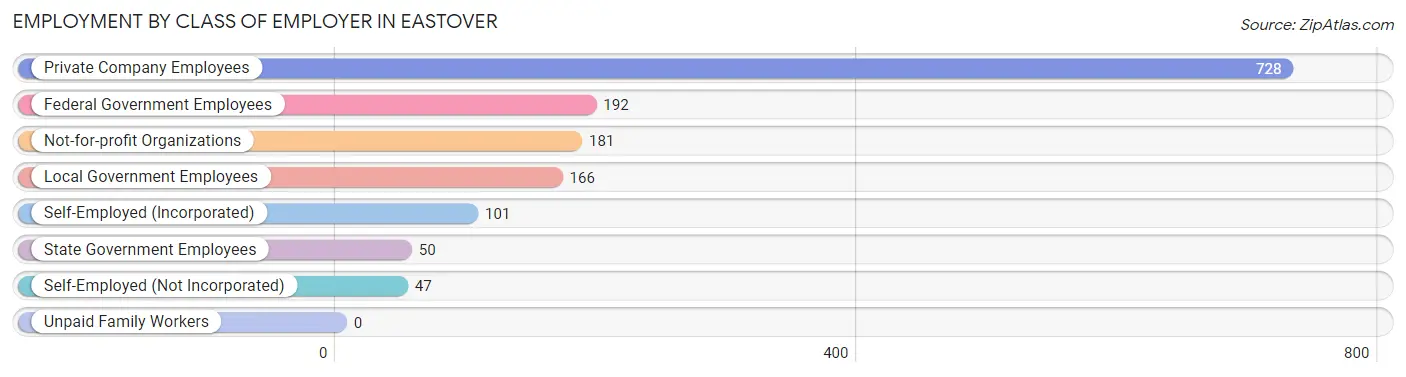
| Employer Class | # Employees | % Employees |
| Private Company Employees | 728 | 49.7% |
| Self-Employed (Incorporated) | 101 | 6.9% |
| Self-Employed (Not Incorporated) | 47 | 3.2% |
| Not-for-profit Organizations | 181 | 12.3% |
| Local Government Employees | 166 | 11.3% |
| State Government Employees | 50 | 3.4% |
| Federal Government Employees | 192 | 13.1% |
| Unpaid Family Workers | 0 | 0.0% |
| Total | 1,465 | 100.0% |
Employment Status by Age in Eastover
According to the labor force statistics for Eastover, out of the total population over 16 years of age (3,027), 51.9% or 1,571 individuals are in the labor force, with 6.2% or 97 of them unemployed. The age group with the highest labor force participation rate is 30 to 34 years, with 100.0% or 127 individuals in the labor force. Within the labor force, the 16 to 19 years age range has the highest percentage of unemployed individuals, with 34.3% or 34 of them being unemployed.
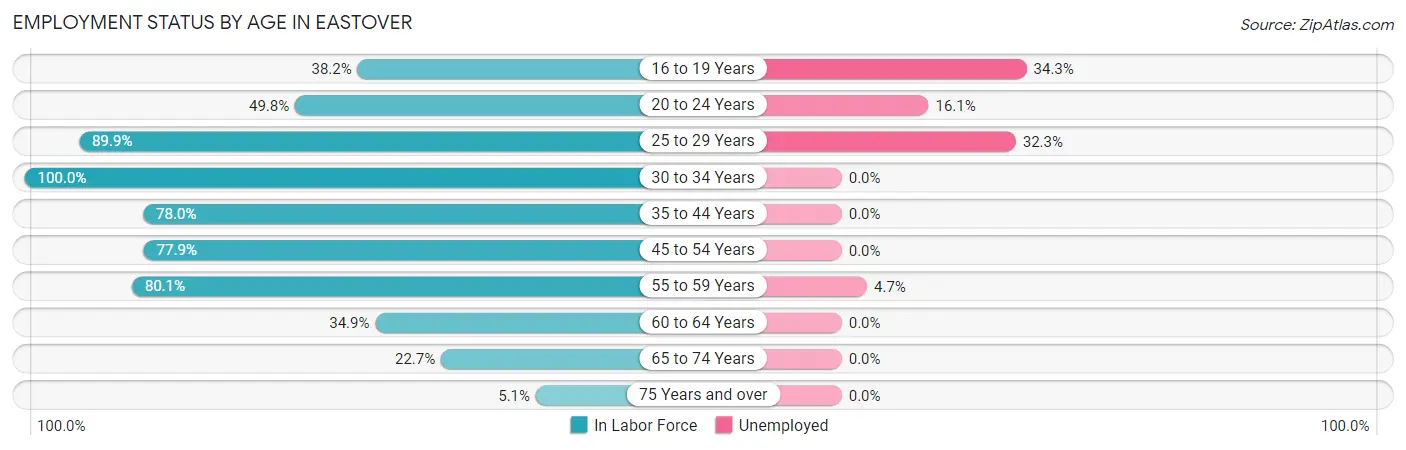
| Age Bracket | In Labor Force | Unemployed |
| 16 to 19 Years | 99 (38.2%) | 34 (34.3%) |
| 20 to 24 Years | 118 (49.8%) | 19 (16.1%) |
| 25 to 29 Years | 134 (89.9%) | 43 (32.3%) |
| 30 to 34 Years | 127 (100.0%) | 0 (0.0%) |
| 35 to 44 Years | 280 (78.0%) | 0 (0.0%) |
| 45 to 54 Years | 380 (77.9%) | 0 (0.0%) |
| 55 to 59 Years | 214 (80.1%) | 10 (4.7%) |
| 60 to 64 Years | 67 (34.9%) | 0 (0.0%) |
| 65 to 74 Years | 135 (22.7%) | 0 (0.0%) |
| 75 Years and over | 18 (5.1%) | 0 (0.0%) |
| Total | 1,571 (51.9%) | 97 (6.2%) |
Employment Status by Educational Attainment in Eastover
According to labor force statistics for Eastover, 76.0% of individuals (1,202) out of the total population between 25 and 64 years of age (1,582) are in the labor force, with 3.6% or 43 of them being unemployed. The group with the highest labor force participation rate are those with the educational attainment of less than high school, with 94.7% or 71 individuals in the labor force. Within the labor force, individuals with high school diploma education have the highest percentage of unemployment, with 16.7% or 39 of them being unemployed.
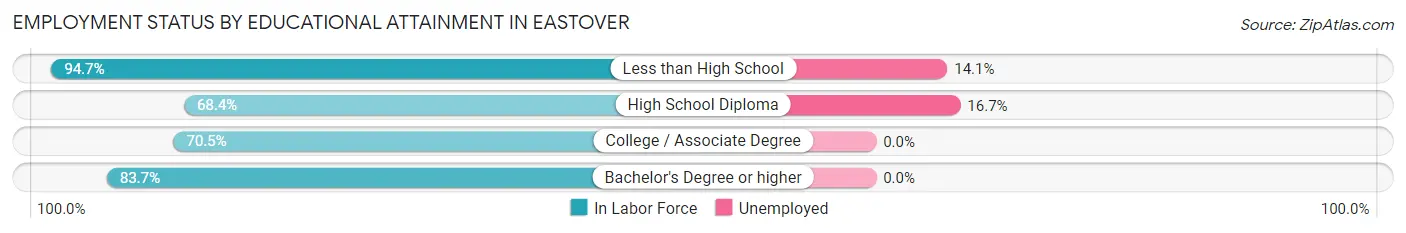
| Educational Attainment | In Labor Force | Unemployed |
| Less than High School | 71 (94.7%) | 11 (14.1%) |
| High School Diploma | 232 (68.4%) | 57 (16.7%) |
| College / Associate Degree | 418 (70.5%) | 0 (0.0%) |
| Bachelor's Degree or higher | 481 (83.7%) | 0 (0.0%) |
| Total | 1,202 (76.0%) | 57 (3.6%) |
Employment Occupations by Sex in Eastover
Management, Business, Science and Arts Occupations
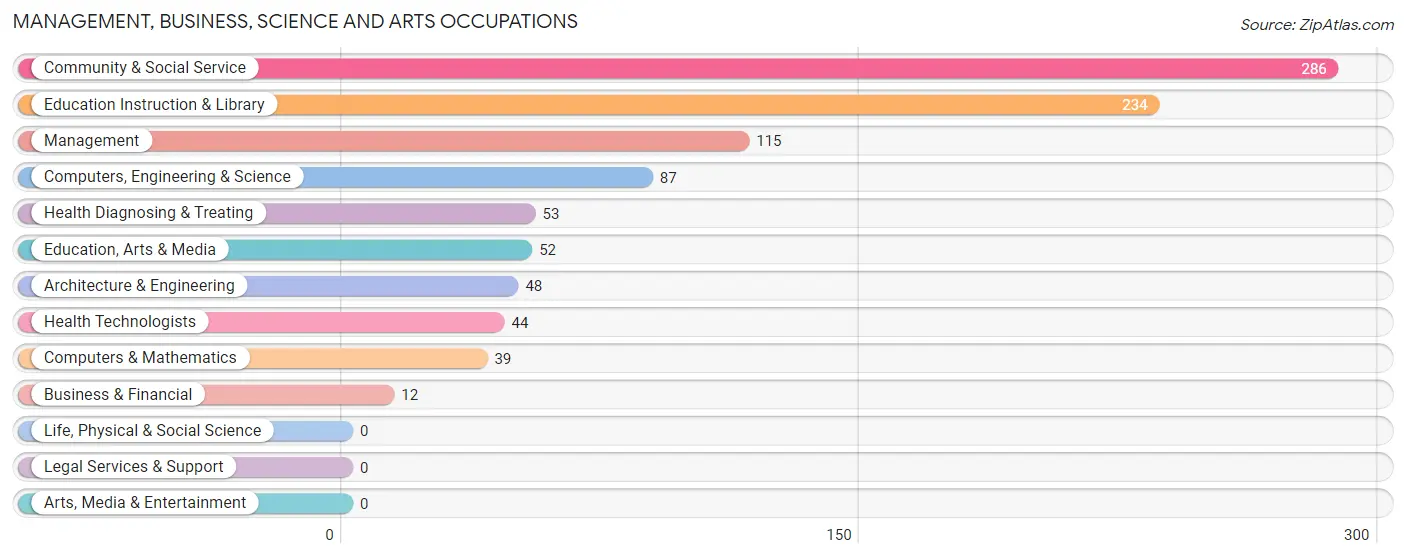
The most common Management, Business, Science and Arts occupations in Eastover are Community & Social Service (286 | 20.2%), Education Instruction & Library (234 | 16.5%), Management (115 | 8.1%), Computers, Engineering & Science (87 | 6.1%), and Health Diagnosing & Treating (53 | 3.7%).
Management, Business, Science and Arts Occupations by Sex
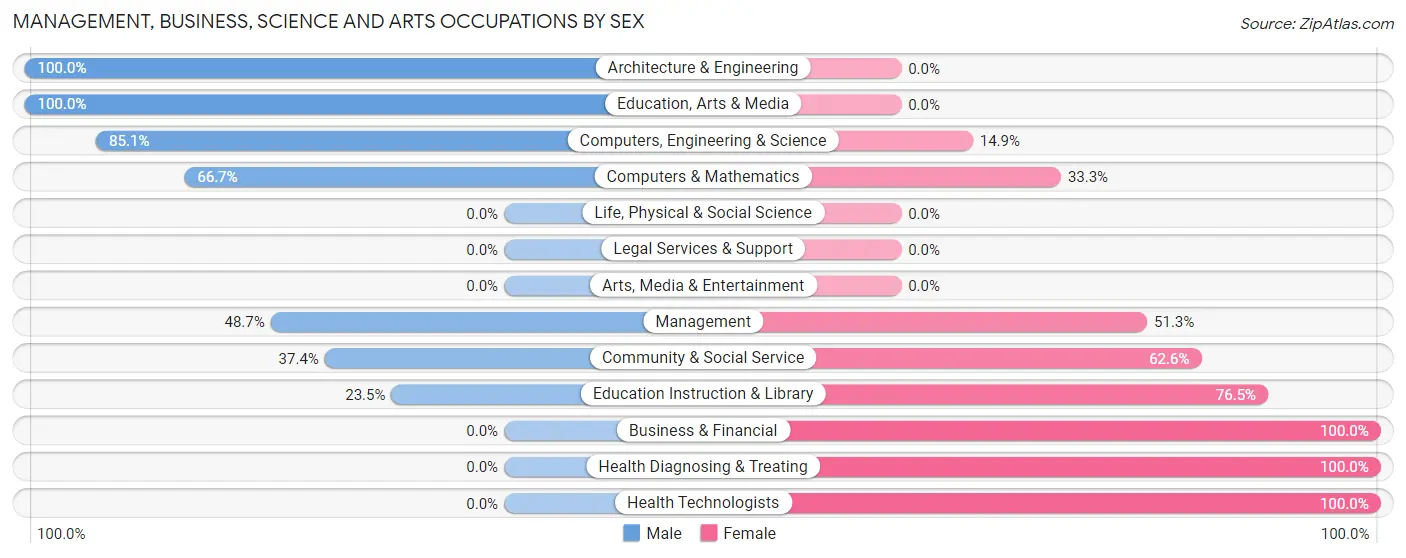
Within the Management, Business, Science and Arts occupations in Eastover, the most male-oriented occupations are Architecture & Engineering (100.0%), Education, Arts & Media (100.0%), and Computers, Engineering & Science (85.1%), while the most female-oriented occupations are Business & Financial (100.0%), Health Diagnosing & Treating (100.0%), and Health Technologists (100.0%).
| Occupation | Male | Female |
| Management | 56 (48.7%) | 59 (51.3%) |
| Business & Financial | 0 (0.0%) | 12 (100.0%) |
| Computers, Engineering & Science | 74 (85.1%) | 13 (14.9%) |
| Computers & Mathematics | 26 (66.7%) | 13 (33.3%) |
| Architecture & Engineering | 48 (100.0%) | 0 (0.0%) |
| Life, Physical & Social Science | 0 (0.0%) | 0 (0.0%) |
| Community & Social Service | 107 (37.4%) | 179 (62.6%) |
| Education, Arts & Media | 52 (100.0%) | 0 (0.0%) |
| Legal Services & Support | 0 (0.0%) | 0 (0.0%) |
| Education Instruction & Library | 55 (23.5%) | 179 (76.5%) |
| Arts, Media & Entertainment | 0 (0.0%) | 0 (0.0%) |
| Health Diagnosing & Treating | 0 (0.0%) | 53 (100.0%) |
| Health Technologists | 0 (0.0%) | 44 (100.0%) |
| Total (Category) | 237 (42.9%) | 316 (57.1%) |
| Total (Overall) | 749 (52.9%) | 668 (47.1%) |
Services Occupations
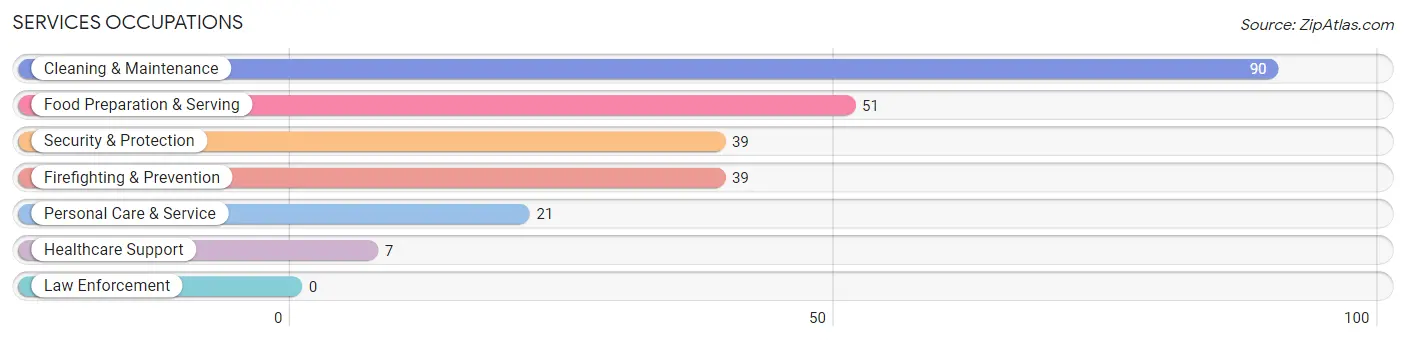
The most common Services occupations in Eastover are Cleaning & Maintenance (90 | 6.4%), Food Preparation & Serving (51 | 3.6%), Security & Protection (39 | 2.8%), Firefighting & Prevention (39 | 2.8%), and Personal Care & Service (21 | 1.5%).
Services Occupations by Sex
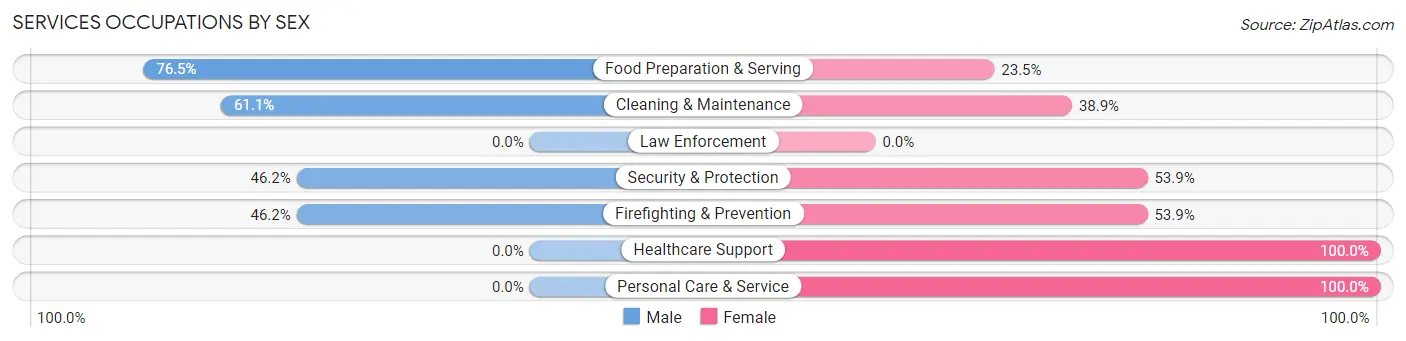
Within the Services occupations in Eastover, the most male-oriented occupations are Food Preparation & Serving (76.5%), Cleaning & Maintenance (61.1%), and Security & Protection (46.2%), while the most female-oriented occupations are Healthcare Support (100.0%), Personal Care & Service (100.0%), and Security & Protection (53.8%).
| Occupation | Male | Female |
| Healthcare Support | 0 (0.0%) | 7 (100.0%) |
| Security & Protection | 18 (46.2%) | 21 (53.8%) |
| Firefighting & Prevention | 18 (46.2%) | 21 (53.8%) |
| Law Enforcement | 0 (0.0%) | 0 (0.0%) |
| Food Preparation & Serving | 39 (76.5%) | 12 (23.5%) |
| Cleaning & Maintenance | 55 (61.1%) | 35 (38.9%) |
| Personal Care & Service | 0 (0.0%) | 21 (100.0%) |
| Total (Category) | 112 (53.8%) | 96 (46.2%) |
| Total (Overall) | 749 (52.9%) | 668 (47.1%) |
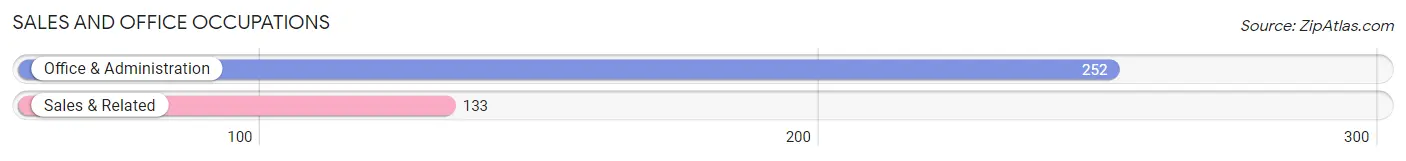
Sales and Office Occupations
The most common Sales and Office occupations in Eastover are Office & Administration (252 | 17.8%), and Sales & Related (133 | 9.4%).
Sales and Office Occupations by Sex
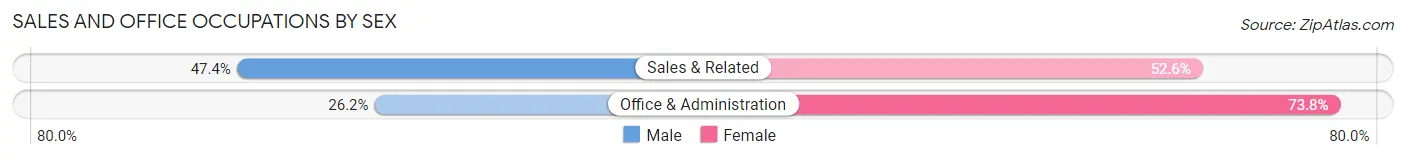
| Occupation | Male | Female |
| Sales & Related | 63 (47.4%) | 70 (52.6%) |
| Office & Administration | 66 (26.2%) | 186 (73.8%) |
| Total (Category) | 129 (33.5%) | 256 (66.5%) |
| Total (Overall) | 749 (52.9%) | 668 (47.1%) |
Natural Resources, Construction and Maintenance Occupations
The most common Natural Resources, Construction and Maintenance occupations in Eastover are Construction & Extraction (69 | 4.9%), and Installation, Maintenance & Repair (66 | 4.7%).
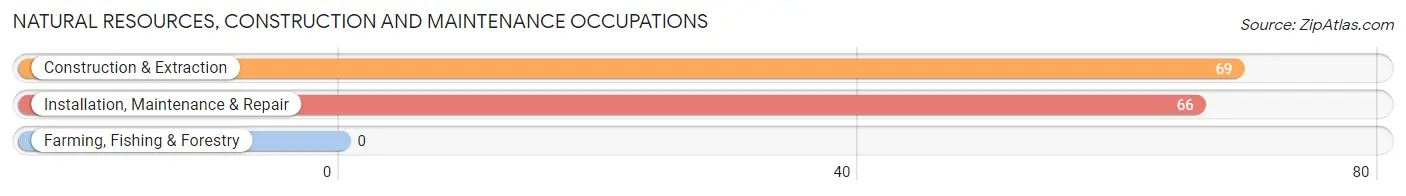
Natural Resources, Construction and Maintenance Occupations by Sex
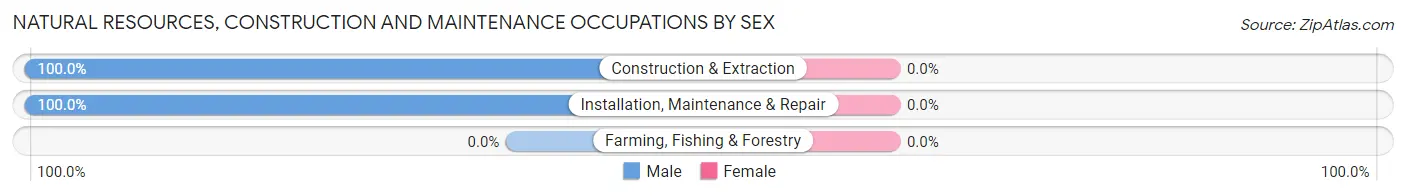
| Occupation | Male | Female |
| Farming, Fishing & Forestry | 0 (0.0%) | 0 (0.0%) |
| Construction & Extraction | 69 (100.0%) | 0 (0.0%) |
| Installation, Maintenance & Repair | 66 (100.0%) | 0 (0.0%) |
| Total (Category) | 135 (100.0%) | 0 (0.0%) |
| Total (Overall) | 749 (52.9%) | 668 (47.1%) |
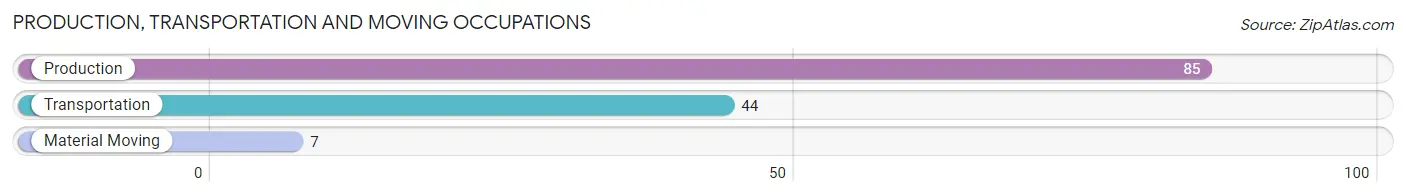
Production, Transportation and Moving Occupations
The most common Production, Transportation and Moving occupations in Eastover are Production (85 | 6.0%), Transportation (44 | 3.1%), and Material Moving (7 | 0.5%).
Production, Transportation and Moving Occupations by Sex
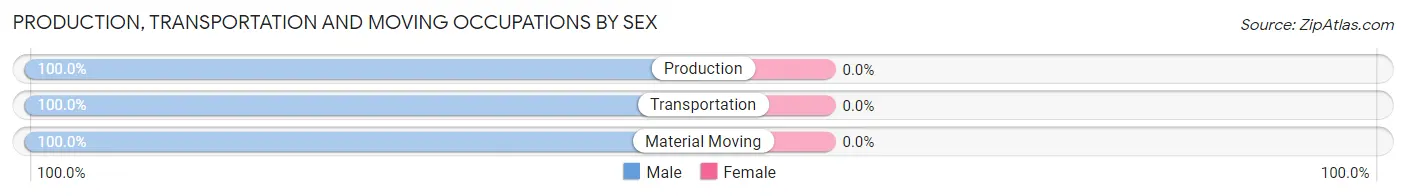
| Occupation | Male | Female |
| Production | 85 (100.0%) | 0 (0.0%) |
| Transportation | 44 (100.0%) | 0 (0.0%) |
| Material Moving | 7 (100.0%) | 0 (0.0%) |
| Total (Category) | 136 (100.0%) | 0 (0.0%) |
| Total (Overall) | 749 (52.9%) | 668 (47.1%) |
Employment Industries by Sex in Eastover
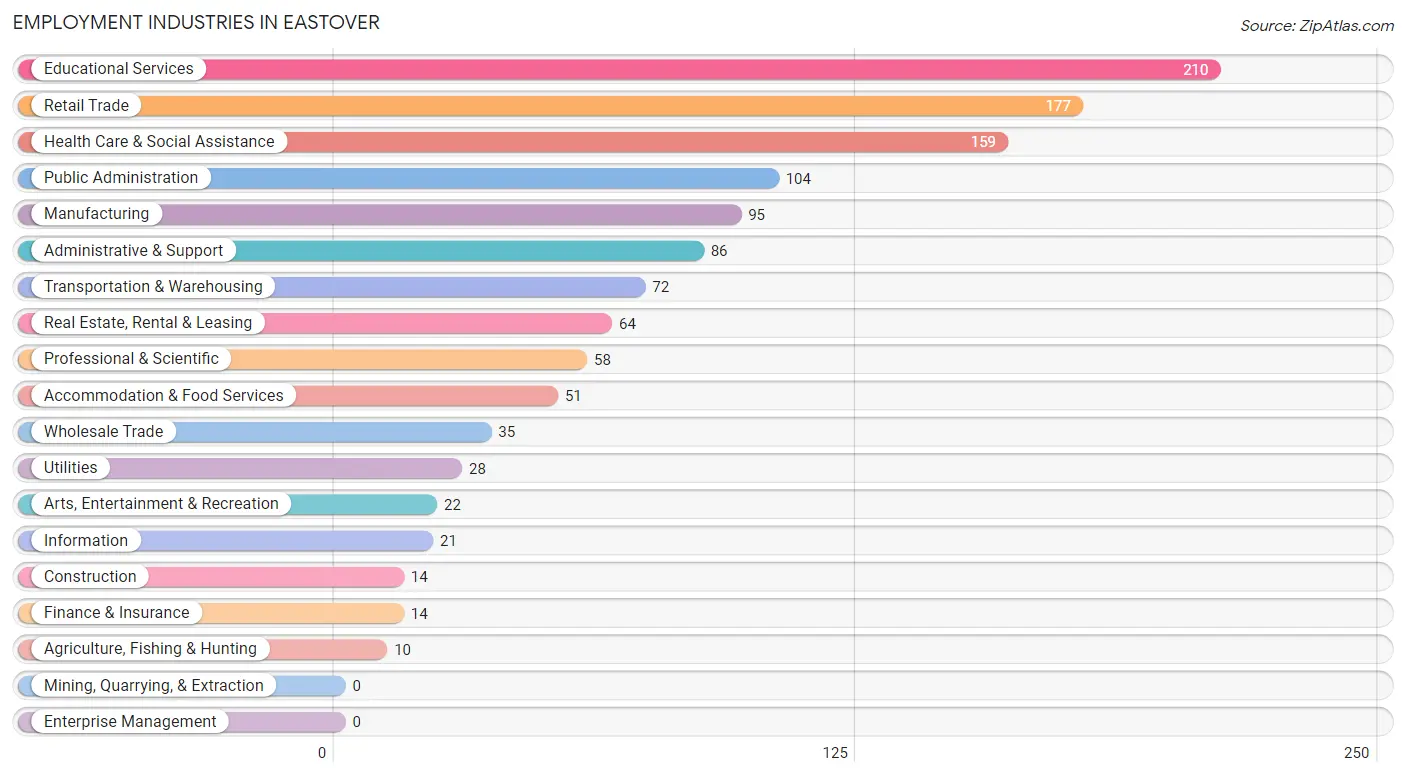
Employment Industries in Eastover
The major employment industries in Eastover include Educational Services (210 | 14.8%), Retail Trade (177 | 12.5%), Health Care & Social Assistance (159 | 11.2%), Public Administration (104 | 7.3%), and Manufacturing (95 | 6.7%).
Employment Industries by Sex in Eastover
The Eastover industries that see more men than women are Agriculture, Fishing & Hunting (100.0%), Construction (100.0%), and Manufacturing (100.0%), whereas the industries that tend to have a higher number of women are Health Care & Social Assistance (88.0%), Real Estate, Rental & Leasing (84.4%), and Educational Services (66.7%).
| Industry | Male | Female |
| Agriculture, Fishing & Hunting | 10 (100.0%) | 0 (0.0%) |
| Mining, Quarrying, & Extraction | 0 (0.0%) | 0 (0.0%) |
| Construction | 14 (100.0%) | 0 (0.0%) |
| Manufacturing | 95 (100.0%) | 0 (0.0%) |
| Wholesale Trade | 26 (74.3%) | 9 (25.7%) |
| Retail Trade | 65 (36.7%) | 112 (63.3%) |
| Transportation & Warehousing | 72 (100.0%) | 0 (0.0%) |
| Utilities | 28 (100.0%) | 0 (0.0%) |
| Information | 16 (76.2%) | 5 (23.8%) |
| Finance & Insurance | 14 (100.0%) | 0 (0.0%) |
| Real Estate, Rental & Leasing | 10 (15.6%) | 54 (84.4%) |
| Professional & Scientific | 31 (53.4%) | 27 (46.6%) |
| Enterprise Management | 0 (0.0%) | 0 (0.0%) |
| Administrative & Support | 75 (87.2%) | 11 (12.8%) |
| Educational Services | 70 (33.3%) | 140 (66.7%) |
| Health Care & Social Assistance | 19 (11.9%) | 140 (88.0%) |
| Arts, Entertainment & Recreation | 11 (50.0%) | 11 (50.0%) |
| Accommodation & Food Services | 39 (76.5%) | 12 (23.5%) |
| Public Administration | 41 (39.4%) | 63 (60.6%) |
| Total | 749 (52.9%) | 668 (47.1%) |
Education in Eastover
School Enrollment in Eastover
The most common levels of schooling among the 956 students in Eastover are high school (353 | 36.9%), middle school (278 | 29.1%), and college / undergraduate (99 | 10.4%).
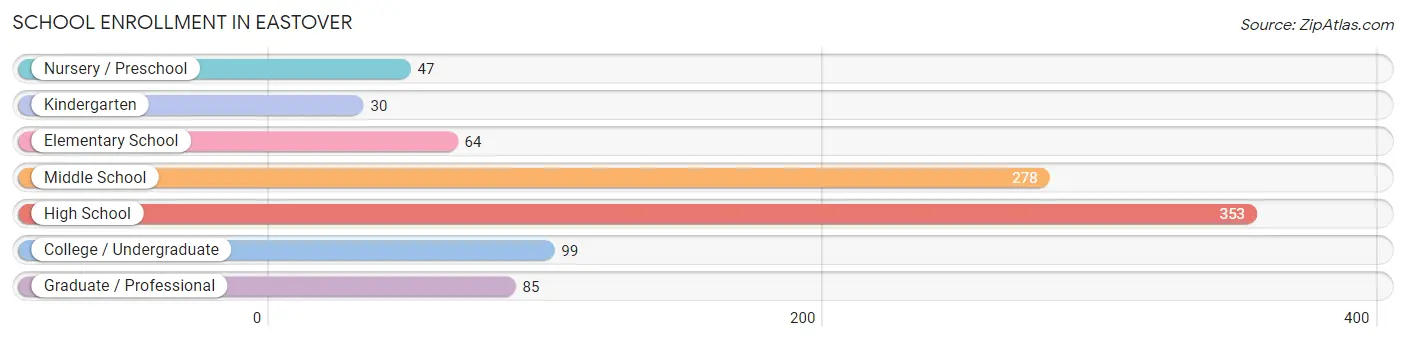
| School Level | # Students | % Students |
| Nursery / Preschool | 47 | 4.9% |
| Kindergarten | 30 | 3.1% |
| Elementary School | 64 | 6.7% |
| Middle School | 278 | 29.1% |
| High School | 353 | 36.9% |
| College / Undergraduate | 99 | 10.4% |
| Graduate / Professional | 85 | 8.9% |
| Total | 956 | 100.0% |
School Enrollment by Age by Funding Source in Eastover
Out of a total of 956 students who are enrolled in schools in Eastover, 118 (12.3%) attend a private institution, while the remaining 838 (87.7%) are enrolled in public schools. The age group of 18 to 19 year olds has the highest likelihood of being enrolled in private schools, with 25 (40.3% in the age bracket) enrolled. Conversely, the age group of 3 to 4 year olds has the lowest likelihood of being enrolled in a private school, with 16 (100.0% in the age bracket) attending a public institution.
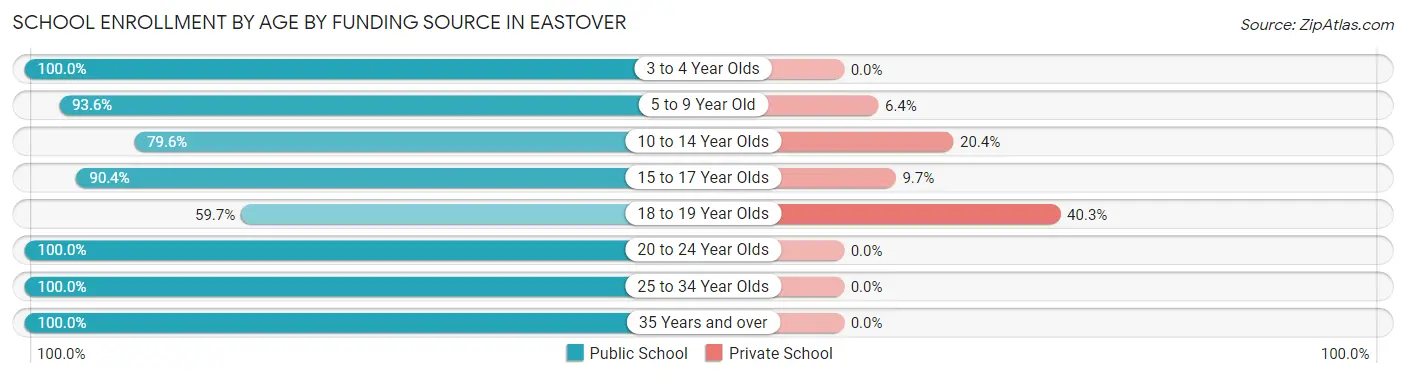
| Age Bracket | Public School | Private School |
| 3 to 4 Year Olds | 16 (100.0%) | 0 (0.0%) |
| 5 to 9 Year Old | 117 (93.6%) | 8 (6.4%) |
| 10 to 14 Year Olds | 215 (79.6%) | 55 (20.4%) |
| 15 to 17 Year Olds | 281 (90.3%) | 30 (9.7%) |
| 18 to 19 Year Olds | 37 (59.7%) | 25 (40.3%) |
| 20 to 24 Year Olds | 63 (100.0%) | 0 (0.0%) |
| 25 to 34 Year Olds | 34 (100.0%) | 0 (0.0%) |
| 35 Years and over | 75 (100.0%) | 0 (0.0%) |
| Total | 838 (87.7%) | 118 (12.3%) |
Educational Attainment by Field of Study in Eastover
Business (116 | 13.0%), liberal arts & history (112 | 12.5%), arts & humanities (112 | 12.5%), education (111 | 12.4%), and science & technology (100 | 11.2%) are the most common fields of study among 894 individuals in Eastover who have obtained a bachelor's degree or higher.
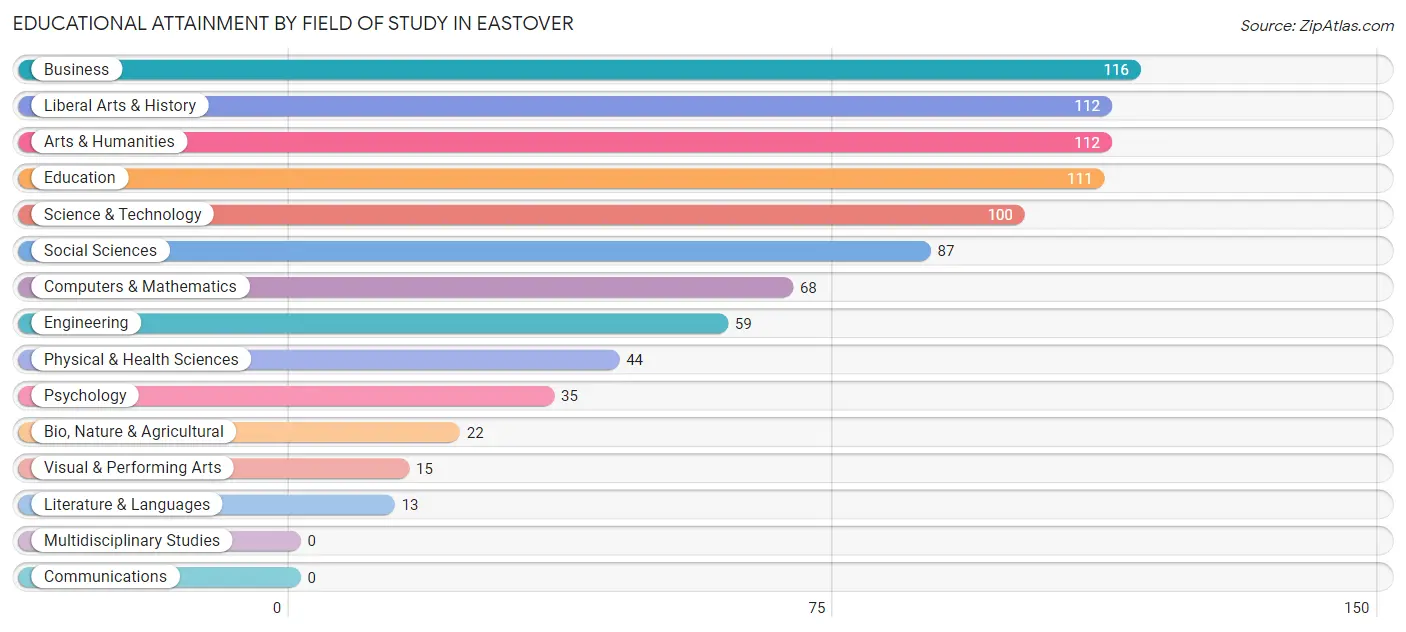
| Field of Study | # Graduates | % Graduates |
| Computers & Mathematics | 68 | 7.6% |
| Bio, Nature & Agricultural | 22 | 2.5% |
| Physical & Health Sciences | 44 | 4.9% |
| Psychology | 35 | 3.9% |
| Social Sciences | 87 | 9.7% |
| Engineering | 59 | 6.6% |
| Multidisciplinary Studies | 0 | 0.0% |
| Science & Technology | 100 | 11.2% |
| Business | 116 | 13.0% |
| Education | 111 | 12.4% |
| Literature & Languages | 13 | 1.5% |
| Liberal Arts & History | 112 | 12.5% |
| Visual & Performing Arts | 15 | 1.7% |
| Communications | 0 | 0.0% |
| Arts & Humanities | 112 | 12.5% |
| Total | 894 | 100.0% |
Transportation & Commute in Eastover
Vehicle Availability by Sex in Eastover
The most prevalent vehicle ownership categories in Eastover are males with 2 vehicles (395, accounting for 49.6%) and females with 2 vehicles (361, making up 59.1%).
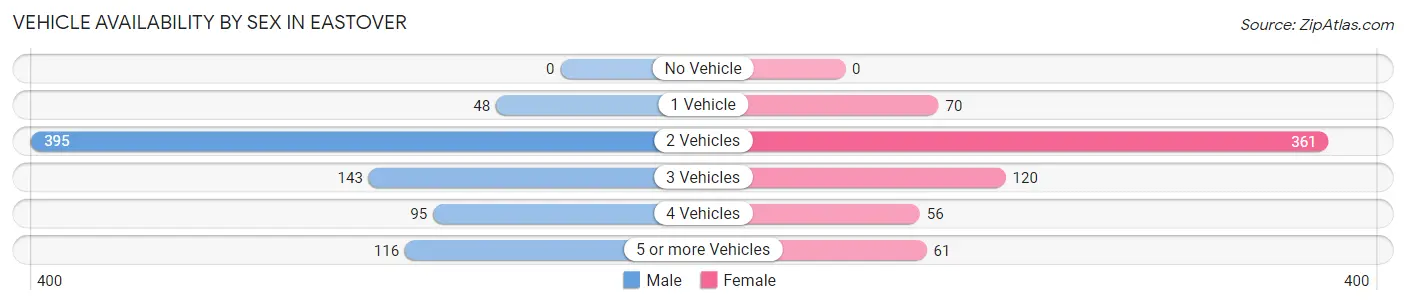
| Vehicles Available | Male | Female |
| No Vehicle | 0 (0.0%) | 0 (0.0%) |
| 1 Vehicle | 48 (6.0%) | 70 (10.5%) |
| 2 Vehicles | 395 (49.6%) | 361 (54.0%) |
| 3 Vehicles | 143 (17.9%) | 120 (18.0%) |
| 4 Vehicles | 95 (11.9%) | 56 (8.4%) |
| 5 or more Vehicles | 116 (14.5%) | 61 (9.1%) |
| Total | 797 (100.0%) | 668 (100.0%) |
Commute Time in Eastover
The most frequently occuring commute durations in Eastover are 20 to 24 minutes (260 commuters, 20.2%), 15 to 19 minutes (258 commuters, 20.0%), and 30 to 34 minutes (205 commuters, 15.9%).
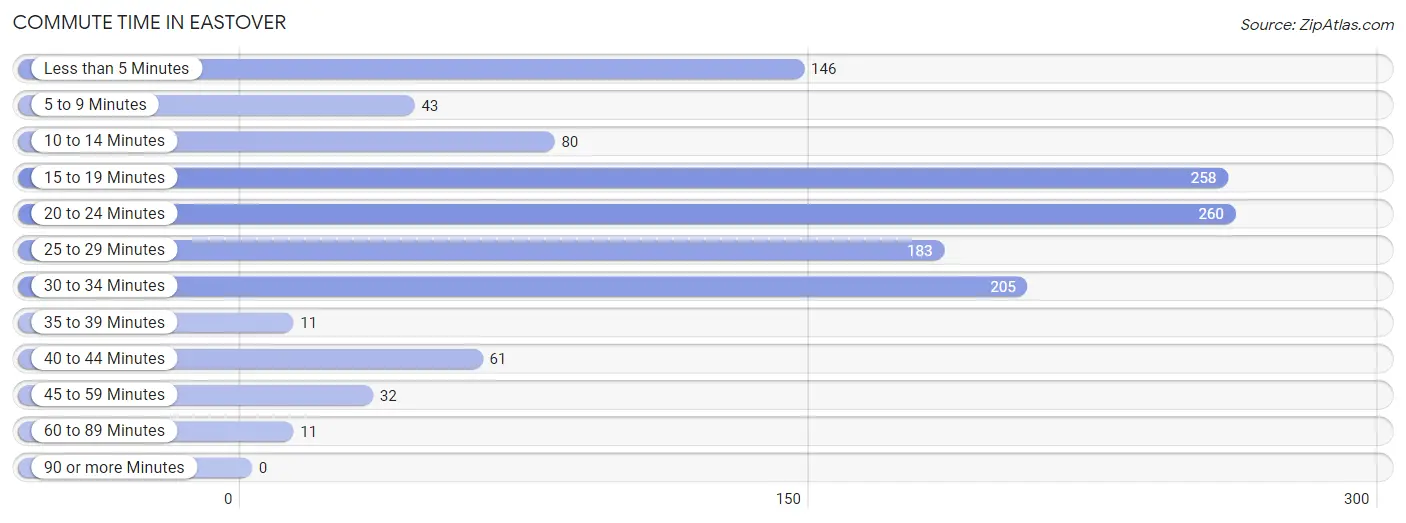
| Commute Time | # Commuters | % Commuters |
| Less than 5 Minutes | 146 | 11.3% |
| 5 to 9 Minutes | 43 | 3.3% |
| 10 to 14 Minutes | 80 | 6.2% |
| 15 to 19 Minutes | 258 | 20.0% |
| 20 to 24 Minutes | 260 | 20.2% |
| 25 to 29 Minutes | 183 | 14.2% |
| 30 to 34 Minutes | 205 | 15.9% |
| 35 to 39 Minutes | 11 | 0.9% |
| 40 to 44 Minutes | 61 | 4.7% |
| 45 to 59 Minutes | 32 | 2.5% |
| 60 to 89 Minutes | 11 | 0.9% |
| 90 or more Minutes | 0 | 0.0% |
Commute Time by Sex in Eastover
The most common commute times in Eastover are 20 to 24 minutes (140 commuters, 19.6%) for males and 15 to 19 minutes (126 commuters, 22.0%) for females.
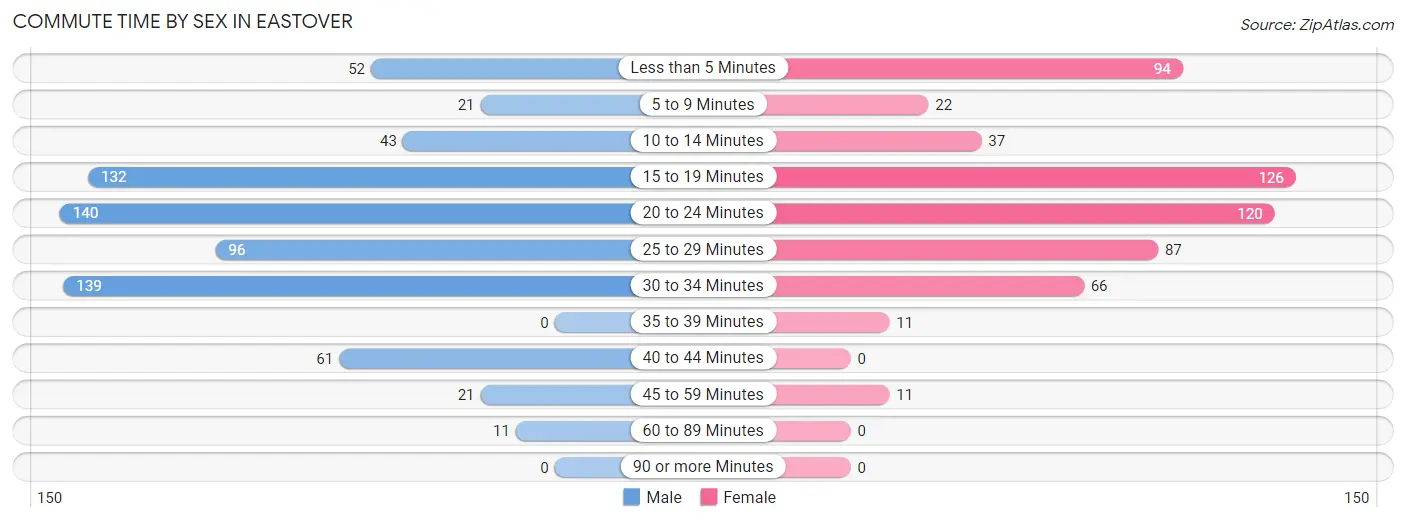
| Commute Time | Male | Female |
| Less than 5 Minutes | 52 (7.3%) | 94 (16.4%) |
| 5 to 9 Minutes | 21 (2.9%) | 22 (3.8%) |
| 10 to 14 Minutes | 43 (6.0%) | 37 (6.5%) |
| 15 to 19 Minutes | 132 (18.4%) | 126 (22.0%) |
| 20 to 24 Minutes | 140 (19.6%) | 120 (20.9%) |
| 25 to 29 Minutes | 96 (13.4%) | 87 (15.2%) |
| 30 to 34 Minutes | 139 (19.4%) | 66 (11.5%) |
| 35 to 39 Minutes | 0 (0.0%) | 11 (1.9%) |
| 40 to 44 Minutes | 61 (8.5%) | 0 (0.0%) |
| 45 to 59 Minutes | 21 (2.9%) | 11 (1.9%) |
| 60 to 89 Minutes | 11 (1.5%) | 0 (0.0%) |
| 90 or more Minutes | 0 (0.0%) | 0 (0.0%) |
Time of Departure to Work by Sex in Eastover
The most frequent times of departure to work in Eastover are 8:00 AM to 8:29 AM (121, 16.9%) for males and 7:00 AM to 7:29 AM (140, 24.4%) for females.
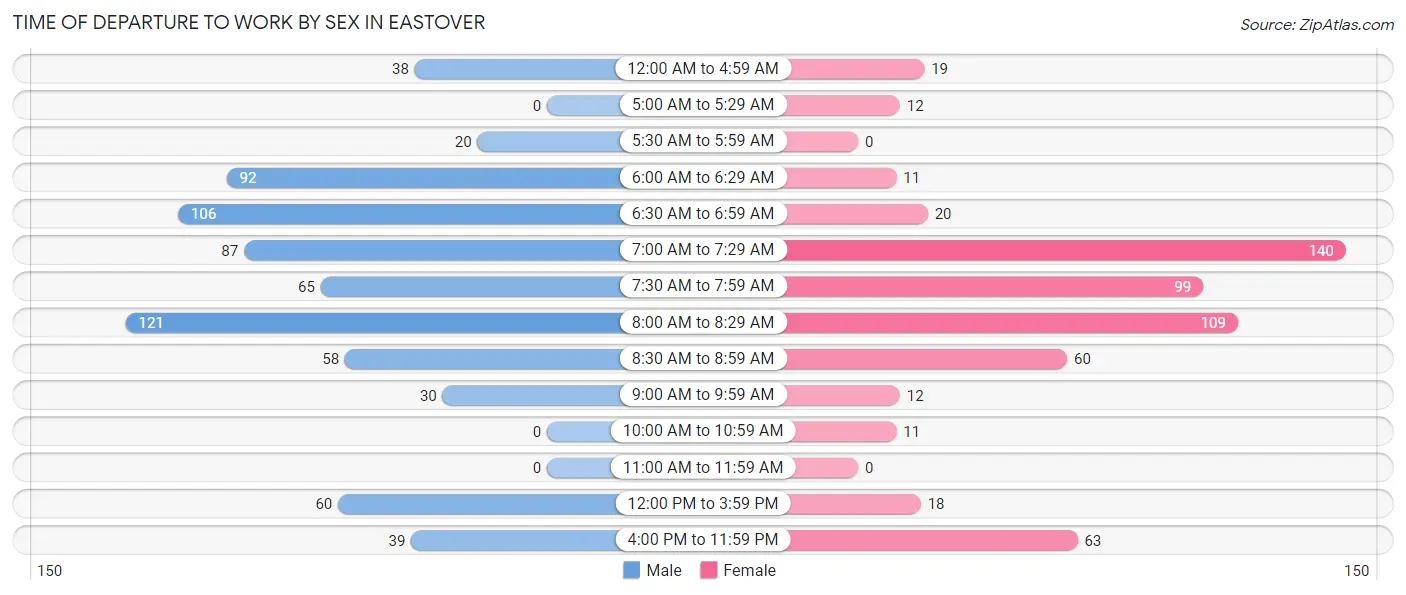
| Time of Departure | Male | Female |
| 12:00 AM to 4:59 AM | 38 (5.3%) | 19 (3.3%) |
| 5:00 AM to 5:29 AM | 0 (0.0%) | 12 (2.1%) |
| 5:30 AM to 5:59 AM | 20 (2.8%) | 0 (0.0%) |
| 6:00 AM to 6:29 AM | 92 (12.9%) | 11 (1.9%) |
| 6:30 AM to 6:59 AM | 106 (14.8%) | 20 (3.5%) |
| 7:00 AM to 7:29 AM | 87 (12.1%) | 140 (24.4%) |
| 7:30 AM to 7:59 AM | 65 (9.1%) | 99 (17.2%) |
| 8:00 AM to 8:29 AM | 121 (16.9%) | 109 (19.0%) |
| 8:30 AM to 8:59 AM | 58 (8.1%) | 60 (10.4%) |
| 9:00 AM to 9:59 AM | 30 (4.2%) | 12 (2.1%) |
| 10:00 AM to 10:59 AM | 0 (0.0%) | 11 (1.9%) |
| 11:00 AM to 11:59 AM | 0 (0.0%) | 0 (0.0%) |
| 12:00 PM to 3:59 PM | 60 (8.4%) | 18 (3.1%) |
| 4:00 PM to 11:59 PM | 39 (5.4%) | 63 (11.0%) |
| Total | 716 (100.0%) | 574 (100.0%) |
Housing Occupancy in Eastover
Occupancy by Ownership in Eastover
Of the total 1,419 dwellings in Eastover, owner-occupied units account for 1,071 (75.5%), while renter-occupied units make up 348 (24.5%).
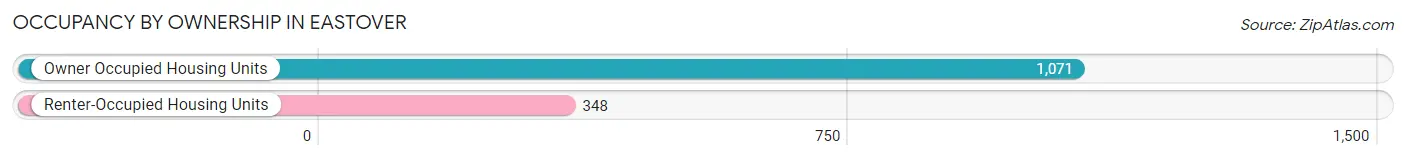
| Occupancy | # Housing Units | % Housing Units |
| Owner Occupied Housing Units | 1,071 | 75.5% |
| Renter-Occupied Housing Units | 348 | 24.5% |
| Total Occupied Housing Units | 1,419 | 100.0% |
Occupancy by Household Size in Eastover
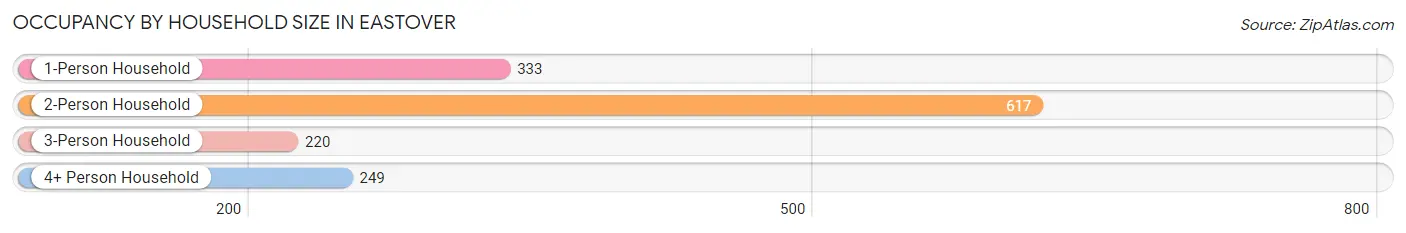
| Household Size | # Housing Units | % Housing Units |
| 1-Person Household | 333 | 23.5% |
| 2-Person Household | 617 | 43.5% |
| 3-Person Household | 220 | 15.5% |
| 4+ Person Household | 249 | 17.5% |
| Total Housing Units | 1,419 | 100.0% |
Occupancy by Ownership by Household Size in Eastover
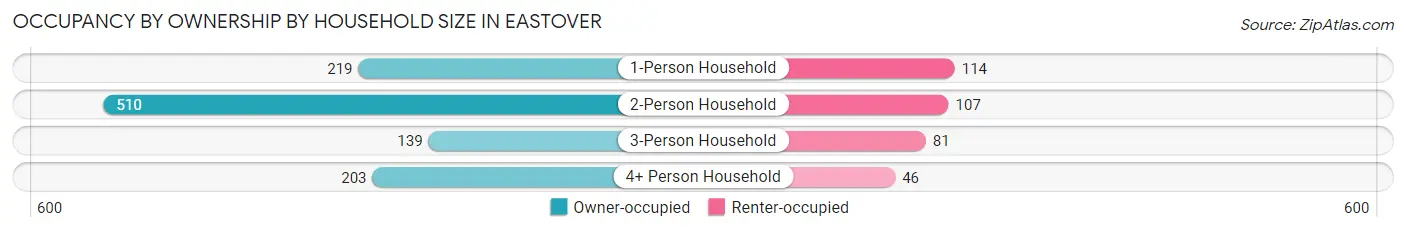
| Household Size | Owner-occupied | Renter-occupied |
| 1-Person Household | 219 (65.8%) | 114 (34.2%) |
| 2-Person Household | 510 (82.7%) | 107 (17.3%) |
| 3-Person Household | 139 (63.2%) | 81 (36.8%) |
| 4+ Person Household | 203 (81.5%) | 46 (18.5%) |
| Total Housing Units | 1,071 (75.5%) | 348 (24.5%) |
Occupancy by Educational Attainment in Eastover
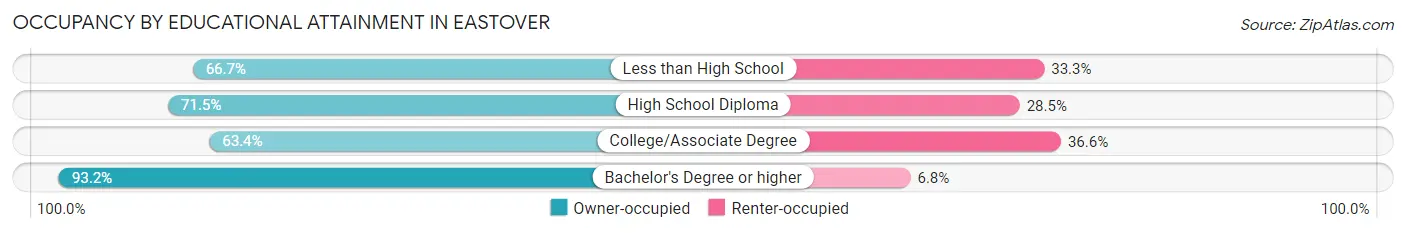
| Household Size | Owner-occupied | Renter-occupied |
| Less than High School | 30 (66.7%) | 15 (33.3%) |
| High School Diploma | 264 (71.5%) | 105 (28.5%) |
| College/Associate Degree | 339 (63.4%) | 196 (36.6%) |
| Bachelor's Degree or higher | 438 (93.2%) | 32 (6.8%) |
Occupancy by Age of Householder in Eastover
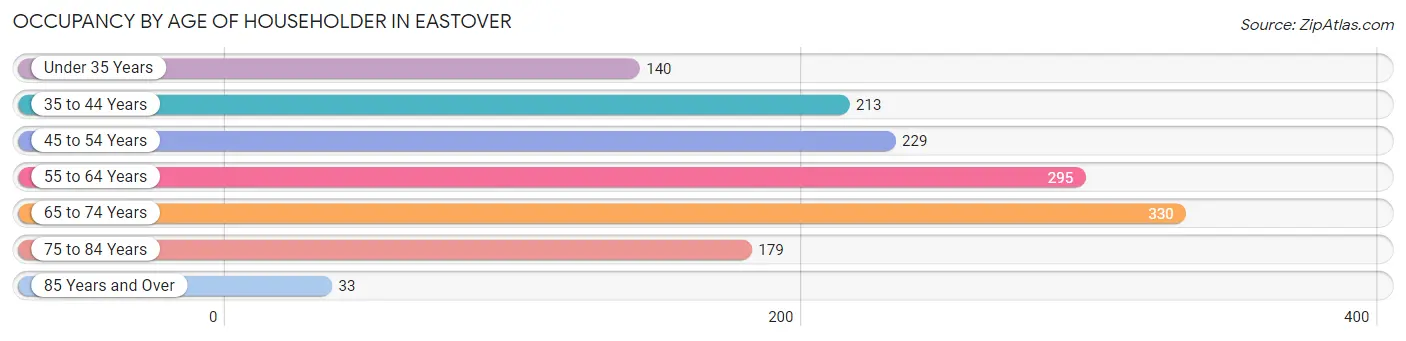
| Age Bracket | # Households | % Households |
| Under 35 Years | 140 | 9.9% |
| 35 to 44 Years | 213 | 15.0% |
| 45 to 54 Years | 229 | 16.1% |
| 55 to 64 Years | 295 | 20.8% |
| 65 to 74 Years | 330 | 23.3% |
| 75 to 84 Years | 179 | 12.6% |
| 85 Years and Over | 33 | 2.3% |
| Total | 1,419 | 100.0% |
Housing Finances in Eastover
Median Income by Occupancy in Eastover
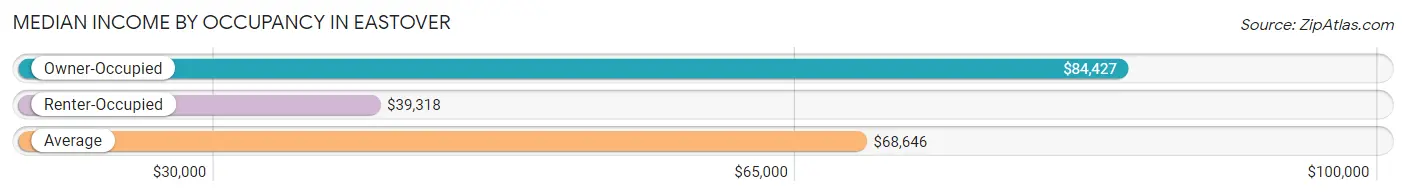
| Occupancy Type | # Households | Median Income |
| Owner-Occupied | 1,071 (75.5%) | $84,427 |
| Renter-Occupied | 348 (24.5%) | $39,318 |
| Average | 1,419 (100.0%) | $68,646 |
Occupancy by Householder Income Bracket in Eastover
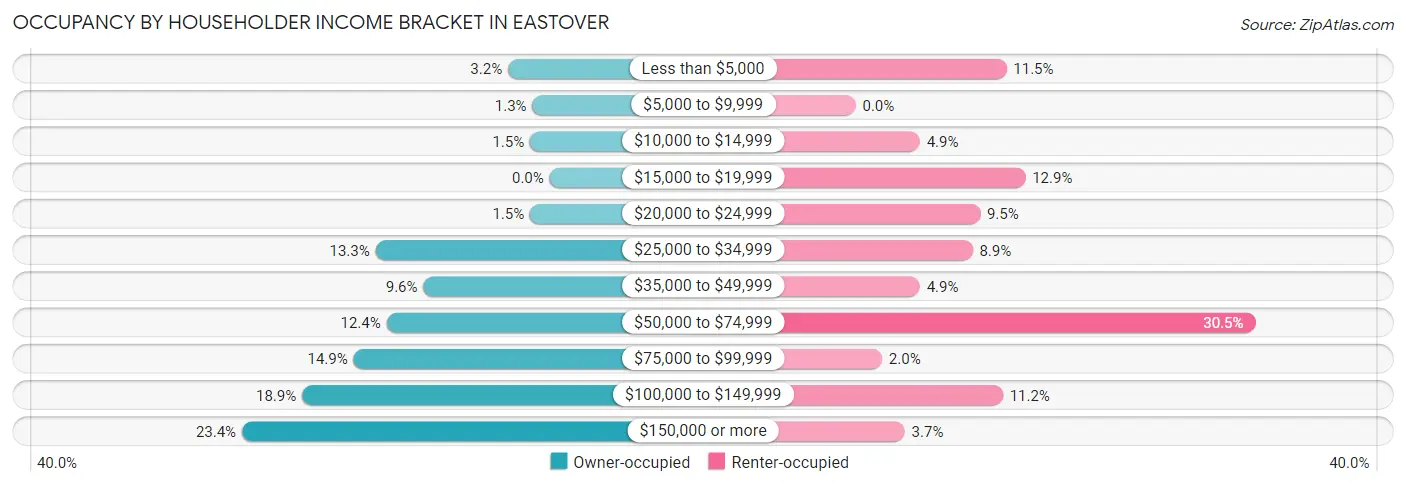
| Income Bracket | Owner-occupied | Renter-occupied |
| Less than $5,000 | 34 (3.2%) | 40 (11.5%) |
| $5,000 to $9,999 | 14 (1.3%) | 0 (0.0%) |
| $10,000 to $14,999 | 16 (1.5%) | 17 (4.9%) |
| $15,000 to $19,999 | 0 (0.0%) | 45 (12.9%) |
| $20,000 to $24,999 | 16 (1.5%) | 33 (9.5%) |
| $25,000 to $34,999 | 142 (13.3%) | 31 (8.9%) |
| $35,000 to $49,999 | 103 (9.6%) | 17 (4.9%) |
| $50,000 to $74,999 | 133 (12.4%) | 106 (30.5%) |
| $75,000 to $99,999 | 160 (14.9%) | 7 (2.0%) |
| $100,000 to $149,999 | 202 (18.9%) | 39 (11.2%) |
| $150,000 or more | 251 (23.4%) | 13 (3.7%) |
| Total | 1,071 (100.0%) | 348 (100.0%) |
Monthly Housing Cost Tiers in Eastover
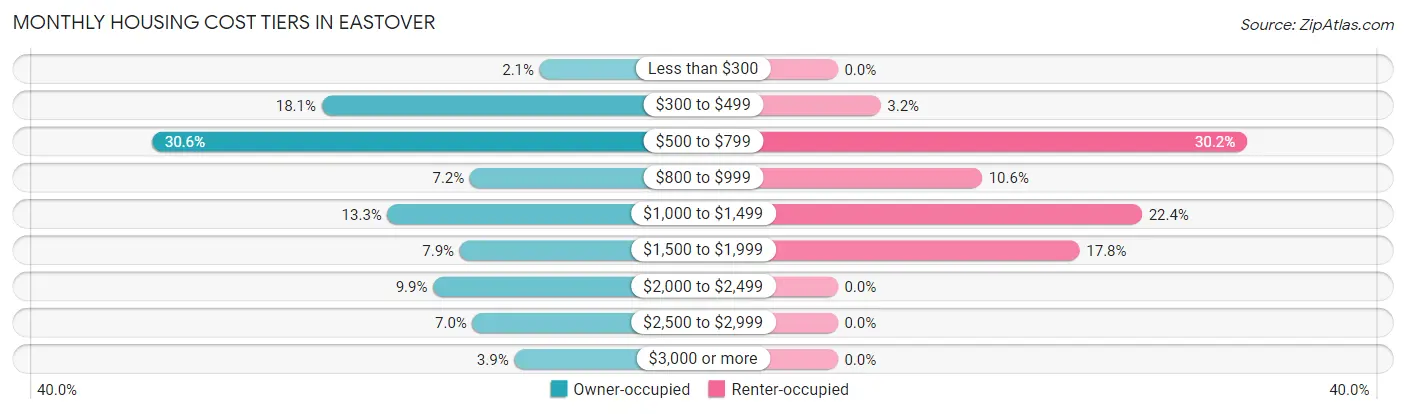
| Monthly Cost | Owner-occupied | Renter-occupied |
| Less than $300 | 22 (2.1%) | 0 (0.0%) |
| $300 to $499 | 194 (18.1%) | 11 (3.2%) |
| $500 to $799 | 328 (30.6%) | 105 (30.2%) |
| $800 to $999 | 77 (7.2%) | 37 (10.6%) |
| $1,000 to $1,499 | 142 (13.3%) | 78 (22.4%) |
| $1,500 to $1,999 | 85 (7.9%) | 62 (17.8%) |
| $2,000 to $2,499 | 106 (9.9%) | 0 (0.0%) |
| $2,500 to $2,999 | 75 (7.0%) | 0 (0.0%) |
| $3,000 or more | 42 (3.9%) | 0 (0.0%) |
| Total | 1,071 (100.0%) | 348 (100.0%) |
Physical Housing Characteristics in Eastover
Housing Structures in Eastover
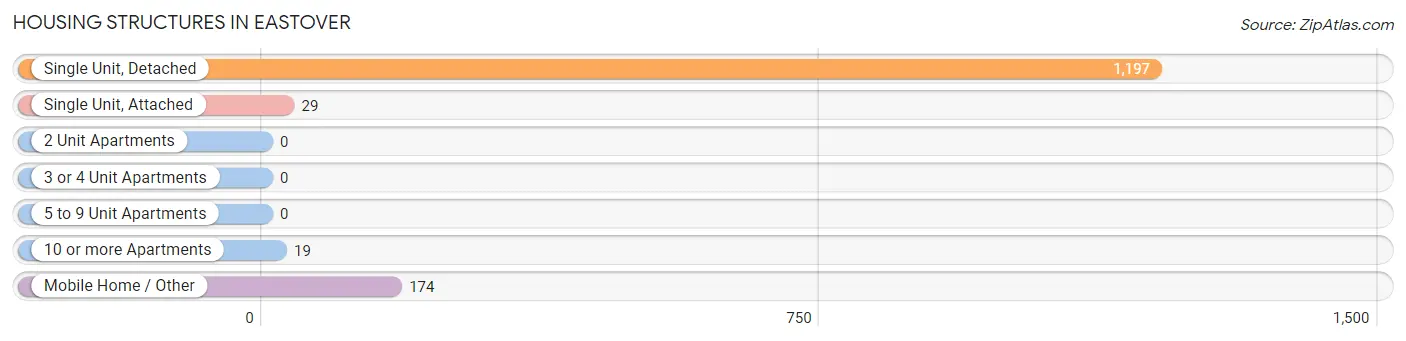
| Structure Type | # Housing Units | % Housing Units |
| Single Unit, Detached | 1,197 | 84.4% |
| Single Unit, Attached | 29 | 2.0% |
| 2 Unit Apartments | 0 | 0.0% |
| 3 or 4 Unit Apartments | 0 | 0.0% |
| 5 to 9 Unit Apartments | 0 | 0.0% |
| 10 or more Apartments | 19 | 1.3% |
| Mobile Home / Other | 174 | 12.3% |
| Total | 1,419 | 100.0% |
Housing Structures by Occupancy in Eastover
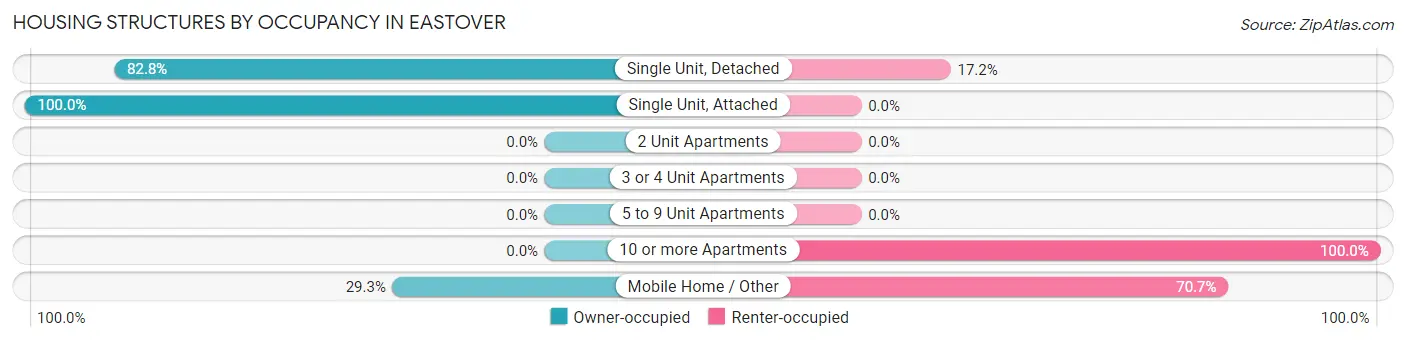
| Structure Type | Owner-occupied | Renter-occupied |
| Single Unit, Detached | 991 (82.8%) | 206 (17.2%) |
| Single Unit, Attached | 29 (100.0%) | 0 (0.0%) |
| 2 Unit Apartments | 0 (0.0%) | 0 (0.0%) |
| 3 or 4 Unit Apartments | 0 (0.0%) | 0 (0.0%) |
| 5 to 9 Unit Apartments | 0 (0.0%) | 0 (0.0%) |
| 10 or more Apartments | 0 (0.0%) | 19 (100.0%) |
| Mobile Home / Other | 51 (29.3%) | 123 (70.7%) |
| Total | 1,071 (75.5%) | 348 (24.5%) |
Housing Structures by Number of Rooms in Eastover
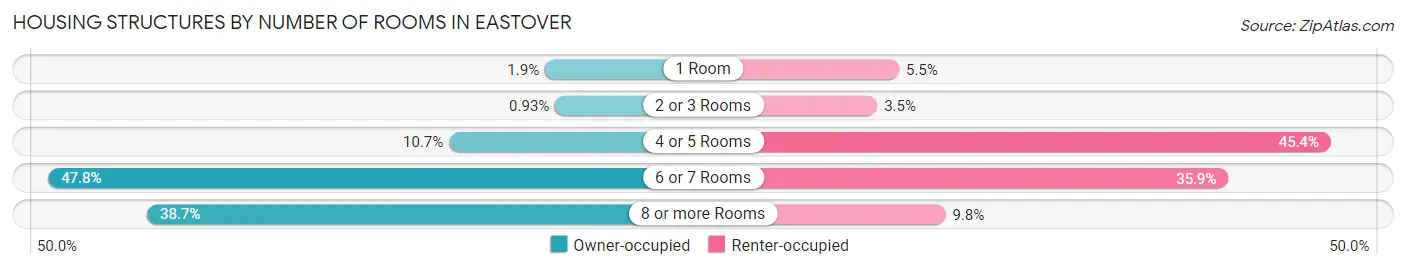
| Number of Rooms | Owner-occupied | Renter-occupied |
| 1 Room | 20 (1.9%) | 19 (5.5%) |
| 2 or 3 Rooms | 10 (0.9%) | 12 (3.5%) |
| 4 or 5 Rooms | 115 (10.7%) | 158 (45.4%) |
| 6 or 7 Rooms | 512 (47.8%) | 125 (35.9%) |
| 8 or more Rooms | 414 (38.7%) | 34 (9.8%) |
| Total | 1,071 (100.0%) | 348 (100.0%) |
Housing Structure by Heating Type in Eastover
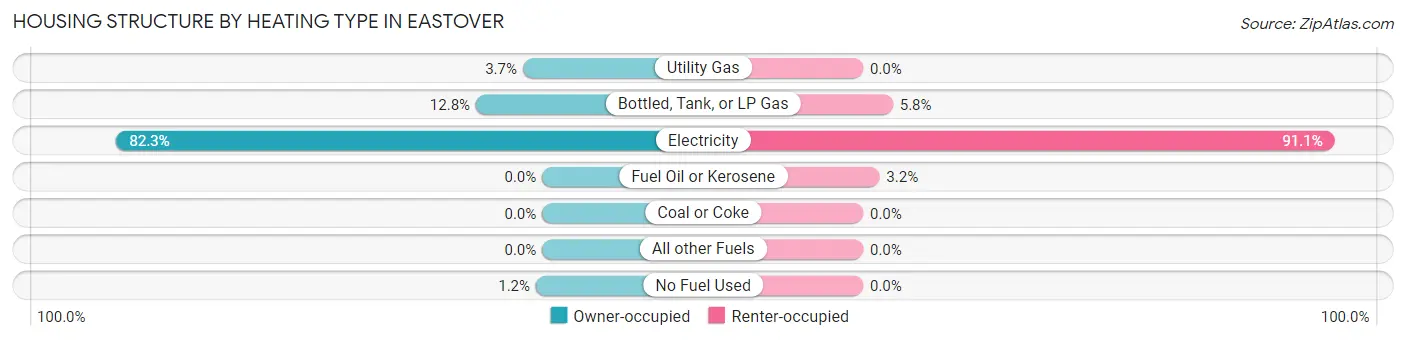
| Heating Type | Owner-occupied | Renter-occupied |
| Utility Gas | 40 (3.7%) | 0 (0.0%) |
| Bottled, Tank, or LP Gas | 137 (12.8%) | 20 (5.8%) |
| Electricity | 881 (82.3%) | 317 (91.1%) |
| Fuel Oil or Kerosene | 0 (0.0%) | 11 (3.2%) |
| Coal or Coke | 0 (0.0%) | 0 (0.0%) |
| All other Fuels | 0 (0.0%) | 0 (0.0%) |
| No Fuel Used | 13 (1.2%) | 0 (0.0%) |
| Total | 1,071 (100.0%) | 348 (100.0%) |
Household Vehicle Usage in Eastover
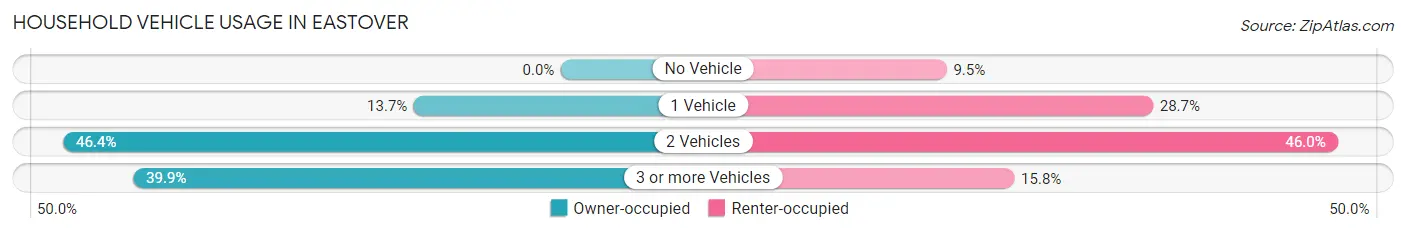
| Vehicles per Household | Owner-occupied | Renter-occupied |
| No Vehicle | 0 (0.0%) | 33 (9.5%) |
| 1 Vehicle | 147 (13.7%) | 100 (28.7%) |
| 2 Vehicles | 497 (46.4%) | 160 (46.0%) |
| 3 or more Vehicles | 427 (39.9%) | 55 (15.8%) |
| Total | 1,071 (100.0%) | 348 (100.0%) |
Real Estate & Mortgages in Eastover
Real Estate and Mortgage Overview in Eastover
| Characteristic | Without Mortgage | With Mortgage |
| Housing Units | 559 | 512 |
| Median Property Value | $214,500 | $277,400 |
| Median Household Income | $83,750 | $167 |
| Monthly Housing Costs | $546 | $42 |
| Real Estate Taxes | $1,709 | $0 |
Property Value by Mortgage Status in Eastover
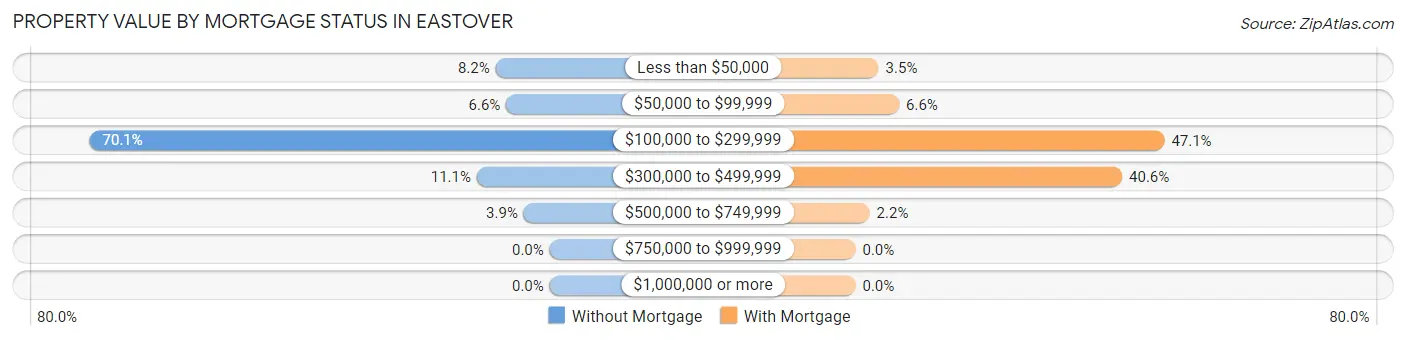
| Property Value | Without Mortgage | With Mortgage |
| Less than $50,000 | 46 (8.2%) | 18 (3.5%) |
| $50,000 to $99,999 | 37 (6.6%) | 34 (6.6%) |
| $100,000 to $299,999 | 392 (70.1%) | 241 (47.1%) |
| $300,000 to $499,999 | 62 (11.1%) | 208 (40.6%) |
| $500,000 to $749,999 | 22 (3.9%) | 11 (2.1%) |
| $750,000 to $999,999 | 0 (0.0%) | 0 (0.0%) |
| $1,000,000 or more | 0 (0.0%) | 0 (0.0%) |
| Total | 559 (100.0%) | 512 (100.0%) |
Household Income by Mortgage Status in Eastover
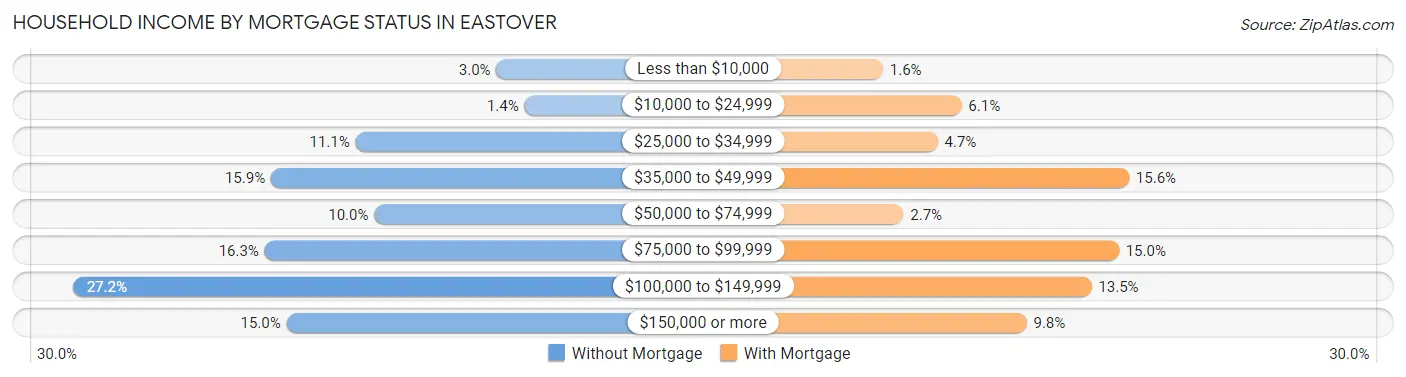
| Household Income | Without Mortgage | With Mortgage |
| Less than $10,000 | 17 (3.0%) | 8 (1.6%) |
| $10,000 to $24,999 | 8 (1.4%) | 31 (6.0%) |
| $25,000 to $34,999 | 62 (11.1%) | 24 (4.7%) |
| $35,000 to $49,999 | 89 (15.9%) | 80 (15.6%) |
| $50,000 to $74,999 | 56 (10.0%) | 14 (2.7%) |
| $75,000 to $99,999 | 91 (16.3%) | 77 (15.0%) |
| $100,000 to $149,999 | 152 (27.2%) | 69 (13.5%) |
| $150,000 or more | 84 (15.0%) | 50 (9.8%) |
| Total | 559 (100.0%) | 512 (100.0%) |
Property Value to Household Income Ratio in Eastover
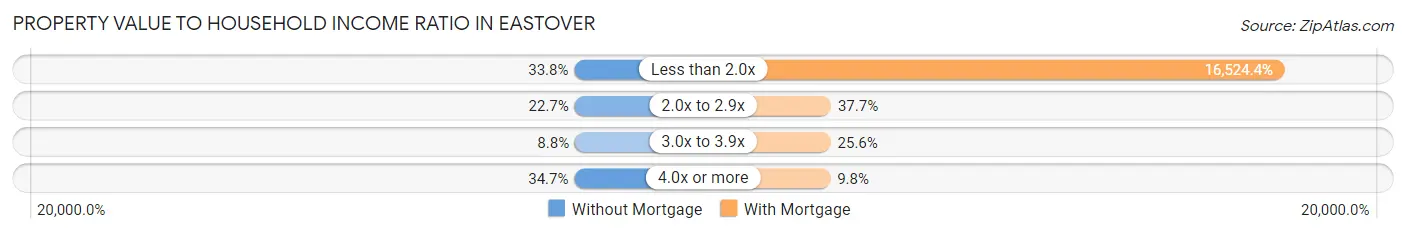
| Value-to-Income Ratio | Without Mortgage | With Mortgage |
| Less than 2.0x | 189 (33.8%) | 84,605 (16,524.4%) |
| 2.0x to 2.9x | 127 (22.7%) | 193 (37.7%) |
| 3.0x to 3.9x | 49 (8.8%) | 131 (25.6%) |
| 4.0x or more | 194 (34.7%) | 50 (9.8%) |
| Total | 559 (100.0%) | 512 (100.0%) |
Real Estate Taxes by Mortgage Status in Eastover
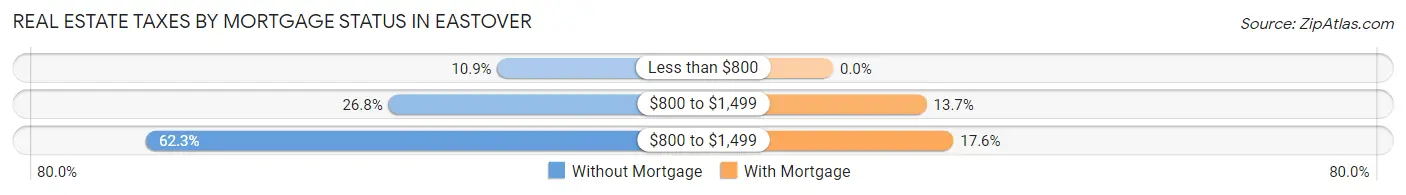
| Property Taxes | Without Mortgage | With Mortgage |
| Less than $800 | 61 (10.9%) | 0 (0.0%) |
| $800 to $1,499 | 150 (26.8%) | 70 (13.7%) |
| $800 to $1,499 | 348 (62.3%) | 90 (17.6%) |
| Total | 559 (100.0%) | 512 (100.0%) |
Health & Disability in Eastover
Health Insurance Coverage by Age in Eastover
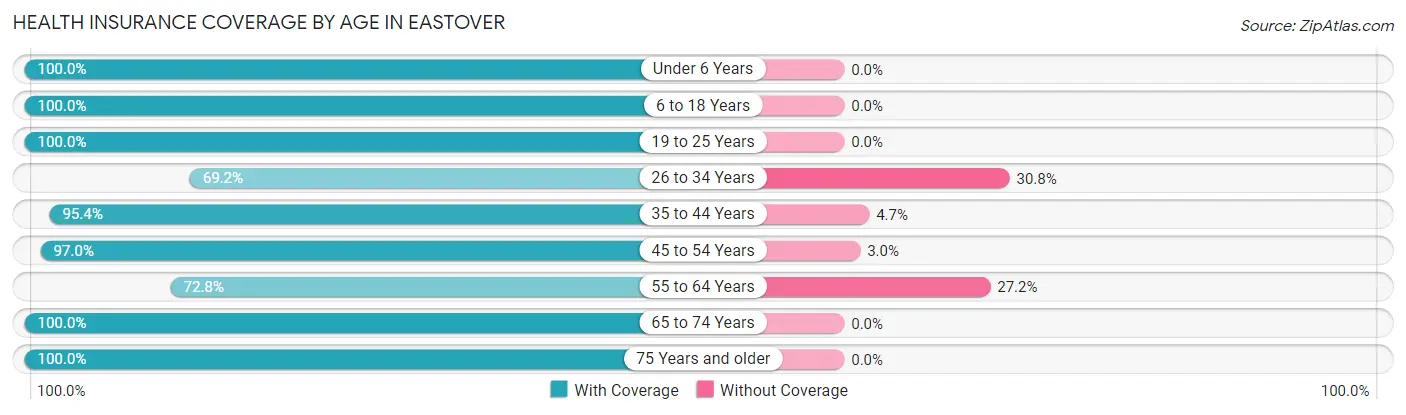
| Age Bracket | With Coverage | Without Coverage |
| Under 6 Years | 170 (100.0%) | 0 (0.0%) |
| 6 to 18 Years | 721 (100.0%) | 0 (0.0%) |
| 19 to 25 Years | 264 (100.0%) | 0 (0.0%) |
| 26 to 34 Years | 146 (69.2%) | 65 (30.8%) |
| 35 to 44 Years | 328 (95.4%) | 16 (4.6%) |
| 45 to 54 Years | 457 (97.0%) | 14 (3.0%) |
| 55 to 64 Years | 326 (72.8%) | 122 (27.2%) |
| 65 to 74 Years | 596 (100.0%) | 0 (0.0%) |
| 75 Years and older | 294 (100.0%) | 0 (0.0%) |
| Total | 3,302 (93.8%) | 217 (6.2%) |
Health Insurance Coverage by Citizenship Status in Eastover
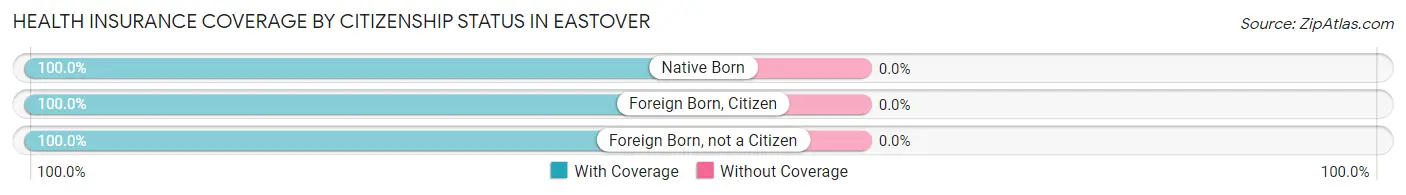
| Citizenship Status | With Coverage | Without Coverage |
| Native Born | 170 (100.0%) | 0 (0.0%) |
| Foreign Born, Citizen | 721 (100.0%) | 0 (0.0%) |
| Foreign Born, not a Citizen | 264 (100.0%) | 0 (0.0%) |
Health Insurance Coverage by Household Income in Eastover
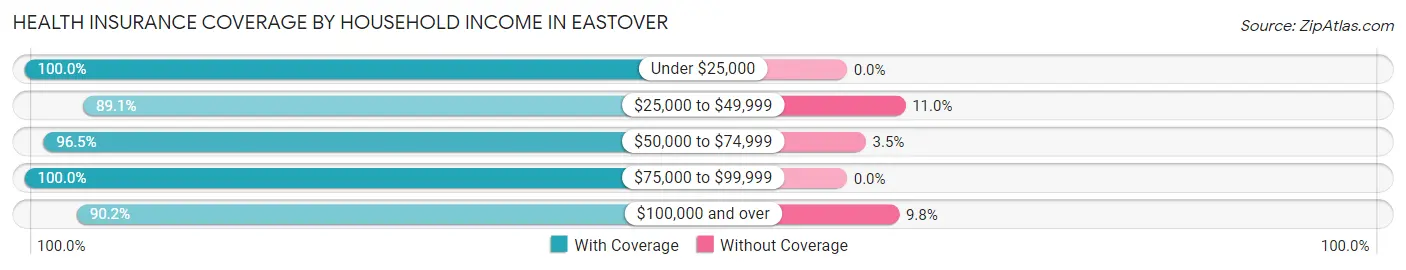
| Household Income | With Coverage | Without Coverage |
| Under $25,000 | 370 (100.0%) | 0 (0.0%) |
| $25,000 to $49,999 | 439 (89.0%) | 54 (11.0%) |
| $50,000 to $74,999 | 740 (96.5%) | 27 (3.5%) |
| $75,000 to $99,999 | 522 (100.0%) | 0 (0.0%) |
| $100,000 and over | 1,227 (90.2%) | 133 (9.8%) |
Public vs Private Health Insurance Coverage by Age in Eastover
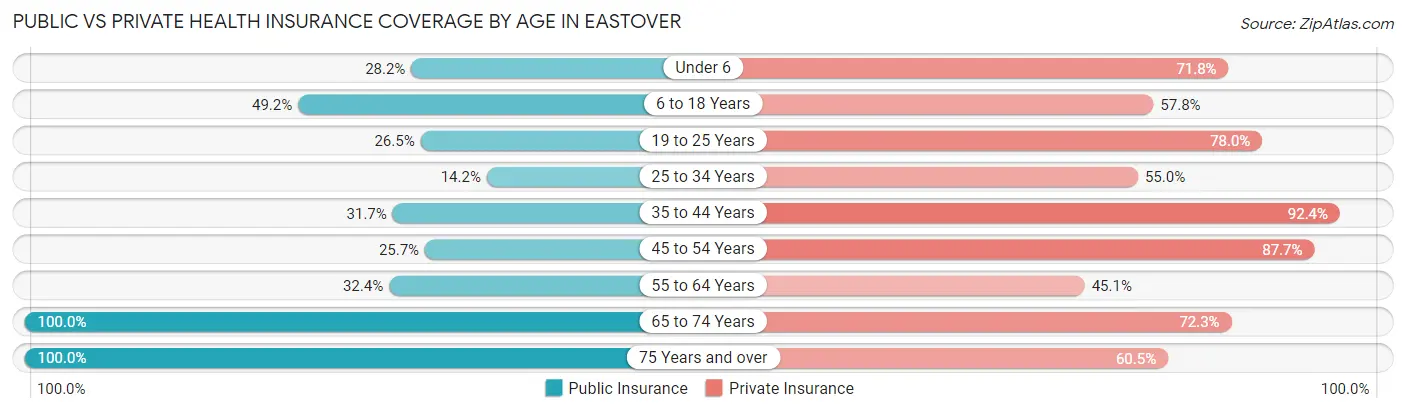
| Age Bracket | Public Insurance | Private Insurance |
| Under 6 | 48 (28.2%) | 122 (71.8%) |
| 6 to 18 Years | 355 (49.2%) | 417 (57.8%) |
| 19 to 25 Years | 70 (26.5%) | 206 (78.0%) |
| 25 to 34 Years | 30 (14.2%) | 116 (55.0%) |
| 35 to 44 Years | 109 (31.7%) | 318 (92.4%) |
| 45 to 54 Years | 121 (25.7%) | 413 (87.7%) |
| 55 to 64 Years | 145 (32.4%) | 202 (45.1%) |
| 65 to 74 Years | 596 (100.0%) | 431 (72.3%) |
| 75 Years and over | 294 (100.0%) | 178 (60.5%) |
| Total | 1,768 (50.2%) | 2,403 (68.3%) |
Disability Status by Sex by Age in Eastover
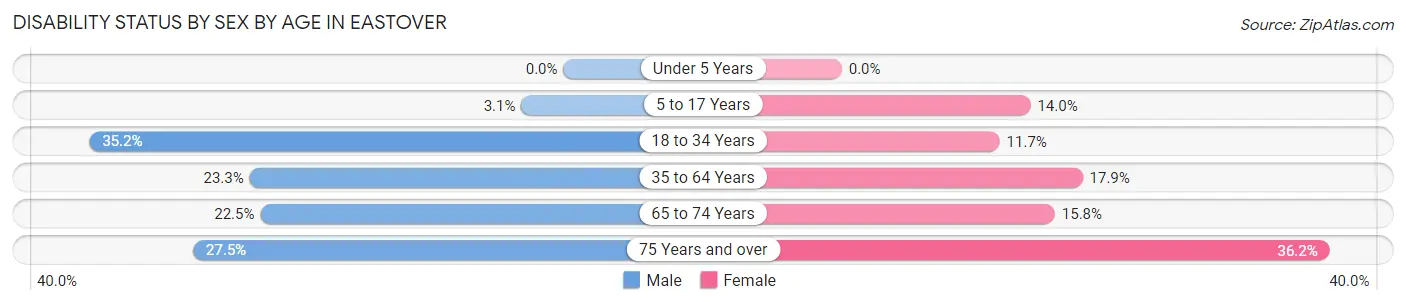
| Age Bracket | Male | Female |
| Under 5 Years | 0 (0.0%) | 0 (0.0%) |
| 5 to 17 Years | 14 (3.1%) | 36 (14.0%) |
| 18 to 34 Years | 138 (35.2%) | 17 (11.7%) |
| 35 to 64 Years | 134 (23.3%) | 123 (17.9%) |
| 65 to 74 Years | 63 (22.5%) | 50 (15.8%) |
| 75 Years and over | 33 (27.5%) | 63 (36.2%) |
Disability Class by Sex by Age in Eastover
Disability Class: Hearing Difficulty
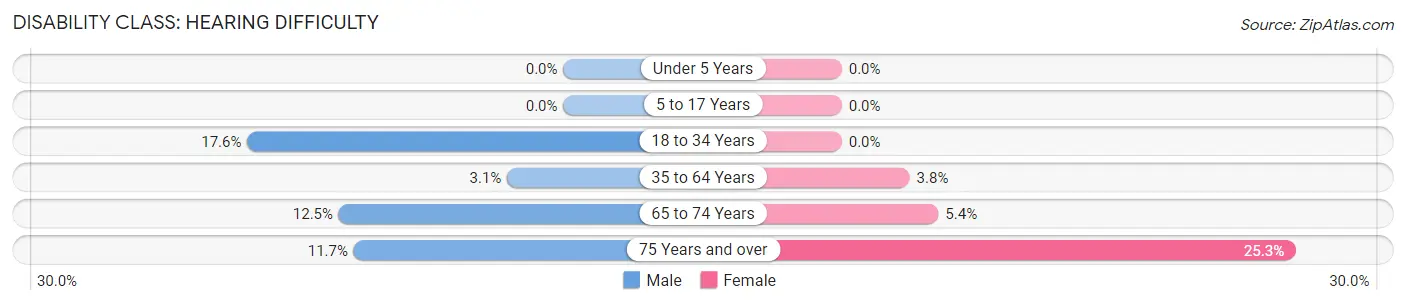
| Age Bracket | Male | Female |
| Under 5 Years | 0 (0.0%) | 0 (0.0%) |
| 5 to 17 Years | 0 (0.0%) | 0 (0.0%) |
| 18 to 34 Years | 69 (17.6%) | 0 (0.0%) |
| 35 to 64 Years | 18 (3.1%) | 26 (3.8%) |
| 65 to 74 Years | 35 (12.5%) | 17 (5.4%) |
| 75 Years and over | 14 (11.7%) | 44 (25.3%) |
Disability Class: Vision Difficulty
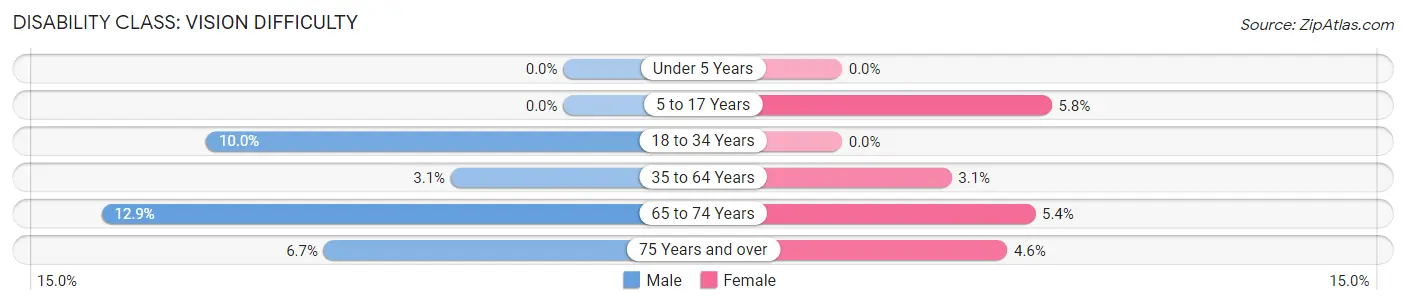
| Age Bracket | Male | Female |
| Under 5 Years | 0 (0.0%) | 0 (0.0%) |
| 5 to 17 Years | 0 (0.0%) | 15 (5.8%) |
| 18 to 34 Years | 39 (10.0%) | 0 (0.0%) |
| 35 to 64 Years | 18 (3.1%) | 21 (3.0%) |
| 65 to 74 Years | 36 (12.9%) | 17 (5.4%) |
| 75 Years and over | 8 (6.7%) | 8 (4.6%) |
Disability Class: Cognitive Difficulty
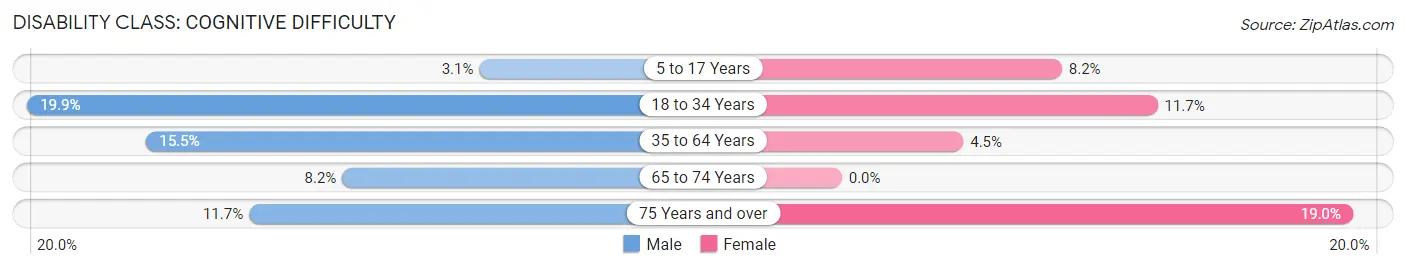
| Age Bracket | Male | Female |
| 5 to 17 Years | 14 (3.1%) | 21 (8.2%) |
| 18 to 34 Years | 78 (19.9%) | 17 (11.7%) |
| 35 to 64 Years | 89 (15.5%) | 31 (4.5%) |
| 65 to 74 Years | 23 (8.2%) | 0 (0.0%) |
| 75 Years and over | 14 (11.7%) | 33 (19.0%) |
Disability Class: Ambulatory Difficulty
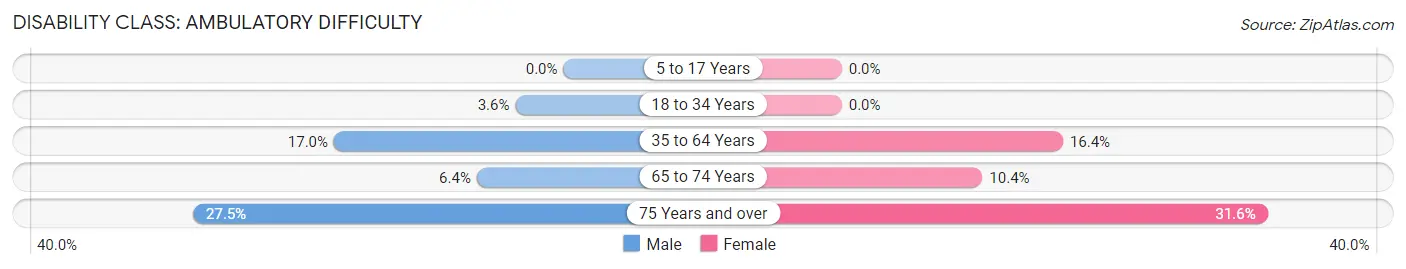
| Age Bracket | Male | Female |
| 5 to 17 Years | 0 (0.0%) | 0 (0.0%) |
| 18 to 34 Years | 14 (3.6%) | 0 (0.0%) |
| 35 to 64 Years | 98 (17.0%) | 113 (16.4%) |
| 65 to 74 Years | 18 (6.4%) | 33 (10.4%) |
| 75 Years and over | 33 (27.5%) | 55 (31.6%) |
Disability Class: Self-Care Difficulty
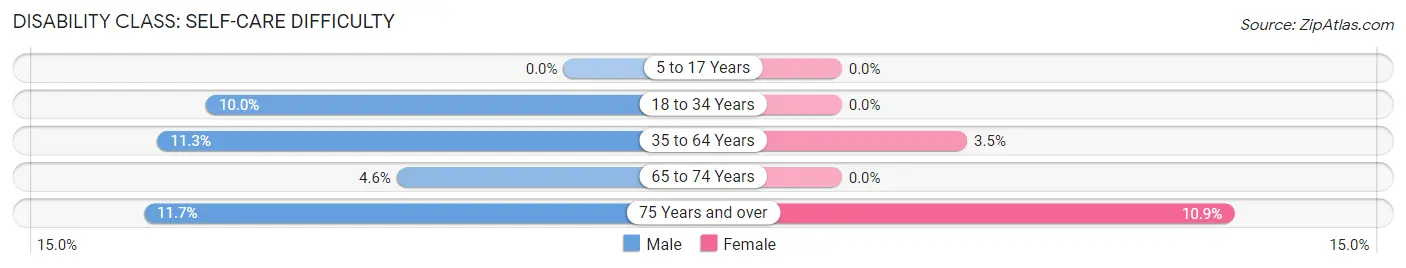
| Age Bracket | Male | Female |
| 5 to 17 Years | 0 (0.0%) | 0 (0.0%) |
| 18 to 34 Years | 39 (10.0%) | 0 (0.0%) |
| 35 to 64 Years | 65 (11.3%) | 24 (3.5%) |
| 65 to 74 Years | 13 (4.6%) | 0 (0.0%) |
| 75 Years and over | 14 (11.7%) | 19 (10.9%) |
Technology Access in Eastover
Computing Device Access in Eastover
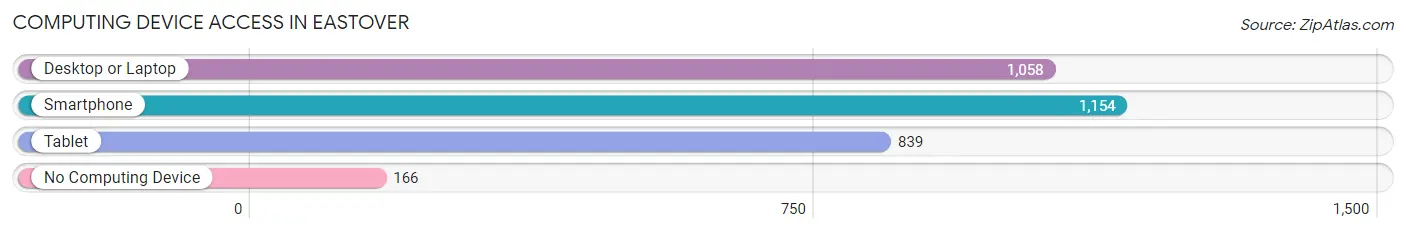
| Device Type | # Households | % Households |
| Desktop or Laptop | 1,058 | 74.6% |
| Smartphone | 1,154 | 81.3% |
| Tablet | 839 | 59.1% |
| No Computing Device | 166 | 11.7% |
| Total | 1,419 | 100.0% |
Internet Access in Eastover
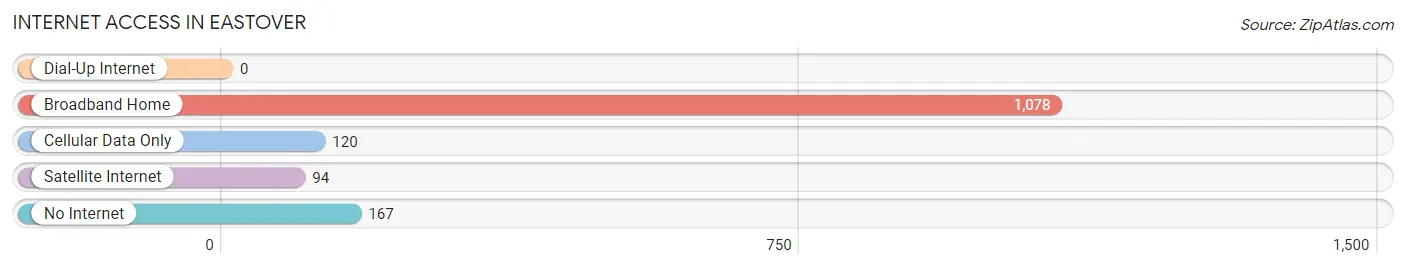
| Internet Type | # Households | % Households |
| Dial-Up Internet | 0 | 0.0% |
| Broadband Home | 1,078 | 76.0% |
| Cellular Data Only | 120 | 8.5% |
| Satellite Internet | 94 | 6.6% |
| No Internet | 167 | 11.8% |
| Total | 1,419 | 100.0% |
Eastover Summary
Eastover is a small town located in Cumberland County, North Carolina. It is situated in the southeastern part of the state, approximately 20 miles south of Fayetteville and about 40 miles east of Raleigh. The town has a population of approximately 1,500 people and is part of the Fayetteville Metropolitan Statistical Area.
History
Eastover was founded in 1887 by a group of settlers from the nearby town of Fayetteville. The town was named after the nearby Eastover Plantation, which was owned by the prominent local family of the same name. The town was originally a farming community, but in the early 20th century, it began to develop into a small industrial center. The town was home to several factories, including a cotton mill, a furniture factory, and a brickyard.
In the mid-20th century, Eastover began to experience a decline in its industrial base. The factories began to close, and the town’s population began to decline. In the late 20th century, the town began to experience a resurgence in its economy. The town was revitalized by the opening of a new shopping center and the development of a new industrial park.
Geography
Eastover is located in the southeastern part of Cumberland County, North Carolina. The town is situated on the banks of the Cape Fear River, approximately 20 miles south of Fayetteville and about 40 miles east of Raleigh. The town is surrounded by rural farmland and is located near the towns of Hope Mills and Wade.
The town has a total area of 1.3 square miles, all of which is land. The town is located at an elevation of approximately 200 feet above sea level. The climate in Eastover is humid subtropical, with hot, humid summers and mild winters.
Economy
Eastover’s economy is largely based on agriculture and manufacturing. The town is home to several small businesses, including a grocery store, a hardware store, and a few restaurants. The town is also home to a number of industrial parks, which are home to a variety of manufacturing and distribution companies.
The town is also home to a number of agricultural operations, including a large poultry farm and several small farms. The town is also home to a number of small retail stores, including a few antique stores.
Demographics
As of the 2010 census, Eastover had a population of 1,500 people. The racial makeup of the town was 79.3% White, 15.3% African American, 0.7% Native American, 0.7% Asian, and 3.3% from other races. The median household income in Eastover was $35,000, and the median family income was $41,000. The town’s poverty rate was 16.7%.
Eastover is served by the Cumberland County School District. The town is home to one elementary school, one middle school, and one high school. The town is also home to a number of churches, including Baptist, Methodist, and Presbyterian.
Common Questions
What is Per Capita Income in Eastover?
Per Capita income in Eastover is $35,489.
What is the Median Family Income in Eastover?
Median Family Income in Eastover is $79,044.
What is the Median Household income in Eastover?
Median Household Income in Eastover is $68,646.
What is Income or Wage Gap in Eastover?
Income or Wage Gap in Eastover is 13.2%.
Women in Eastover earn 86.8 cents for every dollar earned by a man.
What is Family Income Deficit in Eastover?
Family Income Deficit in Eastover is $13,306.
Families that are below poverty line in Eastover earn $13,306 less on average than the poverty threshold level.
What is Inequality or Gini Index in Eastover?
Inequality or Gini Index in Eastover is 0.44.
What is the Total Population of Eastover?
Total Population of Eastover is 3,659.
What is the Total Male Population of Eastover?
Total Male Population of Eastover is 2,021.
What is the Total Female Population of Eastover?
Total Female Population of Eastover is 1,638.
What is the Ratio of Males per 100 Females in Eastover?
There are 123.38 Males per 100 Females in Eastover.
What is the Ratio of Females per 100 Males in Eastover?
There are 81.05 Females per 100 Males in Eastover.
What is the Median Population Age in Eastover?
Median Population Age in Eastover is 48.1 Years.
What is the Average Family Size in Eastover
Average Family Size in Eastover is 3.0 People.
What is the Average Household Size in Eastover
Average Household Size in Eastover is 2.5 People.
How Large is the Labor Force in Eastover?
There are 1,571 People in the Labor Forcein in Eastover.
What is the Percentage of People in the Labor Force in Eastover?
51.9% of People are in the Labor Force in Eastover.
What is the Unemployment Rate in Eastover?
Unemployment Rate in Eastover is 6.2%.