Zip Codes with the Highest Percentage of Population Employed in Office & Administration in Henderson, NC
RELATED REPORTS & OPTIONS
Office & Administration
Henderson
Compare Zip Codes
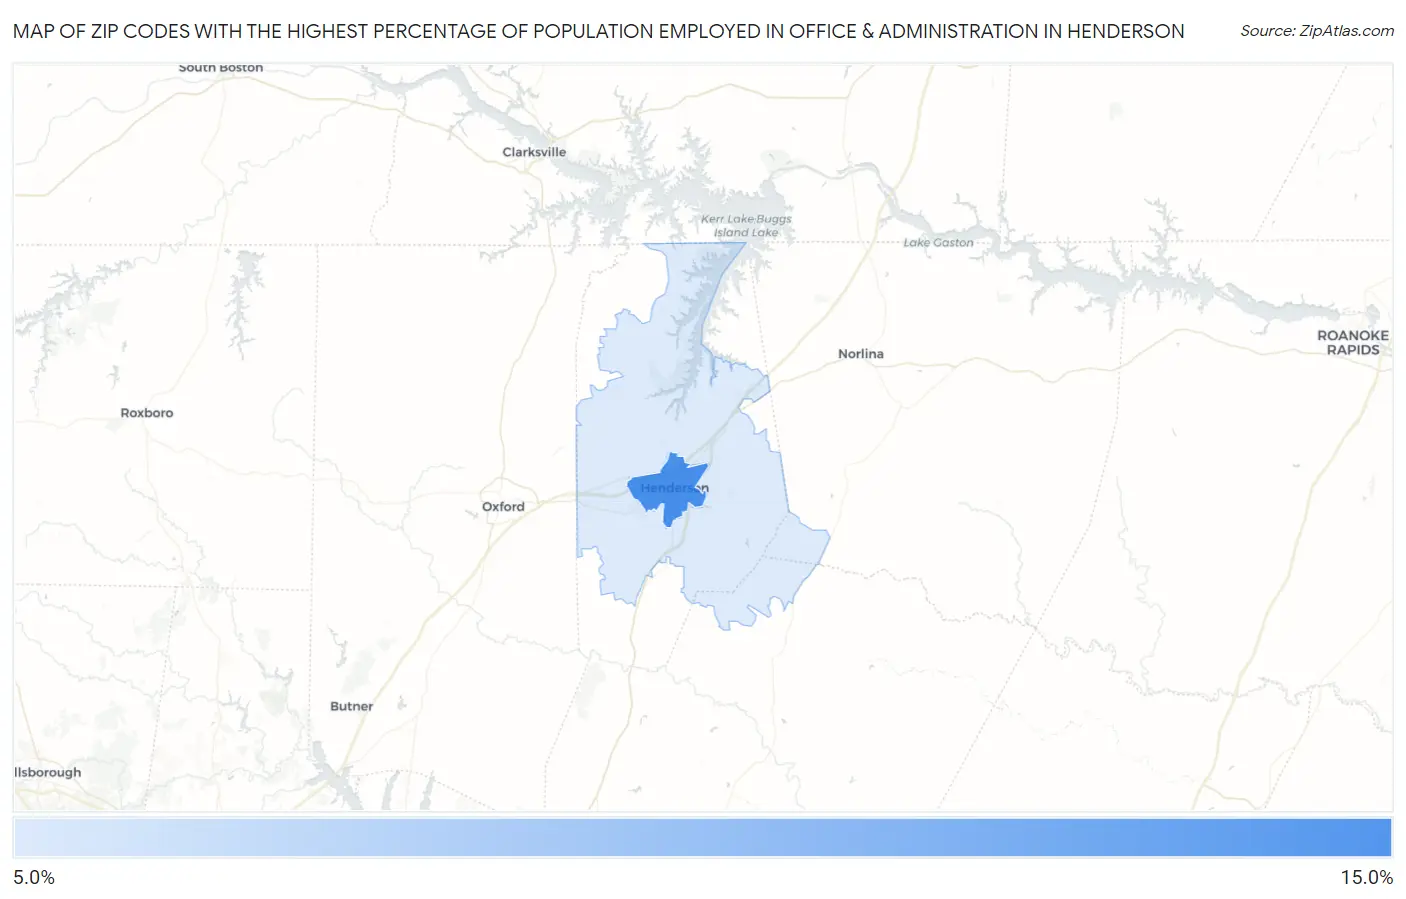
Map of Zip Codes with the Highest Percentage of Population Employed in Office & Administration in Henderson
10.7%
11.4%
Zip Codes with the Highest Percentage of Population Employed in Office & Administration in Henderson, NC
| Zip Code | % Employed | vs State | vs National | |
| 1. | 27536 | 11.4% | 10.2%(+1.23)#267 | 10.9%(+0.572)#12,464 |
| 2. | 27537 | 10.7% | 10.2%(+0.482)#317 | 10.9%(-0.176)#14,874 |
1
Common Questions
What are the Top Zip Codes with the Highest Percentage of Population Employed in Office & Administration in Henderson, NC?
Top Zip Codes with the Highest Percentage of Population Employed in Office & Administration in Henderson, NC are:
What zip code has the Highest Percentage of Population Employed in Office & Administration in Henderson, NC?
27536 has the Highest Percentage of Population Employed in Office & Administration in Henderson, NC with 11.4%.
What is the Percentage of Population Employed in Office & Administration in Henderson, NC?
Percentage of Population Employed in Office & Administration in Henderson is 11.8%.
What is the Percentage of Population Employed in Office & Administration in North Carolina?
Percentage of Population Employed in Office & Administration in North Carolina is 10.2%.
What is the Percentage of Population Employed in Office & Administration in the United States?
Percentage of Population Employed in Office & Administration in the United States is 10.9%.