Terre du Lac, MO Map & Demographics
Terre du Lac Map
Terre du Lac Overview
$32,890
PER CAPITA INCOME
$75,511
AVG FAMILY INCOME
$75,398
AVG HOUSEHOLD INCOME
33.2%
WAGE / INCOME GAP [ % ]
66.8¢/ $1
WAGE / INCOME GAP [ $ ]
0.39
INEQUALITY / GINI INDEX
2,443
TOTAL POPULATION
1,074
MALE POPULATION
1,369
FEMALE POPULATION
78.45
MALES / 100 FEMALES
127.47
FEMALES / 100 MALES
47.1
MEDIAN AGE
2.9
AVG FAMILY SIZE
2.6
AVG HOUSEHOLD SIZE
1,242
LABOR FORCE [ PEOPLE ]
59.2%
PERCENT IN LABOR FORCE
5.6%
UNEMPLOYMENT RATE
Income in Terre du Lac
Income Overview in Terre du Lac
Per Capita Income in Terre du Lac is $32,890, while median incomes of families and households are $75,511 and $75,398 respectively.
| Characteristic | Number | Measure |
| Per Capita Income | 2,443 | $32,890 |
| Median Family Income | 728 | $75,511 |
| Mean Family Income | 728 | $87,963 |
| Median Household Income | 938 | $75,398 |
| Mean Household Income | 938 | $82,953 |
| Income Deficit | 728 | $0 |
| Wage / Income Gap (%) | 2,443 | 33.19% |
| Wage / Income Gap ($) | 2,443 | 66.81¢ per $1 |
| Gini / Inequality Index | 2,443 | 0.39 |
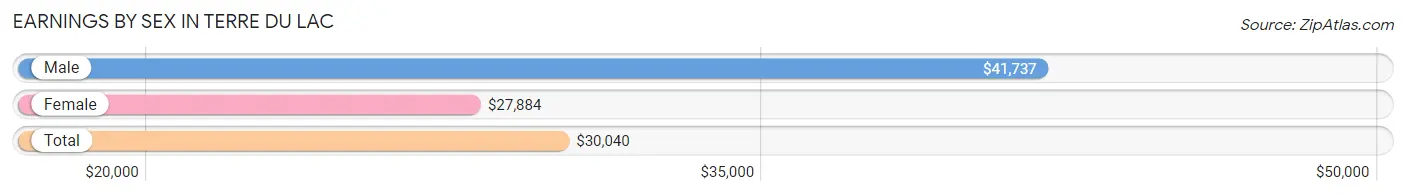
Earnings by Sex in Terre du Lac
Average Earnings in Terre du Lac are $30,040, $41,737 for men and $27,884 for women, a difference of 33.2%.
| Sex | Number | Average Earnings |
| Male | 616 (47.0%) | $41,737 |
| Female | 695 (53.0%) | $27,884 |
| Total | 1,311 (100.0%) | $30,040 |
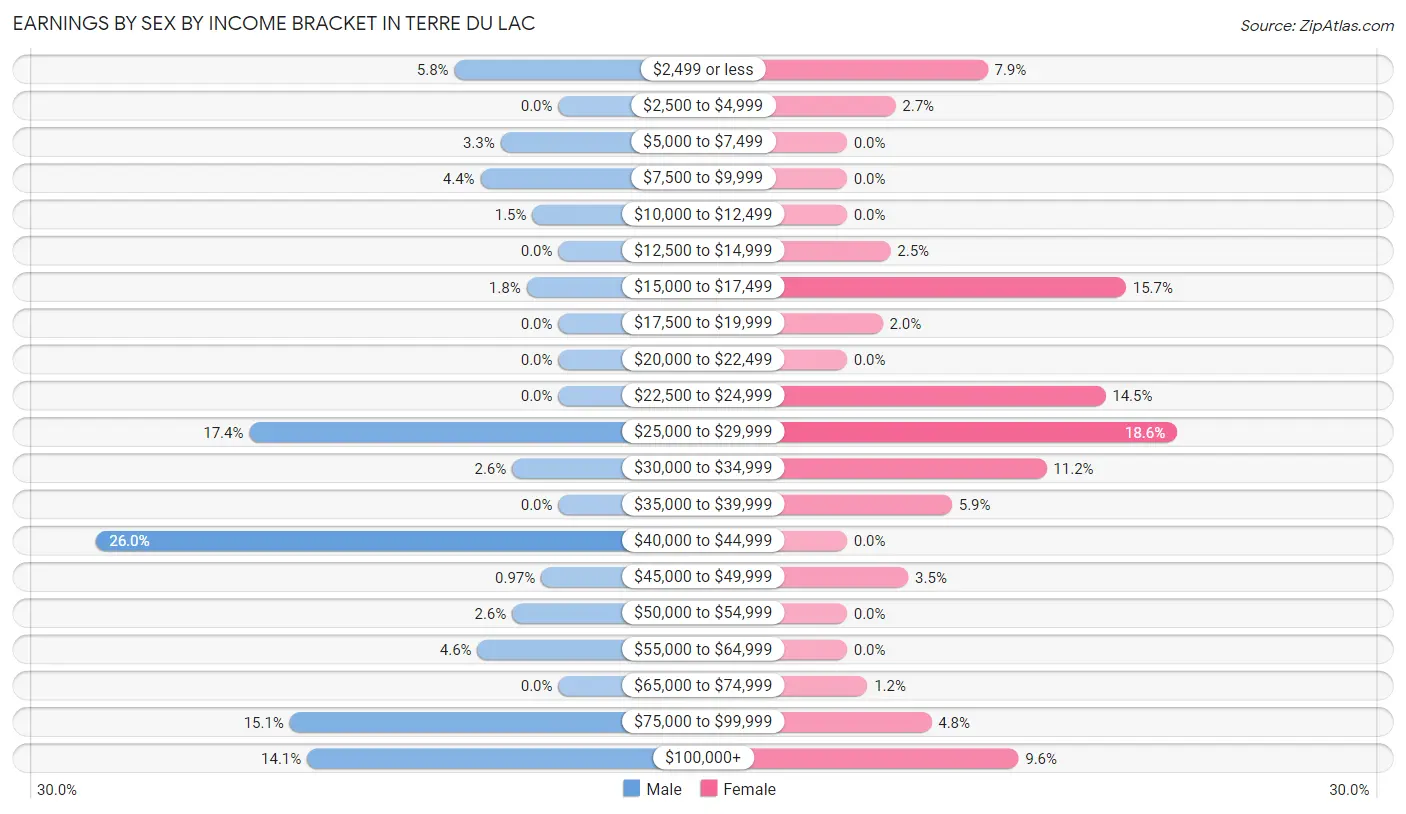
Earnings by Sex by Income Bracket in Terre du Lac
The most common earnings brackets in Terre du Lac are $40,000 to $44,999 for men (160 | 26.0%) and $25,000 to $29,999 for women (129 | 18.6%).
| Income | Male | Female |
| $2,499 or less | 36 (5.8%) | 55 (7.9%) |
| $2,500 to $4,999 | 0 (0.0%) | 19 (2.7%) |
| $5,000 to $7,499 | 20 (3.3%) | 0 (0.0%) |
| $7,500 to $9,999 | 27 (4.4%) | 0 (0.0%) |
| $10,000 to $12,499 | 9 (1.5%) | 0 (0.0%) |
| $12,500 to $14,999 | 0 (0.0%) | 17 (2.5%) |
| $15,000 to $17,499 | 11 (1.8%) | 109 (15.7%) |
| $17,500 to $19,999 | 0 (0.0%) | 14 (2.0%) |
| $20,000 to $22,499 | 0 (0.0%) | 0 (0.0%) |
| $22,500 to $24,999 | 0 (0.0%) | 101 (14.5%) |
| $25,000 to $29,999 | 107 (17.4%) | 129 (18.6%) |
| $30,000 to $34,999 | 16 (2.6%) | 78 (11.2%) |
| $35,000 to $39,999 | 0 (0.0%) | 41 (5.9%) |
| $40,000 to $44,999 | 160 (26.0%) | 0 (0.0%) |
| $45,000 to $49,999 | 6 (1.0%) | 24 (3.5%) |
| $50,000 to $54,999 | 16 (2.6%) | 0 (0.0%) |
| $55,000 to $64,999 | 28 (4.5%) | 0 (0.0%) |
| $65,000 to $74,999 | 0 (0.0%) | 8 (1.1%) |
| $75,000 to $99,999 | 93 (15.1%) | 33 (4.8%) |
| $100,000+ | 87 (14.1%) | 67 (9.6%) |
| Total | 616 (100.0%) | 695 (100.0%) |
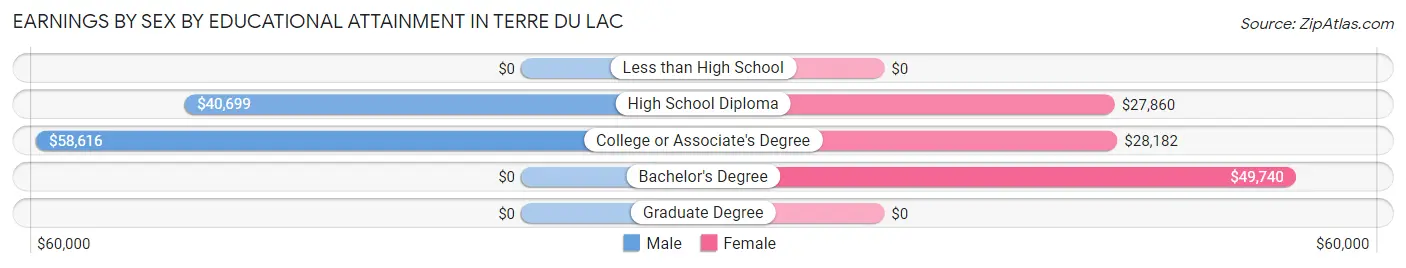
Earnings by Sex by Educational Attainment in Terre du Lac
Average earnings in Terre du Lac are $44,940 for men and $29,205 for women, a difference of 35.0%. Men with an educational attainment of college or associate's degree enjoy the highest average annual earnings of $58,616, while those with high school diploma education earn the least with $40,699. Women with an educational attainment of bachelor's degree earn the most with the average annual earnings of $49,740, while those with high school diploma education have the smallest earnings of $27,860.
| Educational Attainment | Male Income | Female Income |
| Less than High School | - | - |
| High School Diploma | $40,699 | $27,860 |
| College or Associate's Degree | $58,616 | $28,182 |
| Bachelor's Degree | - | - |
| Graduate Degree | - | - |
| Total | $44,940 | $29,205 |
Family Income in Terre du Lac
Family Income Brackets in Terre du Lac
According to the Terre du Lac family income data, there are 152 families falling into the $35,000 to $49,999 income range, which is the most common income bracket and makes up 20.9% of all families.
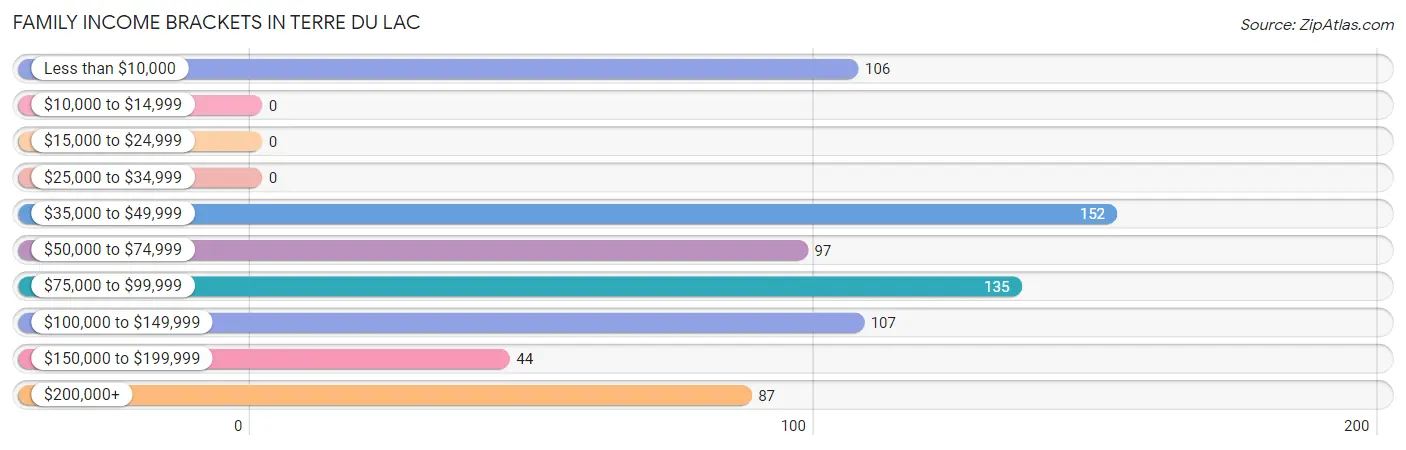
| Income Bracket | # Families | % Families |
| Less than $10,000 | 106 | 14.6% |
| $10,000 to $14,999 | 0 | 0.0% |
| $15,000 to $24,999 | 0 | 0.0% |
| $25,000 to $34,999 | 0 | 0.0% |
| $35,000 to $49,999 | 152 | 20.9% |
| $50,000 to $74,999 | 97 | 13.3% |
| $75,000 to $99,999 | 135 | 18.5% |
| $100,000 to $149,999 | 107 | 14.7% |
| $150,000 to $199,999 | 44 | 6.0% |
| $200,000+ | 87 | 12.0% |
Family Income by Famaliy Size in Terre du Lac
2-person families (387 | 53.2%) account for the highest median family income in Terre du Lac with $75,372 per family, while 2-person families (387 | 53.2%) have the highest median income of $37,686 per family member.
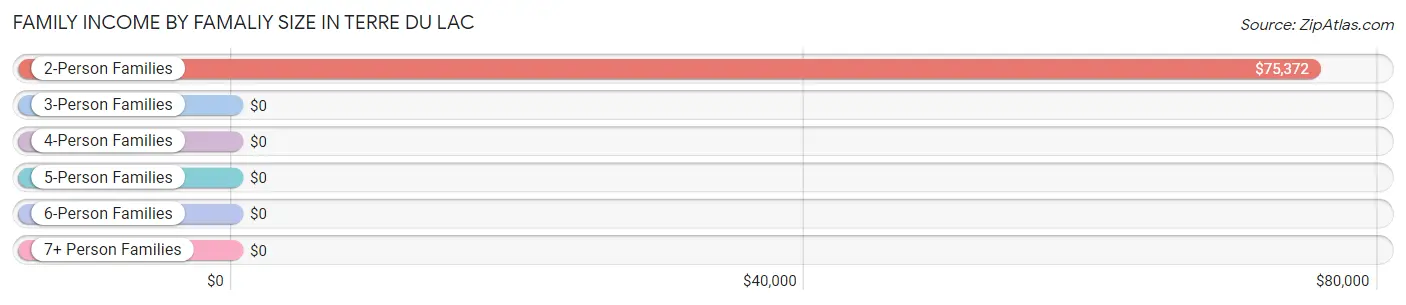
| Income Bracket | # Families | Median Income |
| 2-Person Families | 387 (53.2%) | $75,372 |
| 3-Person Families | 200 (27.5%) | $0 |
| 4-Person Families | 119 (16.4%) | $0 |
| 5-Person Families | 22 (3.0%) | $0 |
| 6-Person Families | 0 (0.0%) | $0 |
| 7+ Person Families | 0 (0.0%) | $0 |
| Total | 728 (100.0%) | $75,511 |
Family Income by Number of Earners in Terre du Lac
The median family income in Terre du Lac is $75,511, with families comprising 3+ earners (99) having the highest median family income of $209,261, while families with no earners (255) have the lowest median family income of $39,375, accounting for 13.6% and 35.0% of families, respectively.
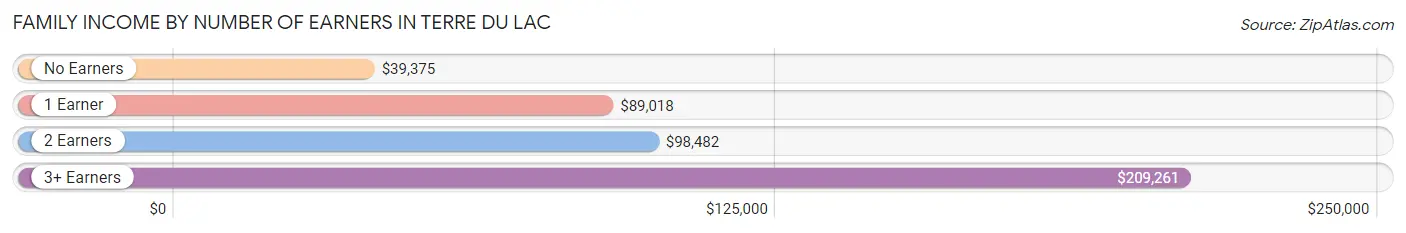
| Number of Earners | # Families | Median Income |
| No Earners | 255 (35.0%) | $39,375 |
| 1 Earner | 95 (13.1%) | $89,018 |
| 2 Earners | 279 (38.3%) | $98,482 |
| 3+ Earners | 99 (13.6%) | $209,261 |
| Total | 728 (100.0%) | $75,511 |
Household Income in Terre du Lac
Household Income Brackets in Terre du Lac
With 238 households falling in the category, the $75,000 to $99,999 income range is the most frequent in Terre du Lac, accounting for 25.4% of all households. In contrast, only 22 households (2.4%) fall into the $25,000 to $34,999 income bracket, making it the least populous group.
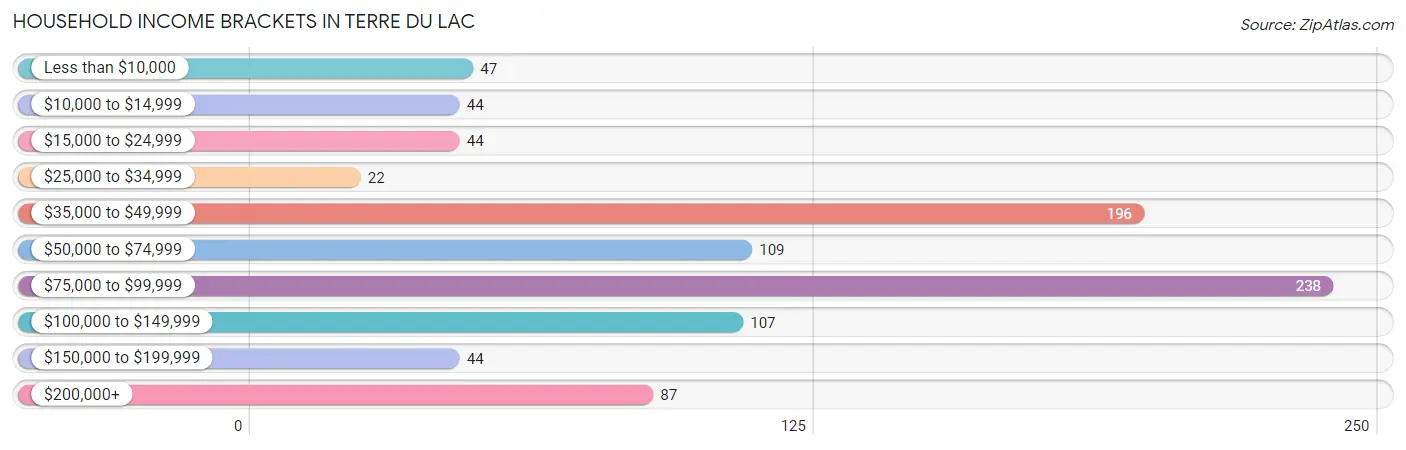
| Income Bracket | # Households | % Households |
| Less than $10,000 | 47 | 5.0% |
| $10,000 to $14,999 | 44 | 4.7% |
| $15,000 to $24,999 | 44 | 4.7% |
| $25,000 to $34,999 | 22 | 2.3% |
| $35,000 to $49,999 | 196 | 20.9% |
| $50,000 to $74,999 | 109 | 11.6% |
| $75,000 to $99,999 | 238 | 25.4% |
| $100,000 to $149,999 | 107 | 11.4% |
| $150,000 to $199,999 | 44 | 4.7% |
| $200,000+ | 87 | 9.3% |
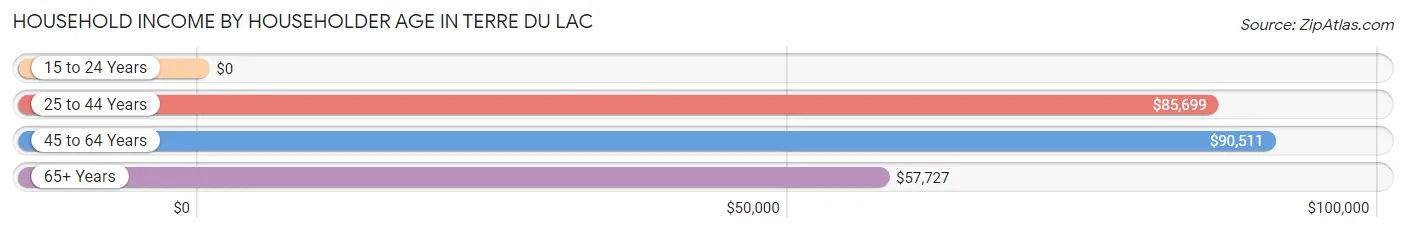
Household Income by Householder Age in Terre du Lac
The median household income in Terre du Lac is $75,398, with the highest median household income of $90,511 found in the 45 to 64 years age bracket for the primary householder. A total of 354 households (37.7%) fall into this category. Meanwhile, the 15 to 24 years age bracket for the primary householder has the lowest median household income of $0, with 7 households (0.7%) in this group.
| Income Bracket | # Households | Median Income |
| 15 to 24 Years | 7 (0.7%) | $0 |
| 25 to 44 Years | 239 (25.5%) | $85,699 |
| 45 to 64 Years | 354 (37.7%) | $90,511 |
| 65+ Years | 338 (36.0%) | $57,727 |
| Total | 938 (100.0%) | $75,398 |
Poverty in Terre du Lac
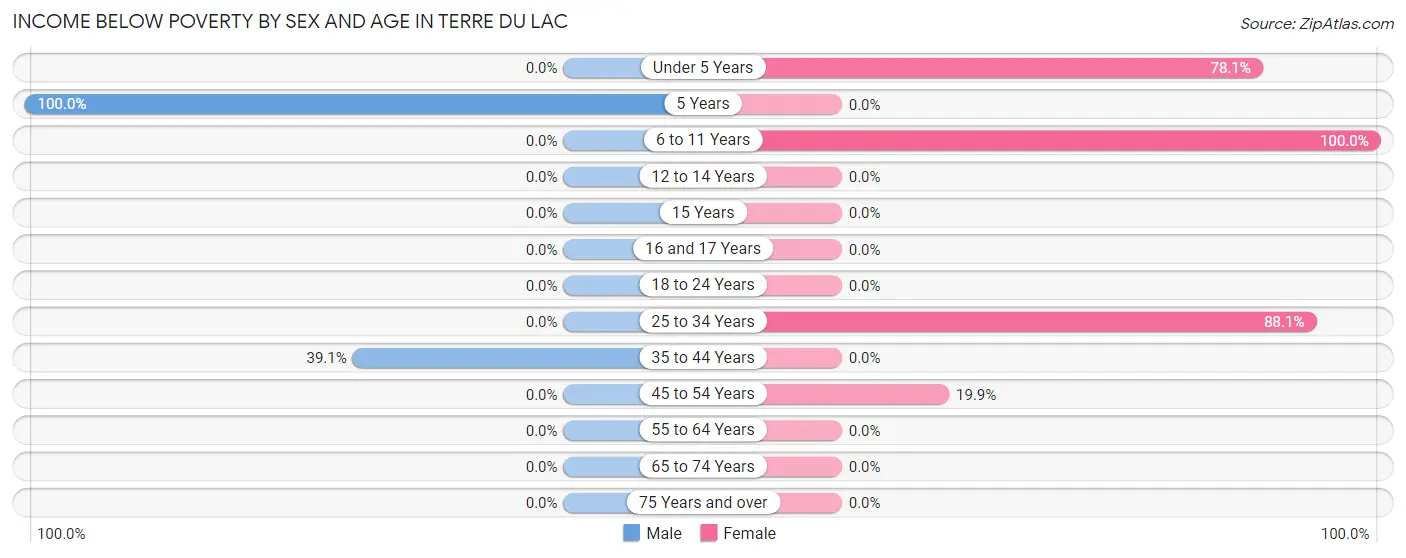
Income Below Poverty by Sex and Age in Terre du Lac
With 8.4% poverty level for males and 20.1% for females among the residents of Terre du Lac, 5 year old males and 6 to 11 year old females are the most vulnerable to poverty, with 50 males (100.0%) and 87 females (100.0%) in their respective age groups living below the poverty level.
| Age Bracket | Male | Female |
| Under 5 Years | 0 (0.0%) | 82 (78.1%) |
| 5 Years | 50 (100.0%) | 0 (0.0%) |
| 6 to 11 Years | 0 (0.0%) | 87 (100.0%) |
| 12 to 14 Years | 0 (0.0%) | 0 (0.0%) |
| 15 Years | 0 (0.0%) | 0 (0.0%) |
| 16 and 17 Years | 0 (0.0%) | 0 (0.0%) |
| 18 to 24 Years | 0 (0.0%) | 0 (0.0%) |
| 25 to 34 Years | 0 (0.0%) | 59 (88.1%) |
| 35 to 44 Years | 36 (39.1%) | 0 (0.0%) |
| 45 to 54 Years | 0 (0.0%) | 47 (19.9%) |
| 55 to 64 Years | 0 (0.0%) | 0 (0.0%) |
| 65 to 74 Years | 0 (0.0%) | 0 (0.0%) |
| 75 Years and over | 0 (0.0%) | 0 (0.0%) |
| Total | 86 (8.4%) | 275 (20.1%) |
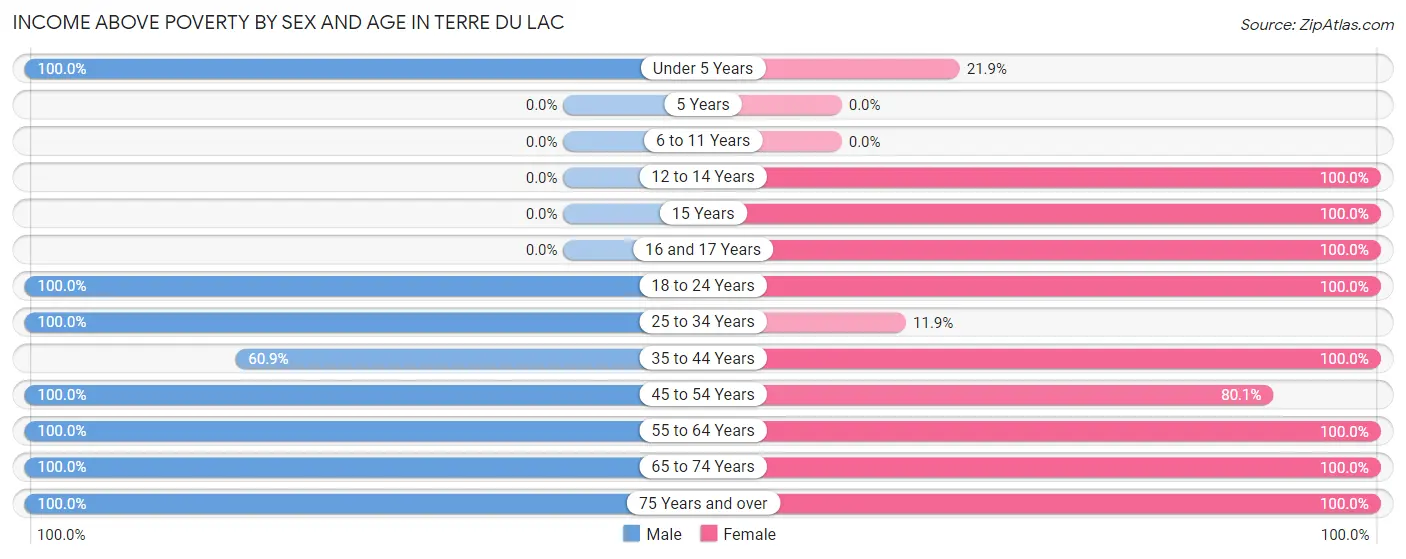
Income Above Poverty by Sex and Age in Terre du Lac
According to the poverty statistics in Terre du Lac, males aged under 5 years and females aged 12 to 14 years are the age groups that are most secure financially, with 100.0% of males and 100.0% of females in these age groups living above the poverty line.
| Age Bracket | Male | Female |
| Under 5 Years | 12 (100.0%) | 23 (21.9%) |
| 5 Years | 0 (0.0%) | 0 (0.0%) |
| 6 to 11 Years | 0 (0.0%) | 0 (0.0%) |
| 12 to 14 Years | 0 (0.0%) | 24 (100.0%) |
| 15 Years | 0 (0.0%) | 17 (100.0%) |
| 16 and 17 Years | 0 (0.0%) | 44 (100.0%) |
| 18 to 24 Years | 166 (100.0%) | 114 (100.0%) |
| 25 to 34 Years | 187 (100.0%) | 8 (11.9%) |
| 35 to 44 Years | 56 (60.9%) | 179 (100.0%) |
| 45 to 54 Years | 119 (100.0%) | 189 (80.1%) |
| 55 to 64 Years | 121 (100.0%) | 238 (100.0%) |
| 65 to 74 Years | 163 (100.0%) | 140 (100.0%) |
| 75 Years and over | 114 (100.0%) | 118 (100.0%) |
| Total | 938 (91.6%) | 1,094 (79.9%) |
Income Below Poverty Among Married-Couple Families in Terre du Lac
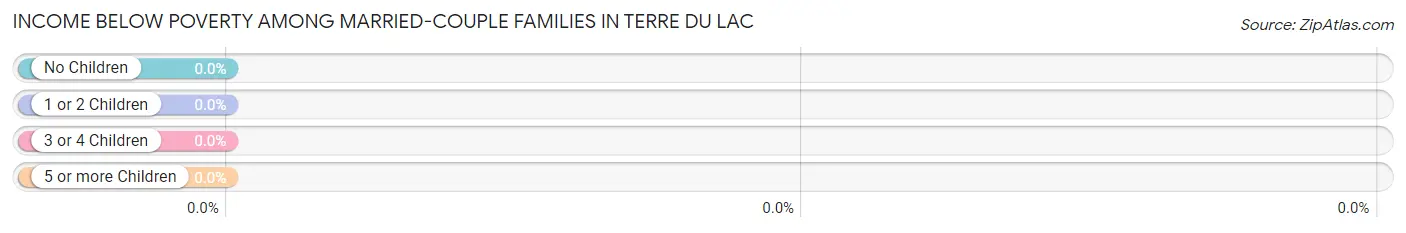
| Children | Above Poverty | Below Poverty |
| No Children | 416 (100.0%) | 0 (0.0%) |
| 1 or 2 Children | 96 (100.0%) | 0 (0.0%) |
| 3 or 4 Children | 0 (0.0%) | 0 (0.0%) |
| 5 or more Children | 0 (0.0%) | 0 (0.0%) |
| Total | 512 (100.0%) | 0 (0.0%) |
Income Below Poverty Among Single-Parent Households in Terre du Lac
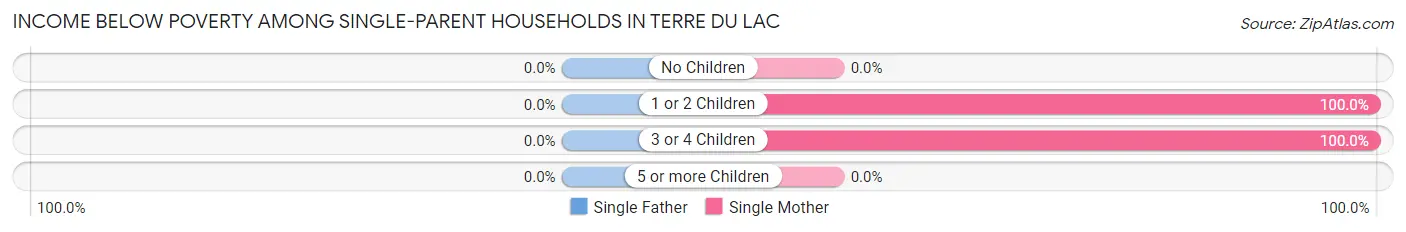
| Children | Single Father | Single Mother |
| No Children | 0 (0.0%) | 0 (0.0%) |
| 1 or 2 Children | 0 (0.0%) | 47 (100.0%) |
| 3 or 4 Children | 0 (0.0%) | 59 (100.0%) |
| 5 or more Children | 0 (0.0%) | 0 (0.0%) |
| Total | 0 (0.0%) | 106 (49.1%) |
Income Below Poverty Among Married-Couple vs Single-Parent Households in Terre du Lac
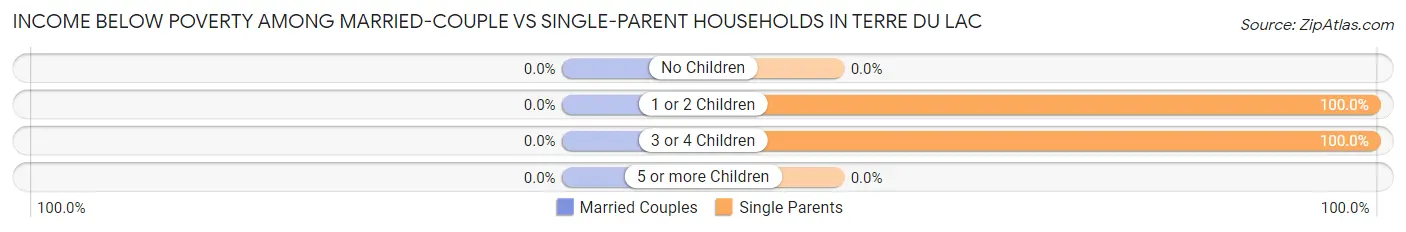
| Children | Married-Couple Families | Single-Parent Households |
| No Children | 0 (0.0%) | 0 (0.0%) |
| 1 or 2 Children | 0 (0.0%) | 47 (100.0%) |
| 3 or 4 Children | 0 (0.0%) | 59 (100.0%) |
| 5 or more Children | 0 (0.0%) | 0 (0.0%) |
| Total | 0 (0.0%) | 106 (49.1%) |
Race in Terre du Lac
The most populous races in Terre du Lac are White / Caucasian (2,396 | 98.1%), Asian (29 | 1.2%), and Some other Race (15 | 0.6%).
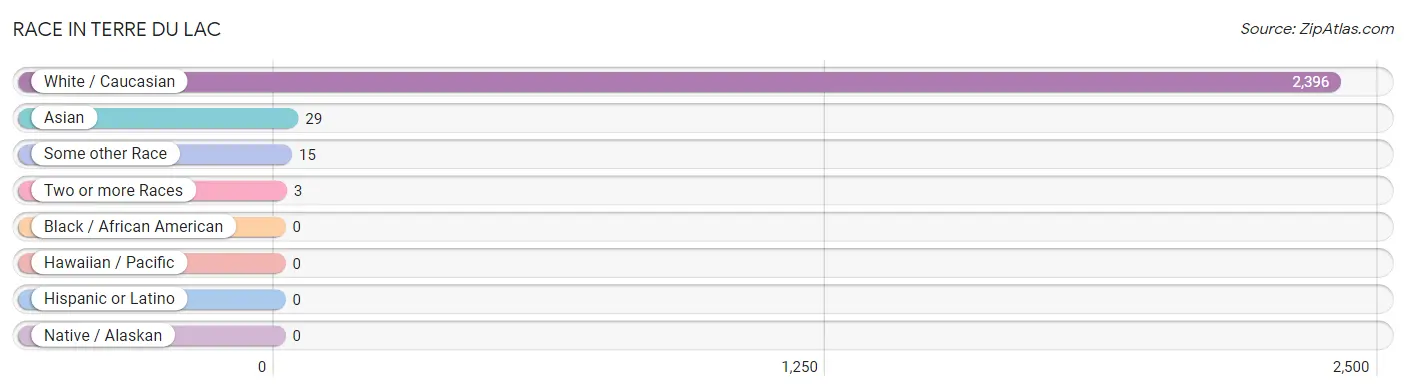
| Race | # Population | % Population |
| Asian | 29 | 1.2% |
| Black / African American | 0 | 0.0% |
| Hawaiian / Pacific | 0 | 0.0% |
| Hispanic or Latino | 0 | 0.0% |
| Native / Alaskan | 0 | 0.0% |
| White / Caucasian | 2,396 | 98.1% |
| Two or more Races | 3 | 0.1% |
| Some other Race | 15 | 0.6% |
| Total | 2,443 | 100.0% |
Ancestry in Terre du Lac
The most populous ancestries reported in Terre du Lac are German (677 | 27.7%), English (498 | 20.4%), American (463 | 19.0%), Irish (264 | 10.8%), and Dutch (166 | 6.8%), together accounting for 84.6% of all Terre du Lac residents.
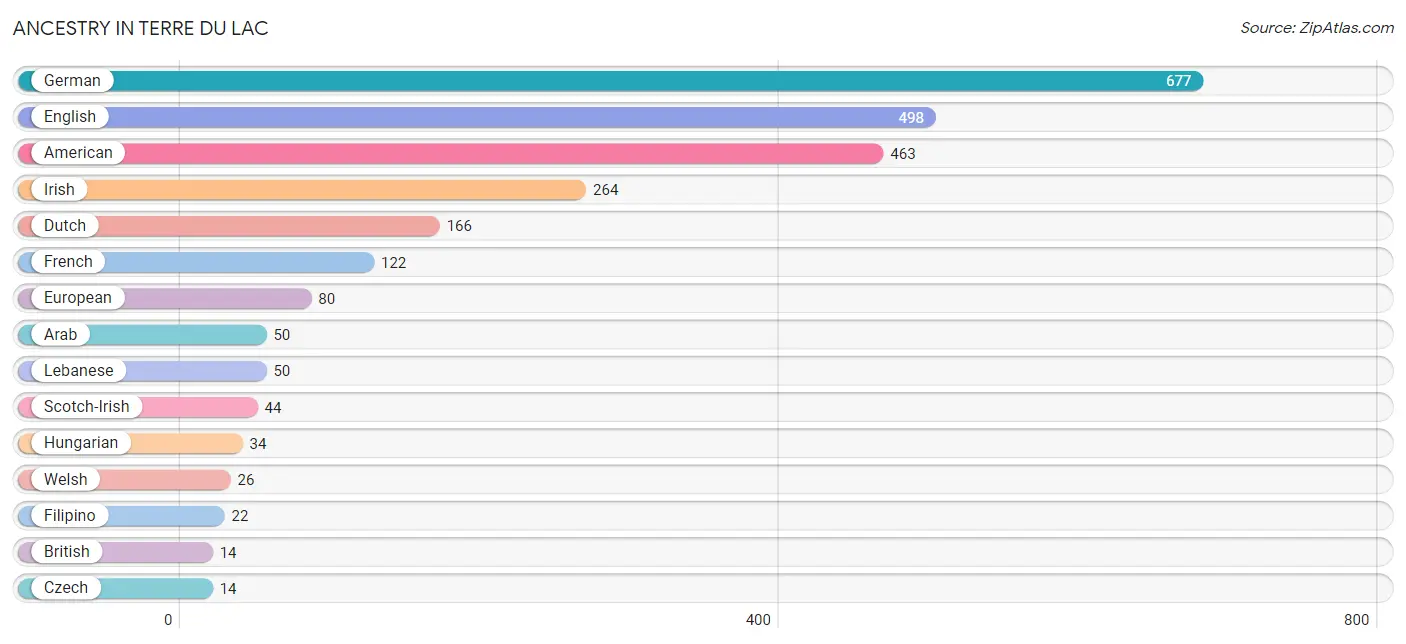
| Ancestry | # Population | % Population |
| American | 463 | 19.0% |
| Arab | 50 | 2.1% |
| British | 14 | 0.6% |
| Canadian | 9 | 0.4% |
| Cherokee | 3 | 0.1% |
| Czech | 14 | 0.6% |
| Dutch | 166 | 6.8% |
| English | 498 | 20.4% |
| European | 80 | 3.3% |
| Filipino | 22 | 0.9% |
| French | 122 | 5.0% |
| German | 677 | 27.7% |
| Greek | 14 | 0.6% |
| Hungarian | 34 | 1.4% |
| Indian (Asian) | 7 | 0.3% |
| Irish | 264 | 10.8% |
| Lebanese | 50 | 2.1% |
| Norwegian | 9 | 0.4% |
| Scandinavian | 11 | 0.4% |
| Scotch-Irish | 44 | 1.8% |
| Scottish | 6 | 0.3% |
| Welsh | 26 | 1.1% | View All 22 Rows |
Immigrants in Terre du Lac
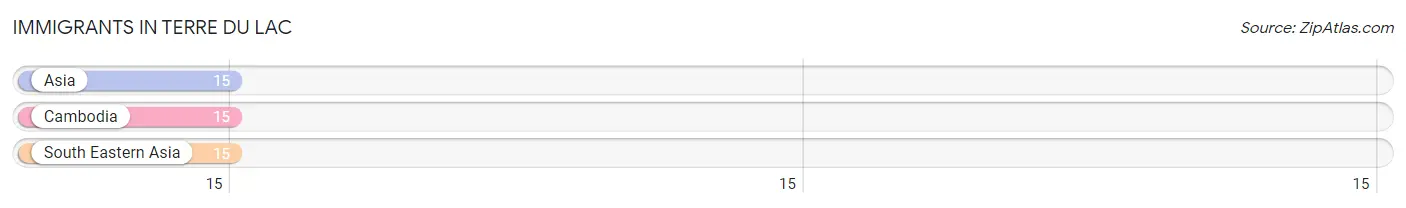
The most numerous immigrant groups reported in Terre du Lac came from Asia (15 | 0.6%), Cambodia (15 | 0.6%), and South Eastern Asia (15 | 0.6%), together accounting for 1.8% of all Terre du Lac residents.
| Immigration Origin | # Population | % Population |
| Asia | 15 | 0.6% |
| Cambodia | 15 | 0.6% |
| South Eastern Asia | 15 | 0.6% | View All 3 Rows |
Sex and Age in Terre du Lac
Sex and Age in Terre du Lac
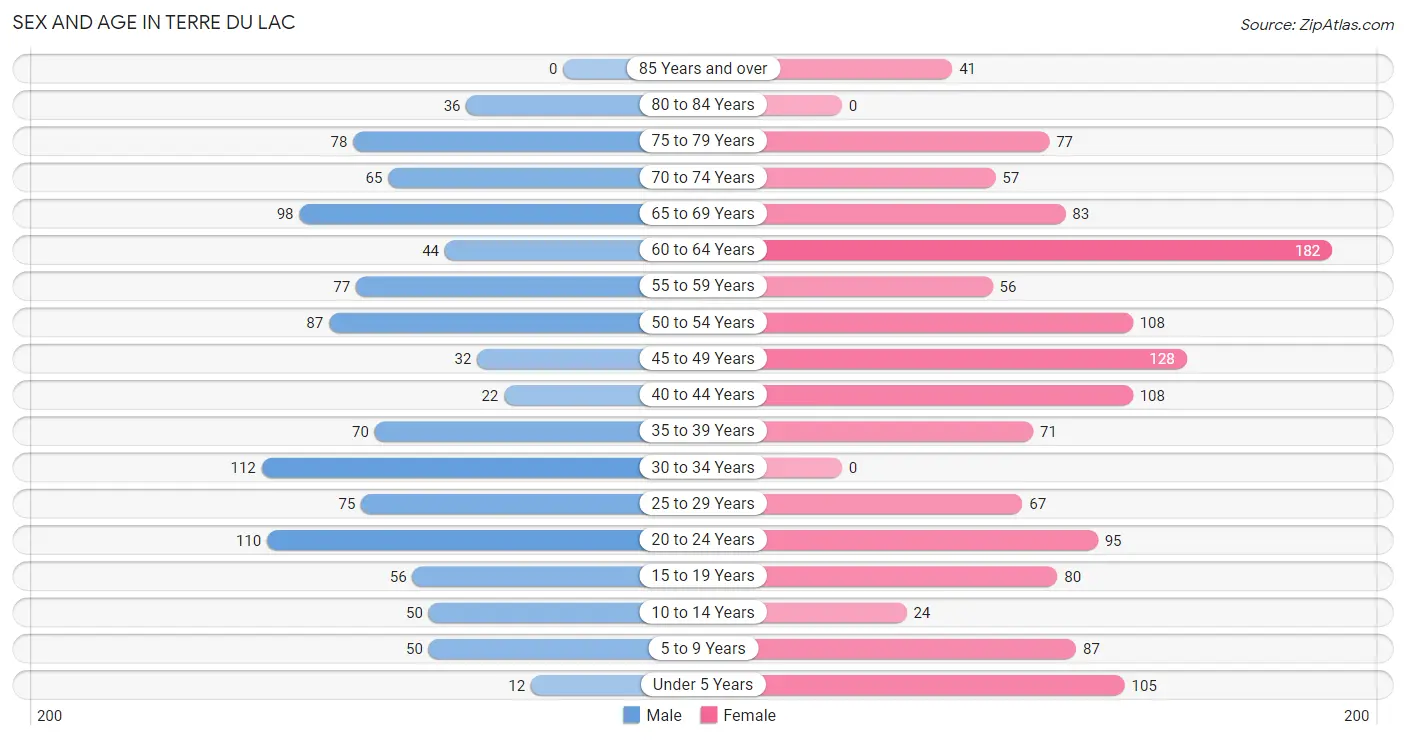
The most populous age groups in Terre du Lac are 30 to 34 Years (112 | 10.4%) for men and 60 to 64 Years (182 | 13.3%) for women.
| Age Bracket | Male | Female |
| Under 5 Years | 12 (1.1%) | 105 (7.7%) |
| 5 to 9 Years | 50 (4.7%) | 87 (6.4%) |
| 10 to 14 Years | 50 (4.7%) | 24 (1.8%) |
| 15 to 19 Years | 56 (5.2%) | 80 (5.8%) |
| 20 to 24 Years | 110 (10.2%) | 95 (6.9%) |
| 25 to 29 Years | 75 (7.0%) | 67 (4.9%) |
| 30 to 34 Years | 112 (10.4%) | 0 (0.0%) |
| 35 to 39 Years | 70 (6.5%) | 71 (5.2%) |
| 40 to 44 Years | 22 (2.1%) | 108 (7.9%) |
| 45 to 49 Years | 32 (3.0%) | 128 (9.3%) |
| 50 to 54 Years | 87 (8.1%) | 108 (7.9%) |
| 55 to 59 Years | 77 (7.2%) | 56 (4.1%) |
| 60 to 64 Years | 44 (4.1%) | 182 (13.3%) |
| 65 to 69 Years | 98 (9.1%) | 83 (6.1%) |
| 70 to 74 Years | 65 (6.0%) | 57 (4.2%) |
| 75 to 79 Years | 78 (7.3%) | 77 (5.6%) |
| 80 to 84 Years | 36 (3.4%) | 0 (0.0%) |
| 85 Years and over | 0 (0.0%) | 41 (3.0%) |
| Total | 1,074 (100.0%) | 1,369 (100.0%) |
Families and Households in Terre du Lac
Median Family Size in Terre du Lac
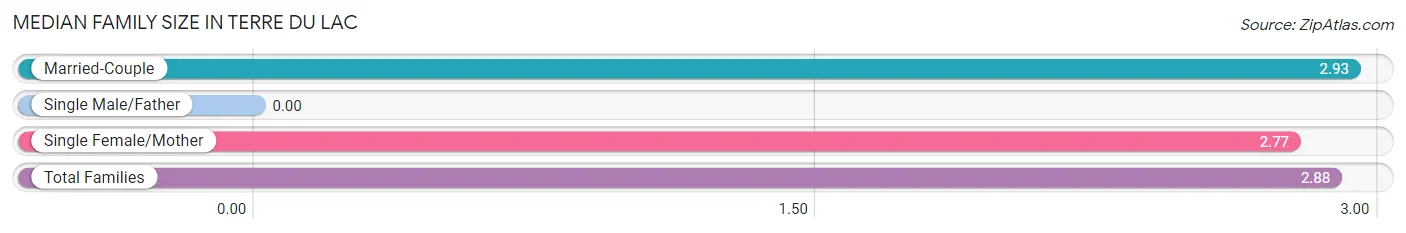
| Family Type | # Families | Family Size |
| Married-Couple | 512 (70.3%) | 2.93 |
| Single Male/Father | 0 (0.0%) | - |
| Single Female/Mother | 216 (29.7%) | 2.77 |
| Total Families | 728 (100.0%) | 2.88 |
Median Household Size in Terre du Lac
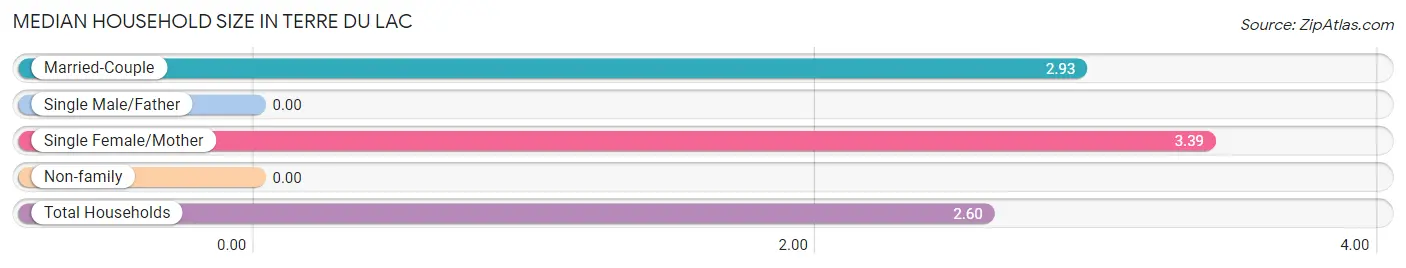
| Household Type | # Households | Household Size |
| Married-Couple | 512 (54.6%) | 2.93 |
| Single Male/Father | 0 (0.0%) | - |
| Single Female/Mother | 216 (23.0%) | 3.39 |
| Non-family | 210 (22.4%) | - |
| Total Households | 938 (100.0%) | 2.60 |
Household Size by Marriage Status in Terre du Lac
Out of a total of 938 households in Terre du Lac, 728 (77.6%) are family households, while 210 (22.4%) are nonfamily households. The most numerous type of family households are 2-person households, comprising 387, and the most common type of nonfamily households are 1-person households, comprising 210.
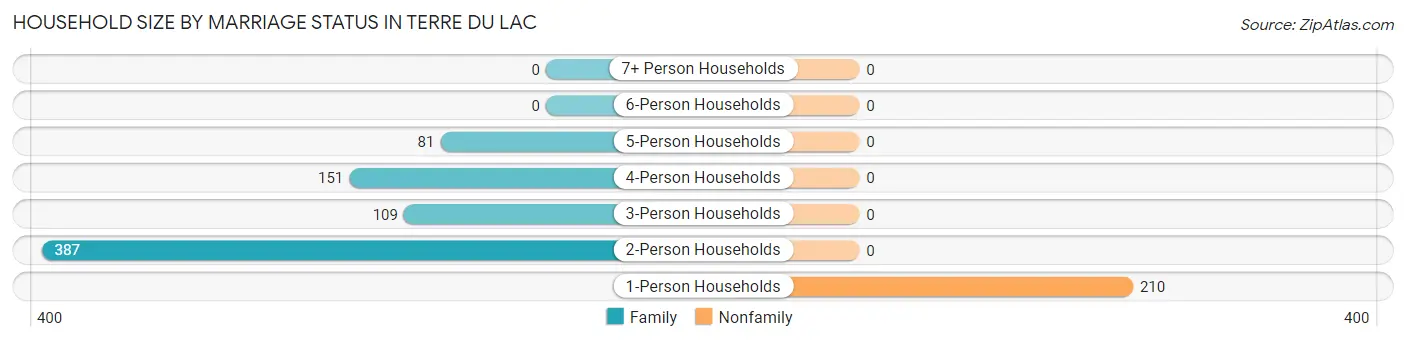
| Household Size | Family Households | Nonfamily Households |
| 1-Person Households | - | 210 (22.4%) |
| 2-Person Households | 387 (41.3%) | 0 (0.0%) |
| 3-Person Households | 109 (11.6%) | 0 (0.0%) |
| 4-Person Households | 151 (16.1%) | 0 (0.0%) |
| 5-Person Households | 81 (8.6%) | 0 (0.0%) |
| 6-Person Households | 0 (0.0%) | 0 (0.0%) |
| 7+ Person Households | 0 (0.0%) | 0 (0.0%) |
| Total | 728 (77.6%) | 210 (22.4%) |
Female Fertility in Terre du Lac
Fertility by Age in Terre du Lac
Average fertility rate in Terre du Lac is 95.0 births per 1,000 women. Women in the age bracket of 35 to 50 years have the highest fertility rate with 147.0 births per 1,000 women. Women in the age bracket of 35 to 50 years acount for 86.5% of all women with births.
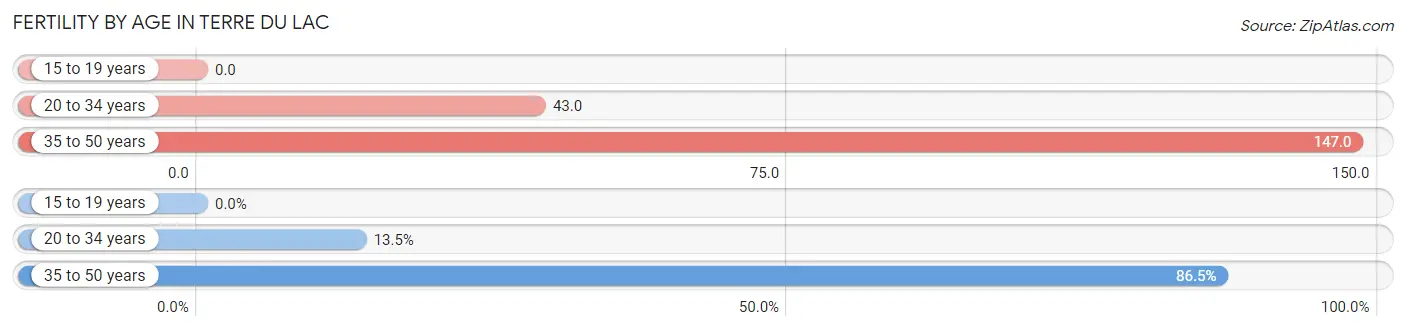
| Age Bracket | Women with Births | Births / 1,000 Women |
| 15 to 19 years | 0 (0.0%) | 0.0 |
| 20 to 34 years | 7 (13.5%) | 43.0 |
| 35 to 50 years | 45 (86.5%) | 147.0 |
| Total | 52 (100.0%) | 95.0 |
Fertility by Age by Marriage Status in Terre du Lac
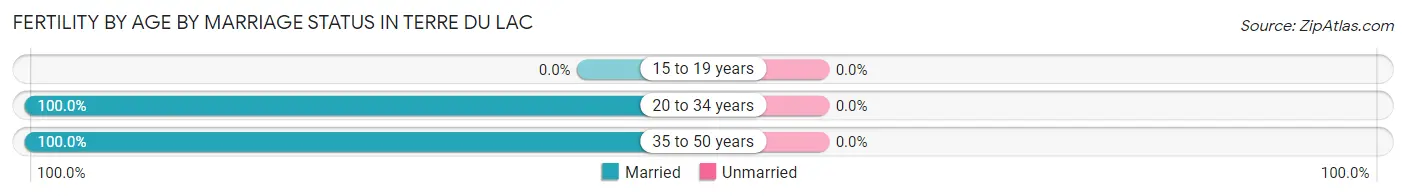
| Age Bracket | Married | Unmarried |
| 15 to 19 years | 0 (0.0%) | 0 (0.0%) |
| 20 to 34 years | 7 (100.0%) | 0 (0.0%) |
| 35 to 50 years | 45 (100.0%) | 0 (0.0%) |
| Total | 52 (100.0%) | 0 (0.0%) |
Fertility by Education in Terre du Lac
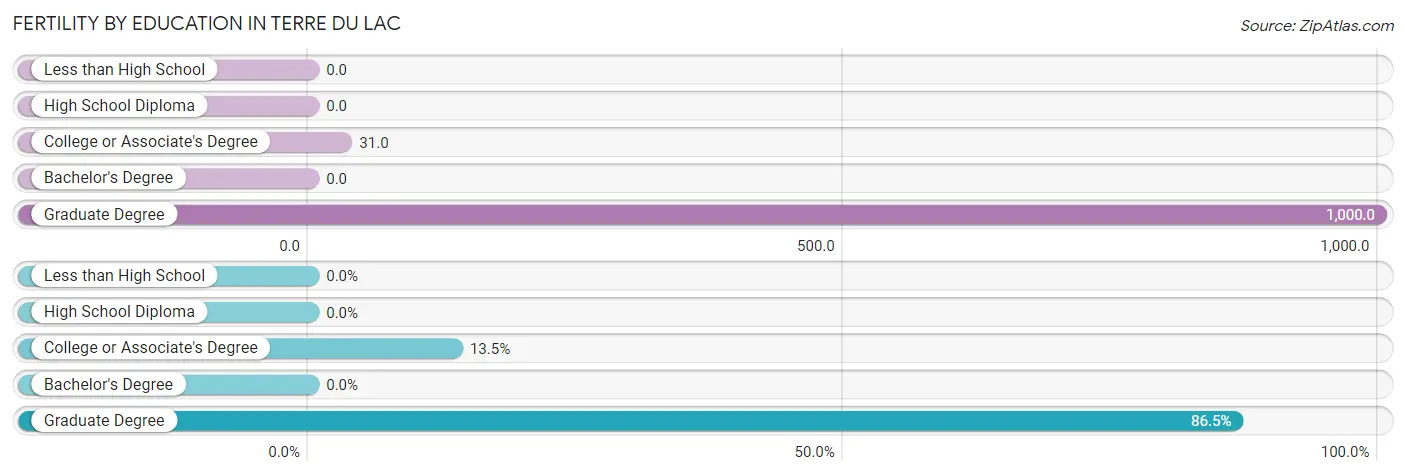
| Educational Attainment | Women with Births | Births / 1,000 Women |
| Less than High School | 0 (0.0%) | 0.0 |
| High School Diploma | 0 (0.0%) | 0.0 |
| College or Associate's Degree | 7 (13.5%) | 31.0 |
| Bachelor's Degree | 0 (0.0%) | 0.0 |
| Graduate Degree | 45 (86.5%) | 1,000.0 |
| Total | 52 (100.0%) | 95.0 |
Fertility by Education by Marriage Status in Terre du Lac
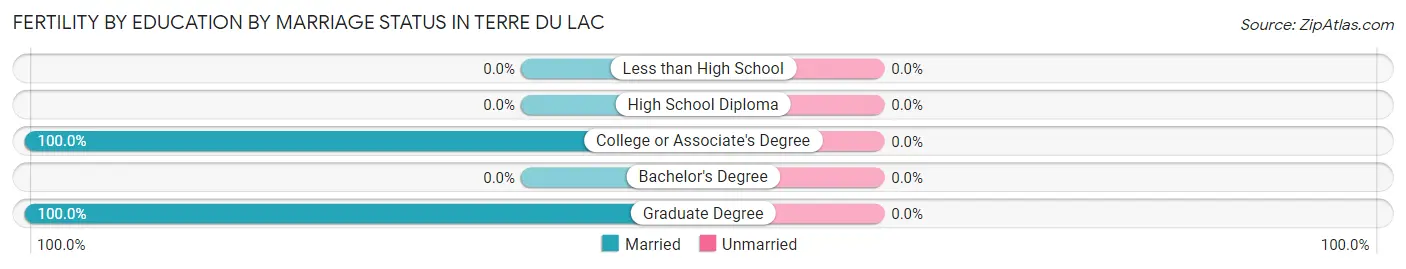
| Educational Attainment | Married | Unmarried |
| Less than High School | 0 (0.0%) | 0 (0.0%) |
| High School Diploma | 0 (0.0%) | 0 (0.0%) |
| College or Associate's Degree | 7 (100.0%) | 0 (0.0%) |
| Bachelor's Degree | 0 (0.0%) | 0 (0.0%) |
| Graduate Degree | 45 (100.0%) | 0 (0.0%) |
| Total | 52 (100.0%) | 0 (0.0%) |
Employment Characteristics in Terre du Lac
Employment by Class of Employer in Terre du Lac
Among the 1,128 employed individuals in Terre du Lac, private company employees (773 | 68.5%), state government employees (221 | 19.6%), and self-employed (not incorporated) (39 | 3.5%) make up the most common classes of employment.
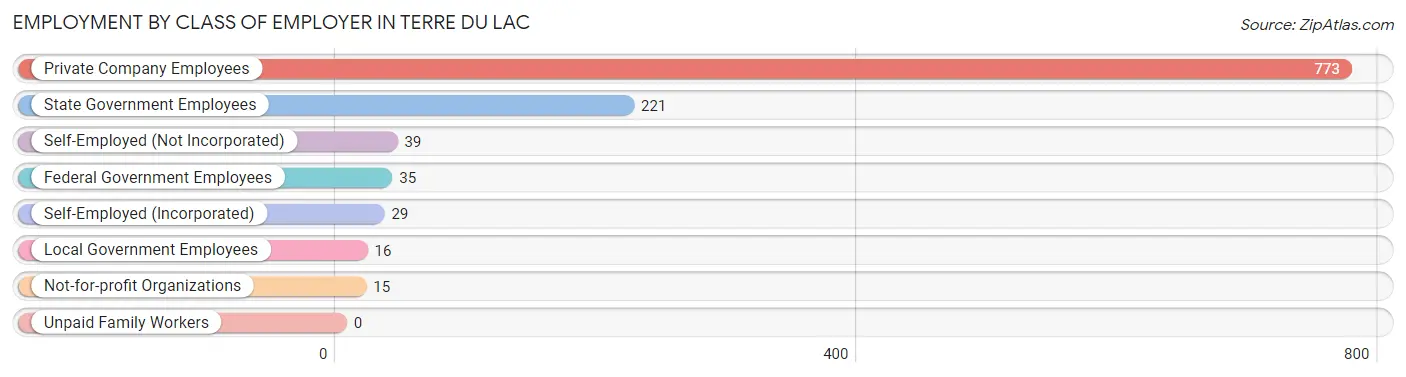
| Employer Class | # Employees | % Employees |
| Private Company Employees | 773 | 68.5% |
| Self-Employed (Incorporated) | 29 | 2.6% |
| Self-Employed (Not Incorporated) | 39 | 3.5% |
| Not-for-profit Organizations | 15 | 1.3% |
| Local Government Employees | 16 | 1.4% |
| State Government Employees | 221 | 19.6% |
| Federal Government Employees | 35 | 3.1% |
| Unpaid Family Workers | 0 | 0.0% |
| Total | 1,128 | 100.0% |
Employment Status by Age in Terre du Lac
According to the labor force statistics for Terre du Lac, out of the total population over 16 years of age (2,098), 59.2% or 1,242 individuals are in the labor force, with 5.6% or 70 of them unemployed. The age group with the highest labor force participation rate is 20 to 24 years, with 100.0% or 205 individuals in the labor force. Within the labor force, the 30 to 34 years age range has the highest percentage of unemployed individuals, with 44.6% or 50 of them being unemployed.
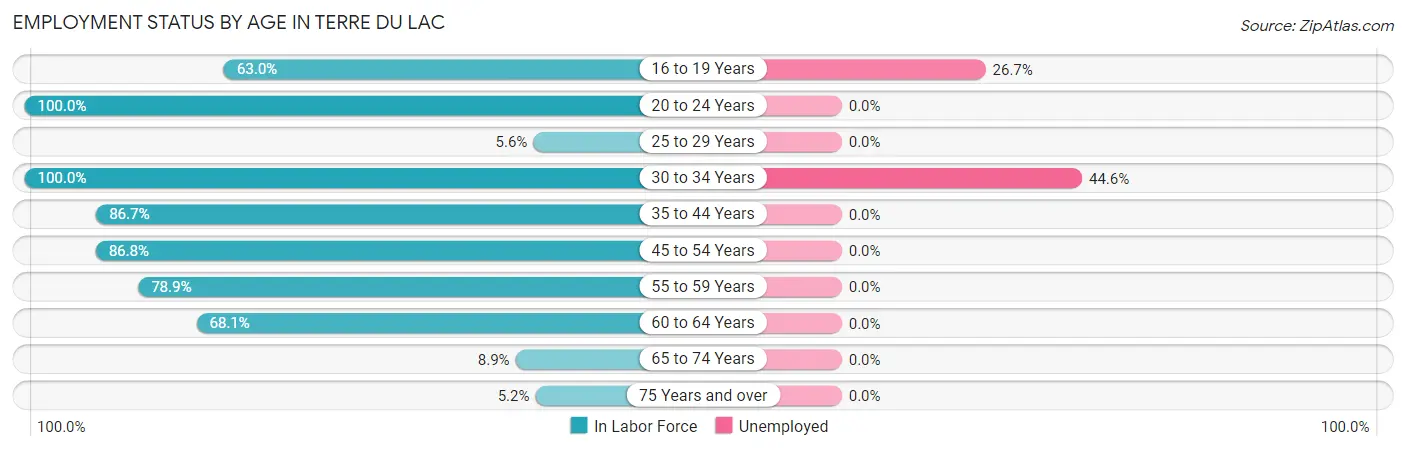
| Age Bracket | In Labor Force | Unemployed |
| 16 to 19 Years | 75 (63.0%) | 20 (26.7%) |
| 20 to 24 Years | 205 (100.0%) | 0 (0.0%) |
| 25 to 29 Years | 8 (5.6%) | 0 (0.0%) |
| 30 to 34 Years | 112 (100.0%) | 50 (44.6%) |
| 35 to 44 Years | 235 (86.7%) | 0 (0.0%) |
| 45 to 54 Years | 308 (86.8%) | 0 (0.0%) |
| 55 to 59 Years | 105 (78.9%) | 0 (0.0%) |
| 60 to 64 Years | 154 (68.1%) | 0 (0.0%) |
| 65 to 74 Years | 27 (8.9%) | 0 (0.0%) |
| 75 Years and over | 12 (5.2%) | 0 (0.0%) |
| Total | 1,242 (59.2%) | 70 (5.6%) |
Employment Status by Educational Attainment in Terre du Lac
According to labor force statistics for Terre du Lac, 74.4% of individuals (922) out of the total population between 25 and 64 years of age (1,239) are in the labor force, with 5.4% or 50 of them being unemployed. The group with the highest labor force participation rate are those with the educational attainment of less than high school, with 100.0% or 27 individuals in the labor force. Within the labor force, individuals with bachelor's degree or higher education have the highest percentage of unemployment, with 23.3% or 50 of them being unemployed.
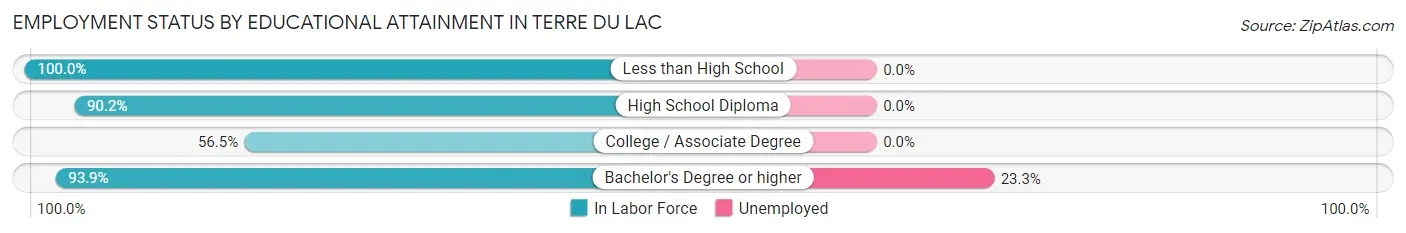
| Educational Attainment | In Labor Force | Unemployed |
| Less than High School | 27 (100.0%) | 0 (0.0%) |
| High School Diploma | 333 (90.2%) | 0 (0.0%) |
| College / Associate Degree | 347 (56.5%) | 0 (0.0%) |
| Bachelor's Degree or higher | 215 (93.9%) | 53 (23.3%) |
| Total | 922 (74.4%) | 67 (5.4%) |
Employment Occupations by Sex in Terre du Lac
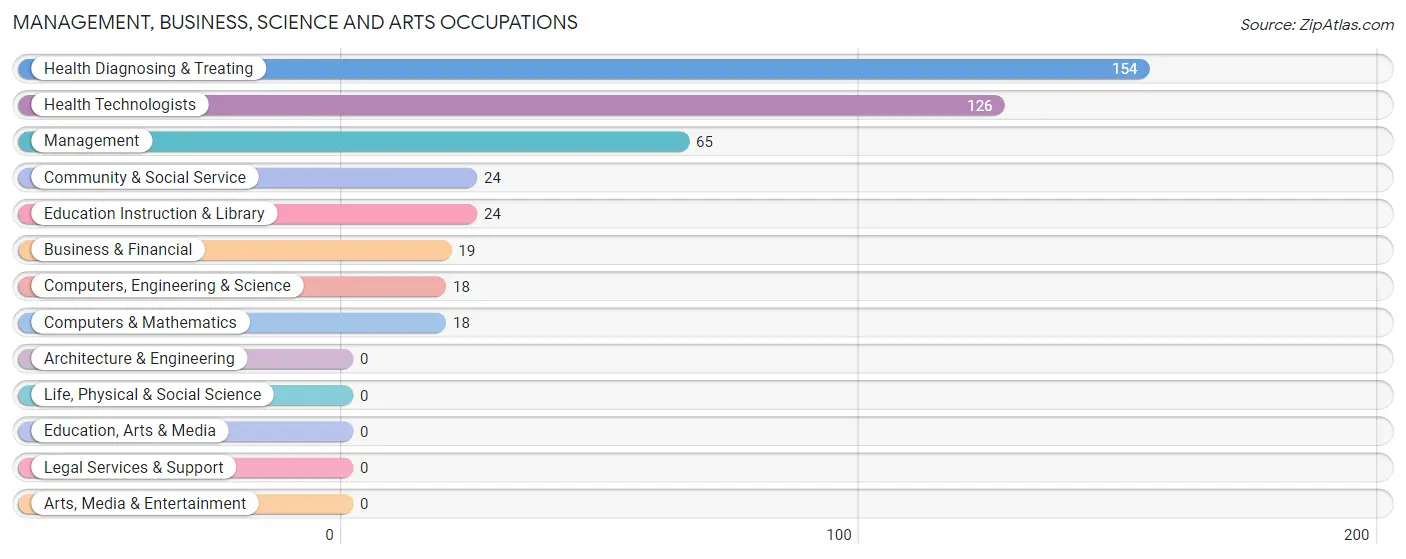
Management, Business, Science and Arts Occupations
The most common Management, Business, Science and Arts occupations in Terre du Lac are Health Diagnosing & Treating (154 | 13.2%), Health Technologists (126 | 10.8%), Management (65 | 5.6%), Community & Social Service (24 | 2.1%), and Education Instruction & Library (24 | 2.1%).
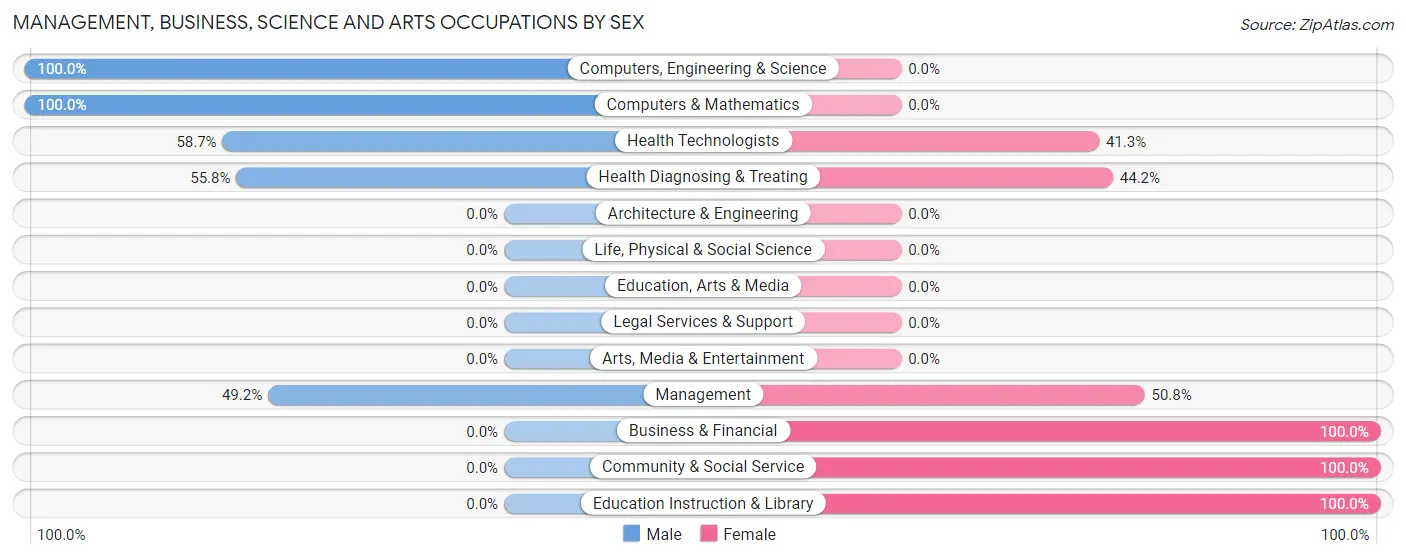
Management, Business, Science and Arts Occupations by Sex
Within the Management, Business, Science and Arts occupations in Terre du Lac, the most male-oriented occupations are Computers, Engineering & Science (100.0%), Computers & Mathematics (100.0%), and Health Technologists (58.7%), while the most female-oriented occupations are Business & Financial (100.0%), Community & Social Service (100.0%), and Education Instruction & Library (100.0%).
| Occupation | Male | Female |
| Management | 32 (49.2%) | 33 (50.8%) |
| Business & Financial | 0 (0.0%) | 19 (100.0%) |
| Computers, Engineering & Science | 18 (100.0%) | 0 (0.0%) |
| Computers & Mathematics | 18 (100.0%) | 0 (0.0%) |
| Architecture & Engineering | 0 (0.0%) | 0 (0.0%) |
| Life, Physical & Social Science | 0 (0.0%) | 0 (0.0%) |
| Community & Social Service | 0 (0.0%) | 24 (100.0%) |
| Education, Arts & Media | 0 (0.0%) | 0 (0.0%) |
| Legal Services & Support | 0 (0.0%) | 0 (0.0%) |
| Education Instruction & Library | 0 (0.0%) | 24 (100.0%) |
| Arts, Media & Entertainment | 0 (0.0%) | 0 (0.0%) |
| Health Diagnosing & Treating | 86 (55.8%) | 68 (44.2%) |
| Health Technologists | 74 (58.7%) | 52 (41.3%) |
| Total (Category) | 136 (48.6%) | 144 (51.4%) |
| Total (Overall) | 531 (45.4%) | 640 (54.6%) |
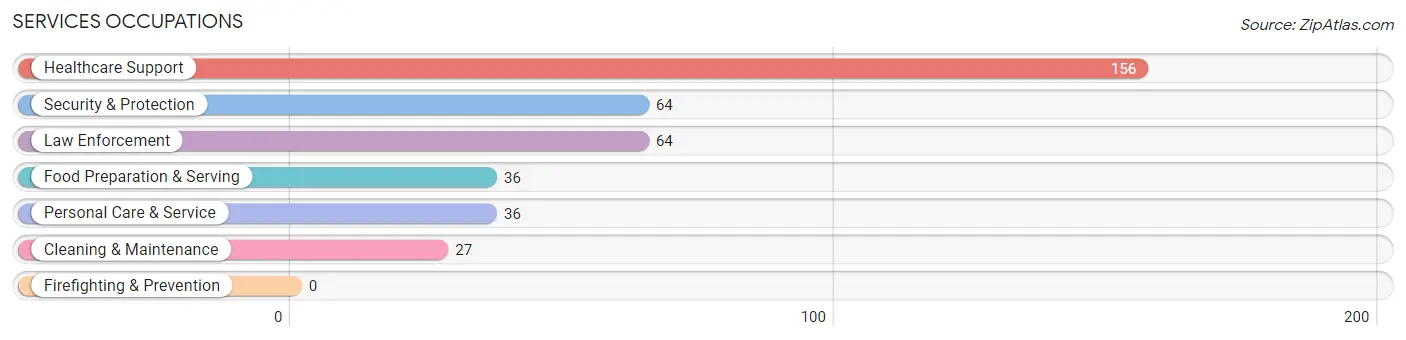
Services Occupations
The most common Services occupations in Terre du Lac are Healthcare Support (156 | 13.3%), Security & Protection (64 | 5.5%), Law Enforcement (64 | 5.5%), Food Preparation & Serving (36 | 3.1%), and Personal Care & Service (36 | 3.1%).
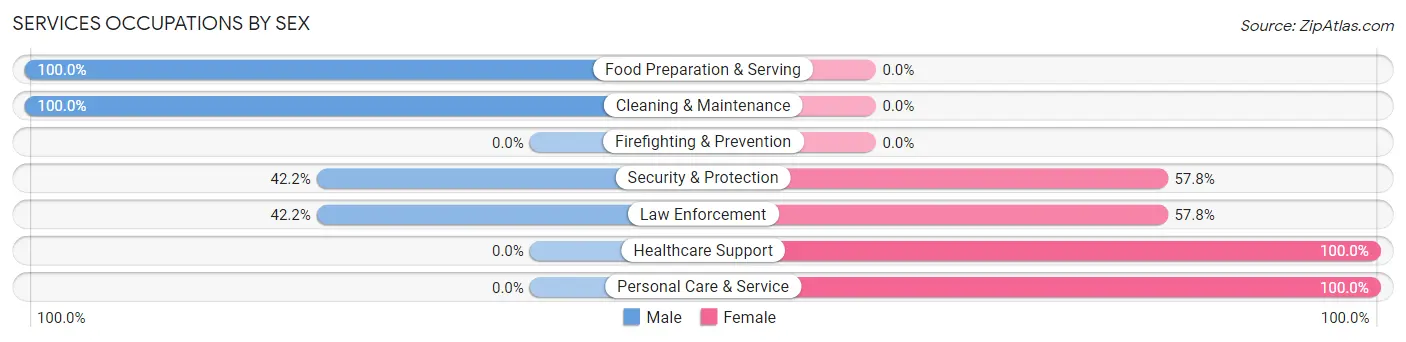
Services Occupations by Sex
Within the Services occupations in Terre du Lac, the most male-oriented occupations are Food Preparation & Serving (100.0%), Cleaning & Maintenance (100.0%), and Security & Protection (42.2%), while the most female-oriented occupations are Healthcare Support (100.0%), Personal Care & Service (100.0%), and Security & Protection (57.8%).
| Occupation | Male | Female |
| Healthcare Support | 0 (0.0%) | 156 (100.0%) |
| Security & Protection | 27 (42.2%) | 37 (57.8%) |
| Firefighting & Prevention | 0 (0.0%) | 0 (0.0%) |
| Law Enforcement | 27 (42.2%) | 37 (57.8%) |
| Food Preparation & Serving | 36 (100.0%) | 0 (0.0%) |
| Cleaning & Maintenance | 27 (100.0%) | 0 (0.0%) |
| Personal Care & Service | 0 (0.0%) | 36 (100.0%) |
| Total (Category) | 90 (28.2%) | 229 (71.8%) |
| Total (Overall) | 531 (45.4%) | 640 (54.6%) |
Sales and Office Occupations
The most common Sales and Office occupations in Terre du Lac are Office & Administration (160 | 13.7%), and Sales & Related (157 | 13.4%).

Sales and Office Occupations by Sex
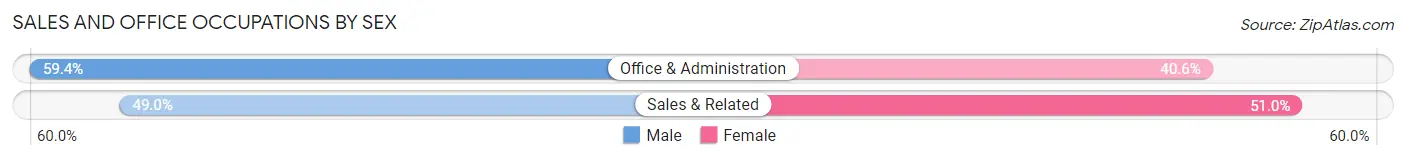
| Occupation | Male | Female |
| Sales & Related | 77 (49.0%) | 80 (51.0%) |
| Office & Administration | 95 (59.4%) | 65 (40.6%) |
| Total (Category) | 172 (54.3%) | 145 (45.7%) |
| Total (Overall) | 531 (45.4%) | 640 (54.6%) |
Natural Resources, Construction and Maintenance Occupations
The most common Natural Resources, Construction and Maintenance occupations in Terre du Lac are , and Installation, Maintenance & Repair (16 | 1.4%).
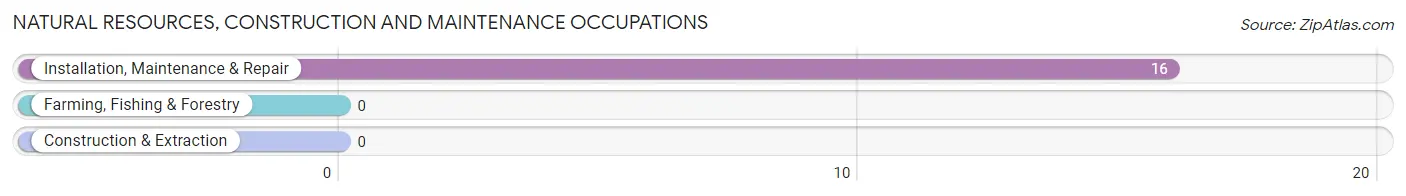
Natural Resources, Construction and Maintenance Occupations by Sex
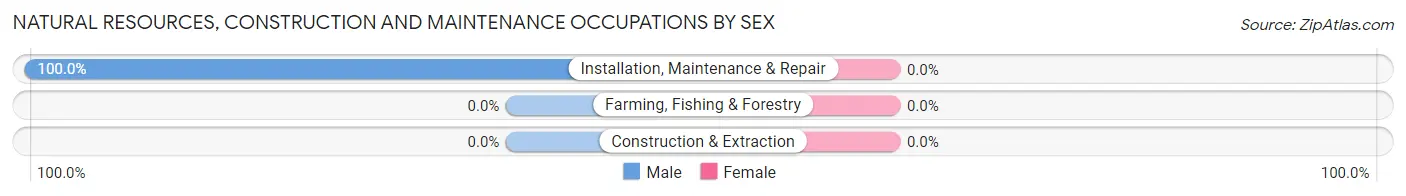
| Occupation | Male | Female |
| Farming, Fishing & Forestry | 0 (0.0%) | 0 (0.0%) |
| Construction & Extraction | 0 (0.0%) | 0 (0.0%) |
| Installation, Maintenance & Repair | 16 (100.0%) | 0 (0.0%) |
| Total (Category) | 16 (100.0%) | 0 (0.0%) |
| Total (Overall) | 531 (45.4%) | 640 (54.6%) |
Production, Transportation and Moving Occupations
The most common Production, Transportation and Moving occupations in Terre du Lac are Transportation (158 | 13.5%), Production (47 | 4.0%), and Material Moving (34 | 2.9%).
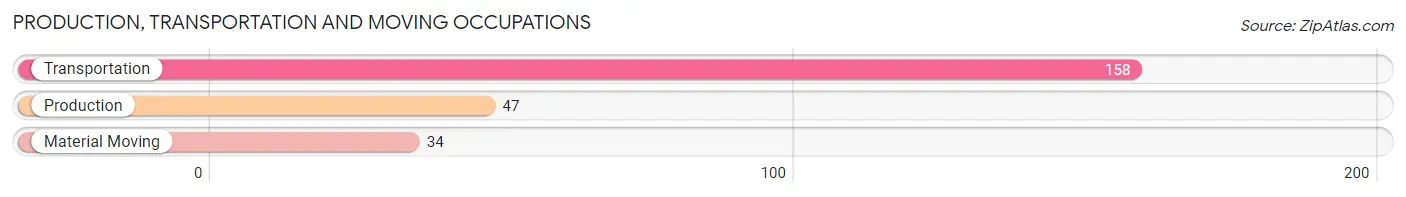
Production, Transportation and Moving Occupations by Sex
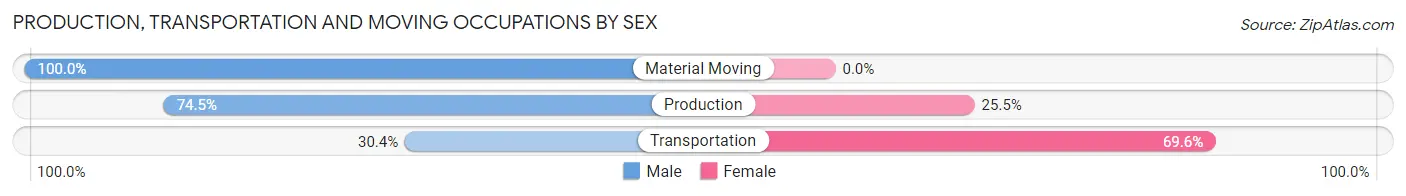
| Occupation | Male | Female |
| Production | 35 (74.5%) | 12 (25.5%) |
| Transportation | 48 (30.4%) | 110 (69.6%) |
| Material Moving | 34 (100.0%) | 0 (0.0%) |
| Total (Category) | 117 (48.9%) | 122 (51.0%) |
| Total (Overall) | 531 (45.4%) | 640 (54.6%) |
Employment Industries by Sex in Terre du Lac
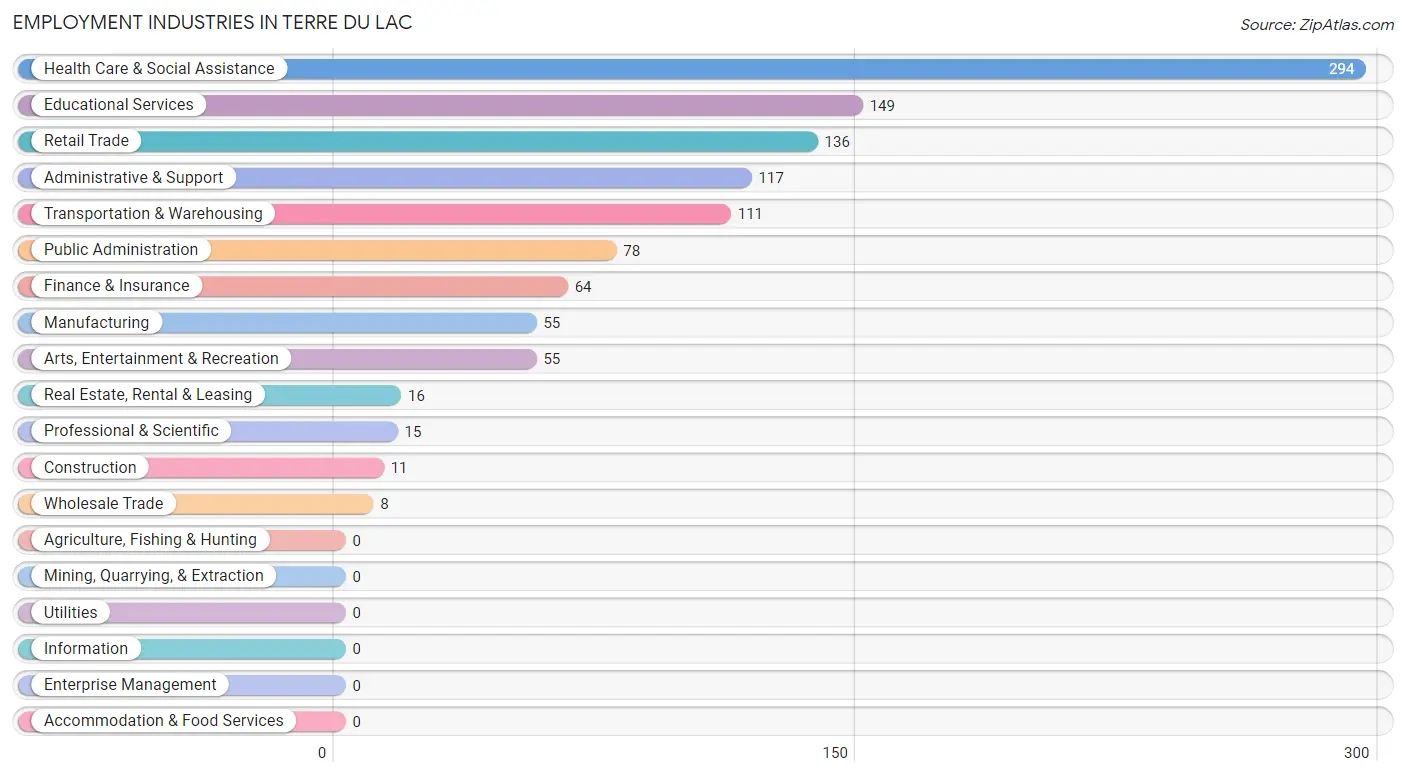
Employment Industries in Terre du Lac
The major employment industries in Terre du Lac include Health Care & Social Assistance (294 | 25.1%), Educational Services (149 | 12.7%), Retail Trade (136 | 11.6%), Administrative & Support (117 | 10.0%), and Transportation & Warehousing (111 | 9.5%).
Employment Industries by Sex in Terre du Lac
The Terre du Lac industries that see more men than women are Construction (100.0%), Real Estate, Rental & Leasing (100.0%), and Administrative & Support (100.0%), whereas the industries that tend to have a higher number of women are Wholesale Trade (100.0%), Educational Services (100.0%), and Health Care & Social Assistance (70.8%).
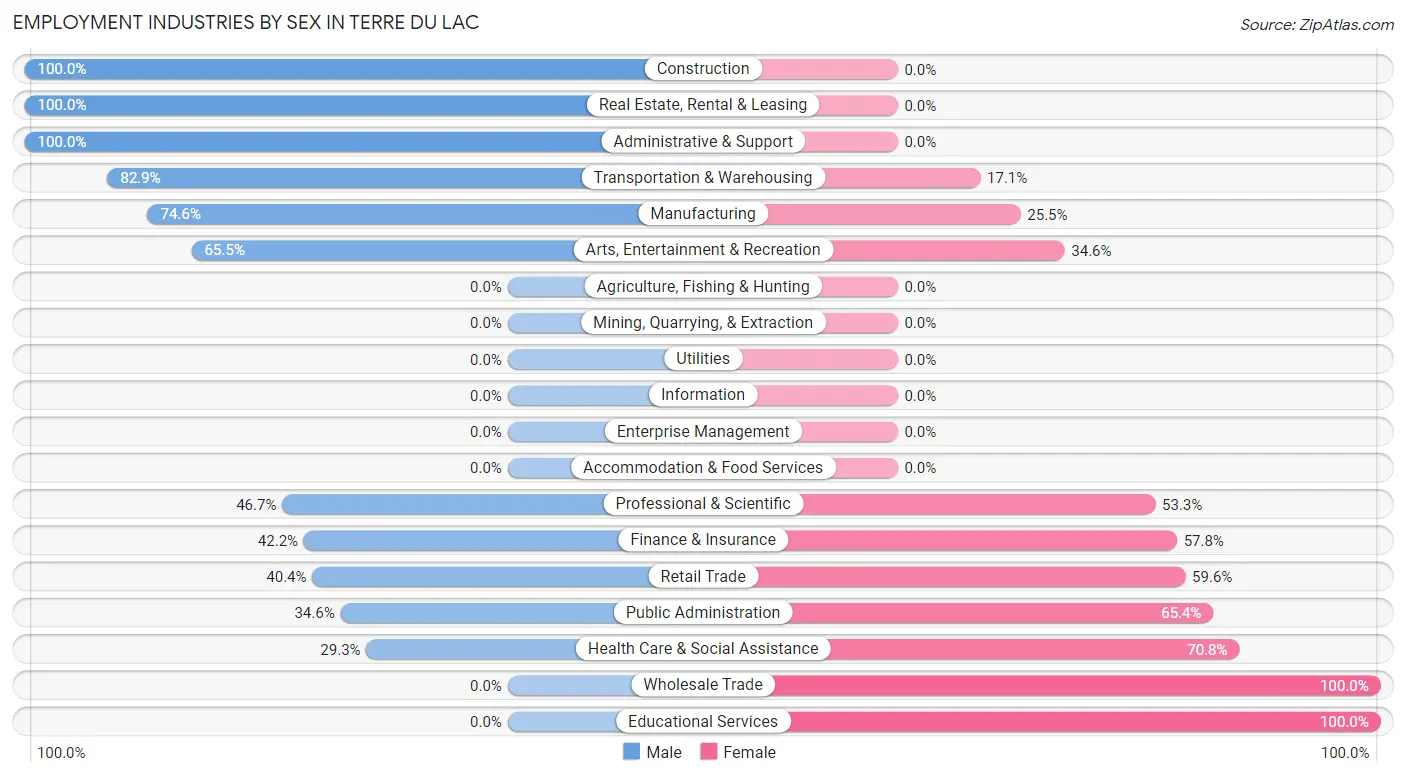
| Industry | Male | Female |
| Agriculture, Fishing & Hunting | 0 (0.0%) | 0 (0.0%) |
| Mining, Quarrying, & Extraction | 0 (0.0%) | 0 (0.0%) |
| Construction | 11 (100.0%) | 0 (0.0%) |
| Manufacturing | 41 (74.6%) | 14 (25.5%) |
| Wholesale Trade | 0 (0.0%) | 8 (100.0%) |
| Retail Trade | 55 (40.4%) | 81 (59.6%) |
| Transportation & Warehousing | 92 (82.9%) | 19 (17.1%) |
| Utilities | 0 (0.0%) | 0 (0.0%) |
| Information | 0 (0.0%) | 0 (0.0%) |
| Finance & Insurance | 27 (42.2%) | 37 (57.8%) |
| Real Estate, Rental & Leasing | 16 (100.0%) | 0 (0.0%) |
| Professional & Scientific | 7 (46.7%) | 8 (53.3%) |
| Enterprise Management | 0 (0.0%) | 0 (0.0%) |
| Administrative & Support | 117 (100.0%) | 0 (0.0%) |
| Educational Services | 0 (0.0%) | 149 (100.0%) |
| Health Care & Social Assistance | 86 (29.2%) | 208 (70.8%) |
| Arts, Entertainment & Recreation | 36 (65.4%) | 19 (34.5%) |
| Accommodation & Food Services | 0 (0.0%) | 0 (0.0%) |
| Public Administration | 27 (34.6%) | 51 (65.4%) |
| Total | 531 (45.4%) | 640 (54.6%) |
Education in Terre du Lac
School Enrollment in Terre du Lac
The most common levels of schooling among the 421 students in Terre du Lac are high school (116 | 27.6%), elementary school (87 | 20.7%), and middle school (74 | 17.6%).
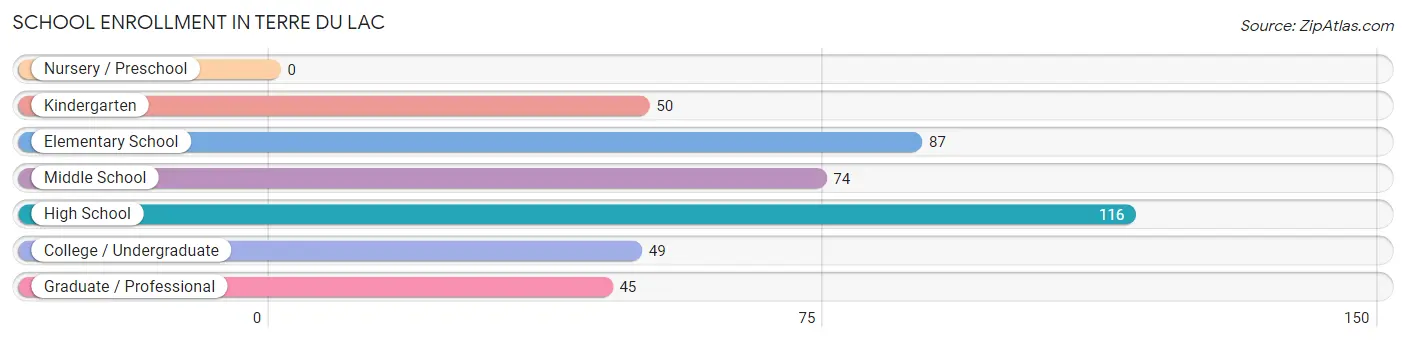
| School Level | # Students | % Students |
| Nursery / Preschool | 0 | 0.0% |
| Kindergarten | 50 | 11.9% |
| Elementary School | 87 | 20.7% |
| Middle School | 74 | 17.6% |
| High School | 116 | 27.6% |
| College / Undergraduate | 49 | 11.6% |
| Graduate / Professional | 45 | 10.7% |
| Total | 421 | 100.0% |
School Enrollment by Age by Funding Source in Terre du Lac
Out of a total of 421 students who are enrolled in schools in Terre du Lac, 37 (8.8%) attend a private institution, while the remaining 384 (91.2%) are enrolled in public schools. The age group of 35 years and over has the highest likelihood of being enrolled in private schools, with 17 (27.4% in the age bracket) enrolled. Conversely, the age group of 5 to 9 year old has the lowest likelihood of being enrolled in a private school, with 137 (100.0% in the age bracket) attending a public institution.
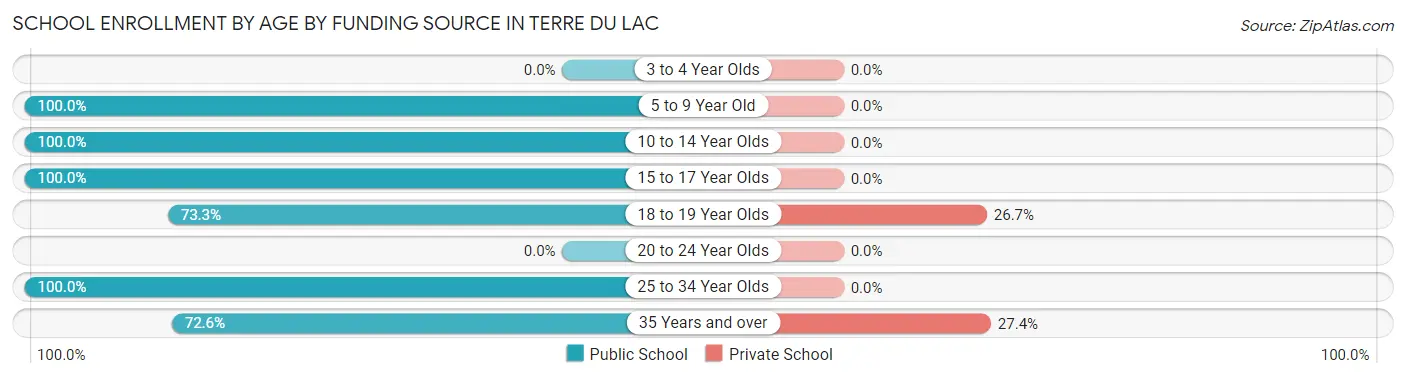
| Age Bracket | Public School | Private School |
| 3 to 4 Year Olds | 0 (0.0%) | 0 (0.0%) |
| 5 to 9 Year Old | 137 (100.0%) | 0 (0.0%) |
| 10 to 14 Year Olds | 74 (100.0%) | 0 (0.0%) |
| 15 to 17 Year Olds | 61 (100.0%) | 0 (0.0%) |
| 18 to 19 Year Olds | 55 (73.3%) | 20 (26.7%) |
| 20 to 24 Year Olds | 0 (0.0%) | 0 (0.0%) |
| 25 to 34 Year Olds | 12 (100.0%) | 0 (0.0%) |
| 35 Years and over | 45 (72.6%) | 17 (27.4%) |
| Total | 384 (91.2%) | 37 (8.8%) |
Educational Attainment by Field of Study in Terre du Lac
Engineering (98 | 20.9%), education (80 | 17.1%), science & technology (59 | 12.6%), business (59 | 12.6%), and social sciences (37 | 7.9%) are the most common fields of study among 469 individuals in Terre du Lac who have obtained a bachelor's degree or higher.
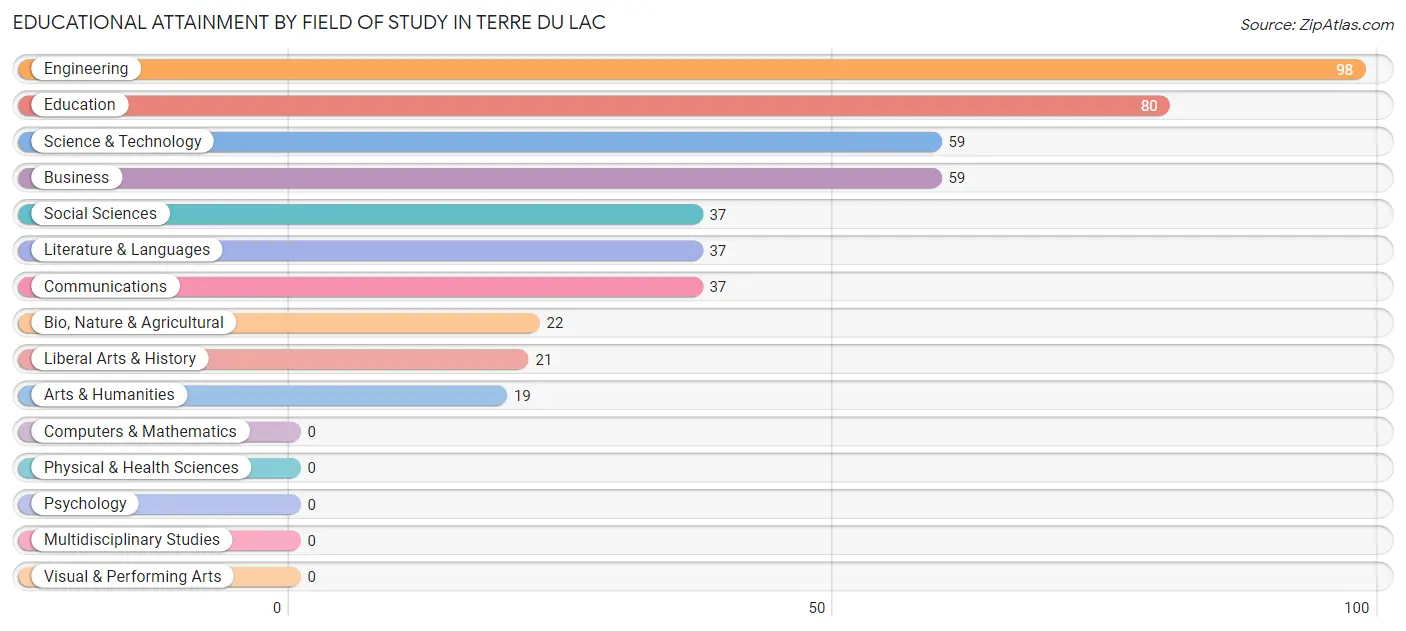
| Field of Study | # Graduates | % Graduates |
| Computers & Mathematics | 0 | 0.0% |
| Bio, Nature & Agricultural | 22 | 4.7% |
| Physical & Health Sciences | 0 | 0.0% |
| Psychology | 0 | 0.0% |
| Social Sciences | 37 | 7.9% |
| Engineering | 98 | 20.9% |
| Multidisciplinary Studies | 0 | 0.0% |
| Science & Technology | 59 | 12.6% |
| Business | 59 | 12.6% |
| Education | 80 | 17.1% |
| Literature & Languages | 37 | 7.9% |
| Liberal Arts & History | 21 | 4.5% |
| Visual & Performing Arts | 0 | 0.0% |
| Communications | 37 | 7.9% |
| Arts & Humanities | 19 | 4.1% |
| Total | 469 | 100.0% |
Transportation & Commute in Terre du Lac
Vehicle Availability by Sex in Terre du Lac
The most prevalent vehicle ownership categories in Terre du Lac are males with 3 vehicles (226, accounting for 45.7%) and females with 3 vehicles (247, making up 35.7%).
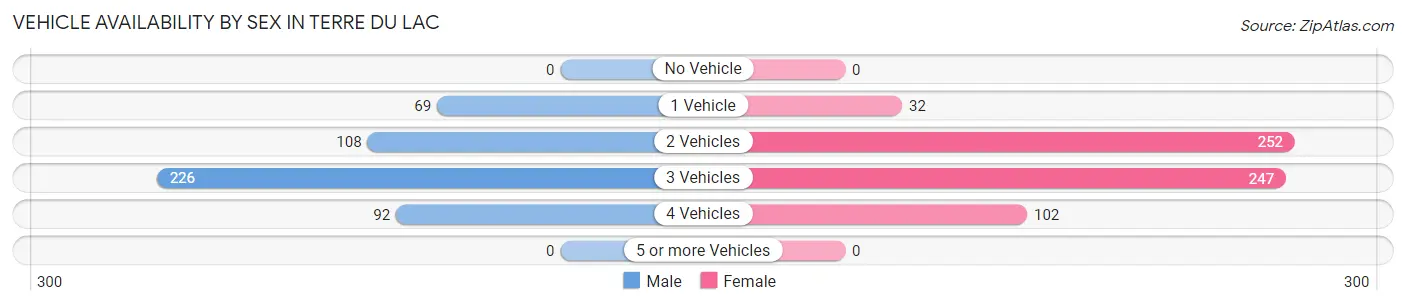
| Vehicles Available | Male | Female |
| No Vehicle | 0 (0.0%) | 0 (0.0%) |
| 1 Vehicle | 69 (13.9%) | 32 (5.1%) |
| 2 Vehicles | 108 (21.8%) | 252 (39.8%) |
| 3 Vehicles | 226 (45.7%) | 247 (39.0%) |
| 4 Vehicles | 92 (18.6%) | 102 (16.1%) |
| 5 or more Vehicles | 0 (0.0%) | 0 (0.0%) |
| Total | 495 (100.0%) | 633 (100.0%) |
Commute Time in Terre du Lac
The most frequently occuring commute durations in Terre du Lac are 30 to 34 minutes (355 commuters, 36.7%), 20 to 24 minutes (144 commuters, 14.9%), and 15 to 19 minutes (117 commuters, 12.1%).
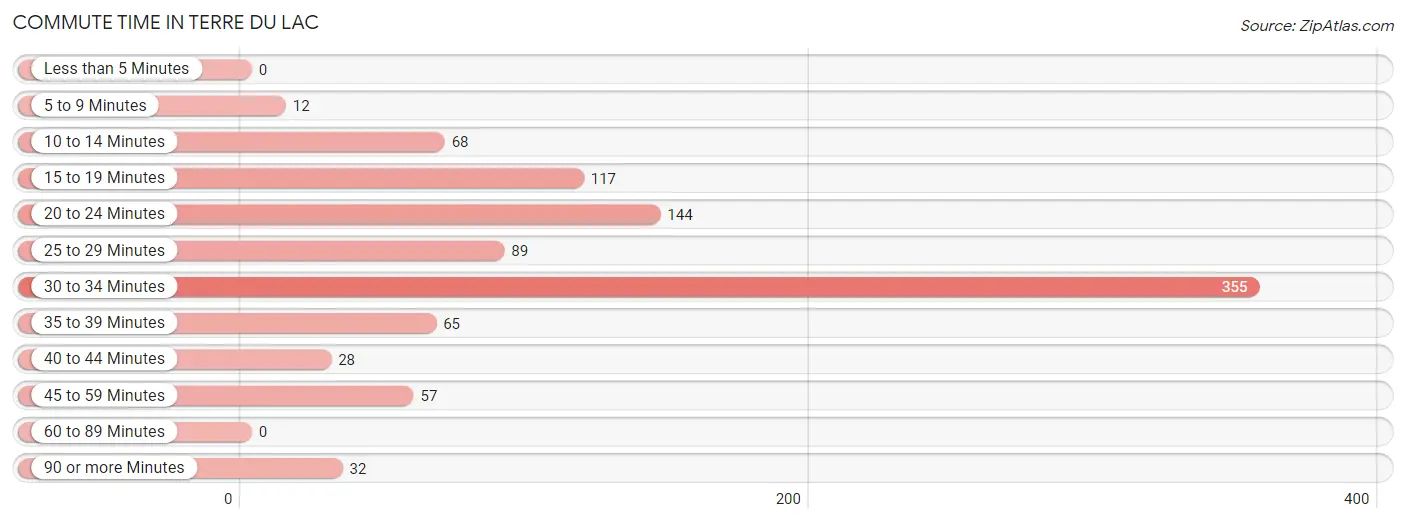
| Commute Time | # Commuters | % Commuters |
| Less than 5 Minutes | 0 | 0.0% |
| 5 to 9 Minutes | 12 | 1.2% |
| 10 to 14 Minutes | 68 | 7.0% |
| 15 to 19 Minutes | 117 | 12.1% |
| 20 to 24 Minutes | 144 | 14.9% |
| 25 to 29 Minutes | 89 | 9.2% |
| 30 to 34 Minutes | 355 | 36.7% |
| 35 to 39 Minutes | 65 | 6.7% |
| 40 to 44 Minutes | 28 | 2.9% |
| 45 to 59 Minutes | 57 | 5.9% |
| 60 to 89 Minutes | 0 | 0.0% |
| 90 or more Minutes | 32 | 3.3% |
Commute Time by Sex in Terre du Lac
The most common commute times in Terre du Lac are 30 to 34 minutes (226 commuters, 49.6%) for males and 30 to 34 minutes (129 commuters, 25.2%) for females.
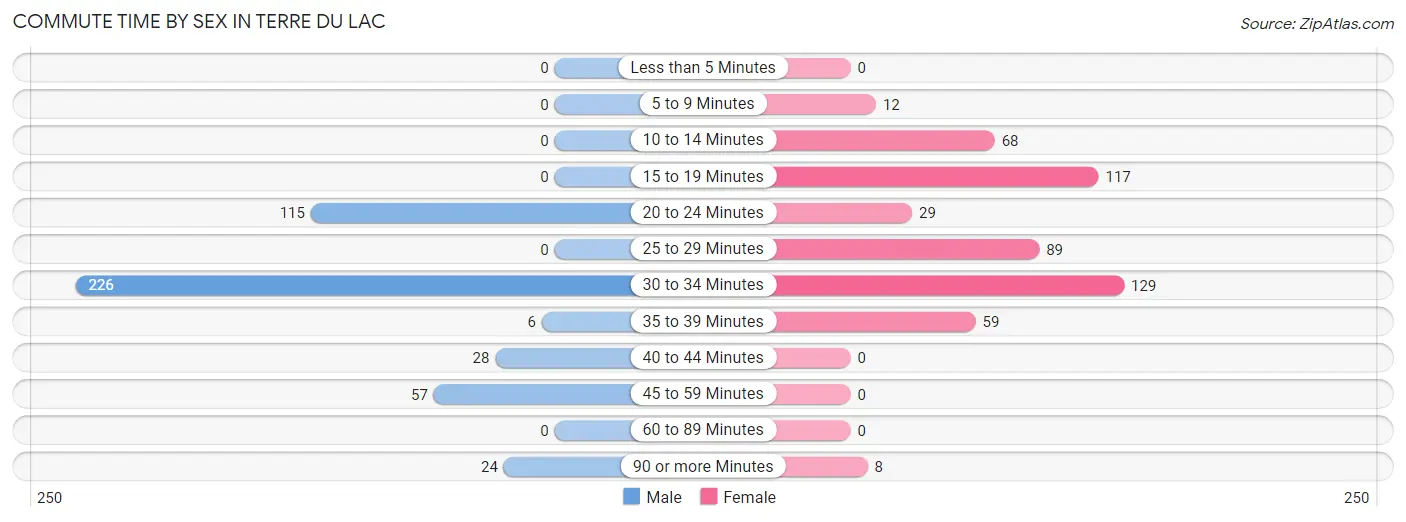
| Commute Time | Male | Female |
| Less than 5 Minutes | 0 (0.0%) | 0 (0.0%) |
| 5 to 9 Minutes | 0 (0.0%) | 12 (2.4%) |
| 10 to 14 Minutes | 0 (0.0%) | 68 (13.3%) |
| 15 to 19 Minutes | 0 (0.0%) | 117 (22.9%) |
| 20 to 24 Minutes | 115 (25.2%) | 29 (5.7%) |
| 25 to 29 Minutes | 0 (0.0%) | 89 (17.4%) |
| 30 to 34 Minutes | 226 (49.6%) | 129 (25.2%) |
| 35 to 39 Minutes | 6 (1.3%) | 59 (11.6%) |
| 40 to 44 Minutes | 28 (6.1%) | 0 (0.0%) |
| 45 to 59 Minutes | 57 (12.5%) | 0 (0.0%) |
| 60 to 89 Minutes | 0 (0.0%) | 0 (0.0%) |
| 90 or more Minutes | 24 (5.3%) | 8 (1.6%) |
Time of Departure to Work by Sex in Terre du Lac
The most frequent times of departure to work in Terre du Lac are 4:00 PM to 11:59 PM (172, 37.7%) for males and 6:30 AM to 6:59 AM (168, 32.9%) for females.
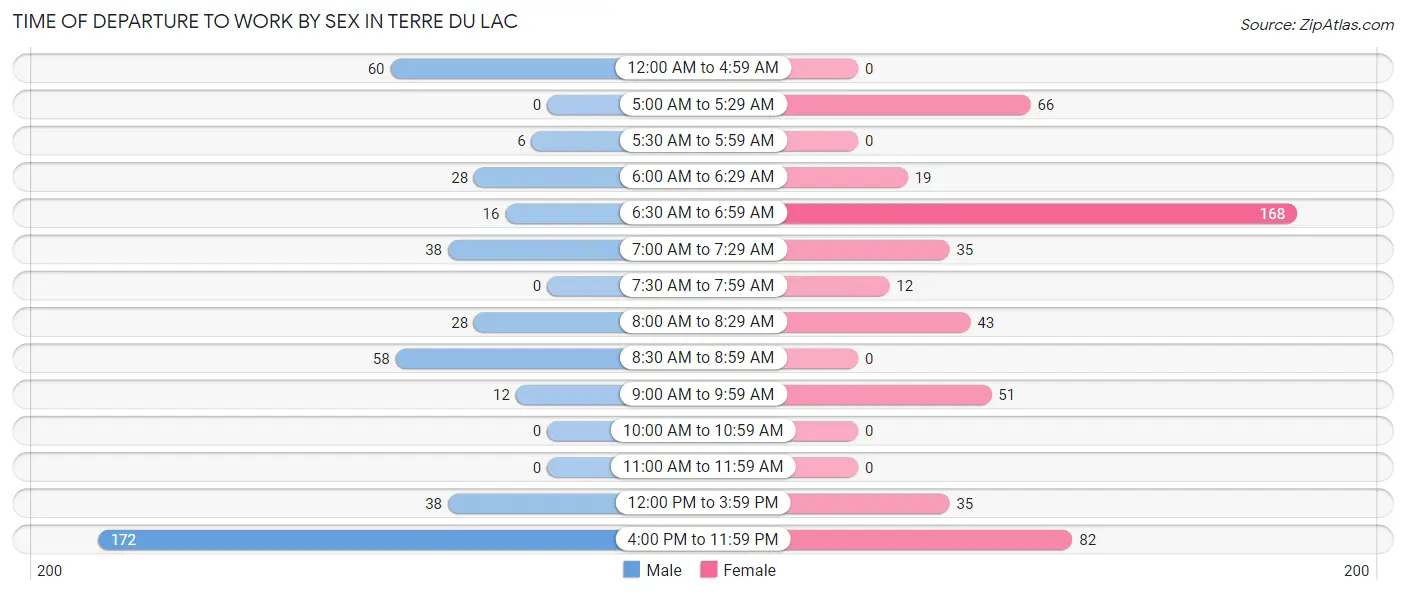
| Time of Departure | Male | Female |
| 12:00 AM to 4:59 AM | 60 (13.2%) | 0 (0.0%) |
| 5:00 AM to 5:29 AM | 0 (0.0%) | 66 (12.9%) |
| 5:30 AM to 5:59 AM | 6 (1.3%) | 0 (0.0%) |
| 6:00 AM to 6:29 AM | 28 (6.1%) | 19 (3.7%) |
| 6:30 AM to 6:59 AM | 16 (3.5%) | 168 (32.9%) |
| 7:00 AM to 7:29 AM | 38 (8.3%) | 35 (6.9%) |
| 7:30 AM to 7:59 AM | 0 (0.0%) | 12 (2.4%) |
| 8:00 AM to 8:29 AM | 28 (6.1%) | 43 (8.4%) |
| 8:30 AM to 8:59 AM | 58 (12.7%) | 0 (0.0%) |
| 9:00 AM to 9:59 AM | 12 (2.6%) | 51 (10.0%) |
| 10:00 AM to 10:59 AM | 0 (0.0%) | 0 (0.0%) |
| 11:00 AM to 11:59 AM | 0 (0.0%) | 0 (0.0%) |
| 12:00 PM to 3:59 PM | 38 (8.3%) | 35 (6.9%) |
| 4:00 PM to 11:59 PM | 172 (37.7%) | 82 (16.1%) |
| Total | 456 (100.0%) | 511 (100.0%) |
Housing Occupancy in Terre du Lac
Occupancy by Ownership in Terre du Lac
Of the total 938 dwellings in Terre du Lac, owner-occupied units account for 748 (79.7%), while renter-occupied units make up 190 (20.3%).
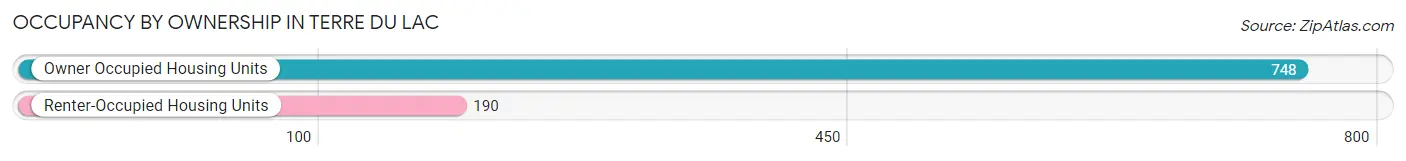
| Occupancy | # Housing Units | % Housing Units |
| Owner Occupied Housing Units | 748 | 79.7% |
| Renter-Occupied Housing Units | 190 | 20.3% |
| Total Occupied Housing Units | 938 | 100.0% |
Occupancy by Household Size in Terre du Lac
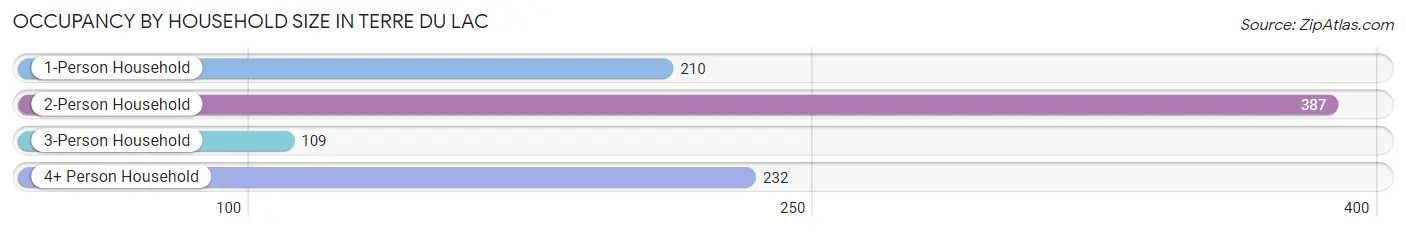
| Household Size | # Housing Units | % Housing Units |
| 1-Person Household | 210 | 22.4% |
| 2-Person Household | 387 | 41.3% |
| 3-Person Household | 109 | 11.6% |
| 4+ Person Household | 232 | 24.7% |
| Total Housing Units | 938 | 100.0% |
Occupancy by Ownership by Household Size in Terre du Lac
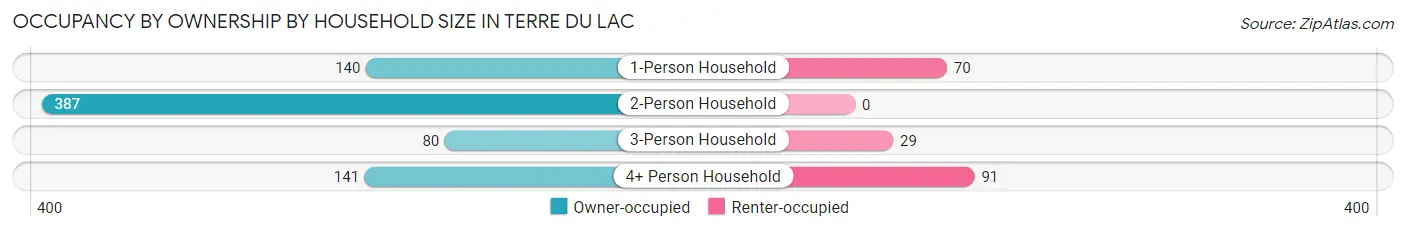
| Household Size | Owner-occupied | Renter-occupied |
| 1-Person Household | 140 (66.7%) | 70 (33.3%) |
| 2-Person Household | 387 (100.0%) | 0 (0.0%) |
| 3-Person Household | 80 (73.4%) | 29 (26.6%) |
| 4+ Person Household | 141 (60.8%) | 91 (39.2%) |
| Total Housing Units | 748 (79.7%) | 190 (20.3%) |
Occupancy by Educational Attainment in Terre du Lac
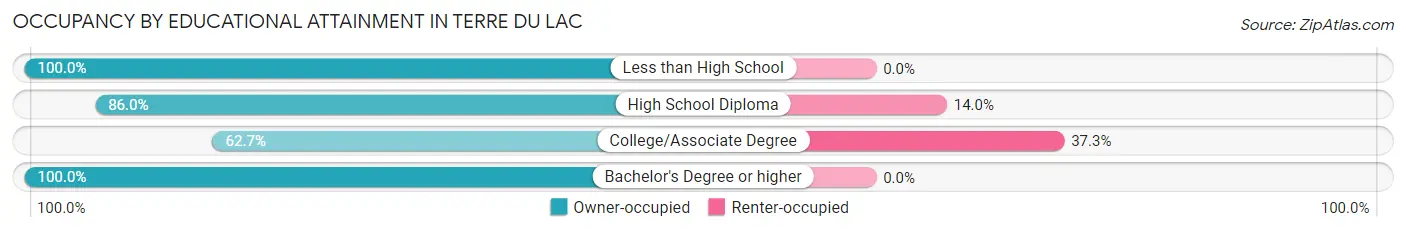
| Household Size | Owner-occupied | Renter-occupied |
| Less than High School | 24 (100.0%) | 0 (0.0%) |
| High School Diploma | 221 (86.0%) | 36 (14.0%) |
| College/Associate Degree | 259 (62.7%) | 154 (37.3%) |
| Bachelor's Degree or higher | 244 (100.0%) | 0 (0.0%) |
Occupancy by Age of Householder in Terre du Lac
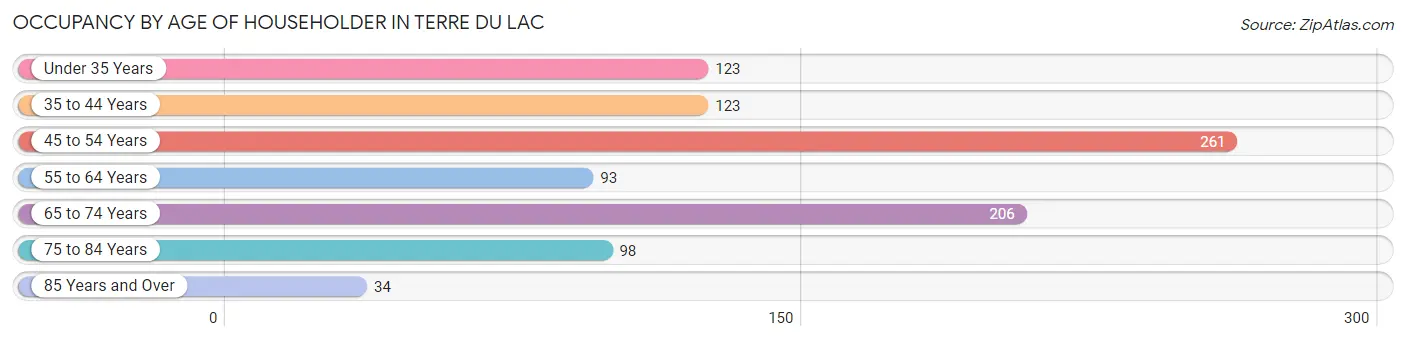
| Age Bracket | # Households | % Households |
| Under 35 Years | 123 | 13.1% |
| 35 to 44 Years | 123 | 13.1% |
| 45 to 54 Years | 261 | 27.8% |
| 55 to 64 Years | 93 | 9.9% |
| 65 to 74 Years | 206 | 22.0% |
| 75 to 84 Years | 98 | 10.4% |
| 85 Years and Over | 34 | 3.6% |
| Total | 938 | 100.0% |
Housing Finances in Terre du Lac
Median Income by Occupancy in Terre du Lac
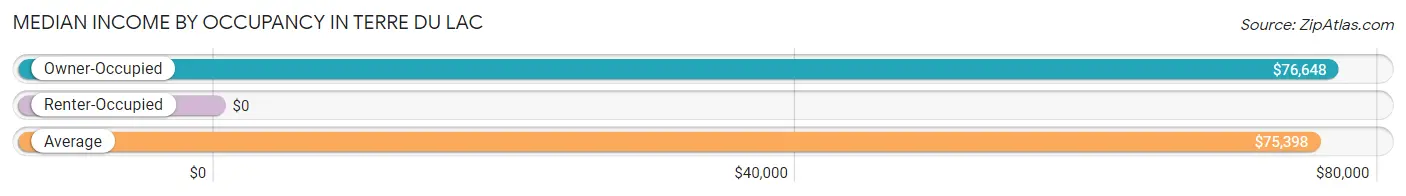
| Occupancy Type | # Households | Median Income |
| Owner-Occupied | 748 (79.7%) | $76,648 |
| Renter-Occupied | 190 (20.3%) | $0 |
| Average | 938 (100.0%) | $75,398 |
Occupancy by Householder Income Bracket in Terre du Lac
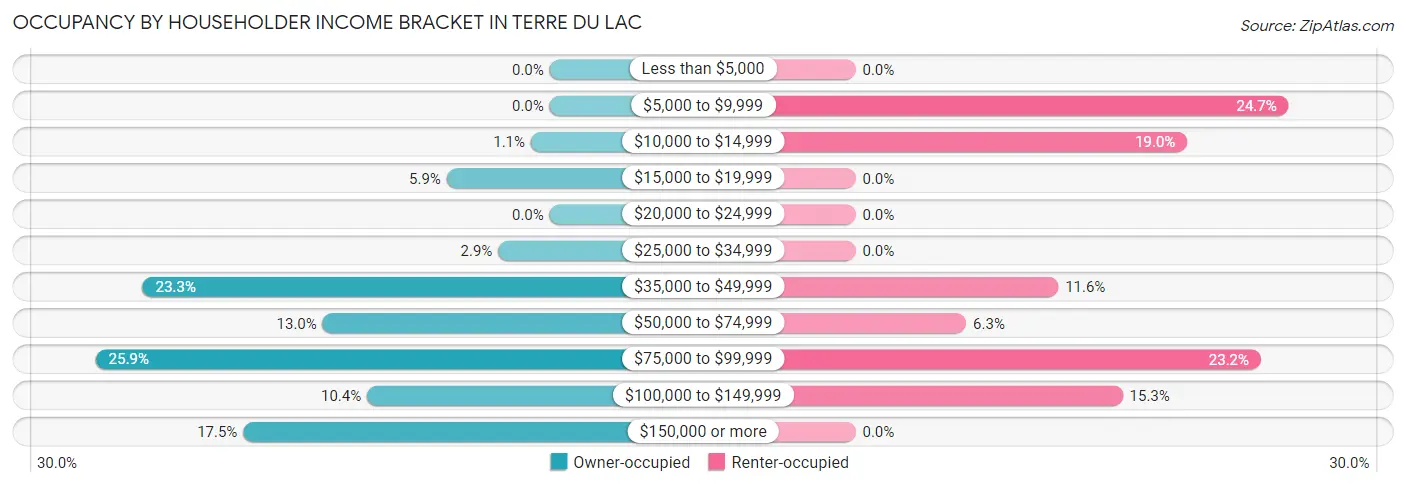
| Income Bracket | Owner-occupied | Renter-occupied |
| Less than $5,000 | 0 (0.0%) | 0 (0.0%) |
| $5,000 to $9,999 | 0 (0.0%) | 47 (24.7%) |
| $10,000 to $14,999 | 8 (1.1%) | 36 (19.0%) |
| $15,000 to $19,999 | 44 (5.9%) | 0 (0.0%) |
| $20,000 to $24,999 | 0 (0.0%) | 0 (0.0%) |
| $25,000 to $34,999 | 22 (2.9%) | 0 (0.0%) |
| $35,000 to $49,999 | 174 (23.3%) | 22 (11.6%) |
| $50,000 to $74,999 | 97 (13.0%) | 12 (6.3%) |
| $75,000 to $99,999 | 194 (25.9%) | 44 (23.2%) |
| $100,000 to $149,999 | 78 (10.4%) | 29 (15.3%) |
| $150,000 or more | 131 (17.5%) | 0 (0.0%) |
| Total | 748 (100.0%) | 190 (100.0%) |
Monthly Housing Cost Tiers in Terre du Lac
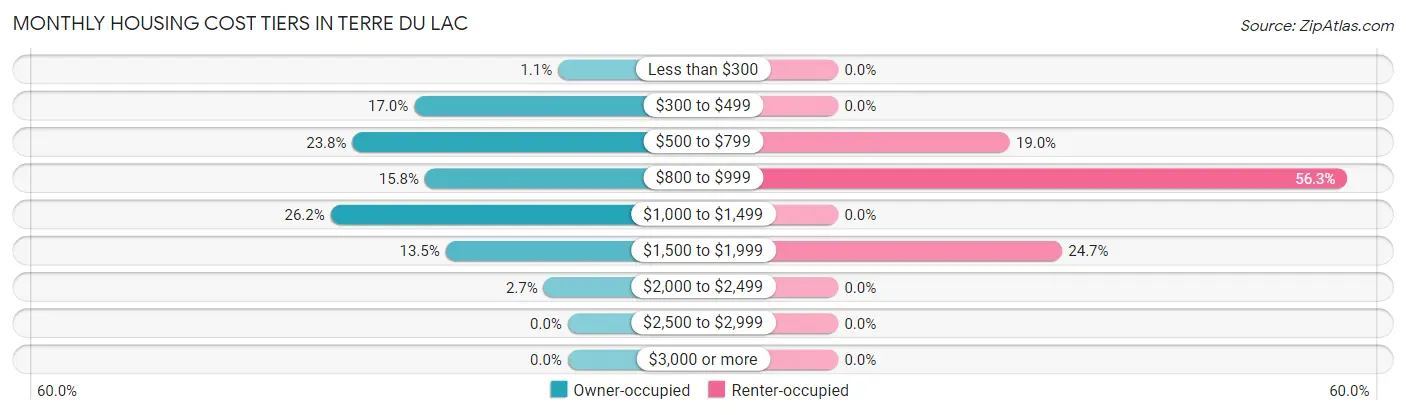
| Monthly Cost | Owner-occupied | Renter-occupied |
| Less than $300 | 8 (1.1%) | 0 (0.0%) |
| $300 to $499 | 127 (17.0%) | 0 (0.0%) |
| $500 to $799 | 178 (23.8%) | 36 (19.0%) |
| $800 to $999 | 118 (15.8%) | 107 (56.3%) |
| $1,000 to $1,499 | 196 (26.2%) | 0 (0.0%) |
| $1,500 to $1,999 | 101 (13.5%) | 47 (24.7%) |
| $2,000 to $2,499 | 20 (2.7%) | 0 (0.0%) |
| $2,500 to $2,999 | 0 (0.0%) | 0 (0.0%) |
| $3,000 or more | 0 (0.0%) | 0 (0.0%) |
| Total | 748 (100.0%) | 190 (100.0%) |
Physical Housing Characteristics in Terre du Lac
Housing Structures in Terre du Lac
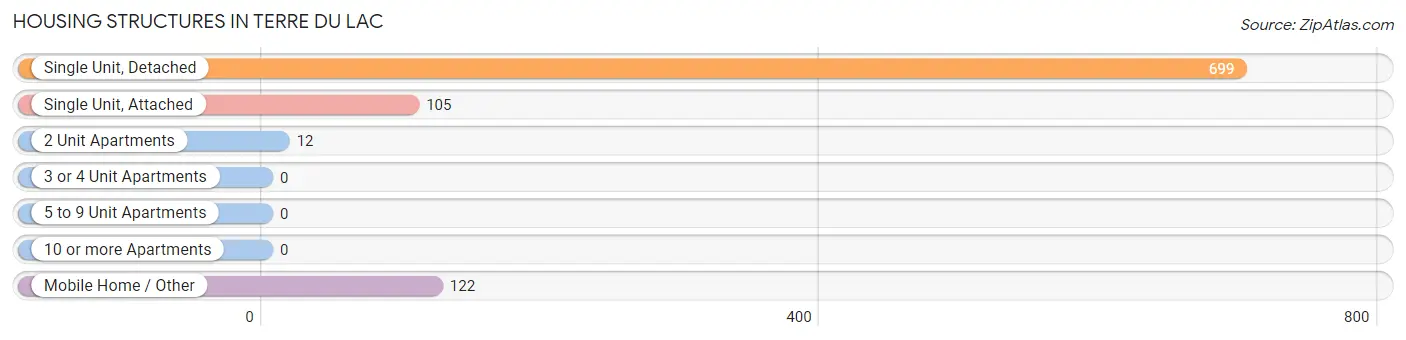
| Structure Type | # Housing Units | % Housing Units |
| Single Unit, Detached | 699 | 74.5% |
| Single Unit, Attached | 105 | 11.2% |
| 2 Unit Apartments | 12 | 1.3% |
| 3 or 4 Unit Apartments | 0 | 0.0% |
| 5 to 9 Unit Apartments | 0 | 0.0% |
| 10 or more Apartments | 0 | 0.0% |
| Mobile Home / Other | 122 | 13.0% |
| Total | 938 | 100.0% |
Housing Structures by Occupancy in Terre du Lac
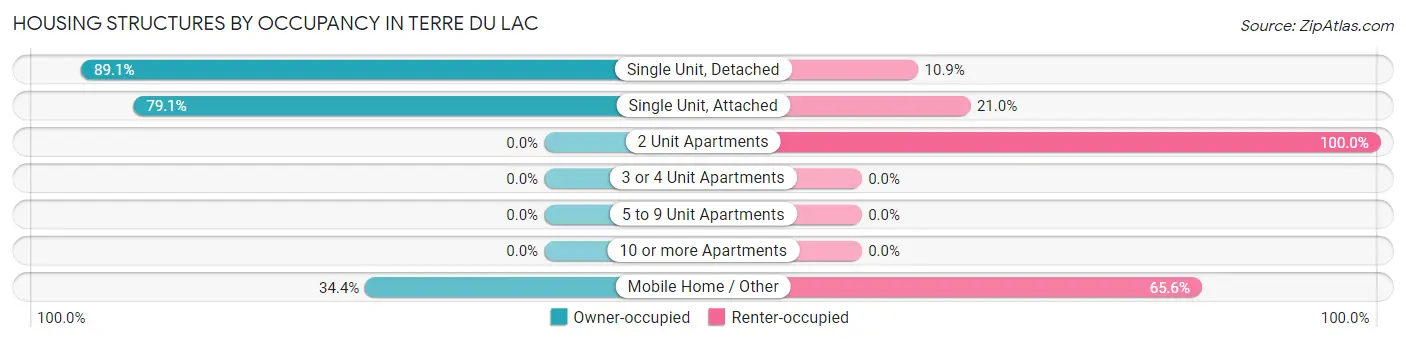
| Structure Type | Owner-occupied | Renter-occupied |
| Single Unit, Detached | 623 (89.1%) | 76 (10.9%) |
| Single Unit, Attached | 83 (79.0%) | 22 (20.9%) |
| 2 Unit Apartments | 0 (0.0%) | 12 (100.0%) |
| 3 or 4 Unit Apartments | 0 (0.0%) | 0 (0.0%) |
| 5 to 9 Unit Apartments | 0 (0.0%) | 0 (0.0%) |
| 10 or more Apartments | 0 (0.0%) | 0 (0.0%) |
| Mobile Home / Other | 42 (34.4%) | 80 (65.6%) |
| Total | 748 (79.7%) | 190 (20.3%) |
Housing Structures by Number of Rooms in Terre du Lac
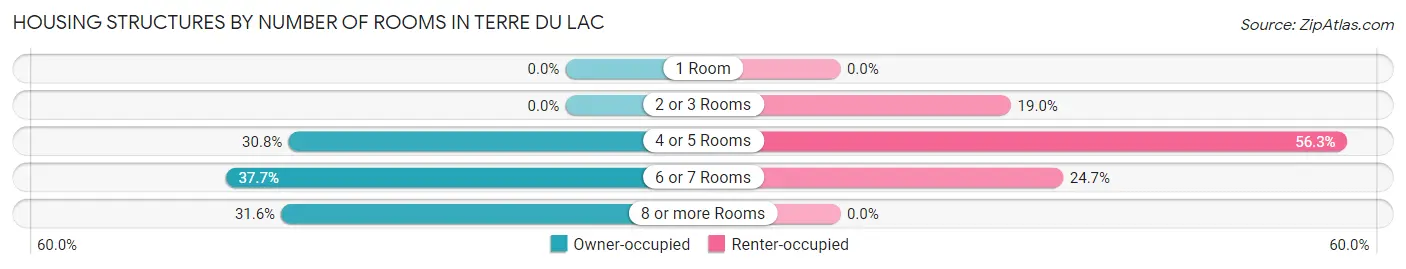
| Number of Rooms | Owner-occupied | Renter-occupied |
| 1 Room | 0 (0.0%) | 0 (0.0%) |
| 2 or 3 Rooms | 0 (0.0%) | 36 (19.0%) |
| 4 or 5 Rooms | 230 (30.7%) | 107 (56.3%) |
| 6 or 7 Rooms | 282 (37.7%) | 47 (24.7%) |
| 8 or more Rooms | 236 (31.6%) | 0 (0.0%) |
| Total | 748 (100.0%) | 190 (100.0%) |
Housing Structure by Heating Type in Terre du Lac
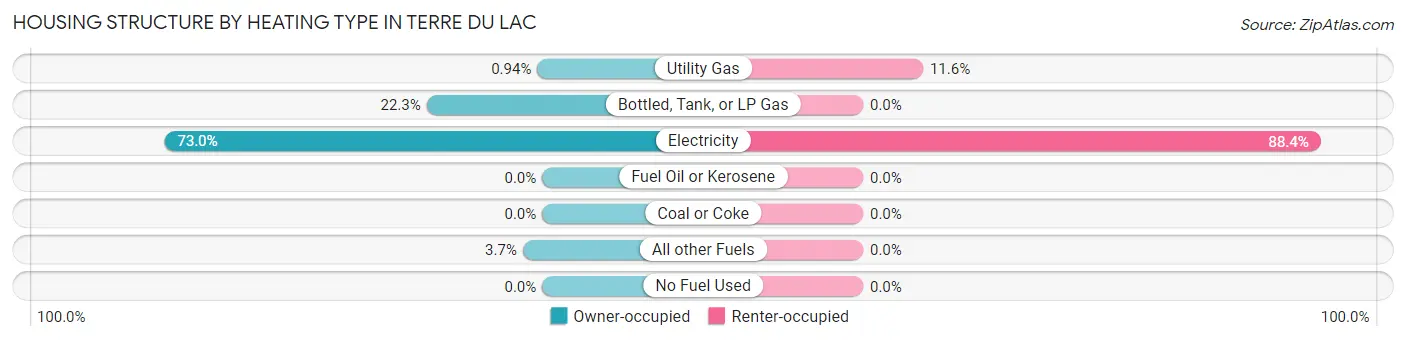
| Heating Type | Owner-occupied | Renter-occupied |
| Utility Gas | 7 (0.9%) | 22 (11.6%) |
| Bottled, Tank, or LP Gas | 167 (22.3%) | 0 (0.0%) |
| Electricity | 546 (73.0%) | 168 (88.4%) |
| Fuel Oil or Kerosene | 0 (0.0%) | 0 (0.0%) |
| Coal or Coke | 0 (0.0%) | 0 (0.0%) |
| All other Fuels | 28 (3.7%) | 0 (0.0%) |
| No Fuel Used | 0 (0.0%) | 0 (0.0%) |
| Total | 748 (100.0%) | 190 (100.0%) |
Household Vehicle Usage in Terre du Lac
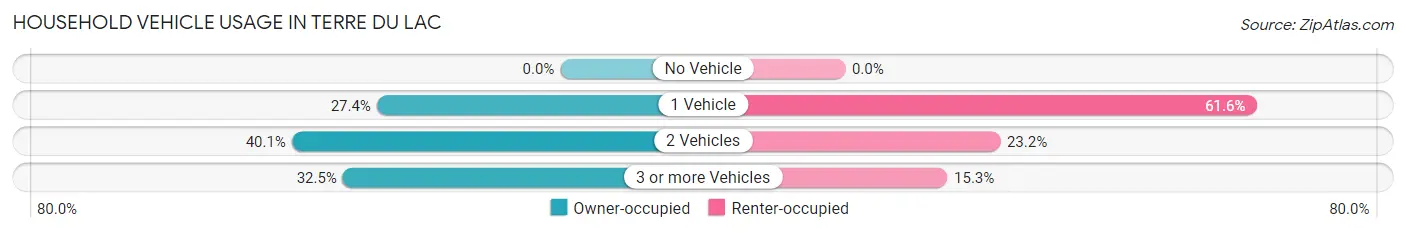
| Vehicles per Household | Owner-occupied | Renter-occupied |
| No Vehicle | 0 (0.0%) | 0 (0.0%) |
| 1 Vehicle | 205 (27.4%) | 117 (61.6%) |
| 2 Vehicles | 300 (40.1%) | 44 (23.2%) |
| 3 or more Vehicles | 243 (32.5%) | 29 (15.3%) |
| Total | 748 (100.0%) | 190 (100.0%) |
Real Estate & Mortgages in Terre du Lac
Real Estate and Mortgage Overview in Terre du Lac
| Characteristic | Without Mortgage | With Mortgage |
| Housing Units | 258 | 490 |
| Median Property Value | $187,200 | $168,800 |
| Median Household Income | $45,982 | $116 |
| Monthly Housing Costs | $494 | $0 |
| Real Estate Taxes | $1,767 | $0 |
Property Value by Mortgage Status in Terre du Lac
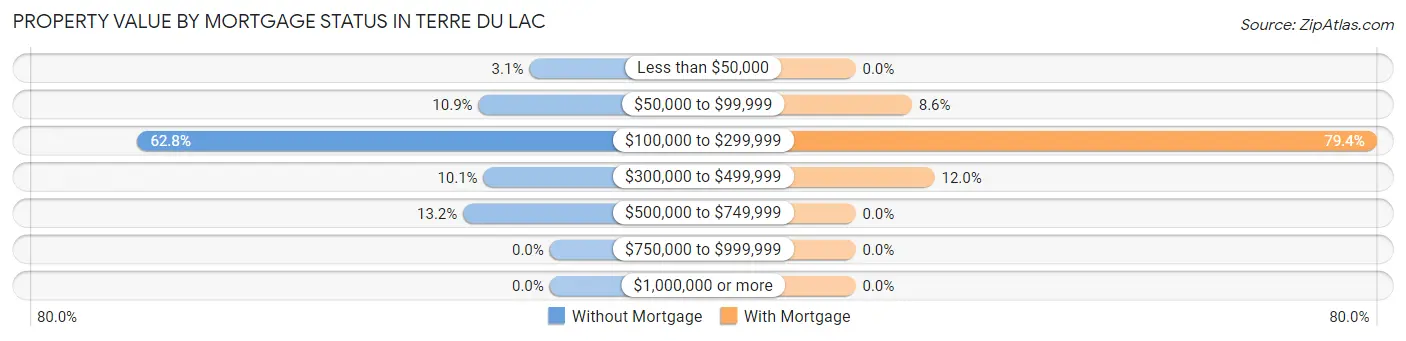
| Property Value | Without Mortgage | With Mortgage |
| Less than $50,000 | 8 (3.1%) | 0 (0.0%) |
| $50,000 to $99,999 | 28 (10.8%) | 42 (8.6%) |
| $100,000 to $299,999 | 162 (62.8%) | 389 (79.4%) |
| $300,000 to $499,999 | 26 (10.1%) | 59 (12.0%) |
| $500,000 to $749,999 | 34 (13.2%) | 0 (0.0%) |
| $750,000 to $999,999 | 0 (0.0%) | 0 (0.0%) |
| $1,000,000 or more | 0 (0.0%) | 0 (0.0%) |
| Total | 258 (100.0%) | 490 (100.0%) |
Household Income by Mortgage Status in Terre du Lac
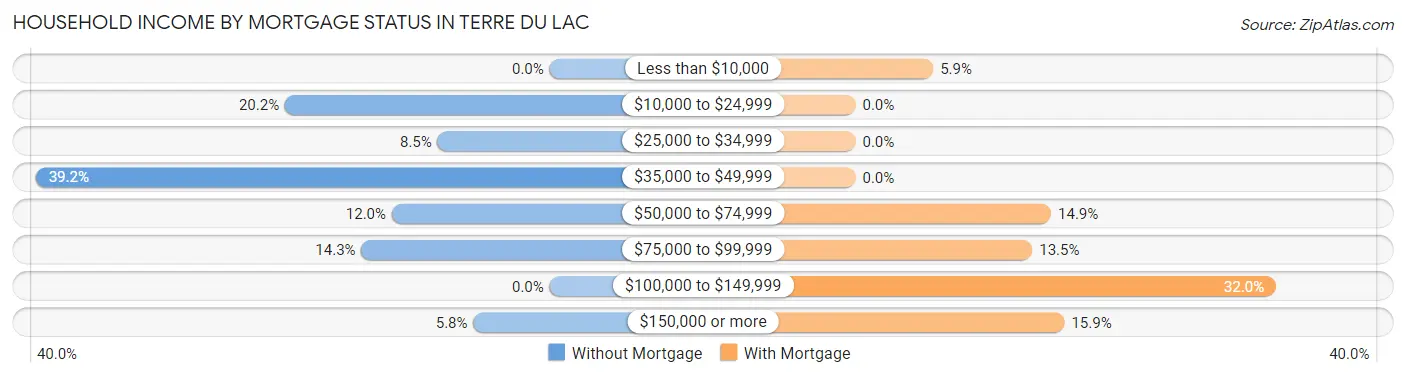
| Household Income | Without Mortgage | With Mortgage |
| Less than $10,000 | 0 (0.0%) | 29 (5.9%) |
| $10,000 to $24,999 | 52 (20.2%) | 0 (0.0%) |
| $25,000 to $34,999 | 22 (8.5%) | 0 (0.0%) |
| $35,000 to $49,999 | 101 (39.2%) | 0 (0.0%) |
| $50,000 to $74,999 | 31 (12.0%) | 73 (14.9%) |
| $75,000 to $99,999 | 37 (14.3%) | 66 (13.5%) |
| $100,000 to $149,999 | 0 (0.0%) | 157 (32.0%) |
| $150,000 or more | 15 (5.8%) | 78 (15.9%) |
| Total | 258 (100.0%) | 490 (100.0%) |
Property Value to Household Income Ratio in Terre du Lac
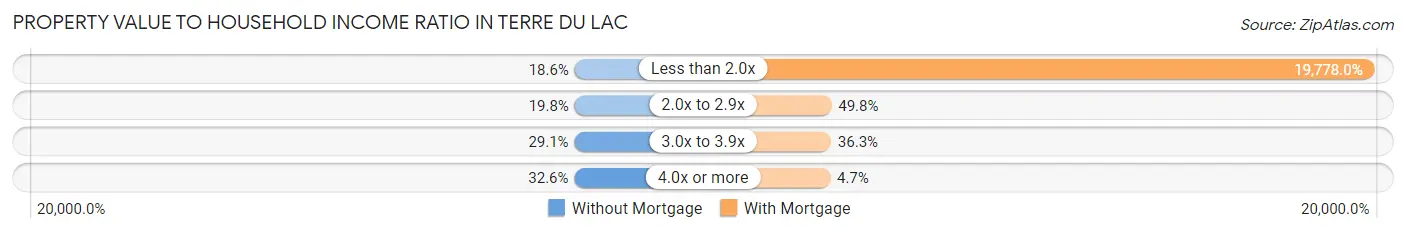
| Value-to-Income Ratio | Without Mortgage | With Mortgage |
| Less than 2.0x | 48 (18.6%) | 96,912 (19,778.0%) |
| 2.0x to 2.9x | 51 (19.8%) | 244 (49.8%) |
| 3.0x to 3.9x | 75 (29.1%) | 178 (36.3%) |
| 4.0x or more | 84 (32.6%) | 23 (4.7%) |
| Total | 258 (100.0%) | 490 (100.0%) |
Real Estate Taxes by Mortgage Status in Terre du Lac
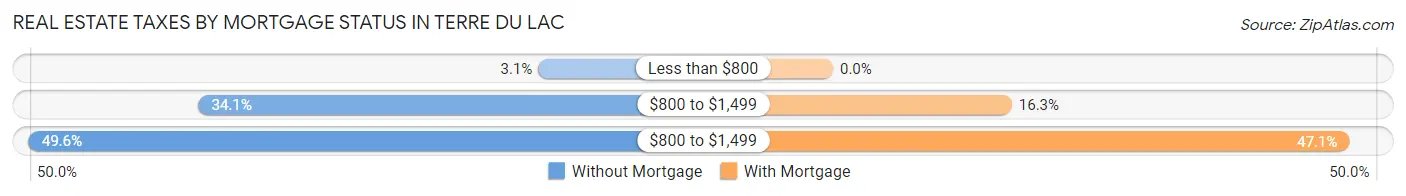
| Property Taxes | Without Mortgage | With Mortgage |
| Less than $800 | 8 (3.1%) | 0 (0.0%) |
| $800 to $1,499 | 88 (34.1%) | 80 (16.3%) |
| $800 to $1,499 | 128 (49.6%) | 231 (47.1%) |
| Total | 258 (100.0%) | 490 (100.0%) |
Health & Disability in Terre du Lac
Health Insurance Coverage by Age in Terre du Lac
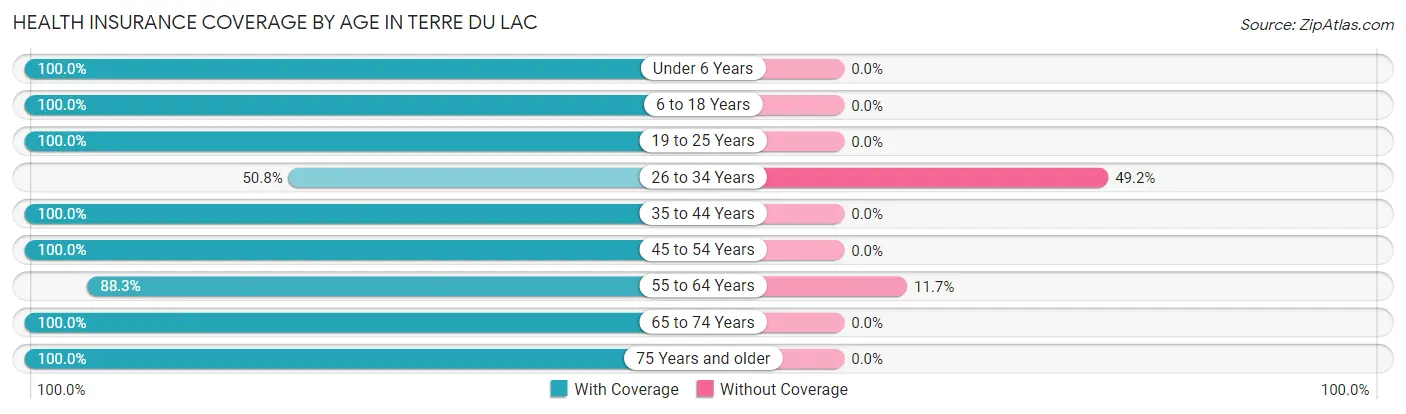
| Age Bracket | With Coverage | Without Coverage |
| Under 6 Years | 167 (100.0%) | 0 (0.0%) |
| 6 to 18 Years | 277 (100.0%) | 0 (0.0%) |
| 19 to 25 Years | 225 (100.0%) | 0 (0.0%) |
| 26 to 34 Years | 129 (50.8%) | 125 (49.2%) |
| 35 to 44 Years | 271 (100.0%) | 0 (0.0%) |
| 45 to 54 Years | 355 (100.0%) | 0 (0.0%) |
| 55 to 64 Years | 317 (88.3%) | 42 (11.7%) |
| 65 to 74 Years | 303 (100.0%) | 0 (0.0%) |
| 75 Years and older | 232 (100.0%) | 0 (0.0%) |
| Total | 2,276 (93.2%) | 167 (6.8%) |
Health Insurance Coverage by Citizenship Status in Terre du Lac

| Citizenship Status | With Coverage | Without Coverage |
| Native Born | 167 (100.0%) | 0 (0.0%) |
| Foreign Born, Citizen | 277 (100.0%) | 0 (0.0%) |
| Foreign Born, not a Citizen | 225 (100.0%) | 0 (0.0%) |
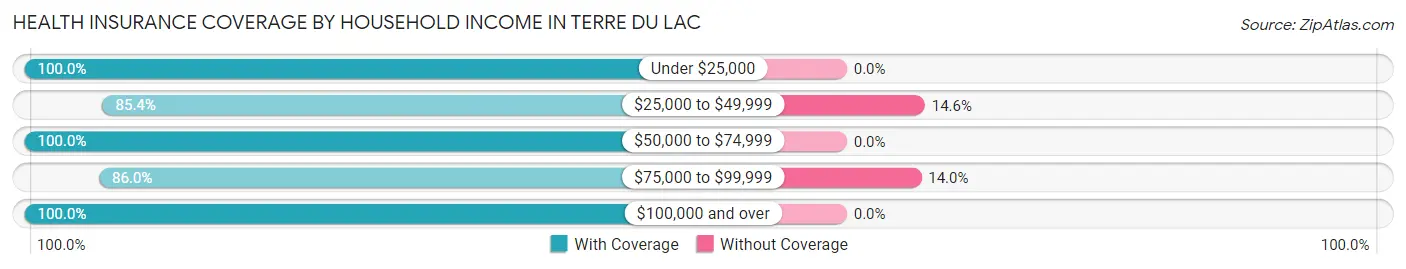
Health Insurance Coverage by Household Income in Terre du Lac
| Household Income | With Coverage | Without Coverage |
| Under $25,000 | 274 (100.0%) | 0 (0.0%) |
| $25,000 to $49,999 | 292 (85.4%) | 50 (14.6%) |
| $50,000 to $74,999 | 192 (100.0%) | 0 (0.0%) |
| $75,000 to $99,999 | 721 (86.0%) | 117 (14.0%) |
| $100,000 and over | 797 (100.0%) | 0 (0.0%) |
Public vs Private Health Insurance Coverage by Age in Terre du Lac
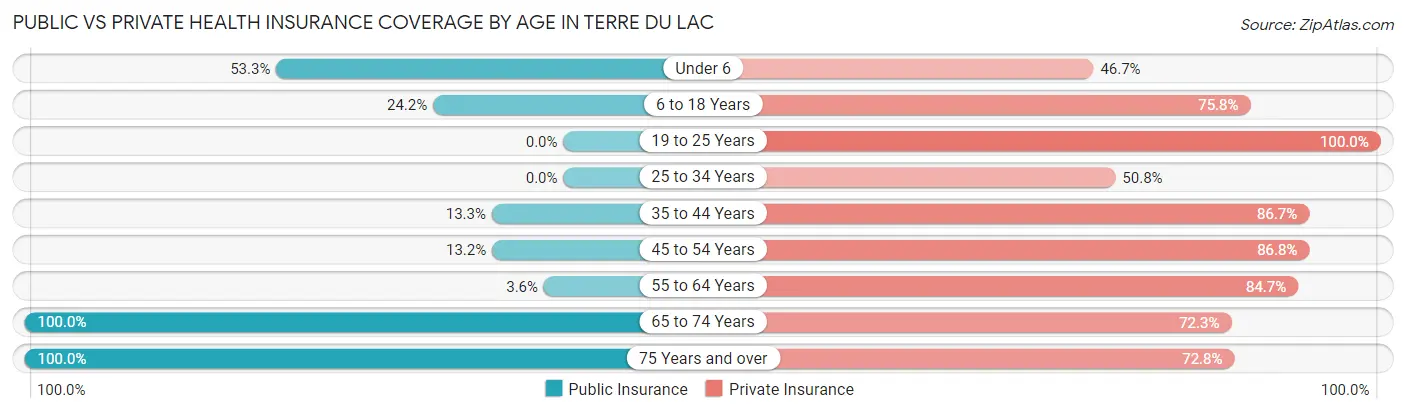
| Age Bracket | Public Insurance | Private Insurance |
| Under 6 | 89 (53.3%) | 78 (46.7%) |
| 6 to 18 Years | 67 (24.2%) | 210 (75.8%) |
| 19 to 25 Years | 0 (0.0%) | 225 (100.0%) |
| 25 to 34 Years | 0 (0.0%) | 129 (50.8%) |
| 35 to 44 Years | 36 (13.3%) | 235 (86.7%) |
| 45 to 54 Years | 47 (13.2%) | 308 (86.8%) |
| 55 to 64 Years | 13 (3.6%) | 304 (84.7%) |
| 65 to 74 Years | 303 (100.0%) | 219 (72.3%) |
| 75 Years and over | 232 (100.0%) | 169 (72.8%) |
| Total | 787 (32.2%) | 1,877 (76.8%) |
Disability Status by Sex by Age in Terre du Lac
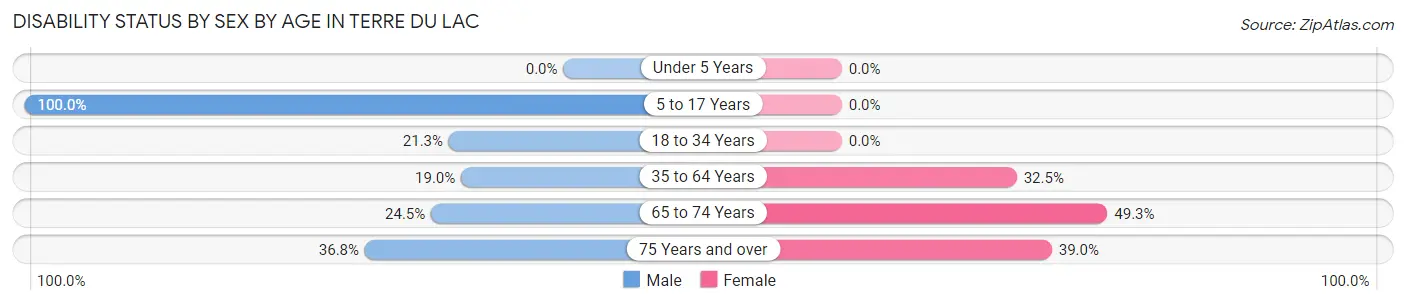
| Age Bracket | Male | Female |
| Under 5 Years | 0 (0.0%) | 0 (0.0%) |
| 5 to 17 Years | 100 (100.0%) | 0 (0.0%) |
| 18 to 34 Years | 75 (21.2%) | 0 (0.0%) |
| 35 to 64 Years | 63 (19.0%) | 212 (32.5%) |
| 65 to 74 Years | 40 (24.5%) | 69 (49.3%) |
| 75 Years and over | 42 (36.8%) | 46 (39.0%) |
Disability Class by Sex by Age in Terre du Lac
Disability Class: Hearing Difficulty
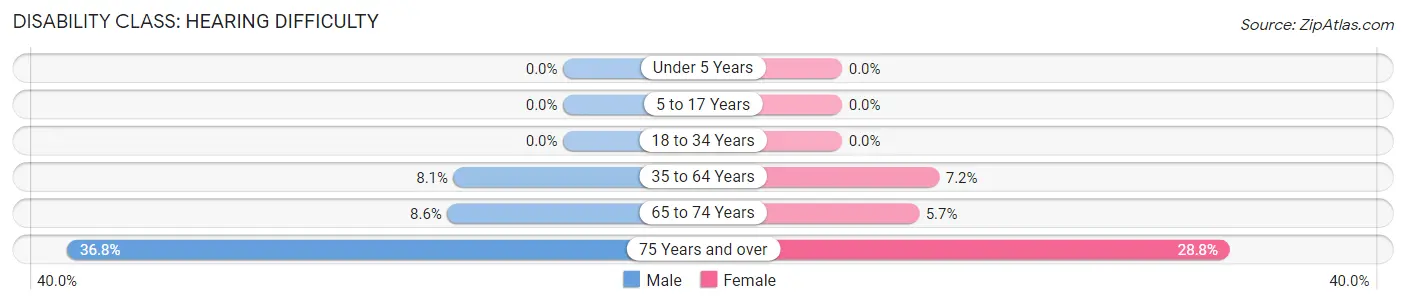
| Age Bracket | Male | Female |
| Under 5 Years | 0 (0.0%) | 0 (0.0%) |
| 5 to 17 Years | 0 (0.0%) | 0 (0.0%) |
| 18 to 34 Years | 0 (0.0%) | 0 (0.0%) |
| 35 to 64 Years | 27 (8.1%) | 47 (7.2%) |
| 65 to 74 Years | 14 (8.6%) | 8 (5.7%) |
| 75 Years and over | 42 (36.8%) | 34 (28.8%) |
Disability Class: Vision Difficulty
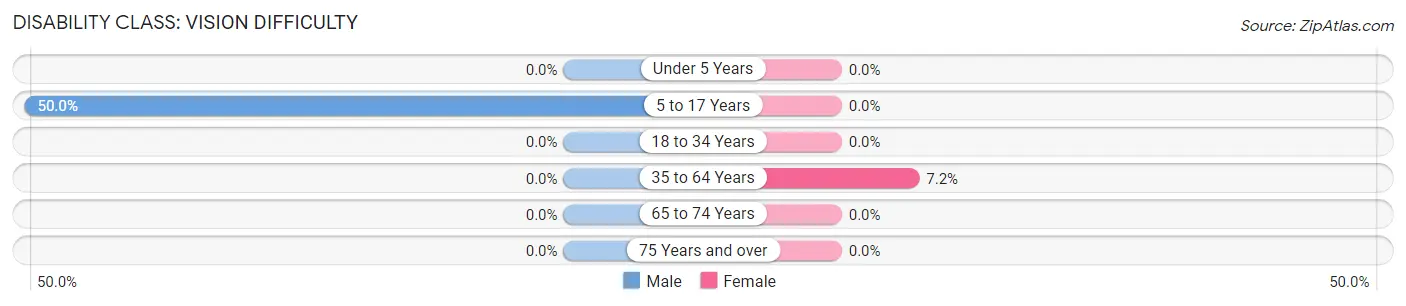
| Age Bracket | Male | Female |
| Under 5 Years | 0 (0.0%) | 0 (0.0%) |
| 5 to 17 Years | 50 (50.0%) | 0 (0.0%) |
| 18 to 34 Years | 0 (0.0%) | 0 (0.0%) |
| 35 to 64 Years | 0 (0.0%) | 47 (7.2%) |
| 65 to 74 Years | 0 (0.0%) | 0 (0.0%) |
| 75 Years and over | 0 (0.0%) | 0 (0.0%) |
Disability Class: Cognitive Difficulty
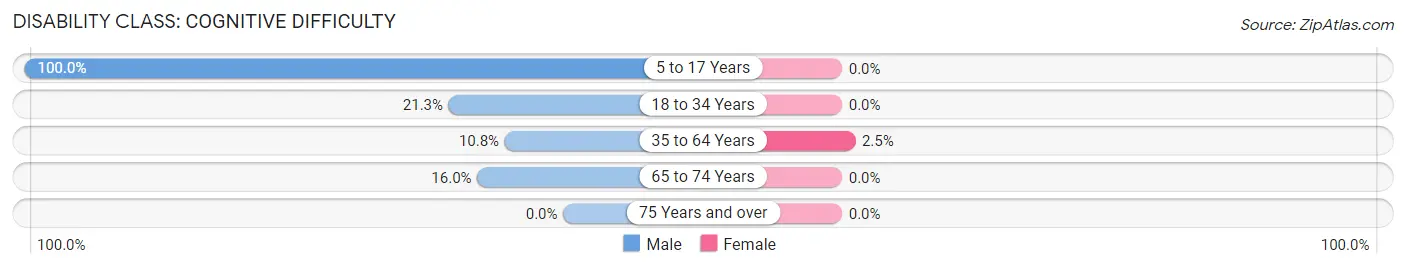
| Age Bracket | Male | Female |
| 5 to 17 Years | 100 (100.0%) | 0 (0.0%) |
| 18 to 34 Years | 75 (21.2%) | 0 (0.0%) |
| 35 to 64 Years | 36 (10.8%) | 16 (2.5%) |
| 65 to 74 Years | 26 (16.0%) | 0 (0.0%) |
| 75 Years and over | 0 (0.0%) | 0 (0.0%) |
Disability Class: Ambulatory Difficulty
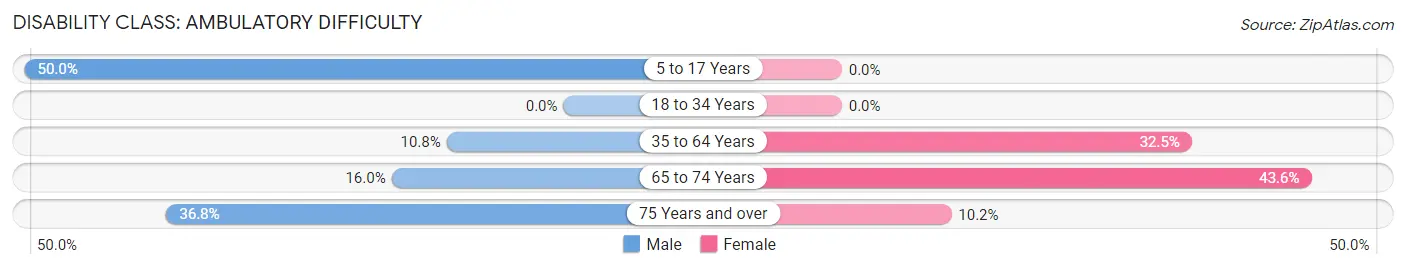
| Age Bracket | Male | Female |
| 5 to 17 Years | 50 (50.0%) | 0 (0.0%) |
| 18 to 34 Years | 0 (0.0%) | 0 (0.0%) |
| 35 to 64 Years | 36 (10.8%) | 212 (32.5%) |
| 65 to 74 Years | 26 (16.0%) | 61 (43.6%) |
| 75 Years and over | 42 (36.8%) | 12 (10.2%) |
Disability Class: Self-Care Difficulty
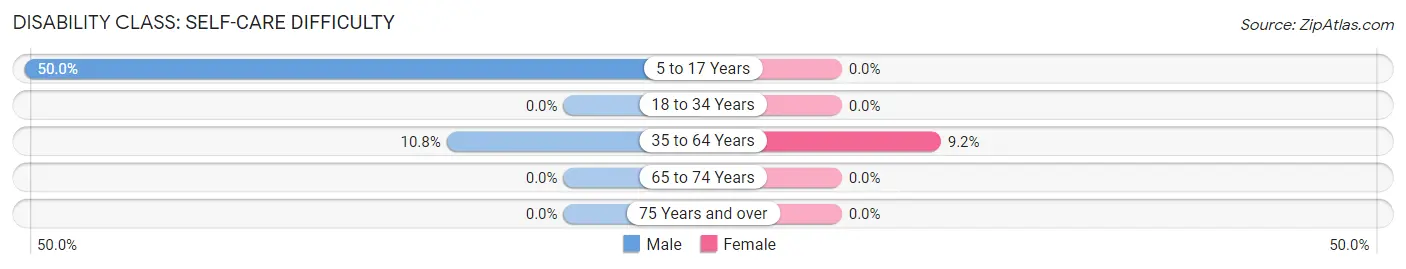
| Age Bracket | Male | Female |
| 5 to 17 Years | 50 (50.0%) | 0 (0.0%) |
| 18 to 34 Years | 0 (0.0%) | 0 (0.0%) |
| 35 to 64 Years | 36 (10.8%) | 60 (9.2%) |
| 65 to 74 Years | 0 (0.0%) | 0 (0.0%) |
| 75 Years and over | 0 (0.0%) | 0 (0.0%) |
Technology Access in Terre du Lac
Computing Device Access in Terre du Lac
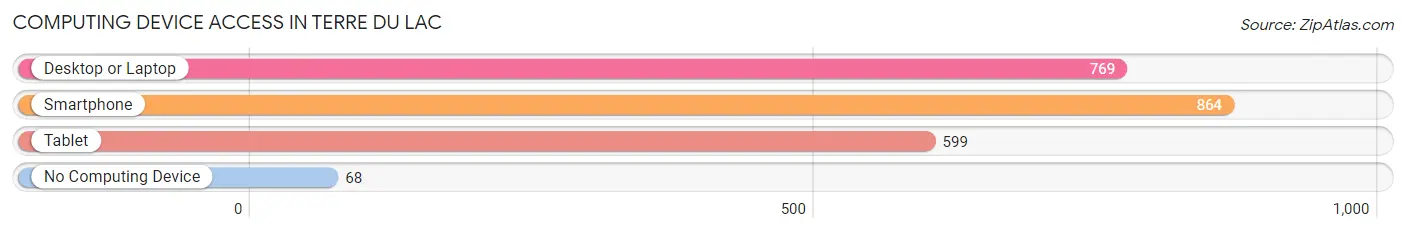
| Device Type | # Households | % Households |
| Desktop or Laptop | 769 | 82.0% |
| Smartphone | 864 | 92.1% |
| Tablet | 599 | 63.9% |
| No Computing Device | 68 | 7.2% |
| Total | 938 | 100.0% |
Internet Access in Terre du Lac
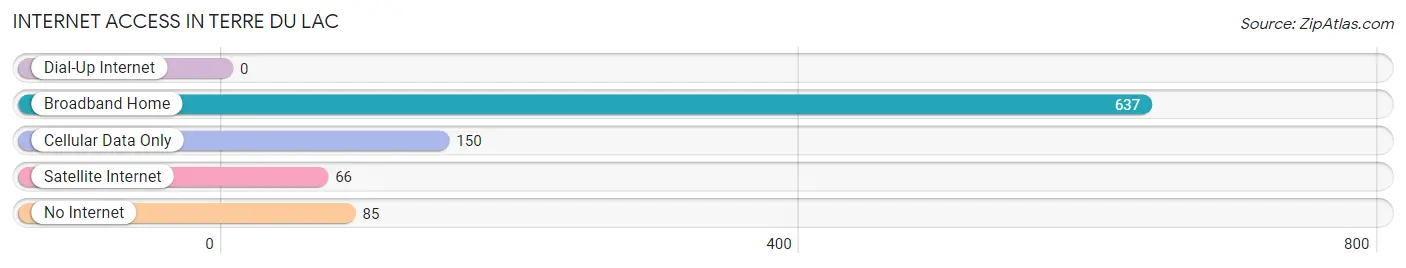
| Internet Type | # Households | % Households |
| Dial-Up Internet | 0 | 0.0% |
| Broadband Home | 637 | 67.9% |
| Cellular Data Only | 150 | 16.0% |
| Satellite Internet | 66 | 7.0% |
| No Internet | 85 | 9.1% |
| Total | 938 | 100.0% |
Terre du Lac Summary
Terre Du Lac is a small unincorporated community located in St. Francois County, Missouri. It is situated on the shores of the Big River, approximately 25 miles south of St. Louis. The population of Terre Du Lac was estimated to be 1,845 in 2019.
History
Terre Du Lac was founded in 1818 by French settlers who were looking for a place to settle and farm. The name Terre Du Lac is French for “land of the lake”, referring to the nearby Big River. The area was originally part of the Louisiana Purchase, and was later annexed by the United States in 1821.
The first settlers of Terre Du Lac were mostly French-Canadian, and the community was largely agricultural. The town was incorporated in 1837, and the first post office was established in 1845.
In the late 19th century, Terre Du Lac began to grow and develop. The town was connected to the St. Louis and Iron Mountain Railroad in 1887, and the first school was built in 1889. The town also had a hotel, a bank, and several stores.
Geography
Terre Du Lac is located in St. Francois County, Missouri. It is situated on the shores of the Big River, approximately 25 miles south of St. Louis. The town is surrounded by rolling hills and forests, and is located in the Ozark Mountains.
The climate in Terre Du Lac is humid subtropical, with hot summers and mild winters. The average annual temperature is around 60°F, and the average annual precipitation is around 40 inches.
Economy
The economy of Terre Du Lac is largely based on agriculture and tourism. The town is home to several farms, and the surrounding area is known for its production of corn, soybeans, and hay.
Tourism is also an important part of the local economy. The town is home to several parks and recreational areas, including the Big River State Park. The town also hosts several festivals and events throughout the year, including the annual Terre Du Lac Festival.
Demographics
As of 2019, the population of Terre Du Lac was estimated to be 1,845. The racial makeup of the town is predominantly white (94.3%), with small percentages of African American (2.2%), Hispanic (1.7%), and Asian (1.2%) residents.
The median household income in Terre Du Lac is $45,000, and the median home value is $125,000. The town has a poverty rate of 15.3%, and the unemployment rate is 4.2%.
Conclusion
Terre Du Lac is a small unincorporated community located in St. Francois County, Missouri. It was founded in 1818 by French settlers, and has since grown into a thriving agricultural and tourist town. The population of Terre Du Lac is estimated to be 1,845, and the town has a median household income of $45,000. The town is home to several farms and recreational areas, and hosts several festivals and events throughout the year.
Common Questions
What is Per Capita Income in Terre du Lac?
Per Capita income in Terre du Lac is $32,890.
What is the Median Family Income in Terre du Lac?
Median Family Income in Terre du Lac is $75,511.
What is the Median Household income in Terre du Lac?
Median Household Income in Terre du Lac is $75,398.
What is Income or Wage Gap in Terre du Lac?
Income or Wage Gap in Terre du Lac is 33.2%.
Women in Terre du Lac earn 66.8 cents for every dollar earned by a man.
What is Inequality or Gini Index in Terre du Lac?
Inequality or Gini Index in Terre du Lac is 0.39.
What is the Total Population of Terre du Lac?
Total Population of Terre du Lac is 2,443.
What is the Total Male Population of Terre du Lac?
Total Male Population of Terre du Lac is 1,074.
What is the Total Female Population of Terre du Lac?
Total Female Population of Terre du Lac is 1,369.
What is the Ratio of Males per 100 Females in Terre du Lac?
There are 78.45 Males per 100 Females in Terre du Lac.
What is the Ratio of Females per 100 Males in Terre du Lac?
There are 127.47 Females per 100 Males in Terre du Lac.
What is the Median Population Age in Terre du Lac?
Median Population Age in Terre du Lac is 47.1 Years.
What is the Average Family Size in Terre du Lac
Average Family Size in Terre du Lac is 2.9 People.
What is the Average Household Size in Terre du Lac
Average Household Size in Terre du Lac is 2.6 People.
How Large is the Labor Force in Terre du Lac?
There are 1,242 People in the Labor Forcein in Terre du Lac.
What is the Percentage of People in the Labor Force in Terre du Lac?
59.2% of People are in the Labor Force in Terre du Lac.
What is the Unemployment Rate in Terre du Lac?
Unemployment Rate in Terre du Lac is 5.6%.