Zip Codes with the Highest Percentage of Population with a Degree in Engineering in Florissant, MO
RELATED REPORTS & OPTIONS
Engineering
Florissant
Compare Zip Codes
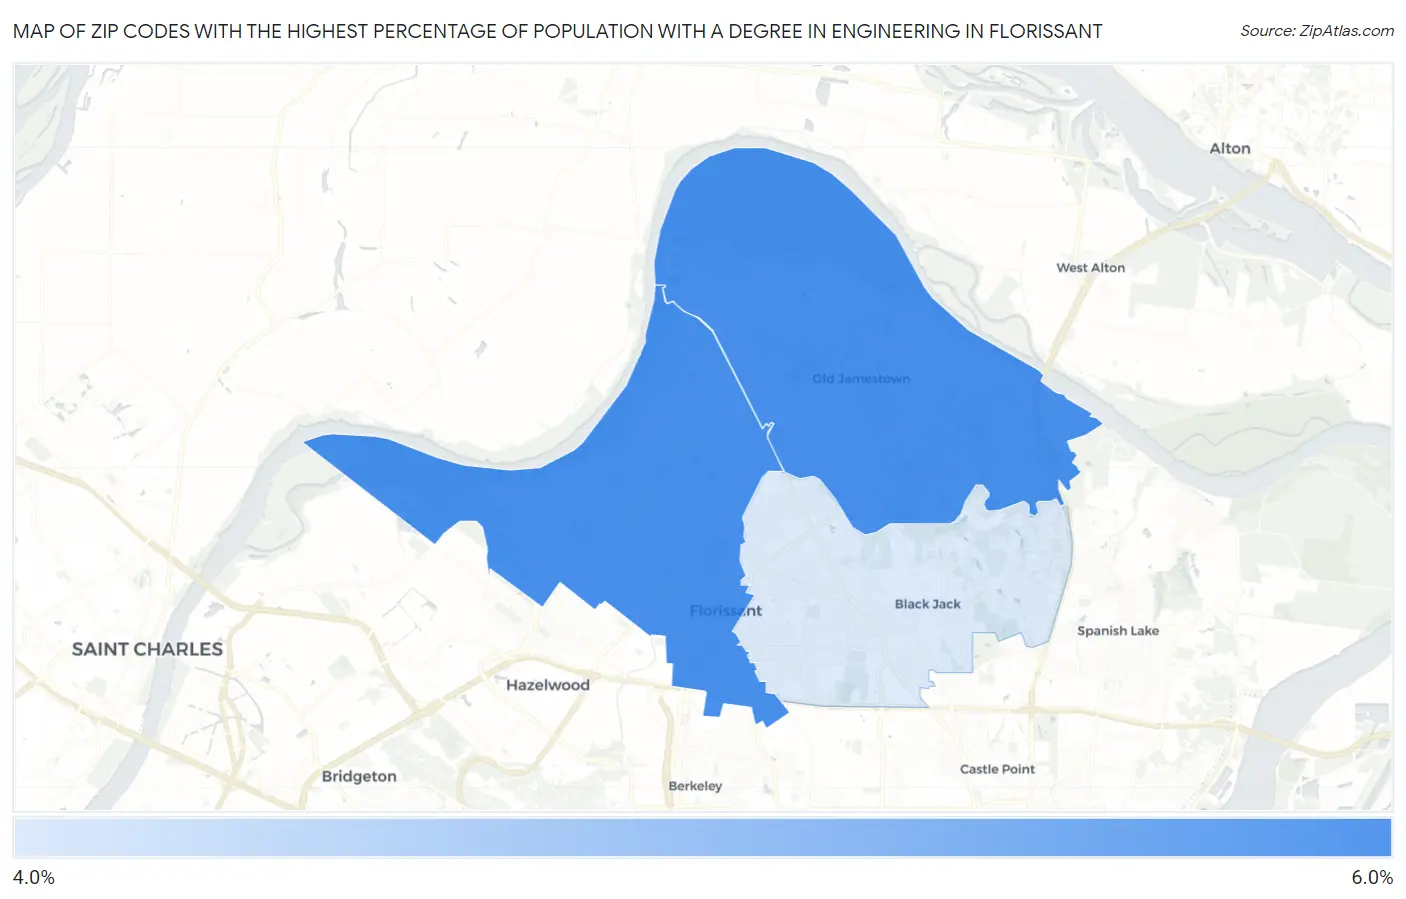
Map of Zip Codes with the Highest Percentage of Population with a Degree in Engineering in Florissant
4.4%
5.1%
Zip Codes with the Highest Percentage of Population with a Degree in Engineering in Florissant, MO
| Zip Code | % Graduates | vs State | vs National | |
| 1. | 63031 | 5.1% | 5.6%(-0.511)#268 | 7.6%(-2.59)#13,517 |
| 2. | 63034 | 5.1% | 5.6%(-0.515)#269 | 7.6%(-2.59)#13,528 |
| 3. | 63033 | 4.4% | 5.6%(-1.21)#318 | 7.6%(-3.29)#15,418 |
1
Common Questions
What are the Top Zip Codes with the Highest Percentage of Population with a Degree in Engineering in Florissant, MO?
Top Zip Codes with the Highest Percentage of Population with a Degree in Engineering in Florissant, MO are:
What zip code has the Highest Percentage of Population with a Degree in Engineering in Florissant, MO?
63031 has the Highest Percentage of Population with a Degree in Engineering in Florissant, MO with 5.1%.
What is the Percentage of Population with a Degree in Engineering in Florissant, MO?
Percentage of Population with a Degree in Engineering in Florissant is 3.9%.
What is the Percentage of Population with a Degree in Engineering in Missouri?
Percentage of Population with a Degree in Engineering in Missouri is 5.6%.
What is the Percentage of Population with a Degree in Engineering in the United States?
Percentage of Population with a Degree in Engineering in the United States is 7.6%.