Winfield, MO Map & Demographics
Winfield Map
Winfield Overview
$27,002
PER CAPITA INCOME
$72,419
AVG FAMILY INCOME
$59,598
AVG HOUSEHOLD INCOME
40.2%
WAGE / INCOME GAP [ % ]
59.8¢/ $1
WAGE / INCOME GAP [ $ ]
0.39
INEQUALITY / GINI INDEX
1,722
TOTAL POPULATION
949
MALE POPULATION
773
FEMALE POPULATION
122.77
MALES / 100 FEMALES
81.45
FEMALES / 100 MALES
35.9
MEDIAN AGE
3.3
AVG FAMILY SIZE
2.7
AVG HOUSEHOLD SIZE
829
LABOR FORCE [ PEOPLE ]
65.1%
PERCENT IN LABOR FORCE
4.5%
UNEMPLOYMENT RATE
Winfield Zip Codes
Winfield Area Codes
Income in Winfield
Income Overview in Winfield
Per Capita Income in Winfield is $27,002, while median incomes of families and households are $72,419 and $59,598 respectively.
| Characteristic | Number | Measure |
| Per Capita Income | 1,722 | $27,002 |
| Median Family Income | 384 | $72,419 |
| Mean Family Income | 384 | $80,856 |
| Median Household Income | 623 | $59,598 |
| Mean Household Income | 623 | $70,038 |
| Income Deficit | 384 | $0 |
| Wage / Income Gap (%) | 1,722 | 40.17% |
| Wage / Income Gap ($) | 1,722 | 59.83¢ per $1 |
| Gini / Inequality Index | 1,722 | 0.39 |
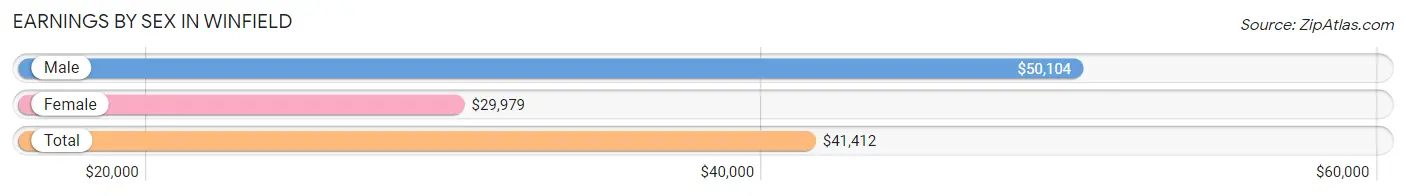
Earnings by Sex in Winfield
Average Earnings in Winfield are $41,412, $50,104 for men and $29,979 for women, a difference of 40.2%.
| Sex | Number | Average Earnings |
| Male | 417 (50.7%) | $50,104 |
| Female | 405 (49.3%) | $29,979 |
| Total | 822 (100.0%) | $41,412 |
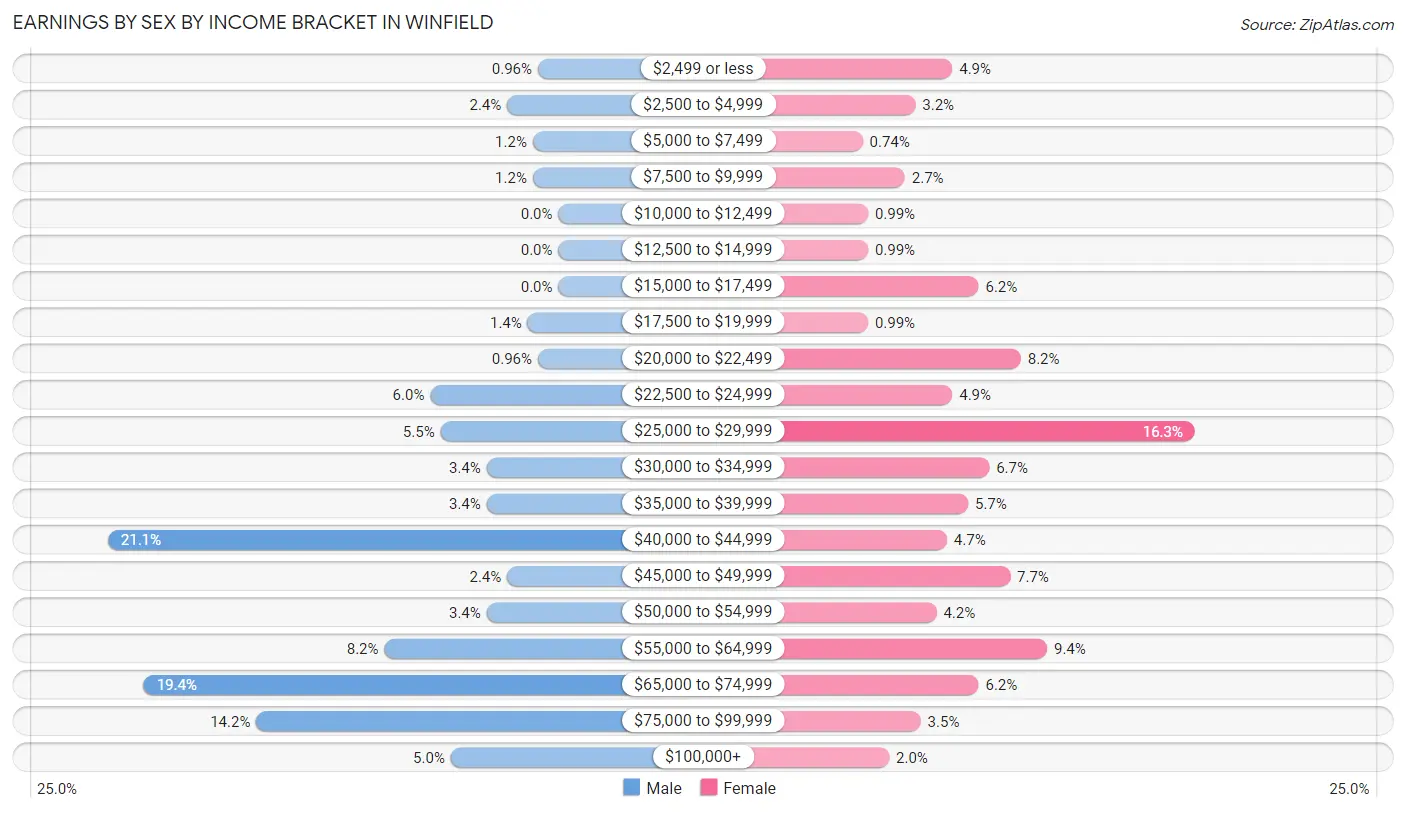
Earnings by Sex by Income Bracket in Winfield
The most common earnings brackets in Winfield are $40,000 to $44,999 for men (88 | 21.1%) and $25,000 to $29,999 for women (66 | 16.3%).
| Income | Male | Female |
| $2,499 or less | 4 (1.0%) | 20 (4.9%) |
| $2,500 to $4,999 | 10 (2.4%) | 13 (3.2%) |
| $5,000 to $7,499 | 5 (1.2%) | 3 (0.7%) |
| $7,500 to $9,999 | 5 (1.2%) | 11 (2.7%) |
| $10,000 to $12,499 | 0 (0.0%) | 4 (1.0%) |
| $12,500 to $14,999 | 0 (0.0%) | 4 (1.0%) |
| $15,000 to $17,499 | 0 (0.0%) | 25 (6.2%) |
| $17,500 to $19,999 | 6 (1.4%) | 4 (1.0%) |
| $20,000 to $22,499 | 4 (1.0%) | 33 (8.2%) |
| $22,500 to $24,999 | 25 (6.0%) | 20 (4.9%) |
| $25,000 to $29,999 | 23 (5.5%) | 66 (16.3%) |
| $30,000 to $34,999 | 14 (3.4%) | 27 (6.7%) |
| $35,000 to $39,999 | 14 (3.4%) | 23 (5.7%) |
| $40,000 to $44,999 | 88 (21.1%) | 19 (4.7%) |
| $45,000 to $49,999 | 10 (2.4%) | 31 (7.6%) |
| $50,000 to $54,999 | 14 (3.4%) | 17 (4.2%) |
| $55,000 to $64,999 | 34 (8.2%) | 38 (9.4%) |
| $65,000 to $74,999 | 81 (19.4%) | 25 (6.2%) |
| $75,000 to $99,999 | 59 (14.1%) | 14 (3.5%) |
| $100,000+ | 21 (5.0%) | 8 (2.0%) |
| Total | 417 (100.0%) | 405 (100.0%) |
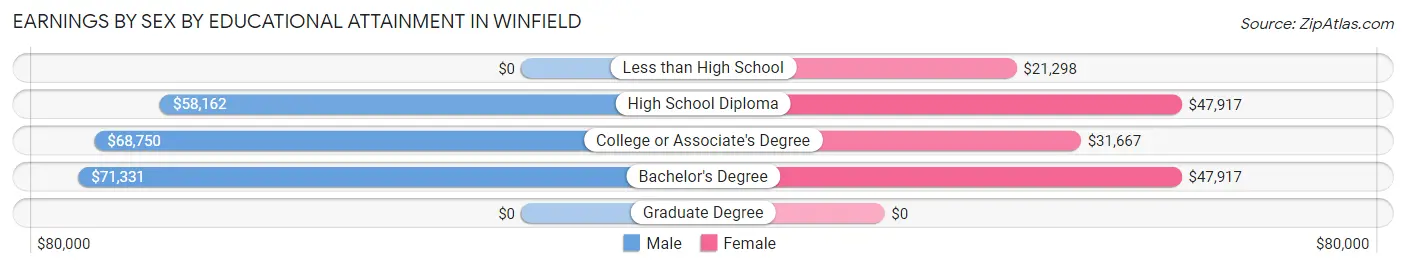
Earnings by Sex by Educational Attainment in Winfield
Average earnings in Winfield are $64,750 for men and $32,153 for women, a difference of 50.3%. Men with an educational attainment of bachelor's degree enjoy the highest average annual earnings of $71,331, while those with high school diploma education earn the least with $58,162. Women with an educational attainment of high school diploma earn the most with the average annual earnings of $47,917, while those with less than high school education have the smallest earnings of $21,298.
| Educational Attainment | Male Income | Female Income |
| Less than High School | - | - |
| High School Diploma | $58,162 | $47,917 |
| College or Associate's Degree | $68,750 | $31,667 |
| Bachelor's Degree | $71,331 | $47,917 |
| Graduate Degree | - | - |
| Total | $64,750 | $32,153 |
Family Income in Winfield
Family Income Brackets in Winfield
According to the Winfield family income data, there are 112 families falling into the $100,000 to $149,999 income range, which is the most common income bracket and makes up 29.2% of all families. Conversely, the $10,000 to $14,999 income bracket is the least frequent group with only 5 families (1.3%) belonging to this category.
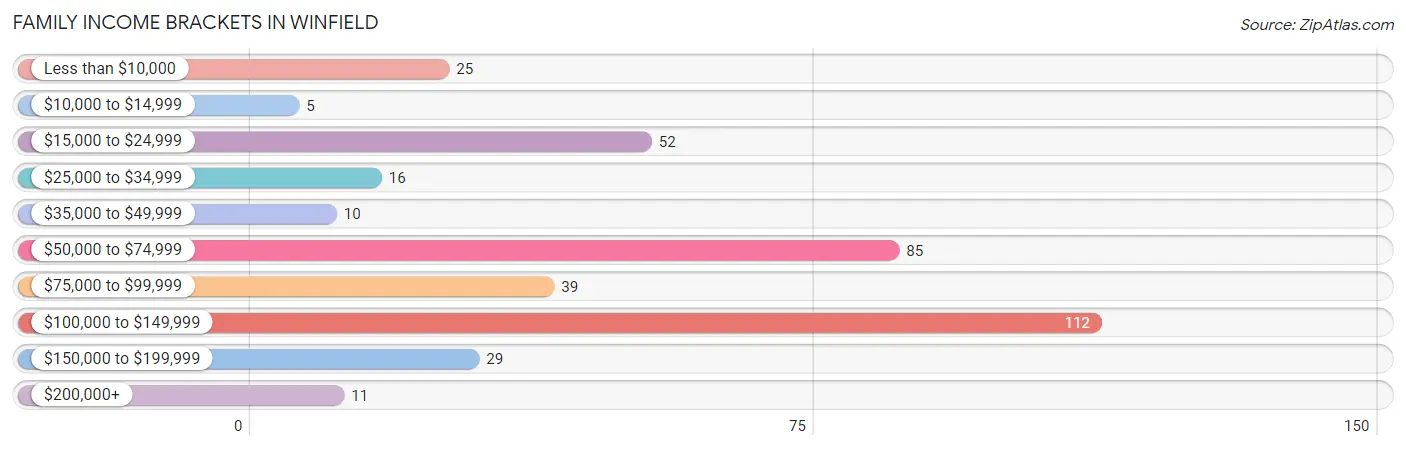
| Income Bracket | # Families | % Families |
| Less than $10,000 | 25 | 6.5% |
| $10,000 to $14,999 | 5 | 1.3% |
| $15,000 to $24,999 | 52 | 13.5% |
| $25,000 to $34,999 | 16 | 4.2% |
| $35,000 to $49,999 | 10 | 2.6% |
| $50,000 to $74,999 | 85 | 22.1% |
| $75,000 to $99,999 | 39 | 10.2% |
| $100,000 to $149,999 | 112 | 29.2% |
| $150,000 to $199,999 | 29 | 7.6% |
| $200,000+ | 11 | 2.9% |
Family Income by Famaliy Size in Winfield
4-person families (44 | 11.5%) account for the highest median family income in Winfield with $126,667 per family, while 4-person families (44 | 11.5%) have the highest median income of $31,667 per family member.
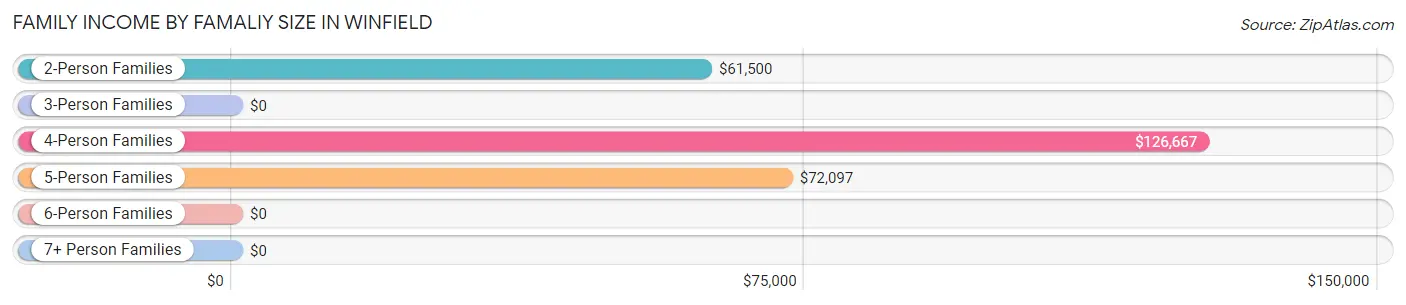
| Income Bracket | # Families | Median Income |
| 2-Person Families | 132 (34.4%) | $61,500 |
| 3-Person Families | 131 (34.1%) | $0 |
| 4-Person Families | 44 (11.5%) | $126,667 |
| 5-Person Families | 60 (15.6%) | $72,097 |
| 6-Person Families | 4 (1.0%) | $0 |
| 7+ Person Families | 13 (3.4%) | $0 |
| Total | 384 (100.0%) | $72,419 |
Family Income by Number of Earners in Winfield
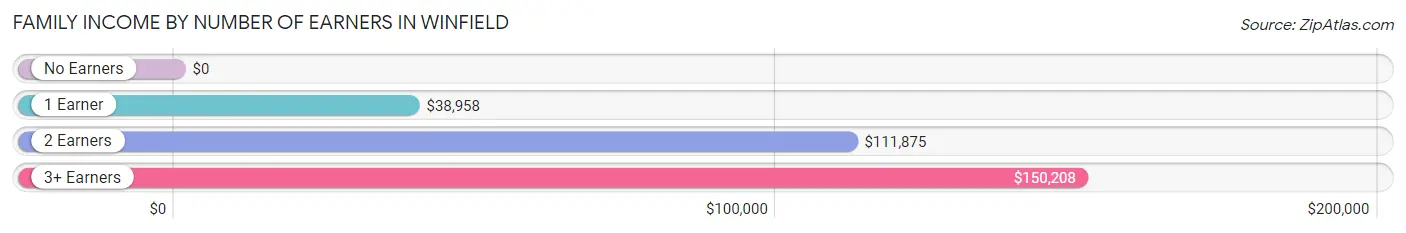
| Number of Earners | # Families | Median Income |
| No Earners | 35 (9.1%) | $0 |
| 1 Earner | 177 (46.1%) | $38,958 |
| 2 Earners | 140 (36.5%) | $111,875 |
| 3+ Earners | 32 (8.3%) | $150,208 |
| Total | 384 (100.0%) | $72,419 |
Household Income in Winfield
Household Income Brackets in Winfield
With 135 households falling in the category, the $100,000 to $149,999 income range is the most frequent in Winfield, accounting for 21.7% of all households. In contrast, only 13 households (2.1%) fall into the $200,000+ income bracket, making it the least populous group.
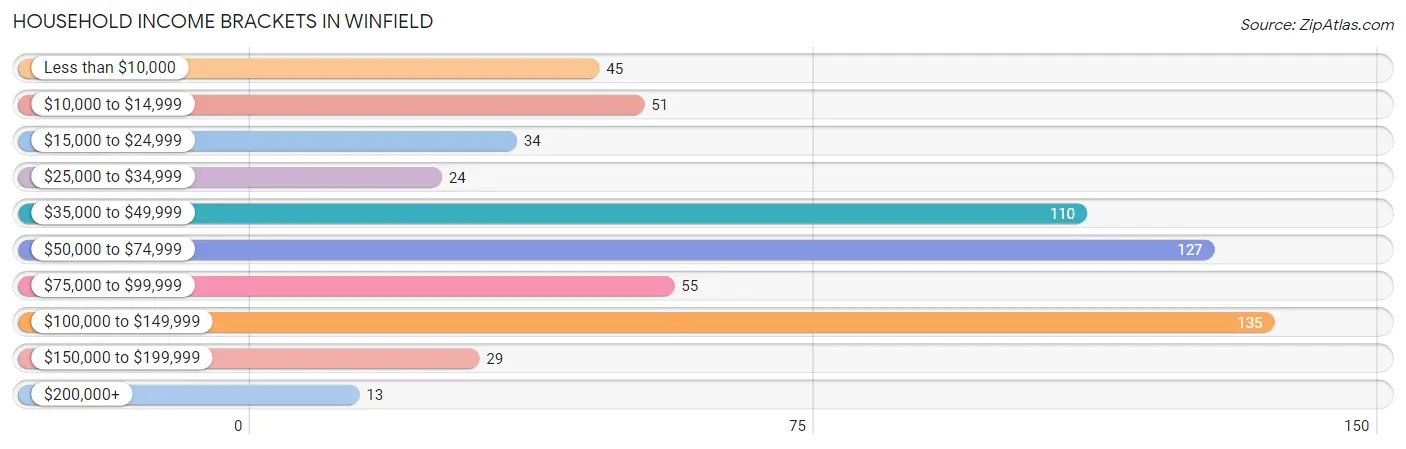
| Income Bracket | # Households | % Households |
| Less than $10,000 | 45 | 7.2% |
| $10,000 to $14,999 | 51 | 8.2% |
| $15,000 to $24,999 | 34 | 5.5% |
| $25,000 to $34,999 | 24 | 3.9% |
| $35,000 to $49,999 | 110 | 17.7% |
| $50,000 to $74,999 | 127 | 20.4% |
| $75,000 to $99,999 | 55 | 8.8% |
| $100,000 to $149,999 | 135 | 21.7% |
| $150,000 to $199,999 | 29 | 4.7% |
| $200,000+ | 13 | 2.1% |
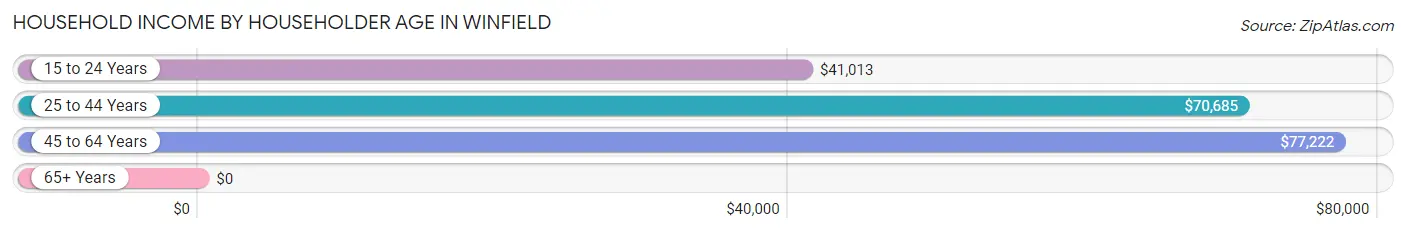
Household Income by Householder Age in Winfield
The median household income in Winfield is $59,598, with the highest median household income of $77,222 found in the 45 to 64 years age bracket for the primary householder. A total of 176 households (28.2%) fall into this category. Meanwhile, the 65+ years age bracket for the primary householder has the lowest median household income of $0, with 141 households (22.6%) in this group.
| Income Bracket | # Households | Median Income |
| 15 to 24 Years | 87 (14.0%) | $41,013 |
| 25 to 44 Years | 219 (35.1%) | $70,685 |
| 45 to 64 Years | 176 (28.2%) | $77,222 |
| 65+ Years | 141 (22.6%) | $0 |
| Total | 623 (100.0%) | $59,598 |
Poverty in Winfield
Income Below Poverty by Sex and Age in Winfield
With 18.3% poverty level for males and 17.5% for females among the residents of Winfield, 15 year old males and 75 year old and over females are the most vulnerable to poverty, with 34 males (79.1%) and 13 females (32.5%) in their respective age groups living below the poverty level.
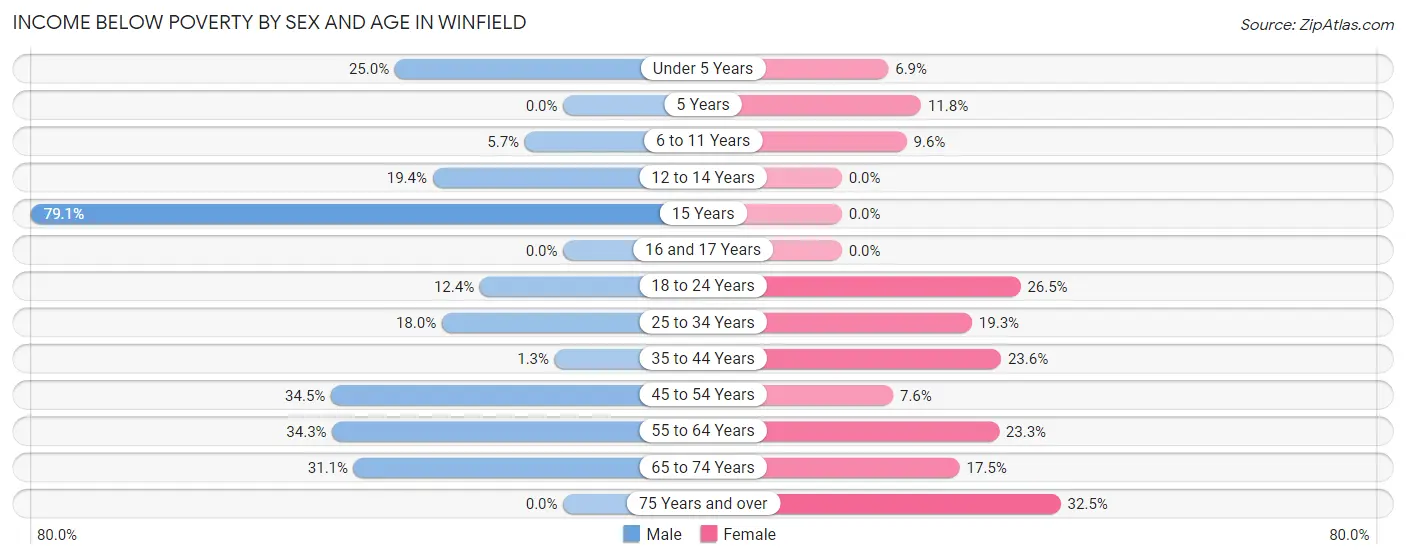
| Age Bracket | Male | Female |
| Under 5 Years | 7 (25.0%) | 2 (6.9%) |
| 5 Years | 0 (0.0%) | 4 (11.8%) |
| 6 to 11 Years | 6 (5.7%) | 5 (9.6%) |
| 12 to 14 Years | 19 (19.4%) | 0 (0.0%) |
| 15 Years | 34 (79.1%) | 0 (0.0%) |
| 16 and 17 Years | 0 (0.0%) | 0 (0.0%) |
| 18 to 24 Years | 13 (12.4%) | 13 (26.5%) |
| 25 to 34 Years | 20 (18.0%) | 17 (19.3%) |
| 35 to 44 Years | 2 (1.3%) | 39 (23.6%) |
| 45 to 54 Years | 20 (34.5%) | 7 (7.6%) |
| 55 to 64 Years | 36 (34.3%) | 21 (23.3%) |
| 65 to 74 Years | 14 (31.1%) | 14 (17.5%) |
| 75 Years and over | 0 (0.0%) | 13 (32.5%) |
| Total | 171 (18.3%) | 135 (17.5%) |
Income Above Poverty by Sex and Age in Winfield
According to the poverty statistics in Winfield, males aged 5 years and females aged 12 to 14 years are the age groups that are most secure financially, with 100.0% of males and 100.0% of females in these age groups living above the poverty line.
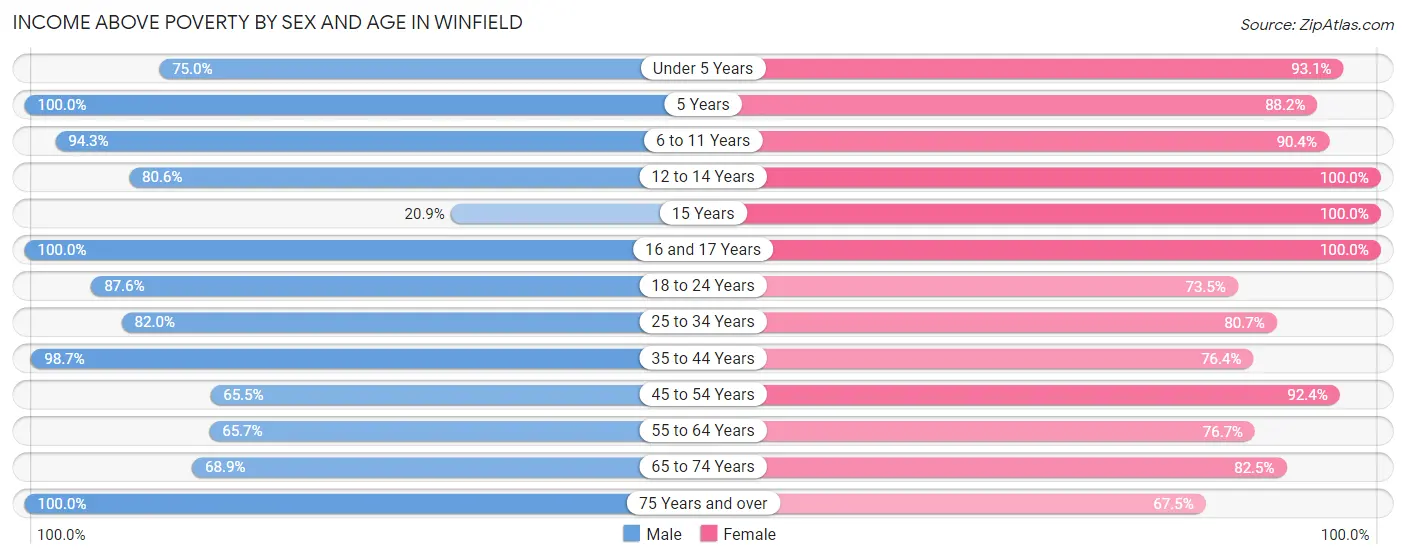
| Age Bracket | Male | Female |
| Under 5 Years | 21 (75.0%) | 27 (93.1%) |
| 5 Years | 11 (100.0%) | 30 (88.2%) |
| 6 to 11 Years | 99 (94.3%) | 47 (90.4%) |
| 12 to 14 Years | 79 (80.6%) | 20 (100.0%) |
| 15 Years | 9 (20.9%) | 12 (100.0%) |
| 16 and 17 Years | 19 (100.0%) | 22 (100.0%) |
| 18 to 24 Years | 92 (87.6%) | 36 (73.5%) |
| 25 to 34 Years | 91 (82.0%) | 71 (80.7%) |
| 35 to 44 Years | 157 (98.7%) | 126 (76.4%) |
| 45 to 54 Years | 38 (65.5%) | 85 (92.4%) |
| 55 to 64 Years | 69 (65.7%) | 69 (76.7%) |
| 65 to 74 Years | 31 (68.9%) | 66 (82.5%) |
| 75 Years and over | 45 (100.0%) | 27 (67.5%) |
| Total | 761 (81.7%) | 638 (82.5%) |
Income Below Poverty Among Married-Couple Families in Winfield
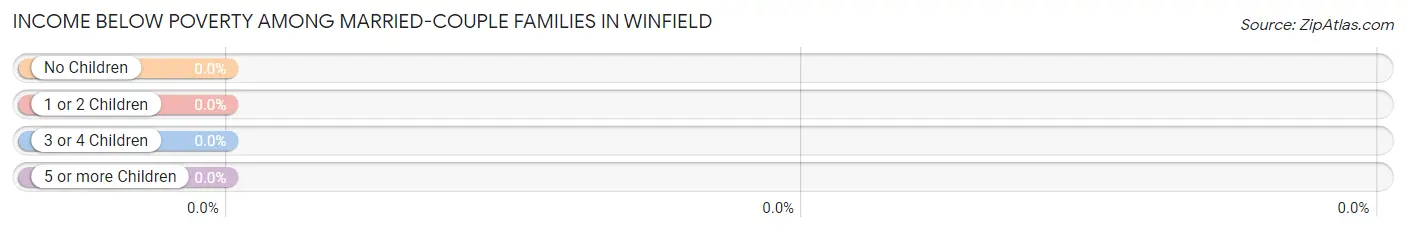
| Children | Above Poverty | Below Poverty |
| No Children | 105 (100.0%) | 0 (0.0%) |
| 1 or 2 Children | 79 (100.0%) | 0 (0.0%) |
| 3 or 4 Children | 52 (100.0%) | 0 (0.0%) |
| 5 or more Children | 13 (100.0%) | 0 (0.0%) |
| Total | 249 (100.0%) | 0 (0.0%) |
Income Below Poverty Among Single-Parent Households in Winfield
According to the poverty data in Winfield, 40.7% or 11 single-father households and 53.7% or 58 single-mother households are living below the poverty line. Among single-father households, those with 1 or 2 children have the highest poverty rate, with 11 households (73.3%) experiencing poverty. Likewise, among single-mother households, those with 1 or 2 children have the highest poverty rate, with 49 households (63.6%) falling below the poverty line.
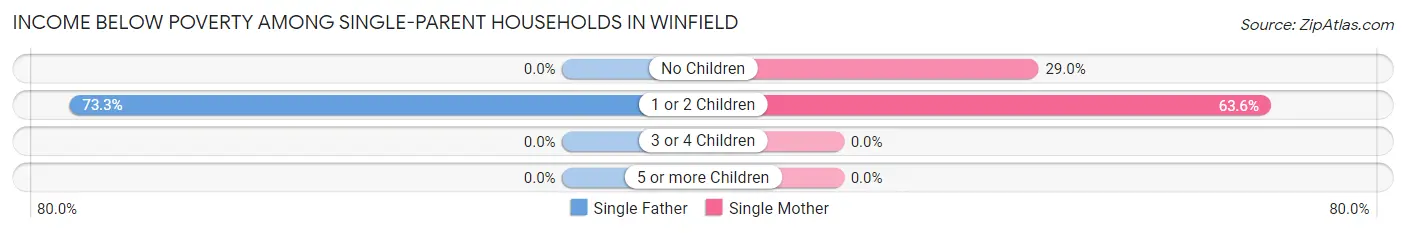
| Children | Single Father | Single Mother |
| No Children | 0 (0.0%) | 9 (29.0%) |
| 1 or 2 Children | 11 (73.3%) | 49 (63.6%) |
| 3 or 4 Children | 0 (0.0%) | 0 (0.0%) |
| 5 or more Children | 0 (0.0%) | 0 (0.0%) |
| Total | 11 (40.7%) | 58 (53.7%) |
Income Below Poverty Among Married-Couple vs Single-Parent Households in Winfield
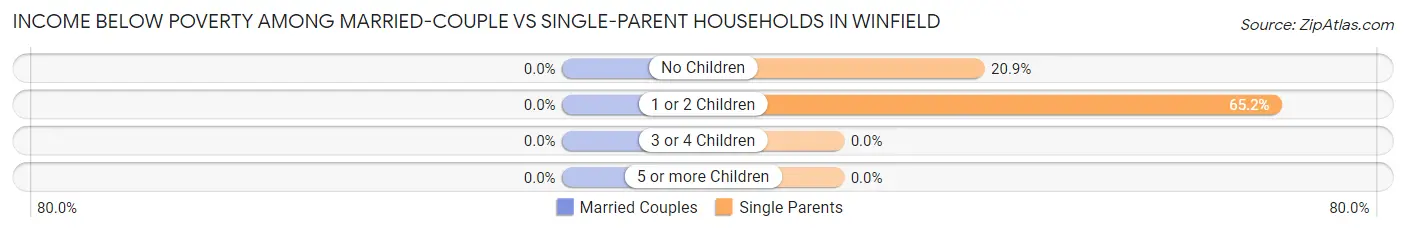
| Children | Married-Couple Families | Single-Parent Households |
| No Children | 0 (0.0%) | 9 (20.9%) |
| 1 or 2 Children | 0 (0.0%) | 60 (65.2%) |
| 3 or 4 Children | 0 (0.0%) | 0 (0.0%) |
| 5 or more Children | 0 (0.0%) | 0 (0.0%) |
| Total | 0 (0.0%) | 69 (51.1%) |
Race in Winfield
The most populous races in Winfield are White / Caucasian (1,627 | 94.5%), Hispanic or Latino (44 | 2.6%), and Two or more Races (42 | 2.4%).
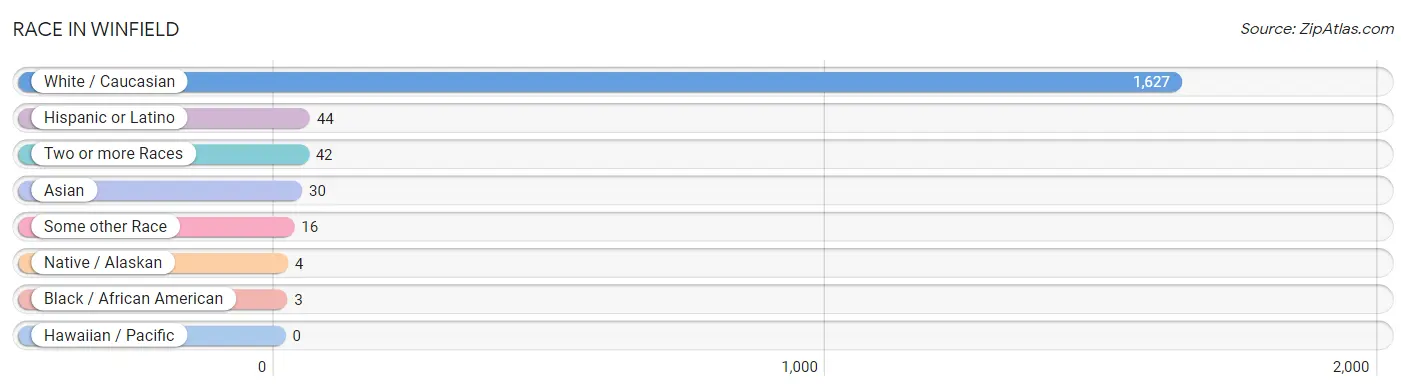
| Race | # Population | % Population |
| Asian | 30 | 1.7% |
| Black / African American | 3 | 0.2% |
| Hawaiian / Pacific | 0 | 0.0% |
| Hispanic or Latino | 44 | 2.6% |
| Native / Alaskan | 4 | 0.2% |
| White / Caucasian | 1,627 | 94.5% |
| Two or more Races | 42 | 2.4% |
| Some other Race | 16 | 0.9% |
| Total | 1,722 | 100.0% |
Ancestry in Winfield
The most populous ancestries reported in Winfield are German (439 | 25.5%), English (329 | 19.1%), Irish (222 | 12.9%), American (116 | 6.7%), and Italian (83 | 4.8%), together accounting for 69.1% of all Winfield residents.
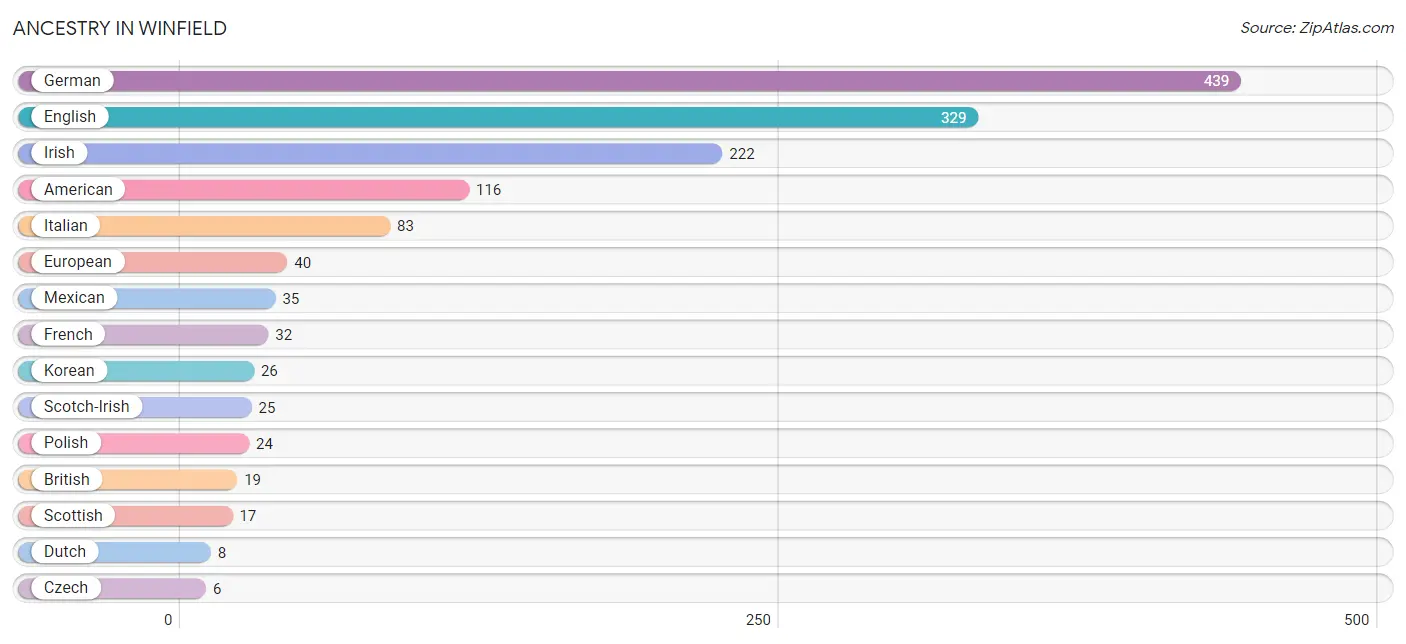
| Ancestry | # Population | % Population |
| American | 116 | 6.7% |
| Belgian | 4 | 0.2% |
| Blackfeet | 2 | 0.1% |
| British | 19 | 1.1% |
| Burmese | 4 | 0.2% |
| Central American | 4 | 0.2% |
| Cherokee | 5 | 0.3% |
| Cuban | 3 | 0.2% |
| Czech | 6 | 0.4% |
| Dutch | 8 | 0.5% |
| English | 329 | 19.1% |
| European | 40 | 2.3% |
| French | 32 | 1.9% |
| German | 439 | 25.5% |
| Guatemalan | 4 | 0.2% |
| Irish | 222 | 12.9% |
| Italian | 83 | 4.8% |
| Korean | 26 | 1.5% |
| Mexican | 35 | 2.0% |
| Northern European | 5 | 0.3% |
| Polish | 24 | 1.4% |
| Puerto Rican | 2 | 0.1% |
| Russian | 6 | 0.4% |
| Scandinavian | 5 | 0.3% |
| Scotch-Irish | 25 | 1.5% |
| Scottish | 17 | 1.0% | View All 26 Rows |
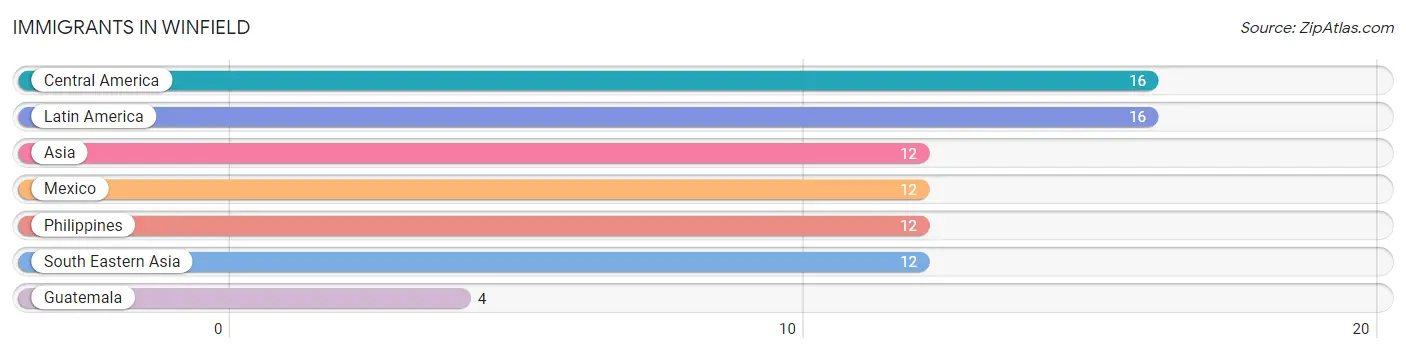
Immigrants in Winfield
The most numerous immigrant groups reported in Winfield came from Central America (16 | 0.9%), Latin America (16 | 0.9%), Asia (12 | 0.7%), Mexico (12 | 0.7%), and Philippines (12 | 0.7%), together accounting for 4.0% of all Winfield residents.
| Immigration Origin | # Population | % Population |
| Asia | 12 | 0.7% |
| Central America | 16 | 0.9% |
| Guatemala | 4 | 0.2% |
| Latin America | 16 | 0.9% |
| Mexico | 12 | 0.7% |
| Philippines | 12 | 0.7% |
| South Eastern Asia | 12 | 0.7% | View All 7 Rows |
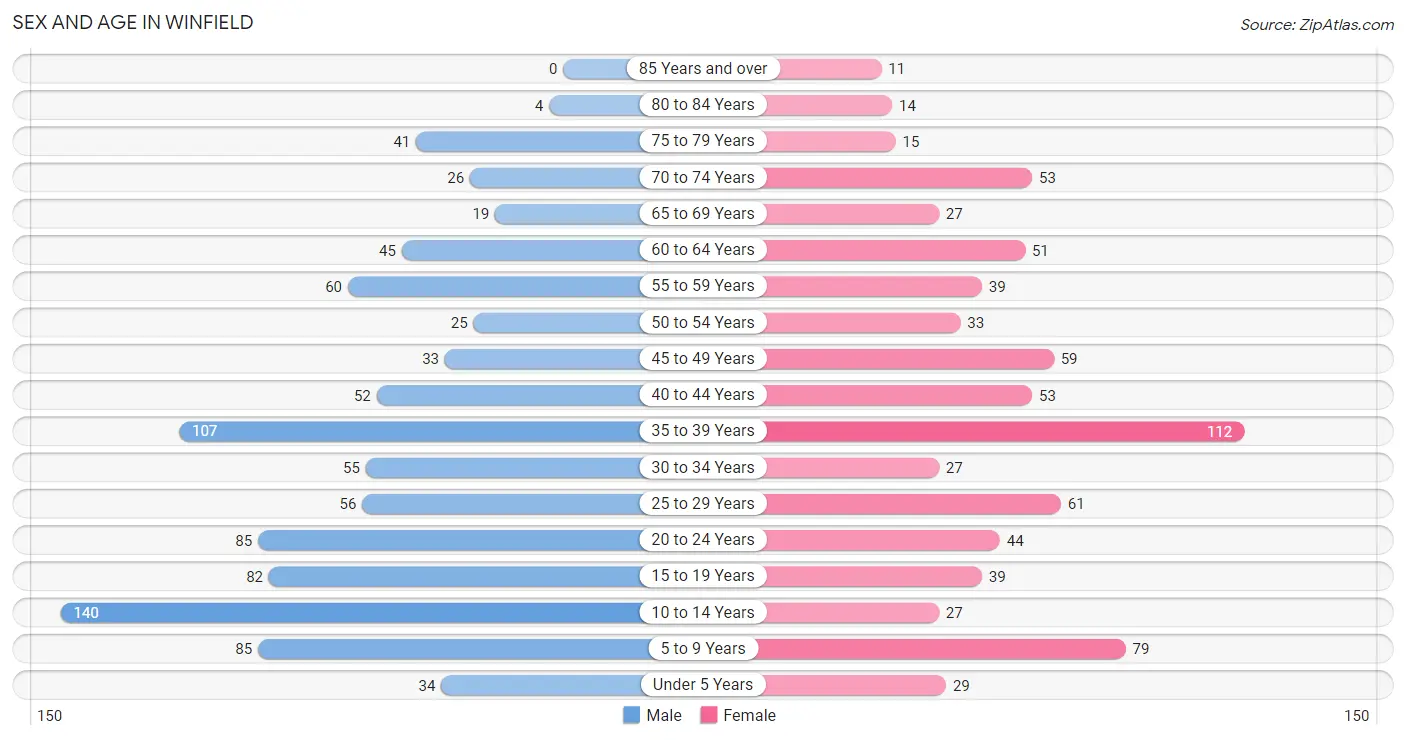
Sex and Age in Winfield
Sex and Age in Winfield
The most populous age groups in Winfield are 10 to 14 Years (140 | 14.7%) for men and 35 to 39 Years (112 | 14.5%) for women.
| Age Bracket | Male | Female |
| Under 5 Years | 34 (3.6%) | 29 (3.7%) |
| 5 to 9 Years | 85 (9.0%) | 79 (10.2%) |
| 10 to 14 Years | 140 (14.7%) | 27 (3.5%) |
| 15 to 19 Years | 82 (8.6%) | 39 (5.1%) |
| 20 to 24 Years | 85 (9.0%) | 44 (5.7%) |
| 25 to 29 Years | 56 (5.9%) | 61 (7.9%) |
| 30 to 34 Years | 55 (5.8%) | 27 (3.5%) |
| 35 to 39 Years | 107 (11.3%) | 112 (14.5%) |
| 40 to 44 Years | 52 (5.5%) | 53 (6.9%) |
| 45 to 49 Years | 33 (3.5%) | 59 (7.6%) |
| 50 to 54 Years | 25 (2.6%) | 33 (4.3%) |
| 55 to 59 Years | 60 (6.3%) | 39 (5.1%) |
| 60 to 64 Years | 45 (4.7%) | 51 (6.6%) |
| 65 to 69 Years | 19 (2.0%) | 27 (3.5%) |
| 70 to 74 Years | 26 (2.7%) | 53 (6.9%) |
| 75 to 79 Years | 41 (4.3%) | 15 (1.9%) |
| 80 to 84 Years | 4 (0.4%) | 14 (1.8%) |
| 85 Years and over | 0 (0.0%) | 11 (1.4%) |
| Total | 949 (100.0%) | 773 (100.0%) |
Families and Households in Winfield
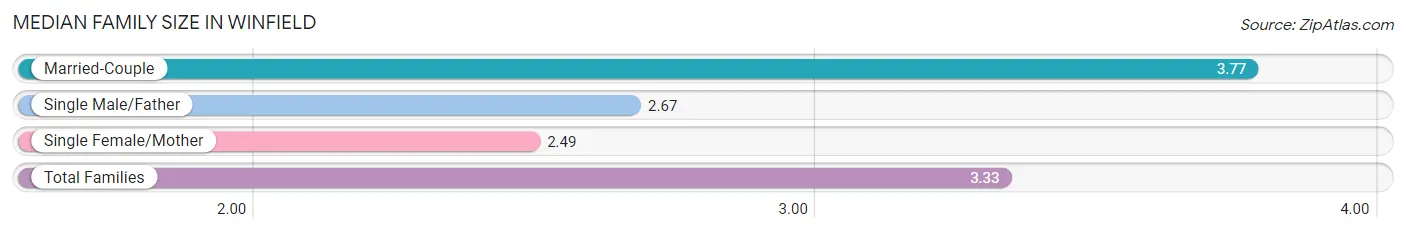
Median Family Size in Winfield
The median family size in Winfield is 3.33 persons per family, with married-couple families (249 | 64.8%) accounting for the largest median family size of 3.77 persons per family. On the other hand, single female/mother families (108 | 28.1%) represent the smallest median family size with 2.49 persons per family.
| Family Type | # Families | Family Size |
| Married-Couple | 249 (64.8%) | 3.77 |
| Single Male/Father | 27 (7.0%) | 2.67 |
| Single Female/Mother | 108 (28.1%) | 2.49 |
| Total Families | 384 (100.0%) | 3.33 |
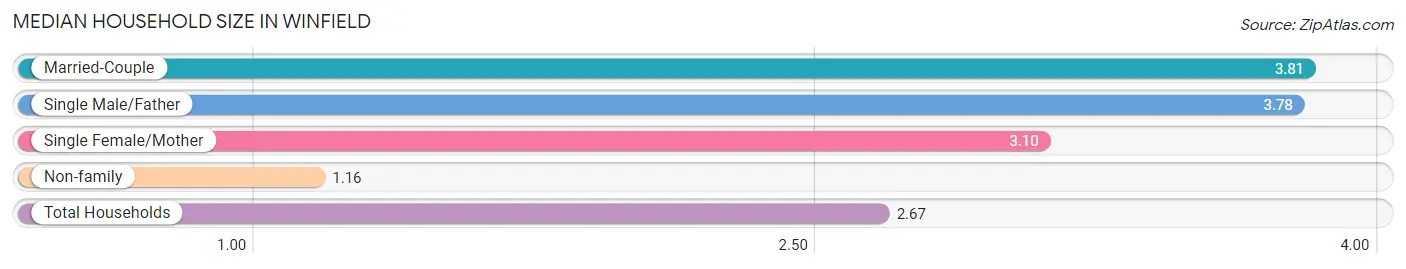
Median Household Size in Winfield
The median household size in Winfield is 2.67 persons per household, with married-couple households (249 | 40.0%) accounting for the largest median household size of 3.81 persons per household. non-family households (239 | 38.4%) represent the smallest median household size with 1.16 persons per household.
| Household Type | # Households | Household Size |
| Married-Couple | 249 (40.0%) | 3.81 |
| Single Male/Father | 27 (4.3%) | 3.78 |
| Single Female/Mother | 108 (17.3%) | 3.10 |
| Non-family | 239 (38.4%) | 1.16 |
| Total Households | 623 (100.0%) | 2.67 |
Household Size by Marriage Status in Winfield
Out of a total of 623 households in Winfield, 384 (61.6%) are family households, while 239 (38.4%) are nonfamily households. The most numerous type of family households are 3-person households, comprising 122, and the most common type of nonfamily households are 1-person households, comprising 210.
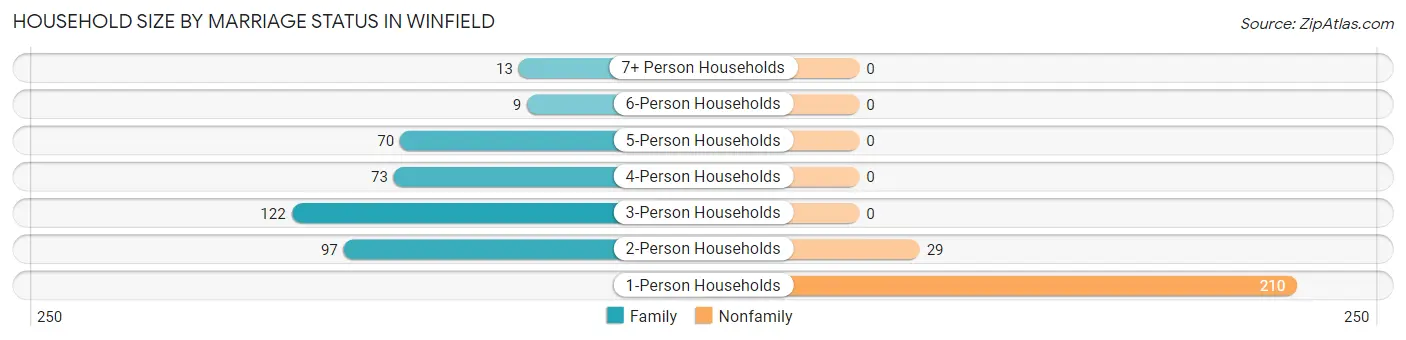
| Household Size | Family Households | Nonfamily Households |
| 1-Person Households | - | 210 (33.7%) |
| 2-Person Households | 97 (15.6%) | 29 (4.6%) |
| 3-Person Households | 122 (19.6%) | 0 (0.0%) |
| 4-Person Households | 73 (11.7%) | 0 (0.0%) |
| 5-Person Households | 70 (11.2%) | 0 (0.0%) |
| 6-Person Households | 9 (1.4%) | 0 (0.0%) |
| 7+ Person Households | 13 (2.1%) | 0 (0.0%) |
| Total | 384 (61.6%) | 239 (38.4%) |
Female Fertility in Winfield
Fertility by Age in Winfield
Average fertility rate in Winfield is 50.0 births per 1,000 women. Women in the age bracket of 20 to 34 years have the highest fertility rate with 152.0 births per 1,000 women. Women in the age bracket of 20 to 34 years acount for 100.0% of all women with births.
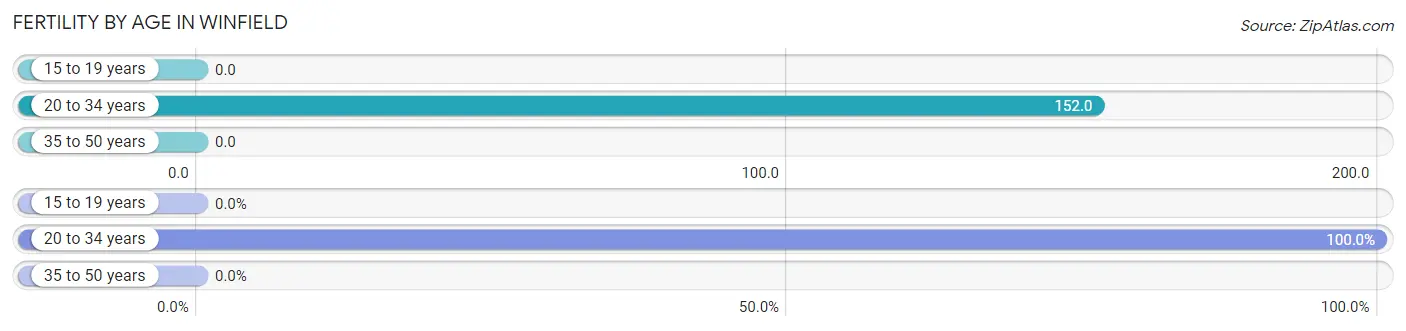
| Age Bracket | Women with Births | Births / 1,000 Women |
| 15 to 19 years | 0 (0.0%) | 0.0 |
| 20 to 34 years | 20 (100.0%) | 152.0 |
| 35 to 50 years | 0 (0.0%) | 0.0 |
| Total | 20 (100.0%) | 50.0 |
Fertility by Age by Marriage Status in Winfield
35.0% of women with births (20) in Winfield are married. The highest percentage of unmarried women with births falls into 20 to 34 years age bracket with 65.0% of them unmarried at the time of birth, while the lowest percentage of unmarried women with births belong to 20 to 34 years age bracket with 65.0% of them unmarried.
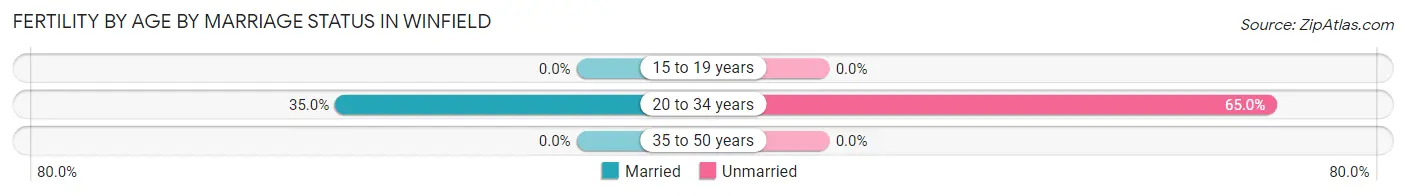
| Age Bracket | Married | Unmarried |
| 15 to 19 years | 0 (0.0%) | 0 (0.0%) |
| 20 to 34 years | 7 (35.0%) | 13 (65.0%) |
| 35 to 50 years | 0 (0.0%) | 0 (0.0%) |
| Total | 7 (35.0%) | 13 (65.0%) |
Fertility by Education in Winfield
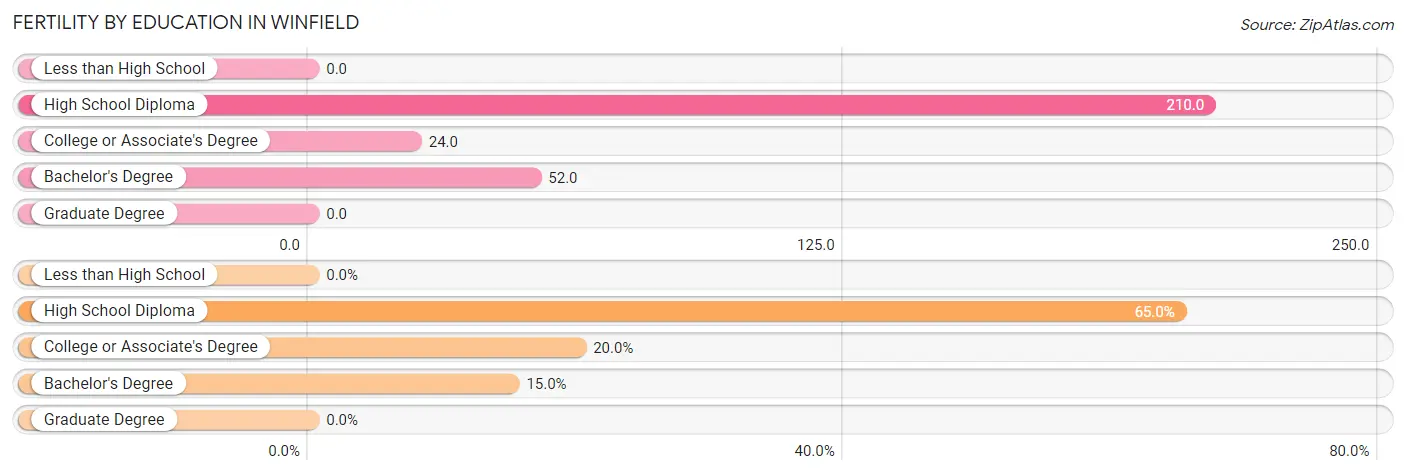
| Educational Attainment | Women with Births | Births / 1,000 Women |
| Less than High School | 0 (0.0%) | 0.0 |
| High School Diploma | 13 (65.0%) | 210.0 |
| College or Associate's Degree | 4 (20.0%) | 24.0 |
| Bachelor's Degree | 3 (15.0%) | 52.0 |
| Graduate Degree | 0 (0.0%) | 0.0 |
| Total | 20 (100.0%) | 50.0 |
Fertility by Education by Marriage Status in Winfield
65.0% of women with births in Winfield are unmarried. Women with the educational attainment of college or associate's degree are most likely to be married with 100.0% of them married at childbirth, while women with the educational attainment of high school diploma are least likely to be married with 100.0% of them unmarried at childbirth.
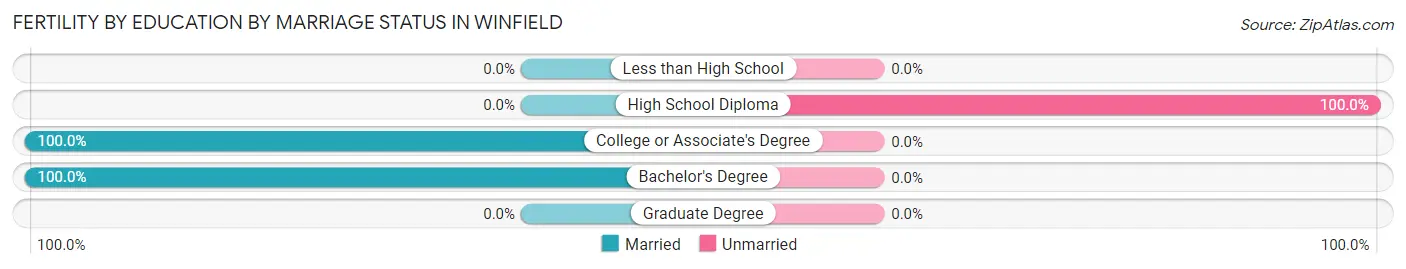
| Educational Attainment | Married | Unmarried |
| Less than High School | 0 (0.0%) | 0 (0.0%) |
| High School Diploma | 0 (0.0%) | 13 (100.0%) |
| College or Associate's Degree | 4 (100.0%) | 0 (0.0%) |
| Bachelor's Degree | 3 (100.0%) | 0 (0.0%) |
| Graduate Degree | 0 (0.0%) | 0 (0.0%) |
| Total | 7 (35.0%) | 13 (65.0%) |
Employment Characteristics in Winfield
Employment by Class of Employer in Winfield
Among the 787 employed individuals in Winfield, private company employees (636 | 80.8%), local government employees (58 | 7.4%), and not-for-profit organizations (49 | 6.2%) make up the most common classes of employment.
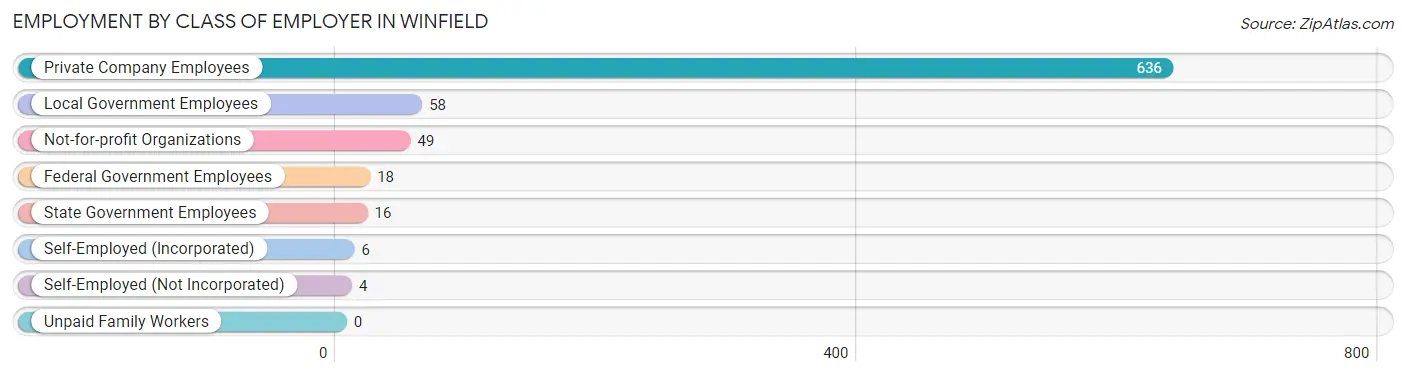
| Employer Class | # Employees | % Employees |
| Private Company Employees | 636 | 80.8% |
| Self-Employed (Incorporated) | 6 | 0.8% |
| Self-Employed (Not Incorporated) | 4 | 0.5% |
| Not-for-profit Organizations | 49 | 6.2% |
| Local Government Employees | 58 | 7.4% |
| State Government Employees | 16 | 2.0% |
| Federal Government Employees | 18 | 2.3% |
| Unpaid Family Workers | 0 | 0.0% |
| Total | 787 | 100.0% |
Employment Status by Age in Winfield
According to the labor force statistics for Winfield, out of the total population over 16 years of age (1,273), 65.1% or 829 individuals are in the labor force, with 4.5% or 37 of them unemployed. The age group with the highest labor force participation rate is 25 to 29 years, with 100.0% or 117 individuals in the labor force. Within the labor force, the 16 to 19 years age range has the highest percentage of unemployed individuals, with 18.5% or 5 of them being unemployed.
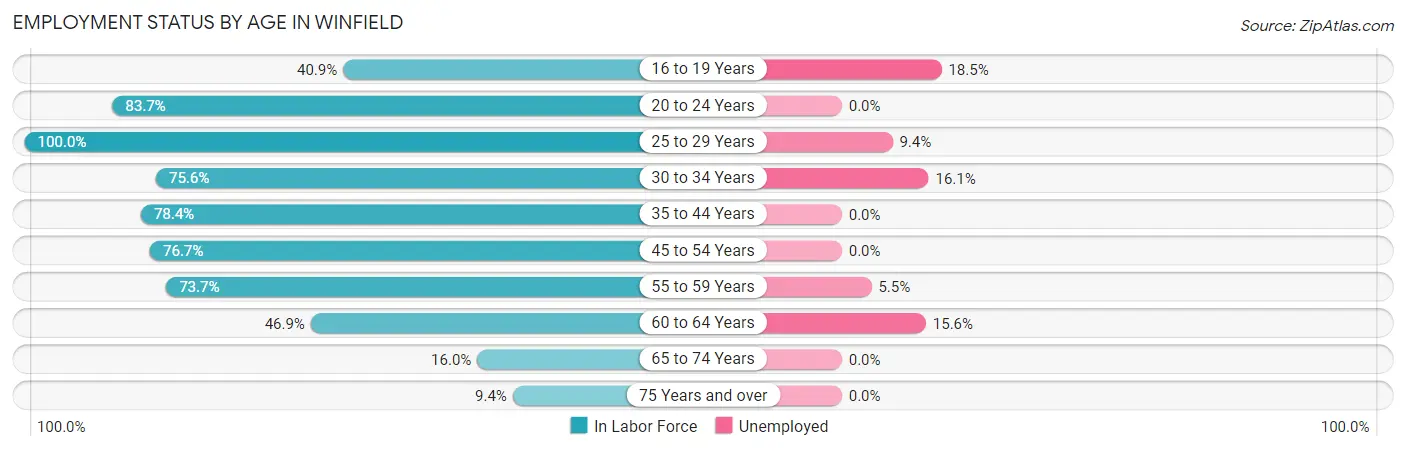
| Age Bracket | In Labor Force | Unemployed |
| 16 to 19 Years | 27 (40.9%) | 5 (18.5%) |
| 20 to 24 Years | 108 (83.7%) | 0 (0.0%) |
| 25 to 29 Years | 117 (100.0%) | 11 (9.4%) |
| 30 to 34 Years | 62 (75.6%) | 10 (16.1%) |
| 35 to 44 Years | 254 (78.4%) | 0 (0.0%) |
| 45 to 54 Years | 115 (76.7%) | 0 (0.0%) |
| 55 to 59 Years | 73 (73.7%) | 4 (5.5%) |
| 60 to 64 Years | 45 (46.9%) | 7 (15.6%) |
| 65 to 74 Years | 20 (16.0%) | 0 (0.0%) |
| 75 Years and over | 8 (9.4%) | 0 (0.0%) |
| Total | 829 (65.1%) | 37 (4.5%) |
Employment Status by Educational Attainment in Winfield
According to labor force statistics for Winfield, 76.7% of individuals (666) out of the total population between 25 and 64 years of age (868) are in the labor force, with 4.8% or 32 of them being unemployed. The group with the highest labor force participation rate are those with the educational attainment of bachelor's degree or higher, with 95.6% or 152 individuals in the labor force. Within the labor force, individuals with high school diploma education have the highest percentage of unemployment, with 13.4% or 25 of them being unemployed.
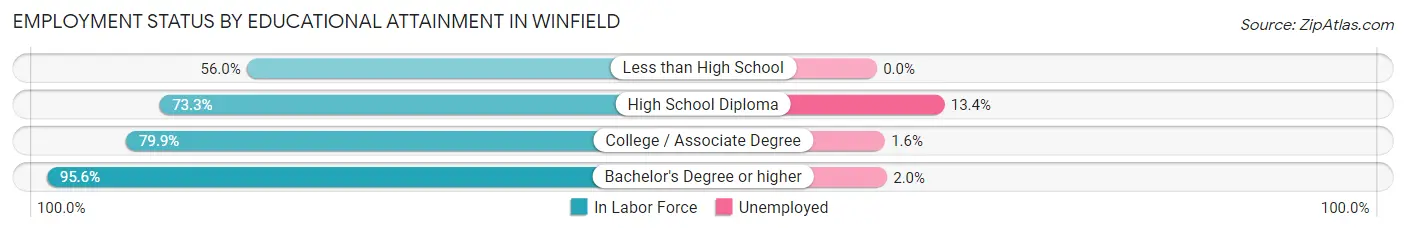
| Educational Attainment | In Labor Force | Unemployed |
| Less than High School | 84 (56.0%) | 0 (0.0%) |
| High School Diploma | 187 (73.3%) | 34 (13.4%) |
| College / Associate Degree | 243 (79.9%) | 5 (1.6%) |
| Bachelor's Degree or higher | 152 (95.6%) | 3 (2.0%) |
| Total | 666 (76.7%) | 42 (4.8%) |
Employment Occupations by Sex in Winfield
Management, Business, Science and Arts Occupations
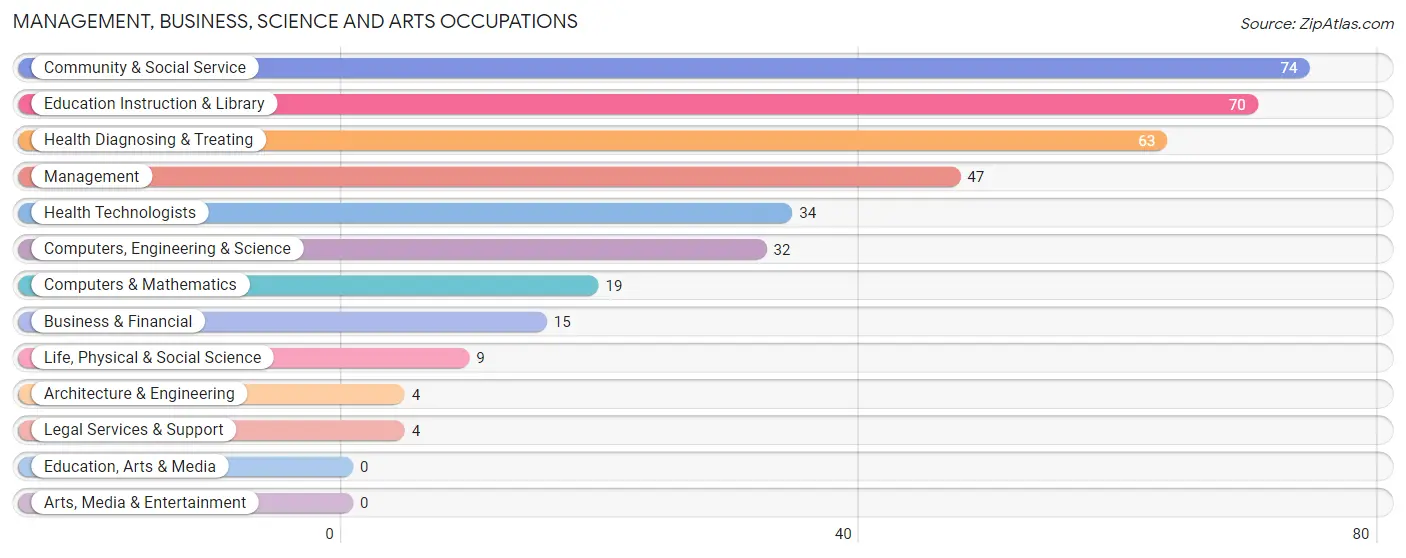
The most common Management, Business, Science and Arts occupations in Winfield are Community & Social Service (74 | 9.3%), Education Instruction & Library (70 | 8.8%), Health Diagnosing & Treating (63 | 8.0%), Management (47 | 5.9%), and Health Technologists (34 | 4.3%).
Management, Business, Science and Arts Occupations by Sex
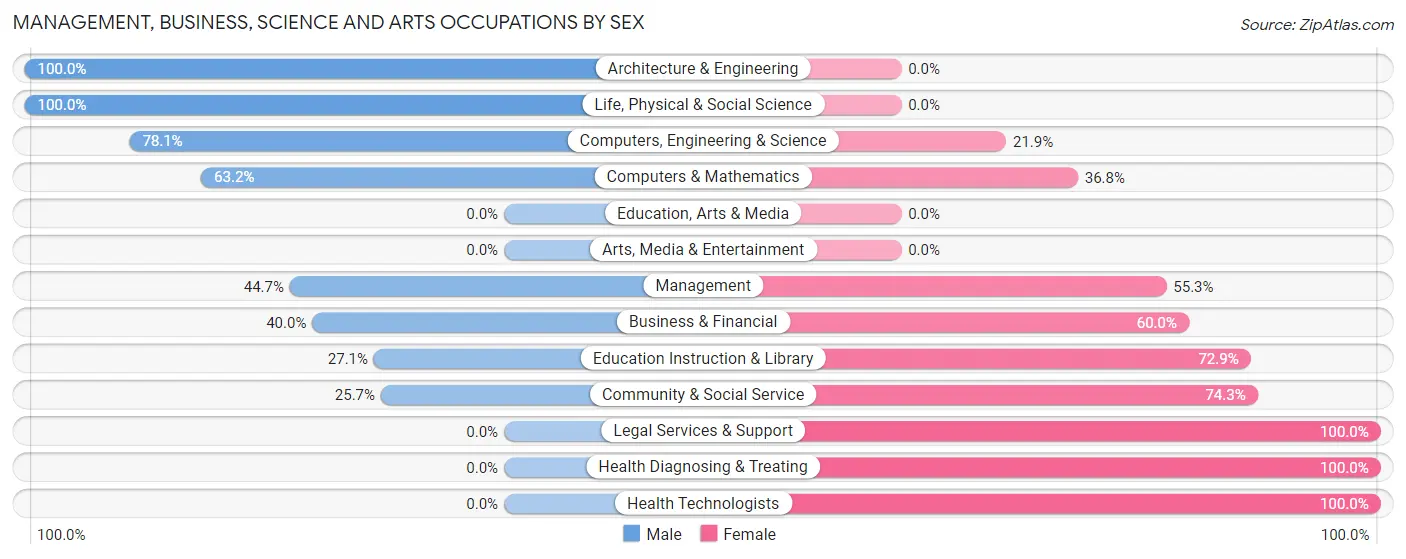
Within the Management, Business, Science and Arts occupations in Winfield, the most male-oriented occupations are Architecture & Engineering (100.0%), Life, Physical & Social Science (100.0%), and Computers, Engineering & Science (78.1%), while the most female-oriented occupations are Legal Services & Support (100.0%), Health Diagnosing & Treating (100.0%), and Health Technologists (100.0%).
| Occupation | Male | Female |
| Management | 21 (44.7%) | 26 (55.3%) |
| Business & Financial | 6 (40.0%) | 9 (60.0%) |
| Computers, Engineering & Science | 25 (78.1%) | 7 (21.9%) |
| Computers & Mathematics | 12 (63.2%) | 7 (36.8%) |
| Architecture & Engineering | 4 (100.0%) | 0 (0.0%) |
| Life, Physical & Social Science | 9 (100.0%) | 0 (0.0%) |
| Community & Social Service | 19 (25.7%) | 55 (74.3%) |
| Education, Arts & Media | 0 (0.0%) | 0 (0.0%) |
| Legal Services & Support | 0 (0.0%) | 4 (100.0%) |
| Education Instruction & Library | 19 (27.1%) | 51 (72.9%) |
| Arts, Media & Entertainment | 0 (0.0%) | 0 (0.0%) |
| Health Diagnosing & Treating | 0 (0.0%) | 63 (100.0%) |
| Health Technologists | 0 (0.0%) | 34 (100.0%) |
| Total (Category) | 71 (30.7%) | 160 (69.3%) |
| Total (Overall) | 404 (51.0%) | 388 (49.0%) |
Services Occupations
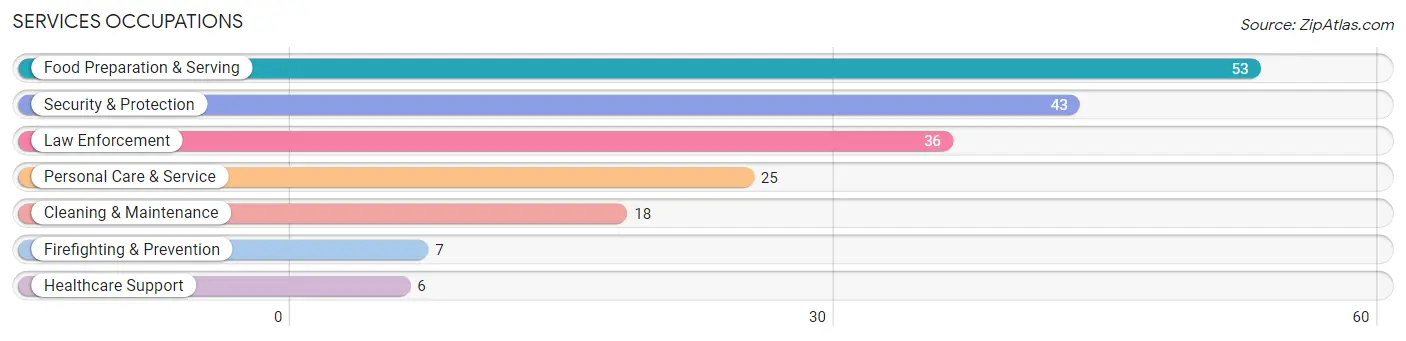
The most common Services occupations in Winfield are Food Preparation & Serving (53 | 6.7%), Security & Protection (43 | 5.4%), Law Enforcement (36 | 4.5%), Personal Care & Service (25 | 3.2%), and Cleaning & Maintenance (18 | 2.3%).
Services Occupations by Sex
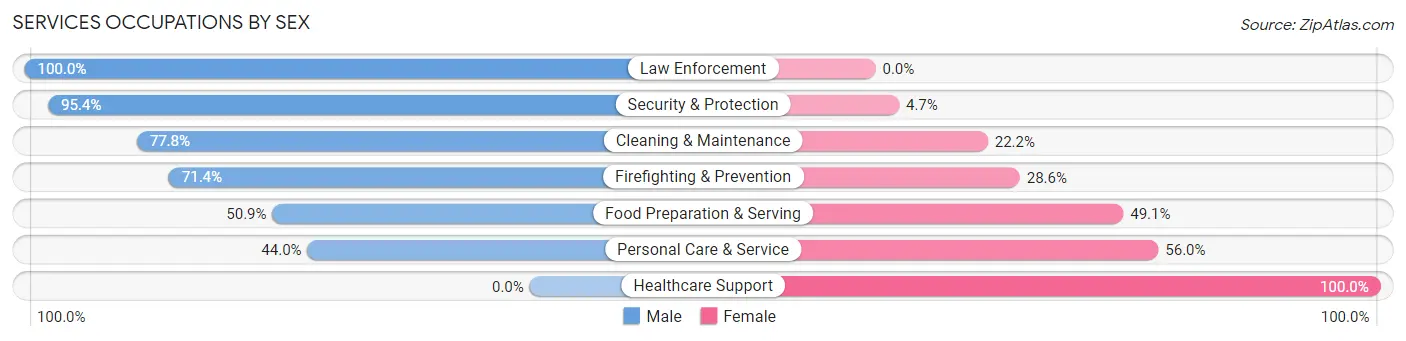
Within the Services occupations in Winfield, the most male-oriented occupations are Law Enforcement (100.0%), Security & Protection (95.4%), and Cleaning & Maintenance (77.8%), while the most female-oriented occupations are Healthcare Support (100.0%), Personal Care & Service (56.0%), and Food Preparation & Serving (49.1%).
| Occupation | Male | Female |
| Healthcare Support | 0 (0.0%) | 6 (100.0%) |
| Security & Protection | 41 (95.4%) | 2 (4.6%) |
| Firefighting & Prevention | 5 (71.4%) | 2 (28.6%) |
| Law Enforcement | 36 (100.0%) | 0 (0.0%) |
| Food Preparation & Serving | 27 (50.9%) | 26 (49.1%) |
| Cleaning & Maintenance | 14 (77.8%) | 4 (22.2%) |
| Personal Care & Service | 11 (44.0%) | 14 (56.0%) |
| Total (Category) | 93 (64.1%) | 52 (35.9%) |
| Total (Overall) | 404 (51.0%) | 388 (49.0%) |
Sales and Office Occupations
The most common Sales and Office occupations in Winfield are Office & Administration (110 | 13.9%), and Sales & Related (58 | 7.3%).
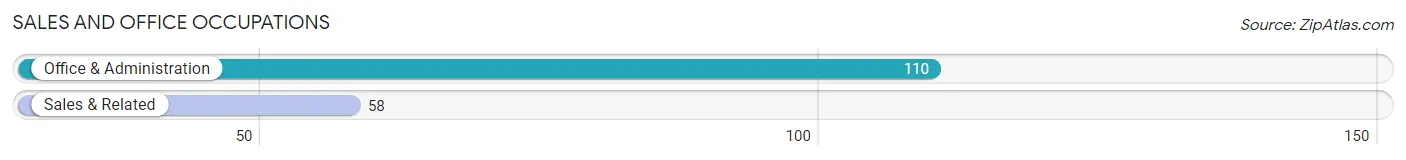
Sales and Office Occupations by Sex
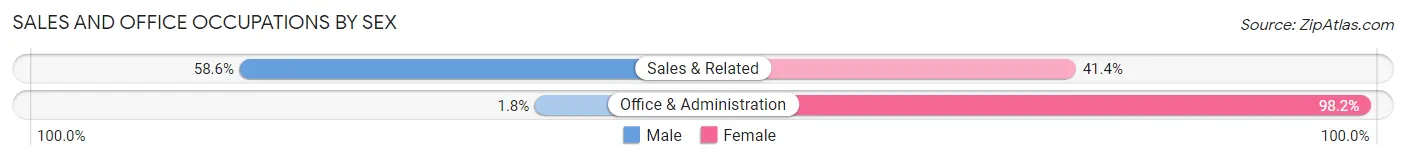
| Occupation | Male | Female |
| Sales & Related | 34 (58.6%) | 24 (41.4%) |
| Office & Administration | 2 (1.8%) | 108 (98.2%) |
| Total (Category) | 36 (21.4%) | 132 (78.6%) |
| Total (Overall) | 404 (51.0%) | 388 (49.0%) |
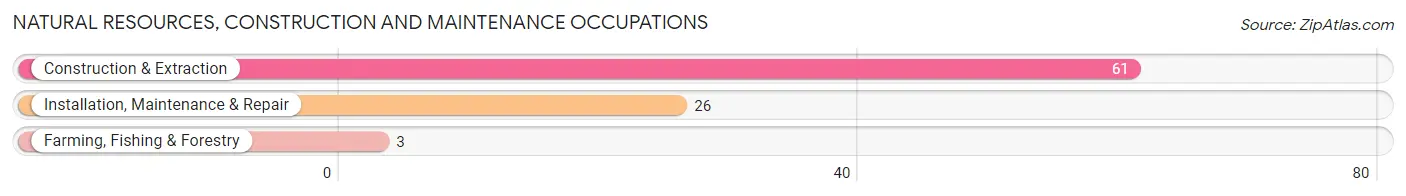
Natural Resources, Construction and Maintenance Occupations
The most common Natural Resources, Construction and Maintenance occupations in Winfield are Construction & Extraction (61 | 7.7%), Installation, Maintenance & Repair (26 | 3.3%), and Farming, Fishing & Forestry (3 | 0.4%).
Natural Resources, Construction and Maintenance Occupations by Sex
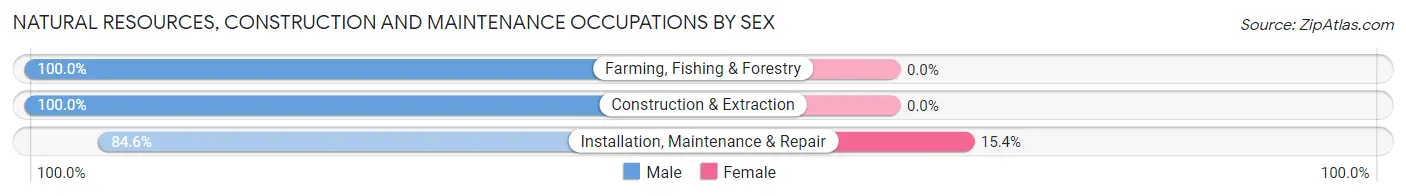
| Occupation | Male | Female |
| Farming, Fishing & Forestry | 3 (100.0%) | 0 (0.0%) |
| Construction & Extraction | 61 (100.0%) | 0 (0.0%) |
| Installation, Maintenance & Repair | 22 (84.6%) | 4 (15.4%) |
| Total (Category) | 86 (95.6%) | 4 (4.4%) |
| Total (Overall) | 404 (51.0%) | 388 (49.0%) |
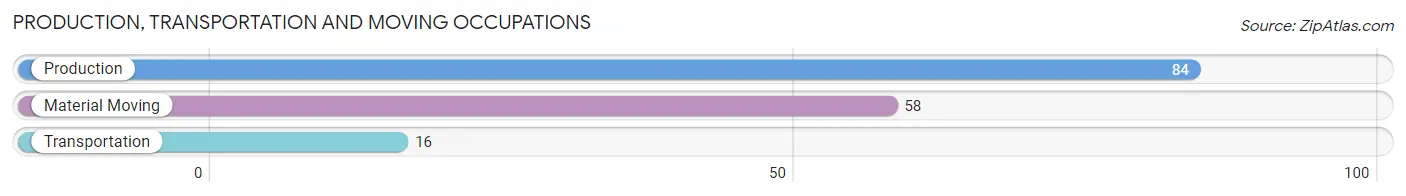
Production, Transportation and Moving Occupations
The most common Production, Transportation and Moving occupations in Winfield are Production (84 | 10.6%), Material Moving (58 | 7.3%), and Transportation (16 | 2.0%).
Production, Transportation and Moving Occupations by Sex
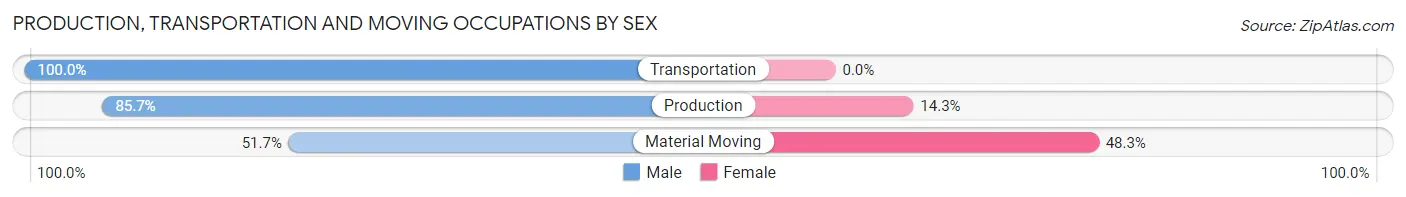
| Occupation | Male | Female |
| Production | 72 (85.7%) | 12 (14.3%) |
| Transportation | 16 (100.0%) | 0 (0.0%) |
| Material Moving | 30 (51.7%) | 28 (48.3%) |
| Total (Category) | 118 (74.7%) | 40 (25.3%) |
| Total (Overall) | 404 (51.0%) | 388 (49.0%) |
Employment Industries by Sex in Winfield
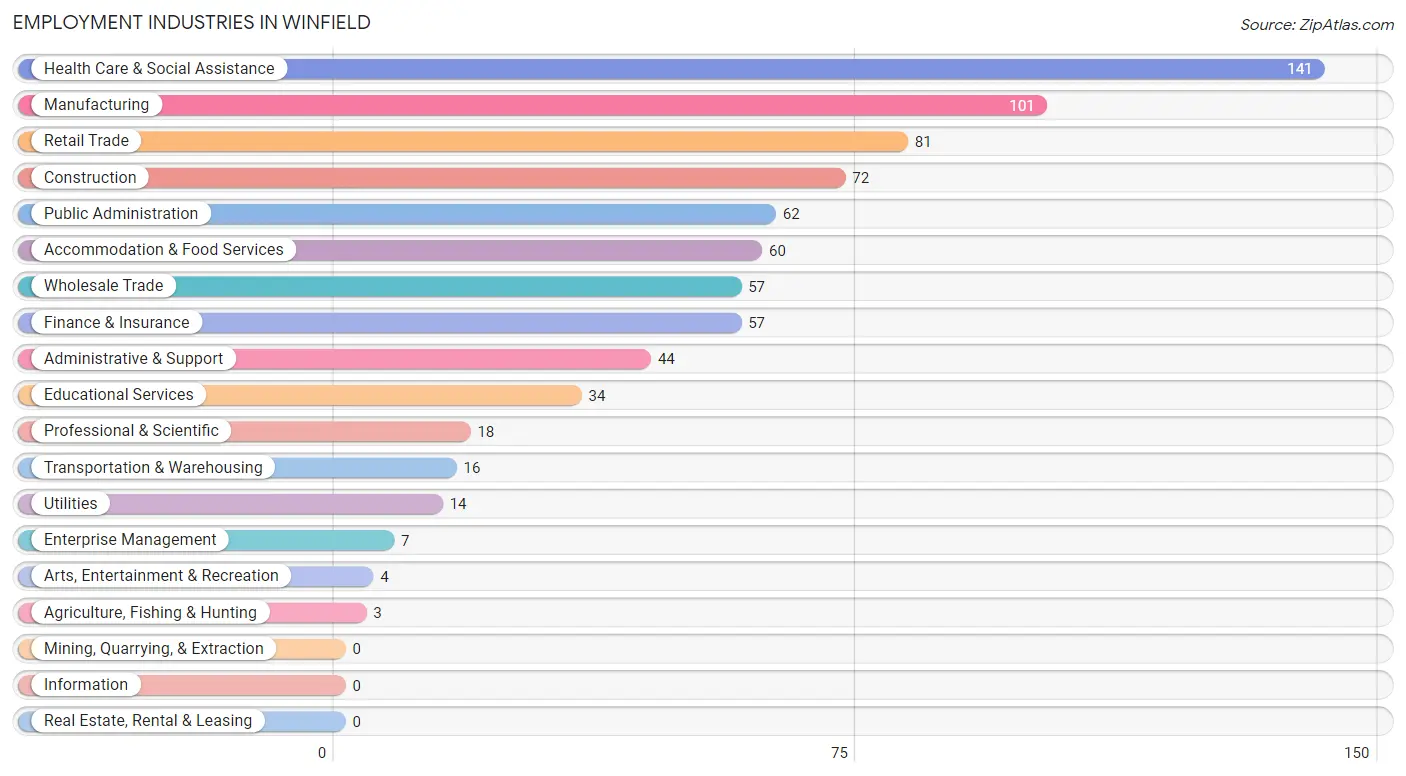
Employment Industries in Winfield
The major employment industries in Winfield include Health Care & Social Assistance (141 | 17.8%), Manufacturing (101 | 12.8%), Retail Trade (81 | 10.2%), Construction (72 | 9.1%), and Public Administration (62 | 7.8%).
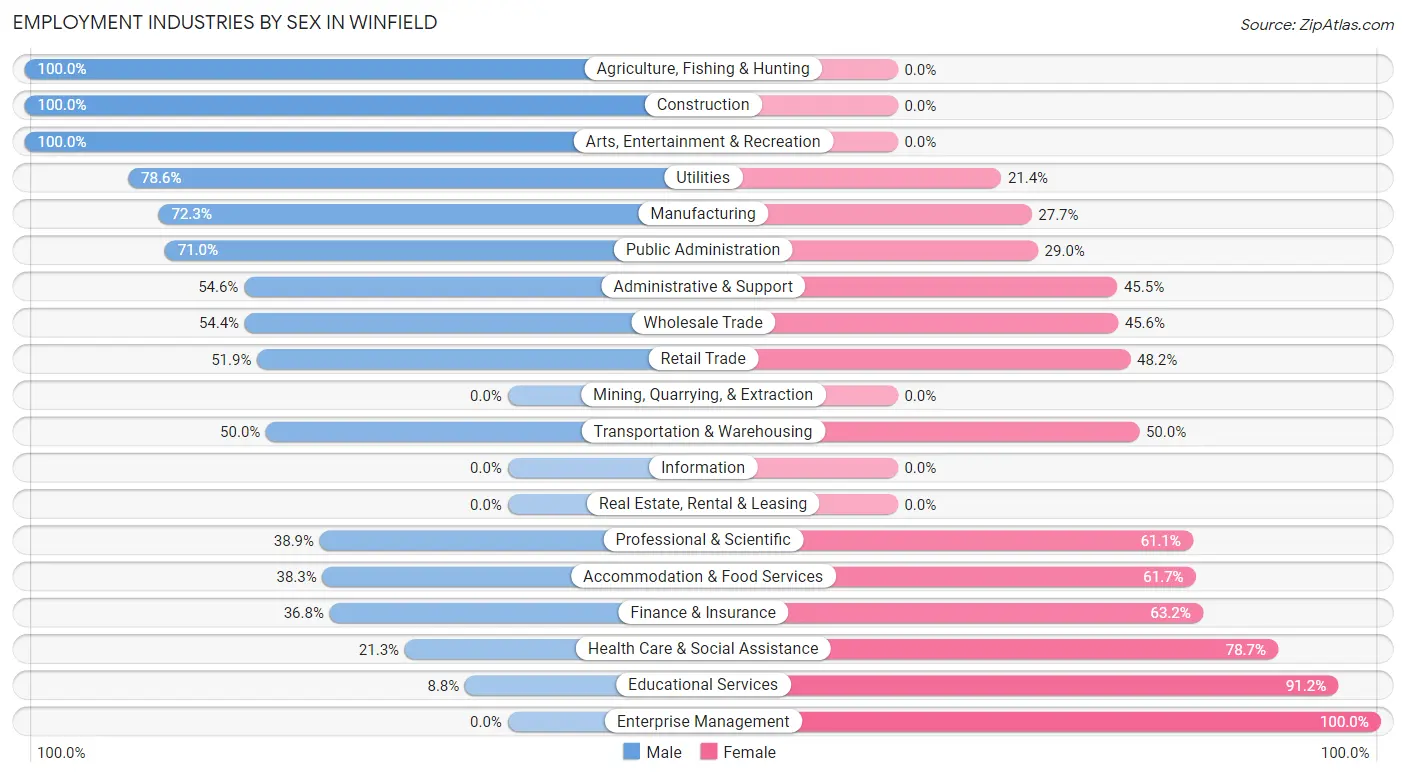
Employment Industries by Sex in Winfield
The Winfield industries that see more men than women are Agriculture, Fishing & Hunting (100.0%), Construction (100.0%), and Arts, Entertainment & Recreation (100.0%), whereas the industries that tend to have a higher number of women are Enterprise Management (100.0%), Educational Services (91.2%), and Health Care & Social Assistance (78.7%).
| Industry | Male | Female |
| Agriculture, Fishing & Hunting | 3 (100.0%) | 0 (0.0%) |
| Mining, Quarrying, & Extraction | 0 (0.0%) | 0 (0.0%) |
| Construction | 72 (100.0%) | 0 (0.0%) |
| Manufacturing | 73 (72.3%) | 28 (27.7%) |
| Wholesale Trade | 31 (54.4%) | 26 (45.6%) |
| Retail Trade | 42 (51.8%) | 39 (48.1%) |
| Transportation & Warehousing | 8 (50.0%) | 8 (50.0%) |
| Utilities | 11 (78.6%) | 3 (21.4%) |
| Information | 0 (0.0%) | 0 (0.0%) |
| Finance & Insurance | 21 (36.8%) | 36 (63.2%) |
| Real Estate, Rental & Leasing | 0 (0.0%) | 0 (0.0%) |
| Professional & Scientific | 7 (38.9%) | 11 (61.1%) |
| Enterprise Management | 0 (0.0%) | 7 (100.0%) |
| Administrative & Support | 24 (54.5%) | 20 (45.5%) |
| Educational Services | 3 (8.8%) | 31 (91.2%) |
| Health Care & Social Assistance | 30 (21.3%) | 111 (78.7%) |
| Arts, Entertainment & Recreation | 4 (100.0%) | 0 (0.0%) |
| Accommodation & Food Services | 23 (38.3%) | 37 (61.7%) |
| Public Administration | 44 (71.0%) | 18 (29.0%) |
| Total | 404 (51.0%) | 388 (49.0%) |
Education in Winfield
School Enrollment in Winfield
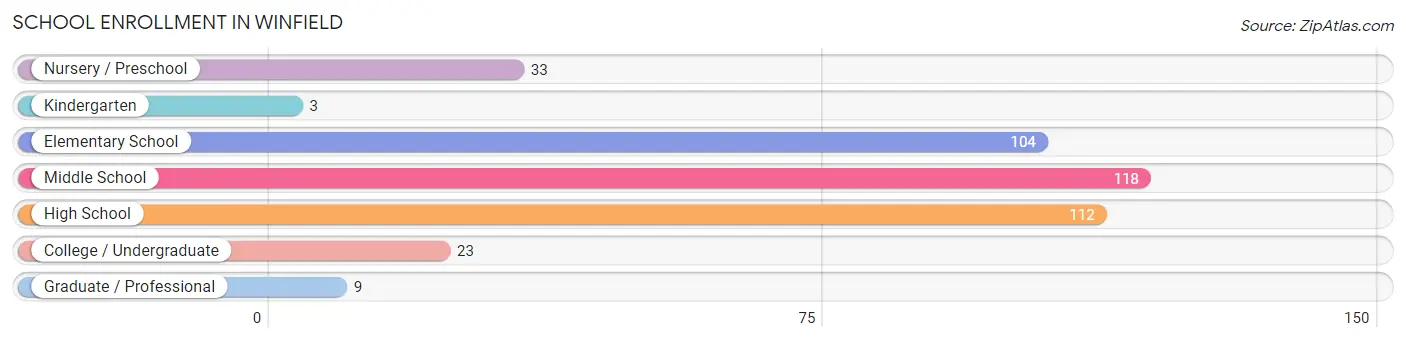
The most common levels of schooling among the 402 students in Winfield are middle school (118 | 29.3%), high school (112 | 27.9%), and elementary school (104 | 25.9%).
| School Level | # Students | % Students |
| Nursery / Preschool | 33 | 8.2% |
| Kindergarten | 3 | 0.7% |
| Elementary School | 104 | 25.9% |
| Middle School | 118 | 29.3% |
| High School | 112 | 27.9% |
| College / Undergraduate | 23 | 5.7% |
| Graduate / Professional | 9 | 2.2% |
| Total | 402 | 100.0% |
School Enrollment by Age by Funding Source in Winfield
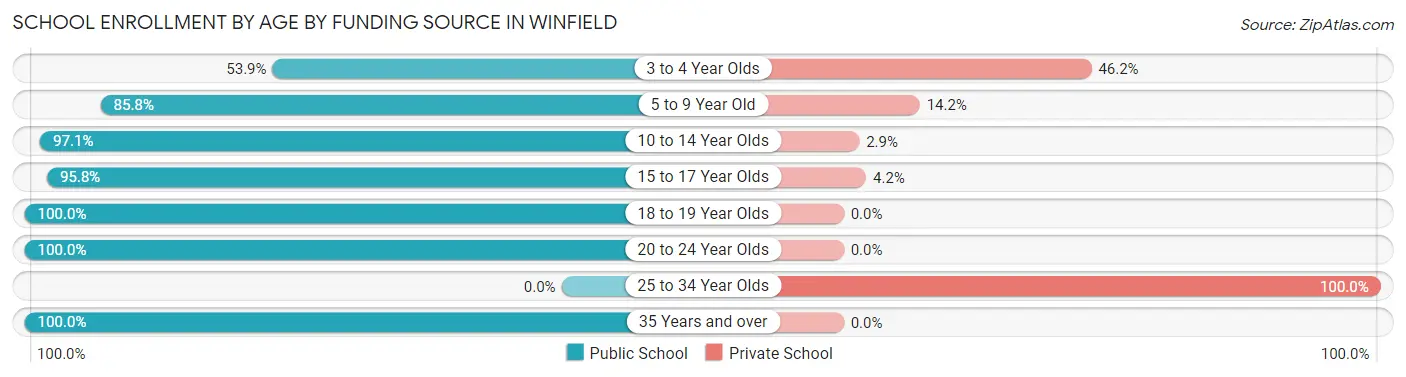
Out of a total of 402 students who are enrolled in schools in Winfield, 34 (8.5%) attend a private institution, while the remaining 368 (91.5%) are enrolled in public schools. The age group of 25 to 34 year olds has the highest likelihood of being enrolled in private schools, with 4 (100.0% in the age bracket) enrolled. Conversely, the age group of 18 to 19 year olds has the lowest likelihood of being enrolled in a private school, with 15 (100.0% in the age bracket) attending a public institution.
| Age Bracket | Public School | Private School |
| 3 to 4 Year Olds | 7 (53.8%) | 6 (46.2%) |
| 5 to 9 Year Old | 97 (85.8%) | 16 (14.2%) |
| 10 to 14 Year Olds | 134 (97.1%) | 4 (2.9%) |
| 15 to 17 Year Olds | 92 (95.8%) | 4 (4.2%) |
| 18 to 19 Year Olds | 15 (100.0%) | 0 (0.0%) |
| 20 to 24 Year Olds | 17 (100.0%) | 0 (0.0%) |
| 25 to 34 Year Olds | 0 (0.0%) | 4 (100.0%) |
| 35 Years and over | 6 (100.0%) | 0 (0.0%) |
| Total | 368 (91.5%) | 34 (8.5%) |
Educational Attainment by Field of Study in Winfield
Education (39 | 21.4%), business (35 | 19.2%), arts & humanities (35 | 19.2%), science & technology (25 | 13.7%), and bio, nature & agricultural (18 | 9.9%) are the most common fields of study among 182 individuals in Winfield who have obtained a bachelor's degree or higher.
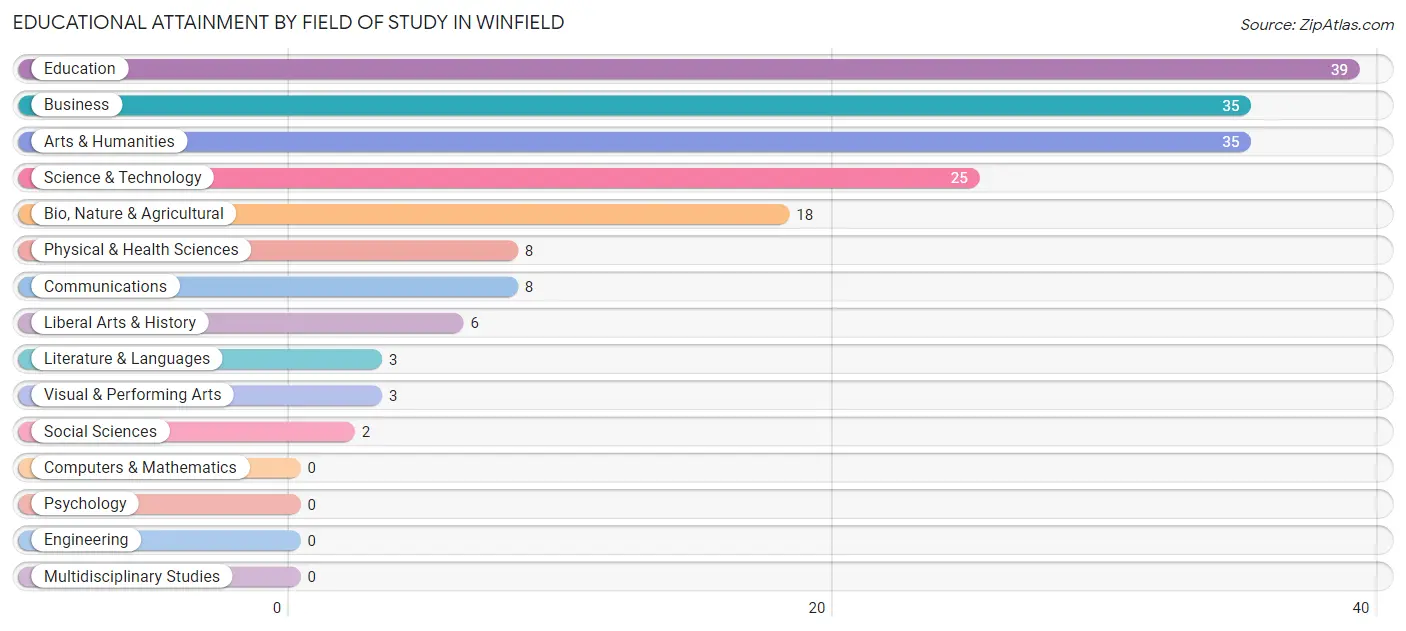
| Field of Study | # Graduates | % Graduates |
| Computers & Mathematics | 0 | 0.0% |
| Bio, Nature & Agricultural | 18 | 9.9% |
| Physical & Health Sciences | 8 | 4.4% |
| Psychology | 0 | 0.0% |
| Social Sciences | 2 | 1.1% |
| Engineering | 0 | 0.0% |
| Multidisciplinary Studies | 0 | 0.0% |
| Science & Technology | 25 | 13.7% |
| Business | 35 | 19.2% |
| Education | 39 | 21.4% |
| Literature & Languages | 3 | 1.7% |
| Liberal Arts & History | 6 | 3.3% |
| Visual & Performing Arts | 3 | 1.7% |
| Communications | 8 | 4.4% |
| Arts & Humanities | 35 | 19.2% |
| Total | 182 | 100.0% |
Transportation & Commute in Winfield
Vehicle Availability by Sex in Winfield
The most prevalent vehicle ownership categories in Winfield are males with 2 vehicles (203, accounting for 50.9%) and females with 2 vehicles (147, making up 52.3%).
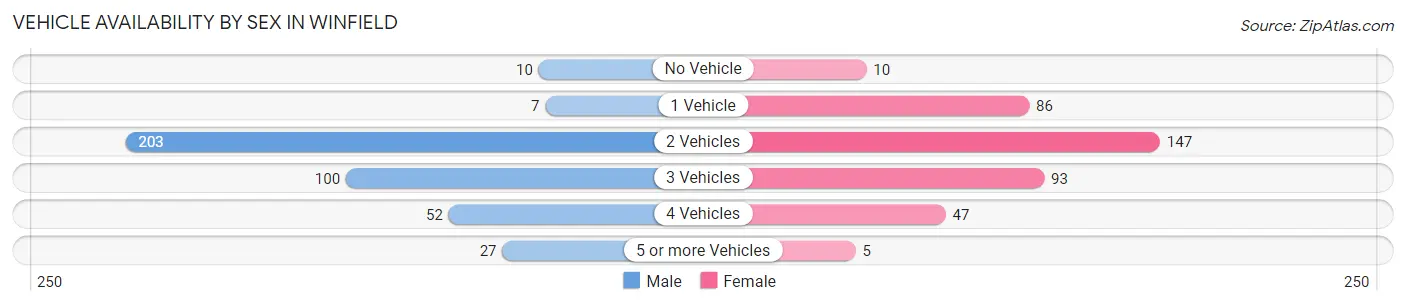
| Vehicles Available | Male | Female |
| No Vehicle | 10 (2.5%) | 10 (2.6%) |
| 1 Vehicle | 7 (1.8%) | 86 (22.2%) |
| 2 Vehicles | 203 (50.9%) | 147 (37.9%) |
| 3 Vehicles | 100 (25.1%) | 93 (24.0%) |
| 4 Vehicles | 52 (13.0%) | 47 (12.1%) |
| 5 or more Vehicles | 27 (6.8%) | 5 (1.3%) |
| Total | 399 (100.0%) | 388 (100.0%) |
Commute Time in Winfield
The most frequently occuring commute durations in Winfield are 40 to 44 minutes (132 commuters, 17.3%), 20 to 24 minutes (131 commuters, 17.2%), and 45 to 59 minutes (115 commuters, 15.1%).
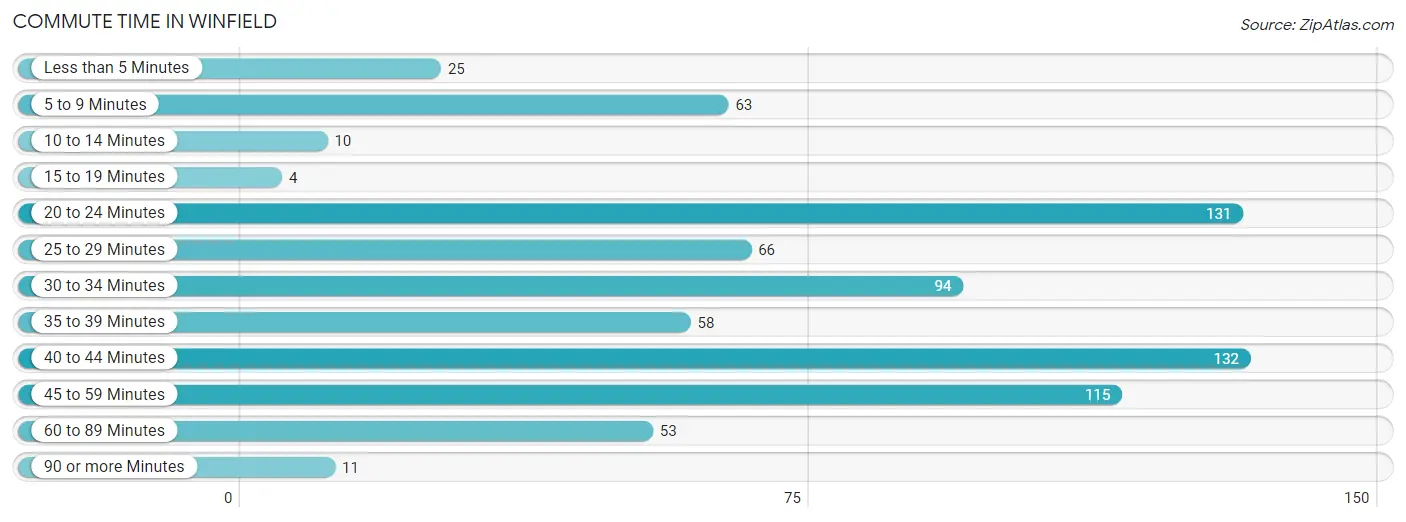
| Commute Time | # Commuters | % Commuters |
| Less than 5 Minutes | 25 | 3.3% |
| 5 to 9 Minutes | 63 | 8.3% |
| 10 to 14 Minutes | 10 | 1.3% |
| 15 to 19 Minutes | 4 | 0.5% |
| 20 to 24 Minutes | 131 | 17.2% |
| 25 to 29 Minutes | 66 | 8.7% |
| 30 to 34 Minutes | 94 | 12.3% |
| 35 to 39 Minutes | 58 | 7.6% |
| 40 to 44 Minutes | 132 | 17.3% |
| 45 to 59 Minutes | 115 | 15.1% |
| 60 to 89 Minutes | 53 | 7.0% |
| 90 or more Minutes | 11 | 1.4% |
Commute Time by Sex in Winfield
The most common commute times in Winfield are 40 to 44 minutes (93 commuters, 23.7%) for males and 45 to 59 minutes (65 commuters, 17.6%) for females.
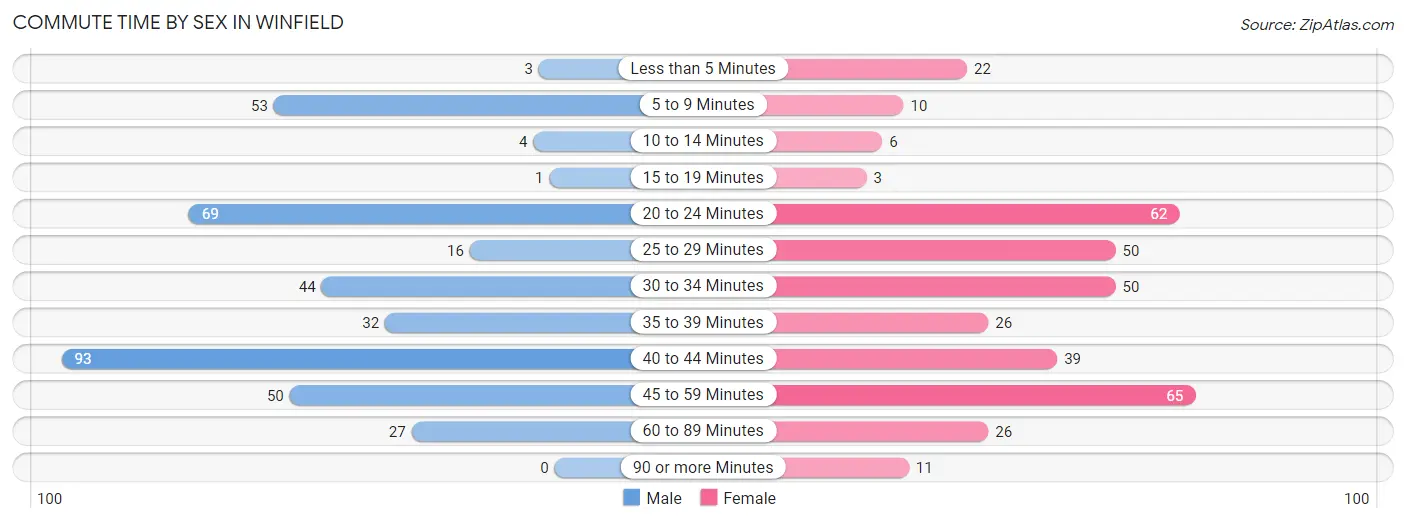
| Commute Time | Male | Female |
| Less than 5 Minutes | 3 (0.8%) | 22 (5.9%) |
| 5 to 9 Minutes | 53 (13.5%) | 10 (2.7%) |
| 10 to 14 Minutes | 4 (1.0%) | 6 (1.6%) |
| 15 to 19 Minutes | 1 (0.3%) | 3 (0.8%) |
| 20 to 24 Minutes | 69 (17.6%) | 62 (16.8%) |
| 25 to 29 Minutes | 16 (4.1%) | 50 (13.5%) |
| 30 to 34 Minutes | 44 (11.2%) | 50 (13.5%) |
| 35 to 39 Minutes | 32 (8.2%) | 26 (7.0%) |
| 40 to 44 Minutes | 93 (23.7%) | 39 (10.5%) |
| 45 to 59 Minutes | 50 (12.8%) | 65 (17.6%) |
| 60 to 89 Minutes | 27 (6.9%) | 26 (7.0%) |
| 90 or more Minutes | 0 (0.0%) | 11 (3.0%) |
Time of Departure to Work by Sex in Winfield
The most frequent times of departure to work in Winfield are 12:00 AM to 4:59 AM (68, 17.3%) for males and 7:00 AM to 7:29 AM (68, 18.4%) for females.
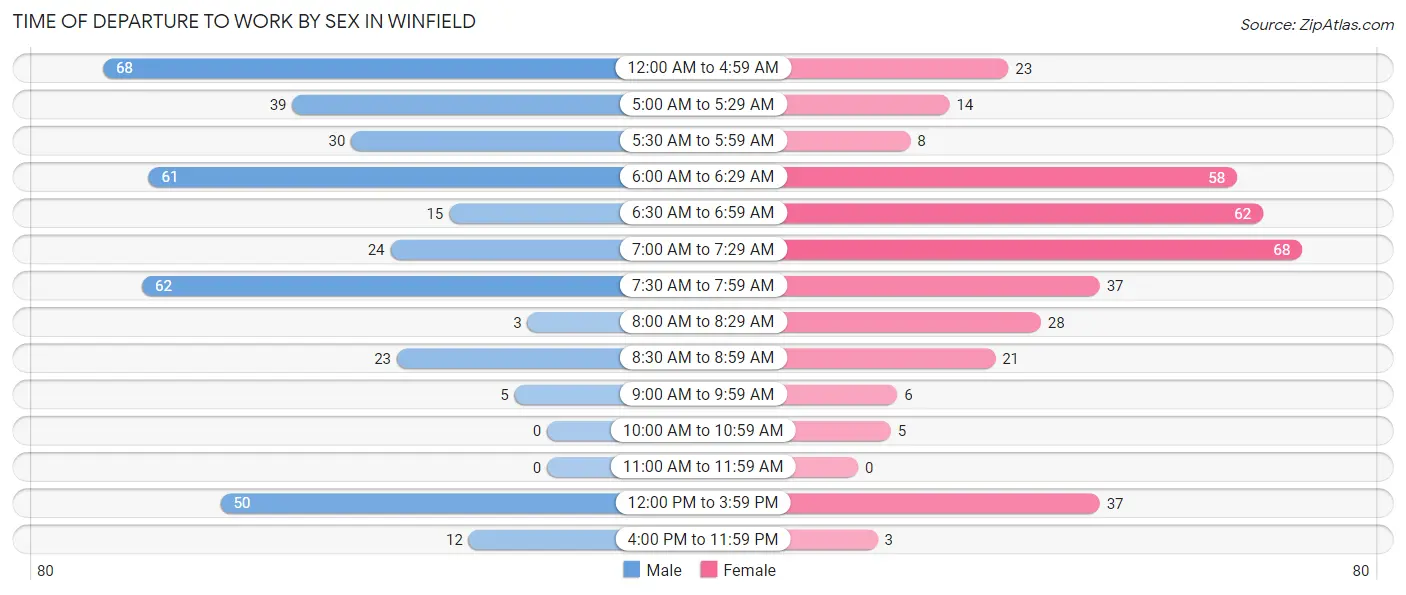
| Time of Departure | Male | Female |
| 12:00 AM to 4:59 AM | 68 (17.3%) | 23 (6.2%) |
| 5:00 AM to 5:29 AM | 39 (10.0%) | 14 (3.8%) |
| 5:30 AM to 5:59 AM | 30 (7.6%) | 8 (2.2%) |
| 6:00 AM to 6:29 AM | 61 (15.6%) | 58 (15.7%) |
| 6:30 AM to 6:59 AM | 15 (3.8%) | 62 (16.8%) |
| 7:00 AM to 7:29 AM | 24 (6.1%) | 68 (18.4%) |
| 7:30 AM to 7:59 AM | 62 (15.8%) | 37 (10.0%) |
| 8:00 AM to 8:29 AM | 3 (0.8%) | 28 (7.6%) |
| 8:30 AM to 8:59 AM | 23 (5.9%) | 21 (5.7%) |
| 9:00 AM to 9:59 AM | 5 (1.3%) | 6 (1.6%) |
| 10:00 AM to 10:59 AM | 0 (0.0%) | 5 (1.3%) |
| 11:00 AM to 11:59 AM | 0 (0.0%) | 0 (0.0%) |
| 12:00 PM to 3:59 PM | 50 (12.8%) | 37 (10.0%) |
| 4:00 PM to 11:59 PM | 12 (3.1%) | 3 (0.8%) |
| Total | 392 (100.0%) | 370 (100.0%) |
Housing Occupancy in Winfield
Occupancy by Ownership in Winfield
Of the total 623 dwellings in Winfield, owner-occupied units account for 352 (56.5%), while renter-occupied units make up 271 (43.5%).
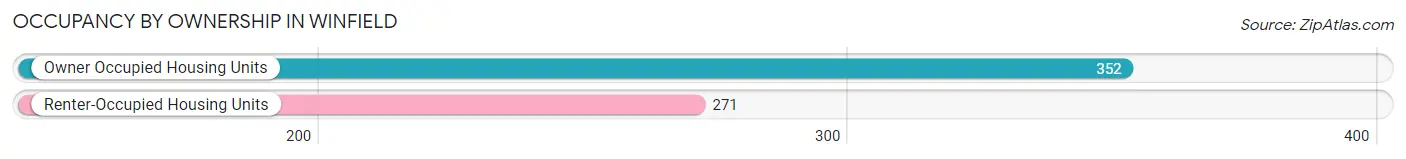
| Occupancy | # Housing Units | % Housing Units |
| Owner Occupied Housing Units | 352 | 56.5% |
| Renter-Occupied Housing Units | 271 | 43.5% |
| Total Occupied Housing Units | 623 | 100.0% |
Occupancy by Household Size in Winfield
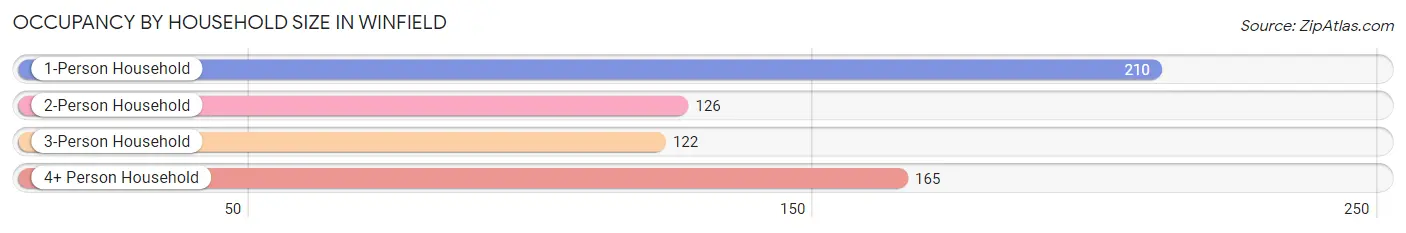
| Household Size | # Housing Units | % Housing Units |
| 1-Person Household | 210 | 33.7% |
| 2-Person Household | 126 | 20.2% |
| 3-Person Household | 122 | 19.6% |
| 4+ Person Household | 165 | 26.5% |
| Total Housing Units | 623 | 100.0% |
Occupancy by Ownership by Household Size in Winfield
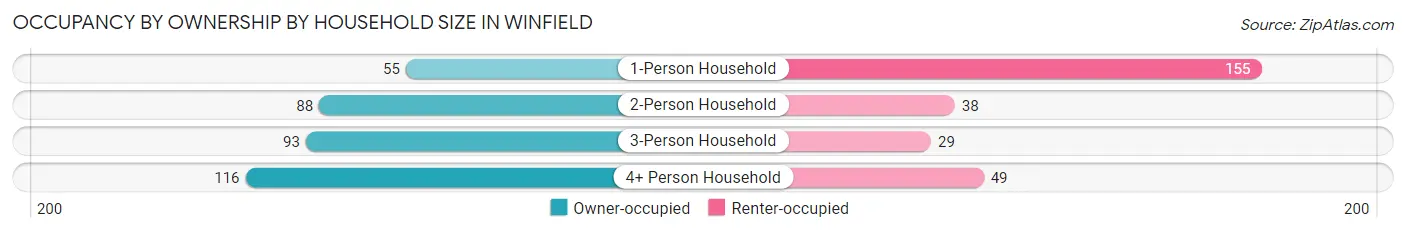
| Household Size | Owner-occupied | Renter-occupied |
| 1-Person Household | 55 (26.2%) | 155 (73.8%) |
| 2-Person Household | 88 (69.8%) | 38 (30.2%) |
| 3-Person Household | 93 (76.2%) | 29 (23.8%) |
| 4+ Person Household | 116 (70.3%) | 49 (29.7%) |
| Total Housing Units | 352 (56.5%) | 271 (43.5%) |
Occupancy by Educational Attainment in Winfield
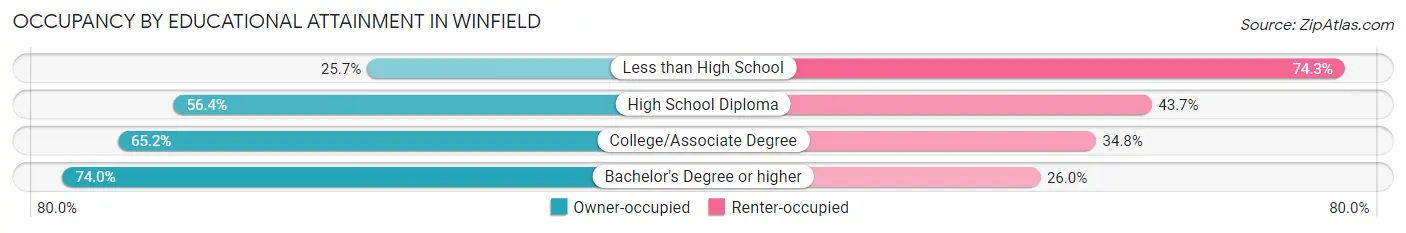
| Household Size | Owner-occupied | Renter-occupied |
| Less than High School | 28 (25.7%) | 81 (74.3%) |
| High School Diploma | 142 (56.4%) | 110 (43.6%) |
| College/Associate Degree | 88 (65.2%) | 47 (34.8%) |
| Bachelor's Degree or higher | 94 (74.0%) | 33 (26.0%) |
Occupancy by Age of Householder in Winfield
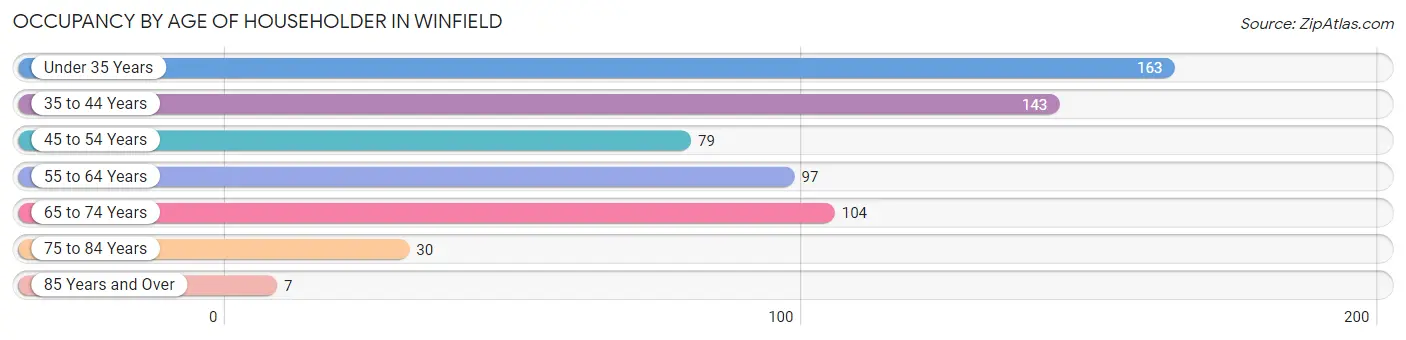
| Age Bracket | # Households | % Households |
| Under 35 Years | 163 | 26.2% |
| 35 to 44 Years | 143 | 23.0% |
| 45 to 54 Years | 79 | 12.7% |
| 55 to 64 Years | 97 | 15.6% |
| 65 to 74 Years | 104 | 16.7% |
| 75 to 84 Years | 30 | 4.8% |
| 85 Years and Over | 7 | 1.1% |
| Total | 623 | 100.0% |
Housing Finances in Winfield
Median Income by Occupancy in Winfield
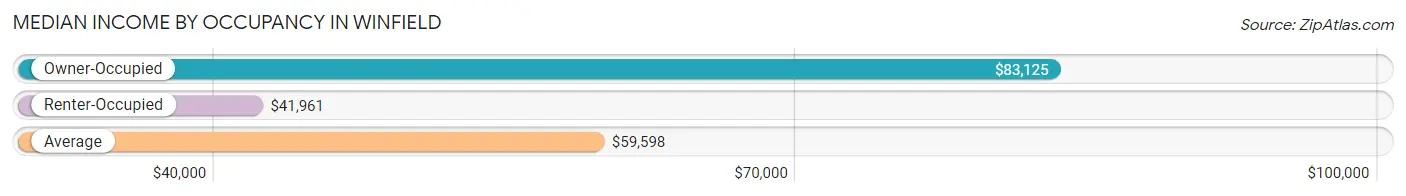
| Occupancy Type | # Households | Median Income |
| Owner-Occupied | 352 (56.5%) | $83,125 |
| Renter-Occupied | 271 (43.5%) | $41,961 |
| Average | 623 (100.0%) | $59,598 |
Occupancy by Householder Income Bracket in Winfield
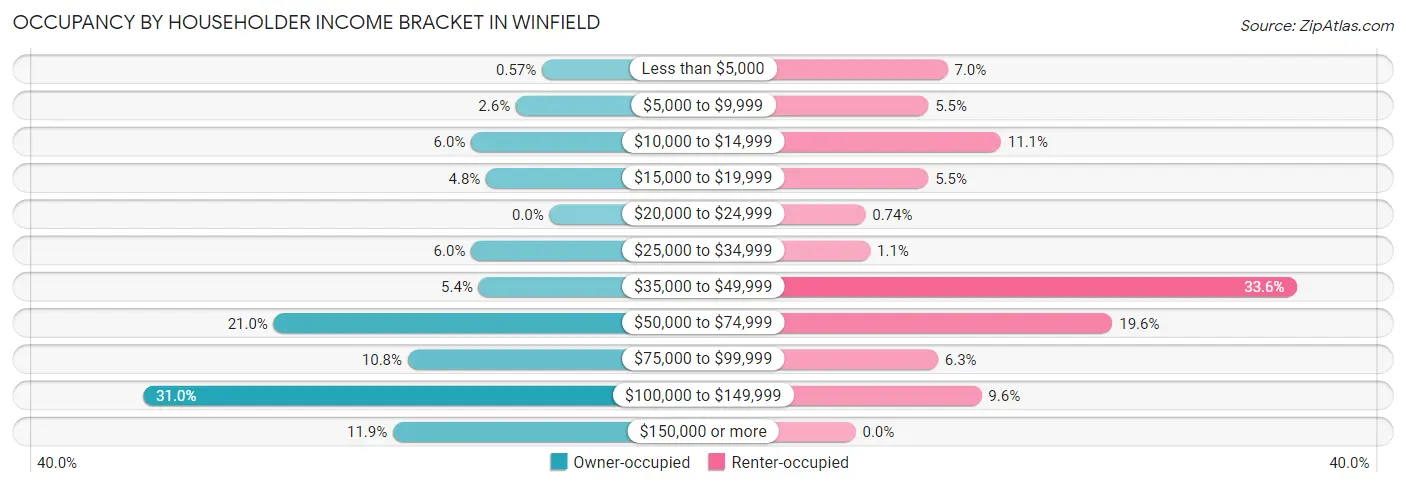
| Income Bracket | Owner-occupied | Renter-occupied |
| Less than $5,000 | 2 (0.6%) | 19 (7.0%) |
| $5,000 to $9,999 | 9 (2.6%) | 15 (5.5%) |
| $10,000 to $14,999 | 21 (6.0%) | 30 (11.1%) |
| $15,000 to $19,999 | 17 (4.8%) | 15 (5.5%) |
| $20,000 to $24,999 | 0 (0.0%) | 2 (0.7%) |
| $25,000 to $34,999 | 21 (6.0%) | 3 (1.1%) |
| $35,000 to $49,999 | 19 (5.4%) | 91 (33.6%) |
| $50,000 to $74,999 | 74 (21.0%) | 53 (19.6%) |
| $75,000 to $99,999 | 38 (10.8%) | 17 (6.3%) |
| $100,000 to $149,999 | 109 (31.0%) | 26 (9.6%) |
| $150,000 or more | 42 (11.9%) | 0 (0.0%) |
| Total | 352 (100.0%) | 271 (100.0%) |
Monthly Housing Cost Tiers in Winfield
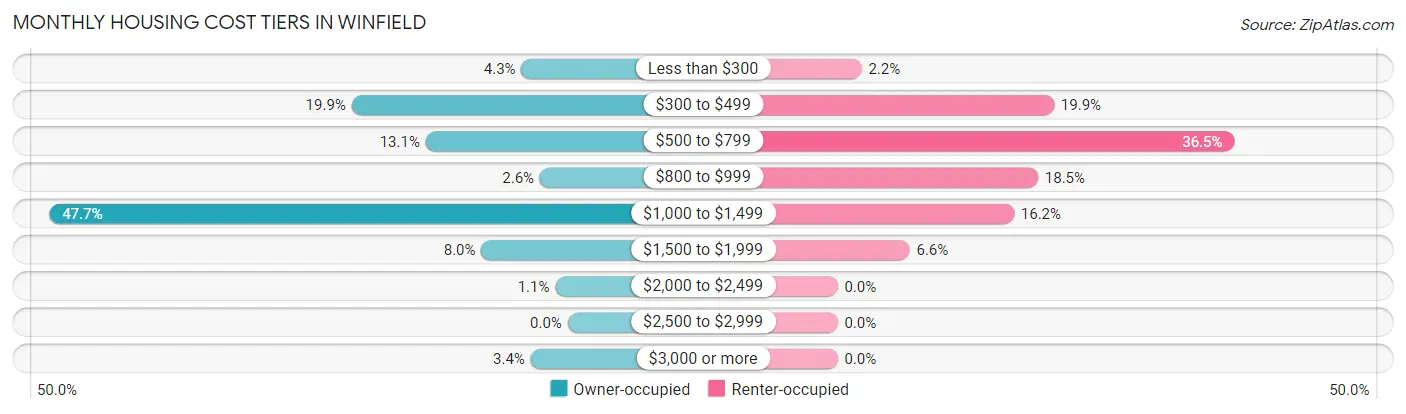
| Monthly Cost | Owner-occupied | Renter-occupied |
| Less than $300 | 15 (4.3%) | 6 (2.2%) |
| $300 to $499 | 70 (19.9%) | 54 (19.9%) |
| $500 to $799 | 46 (13.1%) | 99 (36.5%) |
| $800 to $999 | 9 (2.6%) | 50 (18.4%) |
| $1,000 to $1,499 | 168 (47.7%) | 44 (16.2%) |
| $1,500 to $1,999 | 28 (8.0%) | 18 (6.6%) |
| $2,000 to $2,499 | 4 (1.1%) | 0 (0.0%) |
| $2,500 to $2,999 | 0 (0.0%) | 0 (0.0%) |
| $3,000 or more | 12 (3.4%) | 0 (0.0%) |
| Total | 352 (100.0%) | 271 (100.0%) |
Physical Housing Characteristics in Winfield
Housing Structures in Winfield
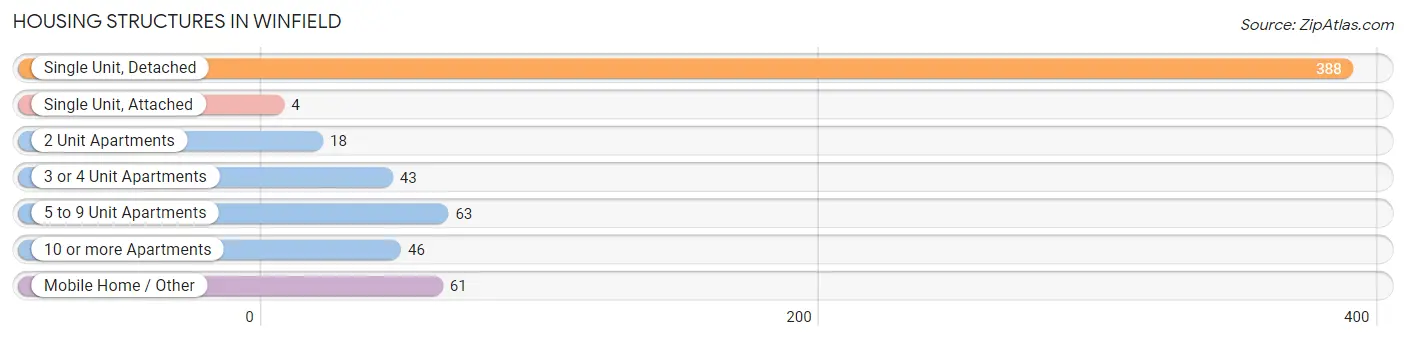
| Structure Type | # Housing Units | % Housing Units |
| Single Unit, Detached | 388 | 62.3% |
| Single Unit, Attached | 4 | 0.6% |
| 2 Unit Apartments | 18 | 2.9% |
| 3 or 4 Unit Apartments | 43 | 6.9% |
| 5 to 9 Unit Apartments | 63 | 10.1% |
| 10 or more Apartments | 46 | 7.4% |
| Mobile Home / Other | 61 | 9.8% |
| Total | 623 | 100.0% |
Housing Structures by Occupancy in Winfield
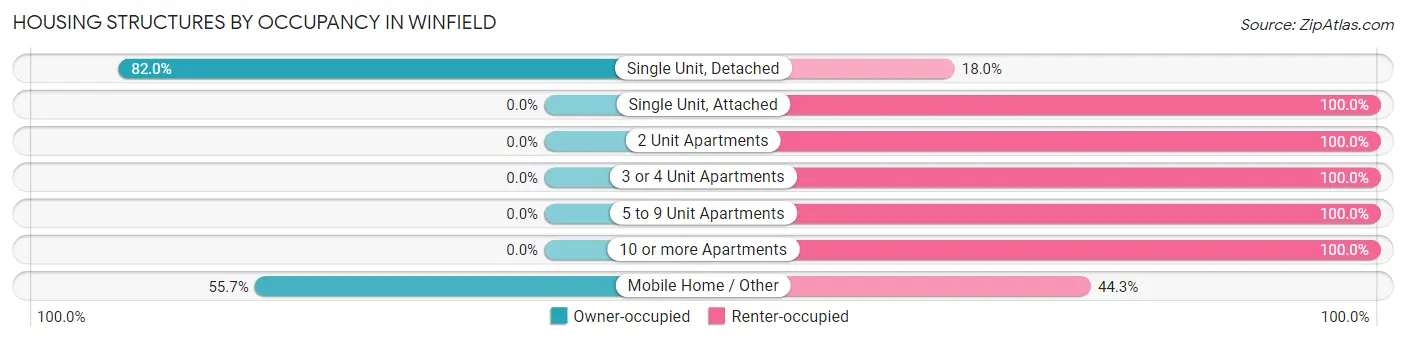
| Structure Type | Owner-occupied | Renter-occupied |
| Single Unit, Detached | 318 (82.0%) | 70 (18.0%) |
| Single Unit, Attached | 0 (0.0%) | 4 (100.0%) |
| 2 Unit Apartments | 0 (0.0%) | 18 (100.0%) |
| 3 or 4 Unit Apartments | 0 (0.0%) | 43 (100.0%) |
| 5 to 9 Unit Apartments | 0 (0.0%) | 63 (100.0%) |
| 10 or more Apartments | 0 (0.0%) | 46 (100.0%) |
| Mobile Home / Other | 34 (55.7%) | 27 (44.3%) |
| Total | 352 (56.5%) | 271 (43.5%) |
Housing Structures by Number of Rooms in Winfield
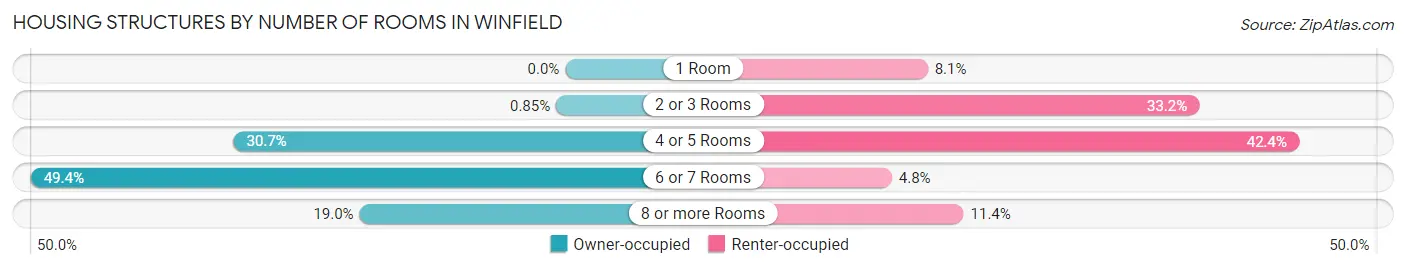
| Number of Rooms | Owner-occupied | Renter-occupied |
| 1 Room | 0 (0.0%) | 22 (8.1%) |
| 2 or 3 Rooms | 3 (0.9%) | 90 (33.2%) |
| 4 or 5 Rooms | 108 (30.7%) | 115 (42.4%) |
| 6 or 7 Rooms | 174 (49.4%) | 13 (4.8%) |
| 8 or more Rooms | 67 (19.0%) | 31 (11.4%) |
| Total | 352 (100.0%) | 271 (100.0%) |
Housing Structure by Heating Type in Winfield
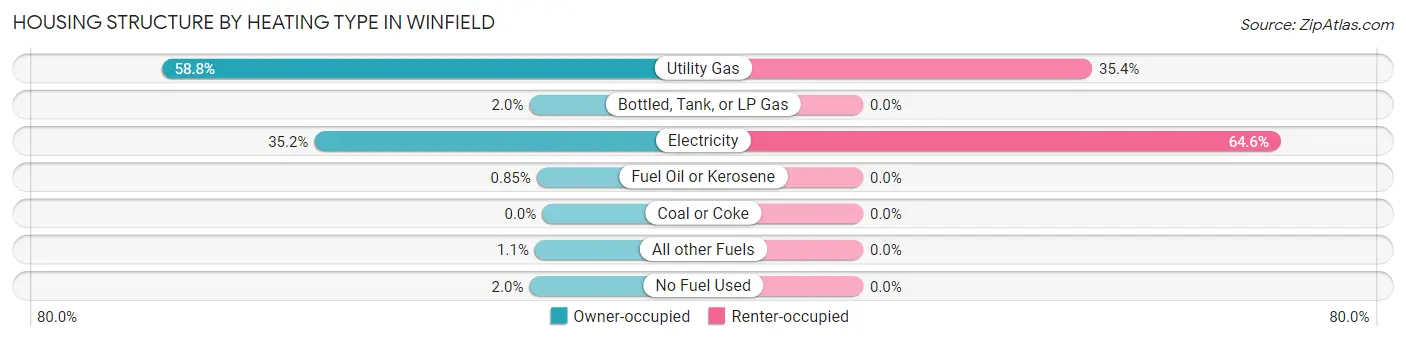
| Heating Type | Owner-occupied | Renter-occupied |
| Utility Gas | 207 (58.8%) | 96 (35.4%) |
| Bottled, Tank, or LP Gas | 7 (2.0%) | 0 (0.0%) |
| Electricity | 124 (35.2%) | 175 (64.6%) |
| Fuel Oil or Kerosene | 3 (0.9%) | 0 (0.0%) |
| Coal or Coke | 0 (0.0%) | 0 (0.0%) |
| All other Fuels | 4 (1.1%) | 0 (0.0%) |
| No Fuel Used | 7 (2.0%) | 0 (0.0%) |
| Total | 352 (100.0%) | 271 (100.0%) |
Household Vehicle Usage in Winfield
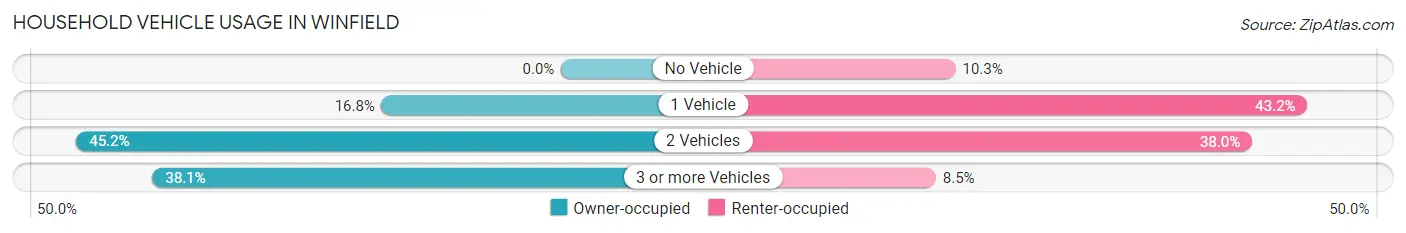
| Vehicles per Household | Owner-occupied | Renter-occupied |
| No Vehicle | 0 (0.0%) | 28 (10.3%) |
| 1 Vehicle | 59 (16.8%) | 117 (43.2%) |
| 2 Vehicles | 159 (45.2%) | 103 (38.0%) |
| 3 or more Vehicles | 134 (38.1%) | 23 (8.5%) |
| Total | 352 (100.0%) | 271 (100.0%) |
Real Estate & Mortgages in Winfield
Real Estate and Mortgage Overview in Winfield
| Characteristic | Without Mortgage | With Mortgage |
| Housing Units | 117 | 235 |
| Median Property Value | $123,800 | $168,400 |
| Median Household Income | $60,750 | $25 |
| Monthly Housing Costs | $442 | $12 |
| Real Estate Taxes | $1,125 | $0 |
Property Value by Mortgage Status in Winfield
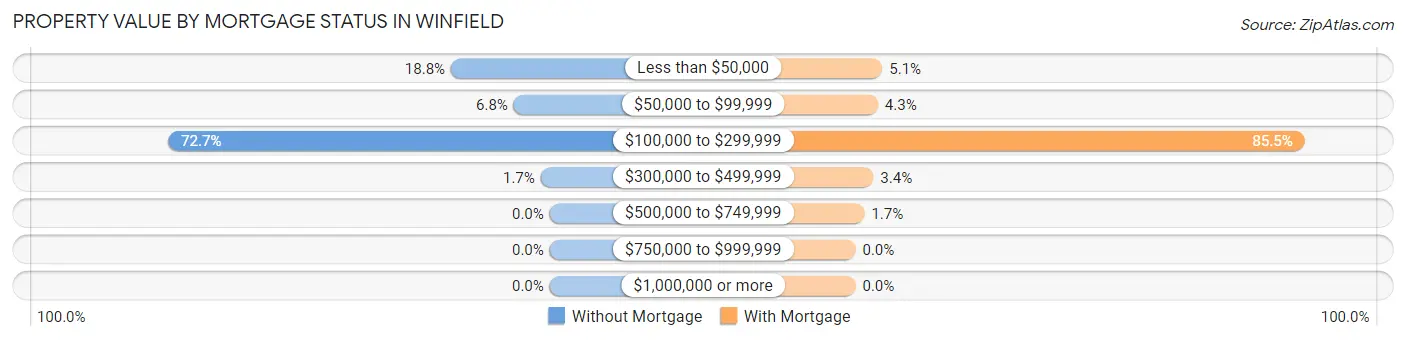
| Property Value | Without Mortgage | With Mortgage |
| Less than $50,000 | 22 (18.8%) | 12 (5.1%) |
| $50,000 to $99,999 | 8 (6.8%) | 10 (4.3%) |
| $100,000 to $299,999 | 85 (72.7%) | 201 (85.5%) |
| $300,000 to $499,999 | 2 (1.7%) | 8 (3.4%) |
| $500,000 to $749,999 | 0 (0.0%) | 4 (1.7%) |
| $750,000 to $999,999 | 0 (0.0%) | 0 (0.0%) |
| $1,000,000 or more | 0 (0.0%) | 0 (0.0%) |
| Total | 117 (100.0%) | 235 (100.0%) |
Household Income by Mortgage Status in Winfield
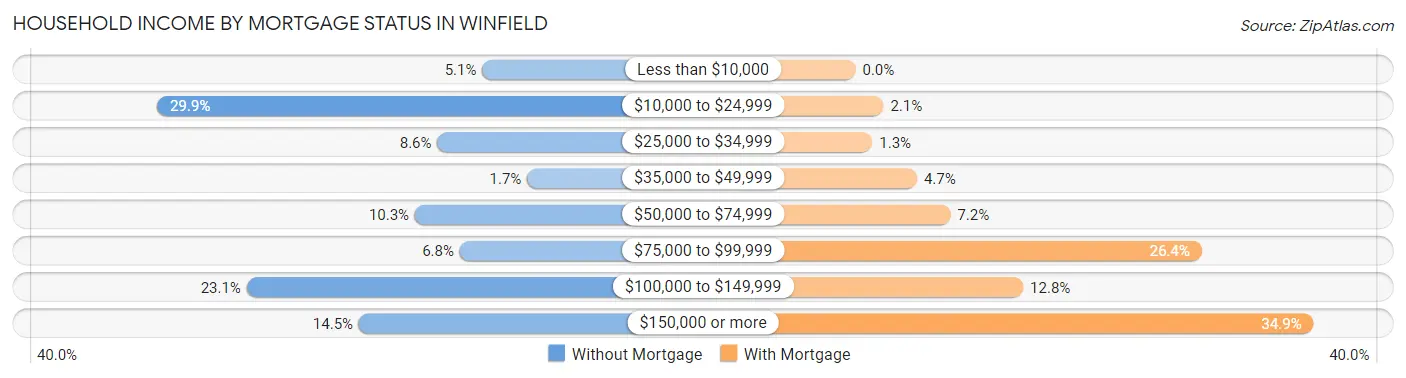
| Household Income | Without Mortgage | With Mortgage |
| Less than $10,000 | 6 (5.1%) | 0 (0.0%) |
| $10,000 to $24,999 | 35 (29.9%) | 5 (2.1%) |
| $25,000 to $34,999 | 10 (8.6%) | 3 (1.3%) |
| $35,000 to $49,999 | 2 (1.7%) | 11 (4.7%) |
| $50,000 to $74,999 | 12 (10.3%) | 17 (7.2%) |
| $75,000 to $99,999 | 8 (6.8%) | 62 (26.4%) |
| $100,000 to $149,999 | 27 (23.1%) | 30 (12.8%) |
| $150,000 or more | 17 (14.5%) | 82 (34.9%) |
| Total | 117 (100.0%) | 235 (100.0%) |
Property Value to Household Income Ratio in Winfield
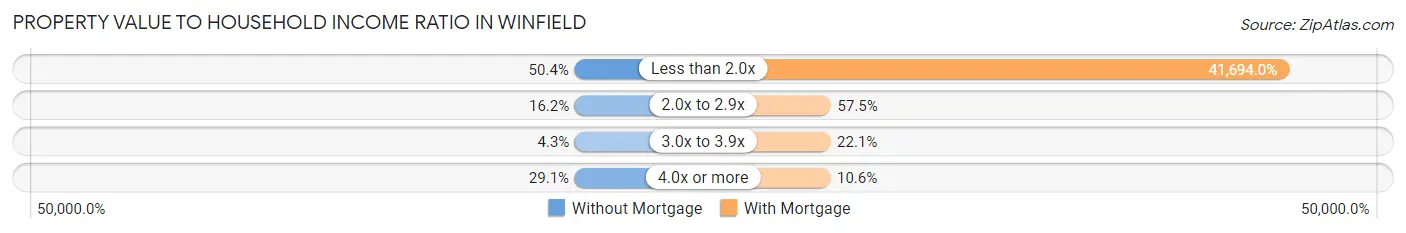
| Value-to-Income Ratio | Without Mortgage | With Mortgage |
| Less than 2.0x | 59 (50.4%) | 97,981 (41,694.0%) |
| 2.0x to 2.9x | 19 (16.2%) | 135 (57.5%) |
| 3.0x to 3.9x | 5 (4.3%) | 52 (22.1%) |
| 4.0x or more | 34 (29.1%) | 25 (10.6%) |
| Total | 117 (100.0%) | 235 (100.0%) |
Real Estate Taxes by Mortgage Status in Winfield
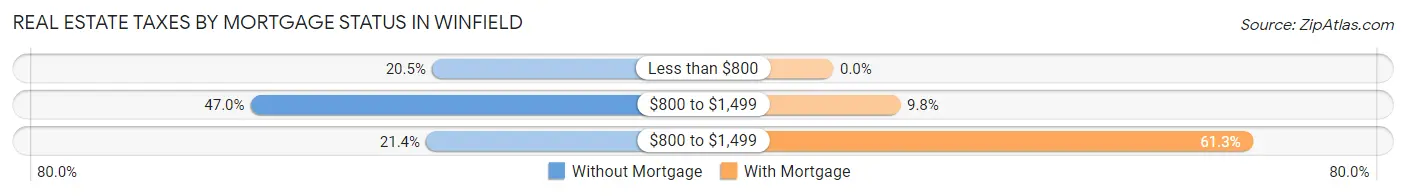
| Property Taxes | Without Mortgage | With Mortgage |
| Less than $800 | 24 (20.5%) | 0 (0.0%) |
| $800 to $1,499 | 55 (47.0%) | 23 (9.8%) |
| $800 to $1,499 | 25 (21.4%) | 144 (61.3%) |
| Total | 117 (100.0%) | 235 (100.0%) |
Health & Disability in Winfield
Health Insurance Coverage by Age in Winfield
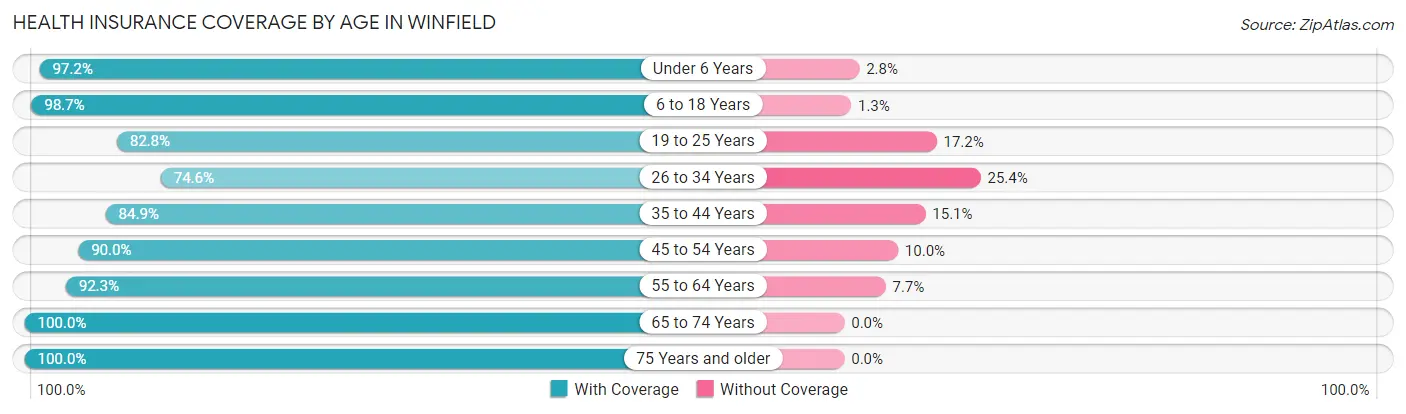
| Age Bracket | With Coverage | Without Coverage |
| Under 6 Years | 105 (97.2%) | 3 (2.8%) |
| 6 to 18 Years | 392 (98.7%) | 5 (1.3%) |
| 19 to 25 Years | 130 (82.8%) | 27 (17.2%) |
| 26 to 34 Years | 135 (74.6%) | 46 (25.4%) |
| 35 to 44 Years | 275 (84.9%) | 49 (15.1%) |
| 45 to 54 Years | 135 (90.0%) | 15 (10.0%) |
| 55 to 64 Years | 180 (92.3%) | 15 (7.7%) |
| 65 to 74 Years | 125 (100.0%) | 0 (0.0%) |
| 75 Years and older | 85 (100.0%) | 0 (0.0%) |
| Total | 1,562 (90.7%) | 160 (9.3%) |
Health Insurance Coverage by Citizenship Status in Winfield
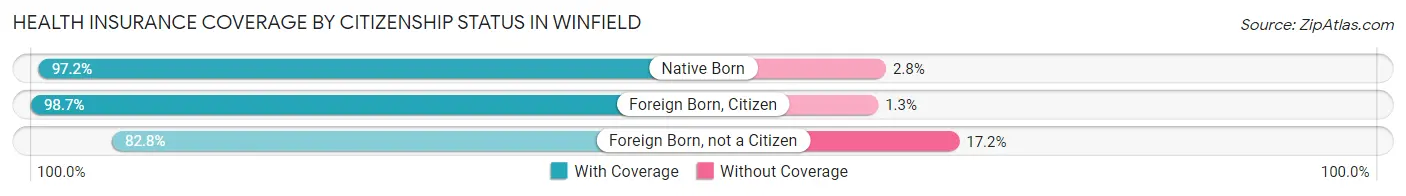
| Citizenship Status | With Coverage | Without Coverage |
| Native Born | 105 (97.2%) | 3 (2.8%) |
| Foreign Born, Citizen | 392 (98.7%) | 5 (1.3%) |
| Foreign Born, not a Citizen | 130 (82.8%) | 27 (17.2%) |
Health Insurance Coverage by Household Income in Winfield
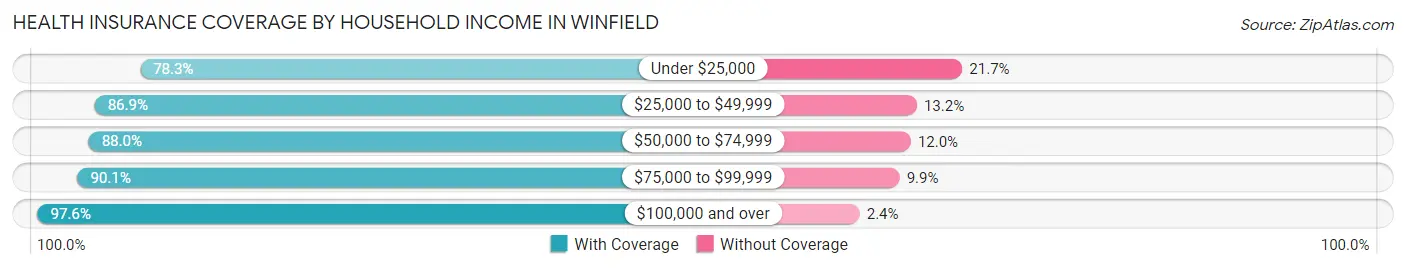
| Household Income | With Coverage | Without Coverage |
| Under $25,000 | 170 (78.3%) | 47 (21.7%) |
| $25,000 to $49,999 | 218 (86.9%) | 33 (13.2%) |
| $50,000 to $74,999 | 322 (88.0%) | 44 (12.0%) |
| $75,000 to $99,999 | 191 (90.1%) | 21 (9.9%) |
| $100,000 and over | 602 (97.6%) | 15 (2.4%) |
Public vs Private Health Insurance Coverage by Age in Winfield
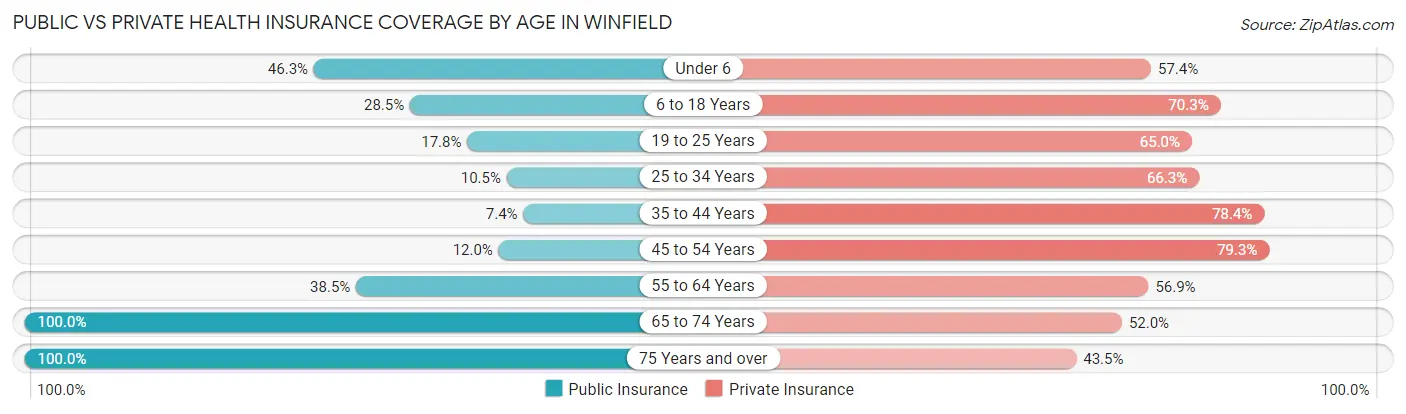
| Age Bracket | Public Insurance | Private Insurance |
| Under 6 | 50 (46.3%) | 62 (57.4%) |
| 6 to 18 Years | 113 (28.5%) | 279 (70.3%) |
| 19 to 25 Years | 28 (17.8%) | 102 (65.0%) |
| 25 to 34 Years | 19 (10.5%) | 120 (66.3%) |
| 35 to 44 Years | 24 (7.4%) | 254 (78.4%) |
| 45 to 54 Years | 18 (12.0%) | 119 (79.3%) |
| 55 to 64 Years | 75 (38.5%) | 111 (56.9%) |
| 65 to 74 Years | 125 (100.0%) | 65 (52.0%) |
| 75 Years and over | 85 (100.0%) | 37 (43.5%) |
| Total | 537 (31.2%) | 1,149 (66.7%) |
Disability Status by Sex by Age in Winfield
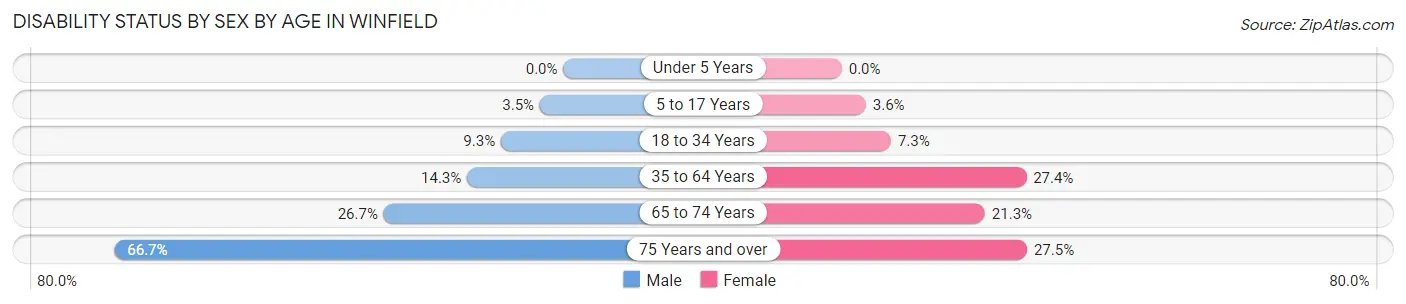
| Age Bracket | Male | Female |
| Under 5 Years | 0 (0.0%) | 0 (0.0%) |
| 5 to 17 Years | 10 (3.5%) | 5 (3.6%) |
| 18 to 34 Years | 20 (9.3%) | 10 (7.3%) |
| 35 to 64 Years | 46 (14.3%) | 95 (27.4%) |
| 65 to 74 Years | 12 (26.7%) | 17 (21.2%) |
| 75 Years and over | 30 (66.7%) | 11 (27.5%) |
Disability Class by Sex by Age in Winfield
Disability Class: Hearing Difficulty
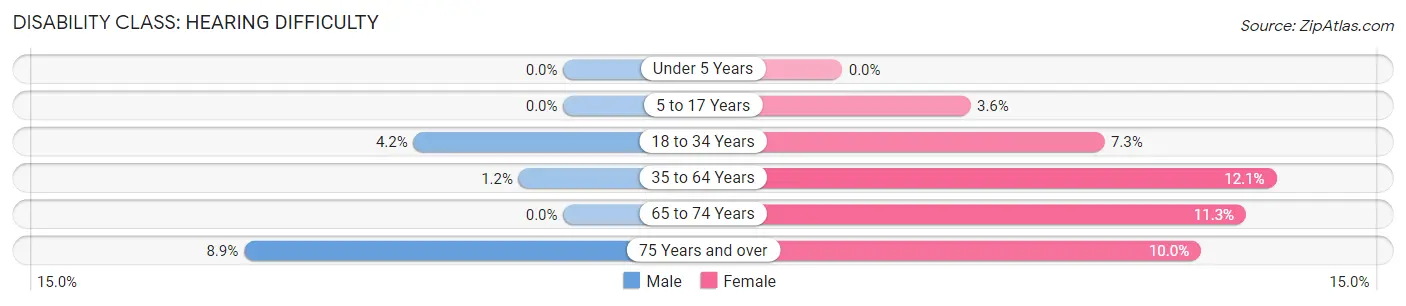
| Age Bracket | Male | Female |
| Under 5 Years | 0 (0.0%) | 0 (0.0%) |
| 5 to 17 Years | 0 (0.0%) | 5 (3.6%) |
| 18 to 34 Years | 9 (4.2%) | 10 (7.3%) |
| 35 to 64 Years | 4 (1.2%) | 42 (12.1%) |
| 65 to 74 Years | 0 (0.0%) | 9 (11.3%) |
| 75 Years and over | 4 (8.9%) | 4 (10.0%) |
Disability Class: Vision Difficulty
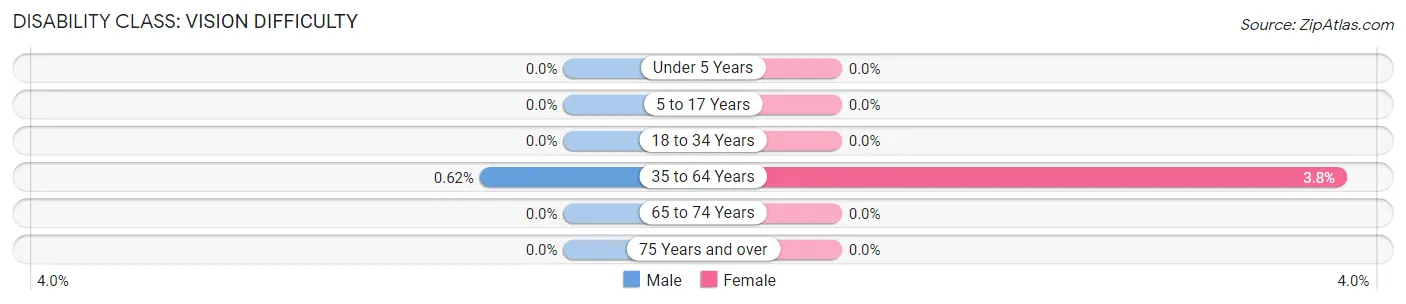
| Age Bracket | Male | Female |
| Under 5 Years | 0 (0.0%) | 0 (0.0%) |
| 5 to 17 Years | 0 (0.0%) | 0 (0.0%) |
| 18 to 34 Years | 0 (0.0%) | 0 (0.0%) |
| 35 to 64 Years | 2 (0.6%) | 13 (3.7%) |
| 65 to 74 Years | 0 (0.0%) | 0 (0.0%) |
| 75 Years and over | 0 (0.0%) | 0 (0.0%) |
Disability Class: Cognitive Difficulty
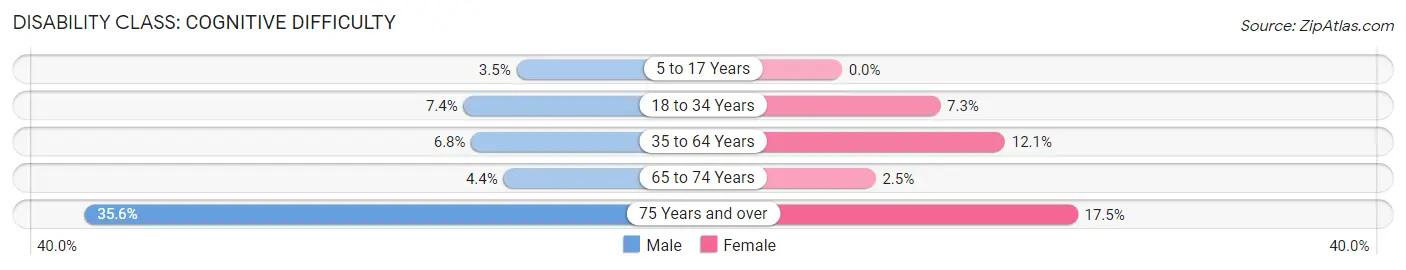
| Age Bracket | Male | Female |
| 5 to 17 Years | 10 (3.5%) | 0 (0.0%) |
| 18 to 34 Years | 16 (7.4%) | 10 (7.3%) |
| 35 to 64 Years | 22 (6.8%) | 42 (12.1%) |
| 65 to 74 Years | 2 (4.4%) | 2 (2.5%) |
| 75 Years and over | 16 (35.6%) | 7 (17.5%) |
Disability Class: Ambulatory Difficulty
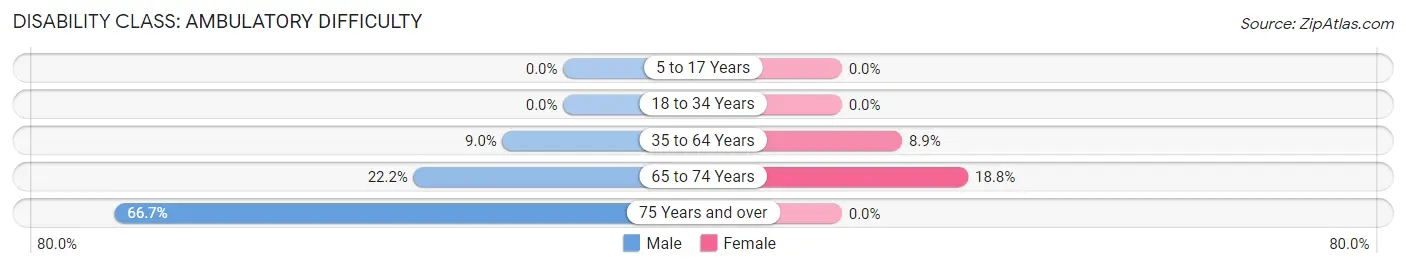
| Age Bracket | Male | Female |
| 5 to 17 Years | 0 (0.0%) | 0 (0.0%) |
| 18 to 34 Years | 0 (0.0%) | 0 (0.0%) |
| 35 to 64 Years | 29 (9.0%) | 31 (8.9%) |
| 65 to 74 Years | 10 (22.2%) | 15 (18.8%) |
| 75 Years and over | 30 (66.7%) | 0 (0.0%) |
Disability Class: Self-Care Difficulty
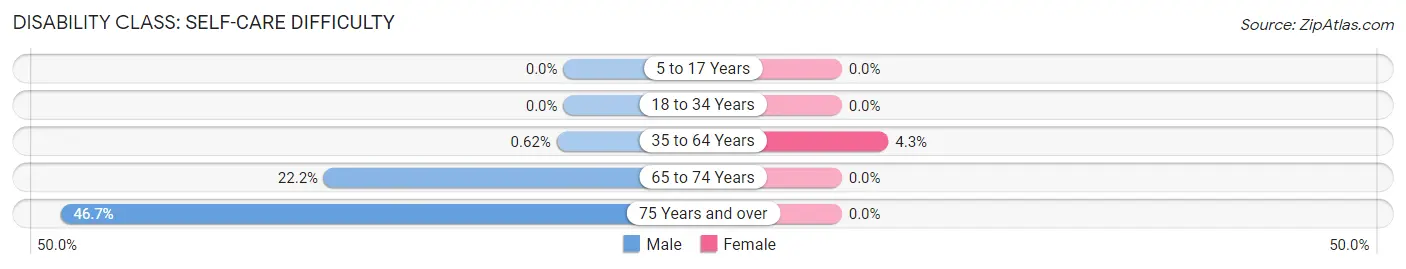
| Age Bracket | Male | Female |
| 5 to 17 Years | 0 (0.0%) | 0 (0.0%) |
| 18 to 34 Years | 0 (0.0%) | 0 (0.0%) |
| 35 to 64 Years | 2 (0.6%) | 15 (4.3%) |
| 65 to 74 Years | 10 (22.2%) | 0 (0.0%) |
| 75 Years and over | 21 (46.7%) | 0 (0.0%) |
Technology Access in Winfield
Computing Device Access in Winfield
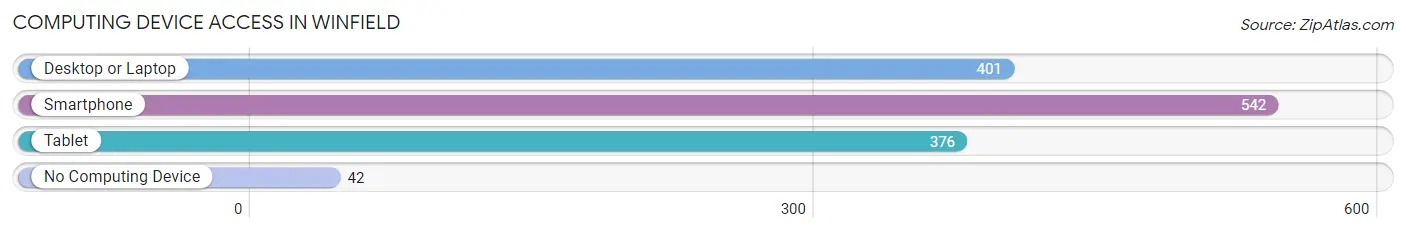
| Device Type | # Households | % Households |
| Desktop or Laptop | 401 | 64.4% |
| Smartphone | 542 | 87.0% |
| Tablet | 376 | 60.4% |
| No Computing Device | 42 | 6.7% |
| Total | 623 | 100.0% |
Internet Access in Winfield
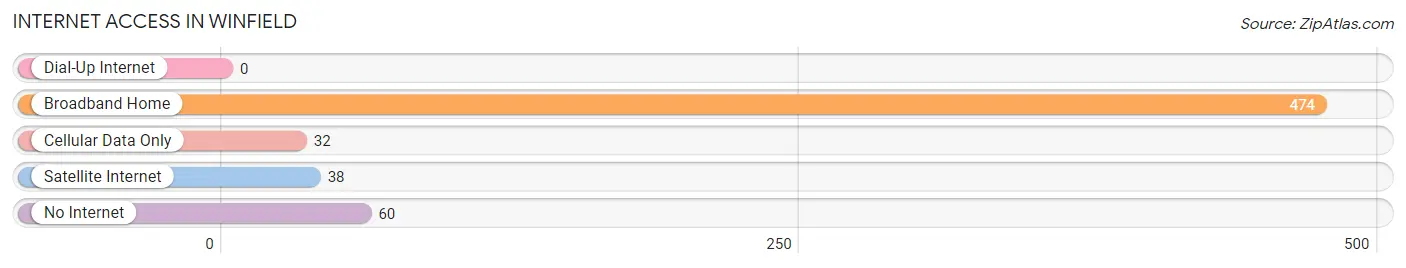
| Internet Type | # Households | % Households |
| Dial-Up Internet | 0 | 0.0% |
| Broadband Home | 474 | 76.1% |
| Cellular Data Only | 32 | 5.1% |
| Satellite Internet | 38 | 6.1% |
| No Internet | 60 | 9.6% |
| Total | 623 | 100.0% |
Winfield Summary
Winfield, Missouri is a small town located in Lincoln County, Missouri. It is situated on the banks of the Mississippi River, approximately 30 miles north of St. Louis. The town was founded in 1837 and has a population of approximately 1,500 people.
Geography
Winfield is located in the northern part of Lincoln County, Missouri. It is situated on the banks of the Mississippi River, approximately 30 miles north of St. Louis. The town is surrounded by rolling hills and farmland, and is located in the Ozark Plateau region. The climate in Winfield is humid and subtropical, with hot summers and mild winters.
Economy
The economy of Winfield is largely based on agriculture. The town is home to several farms, which produce a variety of crops, including corn, soybeans, wheat, and hay. Winfield also has a small manufacturing sector, which produces a variety of products, including furniture, clothing, and food products. The town also has a few small businesses, including restaurants, grocery stores, and a few retail stores.
Demographics
As of the 2010 census, Winfield had a population of 1,500 people. The racial makeup of the town was 97.3% White, 0.7% African American, 0.3% Native American, 0.3% Asian, and 1.3% from other races. The median household income in Winfield was $37,500, and the median family income was $45,000. The per capita income in Winfield was $18,000.
History
Winfield was founded in 1837 by a group of settlers from Kentucky. The town was named after Winfield Scott, a prominent military leader during the War of 1812. The town quickly grew, and by the late 19th century, it had become a thriving agricultural center. In the early 20th century, Winfield was home to several factories, which produced a variety of products, including furniture, clothing, and food products.
In the late 20th century, Winfield began to decline, as many of the factories closed and the population began to decline. However, in recent years, the town has seen a resurgence, as new businesses have opened and the population has begun to grow again. Today, Winfield is a small, but vibrant town, with a strong sense of community and a bright future.
Common Questions
What is Per Capita Income in Winfield?
Per Capita income in Winfield is $27,002.
What is the Median Family Income in Winfield?
Median Family Income in Winfield is $72,419.
What is the Median Household income in Winfield?
Median Household Income in Winfield is $59,598.
What is Income or Wage Gap in Winfield?
Income or Wage Gap in Winfield is 40.2%.
Women in Winfield earn 59.8 cents for every dollar earned by a man.
What is Inequality or Gini Index in Winfield?
Inequality or Gini Index in Winfield is 0.39.
What is the Total Population of Winfield?
Total Population of Winfield is 1,722.
What is the Total Male Population of Winfield?
Total Male Population of Winfield is 949.
What is the Total Female Population of Winfield?
Total Female Population of Winfield is 773.
What is the Ratio of Males per 100 Females in Winfield?
There are 122.77 Males per 100 Females in Winfield.
What is the Ratio of Females per 100 Males in Winfield?
There are 81.45 Females per 100 Males in Winfield.
What is the Median Population Age in Winfield?
Median Population Age in Winfield is 35.9 Years.
What is the Average Family Size in Winfield
Average Family Size in Winfield is 3.3 People.
What is the Average Household Size in Winfield
Average Household Size in Winfield is 2.7 People.
How Large is the Labor Force in Winfield?
There are 829 People in the Labor Forcein in Winfield.
What is the Percentage of People in the Labor Force in Winfield?
65.1% of People are in the Labor Force in Winfield.
What is the Unemployment Rate in Winfield?
Unemployment Rate in Winfield is 4.5%.