Jamesport, MO Map & Demographics
Jamesport Map
Jamesport Overview
$24,749
PER CAPITA INCOME
$67,031
AVG FAMILY INCOME
$48,125
AVG HOUSEHOLD INCOME
34.8%
WAGE / INCOME GAP [ % ]
65.2¢/ $1
WAGE / INCOME GAP [ $ ]
0.41
INEQUALITY / GINI INDEX
625
TOTAL POPULATION
310
MALE POPULATION
315
FEMALE POPULATION
98.41
MALES / 100 FEMALES
101.61
FEMALES / 100 MALES
43.2
MEDIAN AGE
3.1
AVG FAMILY SIZE
2.6
AVG HOUSEHOLD SIZE
296
LABOR FORCE [ PEOPLE ]
55.2%
PERCENT IN LABOR FORCE
2.0%
UNEMPLOYMENT RATE
Jamesport Zip Codes
Jamesport Area Codes
Income in Jamesport
Income Overview in Jamesport
Per Capita Income in Jamesport is $24,749, while median incomes of families and households are $67,031 and $48,125 respectively.
| Characteristic | Number | Measure |
| Per Capita Income | 625 | $24,749 |
| Median Family Income | 161 | $67,031 |
| Mean Family Income | 161 | $77,039 |
| Median Household Income | 243 | $48,125 |
| Mean Household Income | 243 | $61,188 |
| Income Deficit | 161 | $0 |
| Wage / Income Gap (%) | 625 | 34.82% |
| Wage / Income Gap ($) | 625 | 65.18¢ per $1 |
| Gini / Inequality Index | 625 | 0.41 |
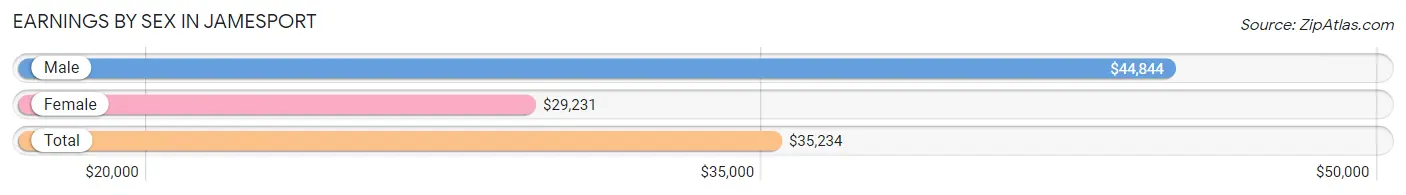
Earnings by Sex in Jamesport
Average Earnings in Jamesport are $35,234, $44,844 for men and $29,231 for women, a difference of 34.8%.
| Sex | Number | Average Earnings |
| Male | 173 (55.3%) | $44,844 |
| Female | 140 (44.7%) | $29,231 |
| Total | 313 (100.0%) | $35,234 |
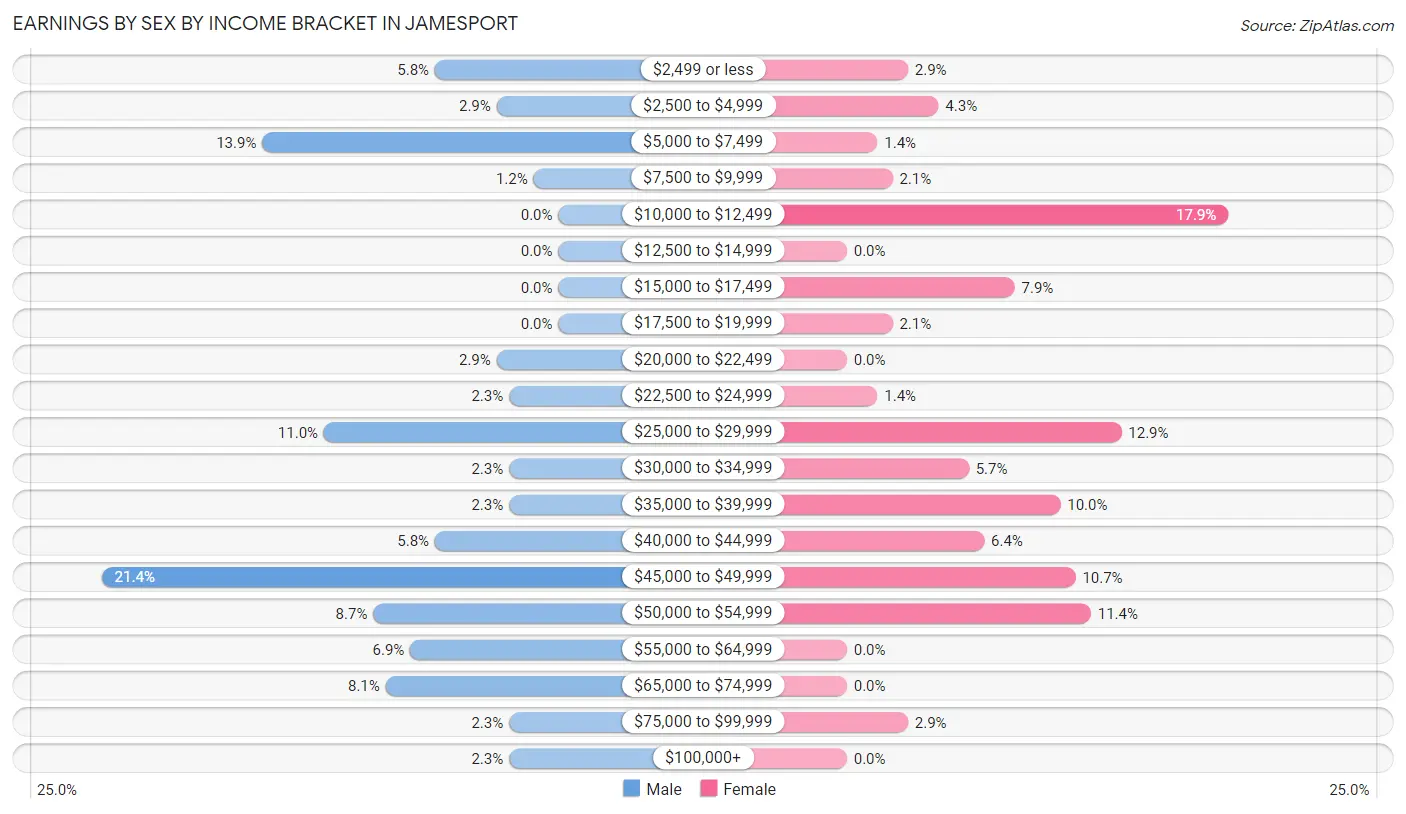
Earnings by Sex by Income Bracket in Jamesport
The most common earnings brackets in Jamesport are $45,000 to $49,999 for men (37 | 21.4%) and $10,000 to $12,499 for women (25 | 17.9%).
| Income | Male | Female |
| $2,499 or less | 10 (5.8%) | 4 (2.9%) |
| $2,500 to $4,999 | 5 (2.9%) | 6 (4.3%) |
| $5,000 to $7,499 | 24 (13.9%) | 2 (1.4%) |
| $7,500 to $9,999 | 2 (1.2%) | 3 (2.1%) |
| $10,000 to $12,499 | 0 (0.0%) | 25 (17.9%) |
| $12,500 to $14,999 | 0 (0.0%) | 0 (0.0%) |
| $15,000 to $17,499 | 0 (0.0%) | 11 (7.9%) |
| $17,500 to $19,999 | 0 (0.0%) | 3 (2.1%) |
| $20,000 to $22,499 | 5 (2.9%) | 0 (0.0%) |
| $22,500 to $24,999 | 4 (2.3%) | 2 (1.4%) |
| $25,000 to $29,999 | 19 (11.0%) | 18 (12.9%) |
| $30,000 to $34,999 | 4 (2.3%) | 8 (5.7%) |
| $35,000 to $39,999 | 4 (2.3%) | 14 (10.0%) |
| $40,000 to $44,999 | 10 (5.8%) | 9 (6.4%) |
| $45,000 to $49,999 | 37 (21.4%) | 15 (10.7%) |
| $50,000 to $54,999 | 15 (8.7%) | 16 (11.4%) |
| $55,000 to $64,999 | 12 (6.9%) | 0 (0.0%) |
| $65,000 to $74,999 | 14 (8.1%) | 0 (0.0%) |
| $75,000 to $99,999 | 4 (2.3%) | 4 (2.9%) |
| $100,000+ | 4 (2.3%) | 0 (0.0%) |
| Total | 173 (100.0%) | 140 (100.0%) |
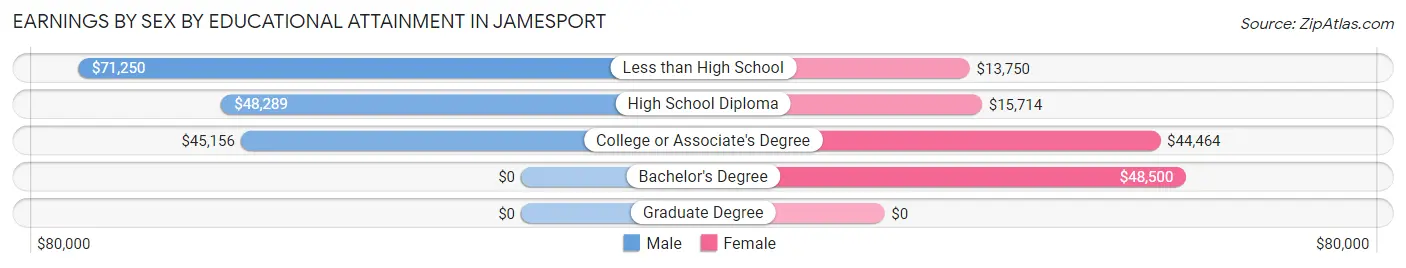
Earnings by Sex by Educational Attainment in Jamesport
Average earnings in Jamesport are $47,431 for men and $33,125 for women, a difference of 30.2%. Men with an educational attainment of less than high school enjoy the highest average annual earnings of $71,250, while those with college or associate's degree education earn the least with $45,156. Women with an educational attainment of bachelor's degree earn the most with the average annual earnings of $48,500, while those with less than high school education have the smallest earnings of $13,750.
| Educational Attainment | Male Income | Female Income |
| Less than High School | $71,250 | $13,750 |
| High School Diploma | $48,289 | $15,714 |
| College or Associate's Degree | $45,156 | $44,464 |
| Bachelor's Degree | - | - |
| Graduate Degree | - | - |
| Total | $47,431 | $33,125 |
Family Income in Jamesport
Family Income Brackets in Jamesport
According to the Jamesport family income data, there are 42 families falling into the $100,000 to $149,999 income range, which is the most common income bracket and makes up 26.1% of all families.
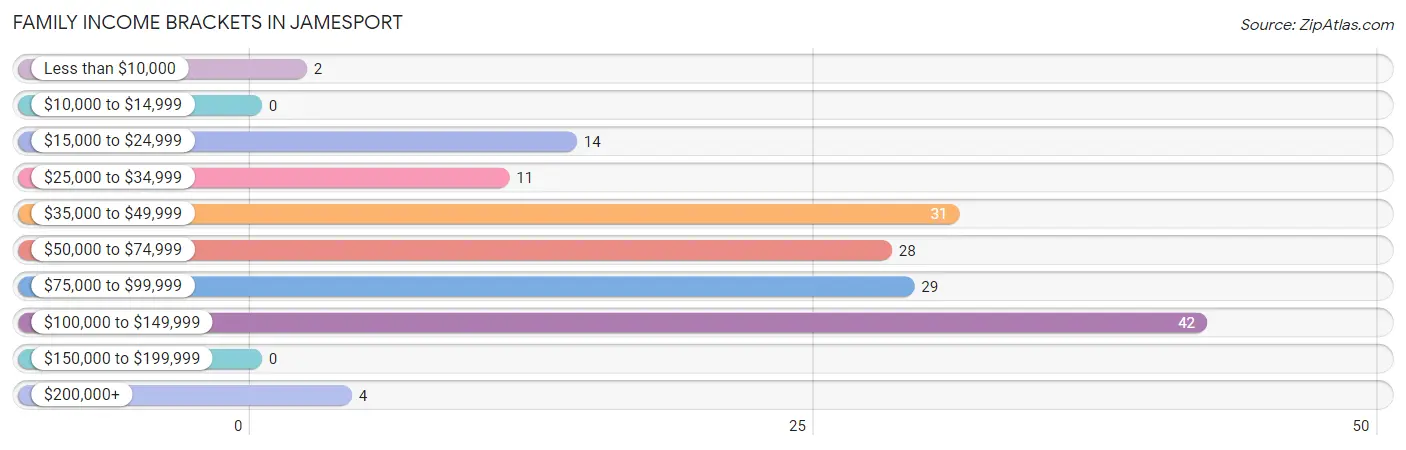
| Income Bracket | # Families | % Families |
| Less than $10,000 | 2 | 1.2% |
| $10,000 to $14,999 | 0 | 0.0% |
| $15,000 to $24,999 | 14 | 8.7% |
| $25,000 to $34,999 | 11 | 6.8% |
| $35,000 to $49,999 | 31 | 19.3% |
| $50,000 to $74,999 | 28 | 17.4% |
| $75,000 to $99,999 | 29 | 18.0% |
| $100,000 to $149,999 | 42 | 26.1% |
| $150,000 to $199,999 | 0 | 0.0% |
| $200,000+ | 4 | 2.5% |
Family Income by Famaliy Size in Jamesport
3-person families (34 | 21.1%) account for the highest median family income in Jamesport with $83,750 per family, while 3-person families (34 | 21.1%) have the highest median income of $27,917 per family member.
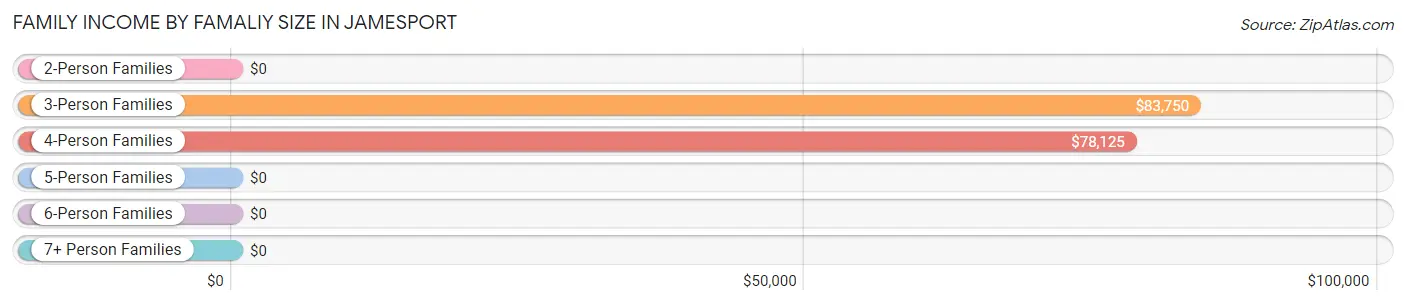
| Income Bracket | # Families | Median Income |
| 2-Person Families | 87 (54.0%) | $0 |
| 3-Person Families | 34 (21.1%) | $83,750 |
| 4-Person Families | 27 (16.8%) | $78,125 |
| 5-Person Families | 4 (2.5%) | $0 |
| 6-Person Families | 6 (3.7%) | $0 |
| 7+ Person Families | 3 (1.9%) | $0 |
| Total | 161 (100.0%) | $67,031 |
Family Income by Number of Earners in Jamesport
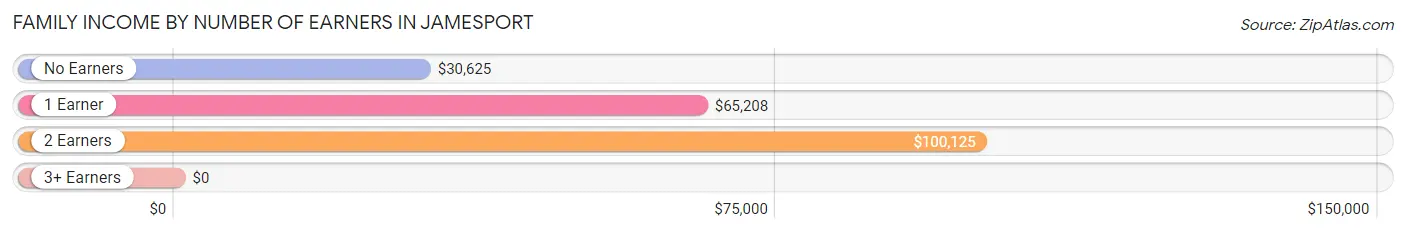
| Number of Earners | # Families | Median Income |
| No Earners | 38 (23.6%) | $30,625 |
| 1 Earner | 39 (24.2%) | $65,208 |
| 2 Earners | 70 (43.5%) | $100,125 |
| 3+ Earners | 14 (8.7%) | $0 |
| Total | 161 (100.0%) | $67,031 |
Household Income in Jamesport
Household Income Brackets in Jamesport
With 52 households falling in the category, the $15,000 to $24,999 income range is the most frequent in Jamesport, accounting for 21.4% of all households.
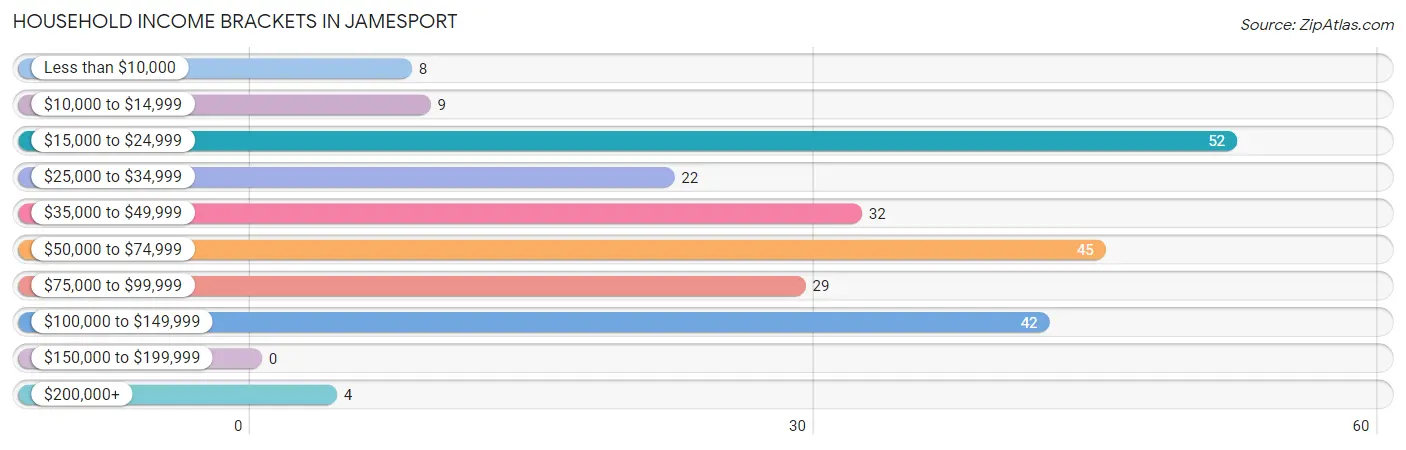
| Income Bracket | # Households | % Households |
| Less than $10,000 | 8 | 3.3% |
| $10,000 to $14,999 | 9 | 3.7% |
| $15,000 to $24,999 | 52 | 21.4% |
| $25,000 to $34,999 | 22 | 9.1% |
| $35,000 to $49,999 | 32 | 13.2% |
| $50,000 to $74,999 | 45 | 18.5% |
| $75,000 to $99,999 | 29 | 11.9% |
| $100,000 to $149,999 | 42 | 17.3% |
| $150,000 to $199,999 | 0 | 0.0% |
| $200,000+ | 4 | 1.6% |
Household Income by Householder Age in Jamesport
The median household income in Jamesport is $48,125, with the highest median household income of $78,214 found in the 45 to 64 years age bracket for the primary householder. A total of 88 households (36.2%) fall into this category. Meanwhile, the 15 to 24 years age bracket for the primary householder has the lowest median household income of $0, with 20 households (8.2%) in this group.
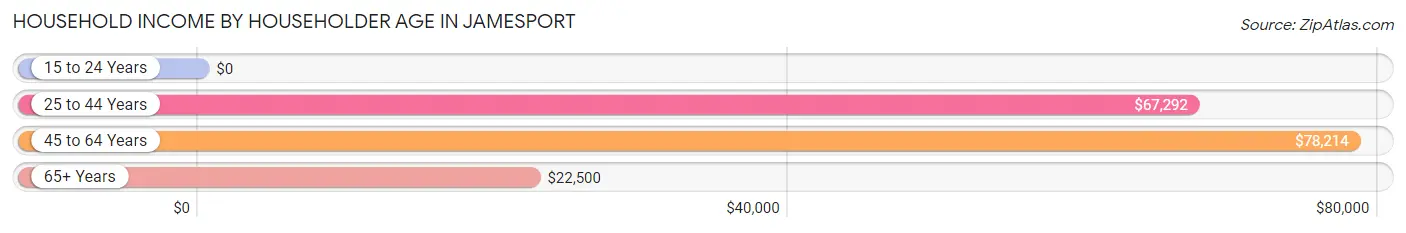
| Income Bracket | # Households | Median Income |
| 15 to 24 Years | 20 (8.2%) | $0 |
| 25 to 44 Years | 47 (19.3%) | $67,292 |
| 45 to 64 Years | 88 (36.2%) | $78,214 |
| 65+ Years | 88 (36.2%) | $22,500 |
| Total | 243 (100.0%) | $48,125 |
Poverty in Jamesport
Income Below Poverty by Sex and Age in Jamesport
With 16.1% poverty level for males and 7.6% for females among the residents of Jamesport, 18 to 24 year old males and under 5 year old females are the most vulnerable to poverty, with 39 males (78.0%) and 6 females (21.4%) in their respective age groups living below the poverty level.
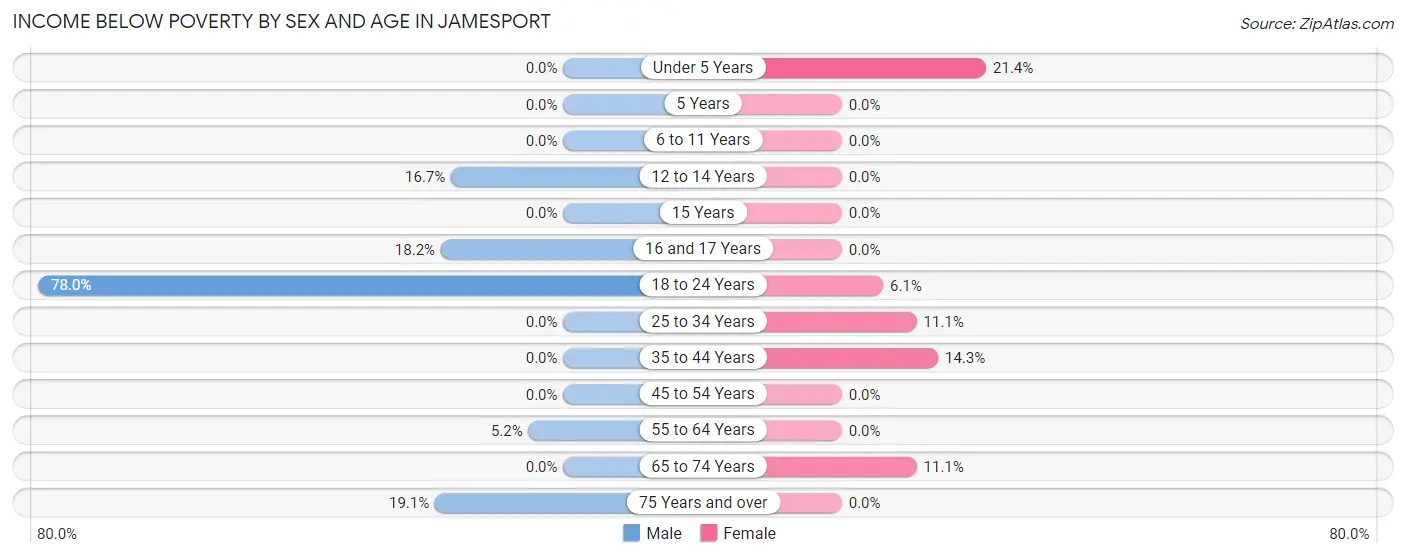
| Age Bracket | Male | Female |
| Under 5 Years | 0 (0.0%) | 6 (21.4%) |
| 5 Years | 0 (0.0%) | 0 (0.0%) |
| 6 to 11 Years | 0 (0.0%) | 0 (0.0%) |
| 12 to 14 Years | 2 (16.7%) | 0 (0.0%) |
| 15 Years | 0 (0.0%) | 0 (0.0%) |
| 16 and 17 Years | 2 (18.2%) | 0 (0.0%) |
| 18 to 24 Years | 39 (78.0%) | 3 (6.1%) |
| 25 to 34 Years | 0 (0.0%) | 2 (11.1%) |
| 35 to 44 Years | 0 (0.0%) | 7 (14.3%) |
| 45 to 54 Years | 0 (0.0%) | 0 (0.0%) |
| 55 to 64 Years | 3 (5.2%) | 0 (0.0%) |
| 65 to 74 Years | 0 (0.0%) | 6 (11.1%) |
| 75 Years and over | 4 (19.1%) | 0 (0.0%) |
| Total | 50 (16.1%) | 24 (7.6%) |
Income Above Poverty by Sex and Age in Jamesport
According to the poverty statistics in Jamesport, males aged under 5 years and females aged 5 years are the age groups that are most secure financially, with 100.0% of males and 100.0% of females in these age groups living above the poverty line.
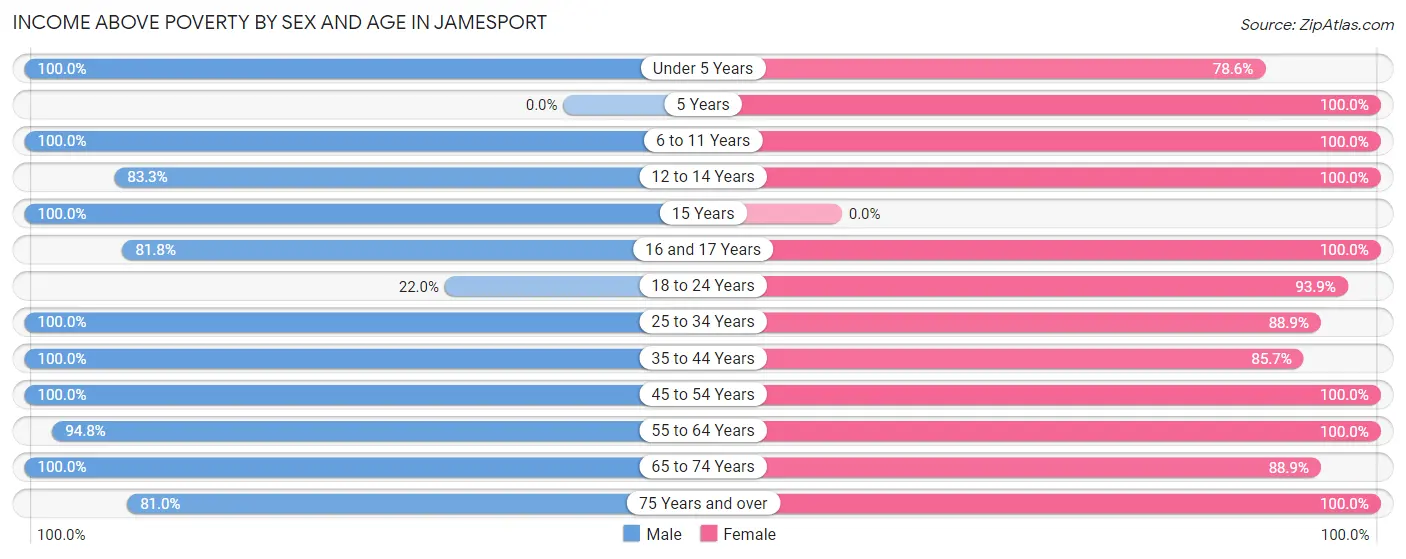
| Age Bracket | Male | Female |
| Under 5 Years | 12 (100.0%) | 22 (78.6%) |
| 5 Years | 0 (0.0%) | 5 (100.0%) |
| 6 to 11 Years | 9 (100.0%) | 5 (100.0%) |
| 12 to 14 Years | 10 (83.3%) | 14 (100.0%) |
| 15 Years | 4 (100.0%) | 0 (0.0%) |
| 16 and 17 Years | 9 (81.8%) | 8 (100.0%) |
| 18 to 24 Years | 11 (22.0%) | 46 (93.9%) |
| 25 to 34 Years | 37 (100.0%) | 16 (88.9%) |
| 35 to 44 Years | 14 (100.0%) | 42 (85.7%) |
| 45 to 54 Years | 44 (100.0%) | 21 (100.0%) |
| 55 to 64 Years | 55 (94.8%) | 47 (100.0%) |
| 65 to 74 Years | 38 (100.0%) | 48 (88.9%) |
| 75 Years and over | 17 (80.9%) | 17 (100.0%) |
| Total | 260 (83.9%) | 291 (92.4%) |
Income Below Poverty Among Married-Couple Families in Jamesport
The poverty statistics for married-couple families in Jamesport show that 2.9% or 4 of the total 138 families live below the poverty line. Families with 1 or 2 children have the highest poverty rate of 8.5%, comprising of 4 families. On the other hand, families with no children have the lowest poverty rate of 0.0%, which includes 0 families.
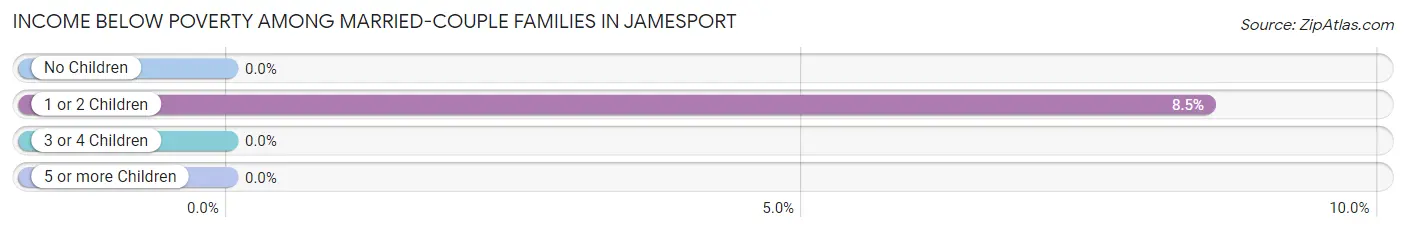
| Children | Above Poverty | Below Poverty |
| No Children | 88 (100.0%) | 0 (0.0%) |
| 1 or 2 Children | 43 (91.5%) | 4 (8.5%) |
| 3 or 4 Children | 3 (100.0%) | 0 (0.0%) |
| 5 or more Children | 0 (0.0%) | 0 (0.0%) |
| Total | 134 (97.1%) | 4 (2.9%) |
Income Below Poverty Among Single-Parent Households in Jamesport
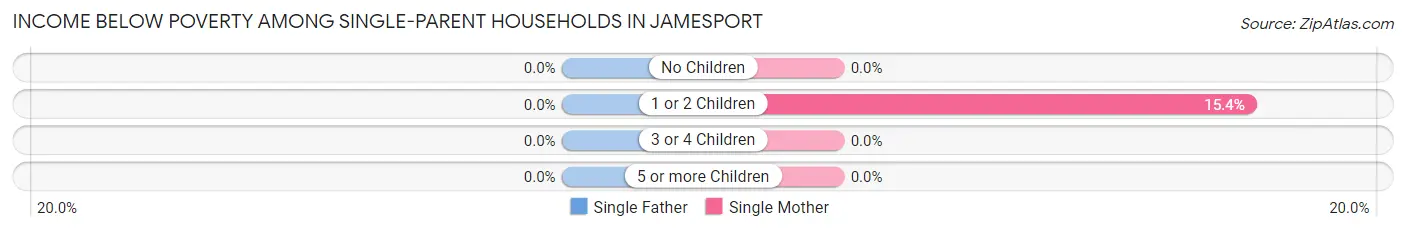
| Children | Single Father | Single Mother |
| No Children | 0 (0.0%) | 0 (0.0%) |
| 1 or 2 Children | 0 (0.0%) | 2 (15.4%) |
| 3 or 4 Children | 0 (0.0%) | 0 (0.0%) |
| 5 or more Children | 0 (0.0%) | 0 (0.0%) |
| Total | 0 (0.0%) | 2 (10.5%) |
Income Below Poverty Among Married-Couple vs Single-Parent Households in Jamesport
The poverty data for Jamesport shows that 4 of the married-couple family households (2.9%) and 2 of the single-parent households (8.7%) are living below the poverty level. Within the married-couple family households, those with 1 or 2 children have the highest poverty rate, with 4 households (8.5%) falling below the poverty line. Among the single-parent households, those with 1 or 2 children have the highest poverty rate, with 2 household (11.8%) living below poverty.
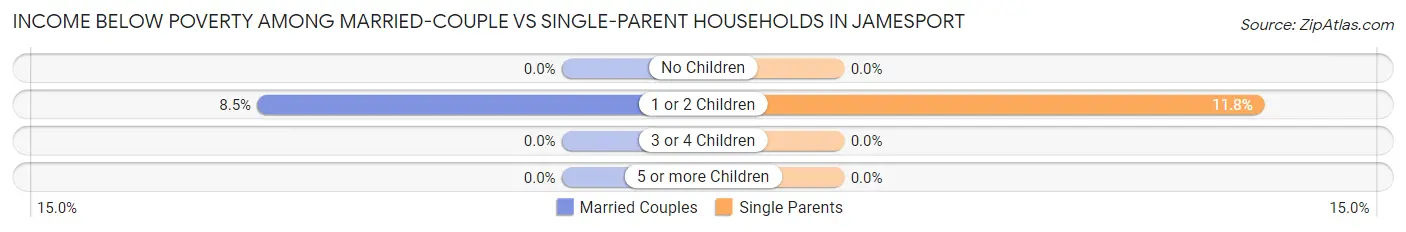
| Children | Married-Couple Families | Single-Parent Households |
| No Children | 0 (0.0%) | 0 (0.0%) |
| 1 or 2 Children | 4 (8.5%) | 2 (11.8%) |
| 3 or 4 Children | 0 (0.0%) | 0 (0.0%) |
| 5 or more Children | 0 (0.0%) | 0 (0.0%) |
| Total | 4 (2.9%) | 2 (8.7%) |
Race in Jamesport
The most populous races in Jamesport are White / Caucasian (598 | 95.7%), Two or more Races (18 | 2.9%), and Hispanic or Latino (15 | 2.4%).
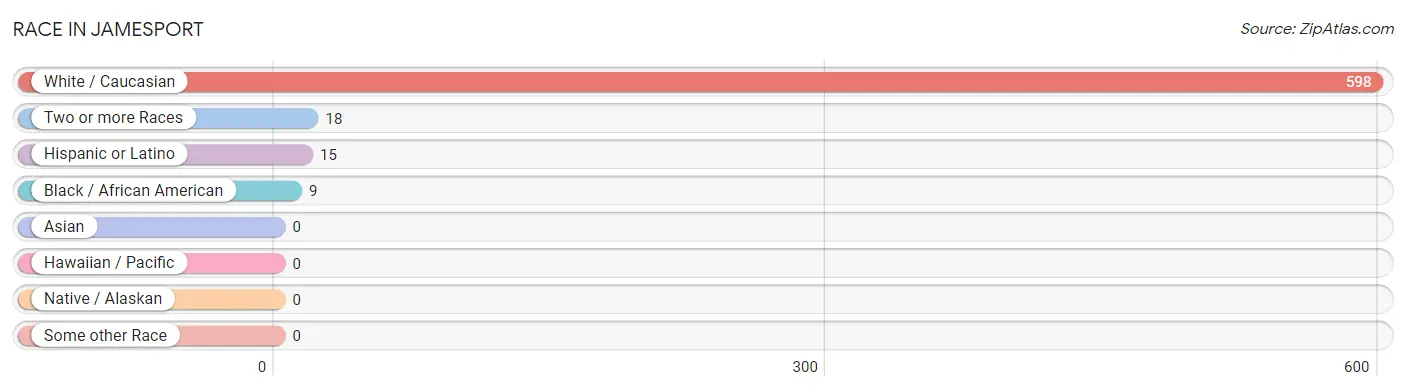
| Race | # Population | % Population |
| Asian | 0 | 0.0% |
| Black / African American | 9 | 1.4% |
| Hawaiian / Pacific | 0 | 0.0% |
| Hispanic or Latino | 15 | 2.4% |
| Native / Alaskan | 0 | 0.0% |
| White / Caucasian | 598 | 95.7% |
| Two or more Races | 18 | 2.9% |
| Some other Race | 0 | 0.0% |
| Total | 625 | 100.0% |
Ancestry in Jamesport
The most populous ancestries reported in Jamesport are American (146 | 23.4%), German (103 | 16.5%), English (51 | 8.2%), Irish (47 | 7.5%), and Scottish (29 | 4.6%), together accounting for 60.2% of all Jamesport residents.
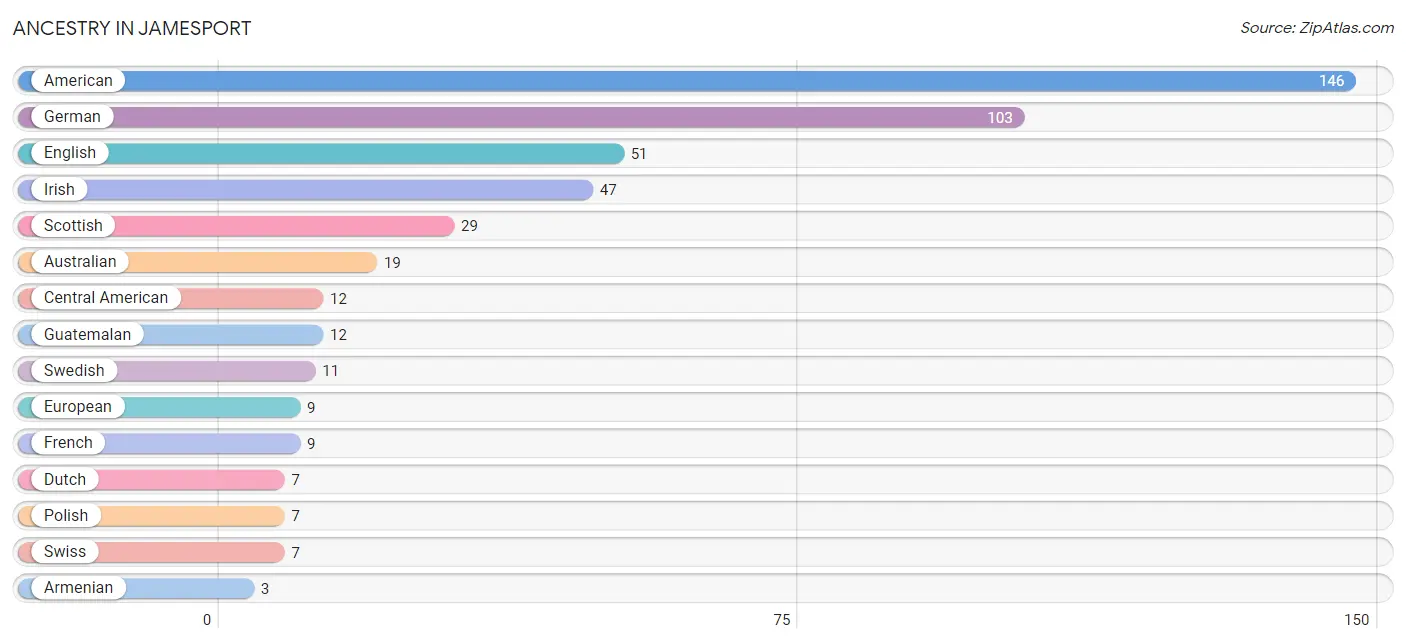
| Ancestry | # Population | % Population |
| American | 146 | 23.4% |
| Armenian | 3 | 0.5% |
| Australian | 19 | 3.0% |
| Central American | 12 | 1.9% |
| Cherokee | 3 | 0.5% |
| Dutch | 7 | 1.1% |
| English | 51 | 8.2% |
| European | 9 | 1.4% |
| French | 9 | 1.4% |
| German | 103 | 16.5% |
| Guatemalan | 12 | 1.9% |
| Irish | 47 | 7.5% |
| Mexican | 3 | 0.5% |
| Pennsylvania German | 3 | 0.5% |
| Polish | 7 | 1.1% |
| Scotch-Irish | 1 | 0.2% |
| Scottish | 29 | 4.6% |
| Swedish | 11 | 1.8% |
| Swiss | 7 | 1.1% |
| Welsh | 1 | 0.2% | View All 20 Rows |
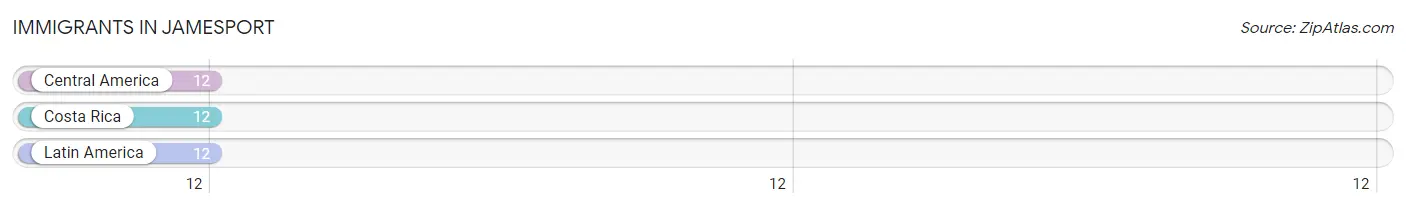
Immigrants in Jamesport
The most numerous immigrant groups reported in Jamesport came from Central America (12 | 1.9%), Costa Rica (12 | 1.9%), and Latin America (12 | 1.9%), together accounting for 5.8% of all Jamesport residents.
| Immigration Origin | # Population | % Population |
| Central America | 12 | 1.9% |
| Costa Rica | 12 | 1.9% |
| Latin America | 12 | 1.9% | View All 3 Rows |
Sex and Age in Jamesport
Sex and Age in Jamesport
The most populous age groups in Jamesport are 50 to 54 Years (44 | 14.2%) for men and 20 to 24 Years (44 | 14.0%) for women.
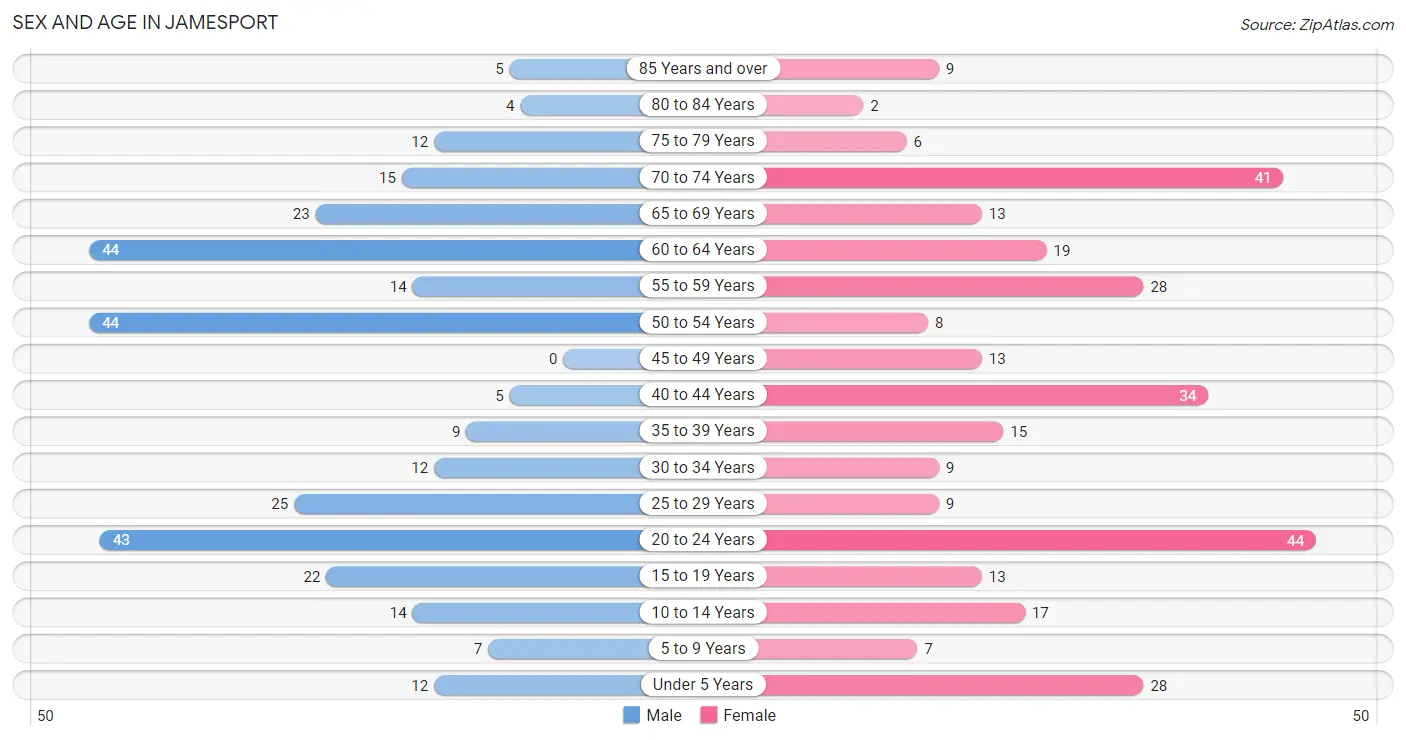
| Age Bracket | Male | Female |
| Under 5 Years | 12 (3.9%) | 28 (8.9%) |
| 5 to 9 Years | 7 (2.3%) | 7 (2.2%) |
| 10 to 14 Years | 14 (4.5%) | 17 (5.4%) |
| 15 to 19 Years | 22 (7.1%) | 13 (4.1%) |
| 20 to 24 Years | 43 (13.9%) | 44 (14.0%) |
| 25 to 29 Years | 25 (8.1%) | 9 (2.9%) |
| 30 to 34 Years | 12 (3.9%) | 9 (2.9%) |
| 35 to 39 Years | 9 (2.9%) | 15 (4.8%) |
| 40 to 44 Years | 5 (1.6%) | 34 (10.8%) |
| 45 to 49 Years | 0 (0.0%) | 13 (4.1%) |
| 50 to 54 Years | 44 (14.2%) | 8 (2.5%) |
| 55 to 59 Years | 14 (4.5%) | 28 (8.9%) |
| 60 to 64 Years | 44 (14.2%) | 19 (6.0%) |
| 65 to 69 Years | 23 (7.4%) | 13 (4.1%) |
| 70 to 74 Years | 15 (4.8%) | 41 (13.0%) |
| 75 to 79 Years | 12 (3.9%) | 6 (1.9%) |
| 80 to 84 Years | 4 (1.3%) | 2 (0.6%) |
| 85 Years and over | 5 (1.6%) | 9 (2.9%) |
| Total | 310 (100.0%) | 315 (100.0%) |
Families and Households in Jamesport
Median Family Size in Jamesport
The median family size in Jamesport is 3.11 persons per family, with single male/father families (4 | 2.5%) accounting for the largest median family size of 3.75 persons per family. On the other hand, single female/mother families (19 | 11.8%) represent the smallest median family size with 2.53 persons per family.
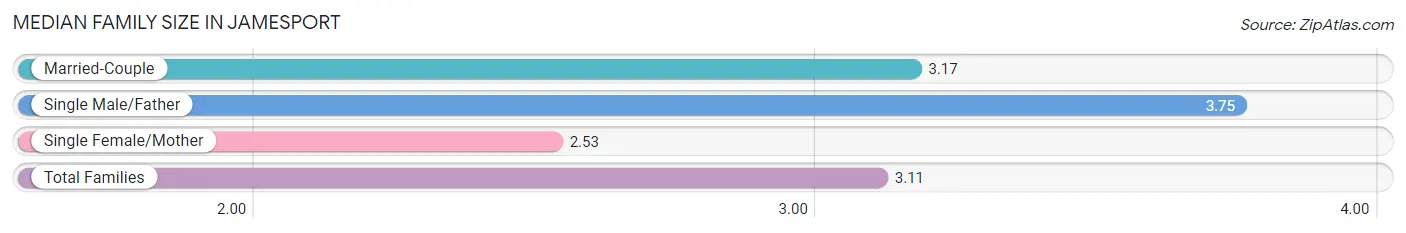
| Family Type | # Families | Family Size |
| Married-Couple | 138 (85.7%) | 3.17 |
| Single Male/Father | 4 (2.5%) | 3.75 |
| Single Female/Mother | 19 (11.8%) | 2.53 |
| Total Families | 161 (100.0%) | 3.11 |
Median Household Size in Jamesport
The median household size in Jamesport is 2.57 persons per household, with single male/father households (4 | 1.7%) accounting for the largest median household size of 4.25 persons per household. non-family households (82 | 33.7%) represent the smallest median household size with 1.39 persons per household.
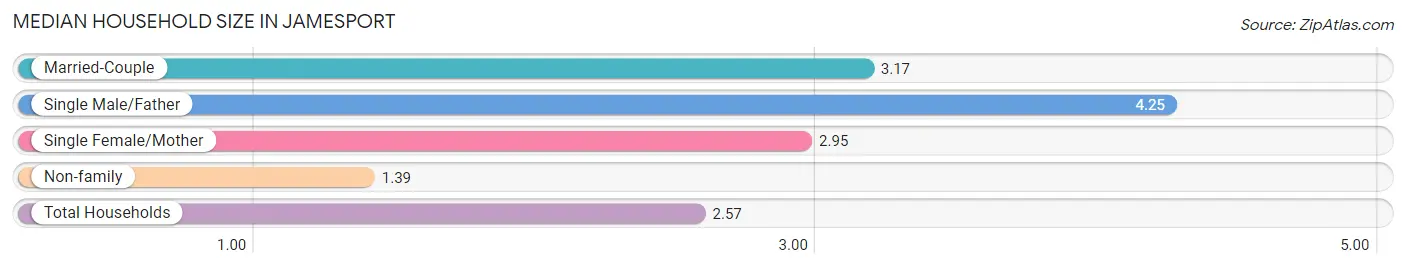
| Household Type | # Households | Household Size |
| Married-Couple | 138 (56.8%) | 3.17 |
| Single Male/Father | 4 (1.7%) | 4.25 |
| Single Female/Mother | 19 (7.8%) | 2.95 |
| Non-family | 82 (33.7%) | 1.39 |
| Total Households | 243 (100.0%) | 2.57 |
Household Size by Marriage Status in Jamesport
Out of a total of 243 households in Jamesport, 161 (66.3%) are family households, while 82 (33.7%) are nonfamily households. The most numerous type of family households are 2-person households, comprising 78, and the most common type of nonfamily households are 1-person households, comprising 77.
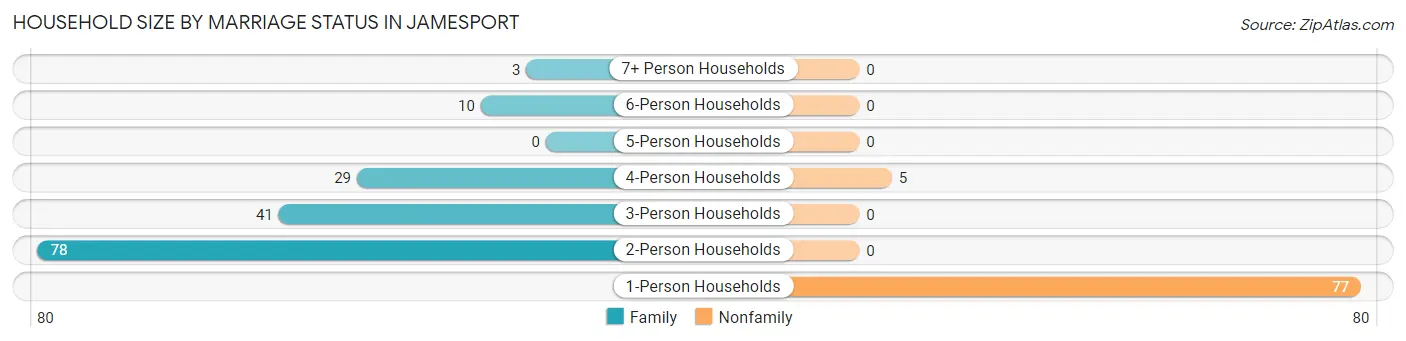
| Household Size | Family Households | Nonfamily Households |
| 1-Person Households | - | 77 (31.7%) |
| 2-Person Households | 78 (32.1%) | 0 (0.0%) |
| 3-Person Households | 41 (16.9%) | 0 (0.0%) |
| 4-Person Households | 29 (11.9%) | 5 (2.1%) |
| 5-Person Households | 0 (0.0%) | 0 (0.0%) |
| 6-Person Households | 10 (4.1%) | 0 (0.0%) |
| 7+ Person Households | 3 (1.2%) | 0 (0.0%) |
| Total | 161 (66.3%) | 82 (33.7%) |
Female Fertility in Jamesport
Fertility by Age in Jamesport
Average fertility rate in Jamesport is 65.0 births per 1,000 women. Women in the age bracket of 20 to 34 years have the highest fertility rate with 145.0 births per 1,000 women. Women in the age bracket of 20 to 34 years acount for 100.0% of all women with births.
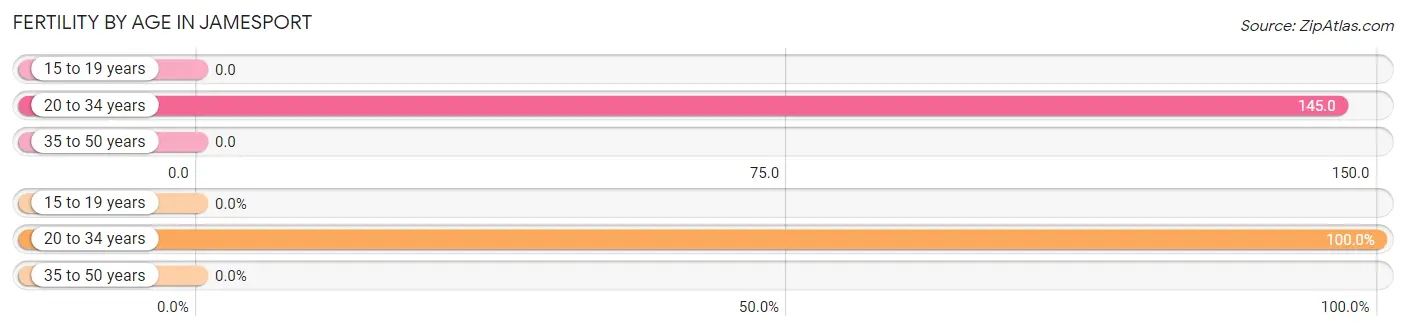
| Age Bracket | Women with Births | Births / 1,000 Women |
| 15 to 19 years | 0 (0.0%) | 0.0 |
| 20 to 34 years | 9 (100.0%) | 145.0 |
| 35 to 50 years | 0 (0.0%) | 0.0 |
| Total | 9 (100.0%) | 65.0 |
Fertility by Age by Marriage Status in Jamesport
77.8% of women with births (9) in Jamesport are married. The highest percentage of unmarried women with births falls into 20 to 34 years age bracket with 22.2% of them unmarried at the time of birth, while the lowest percentage of unmarried women with births belong to 20 to 34 years age bracket with 22.2% of them unmarried.
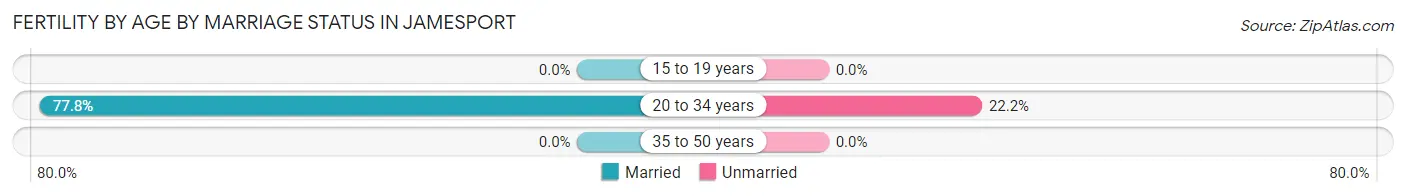
| Age Bracket | Married | Unmarried |
| 15 to 19 years | 0 (0.0%) | 0 (0.0%) |
| 20 to 34 years | 7 (77.8%) | 2 (22.2%) |
| 35 to 50 years | 0 (0.0%) | 0 (0.0%) |
| Total | 7 (77.8%) | 2 (22.2%) |
Fertility by Education in Jamesport
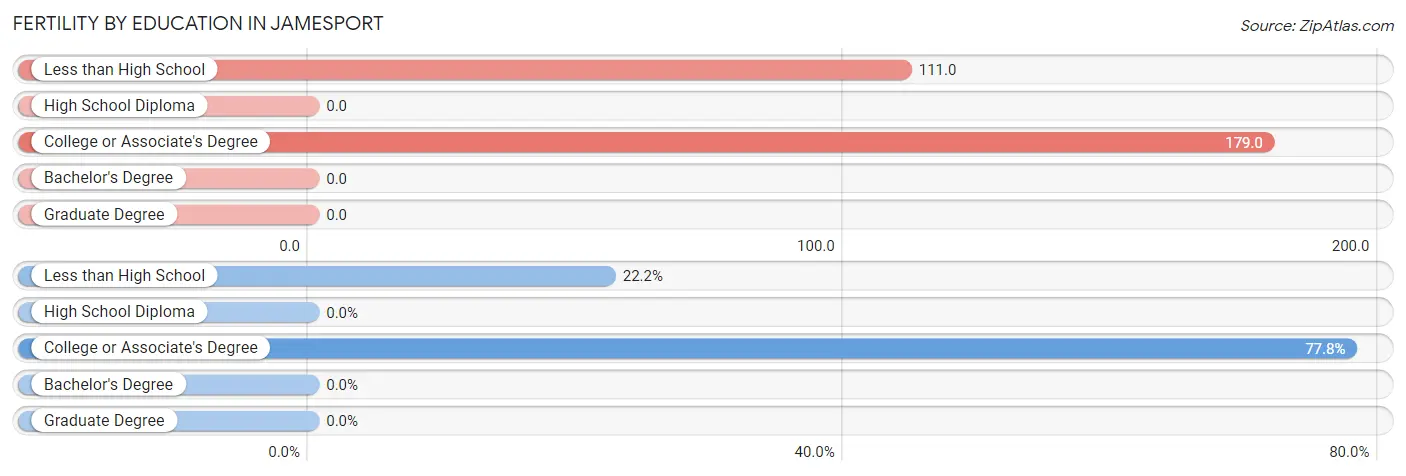
| Educational Attainment | Women with Births | Births / 1,000 Women |
| Less than High School | 2 (22.2%) | 111.0 |
| High School Diploma | 0 (0.0%) | 0.0 |
| College or Associate's Degree | 7 (77.8%) | 179.0 |
| Bachelor's Degree | 0 (0.0%) | 0.0 |
| Graduate Degree | 0 (0.0%) | 0.0 |
| Total | 9 (100.0%) | 65.0 |
Fertility by Education by Marriage Status in Jamesport
22.2% of women with births in Jamesport are unmarried. Women with the educational attainment of college or associate's degree are most likely to be married with 100.0% of them married at childbirth, while women with the educational attainment of less than high school are least likely to be married with 100.0% of them unmarried at childbirth.
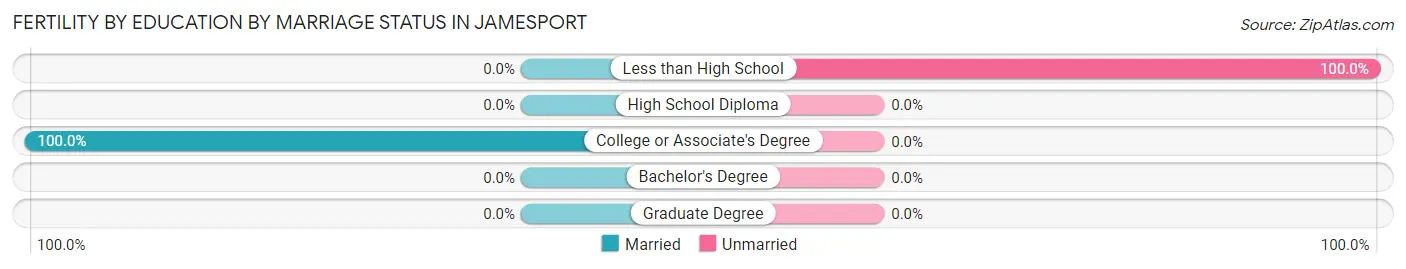
| Educational Attainment | Married | Unmarried |
| Less than High School | 0 (0.0%) | 2 (100.0%) |
| High School Diploma | 0 (0.0%) | 0 (0.0%) |
| College or Associate's Degree | 7 (100.0%) | 0 (0.0%) |
| Bachelor's Degree | 0 (0.0%) | 0 (0.0%) |
| Graduate Degree | 0 (0.0%) | 0 (0.0%) |
| Total | 7 (77.8%) | 2 (22.2%) |
Employment Characteristics in Jamesport
Employment by Class of Employer in Jamesport
Among the 290 employed individuals in Jamesport, private company employees (196 | 67.6%), local government employees (30 | 10.3%), and self-employed (not incorporated) (27 | 9.3%) make up the most common classes of employment.
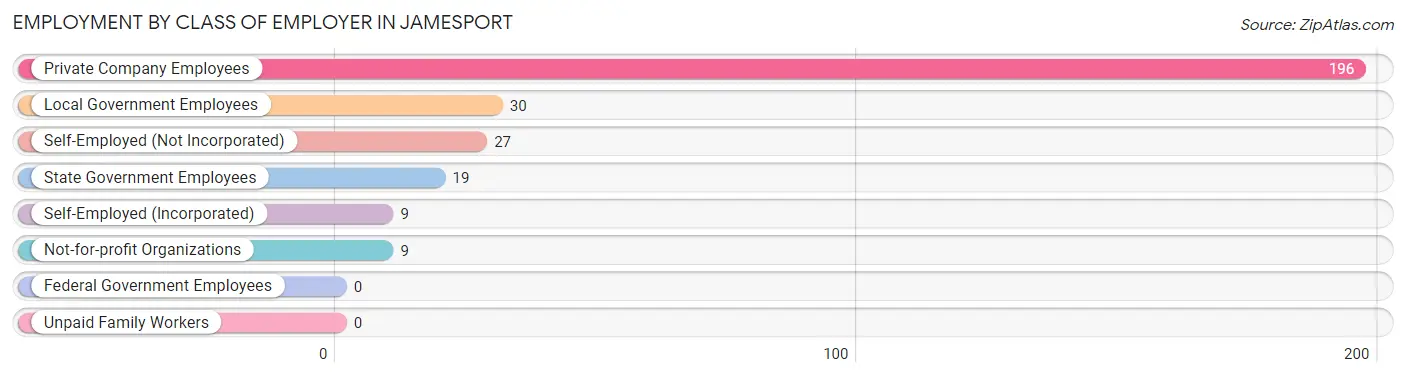
| Employer Class | # Employees | % Employees |
| Private Company Employees | 196 | 67.6% |
| Self-Employed (Incorporated) | 9 | 3.1% |
| Self-Employed (Not Incorporated) | 27 | 9.3% |
| Not-for-profit Organizations | 9 | 3.1% |
| Local Government Employees | 30 | 10.3% |
| State Government Employees | 19 | 6.6% |
| Federal Government Employees | 0 | 0.0% |
| Unpaid Family Workers | 0 | 0.0% |
| Total | 290 | 100.0% |
Employment Status by Age in Jamesport
According to the labor force statistics for Jamesport, out of the total population over 16 years of age (536), 55.2% or 296 individuals are in the labor force, with 2.0% or 6 of them unemployed. The age group with the highest labor force participation rate is 45 to 54 years, with 87.7% or 57 individuals in the labor force. Within the labor force, the 16 to 19 years age range has the highest percentage of unemployed individuals, with 28.6% or 4 of them being unemployed.
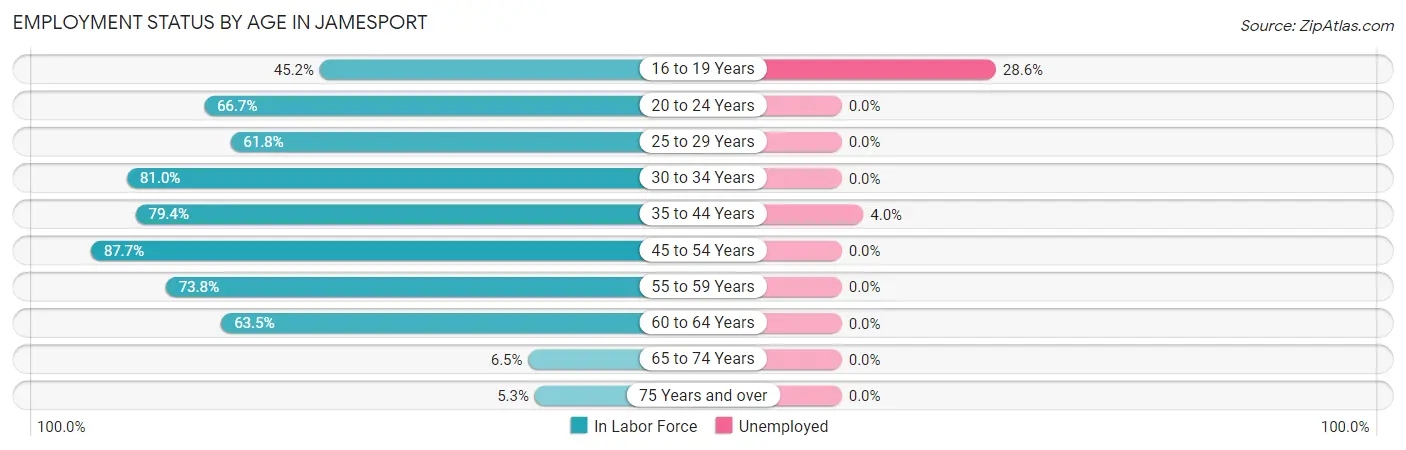
| Age Bracket | In Labor Force | Unemployed |
| 16 to 19 Years | 14 (45.2%) | 4 (28.6%) |
| 20 to 24 Years | 58 (66.7%) | 0 (0.0%) |
| 25 to 29 Years | 21 (61.8%) | 0 (0.0%) |
| 30 to 34 Years | 17 (81.0%) | 0 (0.0%) |
| 35 to 44 Years | 50 (79.4%) | 2 (4.0%) |
| 45 to 54 Years | 57 (87.7%) | 0 (0.0%) |
| 55 to 59 Years | 31 (73.8%) | 0 (0.0%) |
| 60 to 64 Years | 40 (63.5%) | 0 (0.0%) |
| 65 to 74 Years | 6 (6.5%) | 0 (0.0%) |
| 75 Years and over | 2 (5.3%) | 0 (0.0%) |
| Total | 296 (55.2%) | 6 (2.0%) |
Employment Status by Educational Attainment in Jamesport
According to labor force statistics for Jamesport, 75.0% of individuals (216) out of the total population between 25 and 64 years of age (288) are in the labor force, with 0.9% or 2 of them being unemployed. The group with the highest labor force participation rate are those with the educational attainment of bachelor's degree or higher, with 100.0% or 22 individuals in the labor force. Within the labor force, individuals with bachelor's degree or higher education have the highest percentage of unemployment, with 9.1% or 2 of them being unemployed.
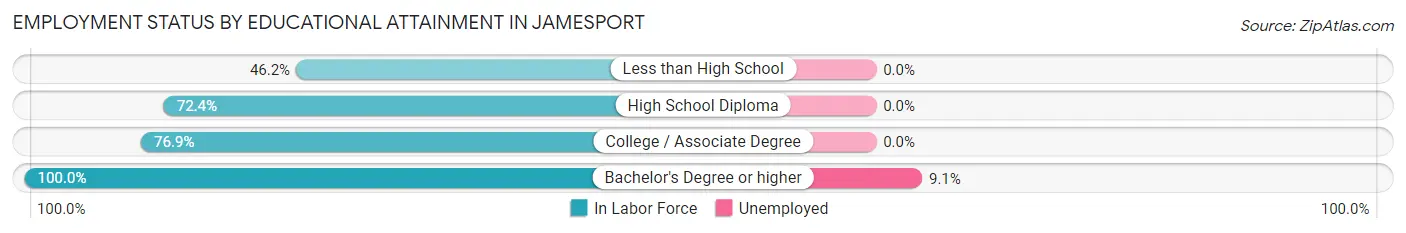
| Educational Attainment | In Labor Force | Unemployed |
| Less than High School | 6 (46.2%) | 0 (0.0%) |
| High School Diploma | 105 (72.4%) | 0 (0.0%) |
| College / Associate Degree | 83 (76.9%) | 0 (0.0%) |
| Bachelor's Degree or higher | 22 (100.0%) | 2 (9.1%) |
| Total | 216 (75.0%) | 3 (0.9%) |
Employment Occupations by Sex in Jamesport
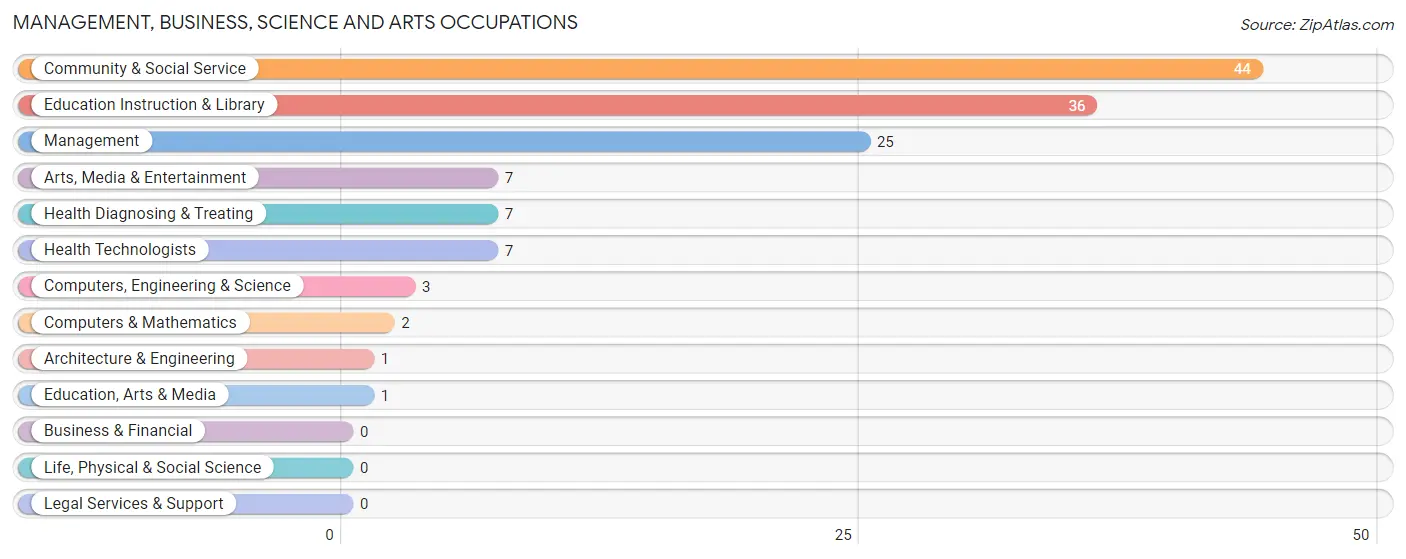
Management, Business, Science and Arts Occupations
The most common Management, Business, Science and Arts occupations in Jamesport are Community & Social Service (44 | 15.2%), Education Instruction & Library (36 | 12.4%), Management (25 | 8.6%), Arts, Media & Entertainment (7 | 2.4%), and Health Diagnosing & Treating (7 | 2.4%).
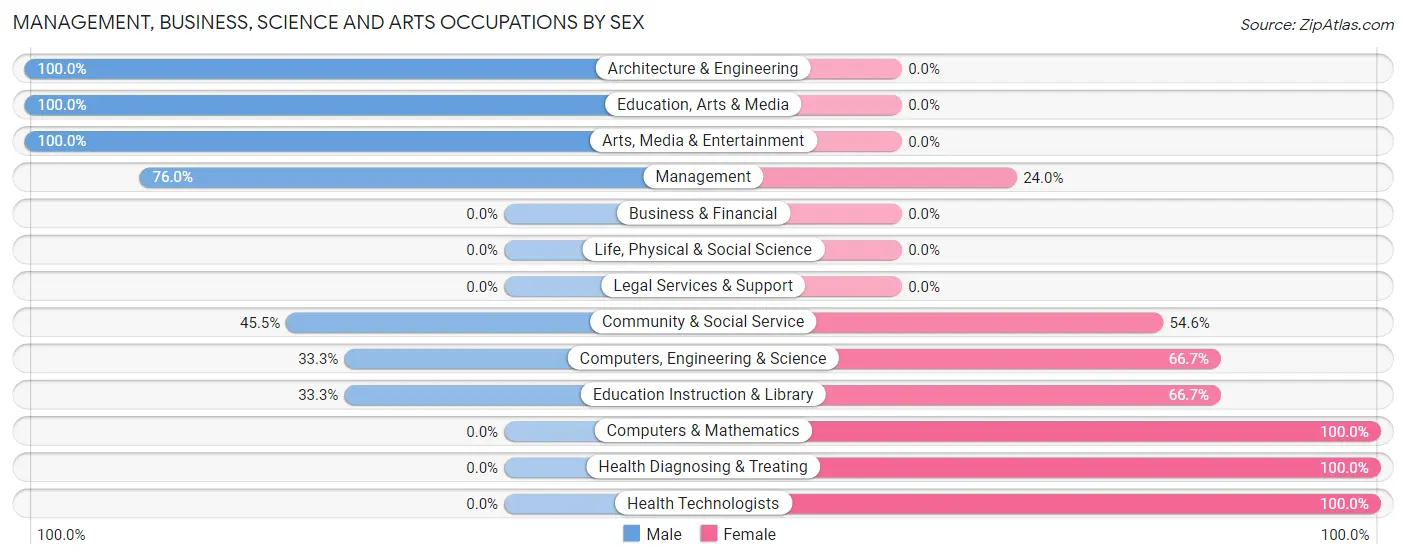
Management, Business, Science and Arts Occupations by Sex
Within the Management, Business, Science and Arts occupations in Jamesport, the most male-oriented occupations are Architecture & Engineering (100.0%), Education, Arts & Media (100.0%), and Arts, Media & Entertainment (100.0%), while the most female-oriented occupations are Computers & Mathematics (100.0%), Health Diagnosing & Treating (100.0%), and Health Technologists (100.0%).
| Occupation | Male | Female |
| Management | 19 (76.0%) | 6 (24.0%) |
| Business & Financial | 0 (0.0%) | 0 (0.0%) |
| Computers, Engineering & Science | 1 (33.3%) | 2 (66.7%) |
| Computers & Mathematics | 0 (0.0%) | 2 (100.0%) |
| Architecture & Engineering | 1 (100.0%) | 0 (0.0%) |
| Life, Physical & Social Science | 0 (0.0%) | 0 (0.0%) |
| Community & Social Service | 20 (45.5%) | 24 (54.5%) |
| Education, Arts & Media | 1 (100.0%) | 0 (0.0%) |
| Legal Services & Support | 0 (0.0%) | 0 (0.0%) |
| Education Instruction & Library | 12 (33.3%) | 24 (66.7%) |
| Arts, Media & Entertainment | 7 (100.0%) | 0 (0.0%) |
| Health Diagnosing & Treating | 0 (0.0%) | 7 (100.0%) |
| Health Technologists | 0 (0.0%) | 7 (100.0%) |
| Total (Category) | 40 (50.6%) | 39 (49.4%) |
| Total (Overall) | 159 (54.8%) | 131 (45.2%) |
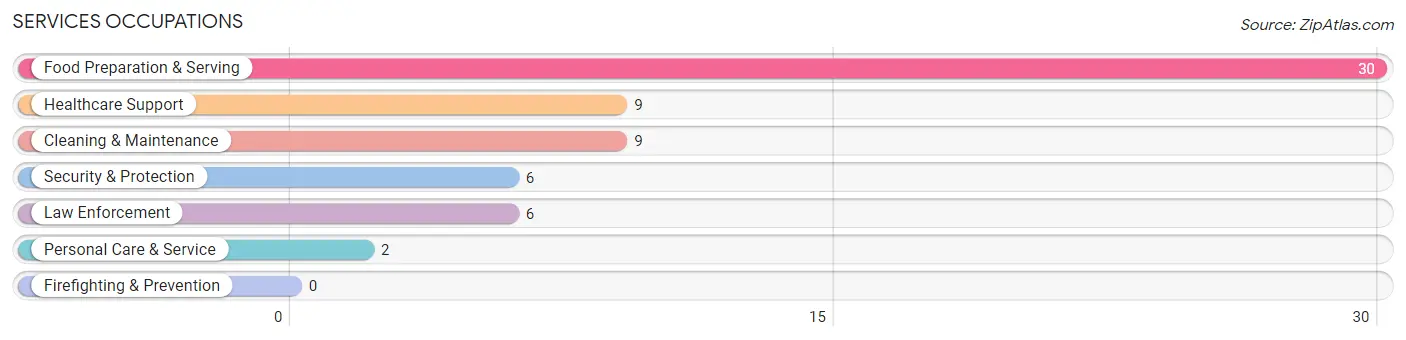
Services Occupations
The most common Services occupations in Jamesport are Food Preparation & Serving (30 | 10.3%), Healthcare Support (9 | 3.1%), Cleaning & Maintenance (9 | 3.1%), Security & Protection (6 | 2.1%), and Law Enforcement (6 | 2.1%).
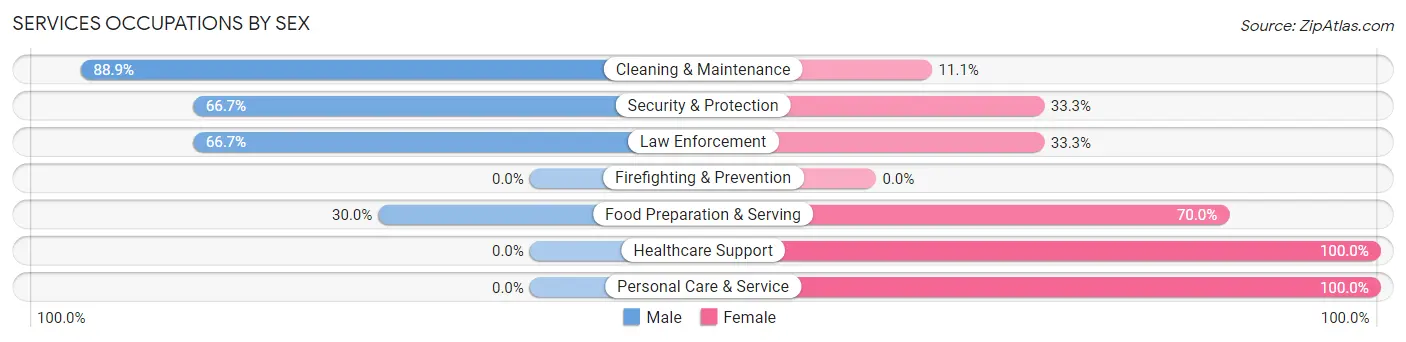
Services Occupations by Sex
Within the Services occupations in Jamesport, the most male-oriented occupations are Cleaning & Maintenance (88.9%), Security & Protection (66.7%), and Law Enforcement (66.7%), while the most female-oriented occupations are Healthcare Support (100.0%), Personal Care & Service (100.0%), and Food Preparation & Serving (70.0%).
| Occupation | Male | Female |
| Healthcare Support | 0 (0.0%) | 9 (100.0%) |
| Security & Protection | 4 (66.7%) | 2 (33.3%) |
| Firefighting & Prevention | 0 (0.0%) | 0 (0.0%) |
| Law Enforcement | 4 (66.7%) | 2 (33.3%) |
| Food Preparation & Serving | 9 (30.0%) | 21 (70.0%) |
| Cleaning & Maintenance | 8 (88.9%) | 1 (11.1%) |
| Personal Care & Service | 0 (0.0%) | 2 (100.0%) |
| Total (Category) | 21 (37.5%) | 35 (62.5%) |
| Total (Overall) | 159 (54.8%) | 131 (45.2%) |
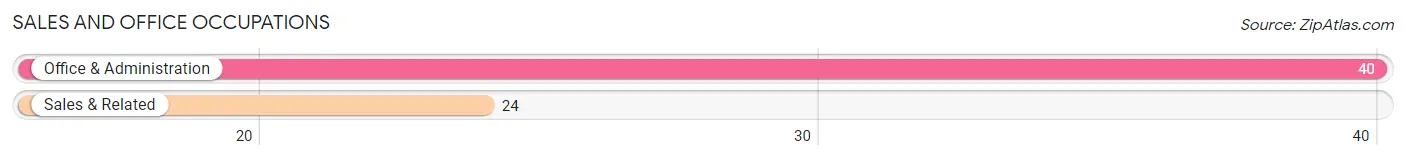
Sales and Office Occupations
The most common Sales and Office occupations in Jamesport are Office & Administration (40 | 13.8%), and Sales & Related (24 | 8.3%).
Sales and Office Occupations by Sex
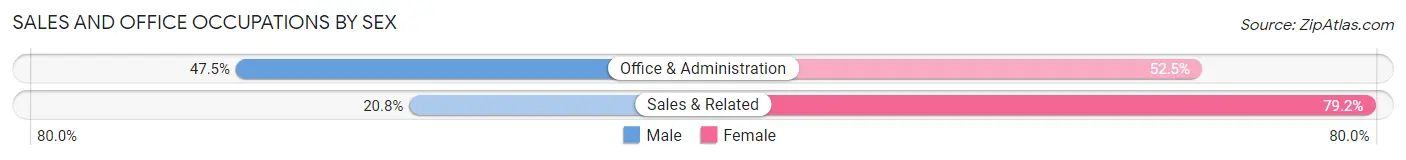
| Occupation | Male | Female |
| Sales & Related | 5 (20.8%) | 19 (79.2%) |
| Office & Administration | 19 (47.5%) | 21 (52.5%) |
| Total (Category) | 24 (37.5%) | 40 (62.5%) |
| Total (Overall) | 159 (54.8%) | 131 (45.2%) |
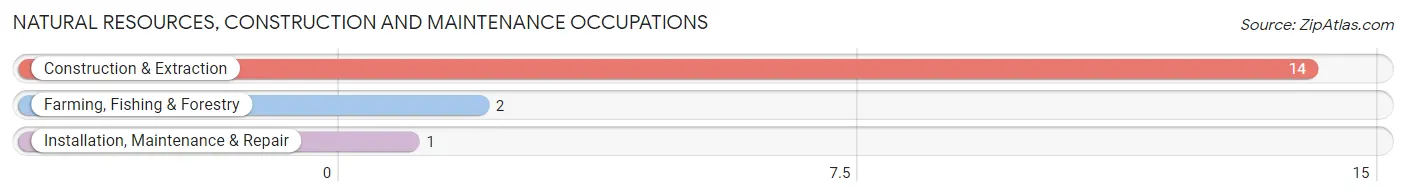
Natural Resources, Construction and Maintenance Occupations
The most common Natural Resources, Construction and Maintenance occupations in Jamesport are Construction & Extraction (14 | 4.8%), Farming, Fishing & Forestry (2 | 0.7%), and Installation, Maintenance & Repair (1 | 0.3%).
Natural Resources, Construction and Maintenance Occupations by Sex
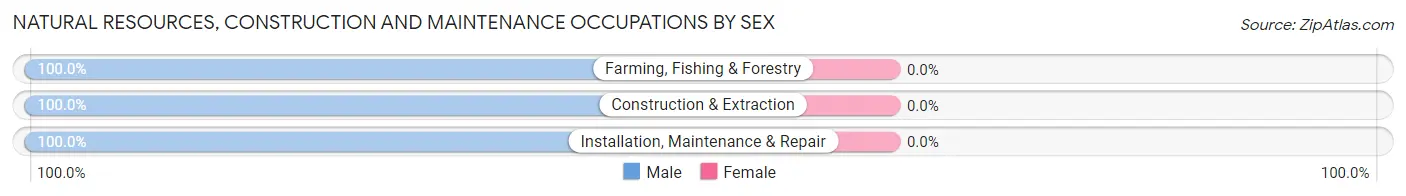
| Occupation | Male | Female |
| Farming, Fishing & Forestry | 2 (100.0%) | 0 (0.0%) |
| Construction & Extraction | 14 (100.0%) | 0 (0.0%) |
| Installation, Maintenance & Repair | 1 (100.0%) | 0 (0.0%) |
| Total (Category) | 17 (100.0%) | 0 (0.0%) |
| Total (Overall) | 159 (54.8%) | 131 (45.2%) |
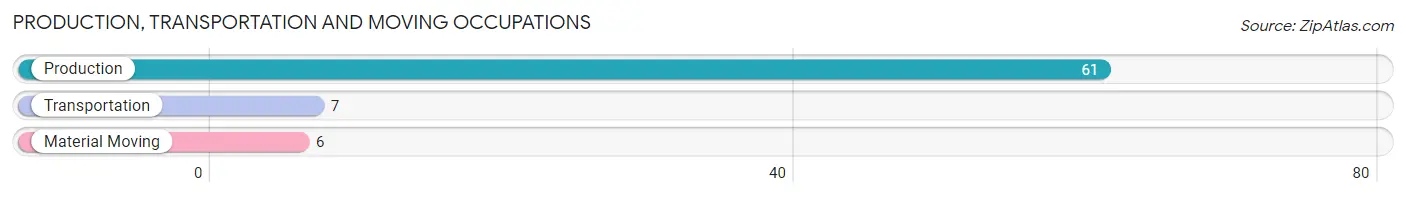
Production, Transportation and Moving Occupations
The most common Production, Transportation and Moving occupations in Jamesport are Production (61 | 21.0%), Transportation (7 | 2.4%), and Material Moving (6 | 2.1%).
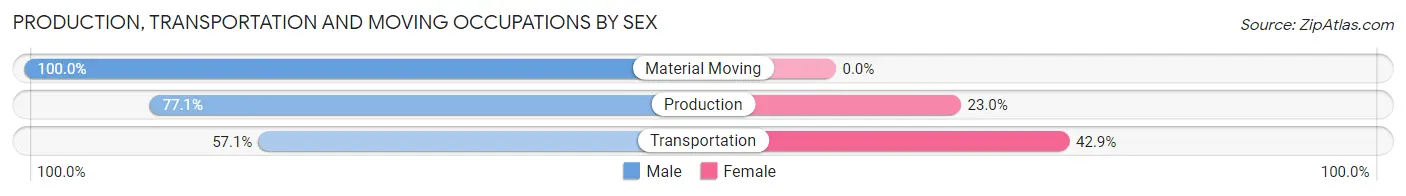
Production, Transportation and Moving Occupations by Sex
| Occupation | Male | Female |
| Production | 47 (77.0%) | 14 (23.0%) |
| Transportation | 4 (57.1%) | 3 (42.9%) |
| Material Moving | 6 (100.0%) | 0 (0.0%) |
| Total (Category) | 57 (77.0%) | 17 (23.0%) |
| Total (Overall) | 159 (54.8%) | 131 (45.2%) |
Employment Industries by Sex in Jamesport
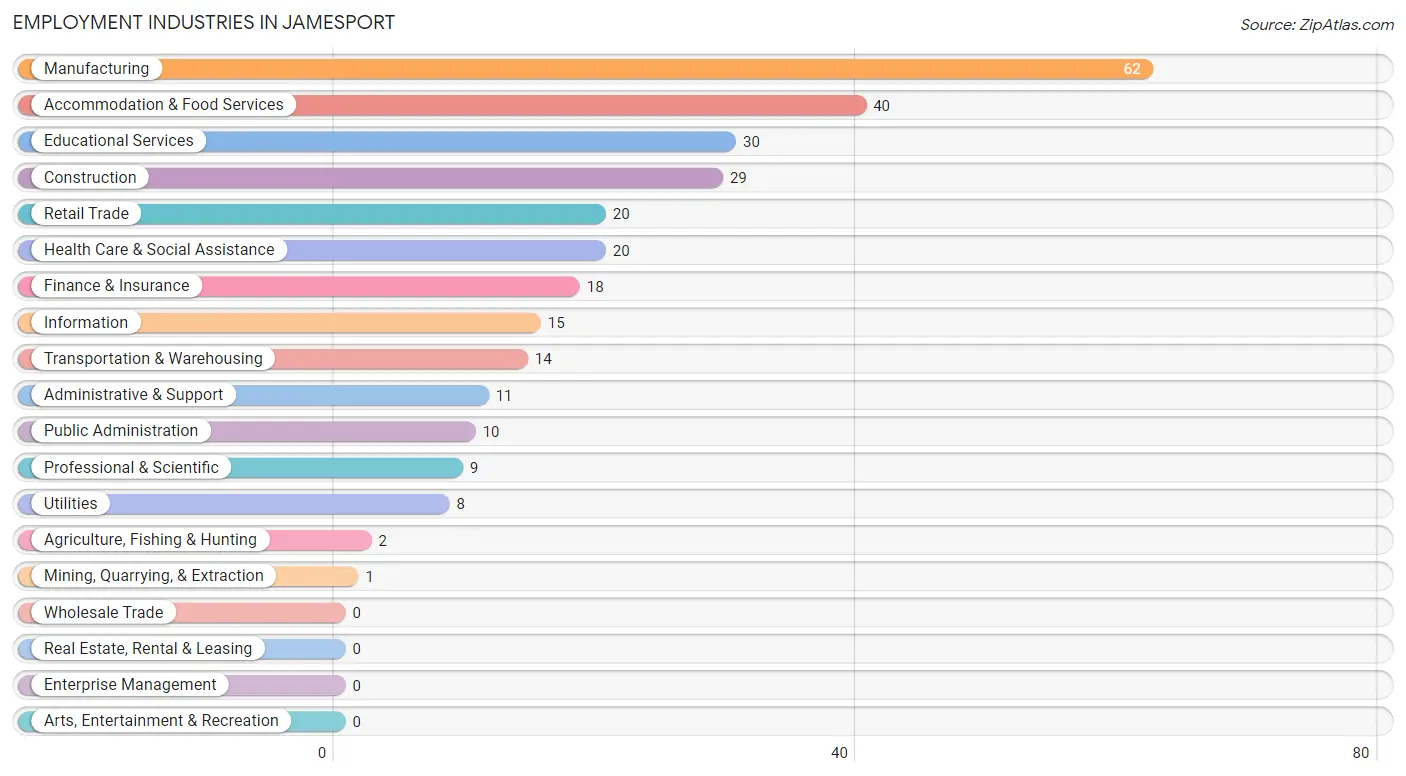
Employment Industries in Jamesport
The major employment industries in Jamesport include Manufacturing (62 | 21.4%), Accommodation & Food Services (40 | 13.8%), Educational Services (30 | 10.3%), Construction (29 | 10.0%), and Retail Trade (20 | 6.9%).
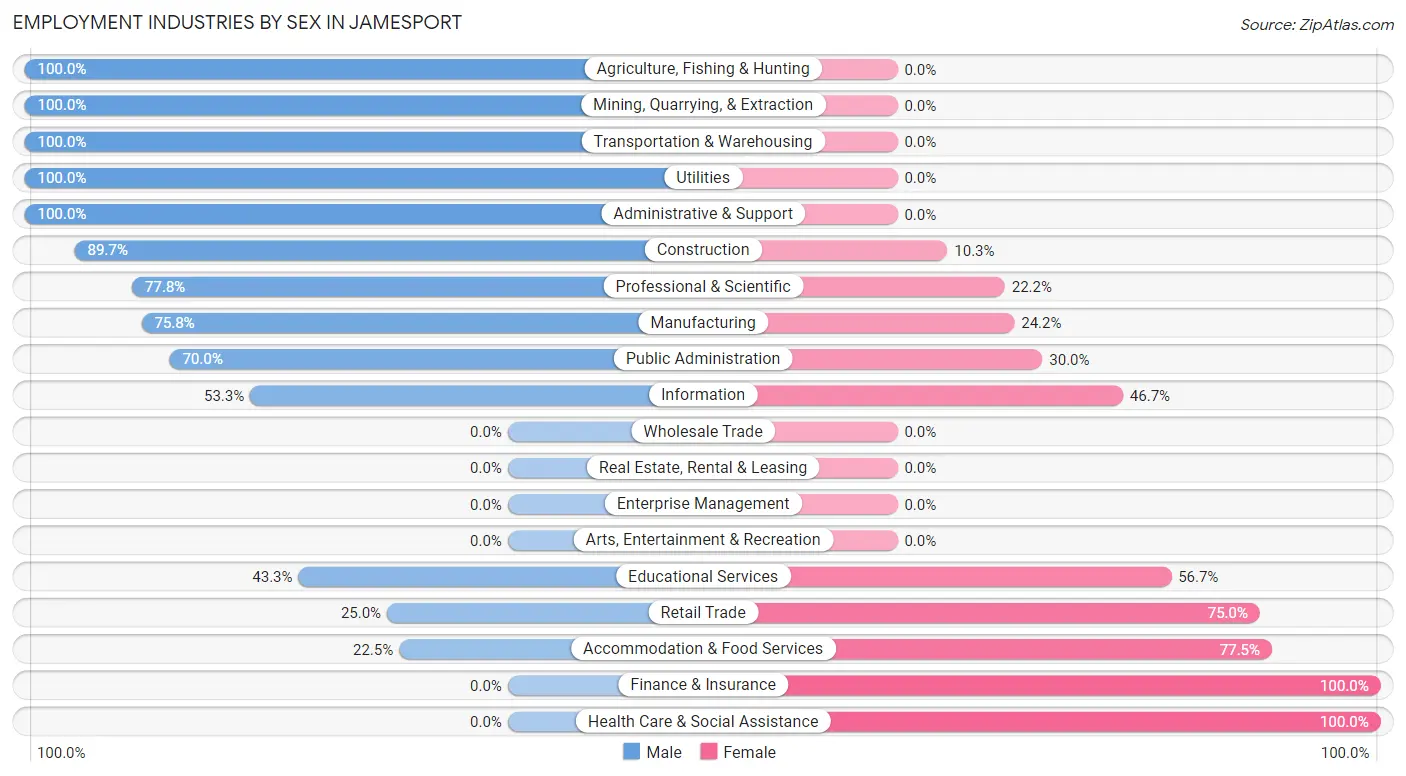
Employment Industries by Sex in Jamesport
The Jamesport industries that see more men than women are Agriculture, Fishing & Hunting (100.0%), Mining, Quarrying, & Extraction (100.0%), and Transportation & Warehousing (100.0%), whereas the industries that tend to have a higher number of women are Finance & Insurance (100.0%), Health Care & Social Assistance (100.0%), and Accommodation & Food Services (77.5%).
| Industry | Male | Female |
| Agriculture, Fishing & Hunting | 2 (100.0%) | 0 (0.0%) |
| Mining, Quarrying, & Extraction | 1 (100.0%) | 0 (0.0%) |
| Construction | 26 (89.7%) | 3 (10.3%) |
| Manufacturing | 47 (75.8%) | 15 (24.2%) |
| Wholesale Trade | 0 (0.0%) | 0 (0.0%) |
| Retail Trade | 5 (25.0%) | 15 (75.0%) |
| Transportation & Warehousing | 14 (100.0%) | 0 (0.0%) |
| Utilities | 8 (100.0%) | 0 (0.0%) |
| Information | 8 (53.3%) | 7 (46.7%) |
| Finance & Insurance | 0 (0.0%) | 18 (100.0%) |
| Real Estate, Rental & Leasing | 0 (0.0%) | 0 (0.0%) |
| Professional & Scientific | 7 (77.8%) | 2 (22.2%) |
| Enterprise Management | 0 (0.0%) | 0 (0.0%) |
| Administrative & Support | 11 (100.0%) | 0 (0.0%) |
| Educational Services | 13 (43.3%) | 17 (56.7%) |
| Health Care & Social Assistance | 0 (0.0%) | 20 (100.0%) |
| Arts, Entertainment & Recreation | 0 (0.0%) | 0 (0.0%) |
| Accommodation & Food Services | 9 (22.5%) | 31 (77.5%) |
| Public Administration | 7 (70.0%) | 3 (30.0%) |
| Total | 159 (54.8%) | 131 (45.2%) |
Education in Jamesport
School Enrollment in Jamesport
The most common levels of schooling among the 113 students in Jamesport are middle school (29 | 25.7%), high school (27 | 23.9%), and graduate / professional (26 | 23.0%).
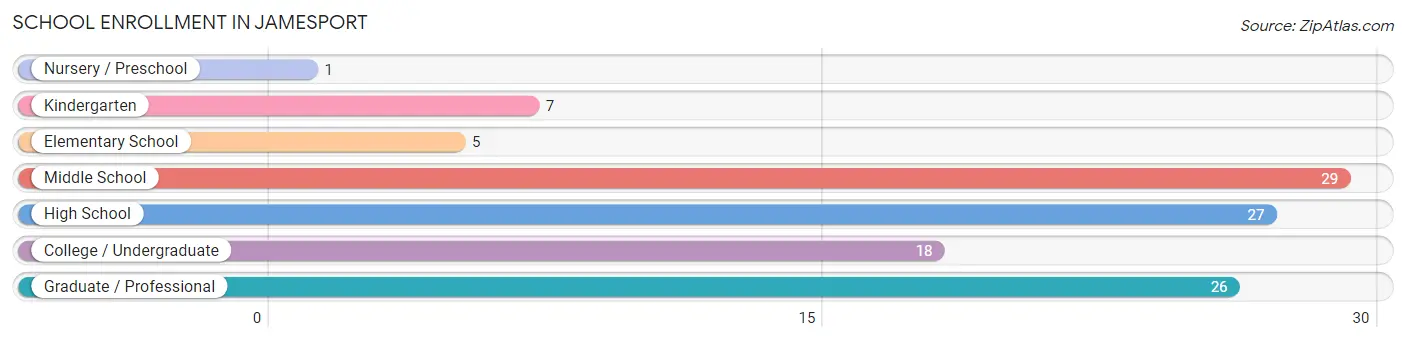
| School Level | # Students | % Students |
| Nursery / Preschool | 1 | 0.9% |
| Kindergarten | 7 | 6.2% |
| Elementary School | 5 | 4.4% |
| Middle School | 29 | 25.7% |
| High School | 27 | 23.9% |
| College / Undergraduate | 18 | 15.9% |
| Graduate / Professional | 26 | 23.0% |
| Total | 113 | 100.0% |
School Enrollment by Age by Funding Source in Jamesport
Out of a total of 113 students who are enrolled in schools in Jamesport, 8 (7.1%) attend a private institution, while the remaining 105 (92.9%) are enrolled in public schools. The age group of 18 to 19 year olds has the highest likelihood of being enrolled in private schools, with 4 (66.7% in the age bracket) enrolled. Conversely, the age group of 3 to 4 year olds has the lowest likelihood of being enrolled in a private school, with 1 (100.0% in the age bracket) attending a public institution.
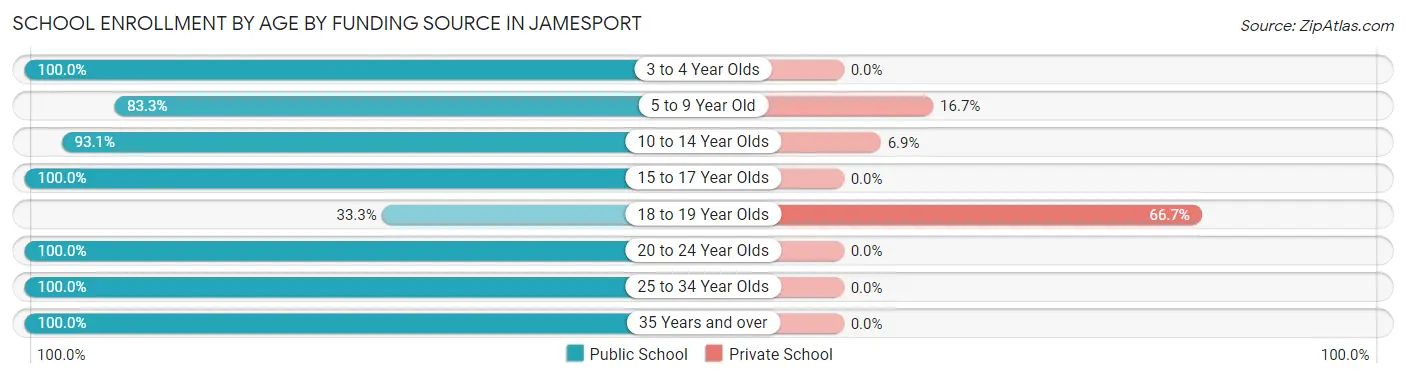
| Age Bracket | Public School | Private School |
| 3 to 4 Year Olds | 1 (100.0%) | 0 (0.0%) |
| 5 to 9 Year Old | 10 (83.3%) | 2 (16.7%) |
| 10 to 14 Year Olds | 27 (93.1%) | 2 (6.9%) |
| 15 to 17 Year Olds | 21 (100.0%) | 0 (0.0%) |
| 18 to 19 Year Olds | 2 (33.3%) | 4 (66.7%) |
| 20 to 24 Year Olds | 37 (100.0%) | 0 (0.0%) |
| 25 to 34 Year Olds | 2 (100.0%) | 0 (0.0%) |
| 35 Years and over | 5 (100.0%) | 0 (0.0%) |
| Total | 105 (92.9%) | 8 (7.1%) |
Educational Attainment by Field of Study in Jamesport
Education (11 | 44.0%), liberal arts & history (5 | 20.0%), bio, nature & agricultural (3 | 12.0%), psychology (2 | 8.0%), and business (2 | 8.0%) are the most common fields of study among 25 individuals in Jamesport who have obtained a bachelor's degree or higher.
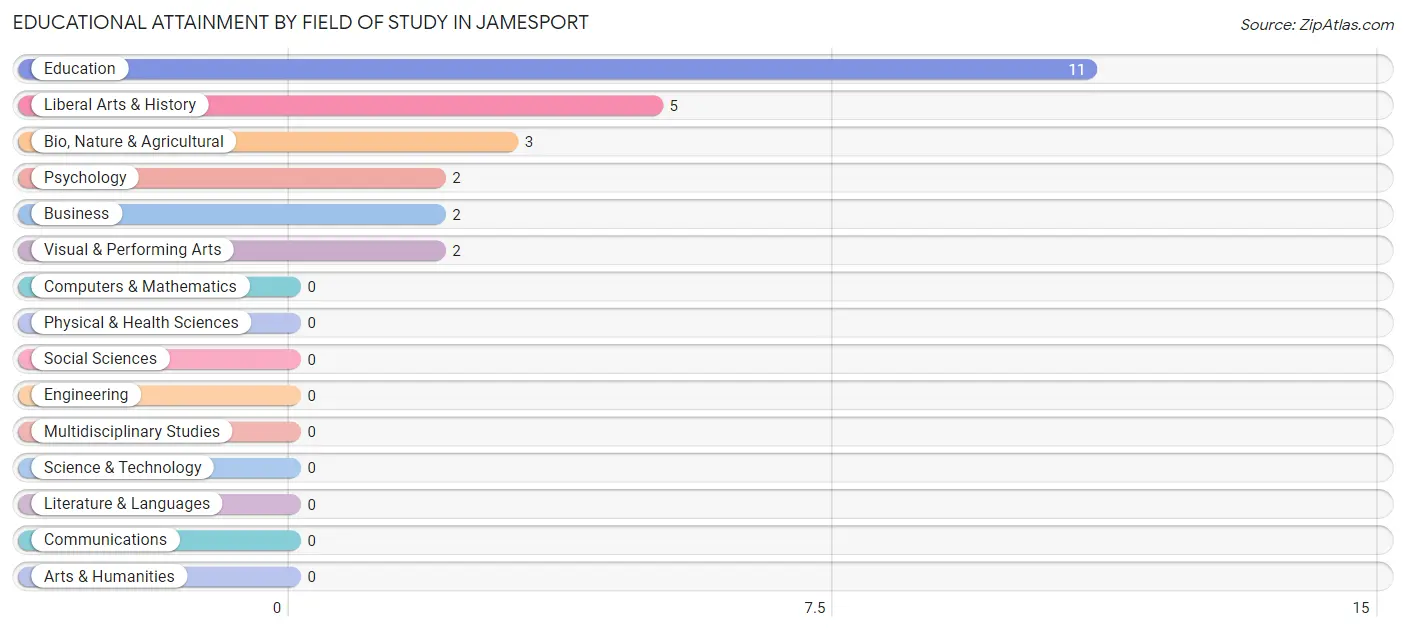
| Field of Study | # Graduates | % Graduates |
| Computers & Mathematics | 0 | 0.0% |
| Bio, Nature & Agricultural | 3 | 12.0% |
| Physical & Health Sciences | 0 | 0.0% |
| Psychology | 2 | 8.0% |
| Social Sciences | 0 | 0.0% |
| Engineering | 0 | 0.0% |
| Multidisciplinary Studies | 0 | 0.0% |
| Science & Technology | 0 | 0.0% |
| Business | 2 | 8.0% |
| Education | 11 | 44.0% |
| Literature & Languages | 0 | 0.0% |
| Liberal Arts & History | 5 | 20.0% |
| Visual & Performing Arts | 2 | 8.0% |
| Communications | 0 | 0.0% |
| Arts & Humanities | 0 | 0.0% |
| Total | 25 | 100.0% |
Transportation & Commute in Jamesport
Vehicle Availability by Sex in Jamesport
The most prevalent vehicle ownership categories in Jamesport are males with 2 vehicles (73, accounting for 45.9%) and females with 2 vehicles (93, making up 55.7%).
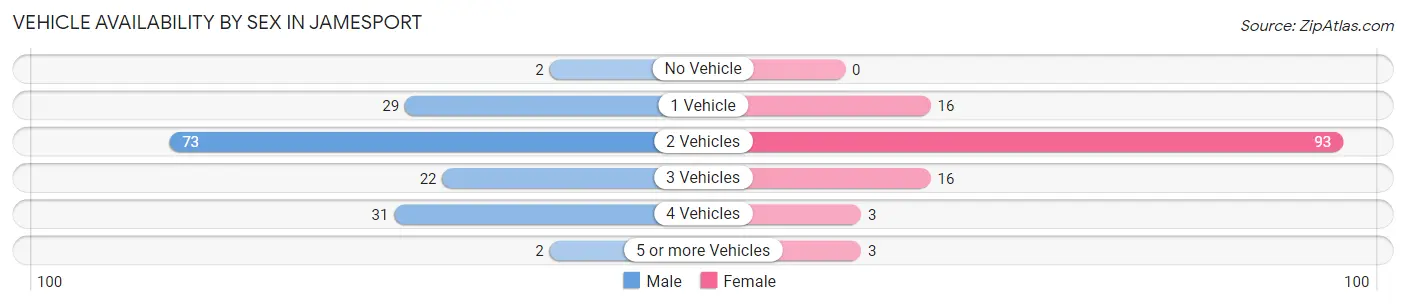
| Vehicles Available | Male | Female |
| No Vehicle | 2 (1.3%) | 0 (0.0%) |
| 1 Vehicle | 29 (18.2%) | 16 (12.2%) |
| 2 Vehicles | 73 (45.9%) | 93 (71.0%) |
| 3 Vehicles | 22 (13.8%) | 16 (12.2%) |
| 4 Vehicles | 31 (19.5%) | 3 (2.3%) |
| 5 or more Vehicles | 2 (1.3%) | 3 (2.3%) |
| Total | 159 (100.0%) | 131 (100.0%) |
Commute Time in Jamesport
The most frequently occuring commute durations in Jamesport are less than 5 minutes (39 commuters, 15.6%), 30 to 34 minutes (34 commuters, 13.6%), and 15 to 19 minutes (32 commuters, 12.8%).
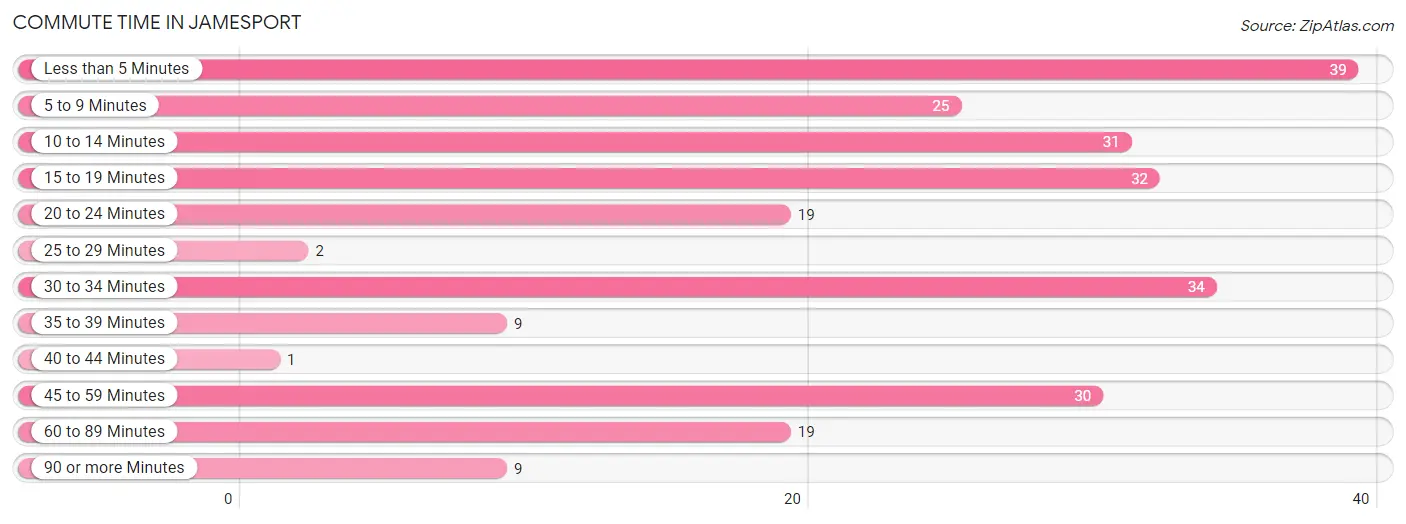
| Commute Time | # Commuters | % Commuters |
| Less than 5 Minutes | 39 | 15.6% |
| 5 to 9 Minutes | 25 | 10.0% |
| 10 to 14 Minutes | 31 | 12.4% |
| 15 to 19 Minutes | 32 | 12.8% |
| 20 to 24 Minutes | 19 | 7.6% |
| 25 to 29 Minutes | 2 | 0.8% |
| 30 to 34 Minutes | 34 | 13.6% |
| 35 to 39 Minutes | 9 | 3.6% |
| 40 to 44 Minutes | 1 | 0.4% |
| 45 to 59 Minutes | 30 | 12.0% |
| 60 to 89 Minutes | 19 | 7.6% |
| 90 or more Minutes | 9 | 3.6% |
Commute Time by Sex in Jamesport
The most common commute times in Jamesport are 10 to 14 minutes (27 commuters, 21.6%) for males and 15 to 19 minutes (24 commuters, 19.2%) for females.
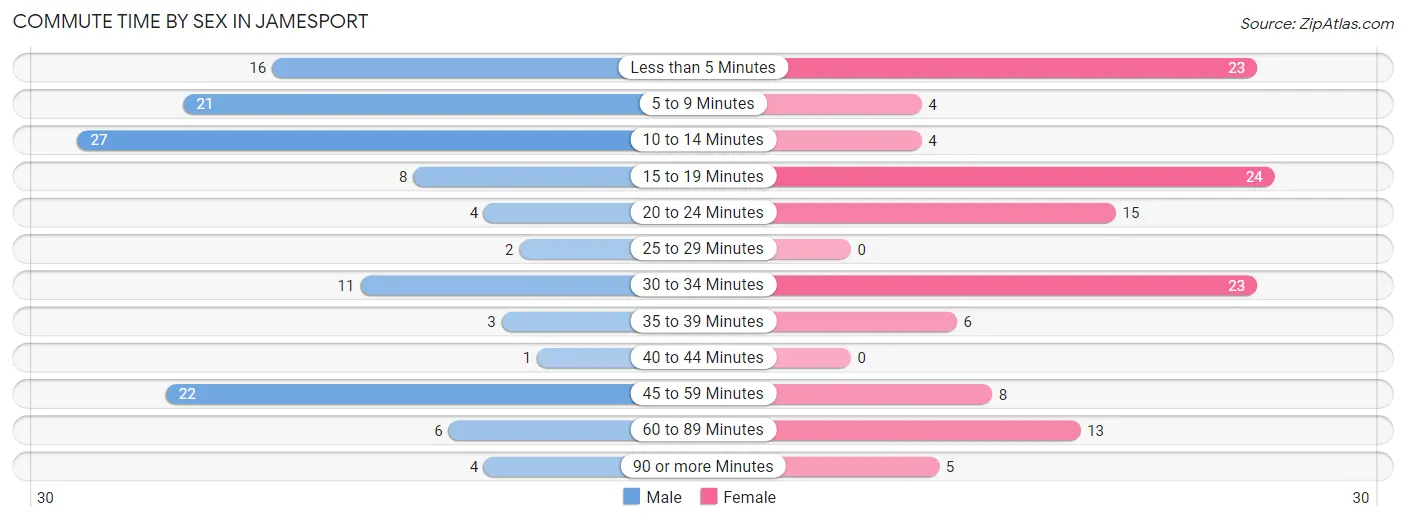
| Commute Time | Male | Female |
| Less than 5 Minutes | 16 (12.8%) | 23 (18.4%) |
| 5 to 9 Minutes | 21 (16.8%) | 4 (3.2%) |
| 10 to 14 Minutes | 27 (21.6%) | 4 (3.2%) |
| 15 to 19 Minutes | 8 (6.4%) | 24 (19.2%) |
| 20 to 24 Minutes | 4 (3.2%) | 15 (12.0%) |
| 25 to 29 Minutes | 2 (1.6%) | 0 (0.0%) |
| 30 to 34 Minutes | 11 (8.8%) | 23 (18.4%) |
| 35 to 39 Minutes | 3 (2.4%) | 6 (4.8%) |
| 40 to 44 Minutes | 1 (0.8%) | 0 (0.0%) |
| 45 to 59 Minutes | 22 (17.6%) | 8 (6.4%) |
| 60 to 89 Minutes | 6 (4.8%) | 13 (10.4%) |
| 90 or more Minutes | 4 (3.2%) | 5 (4.0%) |
Time of Departure to Work by Sex in Jamesport
The most frequent times of departure to work in Jamesport are 6:00 AM to 6:29 AM (30, 24.0%) for males and 7:00 AM to 7:29 AM (23, 18.4%) for females.
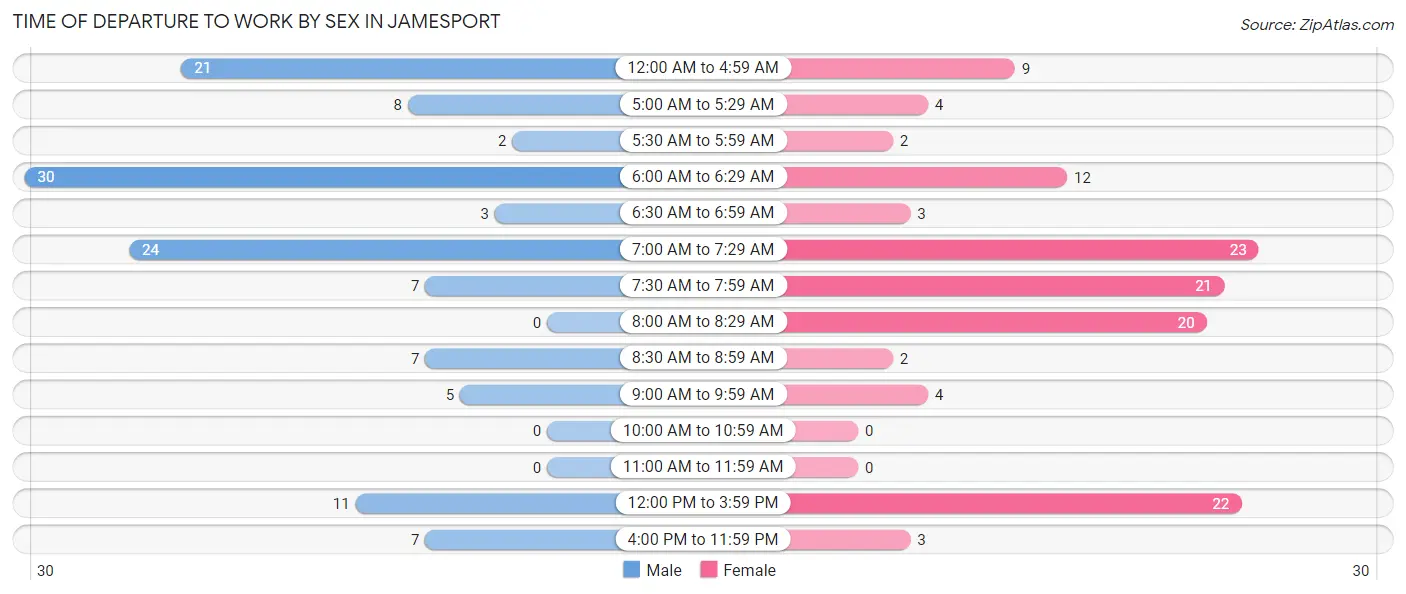
| Time of Departure | Male | Female |
| 12:00 AM to 4:59 AM | 21 (16.8%) | 9 (7.2%) |
| 5:00 AM to 5:29 AM | 8 (6.4%) | 4 (3.2%) |
| 5:30 AM to 5:59 AM | 2 (1.6%) | 2 (1.6%) |
| 6:00 AM to 6:29 AM | 30 (24.0%) | 12 (9.6%) |
| 6:30 AM to 6:59 AM | 3 (2.4%) | 3 (2.4%) |
| 7:00 AM to 7:29 AM | 24 (19.2%) | 23 (18.4%) |
| 7:30 AM to 7:59 AM | 7 (5.6%) | 21 (16.8%) |
| 8:00 AM to 8:29 AM | 0 (0.0%) | 20 (16.0%) |
| 8:30 AM to 8:59 AM | 7 (5.6%) | 2 (1.6%) |
| 9:00 AM to 9:59 AM | 5 (4.0%) | 4 (3.2%) |
| 10:00 AM to 10:59 AM | 0 (0.0%) | 0 (0.0%) |
| 11:00 AM to 11:59 AM | 0 (0.0%) | 0 (0.0%) |
| 12:00 PM to 3:59 PM | 11 (8.8%) | 22 (17.6%) |
| 4:00 PM to 11:59 PM | 7 (5.6%) | 3 (2.4%) |
| Total | 125 (100.0%) | 125 (100.0%) |
Housing Occupancy in Jamesport
Occupancy by Ownership in Jamesport
Of the total 243 dwellings in Jamesport, owner-occupied units account for 176 (72.4%), while renter-occupied units make up 67 (27.6%).
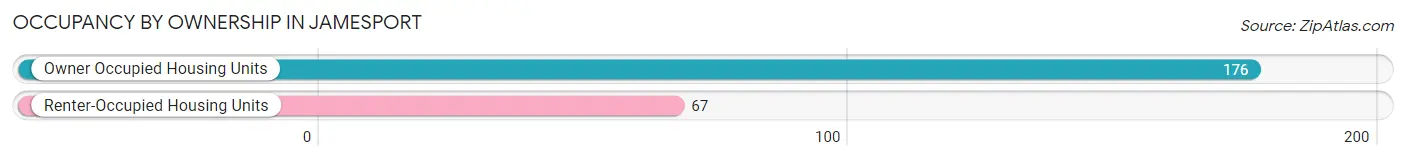
| Occupancy | # Housing Units | % Housing Units |
| Owner Occupied Housing Units | 176 | 72.4% |
| Renter-Occupied Housing Units | 67 | 27.6% |
| Total Occupied Housing Units | 243 | 100.0% |
Occupancy by Household Size in Jamesport
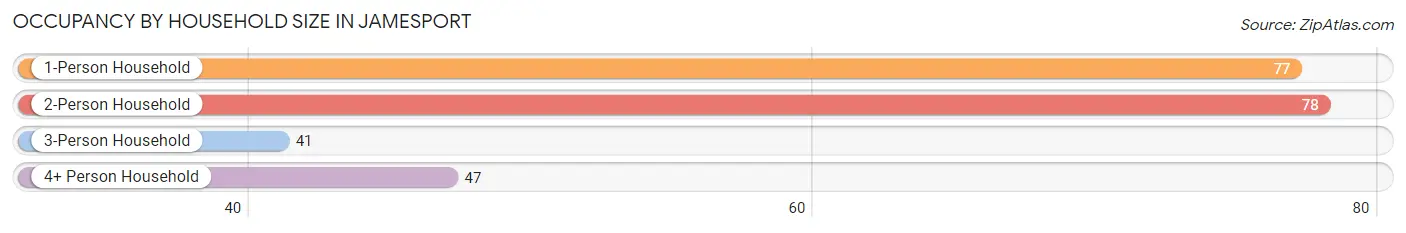
| Household Size | # Housing Units | % Housing Units |
| 1-Person Household | 77 | 31.7% |
| 2-Person Household | 78 | 32.1% |
| 3-Person Household | 41 | 16.9% |
| 4+ Person Household | 47 | 19.3% |
| Total Housing Units | 243 | 100.0% |
Occupancy by Ownership by Household Size in Jamesport
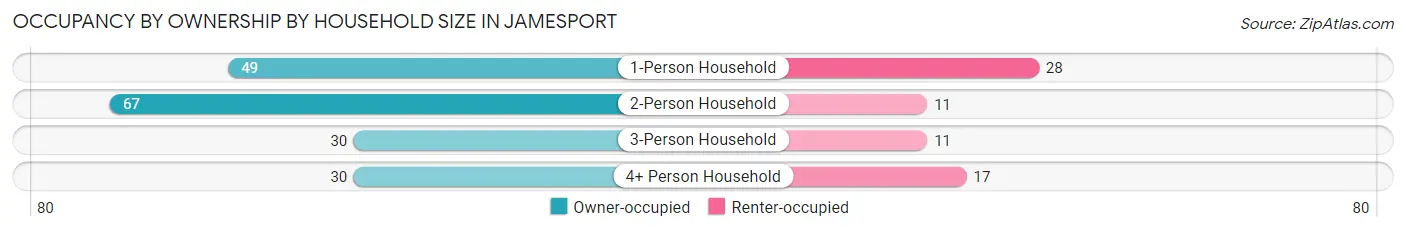
| Household Size | Owner-occupied | Renter-occupied |
| 1-Person Household | 49 (63.6%) | 28 (36.4%) |
| 2-Person Household | 67 (85.9%) | 11 (14.1%) |
| 3-Person Household | 30 (73.2%) | 11 (26.8%) |
| 4+ Person Household | 30 (63.8%) | 17 (36.2%) |
| Total Housing Units | 176 (72.4%) | 67 (27.6%) |
Occupancy by Educational Attainment in Jamesport
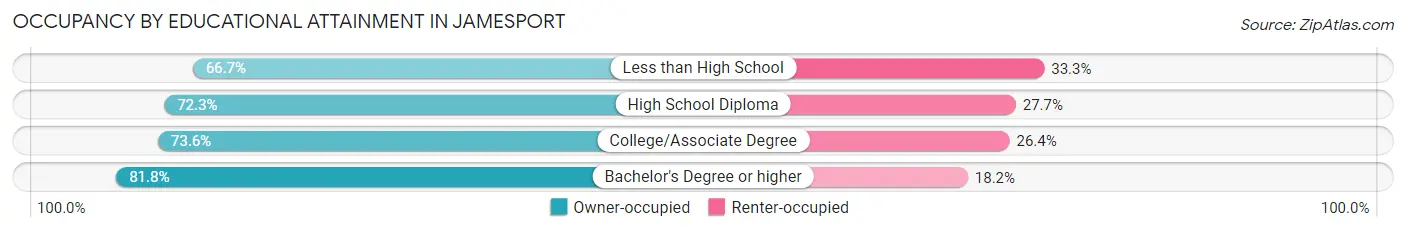
| Household Size | Owner-occupied | Renter-occupied |
| Less than High School | 22 (66.7%) | 11 (33.3%) |
| High School Diploma | 81 (72.3%) | 31 (27.7%) |
| College/Associate Degree | 64 (73.6%) | 23 (26.4%) |
| Bachelor's Degree or higher | 9 (81.8%) | 2 (18.2%) |
Occupancy by Age of Householder in Jamesport
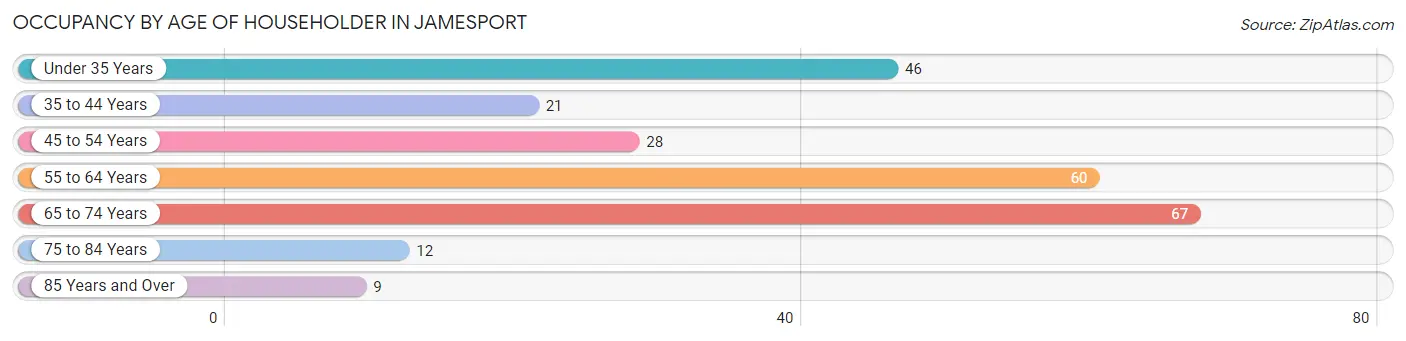
| Age Bracket | # Households | % Households |
| Under 35 Years | 46 | 18.9% |
| 35 to 44 Years | 21 | 8.6% |
| 45 to 54 Years | 28 | 11.5% |
| 55 to 64 Years | 60 | 24.7% |
| 65 to 74 Years | 67 | 27.6% |
| 75 to 84 Years | 12 | 4.9% |
| 85 Years and Over | 9 | 3.7% |
| Total | 243 | 100.0% |
Housing Finances in Jamesport
Median Income by Occupancy in Jamesport
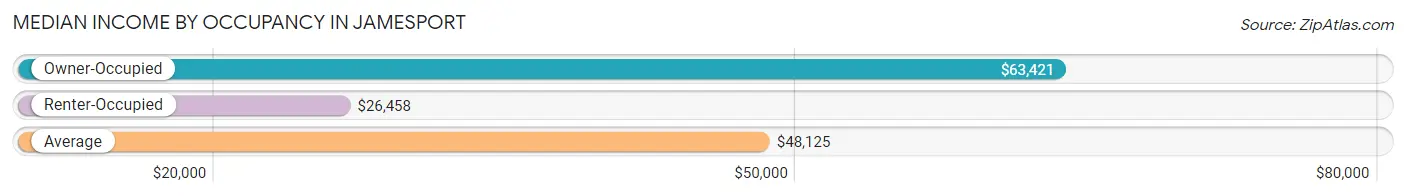
| Occupancy Type | # Households | Median Income |
| Owner-Occupied | 176 (72.4%) | $63,421 |
| Renter-Occupied | 67 (27.6%) | $26,458 |
| Average | 243 (100.0%) | $48,125 |
Occupancy by Householder Income Bracket in Jamesport
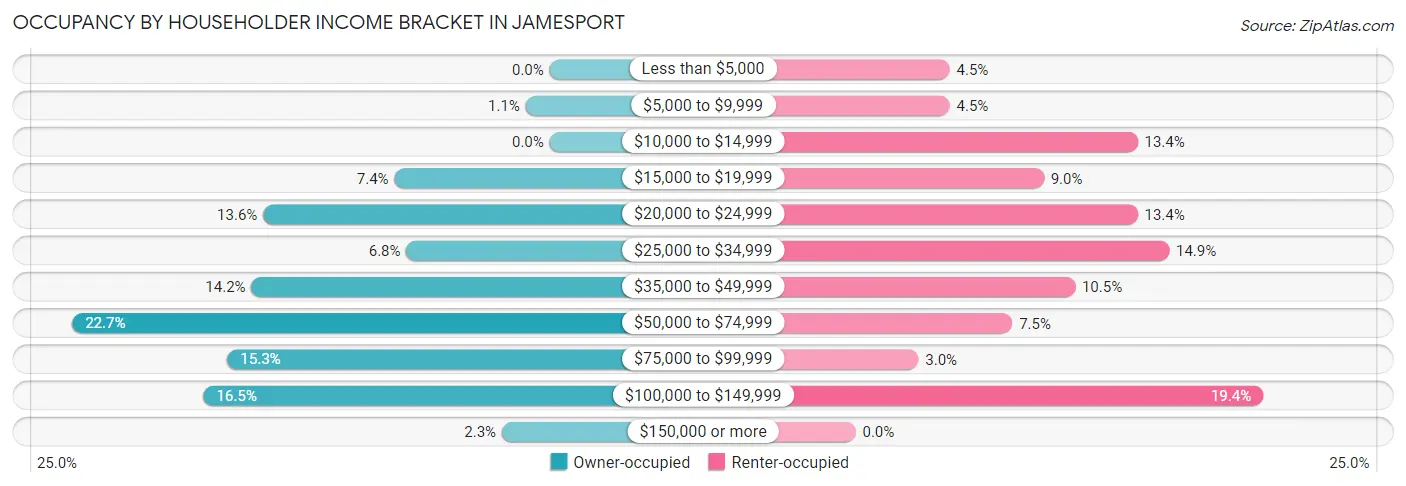
| Income Bracket | Owner-occupied | Renter-occupied |
| Less than $5,000 | 0 (0.0%) | 3 (4.5%) |
| $5,000 to $9,999 | 2 (1.1%) | 3 (4.5%) |
| $10,000 to $14,999 | 0 (0.0%) | 9 (13.4%) |
| $15,000 to $19,999 | 13 (7.4%) | 6 (9.0%) |
| $20,000 to $24,999 | 24 (13.6%) | 9 (13.4%) |
| $25,000 to $34,999 | 12 (6.8%) | 10 (14.9%) |
| $35,000 to $49,999 | 25 (14.2%) | 7 (10.4%) |
| $50,000 to $74,999 | 40 (22.7%) | 5 (7.5%) |
| $75,000 to $99,999 | 27 (15.3%) | 2 (3.0%) |
| $100,000 to $149,999 | 29 (16.5%) | 13 (19.4%) |
| $150,000 or more | 4 (2.3%) | 0 (0.0%) |
| Total | 176 (100.0%) | 67 (100.0%) |
Monthly Housing Cost Tiers in Jamesport
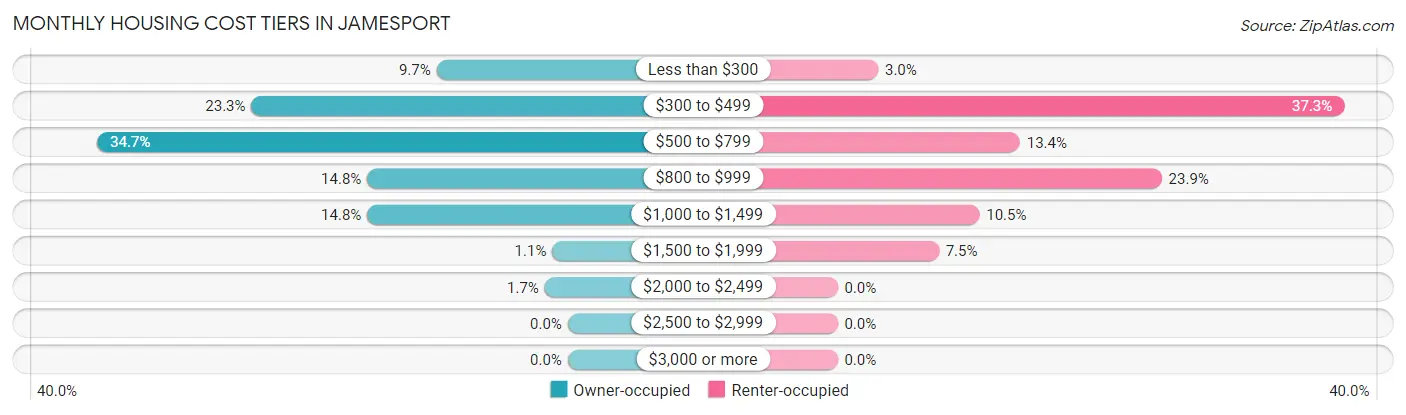
| Monthly Cost | Owner-occupied | Renter-occupied |
| Less than $300 | 17 (9.7%) | 2 (3.0%) |
| $300 to $499 | 41 (23.3%) | 25 (37.3%) |
| $500 to $799 | 61 (34.7%) | 9 (13.4%) |
| $800 to $999 | 26 (14.8%) | 16 (23.9%) |
| $1,000 to $1,499 | 26 (14.8%) | 7 (10.4%) |
| $1,500 to $1,999 | 2 (1.1%) | 5 (7.5%) |
| $2,000 to $2,499 | 3 (1.7%) | 0 (0.0%) |
| $2,500 to $2,999 | 0 (0.0%) | 0 (0.0%) |
| $3,000 or more | 0 (0.0%) | 0 (0.0%) |
| Total | 176 (100.0%) | 67 (100.0%) |
Physical Housing Characteristics in Jamesport
Housing Structures in Jamesport
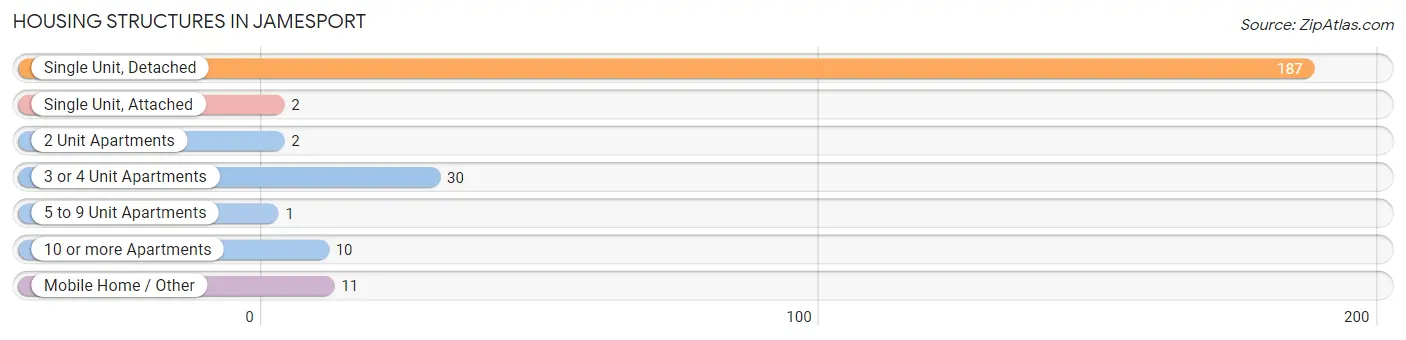
| Structure Type | # Housing Units | % Housing Units |
| Single Unit, Detached | 187 | 76.9% |
| Single Unit, Attached | 2 | 0.8% |
| 2 Unit Apartments | 2 | 0.8% |
| 3 or 4 Unit Apartments | 30 | 12.3% |
| 5 to 9 Unit Apartments | 1 | 0.4% |
| 10 or more Apartments | 10 | 4.1% |
| Mobile Home / Other | 11 | 4.5% |
| Total | 243 | 100.0% |
Housing Structures by Occupancy in Jamesport
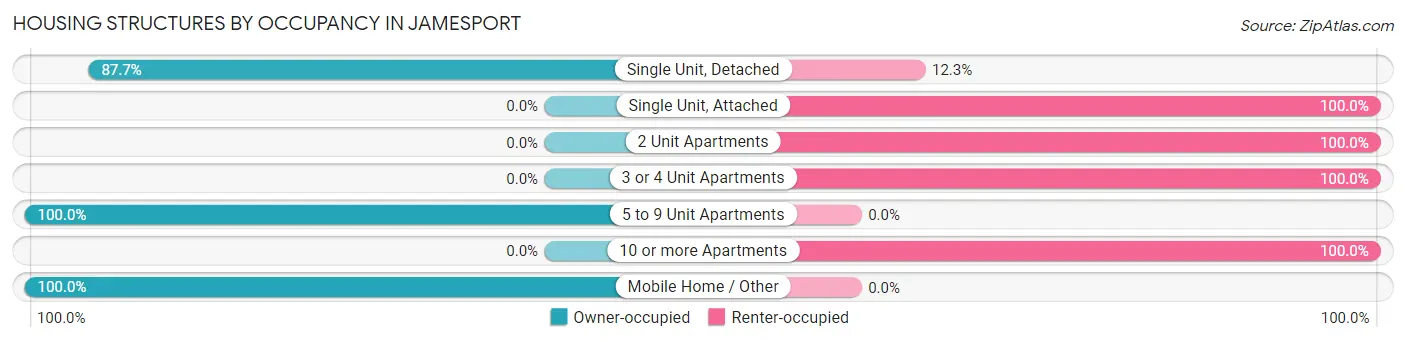
| Structure Type | Owner-occupied | Renter-occupied |
| Single Unit, Detached | 164 (87.7%) | 23 (12.3%) |
| Single Unit, Attached | 0 (0.0%) | 2 (100.0%) |
| 2 Unit Apartments | 0 (0.0%) | 2 (100.0%) |
| 3 or 4 Unit Apartments | 0 (0.0%) | 30 (100.0%) |
| 5 to 9 Unit Apartments | 1 (100.0%) | 0 (0.0%) |
| 10 or more Apartments | 0 (0.0%) | 10 (100.0%) |
| Mobile Home / Other | 11 (100.0%) | 0 (0.0%) |
| Total | 176 (72.4%) | 67 (27.6%) |
Housing Structures by Number of Rooms in Jamesport
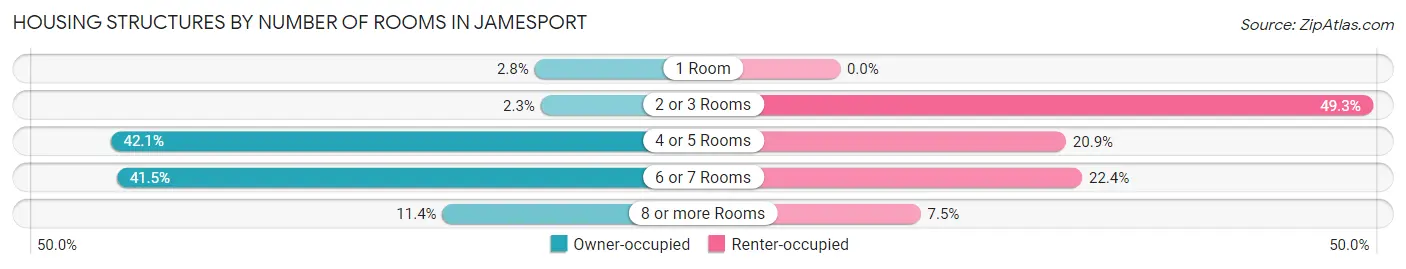
| Number of Rooms | Owner-occupied | Renter-occupied |
| 1 Room | 5 (2.8%) | 0 (0.0%) |
| 2 or 3 Rooms | 4 (2.3%) | 33 (49.2%) |
| 4 or 5 Rooms | 74 (42.0%) | 14 (20.9%) |
| 6 or 7 Rooms | 73 (41.5%) | 15 (22.4%) |
| 8 or more Rooms | 20 (11.4%) | 5 (7.5%) |
| Total | 176 (100.0%) | 67 (100.0%) |
Housing Structure by Heating Type in Jamesport
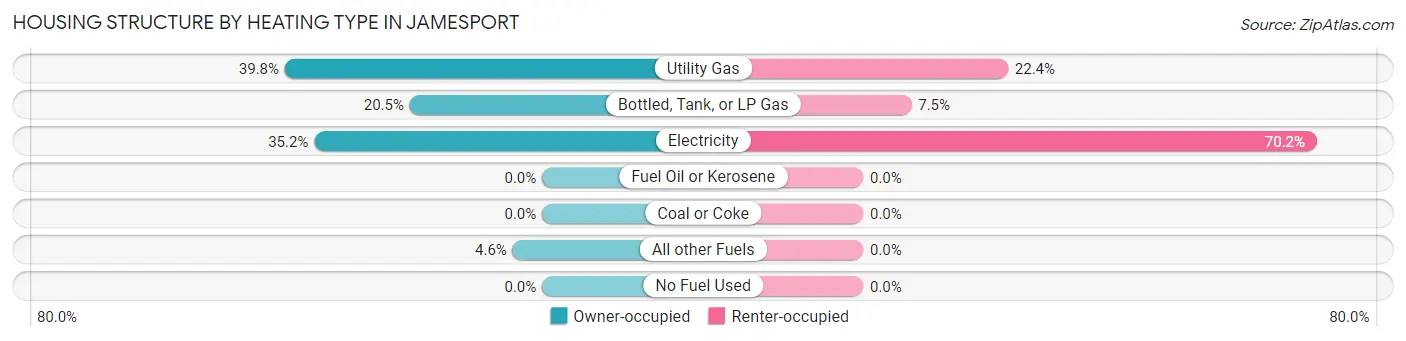
| Heating Type | Owner-occupied | Renter-occupied |
| Utility Gas | 70 (39.8%) | 15 (22.4%) |
| Bottled, Tank, or LP Gas | 36 (20.4%) | 5 (7.5%) |
| Electricity | 62 (35.2%) | 47 (70.2%) |
| Fuel Oil or Kerosene | 0 (0.0%) | 0 (0.0%) |
| Coal or Coke | 0 (0.0%) | 0 (0.0%) |
| All other Fuels | 8 (4.5%) | 0 (0.0%) |
| No Fuel Used | 0 (0.0%) | 0 (0.0%) |
| Total | 176 (100.0%) | 67 (100.0%) |
Household Vehicle Usage in Jamesport
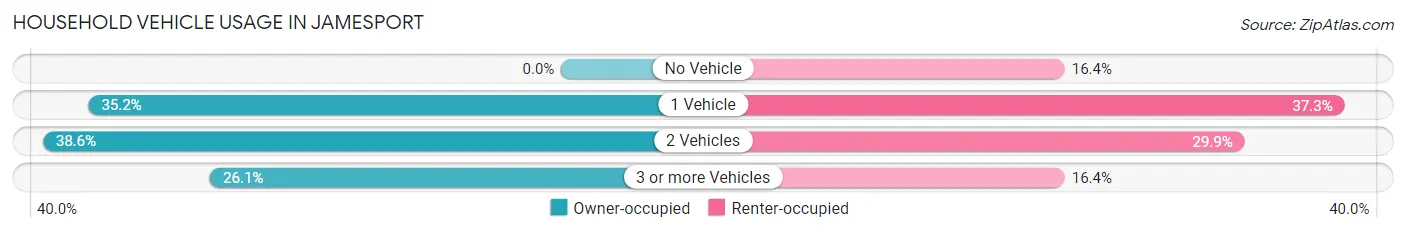
| Vehicles per Household | Owner-occupied | Renter-occupied |
| No Vehicle | 0 (0.0%) | 11 (16.4%) |
| 1 Vehicle | 62 (35.2%) | 25 (37.3%) |
| 2 Vehicles | 68 (38.6%) | 20 (29.8%) |
| 3 or more Vehicles | 46 (26.1%) | 11 (16.4%) |
| Total | 176 (100.0%) | 67 (100.0%) |
Real Estate & Mortgages in Jamesport
Real Estate and Mortgage Overview in Jamesport
| Characteristic | Without Mortgage | With Mortgage |
| Housing Units | 99 | 77 |
| Median Property Value | $103,400 | $66,400 |
| Median Household Income | $41,979 | $0 |
| Monthly Housing Costs | $455 | $0 |
| Real Estate Taxes | $921 | $0 |
Property Value by Mortgage Status in Jamesport
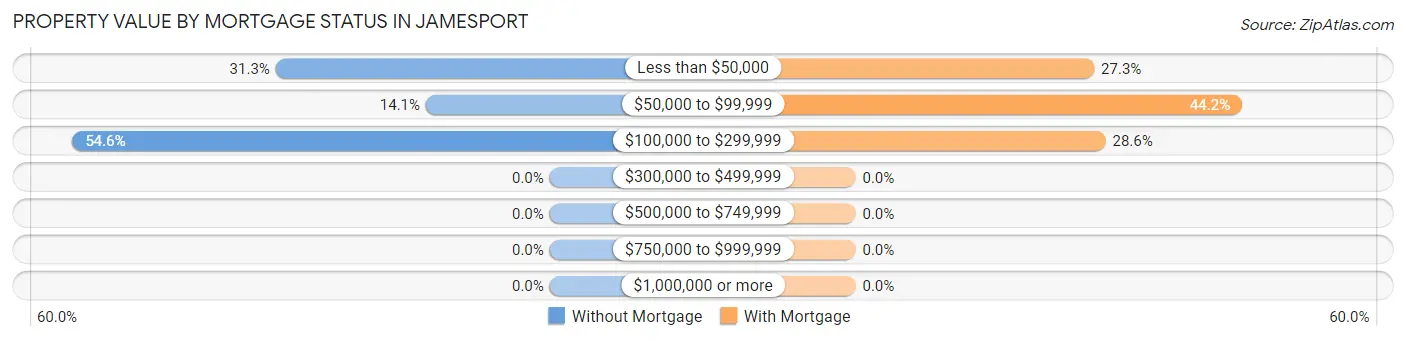
| Property Value | Without Mortgage | With Mortgage |
| Less than $50,000 | 31 (31.3%) | 21 (27.3%) |
| $50,000 to $99,999 | 14 (14.1%) | 34 (44.2%) |
| $100,000 to $299,999 | 54 (54.5%) | 22 (28.6%) |
| $300,000 to $499,999 | 0 (0.0%) | 0 (0.0%) |
| $500,000 to $749,999 | 0 (0.0%) | 0 (0.0%) |
| $750,000 to $999,999 | 0 (0.0%) | 0 (0.0%) |
| $1,000,000 or more | 0 (0.0%) | 0 (0.0%) |
| Total | 99 (100.0%) | 77 (100.0%) |
Household Income by Mortgage Status in Jamesport
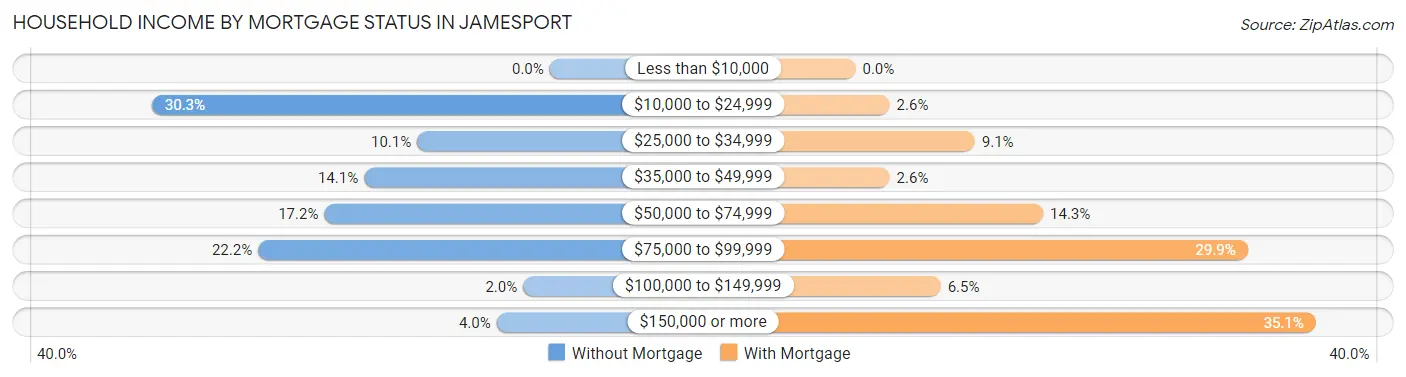
| Household Income | Without Mortgage | With Mortgage |
| Less than $10,000 | 0 (0.0%) | 0 (0.0%) |
| $10,000 to $24,999 | 30 (30.3%) | 2 (2.6%) |
| $25,000 to $34,999 | 10 (10.1%) | 7 (9.1%) |
| $35,000 to $49,999 | 14 (14.1%) | 2 (2.6%) |
| $50,000 to $74,999 | 17 (17.2%) | 11 (14.3%) |
| $75,000 to $99,999 | 22 (22.2%) | 23 (29.9%) |
| $100,000 to $149,999 | 2 (2.0%) | 5 (6.5%) |
| $150,000 or more | 4 (4.0%) | 27 (35.1%) |
| Total | 99 (100.0%) | 77 (100.0%) |
Property Value to Household Income Ratio in Jamesport
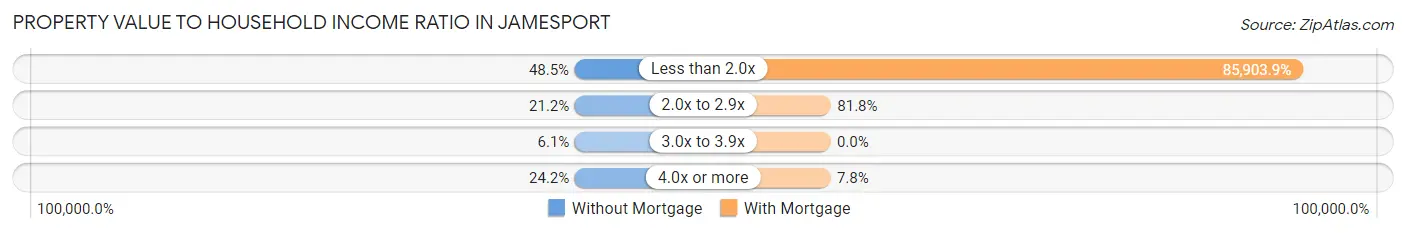
| Value-to-Income Ratio | Without Mortgage | With Mortgage |
| Less than 2.0x | 48 (48.5%) | 66,146 (85,903.9%) |
| 2.0x to 2.9x | 21 (21.2%) | 63 (81.8%) |
| 3.0x to 3.9x | 6 (6.1%) | 0 (0.0%) |
| 4.0x or more | 24 (24.2%) | 6 (7.8%) |
| Total | 99 (100.0%) | 77 (100.0%) |
Real Estate Taxes by Mortgage Status in Jamesport
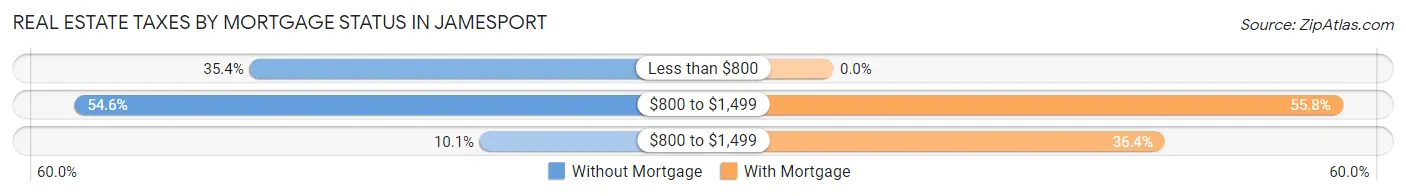
| Property Taxes | Without Mortgage | With Mortgage |
| Less than $800 | 35 (35.3%) | 0 (0.0%) |
| $800 to $1,499 | 54 (54.5%) | 43 (55.8%) |
| $800 to $1,499 | 10 (10.1%) | 28 (36.4%) |
| Total | 99 (100.0%) | 77 (100.0%) |
Health & Disability in Jamesport
Health Insurance Coverage by Age in Jamesport
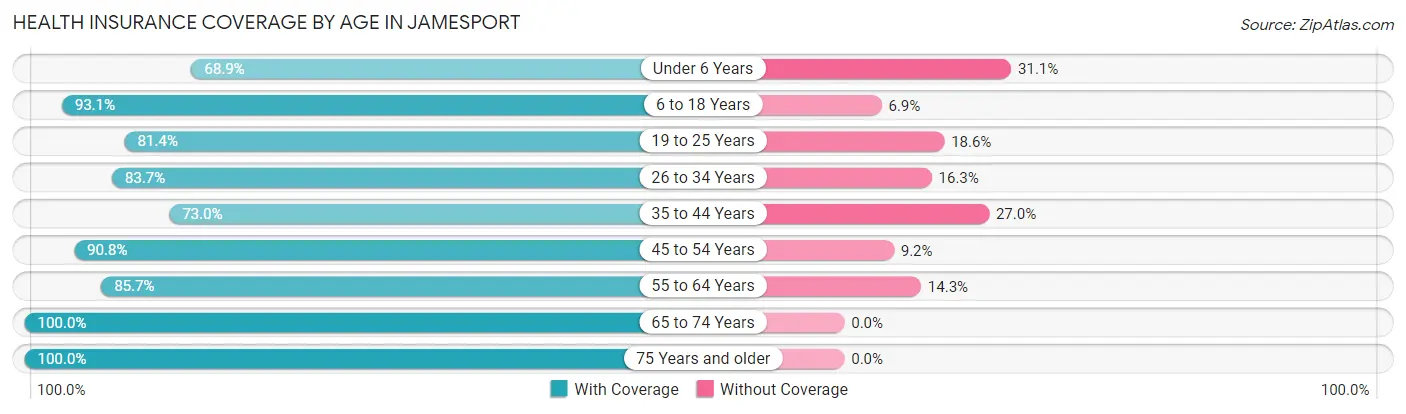
| Age Bracket | With Coverage | Without Coverage |
| Under 6 Years | 31 (68.9%) | 14 (31.1%) |
| 6 to 18 Years | 67 (93.1%) | 5 (6.9%) |
| 19 to 25 Years | 83 (81.4%) | 19 (18.6%) |
| 26 to 34 Years | 36 (83.7%) | 7 (16.3%) |
| 35 to 44 Years | 46 (73.0%) | 17 (27.0%) |
| 45 to 54 Years | 59 (90.8%) | 6 (9.2%) |
| 55 to 64 Years | 90 (85.7%) | 15 (14.3%) |
| 65 to 74 Years | 92 (100.0%) | 0 (0.0%) |
| 75 Years and older | 38 (100.0%) | 0 (0.0%) |
| Total | 542 (86.7%) | 83 (13.3%) |
Health Insurance Coverage by Citizenship Status in Jamesport
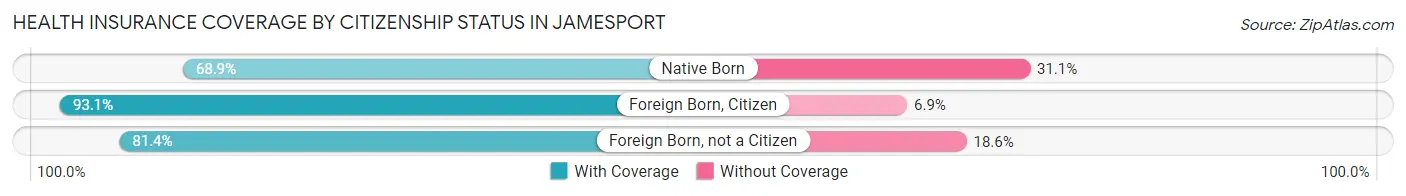
| Citizenship Status | With Coverage | Without Coverage |
| Native Born | 31 (68.9%) | 14 (31.1%) |
| Foreign Born, Citizen | 67 (93.1%) | 5 (6.9%) |
| Foreign Born, not a Citizen | 83 (81.4%) | 19 (18.6%) |
Health Insurance Coverage by Household Income in Jamesport
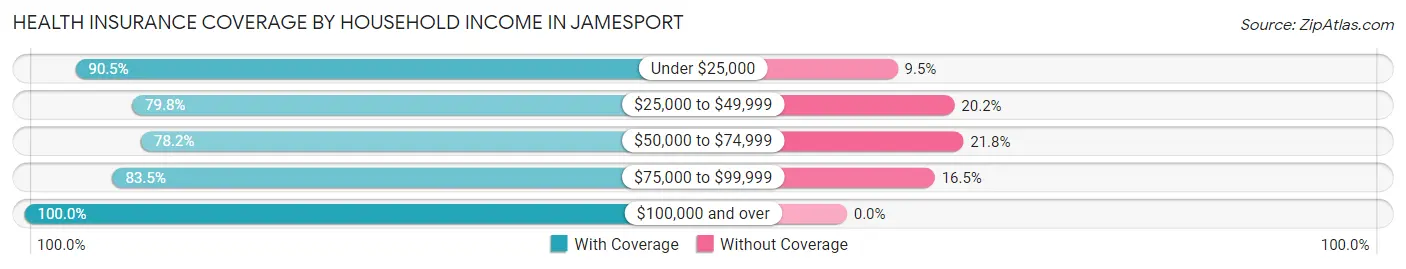
| Household Income | With Coverage | Without Coverage |
| Under $25,000 | 114 (90.5%) | 12 (9.5%) |
| $25,000 to $49,999 | 103 (79.8%) | 26 (20.2%) |
| $50,000 to $74,999 | 111 (78.2%) | 31 (21.8%) |
| $75,000 to $99,999 | 71 (83.5%) | 14 (16.5%) |
| $100,000 and over | 143 (100.0%) | 0 (0.0%) |
Public vs Private Health Insurance Coverage by Age in Jamesport
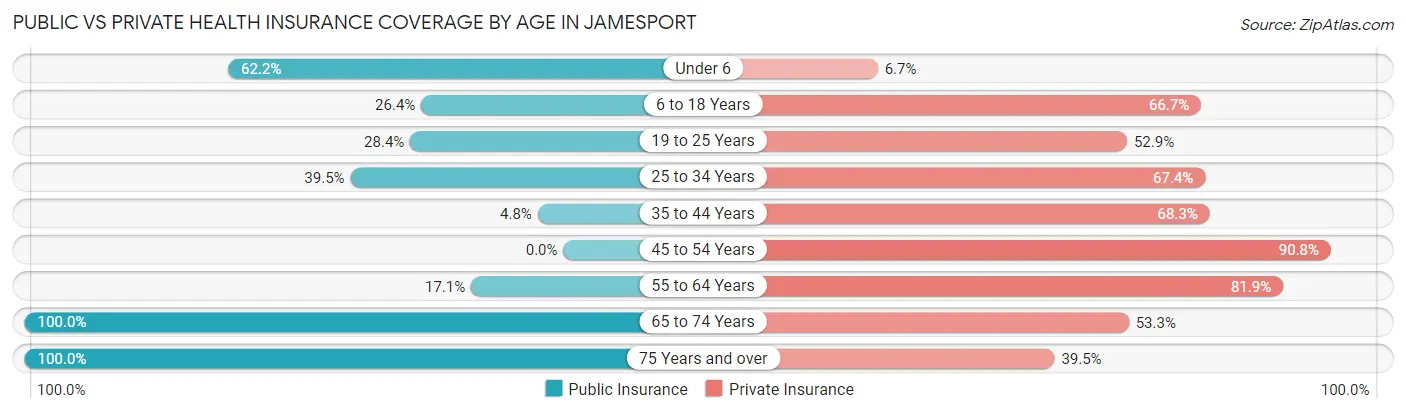
| Age Bracket | Public Insurance | Private Insurance |
| Under 6 | 28 (62.2%) | 3 (6.7%) |
| 6 to 18 Years | 19 (26.4%) | 48 (66.7%) |
| 19 to 25 Years | 29 (28.4%) | 54 (52.9%) |
| 25 to 34 Years | 17 (39.5%) | 29 (67.4%) |
| 35 to 44 Years | 3 (4.8%) | 43 (68.2%) |
| 45 to 54 Years | 0 (0.0%) | 59 (90.8%) |
| 55 to 64 Years | 18 (17.1%) | 86 (81.9%) |
| 65 to 74 Years | 92 (100.0%) | 49 (53.3%) |
| 75 Years and over | 38 (100.0%) | 15 (39.5%) |
| Total | 244 (39.0%) | 386 (61.8%) |
Disability Status by Sex by Age in Jamesport
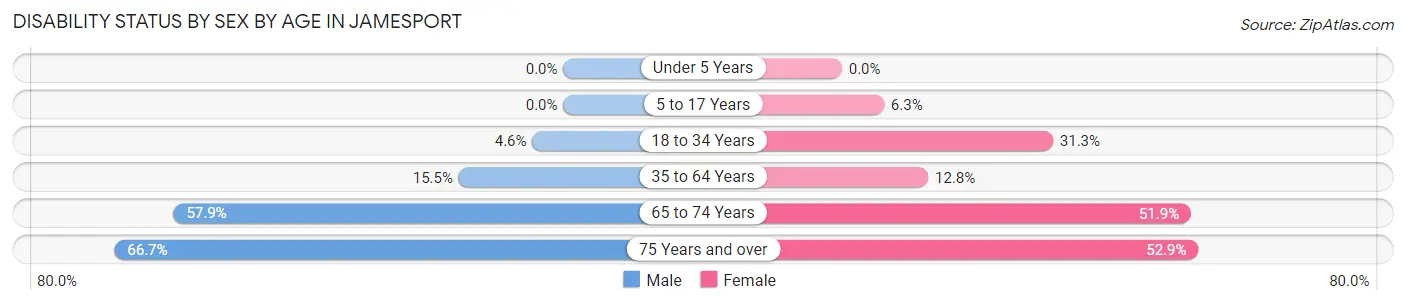
| Age Bracket | Male | Female |
| Under 5 Years | 0 (0.0%) | 0 (0.0%) |
| 5 to 17 Years | 0 (0.0%) | 2 (6.2%) |
| 18 to 34 Years | 4 (4.6%) | 21 (31.3%) |
| 35 to 64 Years | 18 (15.5%) | 15 (12.8%) |
| 65 to 74 Years | 22 (57.9%) | 28 (51.8%) |
| 75 Years and over | 14 (66.7%) | 9 (52.9%) |
Disability Class by Sex by Age in Jamesport
Disability Class: Hearing Difficulty
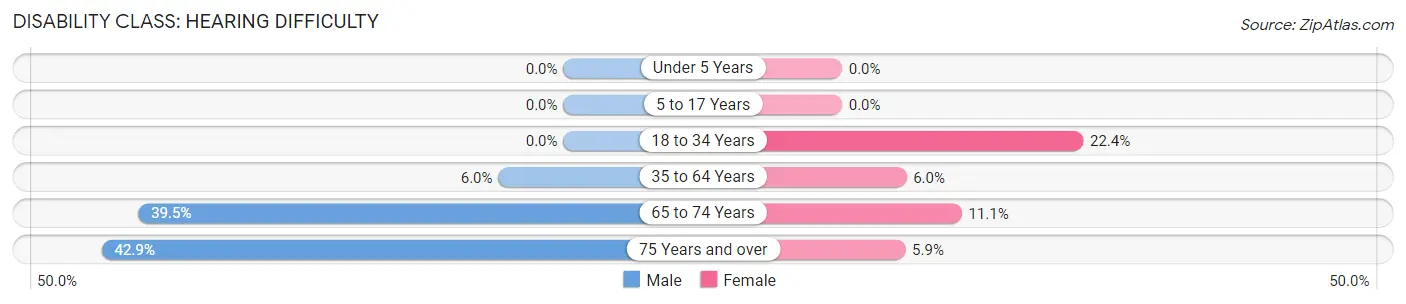
| Age Bracket | Male | Female |
| Under 5 Years | 0 (0.0%) | 0 (0.0%) |
| 5 to 17 Years | 0 (0.0%) | 0 (0.0%) |
| 18 to 34 Years | 0 (0.0%) | 15 (22.4%) |
| 35 to 64 Years | 7 (6.0%) | 7 (6.0%) |
| 65 to 74 Years | 15 (39.5%) | 6 (11.1%) |
| 75 Years and over | 9 (42.9%) | 1 (5.9%) |
Disability Class: Vision Difficulty
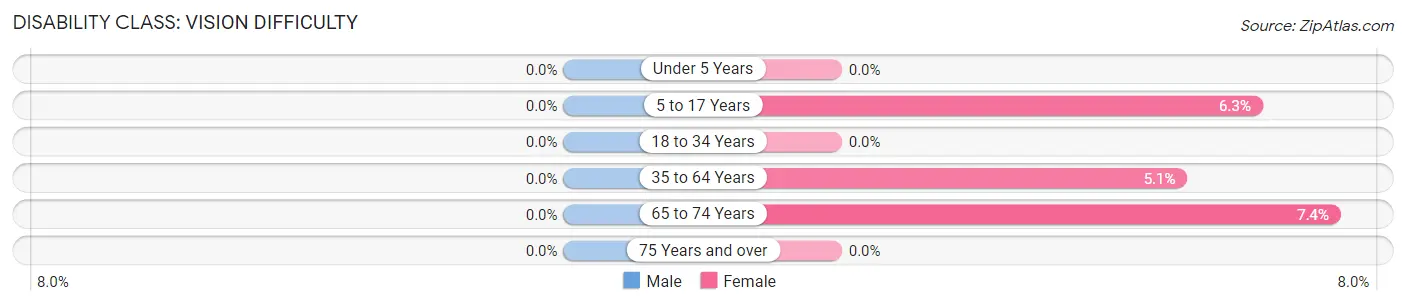
| Age Bracket | Male | Female |
| Under 5 Years | 0 (0.0%) | 0 (0.0%) |
| 5 to 17 Years | 0 (0.0%) | 2 (6.2%) |
| 18 to 34 Years | 0 (0.0%) | 0 (0.0%) |
| 35 to 64 Years | 0 (0.0%) | 6 (5.1%) |
| 65 to 74 Years | 0 (0.0%) | 4 (7.4%) |
| 75 Years and over | 0 (0.0%) | 0 (0.0%) |
Disability Class: Cognitive Difficulty
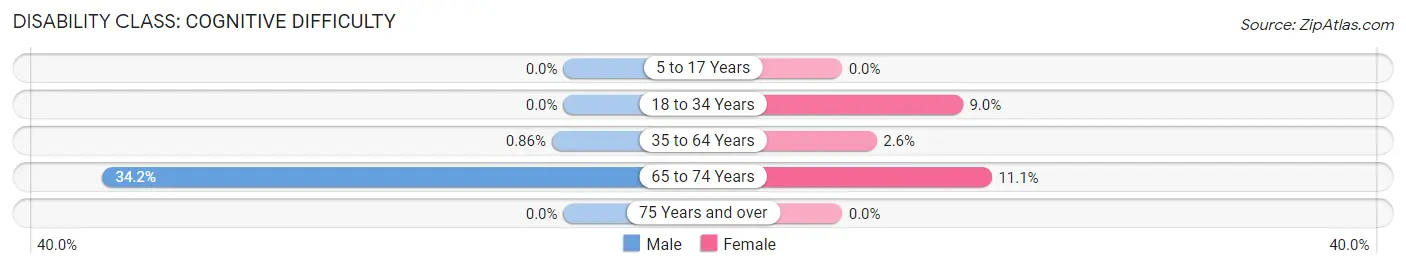
| Age Bracket | Male | Female |
| 5 to 17 Years | 0 (0.0%) | 0 (0.0%) |
| 18 to 34 Years | 0 (0.0%) | 6 (9.0%) |
| 35 to 64 Years | 1 (0.9%) | 3 (2.6%) |
| 65 to 74 Years | 13 (34.2%) | 6 (11.1%) |
| 75 Years and over | 0 (0.0%) | 0 (0.0%) |
Disability Class: Ambulatory Difficulty
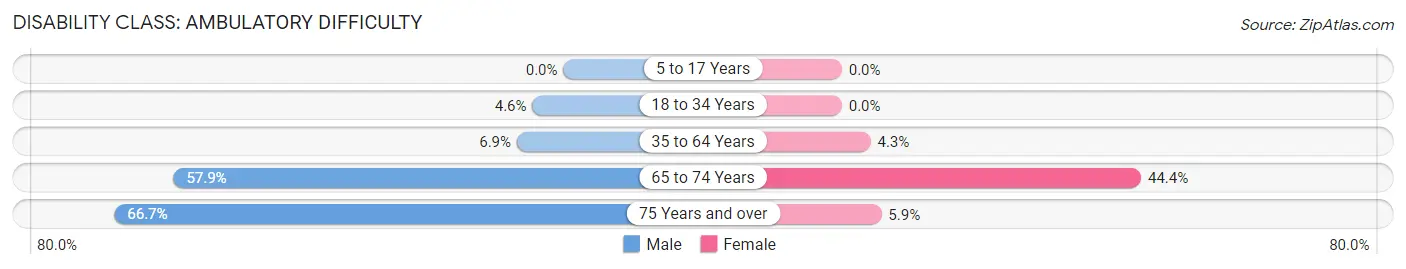
| Age Bracket | Male | Female |
| 5 to 17 Years | 0 (0.0%) | 0 (0.0%) |
| 18 to 34 Years | 4 (4.6%) | 0 (0.0%) |
| 35 to 64 Years | 8 (6.9%) | 5 (4.3%) |
| 65 to 74 Years | 22 (57.9%) | 24 (44.4%) |
| 75 Years and over | 14 (66.7%) | 1 (5.9%) |
Disability Class: Self-Care Difficulty
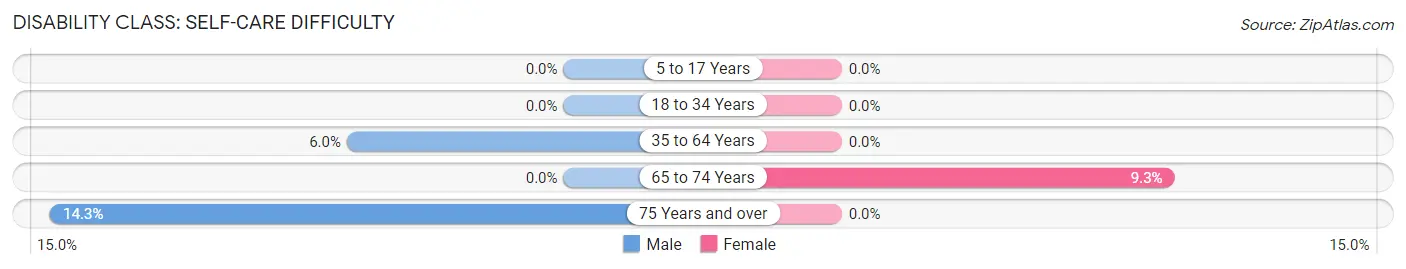
| Age Bracket | Male | Female |
| 5 to 17 Years | 0 (0.0%) | 0 (0.0%) |
| 18 to 34 Years | 0 (0.0%) | 0 (0.0%) |
| 35 to 64 Years | 7 (6.0%) | 0 (0.0%) |
| 65 to 74 Years | 0 (0.0%) | 5 (9.3%) |
| 75 Years and over | 3 (14.3%) | 0 (0.0%) |
Technology Access in Jamesport
Computing Device Access in Jamesport
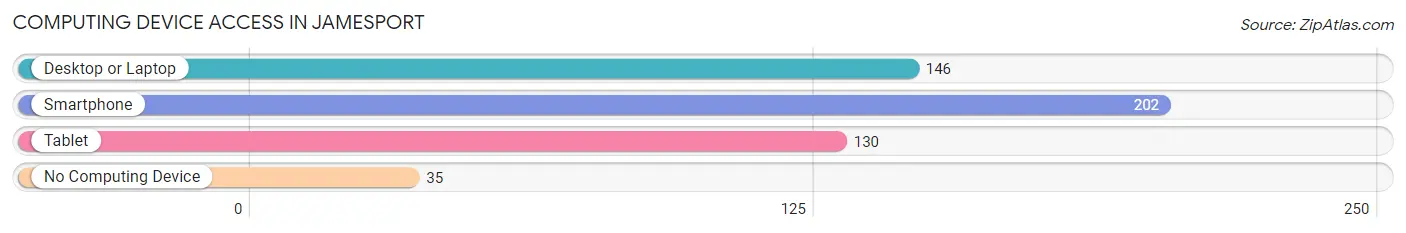
| Device Type | # Households | % Households |
| Desktop or Laptop | 146 | 60.1% |
| Smartphone | 202 | 83.1% |
| Tablet | 130 | 53.5% |
| No Computing Device | 35 | 14.4% |
| Total | 243 | 100.0% |
Internet Access in Jamesport
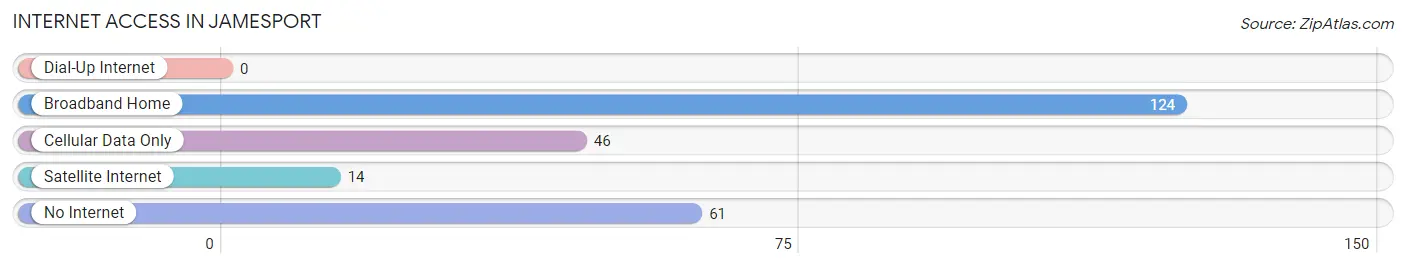
| Internet Type | # Households | % Households |
| Dial-Up Internet | 0 | 0.0% |
| Broadband Home | 124 | 51.0% |
| Cellular Data Only | 46 | 18.9% |
| Satellite Internet | 14 | 5.8% |
| No Internet | 61 | 25.1% |
| Total | 243 | 100.0% |
Jamesport Summary
Introduction
Jamesport, Missouri is a small town located in the northwest corner of the state. It is a rural community with a population of just over 1,000 people. The town is known for its strong agricultural heritage and its close-knit community. It is also home to a variety of businesses, including a winery, a cheese factory, and a variety of other small businesses.
History
Jamesport was founded in 1871 by James and Mary Ann Smith. The Smiths were originally from Kentucky and had moved to Missouri in search of a better life. They purchased land in the area and began to build a small town. The town was named after James Smith and was originally known as Smithville.
In 1876, the town was renamed Jamesport. The town grew slowly but steadily over the years, and by the early 1900s, it had become a thriving agricultural community. The town was home to a variety of businesses, including a cheese factory, a winery, and a variety of other small businesses.
Geography
Jamesport is located in the northwest corner of Missouri, near the Iowa and Nebraska borders. It is situated in the Missouri River Valley, which is known for its fertile soil and abundant natural resources. The town is surrounded by rolling hills and farmland, and is located about 30 miles from the nearest major city, St. Joseph.
The climate in Jamesport is generally mild, with hot summers and cold winters. The average temperature in the summer is around 80 degrees Fahrenheit, and the average temperature in the winter is around 40 degrees Fahrenheit.
Economy
Jamesport’s economy is largely based on agriculture. The town is home to a variety of farms, including dairy farms, beef farms, and vegetable farms. The town is also home to a variety of small businesses, including a winery, a cheese factory, and a variety of other small businesses.
The town is also home to a variety of tourist attractions, including a museum, a winery, and a variety of other attractions. The town is also home to a variety of festivals and events throughout the year, including the Jamesport Country Fair, which is held every summer.
Demographics
As of the 2010 census, the population of Jamesport was 1,072. The population is largely white (97.2%), with a small percentage of African Americans (1.2%) and Hispanics (1.6%). The median household income in Jamesport is $41,250, and the median age is 44.
Conclusion
Jamesport, Missouri is a small town with a population of just over 1,000 people. The town is known for its strong agricultural heritage and its close-knit community. It is also home to a variety of businesses, including a winery, a cheese factory, and a variety of other small businesses. The town is also home to a variety of tourist attractions, including a museum, a winery, and a variety of other attractions. The town’s economy is largely based on agriculture, and the population is largely white.
Common Questions
What is Per Capita Income in Jamesport?
Per Capita income in Jamesport is $24,749.
What is the Median Family Income in Jamesport?
Median Family Income in Jamesport is $67,031.
What is the Median Household income in Jamesport?
Median Household Income in Jamesport is $48,125.
What is Income or Wage Gap in Jamesport?
Income or Wage Gap in Jamesport is 34.8%.
Women in Jamesport earn 65.2 cents for every dollar earned by a man.
What is Inequality or Gini Index in Jamesport?
Inequality or Gini Index in Jamesport is 0.41.
What is the Total Population of Jamesport?
Total Population of Jamesport is 625.
What is the Total Male Population of Jamesport?
Total Male Population of Jamesport is 310.
What is the Total Female Population of Jamesport?
Total Female Population of Jamesport is 315.
What is the Ratio of Males per 100 Females in Jamesport?
There are 98.41 Males per 100 Females in Jamesport.
What is the Ratio of Females per 100 Males in Jamesport?
There are 101.61 Females per 100 Males in Jamesport.
What is the Median Population Age in Jamesport?
Median Population Age in Jamesport is 43.2 Years.
What is the Average Family Size in Jamesport
Average Family Size in Jamesport is 3.1 People.
What is the Average Household Size in Jamesport
Average Household Size in Jamesport is 2.6 People.
How Large is the Labor Force in Jamesport?
There are 296 People in the Labor Forcein in Jamesport.
What is the Percentage of People in the Labor Force in Jamesport?
55.2% of People are in the Labor Force in Jamesport.
What is the Unemployment Rate in Jamesport?
Unemployment Rate in Jamesport is 2.0%.