Zip Codes with the Highest Percentage of Population Employed in Accommodation & Food Services in Independence, MO
RELATED REPORTS & OPTIONS
Accommodation & Food Services
Independence
Compare Zip Codes
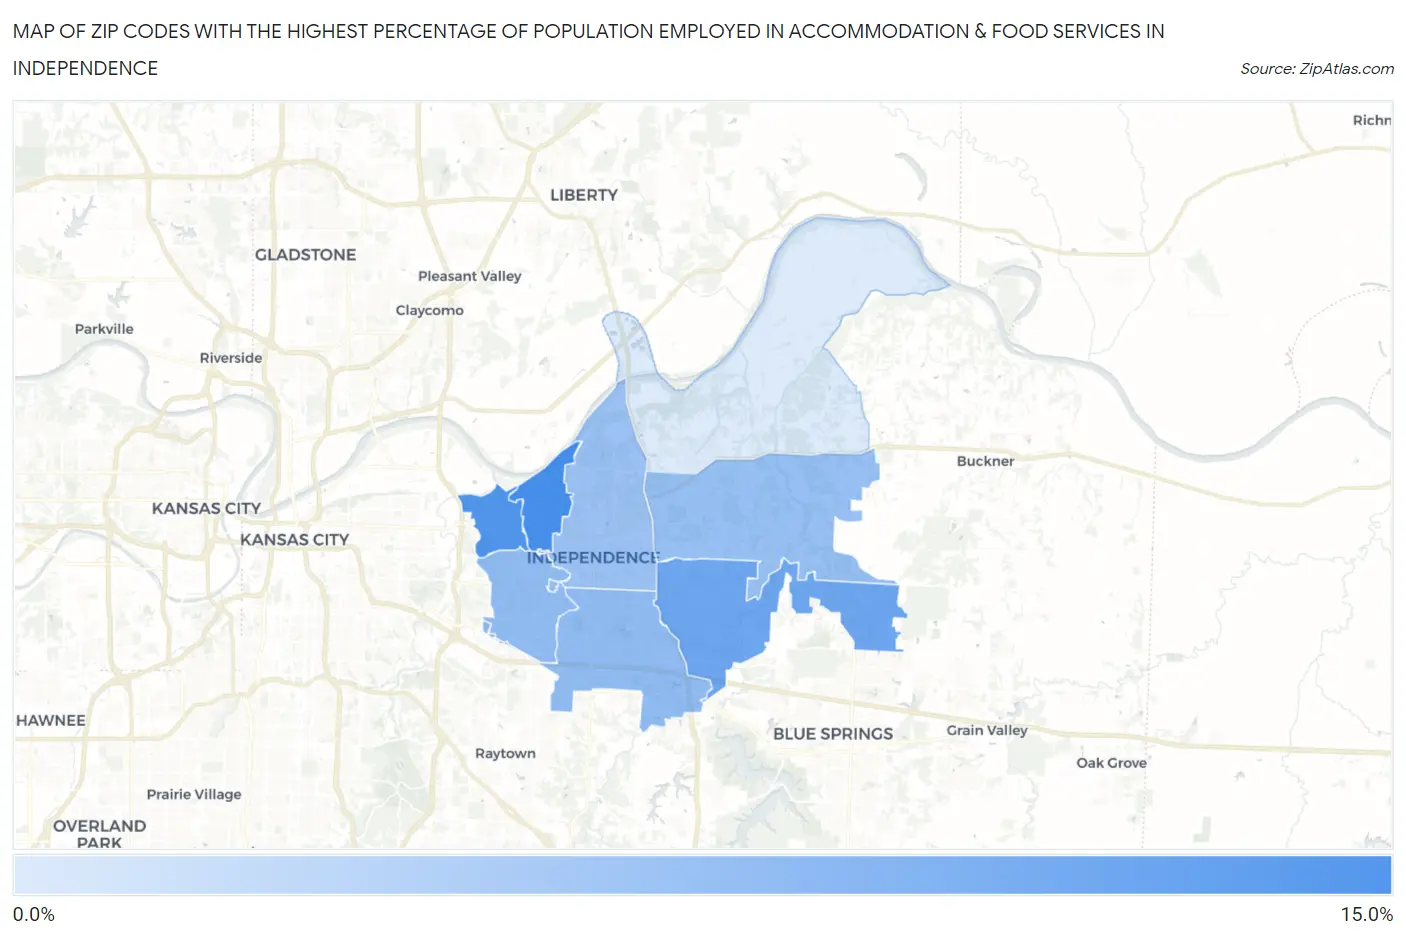
Map of Zip Codes with the Highest Percentage of Population Employed in Accommodation & Food Services in Independence
4.4%
10.1%
Zip Codes with the Highest Percentage of Population Employed in Accommodation & Food Services in Independence, MO
| Zip Code | % Employed | vs State | vs National | |
| 1. | 64054 | 10.1% | 6.6%(+3.55)#123 | 6.9%(+3.24)#4,385 |
| 2. | 64053 | 9.7% | 6.6%(+3.12)#138 | 6.9%(+2.82)#4,929 |
| 3. | 64057 | 8.6% | 6.6%(+1.99)#190 | 6.9%(+1.69)#6,694 |
| 4. | 64055 | 7.3% | 6.6%(+0.676)#260 | 6.9%(+0.370)#9,674 |
| 5. | 64052 | 7.2% | 6.6%(+0.663)#261 | 6.9%(+0.357)#9,702 |
| 6. | 64056 | 7.0% | 6.6%(+0.419)#277 | 6.9%(+0.113)#10,331 |
| 7. | 64050 | 6.9% | 6.6%(+0.343)#284 | 6.9%(+0.037)#10,552 |
| 8. | 64058 | 4.4% | 6.6%(-2.16)#513 | 6.9%(-2.46)#18,765 |
1
Common Questions
What are the Top 5 Zip Codes with the Highest Percentage of Population Employed in Accommodation & Food Services in Independence, MO?
Top 5 Zip Codes with the Highest Percentage of Population Employed in Accommodation & Food Services in Independence, MO are:
What zip code has the Highest Percentage of Population Employed in Accommodation & Food Services in Independence, MO?
64054 has the Highest Percentage of Population Employed in Accommodation & Food Services in Independence, MO with 10.1%.
What is the Percentage of Population Employed in Accommodation & Food Services in Independence, MO?
Percentage of Population Employed in Accommodation & Food Services in Independence is 7.3%.
What is the Percentage of Population Employed in Accommodation & Food Services in Missouri?
Percentage of Population Employed in Accommodation & Food Services in Missouri is 6.6%.
What is the Percentage of Population Employed in Accommodation & Food Services in the United States?
Percentage of Population Employed in Accommodation & Food Services in the United States is 6.9%.