Theodosia, MO Map & Demographics
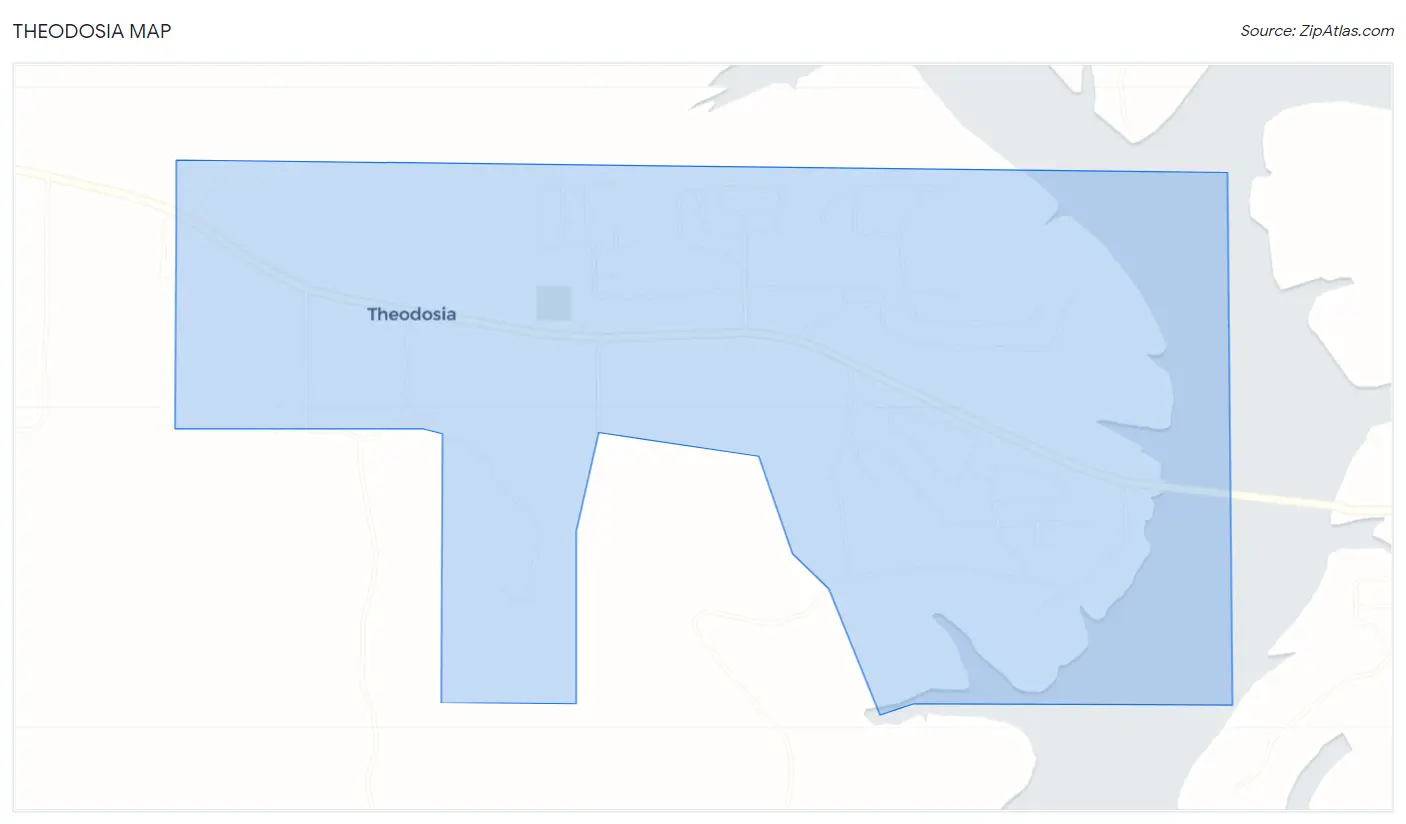
Theodosia Map
Theodosia Overview
$20,794
PER CAPITA INCOME
$28,750
AVG FAMILY INCOME
$22,440
AVG HOUSEHOLD INCOME
0.37
INEQUALITY / GINI INDEX
146
TOTAL POPULATION
84
MALE POPULATION
62
FEMALE POPULATION
135.48
MALES / 100 FEMALES
73.81
FEMALES / 100 MALES
63.1
MEDIAN AGE
2.1
AVG FAMILY SIZE
1.7
AVG HOUSEHOLD SIZE
23
LABOR FORCE [ PEOPLE ]
16.9%
PERCENT IN LABOR FORCE
Theodosia Zip Codes
Theodosia Area Codes
Income in Theodosia
Income Overview in Theodosia
Per Capita Income in Theodosia is $20,794, while median incomes of families and households are $28,750 and $22,440 respectively.
| Characteristic | Number | Measure |
| Per Capita Income | 146 | $20,794 |
| Median Family Income | 44 | $28,750 |
| Mean Family Income | 44 | $37,509 |
| Median Household Income | 85 | $22,440 |
| Mean Household Income | 85 | $36,752 |
| Income Deficit | 44 | $0 |
| Wage / Income Gap (%) | 146 | 0.00% |
| Wage / Income Gap ($) | 146 | 100.00¢ per $1 |
| Gini / Inequality Index | 146 | 0.37 |
Earnings by Sex in Theodosia
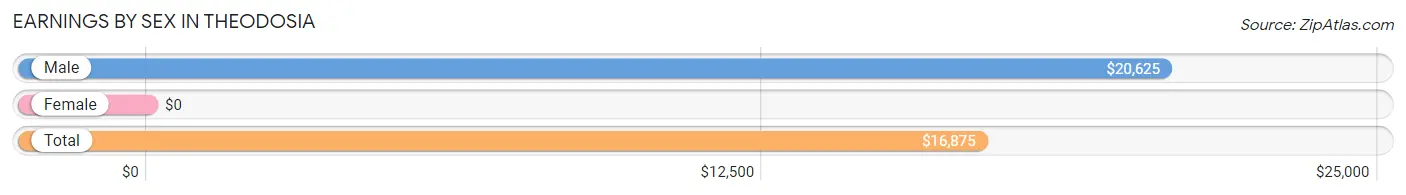
| Sex | Number | Average Earnings |
| Male | 11 (39.3%) | $20,625 |
| Female | 17 (60.7%) | $0 |
| Total | 28 (100.0%) | $16,875 |
Earnings by Sex by Income Bracket in Theodosia
The most common earnings brackets in Theodosia are $15,000 to $17,499 for men (3 | 27.3%) and $35,000 to $39,999 for women (5 | 29.4%).
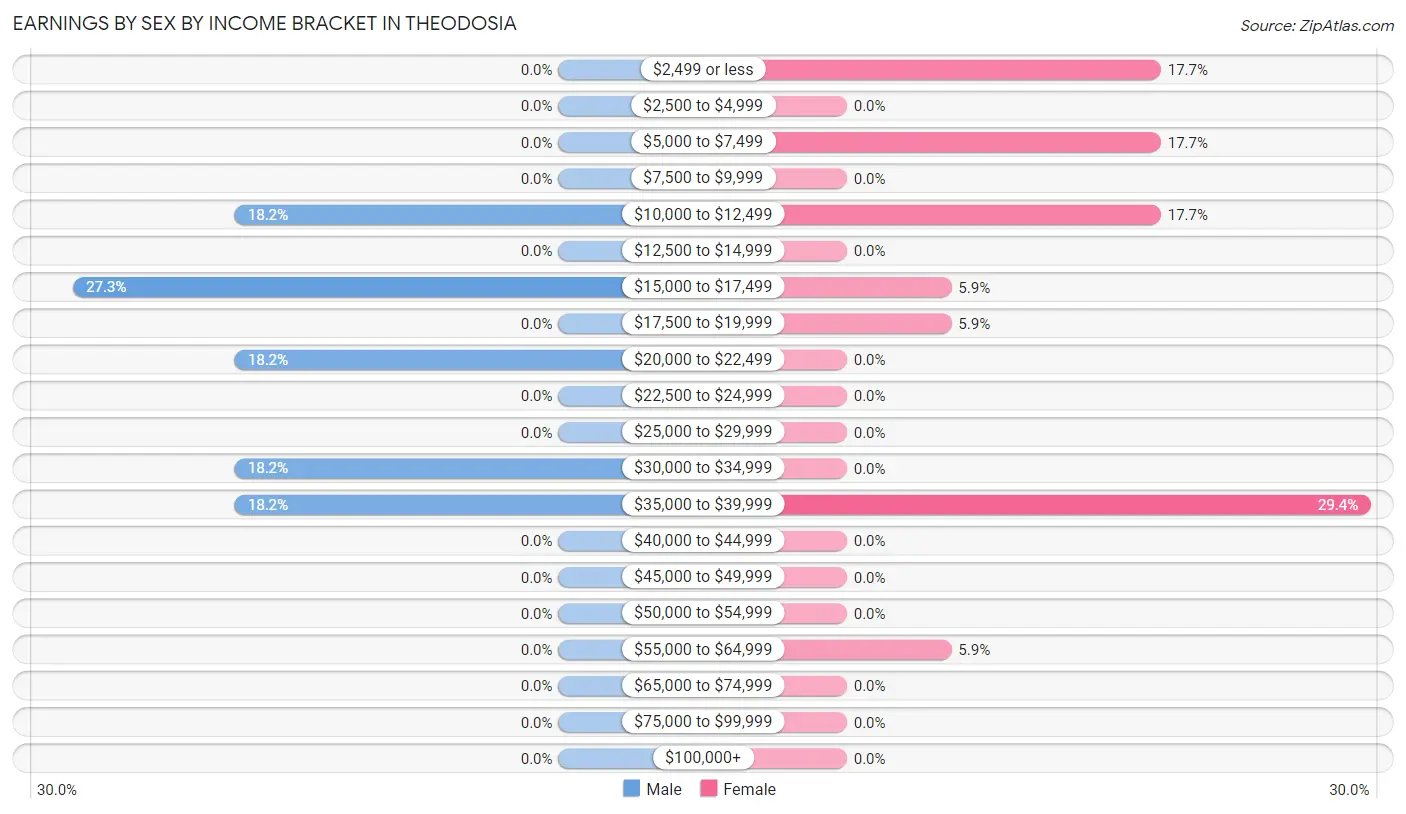
| Income | Male | Female |
| $2,499 or less | 0 (0.0%) | 3 (17.6%) |
| $2,500 to $4,999 | 0 (0.0%) | 0 (0.0%) |
| $5,000 to $7,499 | 0 (0.0%) | 3 (17.6%) |
| $7,500 to $9,999 | 0 (0.0%) | 0 (0.0%) |
| $10,000 to $12,499 | 2 (18.2%) | 3 (17.6%) |
| $12,500 to $14,999 | 0 (0.0%) | 0 (0.0%) |
| $15,000 to $17,499 | 3 (27.3%) | 1 (5.9%) |
| $17,500 to $19,999 | 0 (0.0%) | 1 (5.9%) |
| $20,000 to $22,499 | 2 (18.2%) | 0 (0.0%) |
| $22,500 to $24,999 | 0 (0.0%) | 0 (0.0%) |
| $25,000 to $29,999 | 0 (0.0%) | 0 (0.0%) |
| $30,000 to $34,999 | 2 (18.2%) | 0 (0.0%) |
| $35,000 to $39,999 | 2 (18.2%) | 5 (29.4%) |
| $40,000 to $44,999 | 0 (0.0%) | 0 (0.0%) |
| $45,000 to $49,999 | 0 (0.0%) | 0 (0.0%) |
| $50,000 to $54,999 | 0 (0.0%) | 0 (0.0%) |
| $55,000 to $64,999 | 0 (0.0%) | 1 (5.9%) |
| $65,000 to $74,999 | 0 (0.0%) | 0 (0.0%) |
| $75,000 to $99,999 | 0 (0.0%) | 0 (0.0%) |
| $100,000+ | 0 (0.0%) | 0 (0.0%) |
| Total | 11 (100.0%) | 17 (100.0%) |
Earnings by Sex by Educational Attainment in Theodosia
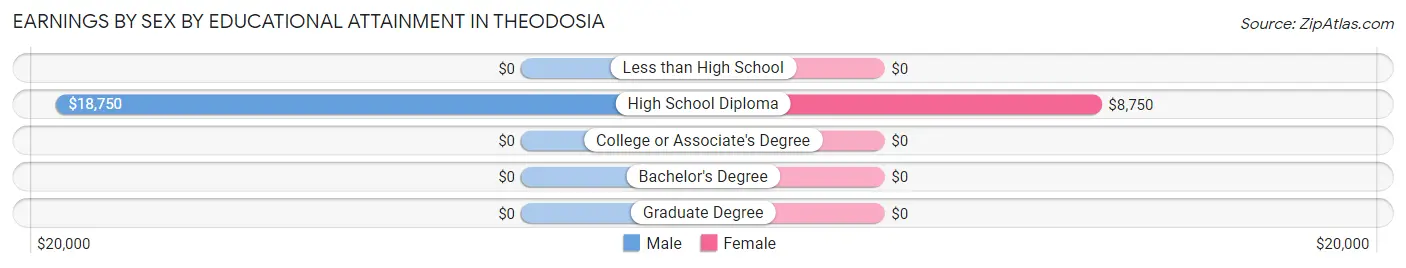
| Educational Attainment | Male Income | Female Income |
| Less than High School | - | - |
| High School Diploma | $18,750 | $8,750 |
| College or Associate's Degree | - | - |
| Bachelor's Degree | - | - |
| Graduate Degree | - | - |
| Total | $20,625 | $0 |
Family Income in Theodosia
Family Income Brackets in Theodosia
According to the Theodosia family income data, there are 16 families falling into the $15,000 to $24,999 income range, which is the most common income bracket and makes up 36.4% of all families.
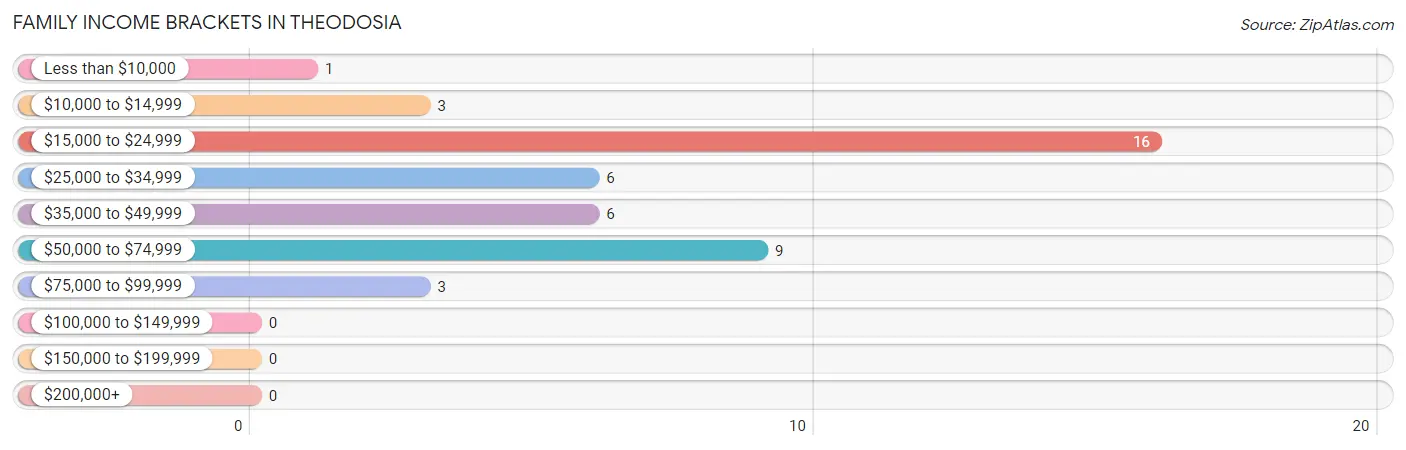
| Income Bracket | # Families | % Families |
| Less than $10,000 | 1 | 2.3% |
| $10,000 to $14,999 | 3 | 6.8% |
| $15,000 to $24,999 | 16 | 36.4% |
| $25,000 to $34,999 | 6 | 13.6% |
| $35,000 to $49,999 | 6 | 13.6% |
| $50,000 to $74,999 | 9 | 20.5% |
| $75,000 to $99,999 | 3 | 6.8% |
| $100,000 to $149,999 | 0 | 0.0% |
| $150,000 to $199,999 | 0 | 0.0% |
| $200,000+ | 0 | 0.0% |
Family Income by Famaliy Size in Theodosia
2-person families (34 | 77.3%) account for the highest median family income in Theodosia with $23,750 per family, while 2-person families (34 | 77.3%) have the highest median income of $11,875 per family member.
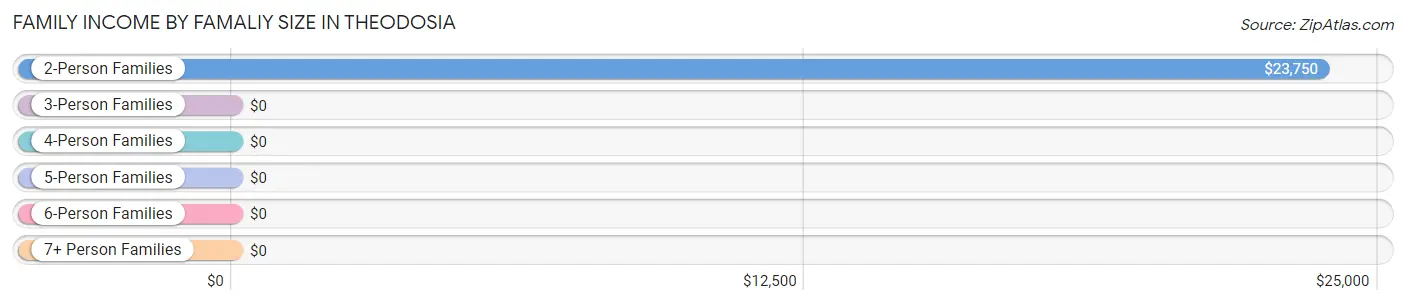
| Income Bracket | # Families | Median Income |
| 2-Person Families | 34 (77.3%) | $23,750 |
| 3-Person Families | 7 (15.9%) | $0 |
| 4-Person Families | 0 (0.0%) | $0 |
| 5-Person Families | 3 (6.8%) | $0 |
| 6-Person Families | 0 (0.0%) | $0 |
| 7+ Person Families | 0 (0.0%) | $0 |
| Total | 44 (100.0%) | $28,750 |
Family Income by Number of Earners in Theodosia
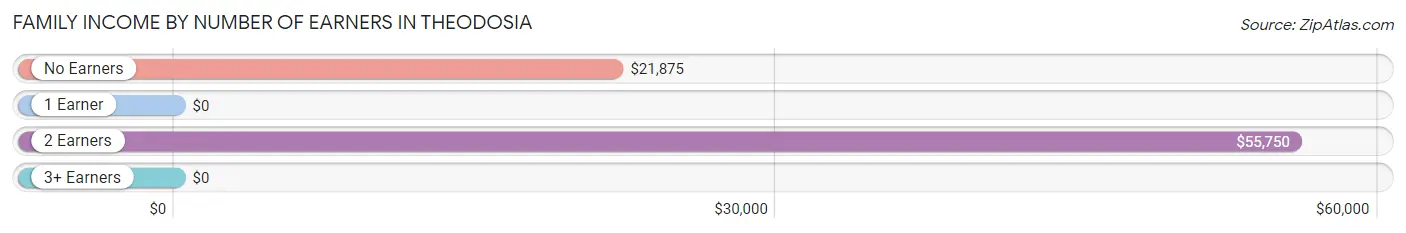
| Number of Earners | # Families | Median Income |
| No Earners | 30 (68.2%) | $21,875 |
| 1 Earner | 3 (6.8%) | $0 |
| 2 Earners | 11 (25.0%) | $55,750 |
| 3+ Earners | 0 (0.0%) | $0 |
| Total | 44 (100.0%) | $28,750 |
Household Income in Theodosia
Household Income Brackets in Theodosia
With 31 households falling in the category, the $15,000 to $24,999 income range is the most frequent in Theodosia, accounting for 36.5% of all households.
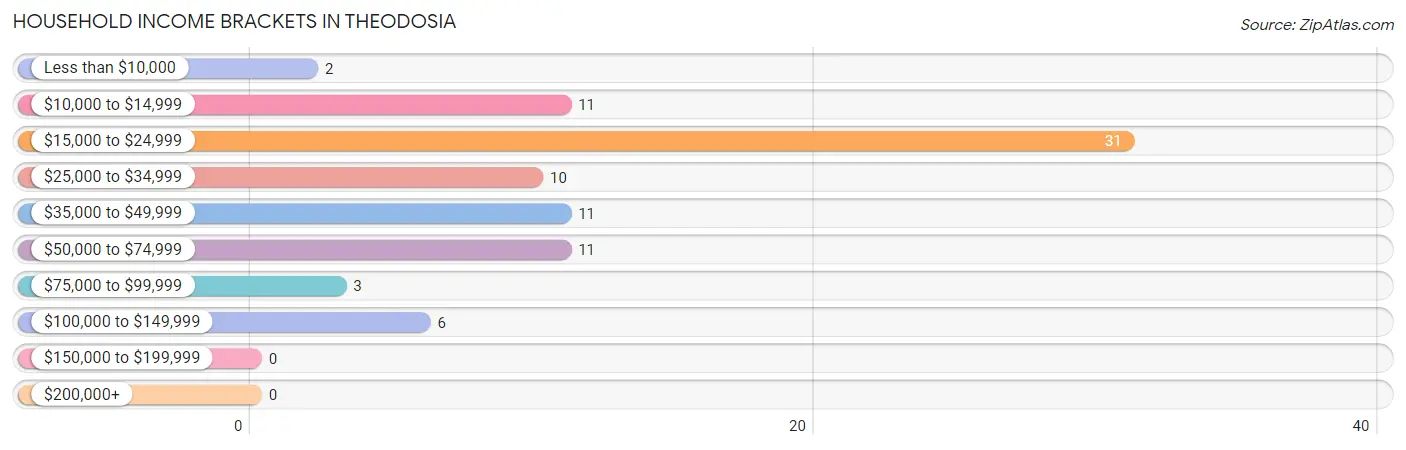
| Income Bracket | # Households | % Households |
| Less than $10,000 | 2 | 2.4% |
| $10,000 to $14,999 | 11 | 12.9% |
| $15,000 to $24,999 | 31 | 36.5% |
| $25,000 to $34,999 | 10 | 11.8% |
| $35,000 to $49,999 | 11 | 12.9% |
| $50,000 to $74,999 | 11 | 12.9% |
| $75,000 to $99,999 | 3 | 3.5% |
| $100,000 to $149,999 | 6 | 7.1% |
| $150,000 to $199,999 | 0 | 0.0% |
| $200,000+ | 0 | 0.0% |
Household Income by Householder Age in Theodosia
The median household income in Theodosia is $22,440, with the highest median household income of $48,214 found in the 65+ years age bracket for the primary householder. A total of 40 households (47.1%) fall into this category.
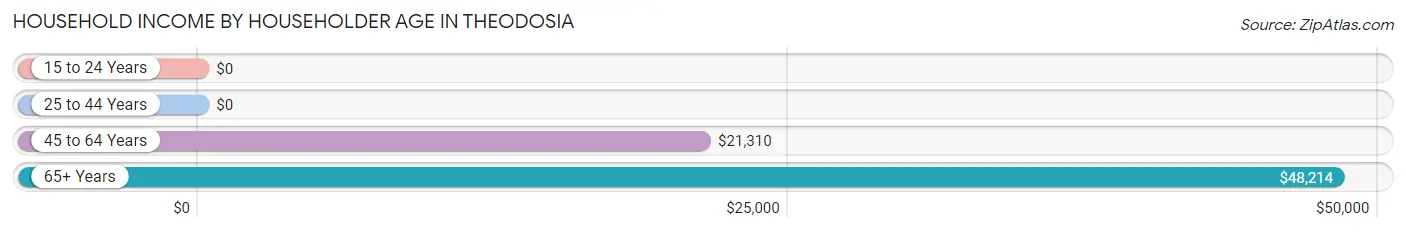
| Income Bracket | # Households | Median Income |
| 15 to 24 Years | 0 (0.0%) | $0 |
| 25 to 44 Years | 5 (5.9%) | $0 |
| 45 to 64 Years | 40 (47.1%) | $21,310 |
| 65+ Years | 40 (47.1%) | $48,214 |
| Total | 85 (100.0%) | $22,440 |
Poverty in Theodosia
Income Below Poverty by Sex and Age in Theodosia
With 20.2% poverty level for males and 35.5% for females among the residents of Theodosia, 6 to 11 year old males and 6 to 11 year old females are the most vulnerable to poverty, with 3 males (100.0%) and 5 females (100.0%) in their respective age groups living below the poverty level.
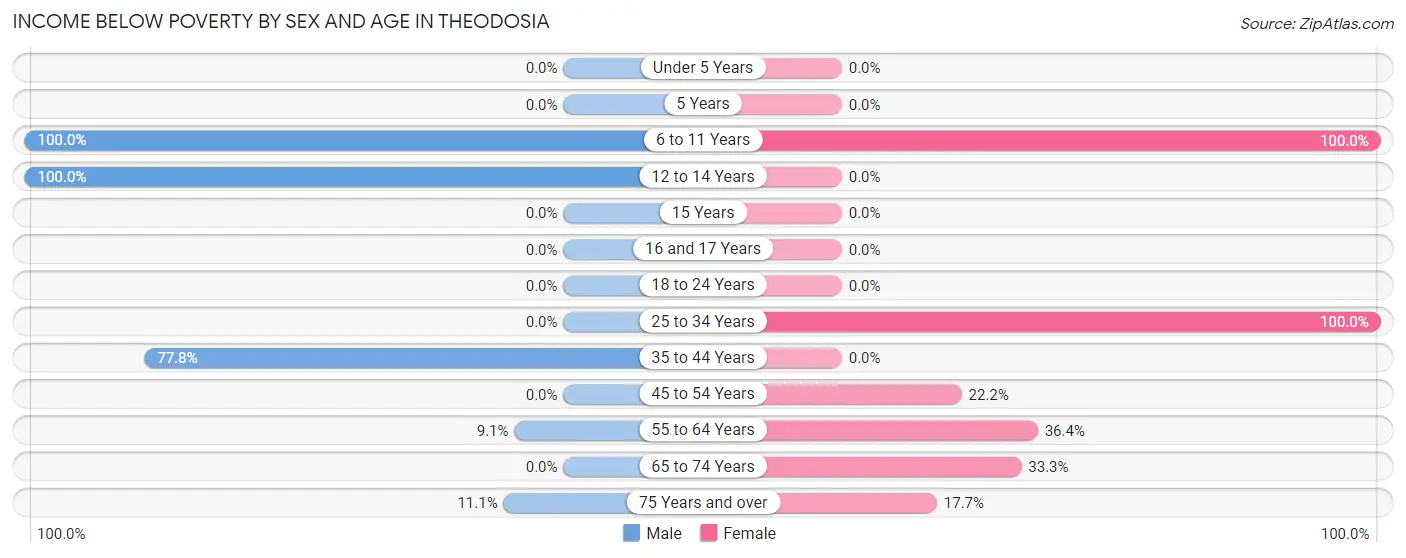
| Age Bracket | Male | Female |
| Under 5 Years | 0 (0.0%) | 0 (0.0%) |
| 5 Years | 0 (0.0%) | 0 (0.0%) |
| 6 to 11 Years | 3 (100.0%) | 5 (100.0%) |
| 12 to 14 Years | 2 (100.0%) | 0 (0.0%) |
| 15 Years | 0 (0.0%) | 0 (0.0%) |
| 16 and 17 Years | 0 (0.0%) | 0 (0.0%) |
| 18 to 24 Years | 0 (0.0%) | 0 (0.0%) |
| 25 to 34 Years | 0 (0.0%) | 3 (100.0%) |
| 35 to 44 Years | 7 (77.8%) | 0 (0.0%) |
| 45 to 54 Years | 0 (0.0%) | 2 (22.2%) |
| 55 to 64 Years | 3 (9.1%) | 4 (36.4%) |
| 65 to 74 Years | 0 (0.0%) | 5 (33.3%) |
| 75 Years and over | 2 (11.1%) | 3 (17.6%) |
| Total | 17 (20.2%) | 22 (35.5%) |
Income Above Poverty by Sex and Age in Theodosia
According to the poverty statistics in Theodosia, males aged 16 and 17 years and females aged 35 to 44 years are the age groups that are most secure financially, with 100.0% of males and 100.0% of females in these age groups living above the poverty line.
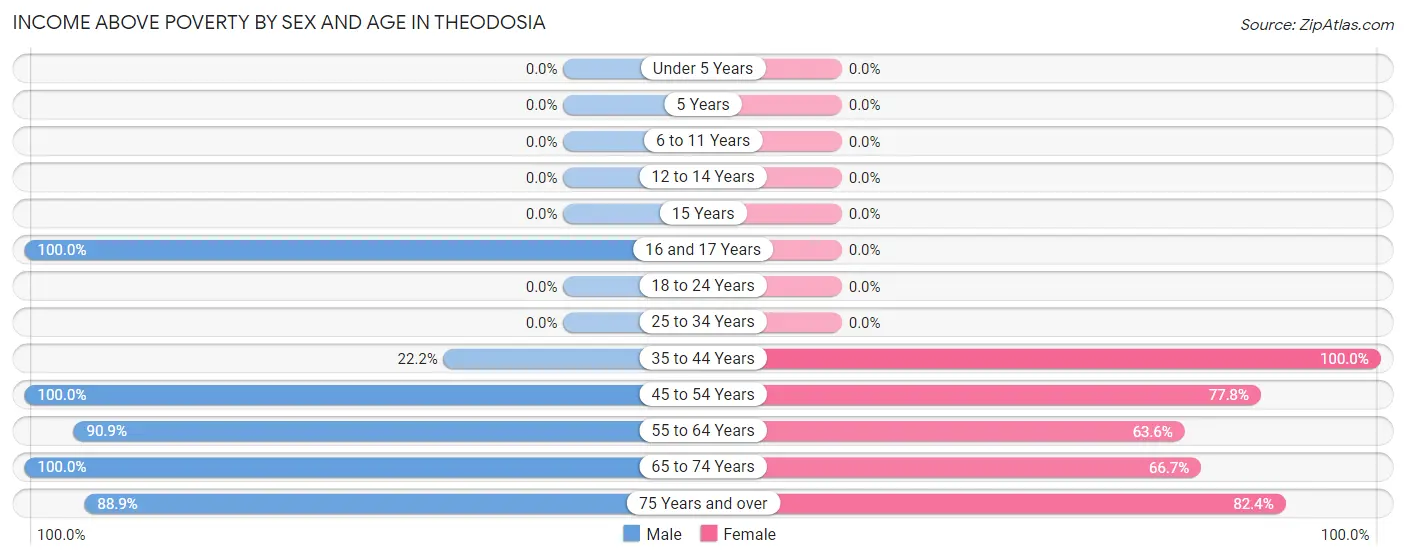
| Age Bracket | Male | Female |
| Under 5 Years | 0 (0.0%) | 0 (0.0%) |
| 5 Years | 0 (0.0%) | 0 (0.0%) |
| 6 to 11 Years | 0 (0.0%) | 0 (0.0%) |
| 12 to 14 Years | 0 (0.0%) | 0 (0.0%) |
| 15 Years | 0 (0.0%) | 0 (0.0%) |
| 16 and 17 Years | 4 (100.0%) | 0 (0.0%) |
| 18 to 24 Years | 0 (0.0%) | 0 (0.0%) |
| 25 to 34 Years | 0 (0.0%) | 0 (0.0%) |
| 35 to 44 Years | 2 (22.2%) | 2 (100.0%) |
| 45 to 54 Years | 2 (100.0%) | 7 (77.8%) |
| 55 to 64 Years | 30 (90.9%) | 7 (63.6%) |
| 65 to 74 Years | 13 (100.0%) | 10 (66.7%) |
| 75 Years and over | 16 (88.9%) | 14 (82.4%) |
| Total | 67 (79.8%) | 40 (64.5%) |
Income Below Poverty Among Married-Couple Families in Theodosia
The poverty statistics for married-couple families in Theodosia show that 7.0% or 3 of the total 43 families live below the poverty line. Families with 3 or 4 children have the highest poverty rate of 100.0%, comprising of 3 families. On the other hand, families with no children have the lowest poverty rate of 0.0%, which includes 0 families.
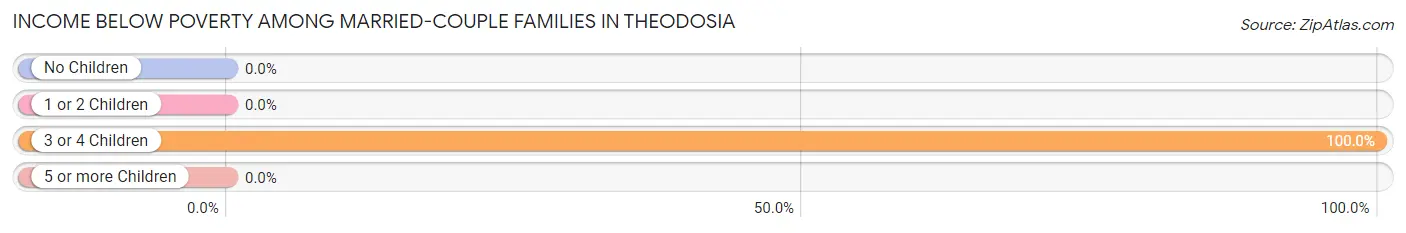
| Children | Above Poverty | Below Poverty |
| No Children | 35 (100.0%) | 0 (0.0%) |
| 1 or 2 Children | 5 (100.0%) | 0 (0.0%) |
| 3 or 4 Children | 0 (0.0%) | 3 (100.0%) |
| 5 or more Children | 0 (0.0%) | 0 (0.0%) |
| Total | 40 (93.0%) | 3 (7.0%) |
Income Below Poverty Among Single-Parent Households in Theodosia
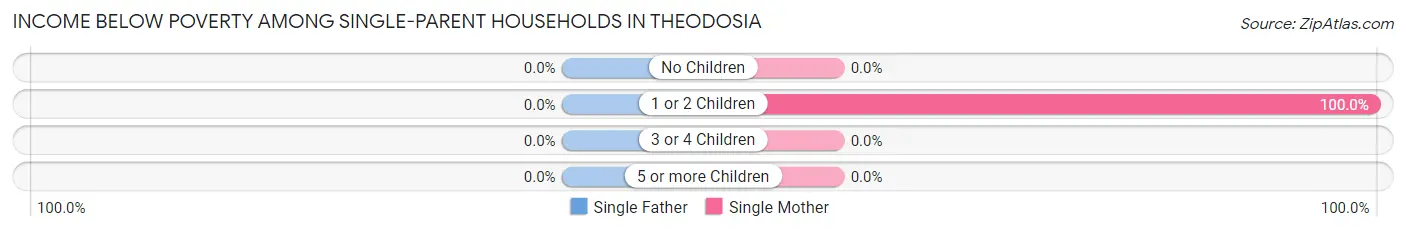
| Children | Single Father | Single Mother |
| No Children | 0 (0.0%) | 0 (0.0%) |
| 1 or 2 Children | 0 (0.0%) | 1 (100.0%) |
| 3 or 4 Children | 0 (0.0%) | 0 (0.0%) |
| 5 or more Children | 0 (0.0%) | 0 (0.0%) |
| Total | 0 (0.0%) | 1 (100.0%) |
Income Below Poverty Among Married-Couple vs Single-Parent Households in Theodosia
The poverty data for Theodosia shows that 3 of the married-couple family households (7.0%) and 1 of the single-parent households (100.0%) are living below the poverty level. Within the married-couple family households, those with 3 or 4 children have the highest poverty rate, with 3 households (100.0%) falling below the poverty line. Among the single-parent households, those with 1 or 2 children have the highest poverty rate, with 1 household (100.0%) living below poverty.
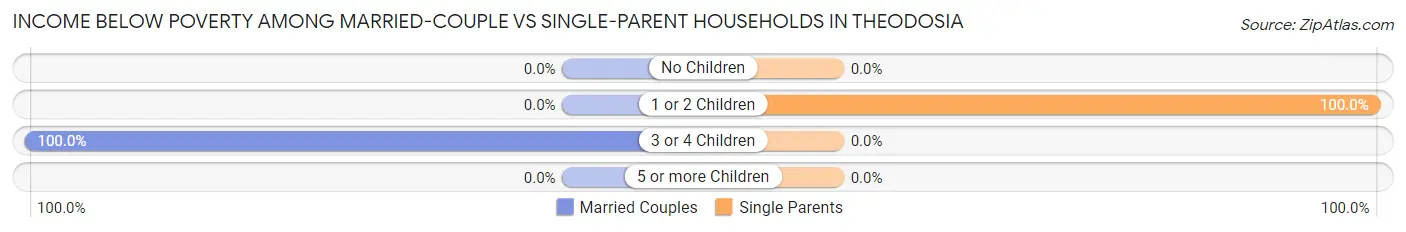
| Children | Married-Couple Families | Single-Parent Households |
| No Children | 0 (0.0%) | 0 (0.0%) |
| 1 or 2 Children | 0 (0.0%) | 1 (100.0%) |
| 3 or 4 Children | 3 (100.0%) | 0 (0.0%) |
| 5 or more Children | 0 (0.0%) | 0 (0.0%) |
| Total | 3 (7.0%) | 1 (100.0%) |
Race in Theodosia
The most populous races in Theodosia are White / Caucasian (122 | 83.6%), and Two or more Races (24 | 16.4%).
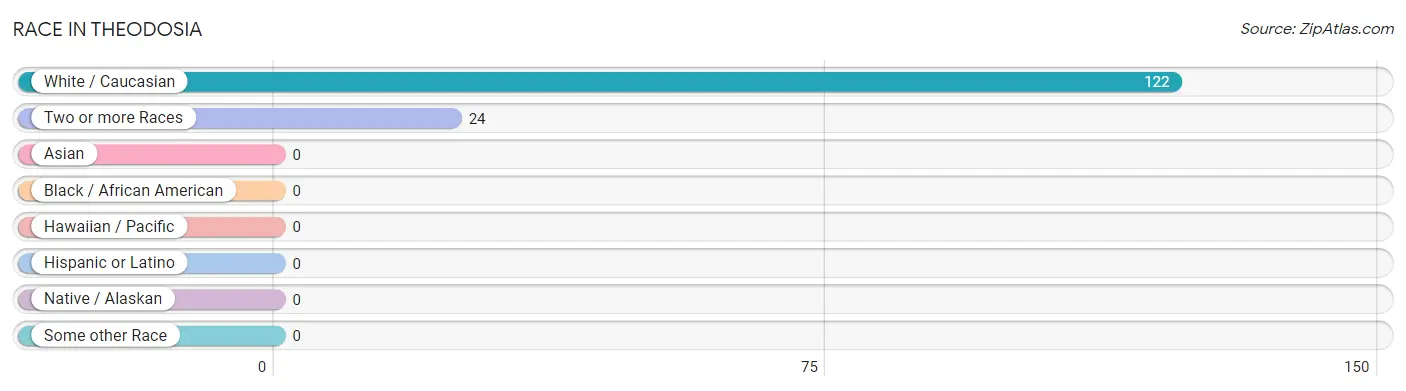
| Race | # Population | % Population |
| Asian | 0 | 0.0% |
| Black / African American | 0 | 0.0% |
| Hawaiian / Pacific | 0 | 0.0% |
| Hispanic or Latino | 0 | 0.0% |
| Native / Alaskan | 0 | 0.0% |
| White / Caucasian | 122 | 83.6% |
| Two or more Races | 24 | 16.4% |
| Some other Race | 0 | 0.0% |
| Total | 146 | 100.0% |
Ancestry in Theodosia
The most populous ancestries reported in Theodosia are Irish (41 | 28.1%), German (24 | 16.4%), Czech (9 | 6.2%), English (7 | 4.8%), and Scandinavian (5 | 3.4%), together accounting for 58.9% of all Theodosia residents.
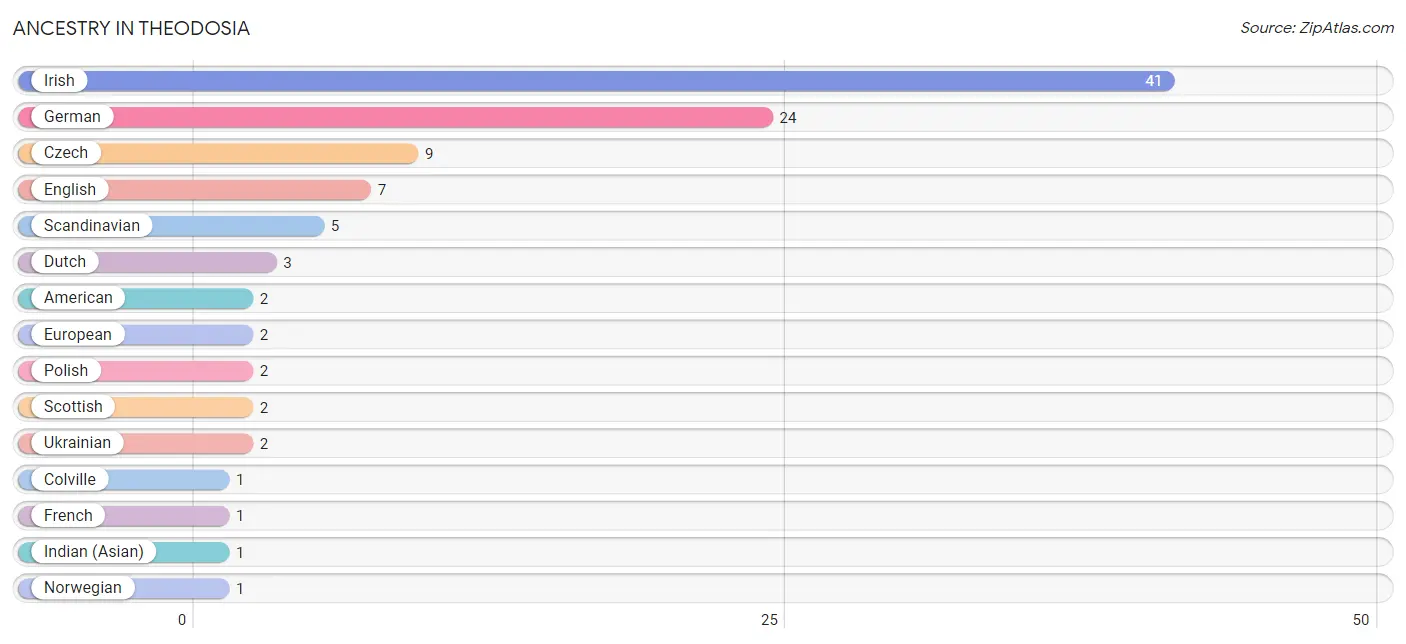
| Ancestry | # Population | % Population |
| American | 2 | 1.4% |
| Colville | 1 | 0.7% |
| Czech | 9 | 6.2% |
| Dutch | 3 | 2.1% |
| English | 7 | 4.8% |
| European | 2 | 1.4% |
| French | 1 | 0.7% |
| German | 24 | 16.4% |
| Indian (Asian) | 1 | 0.7% |
| Irish | 41 | 28.1% |
| Norwegian | 1 | 0.7% |
| Polish | 2 | 1.4% |
| Scandinavian | 5 | 3.4% |
| Scottish | 2 | 1.4% |
| Ukrainian | 2 | 1.4% | View All 15 Rows |
Immigrants in Theodosia
The most numerous immigrant groups reported in Theodosia came from Europe (1 | 0.7%), Netherlands (1 | 0.7%), and Western Europe (1 | 0.7%), together accounting for 2.0% of all Theodosia residents.
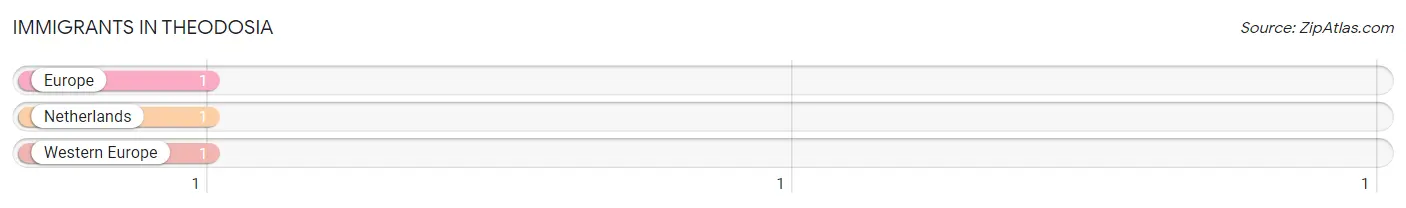
| Immigration Origin | # Population | % Population |
| Europe | 1 | 0.7% |
| Netherlands | 1 | 0.7% |
| Western Europe | 1 | 0.7% | View All 3 Rows |
Sex and Age in Theodosia
Sex and Age in Theodosia
The most populous age groups in Theodosia are 55 to 59 Years (22 | 26.2%) for men and 75 to 79 Years (15 | 24.2%) for women.
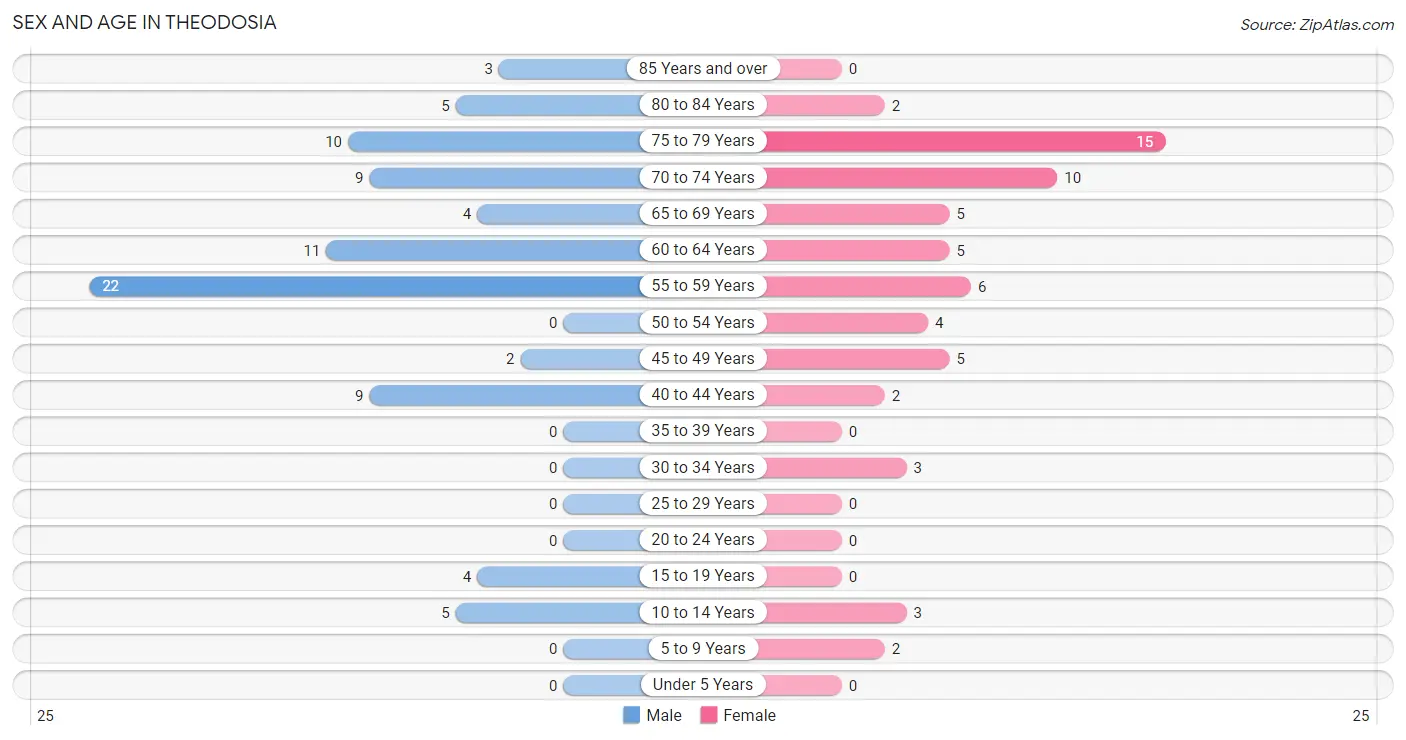
| Age Bracket | Male | Female |
| Under 5 Years | 0 (0.0%) | 0 (0.0%) |
| 5 to 9 Years | 0 (0.0%) | 2 (3.2%) |
| 10 to 14 Years | 5 (5.9%) | 3 (4.8%) |
| 15 to 19 Years | 4 (4.8%) | 0 (0.0%) |
| 20 to 24 Years | 0 (0.0%) | 0 (0.0%) |
| 25 to 29 Years | 0 (0.0%) | 0 (0.0%) |
| 30 to 34 Years | 0 (0.0%) | 3 (4.8%) |
| 35 to 39 Years | 0 (0.0%) | 0 (0.0%) |
| 40 to 44 Years | 9 (10.7%) | 2 (3.2%) |
| 45 to 49 Years | 2 (2.4%) | 5 (8.1%) |
| 50 to 54 Years | 0 (0.0%) | 4 (6.5%) |
| 55 to 59 Years | 22 (26.2%) | 6 (9.7%) |
| 60 to 64 Years | 11 (13.1%) | 5 (8.1%) |
| 65 to 69 Years | 4 (4.8%) | 5 (8.1%) |
| 70 to 74 Years | 9 (10.7%) | 10 (16.1%) |
| 75 to 79 Years | 10 (11.9%) | 15 (24.2%) |
| 80 to 84 Years | 5 (5.9%) | 2 (3.2%) |
| 85 Years and over | 3 (3.6%) | 0 (0.0%) |
| Total | 84 (100.0%) | 62 (100.0%) |
Families and Households in Theodosia
Median Family Size in Theodosia
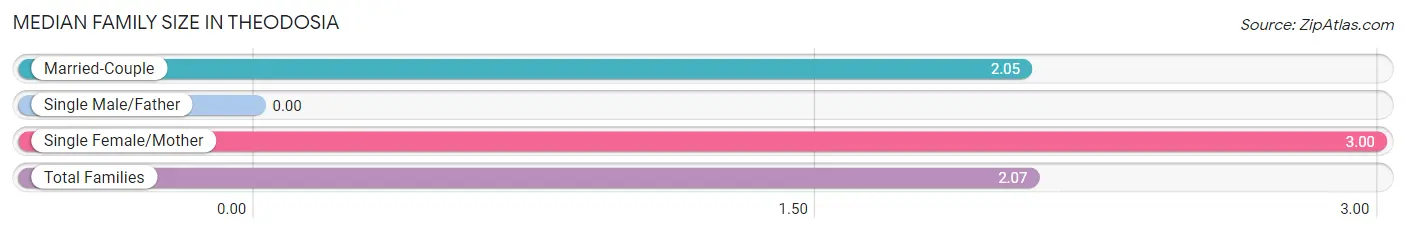
| Family Type | # Families | Family Size |
| Married-Couple | 43 (97.7%) | 2.05 |
| Single Male/Father | 0 (0.0%) | - |
| Single Female/Mother | 1 (2.3%) | 3.00 |
| Total Families | 44 (100.0%) | 2.07 |
Median Household Size in Theodosia
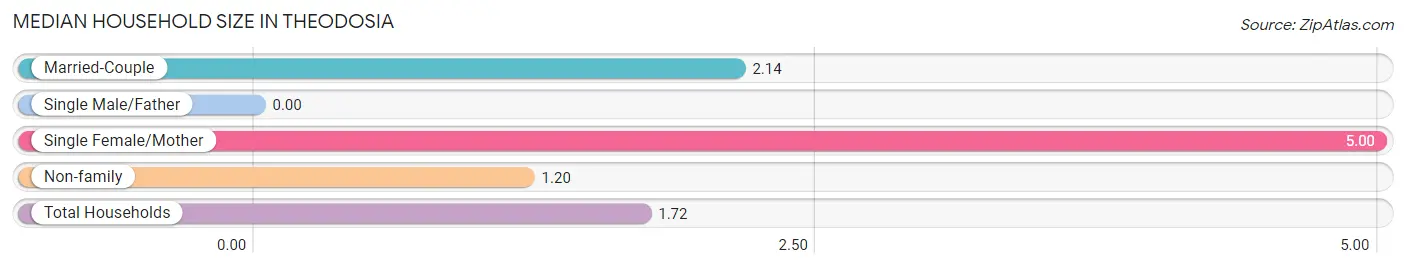
| Household Type | # Households | Household Size |
| Married-Couple | 43 (50.6%) | 2.14 |
| Single Male/Father | 0 (0.0%) | - |
| Single Female/Mother | 1 (1.2%) | 5.00 |
| Non-family | 41 (48.2%) | 1.20 |
| Total Households | 85 (100.0%) | 1.72 |
Household Size by Marriage Status in Theodosia
Out of a total of 85 households in Theodosia, 44 (51.8%) are family households, while 41 (48.2%) are nonfamily households. The most numerous type of family households are 2-person households, comprising 33, and the most common type of nonfamily households are 1-person households, comprising 37.
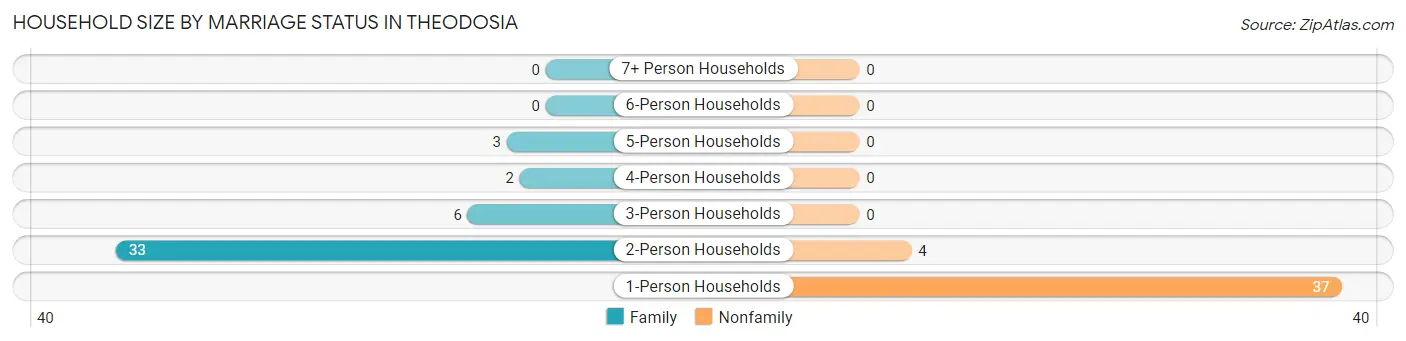
| Household Size | Family Households | Nonfamily Households |
| 1-Person Households | - | 37 (43.5%) |
| 2-Person Households | 33 (38.8%) | 4 (4.7%) |
| 3-Person Households | 6 (7.1%) | 0 (0.0%) |
| 4-Person Households | 2 (2.4%) | 0 (0.0%) |
| 5-Person Households | 3 (3.5%) | 0 (0.0%) |
| 6-Person Households | 0 (0.0%) | 0 (0.0%) |
| 7+ Person Households | 0 (0.0%) | 0 (0.0%) |
| Total | 44 (51.8%) | 41 (48.2%) |
Female Fertility in Theodosia
Fertility by Age in Theodosia
| Age Bracket | Women with Births | Births / 1,000 Women |
| 15 to 19 years | 0 (0.0%) | 0.0 |
| 20 to 34 years | 0 (0.0%) | 0.0 |
| 35 to 50 years | 0 (0.0%) | 0.0 |
| Total | 0 (0.0%) | 0.0 |
Fertility by Age by Marriage Status in Theodosia
| Age Bracket | Married | Unmarried |
| 15 to 19 years | 0 (0.0%) | 0 (0.0%) |
| 20 to 34 years | 0 (0.0%) | 0 (0.0%) |
| 35 to 50 years | 0 (0.0%) | 0 (0.0%) |
| Total | 0 (0.0%) | 0 (0.0%) |
Fertility by Education in Theodosia
| Educational Attainment | Women with Births | Births / 1,000 Women |
| Less than High School | 0 (0.0%) | 0.0 |
| High School Diploma | 0 (0.0%) | 0.0 |
| College or Associate's Degree | 0 (0.0%) | 0.0 |
| Bachelor's Degree | 0 (0.0%) | 0.0 |
| Graduate Degree | 0 (0.0%) | 0.0 |
| Total | 0 (0.0%) | 0.0 |
Fertility by Education by Marriage Status in Theodosia
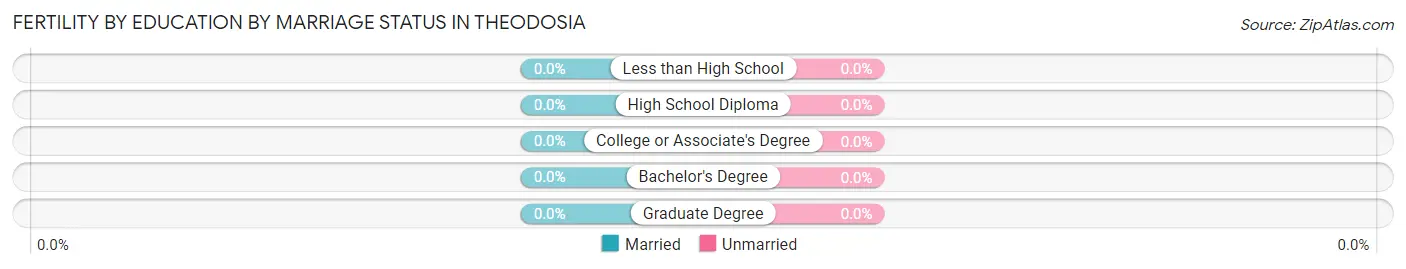
| Educational Attainment | Married | Unmarried |
| Less than High School | 0 (0.0%) | 0 (0.0%) |
| High School Diploma | 0 (0.0%) | 0 (0.0%) |
| College or Associate's Degree | 0 (0.0%) | 0 (0.0%) |
| Bachelor's Degree | 0 (0.0%) | 0 (0.0%) |
| Graduate Degree | 0 (0.0%) | 0 (0.0%) |
| Total | 0 (0.0%) | 0 (0.0%) |
Employment Characteristics in Theodosia
Employment by Class of Employer in Theodosia
Among the 21 employed individuals in Theodosia, private company employees (15 | 71.4%), self-employed (not incorporated) (2 | 9.5%), and not-for-profit organizations (2 | 9.5%) make up the most common classes of employment.
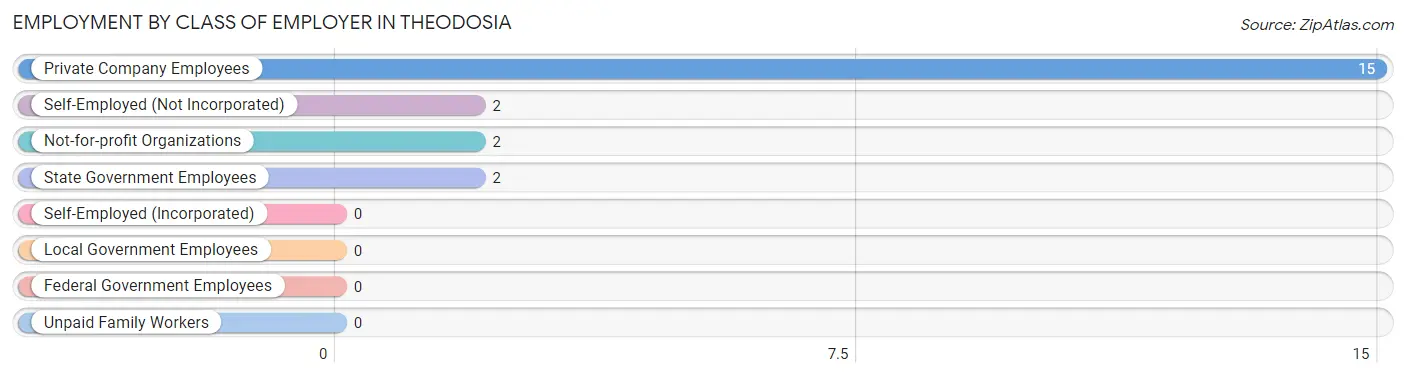
| Employer Class | # Employees | % Employees |
| Private Company Employees | 15 | 71.4% |
| Self-Employed (Incorporated) | 0 | 0.0% |
| Self-Employed (Not Incorporated) | 2 | 9.5% |
| Not-for-profit Organizations | 2 | 9.5% |
| Local Government Employees | 0 | 0.0% |
| State Government Employees | 2 | 9.5% |
| Federal Government Employees | 0 | 0.0% |
| Unpaid Family Workers | 0 | 0.0% |
| Total | 21 | 100.0% |
Employment Status by Age in Theodosia
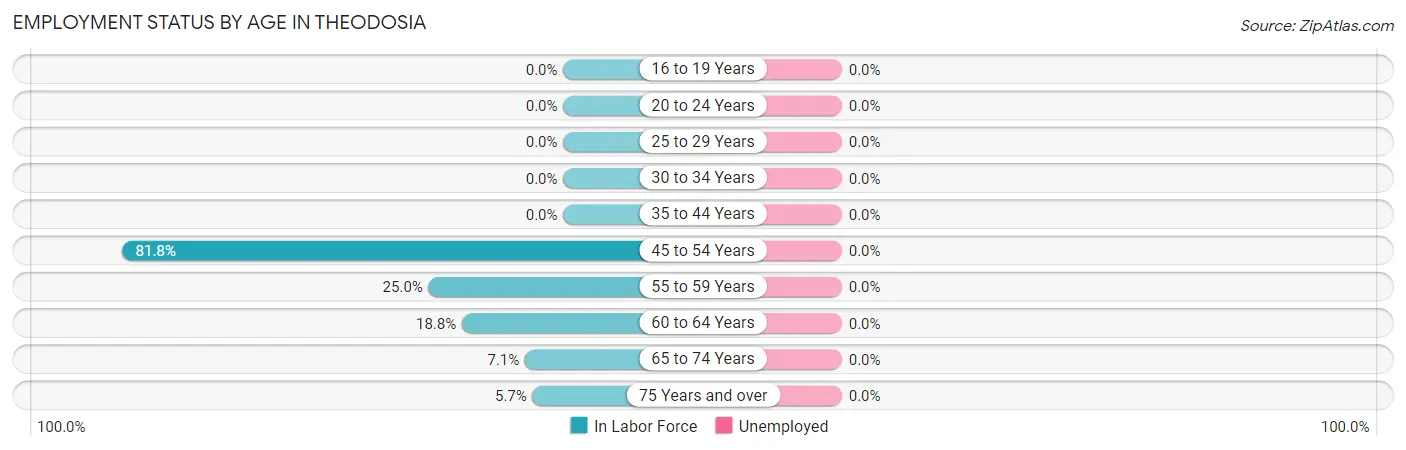
| Age Bracket | In Labor Force | Unemployed |
| 16 to 19 Years | 0 (0.0%) | 0 (0.0%) |
| 20 to 24 Years | 0 (0.0%) | 0 (0.0%) |
| 25 to 29 Years | 0 (0.0%) | 0 (0.0%) |
| 30 to 34 Years | 0 (0.0%) | 0 (0.0%) |
| 35 to 44 Years | 0 (0.0%) | 0 (0.0%) |
| 45 to 54 Years | 9 (81.8%) | 0 (0.0%) |
| 55 to 59 Years | 7 (25.0%) | 0 (0.0%) |
| 60 to 64 Years | 3 (18.8%) | 0 (0.0%) |
| 65 to 74 Years | 2 (7.1%) | 0 (0.0%) |
| 75 Years and over | 2 (5.7%) | 0 (0.0%) |
| Total | 23 (16.9%) | 0 (0.0%) |
Employment Status by Educational Attainment in Theodosia
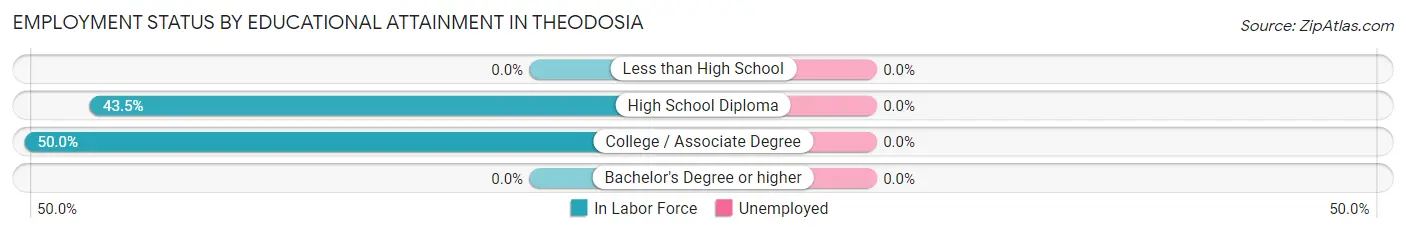
| Educational Attainment | In Labor Force | Unemployed |
| Less than High School | 0 (0.0%) | 0 (0.0%) |
| High School Diploma | 10 (43.5%) | 0 (0.0%) |
| College / Associate Degree | 9 (50.0%) | 0 (0.0%) |
| Bachelor's Degree or higher | 0 (0.0%) | 0 (0.0%) |
| Total | 19 (27.5%) | 0 (0.0%) |
Employment Occupations by Sex in Theodosia
Management, Business, Science and Arts Occupations
The most common Management, Business, Science and Arts occupations in Theodosia are Management (5 | 21.7%), and Business & Financial (5 | 21.7%).
Management, Business, Science and Arts Occupations by Sex
| Occupation | Male | Female |
| Management | 3 (60.0%) | 2 (40.0%) |
| Business & Financial | 0 (0.0%) | 5 (100.0%) |
| Computers, Engineering & Science | 0 (0.0%) | 0 (0.0%) |
| Computers & Mathematics | 0 (0.0%) | 0 (0.0%) |
| Architecture & Engineering | 0 (0.0%) | 0 (0.0%) |
| Life, Physical & Social Science | 0 (0.0%) | 0 (0.0%) |
| Community & Social Service | 0 (0.0%) | 0 (0.0%) |
| Education, Arts & Media | 0 (0.0%) | 0 (0.0%) |
| Legal Services & Support | 0 (0.0%) | 0 (0.0%) |
| Education Instruction & Library | 0 (0.0%) | 0 (0.0%) |
| Arts, Media & Entertainment | 0 (0.0%) | 0 (0.0%) |
| Health Diagnosing & Treating | 0 (0.0%) | 0 (0.0%) |
| Health Technologists | 0 (0.0%) | 0 (0.0%) |
| Total (Category) | 3 (30.0%) | 7 (70.0%) |
| Total (Overall) | 9 (39.1%) | 14 (60.9%) |
Services Occupations
The most common Services occupations in Theodosia are Food Preparation & Serving (3 | 13.0%), Cleaning & Maintenance (3 | 13.0%), Security & Protection (2 | 8.7%), and Law Enforcement (2 | 8.7%).
Services Occupations by Sex
Within the Services occupations in Theodosia, the most male-oriented occupations are Security & Protection (100.0%), Law Enforcement (100.0%), and Food Preparation & Serving (66.7%), while the most female-oriented occupations are Food Preparation & Serving (33.3%), and Cleaning & Maintenance (33.3%).
| Occupation | Male | Female |
| Healthcare Support | 0 (0.0%) | 0 (0.0%) |
| Security & Protection | 2 (100.0%) | 0 (0.0%) |
| Firefighting & Prevention | 0 (0.0%) | 0 (0.0%) |
| Law Enforcement | 2 (100.0%) | 0 (0.0%) |
| Food Preparation & Serving | 2 (66.7%) | 1 (33.3%) |
| Cleaning & Maintenance | 2 (66.7%) | 1 (33.3%) |
| Personal Care & Service | 0 (0.0%) | 0 (0.0%) |
| Total (Category) | 6 (75.0%) | 2 (25.0%) |
| Total (Overall) | 9 (39.1%) | 14 (60.9%) |
Sales and Office Occupations
The most common Sales and Office occupations in Theodosia are , and Office & Administration (5 | 21.7%).
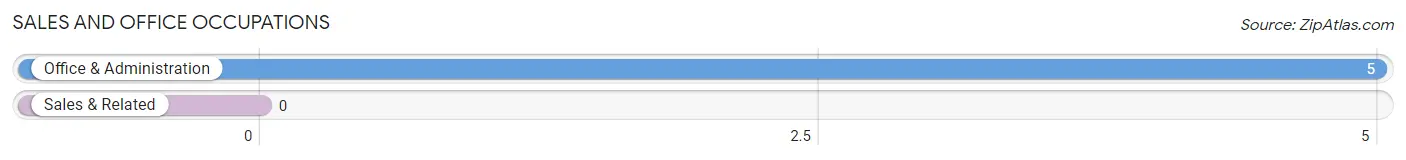
Sales and Office Occupations by Sex

| Occupation | Male | Female |
| Sales & Related | 0 (0.0%) | 0 (0.0%) |
| Office & Administration | 0 (0.0%) | 5 (100.0%) |
| Total (Category) | 0 (0.0%) | 5 (100.0%) |
| Total (Overall) | 9 (39.1%) | 14 (60.9%) |
Natural Resources, Construction and Maintenance Occupations
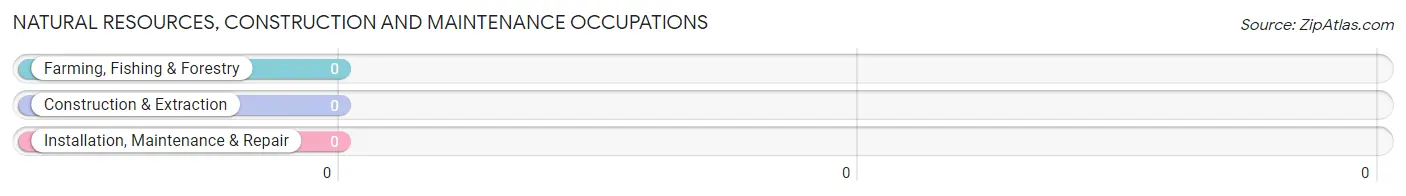
Natural Resources, Construction and Maintenance Occupations by Sex
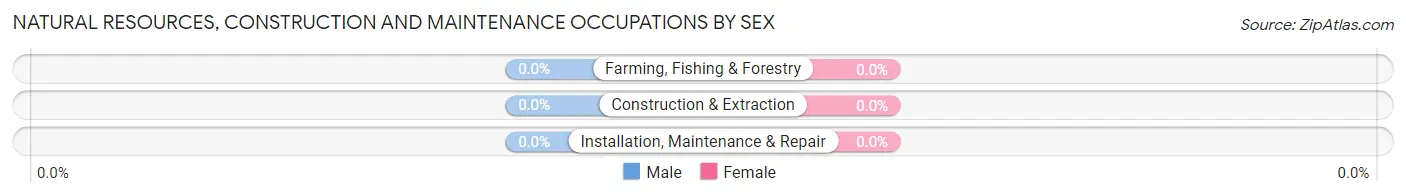
| Occupation | Male | Female |
| Farming, Fishing & Forestry | 0 (0.0%) | 0 (0.0%) |
| Construction & Extraction | 0 (0.0%) | 0 (0.0%) |
| Installation, Maintenance & Repair | 0 (0.0%) | 0 (0.0%) |
| Total (Category) | 0 (0.0%) | 0 (0.0%) |
| Total (Overall) | 9 (39.1%) | 14 (60.9%) |
Production, Transportation and Moving Occupations
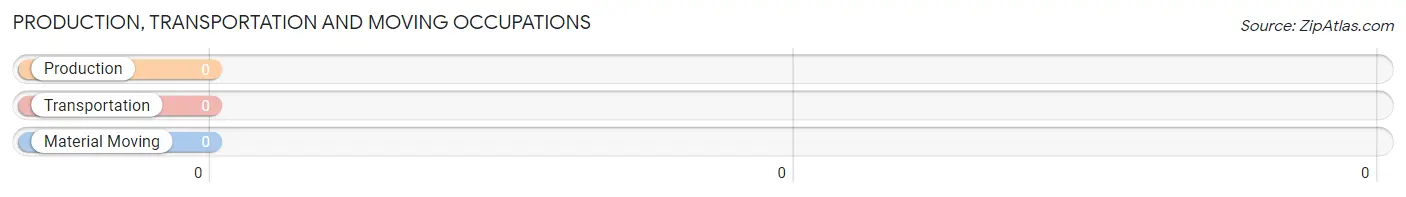
Production, Transportation and Moving Occupations by Sex
| Occupation | Male | Female |
| Production | 0 (0.0%) | 0 (0.0%) |
| Transportation | 0 (0.0%) | 0 (0.0%) |
| Material Moving | 0 (0.0%) | 0 (0.0%) |
| Total (Category) | 0 (0.0%) | 0 (0.0%) |
| Total (Overall) | 9 (39.1%) | 14 (60.9%) |
Employment Industries by Sex in Theodosia
Employment Industries in Theodosia
The major employment industries in Theodosia include Finance & Insurance (6 | 26.1%), Administrative & Support (5 | 21.7%), Accommodation & Food Services (4 | 17.4%), Construction (2 | 8.7%), and Public Administration (2 | 8.7%).
Employment Industries by Sex in Theodosia
The Theodosia industries that see more men than women are Construction (100.0%), Arts, Entertainment & Recreation (100.0%), and Public Administration (100.0%), whereas the industries that tend to have a higher number of women are Finance & Insurance (100.0%), Administrative & Support (60.0%), and Accommodation & Food Services (50.0%).
| Industry | Male | Female |
| Agriculture, Fishing & Hunting | 0 (0.0%) | 0 (0.0%) |
| Mining, Quarrying, & Extraction | 0 (0.0%) | 0 (0.0%) |
| Construction | 2 (100.0%) | 0 (0.0%) |
| Manufacturing | 0 (0.0%) | 0 (0.0%) |
| Wholesale Trade | 0 (0.0%) | 0 (0.0%) |
| Retail Trade | 0 (0.0%) | 0 (0.0%) |
| Transportation & Warehousing | 0 (0.0%) | 0 (0.0%) |
| Utilities | 0 (0.0%) | 0 (0.0%) |
| Information | 0 (0.0%) | 0 (0.0%) |
| Finance & Insurance | 0 (0.0%) | 6 (100.0%) |
| Real Estate, Rental & Leasing | 0 (0.0%) | 0 (0.0%) |
| Professional & Scientific | 0 (0.0%) | 0 (0.0%) |
| Enterprise Management | 0 (0.0%) | 0 (0.0%) |
| Administrative & Support | 2 (40.0%) | 3 (60.0%) |
| Educational Services | 0 (0.0%) | 0 (0.0%) |
| Health Care & Social Assistance | 0 (0.0%) | 0 (0.0%) |
| Arts, Entertainment & Recreation | 1 (100.0%) | 0 (0.0%) |
| Accommodation & Food Services | 2 (50.0%) | 2 (50.0%) |
| Public Administration | 2 (100.0%) | 0 (0.0%) |
| Total | 9 (39.1%) | 14 (60.9%) |
Education in Theodosia
School Enrollment in Theodosia
The most common levels of schooling among the 20 students in Theodosia are college / undergraduate (6 | 30.0%), elementary school (5 | 25.0%), and middle school (5 | 25.0%).
| School Level | # Students | % Students |
| Nursery / Preschool | 0 | 0.0% |
| Kindergarten | 0 | 0.0% |
| Elementary School | 5 | 25.0% |
| Middle School | 5 | 25.0% |
| High School | 4 | 20.0% |
| College / Undergraduate | 6 | 30.0% |
| Graduate / Professional | 0 | 0.0% |
| Total | 20 | 100.0% |
School Enrollment by Age by Funding Source in Theodosia
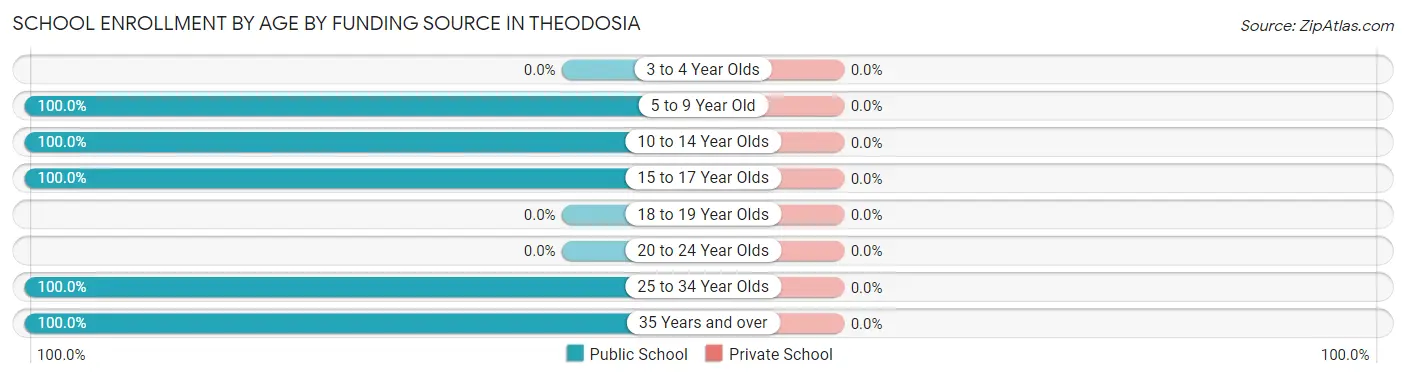
| Age Bracket | Public School | Private School |
| 3 to 4 Year Olds | 0 (0.0%) | 0 (0.0%) |
| 5 to 9 Year Old | 2 (100.0%) | 0 (0.0%) |
| 10 to 14 Year Olds | 8 (100.0%) | 0 (0.0%) |
| 15 to 17 Year Olds | 4 (100.0%) | 0 (0.0%) |
| 18 to 19 Year Olds | 0 (0.0%) | 0 (0.0%) |
| 20 to 24 Year Olds | 0 (0.0%) | 0 (0.0%) |
| 25 to 34 Year Olds | 3 (100.0%) | 0 (0.0%) |
| 35 Years and over | 3 (100.0%) | 0 (0.0%) |
| Total | 20 (100.0%) | 0 (0.0%) |
Educational Attainment by Field of Study in Theodosia
, and education (1 | 100.0%) are the most common fields of study among 1 individuals in Theodosia who have obtained a bachelor's degree or higher.
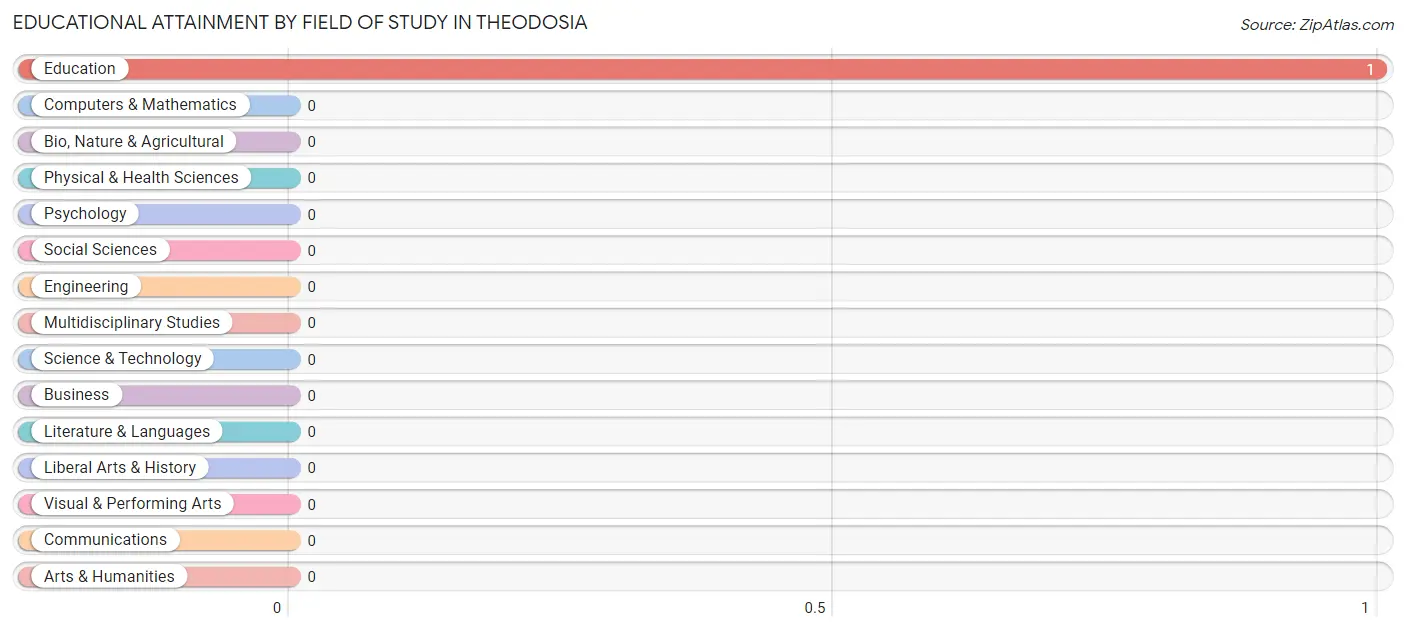
| Field of Study | # Graduates | % Graduates |
| Computers & Mathematics | 0 | 0.0% |
| Bio, Nature & Agricultural | 0 | 0.0% |
| Physical & Health Sciences | 0 | 0.0% |
| Psychology | 0 | 0.0% |
| Social Sciences | 0 | 0.0% |
| Engineering | 0 | 0.0% |
| Multidisciplinary Studies | 0 | 0.0% |
| Science & Technology | 0 | 0.0% |
| Business | 0 | 0.0% |
| Education | 1 | 100.0% |
| Literature & Languages | 0 | 0.0% |
| Liberal Arts & History | 0 | 0.0% |
| Visual & Performing Arts | 0 | 0.0% |
| Communications | 0 | 0.0% |
| Arts & Humanities | 0 | 0.0% |
| Total | 1 | 100.0% |
Transportation & Commute in Theodosia
Vehicle Availability by Sex in Theodosia
The most prevalent vehicle ownership categories in Theodosia are males with 2 vehicles (7, accounting for 77.8%) and females with 2 vehicles (8, making up 58.3%).
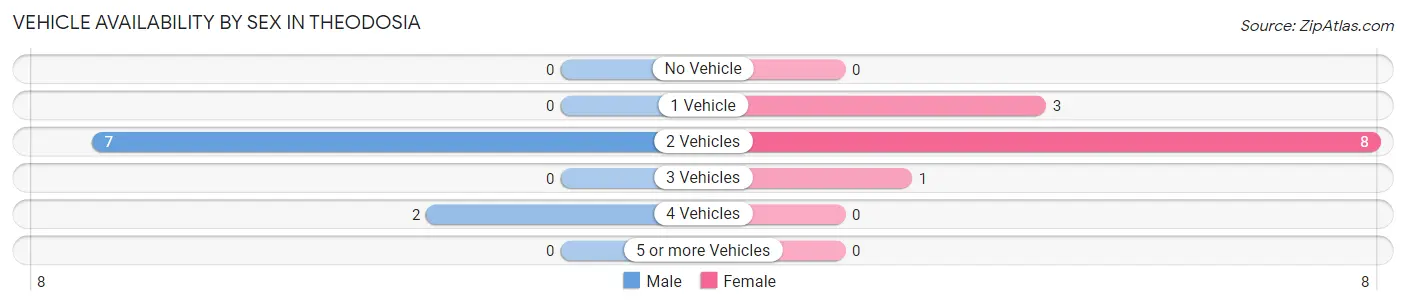
| Vehicles Available | Male | Female |
| No Vehicle | 0 (0.0%) | 0 (0.0%) |
| 1 Vehicle | 0 (0.0%) | 3 (25.0%) |
| 2 Vehicles | 7 (77.8%) | 8 (66.7%) |
| 3 Vehicles | 0 (0.0%) | 1 (8.3%) |
| 4 Vehicles | 2 (22.2%) | 0 (0.0%) |
| 5 or more Vehicles | 0 (0.0%) | 0 (0.0%) |
| Total | 9 (100.0%) | 12 (100.0%) |
Commute Time in Theodosia
The most frequently occuring commute durations in Theodosia are less than 5 minutes (7 commuters, 43.8%), 5 to 9 minutes (4 commuters, 25.0%), and 60 to 89 minutes (2 commuters, 12.5%).
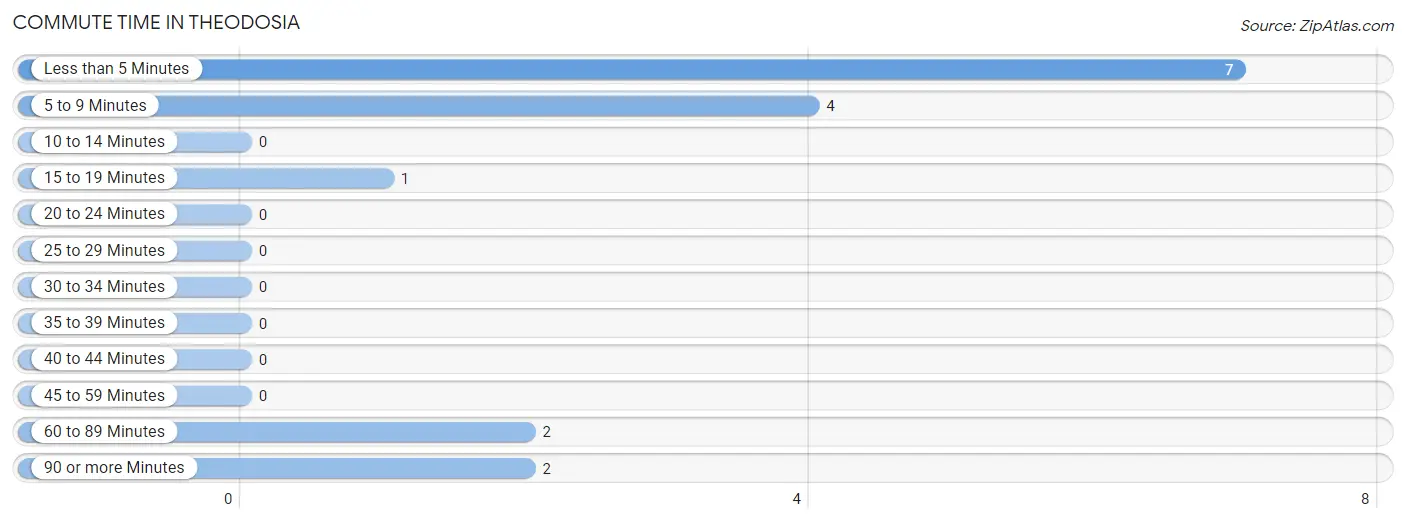
| Commute Time | # Commuters | % Commuters |
| Less than 5 Minutes | 7 | 43.8% |
| 5 to 9 Minutes | 4 | 25.0% |
| 10 to 14 Minutes | 0 | 0.0% |
| 15 to 19 Minutes | 1 | 6.2% |
| 20 to 24 Minutes | 0 | 0.0% |
| 25 to 29 Minutes | 0 | 0.0% |
| 30 to 34 Minutes | 0 | 0.0% |
| 35 to 39 Minutes | 0 | 0.0% |
| 40 to 44 Minutes | 0 | 0.0% |
| 45 to 59 Minutes | 0 | 0.0% |
| 60 to 89 Minutes | 2 | 12.5% |
| 90 or more Minutes | 2 | 12.5% |
Commute Time by Sex in Theodosia
The most common commute times in Theodosia are less than 5 minutes (3 commuters, 33.3%) for males and less than 5 minutes (4 commuters, 57.1%) for females.
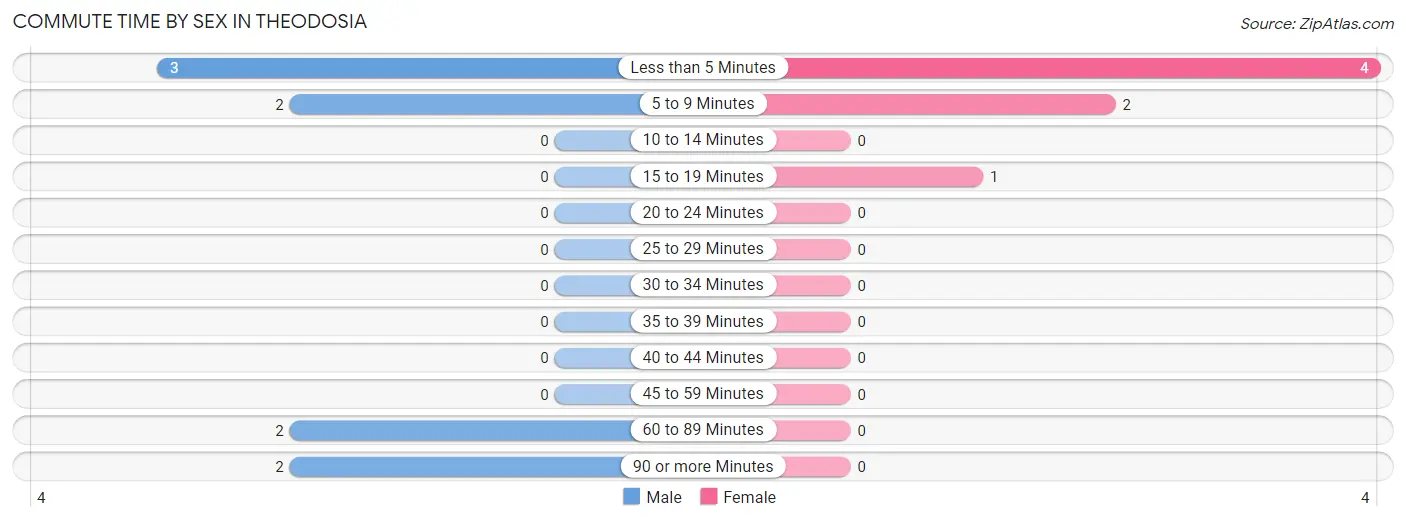
| Commute Time | Male | Female |
| Less than 5 Minutes | 3 (33.3%) | 4 (57.1%) |
| 5 to 9 Minutes | 2 (22.2%) | 2 (28.6%) |
| 10 to 14 Minutes | 0 (0.0%) | 0 (0.0%) |
| 15 to 19 Minutes | 0 (0.0%) | 1 (14.3%) |
| 20 to 24 Minutes | 0 (0.0%) | 0 (0.0%) |
| 25 to 29 Minutes | 0 (0.0%) | 0 (0.0%) |
| 30 to 34 Minutes | 0 (0.0%) | 0 (0.0%) |
| 35 to 39 Minutes | 0 (0.0%) | 0 (0.0%) |
| 40 to 44 Minutes | 0 (0.0%) | 0 (0.0%) |
| 45 to 59 Minutes | 0 (0.0%) | 0 (0.0%) |
| 60 to 89 Minutes | 2 (22.2%) | 0 (0.0%) |
| 90 or more Minutes | 2 (22.2%) | 0 (0.0%) |
Time of Departure to Work by Sex in Theodosia
The most frequent times of departure to work in Theodosia are 6:00 AM to 6:29 AM (3, 33.3%) for males and 8:30 AM to 8:59 AM (2, 28.6%) for females.
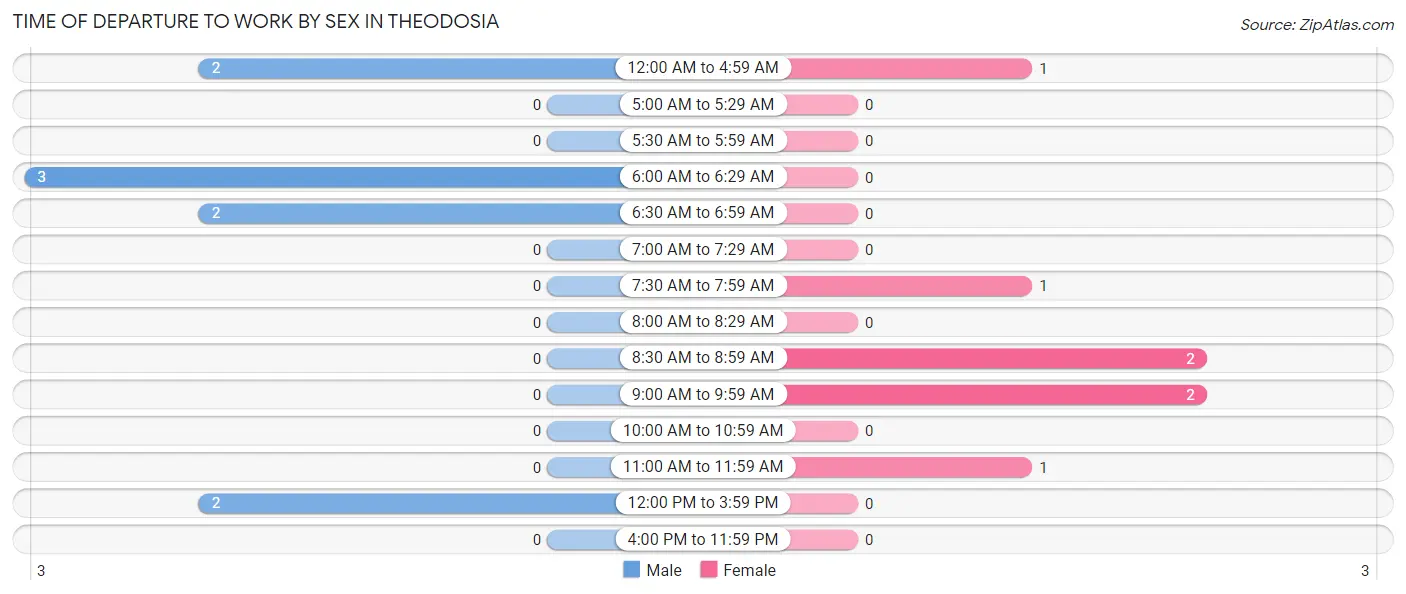
| Time of Departure | Male | Female |
| 12:00 AM to 4:59 AM | 2 (22.2%) | 1 (14.3%) |
| 5:00 AM to 5:29 AM | 0 (0.0%) | 0 (0.0%) |
| 5:30 AM to 5:59 AM | 0 (0.0%) | 0 (0.0%) |
| 6:00 AM to 6:29 AM | 3 (33.3%) | 0 (0.0%) |
| 6:30 AM to 6:59 AM | 2 (22.2%) | 0 (0.0%) |
| 7:00 AM to 7:29 AM | 0 (0.0%) | 0 (0.0%) |
| 7:30 AM to 7:59 AM | 0 (0.0%) | 1 (14.3%) |
| 8:00 AM to 8:29 AM | 0 (0.0%) | 0 (0.0%) |
| 8:30 AM to 8:59 AM | 0 (0.0%) | 2 (28.6%) |
| 9:00 AM to 9:59 AM | 0 (0.0%) | 2 (28.6%) |
| 10:00 AM to 10:59 AM | 0 (0.0%) | 0 (0.0%) |
| 11:00 AM to 11:59 AM | 0 (0.0%) | 1 (14.3%) |
| 12:00 PM to 3:59 PM | 2 (22.2%) | 0 (0.0%) |
| 4:00 PM to 11:59 PM | 0 (0.0%) | 0 (0.0%) |
| Total | 9 (100.0%) | 7 (100.0%) |
Housing Occupancy in Theodosia
Occupancy by Ownership in Theodosia
Of the total 85 dwellings in Theodosia, owner-occupied units account for 80 (94.1%), while renter-occupied units make up 5 (5.9%).
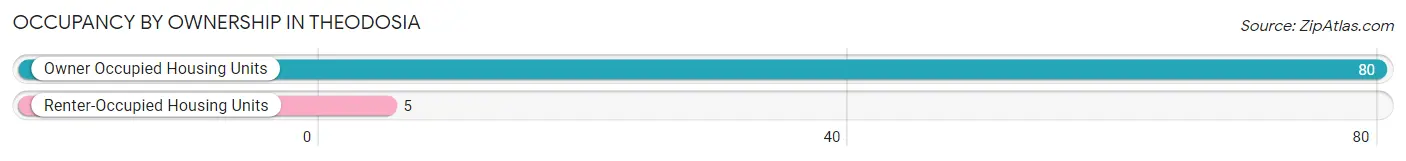
| Occupancy | # Housing Units | % Housing Units |
| Owner Occupied Housing Units | 80 | 94.1% |
| Renter-Occupied Housing Units | 5 | 5.9% |
| Total Occupied Housing Units | 85 | 100.0% |
Occupancy by Household Size in Theodosia
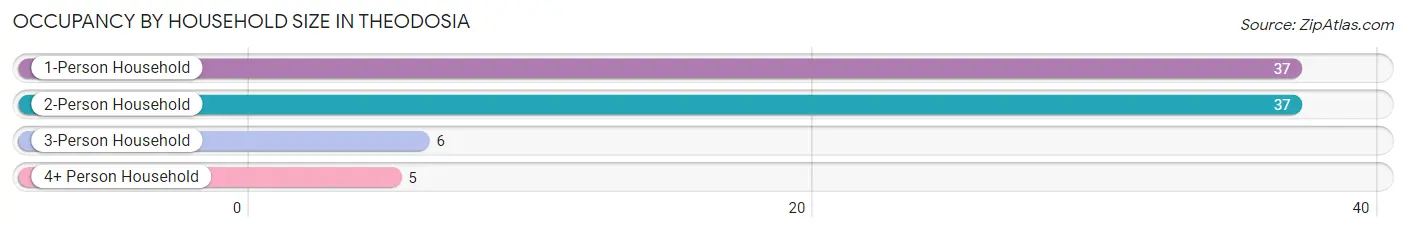
| Household Size | # Housing Units | % Housing Units |
| 1-Person Household | 37 | 43.5% |
| 2-Person Household | 37 | 43.5% |
| 3-Person Household | 6 | 7.1% |
| 4+ Person Household | 5 | 5.9% |
| Total Housing Units | 85 | 100.0% |
Occupancy by Ownership by Household Size in Theodosia
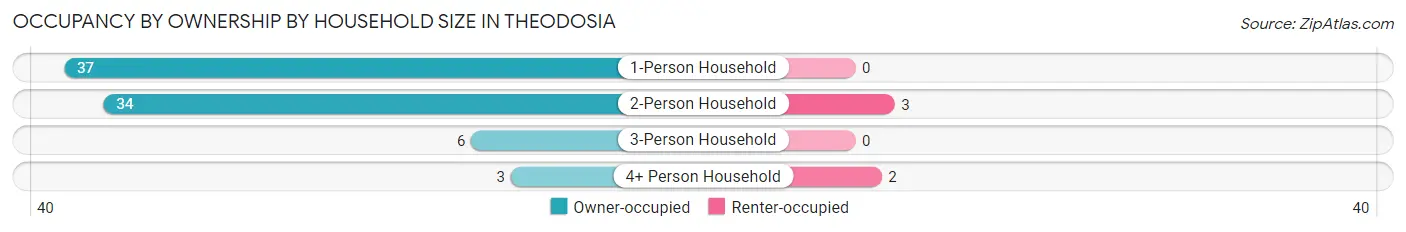
| Household Size | Owner-occupied | Renter-occupied |
| 1-Person Household | 37 (100.0%) | 0 (0.0%) |
| 2-Person Household | 34 (91.9%) | 3 (8.1%) |
| 3-Person Household | 6 (100.0%) | 0 (0.0%) |
| 4+ Person Household | 3 (60.0%) | 2 (40.0%) |
| Total Housing Units | 80 (94.1%) | 5 (5.9%) |
Occupancy by Educational Attainment in Theodosia
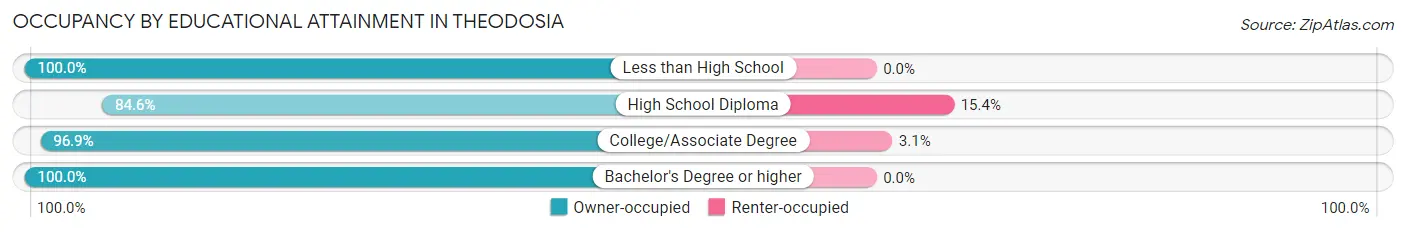
| Household Size | Owner-occupied | Renter-occupied |
| Less than High School | 26 (100.0%) | 0 (0.0%) |
| High School Diploma | 22 (84.6%) | 4 (15.4%) |
| College/Associate Degree | 31 (96.9%) | 1 (3.1%) |
| Bachelor's Degree or higher | 1 (100.0%) | 0 (0.0%) |
Occupancy by Age of Householder in Theodosia
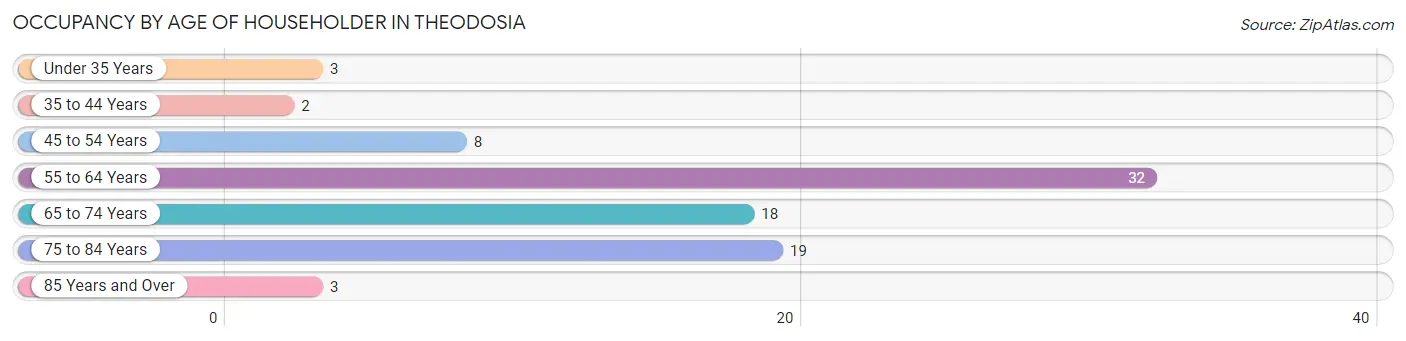
| Age Bracket | # Households | % Households |
| Under 35 Years | 3 | 3.5% |
| 35 to 44 Years | 2 | 2.4% |
| 45 to 54 Years | 8 | 9.4% |
| 55 to 64 Years | 32 | 37.7% |
| 65 to 74 Years | 18 | 21.2% |
| 75 to 84 Years | 19 | 22.4% |
| 85 Years and Over | 3 | 3.5% |
| Total | 85 | 100.0% |
Housing Finances in Theodosia
Median Income by Occupancy in Theodosia
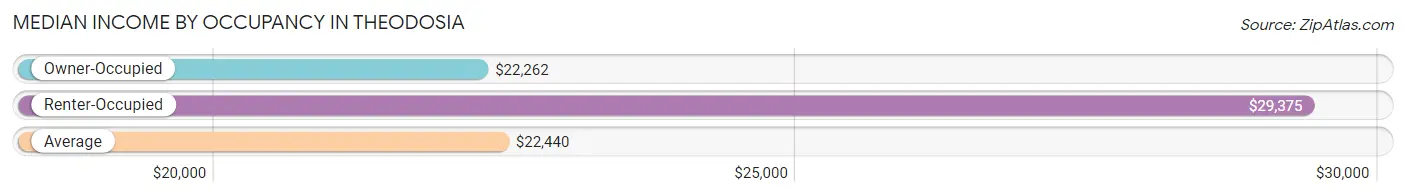
| Occupancy Type | # Households | Median Income |
| Owner-Occupied | 80 (94.1%) | $22,262 |
| Renter-Occupied | 5 (5.9%) | $29,375 |
| Average | 85 (100.0%) | $22,440 |
Occupancy by Householder Income Bracket in Theodosia
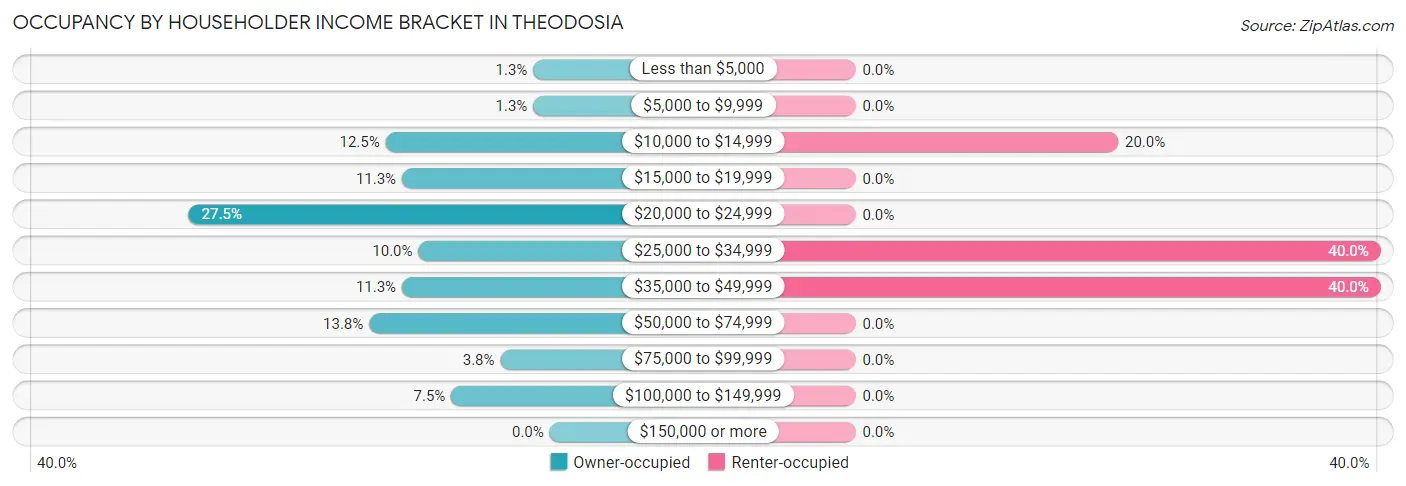
| Income Bracket | Owner-occupied | Renter-occupied |
| Less than $5,000 | 1 (1.3%) | 0 (0.0%) |
| $5,000 to $9,999 | 1 (1.3%) | 0 (0.0%) |
| $10,000 to $14,999 | 10 (12.5%) | 1 (20.0%) |
| $15,000 to $19,999 | 9 (11.3%) | 0 (0.0%) |
| $20,000 to $24,999 | 22 (27.5%) | 0 (0.0%) |
| $25,000 to $34,999 | 8 (10.0%) | 2 (40.0%) |
| $35,000 to $49,999 | 9 (11.3%) | 2 (40.0%) |
| $50,000 to $74,999 | 11 (13.8%) | 0 (0.0%) |
| $75,000 to $99,999 | 3 (3.7%) | 0 (0.0%) |
| $100,000 to $149,999 | 6 (7.5%) | 0 (0.0%) |
| $150,000 or more | 0 (0.0%) | 0 (0.0%) |
| Total | 80 (100.0%) | 5 (100.0%) |
Monthly Housing Cost Tiers in Theodosia
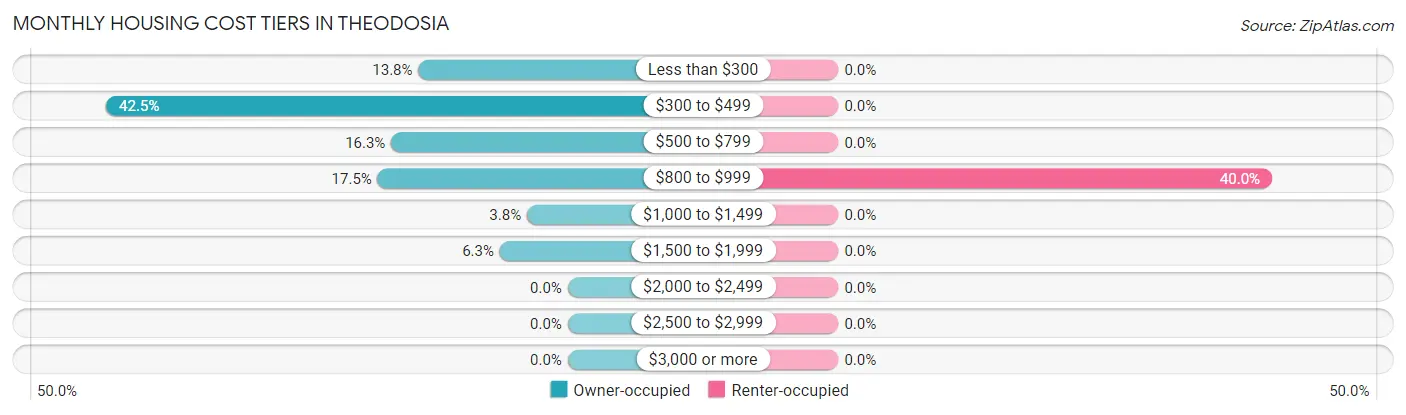
| Monthly Cost | Owner-occupied | Renter-occupied |
| Less than $300 | 11 (13.8%) | 0 (0.0%) |
| $300 to $499 | 34 (42.5%) | 0 (0.0%) |
| $500 to $799 | 13 (16.3%) | 0 (0.0%) |
| $800 to $999 | 14 (17.5%) | 2 (40.0%) |
| $1,000 to $1,499 | 3 (3.7%) | 0 (0.0%) |
| $1,500 to $1,999 | 5 (6.2%) | 0 (0.0%) |
| $2,000 to $2,499 | 0 (0.0%) | 0 (0.0%) |
| $2,500 to $2,999 | 0 (0.0%) | 0 (0.0%) |
| $3,000 or more | 0 (0.0%) | 0 (0.0%) |
| Total | 80 (100.0%) | 5 (100.0%) |
Physical Housing Characteristics in Theodosia
Housing Structures in Theodosia
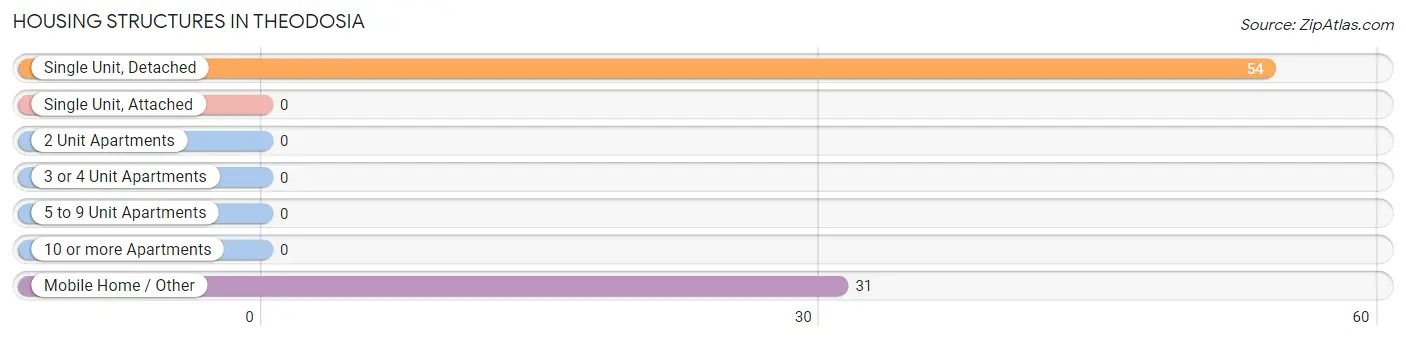
| Structure Type | # Housing Units | % Housing Units |
| Single Unit, Detached | 54 | 63.5% |
| Single Unit, Attached | 0 | 0.0% |
| 2 Unit Apartments | 0 | 0.0% |
| 3 or 4 Unit Apartments | 0 | 0.0% |
| 5 to 9 Unit Apartments | 0 | 0.0% |
| 10 or more Apartments | 0 | 0.0% |
| Mobile Home / Other | 31 | 36.5% |
| Total | 85 | 100.0% |
Housing Structures by Occupancy in Theodosia
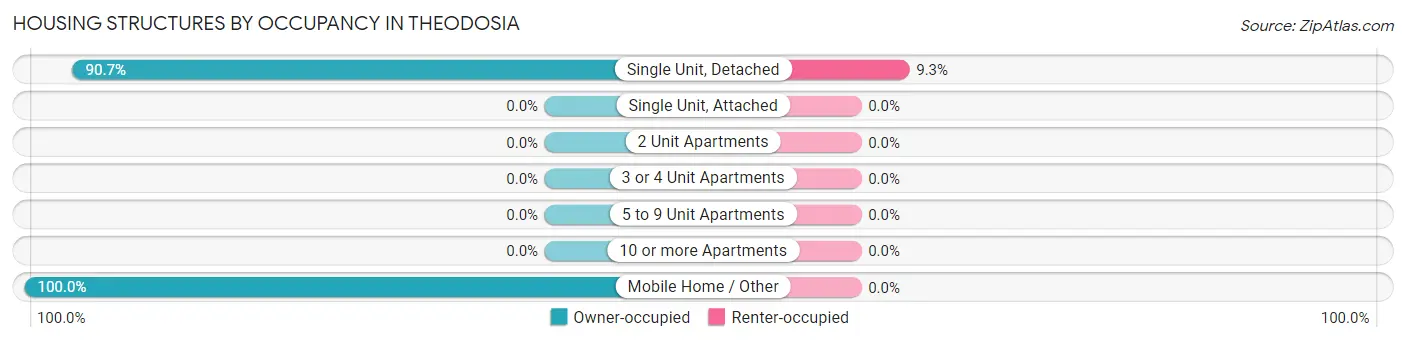
| Structure Type | Owner-occupied | Renter-occupied |
| Single Unit, Detached | 49 (90.7%) | 5 (9.3%) |
| Single Unit, Attached | 0 (0.0%) | 0 (0.0%) |
| 2 Unit Apartments | 0 (0.0%) | 0 (0.0%) |
| 3 or 4 Unit Apartments | 0 (0.0%) | 0 (0.0%) |
| 5 to 9 Unit Apartments | 0 (0.0%) | 0 (0.0%) |
| 10 or more Apartments | 0 (0.0%) | 0 (0.0%) |
| Mobile Home / Other | 31 (100.0%) | 0 (0.0%) |
| Total | 80 (94.1%) | 5 (5.9%) |
Housing Structures by Number of Rooms in Theodosia
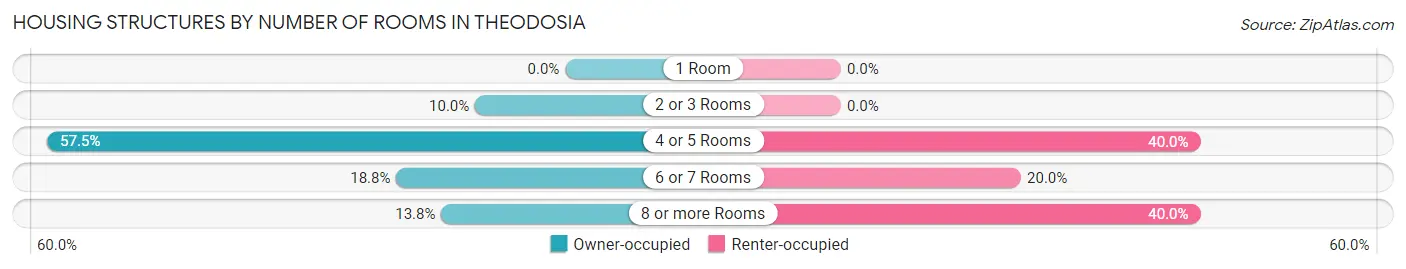
| Number of Rooms | Owner-occupied | Renter-occupied |
| 1 Room | 0 (0.0%) | 0 (0.0%) |
| 2 or 3 Rooms | 8 (10.0%) | 0 (0.0%) |
| 4 or 5 Rooms | 46 (57.5%) | 2 (40.0%) |
| 6 or 7 Rooms | 15 (18.8%) | 1 (20.0%) |
| 8 or more Rooms | 11 (13.8%) | 2 (40.0%) |
| Total | 80 (100.0%) | 5 (100.0%) |
Housing Structure by Heating Type in Theodosia
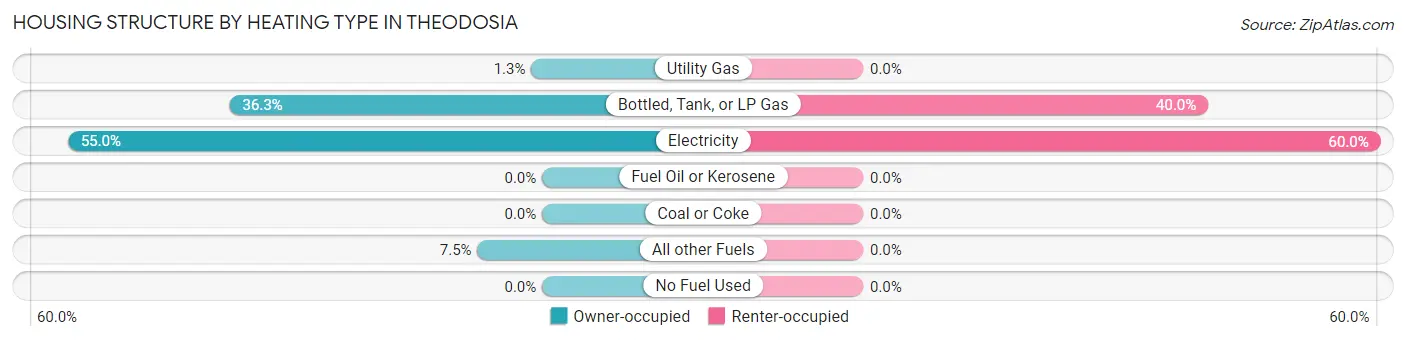
| Heating Type | Owner-occupied | Renter-occupied |
| Utility Gas | 1 (1.3%) | 0 (0.0%) |
| Bottled, Tank, or LP Gas | 29 (36.2%) | 2 (40.0%) |
| Electricity | 44 (55.0%) | 3 (60.0%) |
| Fuel Oil or Kerosene | 0 (0.0%) | 0 (0.0%) |
| Coal or Coke | 0 (0.0%) | 0 (0.0%) |
| All other Fuels | 6 (7.5%) | 0 (0.0%) |
| No Fuel Used | 0 (0.0%) | 0 (0.0%) |
| Total | 80 (100.0%) | 5 (100.0%) |
Household Vehicle Usage in Theodosia
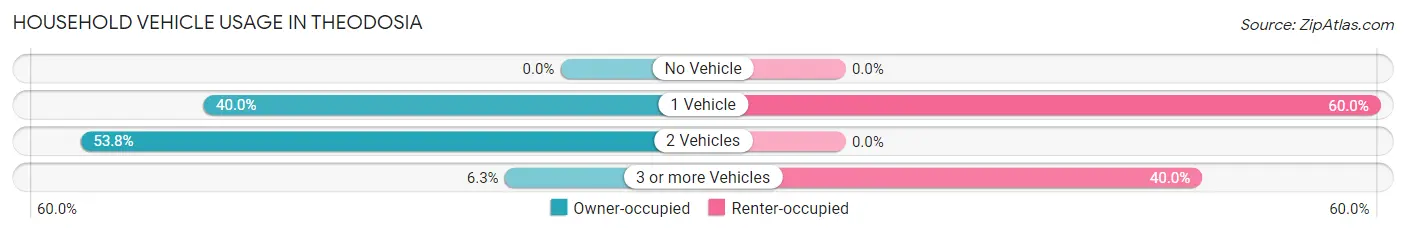
| Vehicles per Household | Owner-occupied | Renter-occupied |
| No Vehicle | 0 (0.0%) | 0 (0.0%) |
| 1 Vehicle | 32 (40.0%) | 3 (60.0%) |
| 2 Vehicles | 43 (53.7%) | 0 (0.0%) |
| 3 or more Vehicles | 5 (6.2%) | 2 (40.0%) |
| Total | 80 (100.0%) | 5 (100.0%) |
Real Estate & Mortgages in Theodosia
Real Estate and Mortgage Overview in Theodosia
| Characteristic | Without Mortgage | With Mortgage |
| Housing Units | 54 | 26 |
| Median Property Value | $90,000 | $137,500 |
| Median Household Income | $21,944 | $0 |
| Monthly Housing Costs | $431 | $0 |
| Real Estate Taxes | $500 | $0 |
Property Value by Mortgage Status in Theodosia
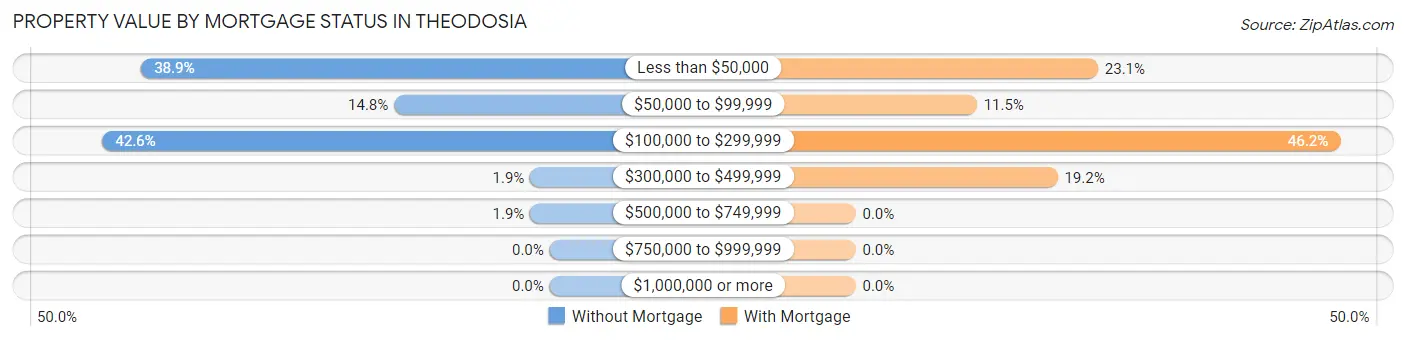
| Property Value | Without Mortgage | With Mortgage |
| Less than $50,000 | 21 (38.9%) | 6 (23.1%) |
| $50,000 to $99,999 | 8 (14.8%) | 3 (11.5%) |
| $100,000 to $299,999 | 23 (42.6%) | 12 (46.2%) |
| $300,000 to $499,999 | 1 (1.8%) | 5 (19.2%) |
| $500,000 to $749,999 | 1 (1.8%) | 0 (0.0%) |
| $750,000 to $999,999 | 0 (0.0%) | 0 (0.0%) |
| $1,000,000 or more | 0 (0.0%) | 0 (0.0%) |
| Total | 54 (100.0%) | 26 (100.0%) |
Household Income by Mortgage Status in Theodosia
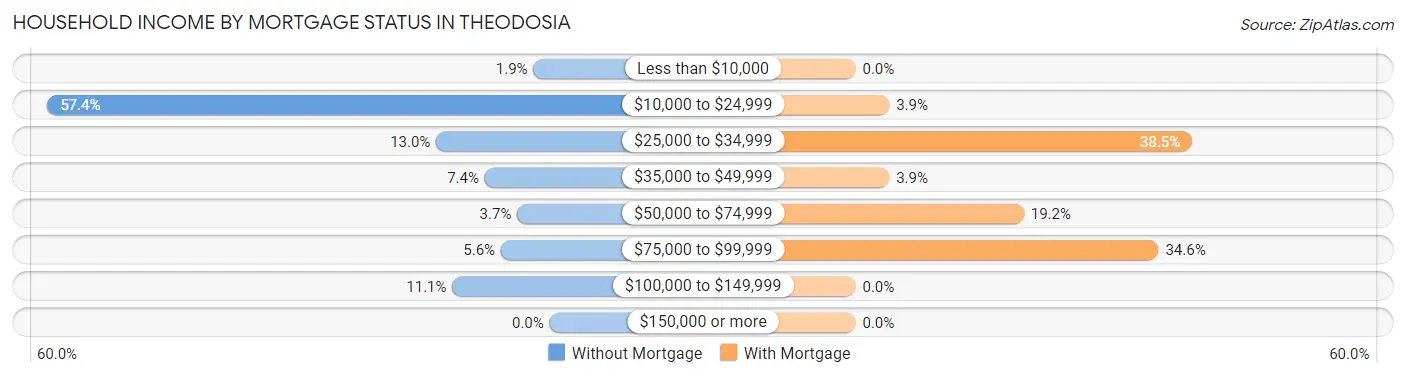
| Household Income | Without Mortgage | With Mortgage |
| Less than $10,000 | 1 (1.8%) | 0 (0.0%) |
| $10,000 to $24,999 | 31 (57.4%) | 1 (3.8%) |
| $25,000 to $34,999 | 7 (13.0%) | 10 (38.5%) |
| $35,000 to $49,999 | 4 (7.4%) | 1 (3.8%) |
| $50,000 to $74,999 | 2 (3.7%) | 5 (19.2%) |
| $75,000 to $99,999 | 3 (5.6%) | 9 (34.6%) |
| $100,000 to $149,999 | 6 (11.1%) | 0 (0.0%) |
| $150,000 or more | 0 (0.0%) | 0 (0.0%) |
| Total | 54 (100.0%) | 26 (100.0%) |
Property Value to Household Income Ratio in Theodosia
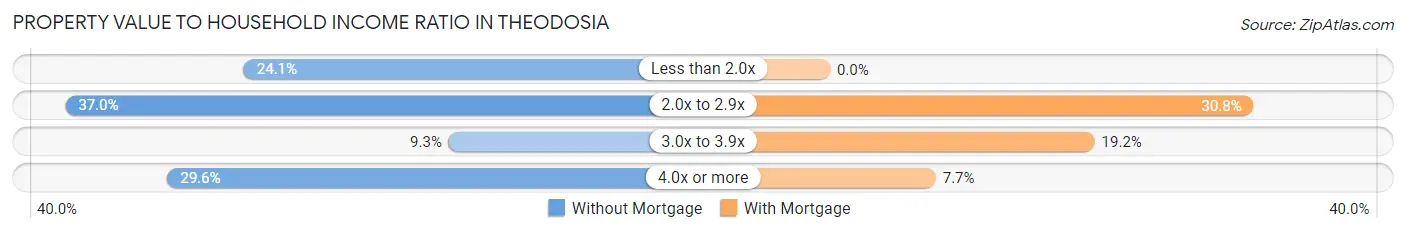
| Value-to-Income Ratio | Without Mortgage | With Mortgage |
| Less than 2.0x | 13 (24.1%) | 0 (0.0%) |
| 2.0x to 2.9x | 20 (37.0%) | 8 (30.8%) |
| 3.0x to 3.9x | 5 (9.3%) | 5 (19.2%) |
| 4.0x or more | 16 (29.6%) | 2 (7.7%) |
| Total | 54 (100.0%) | 26 (100.0%) |
Real Estate Taxes by Mortgage Status in Theodosia
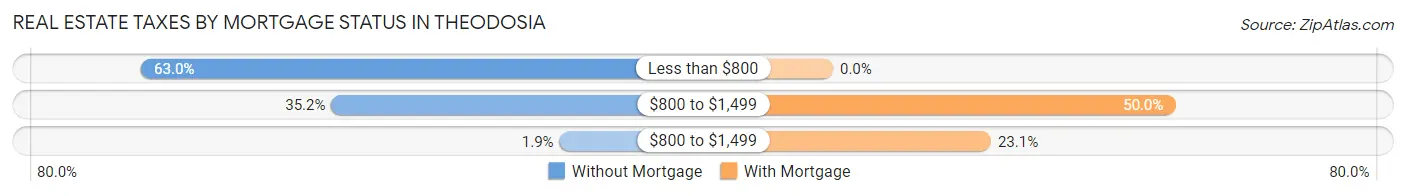
| Property Taxes | Without Mortgage | With Mortgage |
| Less than $800 | 34 (63.0%) | 0 (0.0%) |
| $800 to $1,499 | 19 (35.2%) | 13 (50.0%) |
| $800 to $1,499 | 1 (1.8%) | 6 (23.1%) |
| Total | 54 (100.0%) | 26 (100.0%) |
Health & Disability in Theodosia
Health Insurance Coverage by Age in Theodosia
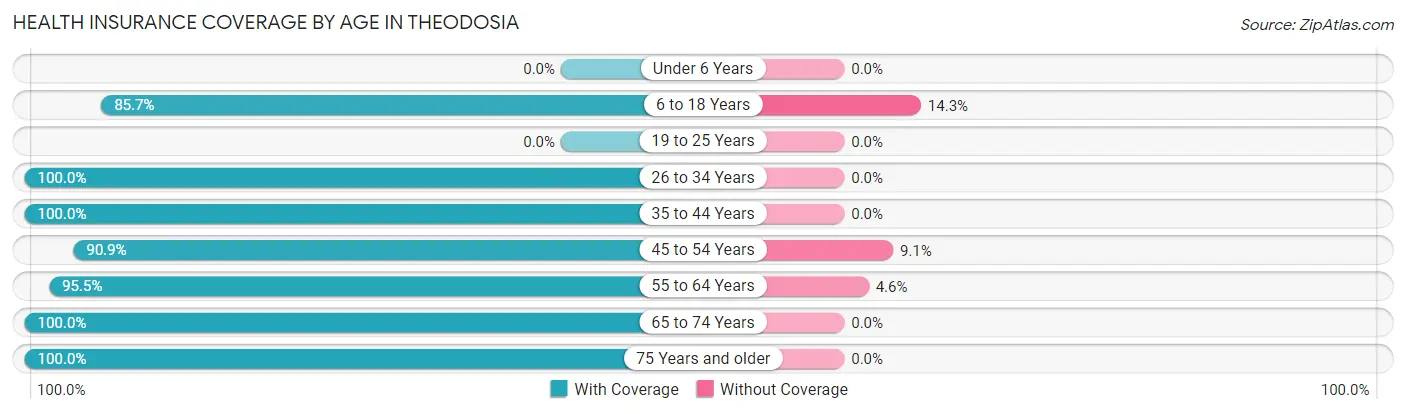
| Age Bracket | With Coverage | Without Coverage |
| Under 6 Years | 0 (0.0%) | 0 (0.0%) |
| 6 to 18 Years | 12 (85.7%) | 2 (14.3%) |
| 19 to 25 Years | 0 (0.0%) | 0 (0.0%) |
| 26 to 34 Years | 3 (100.0%) | 0 (0.0%) |
| 35 to 44 Years | 11 (100.0%) | 0 (0.0%) |
| 45 to 54 Years | 10 (90.9%) | 1 (9.1%) |
| 55 to 64 Years | 42 (95.5%) | 2 (4.5%) |
| 65 to 74 Years | 28 (100.0%) | 0 (0.0%) |
| 75 Years and older | 35 (100.0%) | 0 (0.0%) |
| Total | 141 (96.6%) | 5 (3.4%) |
Health Insurance Coverage by Citizenship Status in Theodosia
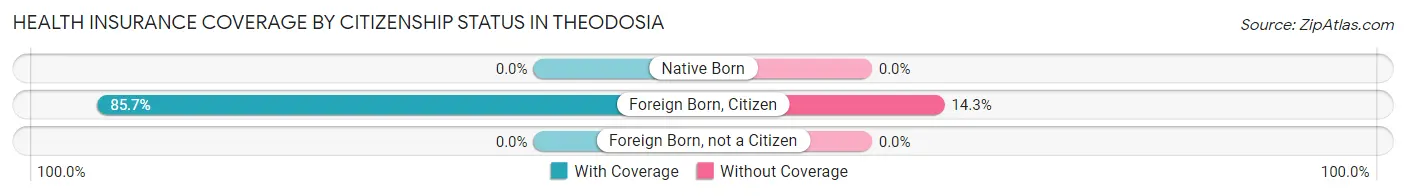
| Citizenship Status | With Coverage | Without Coverage |
| Native Born | 0 (0.0%) | 0 (0.0%) |
| Foreign Born, Citizen | 12 (85.7%) | 2 (14.3%) |
| Foreign Born, not a Citizen | 0 (0.0%) | 0 (0.0%) |
Health Insurance Coverage by Household Income in Theodosia
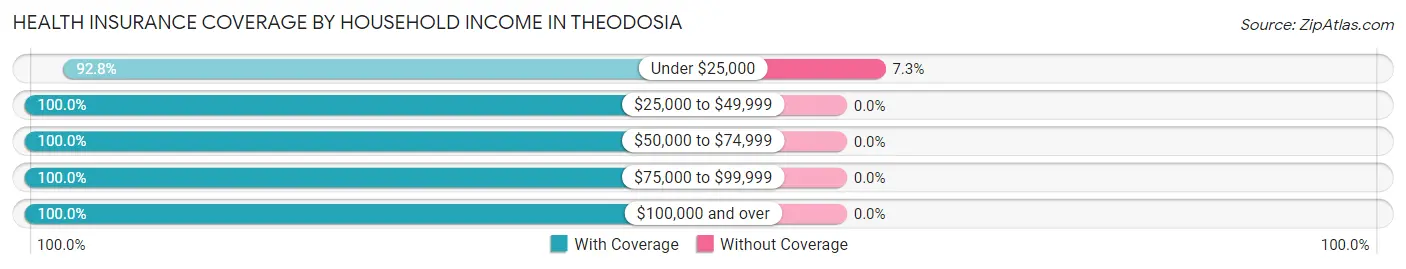
| Household Income | With Coverage | Without Coverage |
| Under $25,000 | 64 (92.7%) | 5 (7.2%) |
| $25,000 to $49,999 | 41 (100.0%) | 0 (0.0%) |
| $50,000 to $74,999 | 25 (100.0%) | 0 (0.0%) |
| $75,000 to $99,999 | 5 (100.0%) | 0 (0.0%) |
| $100,000 and over | 6 (100.0%) | 0 (0.0%) |
Public vs Private Health Insurance Coverage by Age in Theodosia
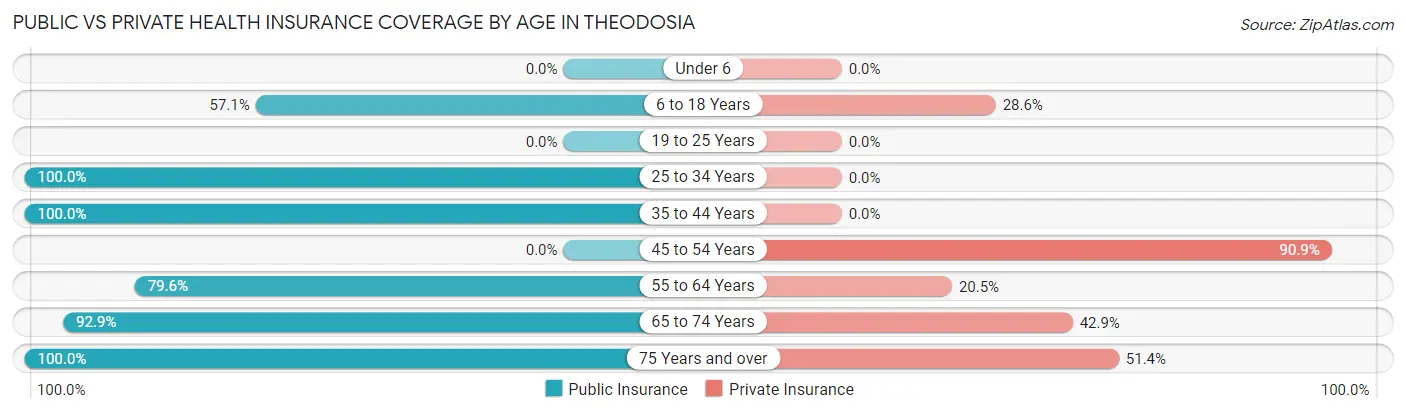
| Age Bracket | Public Insurance | Private Insurance |
| Under 6 | 0 (0.0%) | 0 (0.0%) |
| 6 to 18 Years | 8 (57.1%) | 4 (28.6%) |
| 19 to 25 Years | 0 (0.0%) | 0 (0.0%) |
| 25 to 34 Years | 3 (100.0%) | 0 (0.0%) |
| 35 to 44 Years | 11 (100.0%) | 0 (0.0%) |
| 45 to 54 Years | 0 (0.0%) | 10 (90.9%) |
| 55 to 64 Years | 35 (79.5%) | 9 (20.4%) |
| 65 to 74 Years | 26 (92.9%) | 12 (42.9%) |
| 75 Years and over | 35 (100.0%) | 18 (51.4%) |
| Total | 118 (80.8%) | 53 (36.3%) |
Disability Status by Sex by Age in Theodosia
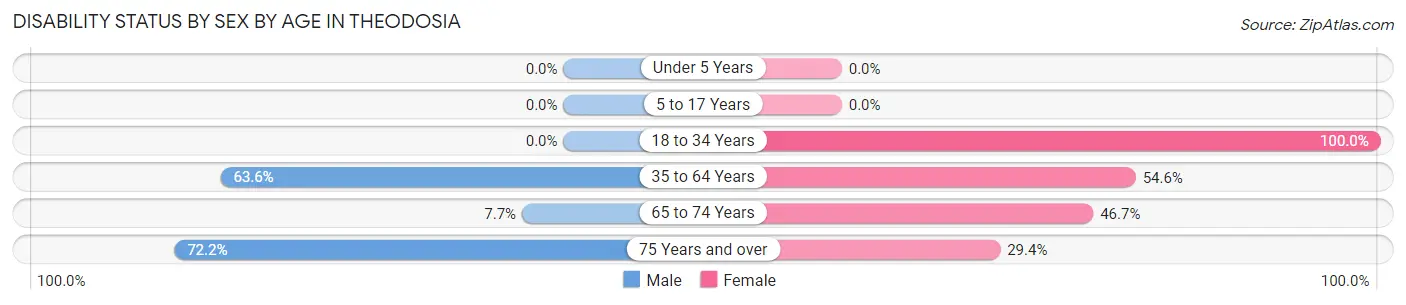
| Age Bracket | Male | Female |
| Under 5 Years | 0 (0.0%) | 0 (0.0%) |
| 5 to 17 Years | 0 (0.0%) | 0 (0.0%) |
| 18 to 34 Years | 0 (0.0%) | 3 (100.0%) |
| 35 to 64 Years | 28 (63.6%) | 12 (54.5%) |
| 65 to 74 Years | 1 (7.7%) | 7 (46.7%) |
| 75 Years and over | 13 (72.2%) | 5 (29.4%) |
Disability Class by Sex by Age in Theodosia
Disability Class: Hearing Difficulty
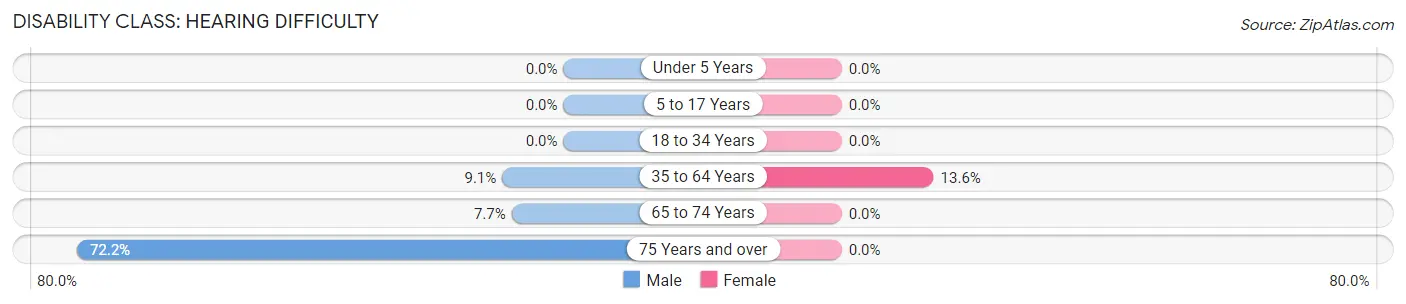
| Age Bracket | Male | Female |
| Under 5 Years | 0 (0.0%) | 0 (0.0%) |
| 5 to 17 Years | 0 (0.0%) | 0 (0.0%) |
| 18 to 34 Years | 0 (0.0%) | 0 (0.0%) |
| 35 to 64 Years | 4 (9.1%) | 3 (13.6%) |
| 65 to 74 Years | 1 (7.7%) | 0 (0.0%) |
| 75 Years and over | 13 (72.2%) | 0 (0.0%) |
Disability Class: Vision Difficulty
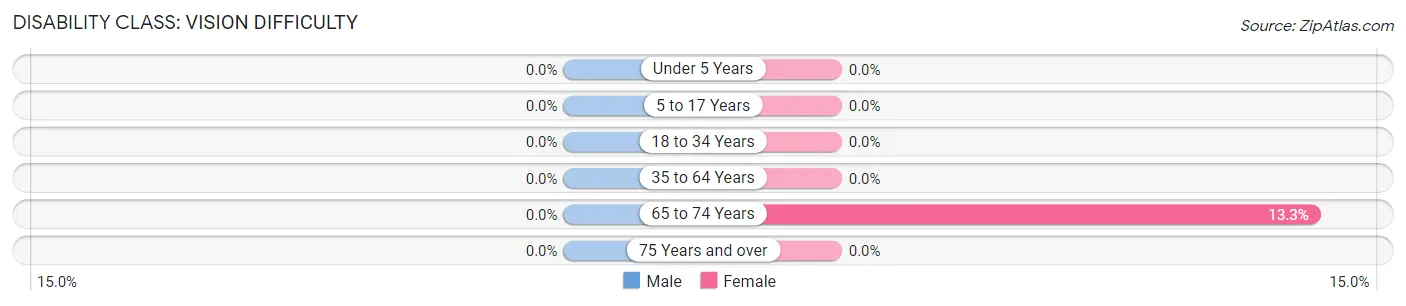
| Age Bracket | Male | Female |
| Under 5 Years | 0 (0.0%) | 0 (0.0%) |
| 5 to 17 Years | 0 (0.0%) | 0 (0.0%) |
| 18 to 34 Years | 0 (0.0%) | 0 (0.0%) |
| 35 to 64 Years | 0 (0.0%) | 0 (0.0%) |
| 65 to 74 Years | 0 (0.0%) | 2 (13.3%) |
| 75 Years and over | 0 (0.0%) | 0 (0.0%) |
Disability Class: Cognitive Difficulty
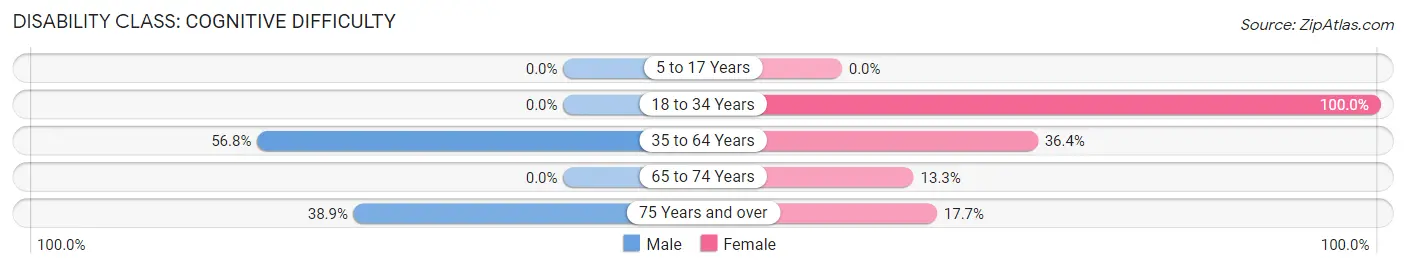
| Age Bracket | Male | Female |
| 5 to 17 Years | 0 (0.0%) | 0 (0.0%) |
| 18 to 34 Years | 0 (0.0%) | 3 (100.0%) |
| 35 to 64 Years | 25 (56.8%) | 8 (36.4%) |
| 65 to 74 Years | 0 (0.0%) | 2 (13.3%) |
| 75 Years and over | 7 (38.9%) | 3 (17.6%) |
Disability Class: Ambulatory Difficulty
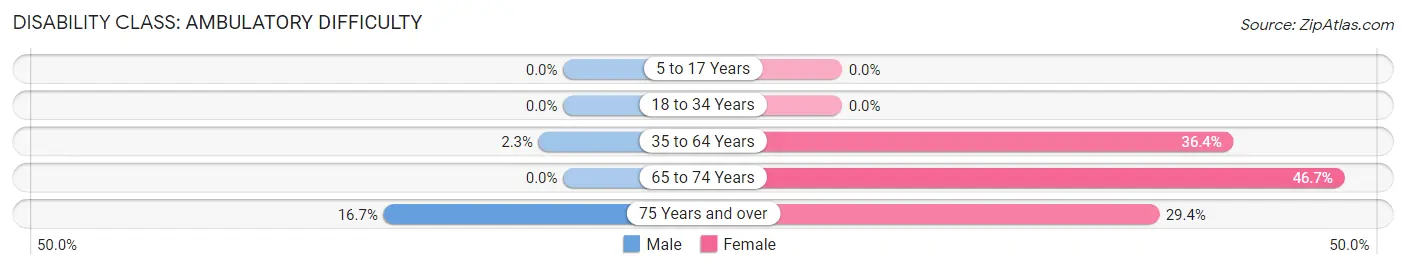
| Age Bracket | Male | Female |
| 5 to 17 Years | 0 (0.0%) | 0 (0.0%) |
| 18 to 34 Years | 0 (0.0%) | 0 (0.0%) |
| 35 to 64 Years | 1 (2.3%) | 8 (36.4%) |
| 65 to 74 Years | 0 (0.0%) | 7 (46.7%) |
| 75 Years and over | 3 (16.7%) | 5 (29.4%) |
Disability Class: Self-Care Difficulty
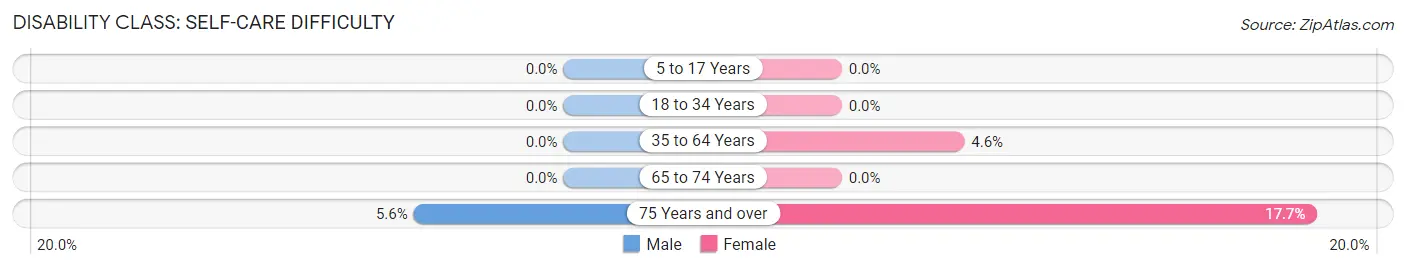
| Age Bracket | Male | Female |
| 5 to 17 Years | 0 (0.0%) | 0 (0.0%) |
| 18 to 34 Years | 0 (0.0%) | 0 (0.0%) |
| 35 to 64 Years | 0 (0.0%) | 1 (4.5%) |
| 65 to 74 Years | 0 (0.0%) | 0 (0.0%) |
| 75 Years and over | 1 (5.6%) | 3 (17.6%) |
Technology Access in Theodosia
Computing Device Access in Theodosia
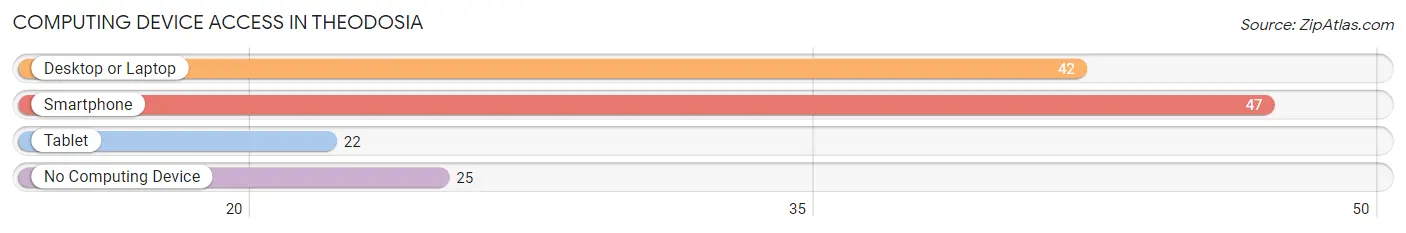
| Device Type | # Households | % Households |
| Desktop or Laptop | 42 | 49.4% |
| Smartphone | 47 | 55.3% |
| Tablet | 22 | 25.9% |
| No Computing Device | 25 | 29.4% |
| Total | 85 | 100.0% |
Internet Access in Theodosia
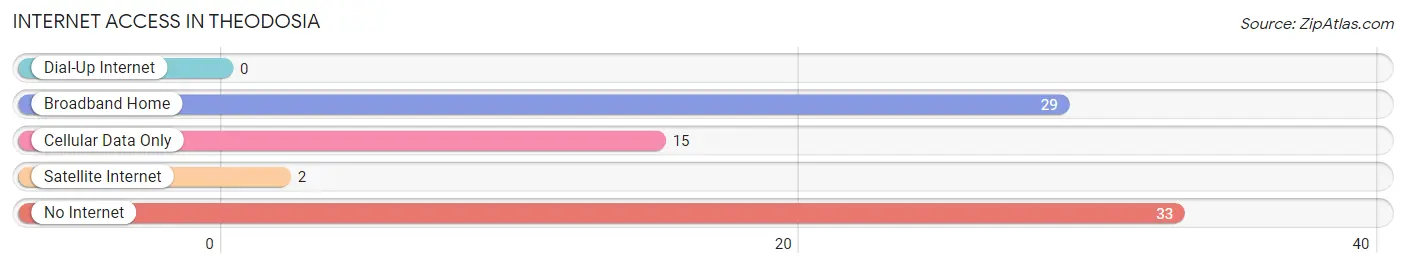
| Internet Type | # Households | % Households |
| Dial-Up Internet | 0 | 0.0% |
| Broadband Home | 29 | 34.1% |
| Cellular Data Only | 15 | 17.6% |
| Satellite Internet | 2 | 2.4% |
| No Internet | 33 | 38.8% |
| Total | 85 | 100.0% |
Theodosia Summary
Theodosia, Missouri is a small town located in the Ozark Mountains of southern Missouri. It is situated in Ozark County, approximately 20 miles south of the Arkansas border. The town was founded in 1883 and named after Theodosia Burr, the daughter of Aaron Burr. Theodosia is a small, rural community with a population of just over 500 people.
Geography
Theodosia is located in the Ozark Mountains of southern Missouri. It is situated in Ozark County, approximately 20 miles south of the Arkansas border. The town is located on the banks of Bull Shoals Lake, a large reservoir created by the U.S. Army Corps of Engineers in 1951. The lake is a popular destination for fishing, boating, and other recreational activities. The town is also located near the Mark Twain National Forest, which provides a variety of outdoor activities such as camping, hiking, and hunting.
The town is situated in a hilly area with elevations ranging from 600 to 1,000 feet above sea level. The climate is temperate, with hot summers and mild winters. The average annual temperature is around 60 degrees Fahrenheit.
Economy
The economy of Theodosia is largely based on tourism and agriculture. The town is a popular destination for fishing, boating, and other recreational activities. The town is also home to several small businesses, including a grocery store, a hardware store, and a restaurant.
Agriculture is an important part of the local economy. The town is surrounded by farms and ranches, and the area is known for its production of beef, pork, and poultry. The town is also home to several wineries and vineyards, which produce a variety of wines.
Demographics
The population of Theodosia is approximately 500 people. The town is predominantly white, with a small African American population. The median household income is around $30,000, and the median age is around 40 years old.
The town is served by the Theodosia-Ozark County School District, which includes one elementary school, one middle school, and one high school. The town is also home to a branch of the Ozark County Library.
Conclusion
Theodosia, Missouri is a small, rural town located in the Ozark Mountains of southern Missouri. It is a popular destination for fishing, boating, and other recreational activities. The town is also home to several small businesses and farms, and the area is known for its production of beef, pork, and poultry. The population of Theodosia is approximately 500 people, and the median household income is around $30,000. The town is served by the Theodosia-Ozark County School District, and is home to a branch of the Ozark County Library.
Common Questions
What is Per Capita Income in Theodosia?
Per Capita income in Theodosia is $20,794.
What is the Median Family Income in Theodosia?
Median Family Income in Theodosia is $28,750.
What is the Median Household income in Theodosia?
Median Household Income in Theodosia is $22,440.
What is Inequality or Gini Index in Theodosia?
Inequality or Gini Index in Theodosia is 0.37.
What is the Total Population of Theodosia?
Total Population of Theodosia is 146.
What is the Total Male Population of Theodosia?
Total Male Population of Theodosia is 84.
What is the Total Female Population of Theodosia?
Total Female Population of Theodosia is 62.
What is the Ratio of Males per 100 Females in Theodosia?
There are 135.48 Males per 100 Females in Theodosia.
What is the Ratio of Females per 100 Males in Theodosia?
There are 73.81 Females per 100 Males in Theodosia.
What is the Median Population Age in Theodosia?
Median Population Age in Theodosia is 63.1 Years.
What is the Average Family Size in Theodosia
Average Family Size in Theodosia is 2.1 People.
What is the Average Household Size in Theodosia
Average Household Size in Theodosia is 1.7 People.
How Large is the Labor Force in Theodosia?
There are 23 People in the Labor Forcein in Theodosia.
What is the Percentage of People in the Labor Force in Theodosia?
16.9% of People are in the Labor Force in Theodosia.