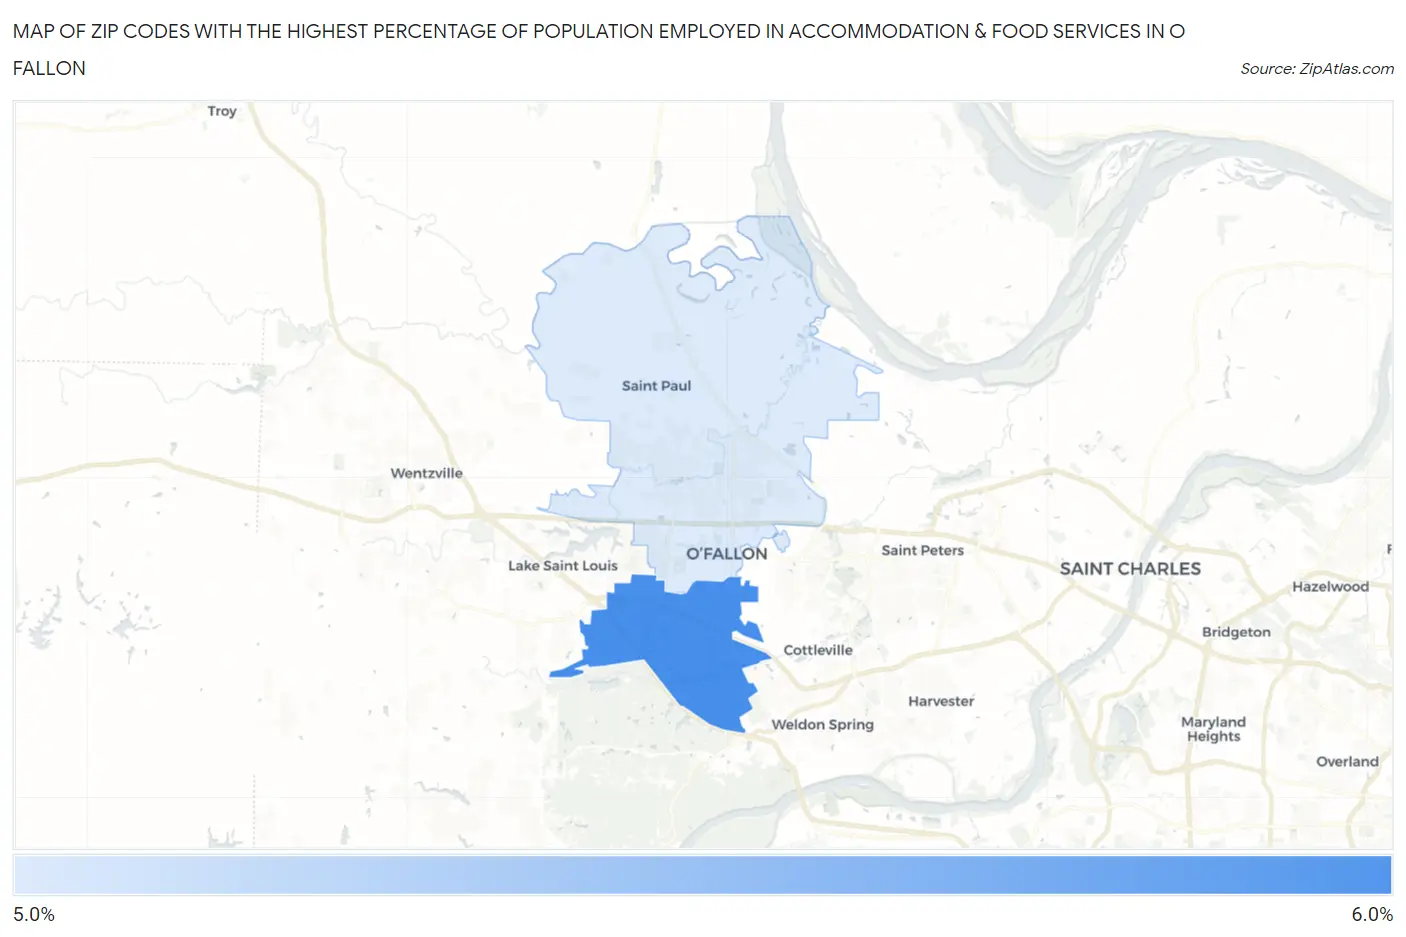
Zip Codes with the Highest Percentage of Population Employed in Accommodation & Food Services in O Fallon, MO
RELATED REPORTS & OPTIONS
Accommodation & Food Services
O Fallon
Compare Zip Codes
Map of Zip Codes with the Highest Percentage of Population Employed in Accommodation & Food Services in O Fallon
5.6%
5.8%
Zip Codes with the Highest Percentage of Population Employed in Accommodation & Food Services in O Fallon, MO
| Zip Code | % Employed | vs State | vs National | |
| 1. | 63368 | 5.8% | 6.6%(-0.820)#388 | 6.9%(-1.13)#14,215 |
| 2. | 63366 | 5.6% | 6.6%(-0.980)#400 | 6.9%(-1.29)#14,719 |
1
Common Questions
What are the Top Zip Codes with the Highest Percentage of Population Employed in Accommodation & Food Services in O Fallon, MO?
Top Zip Codes with the Highest Percentage of Population Employed in Accommodation & Food Services in O Fallon, MO are:
What zip code has the Highest Percentage of Population Employed in Accommodation & Food Services in O Fallon, MO?
63368 has the Highest Percentage of Population Employed in Accommodation & Food Services in O Fallon, MO with 5.8%.
What is the Percentage of Population Employed in Accommodation & Food Services in O Fallon, MO?
Percentage of Population Employed in Accommodation & Food Services in O Fallon is 5.5%.
What is the Percentage of Population Employed in Accommodation & Food Services in Missouri?
Percentage of Population Employed in Accommodation & Food Services in Missouri is 6.6%.
What is the Percentage of Population Employed in Accommodation & Food Services in the United States?
Percentage of Population Employed in Accommodation & Food Services in the United States is 6.9%.