Zip Codes with the Highest Percentage of Population Employed in Accommodation & Food Services in Lees Summit, MO
RELATED REPORTS & OPTIONS
Accommodation & Food Services
Lees Summit
Compare Zip Codes
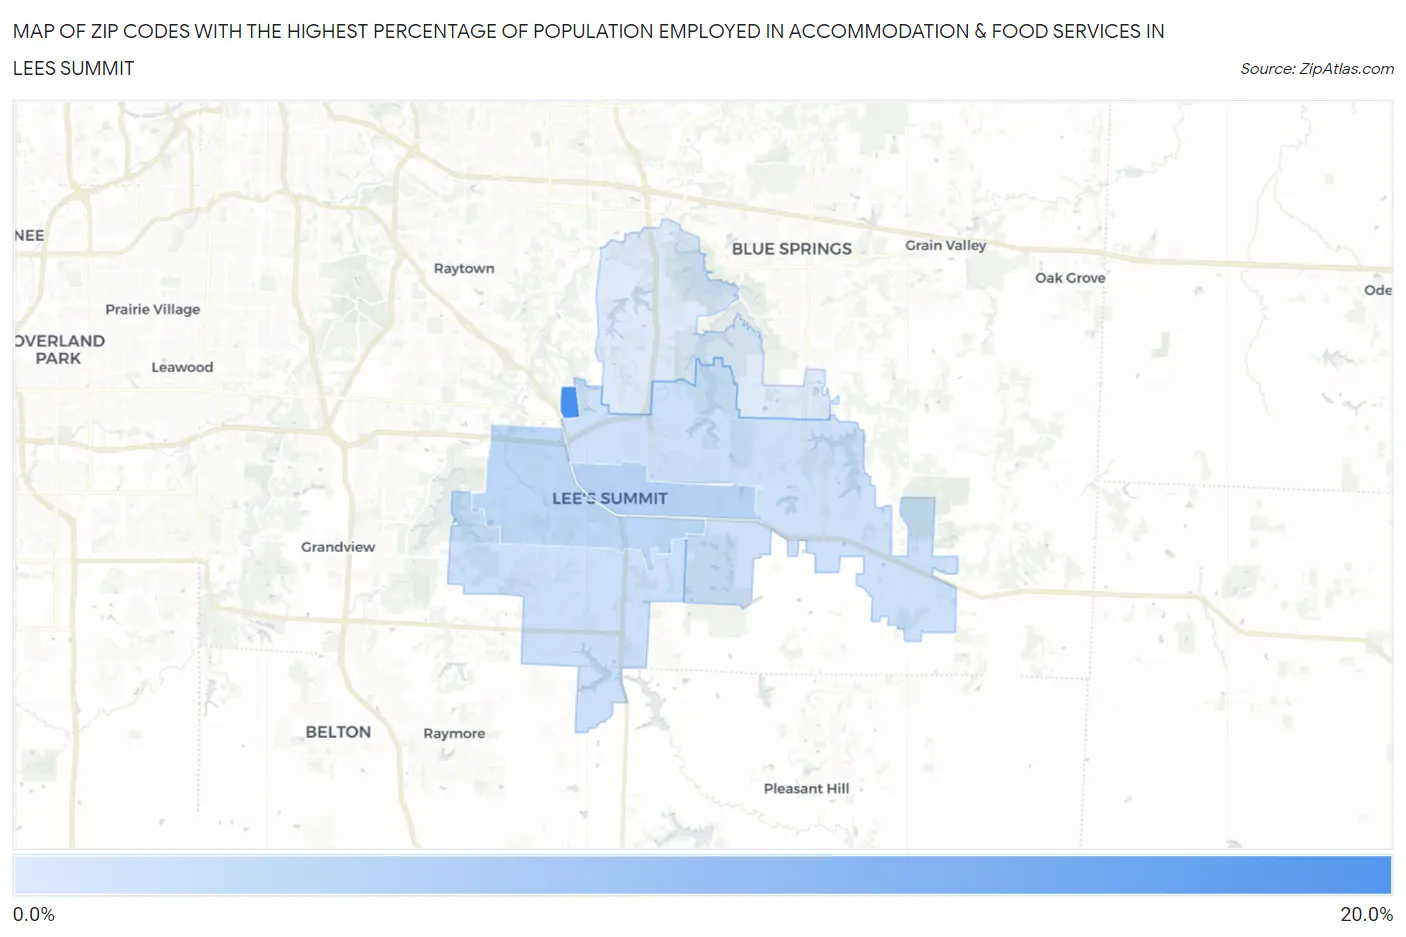
Map of Zip Codes with the Highest Percentage of Population Employed in Accommodation & Food Services in Lees Summit
3.7%
16.7%
Zip Codes with the Highest Percentage of Population Employed in Accommodation & Food Services in Lees Summit, MO
| Zip Code | % Employed | vs State | vs National | |
| 1. | 64065 | 16.7% | 6.6%(+10.1)#42 | 6.9%(+9.79)#1,319 |
| 2. | 64063 | 6.7% | 6.6%(+0.163)#294 | 6.9%(-0.144)#11,084 |
| 3. | 64081 | 6.4% | 6.6%(-0.128)#319 | 6.9%(-0.435)#12,009 |
| 4. | 64082 | 5.1% | 6.6%(-1.52)#451 | 6.9%(-1.82)#16,616 |
| 5. | 64086 | 4.9% | 6.6%(-1.68)#466 | 6.9%(-1.98)#17,169 |
| 6. | 64064 | 3.7% | 6.6%(-2.85)#583 | 6.9%(-3.15)#21,019 |
1
Common Questions
What are the Top 5 Zip Codes with the Highest Percentage of Population Employed in Accommodation & Food Services in Lees Summit, MO?
Top 5 Zip Codes with the Highest Percentage of Population Employed in Accommodation & Food Services in Lees Summit, MO are:
What zip code has the Highest Percentage of Population Employed in Accommodation & Food Services in Lees Summit, MO?
64065 has the Highest Percentage of Population Employed in Accommodation & Food Services in Lees Summit, MO with 16.7%.
What is the Percentage of Population Employed in Accommodation & Food Services in Missouri?
Percentage of Population Employed in Accommodation & Food Services in Missouri is 6.6%.
What is the Percentage of Population Employed in Accommodation & Food Services in the United States?
Percentage of Population Employed in Accommodation & Food Services in the United States is 6.9%.