Avondale, MO Map & Demographics
Avondale Map
Avondale Overview
$26,708
PER CAPITA INCOME
$46,250
AVG FAMILY INCOME
$40,000
AVG HOUSEHOLD INCOME
21.5%
WAGE / INCOME GAP [ % ]
78.5¢/ $1
WAGE / INCOME GAP [ $ ]
0.45
INEQUALITY / GINI INDEX
343
TOTAL POPULATION
160
MALE POPULATION
183
FEMALE POPULATION
87.43
MALES / 100 FEMALES
114.38
FEMALES / 100 MALES
42.9
MEDIAN AGE
2.8
AVG FAMILY SIZE
2.1
AVG HOUSEHOLD SIZE
184
LABOR FORCE [ PEOPLE ]
65.0%
PERCENT IN LABOR FORCE
4.9%
UNEMPLOYMENT RATE
Avondale Area Codes
Income in Avondale
Income Overview in Avondale
Per Capita Income in Avondale is $26,708, while median incomes of families and households are $46,250 and $40,000 respectively.
| Characteristic | Number | Measure |
| Per Capita Income | 343 | $26,708 |
| Median Family Income | 80 | $46,250 |
| Mean Family Income | 80 | $54,715 |
| Median Household Income | 166 | $40,000 |
| Mean Household Income | 166 | $54,316 |
| Income Deficit | 80 | $0 |
| Wage / Income Gap (%) | 343 | 21.51% |
| Wage / Income Gap ($) | 343 | 78.49¢ per $1 |
| Gini / Inequality Index | 343 | 0.45 |
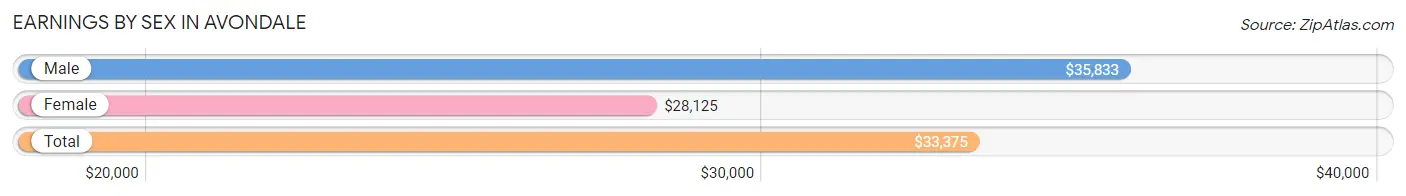
Earnings by Sex in Avondale
Average Earnings in Avondale are $33,375, $35,833 for men and $28,125 for women, a difference of 21.5%.
| Sex | Number | Average Earnings |
| Male | 84 (46.4%) | $35,833 |
| Female | 97 (53.6%) | $28,125 |
| Total | 181 (100.0%) | $33,375 |
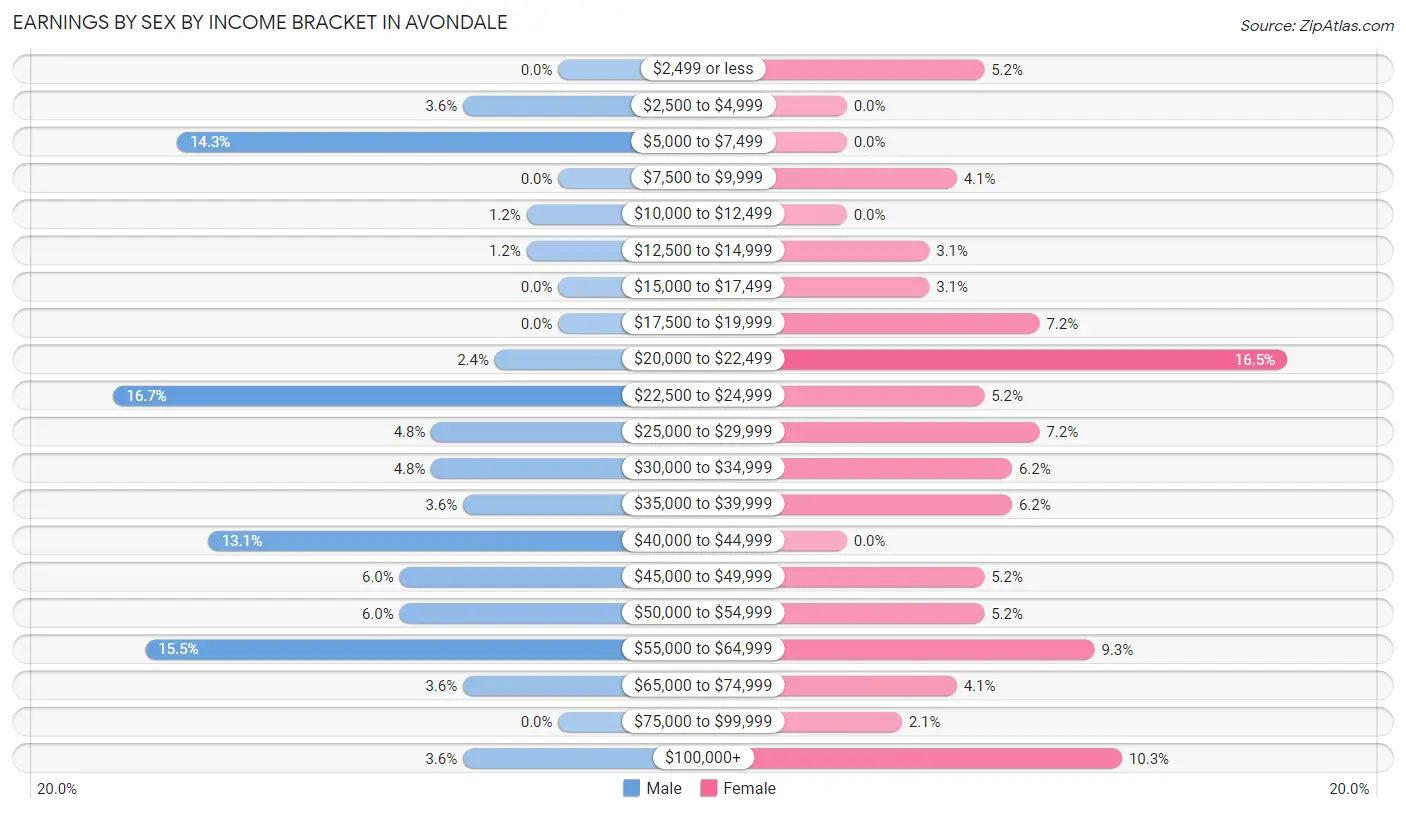
Earnings by Sex by Income Bracket in Avondale
The most common earnings brackets in Avondale are $22,500 to $24,999 for men (14 | 16.7%) and $20,000 to $22,499 for women (16 | 16.5%).
| Income | Male | Female |
| $2,499 or less | 0 (0.0%) | 5 (5.1%) |
| $2,500 to $4,999 | 3 (3.6%) | 0 (0.0%) |
| $5,000 to $7,499 | 12 (14.3%) | 0 (0.0%) |
| $7,500 to $9,999 | 0 (0.0%) | 4 (4.1%) |
| $10,000 to $12,499 | 1 (1.2%) | 0 (0.0%) |
| $12,500 to $14,999 | 1 (1.2%) | 3 (3.1%) |
| $15,000 to $17,499 | 0 (0.0%) | 3 (3.1%) |
| $17,500 to $19,999 | 0 (0.0%) | 7 (7.2%) |
| $20,000 to $22,499 | 2 (2.4%) | 16 (16.5%) |
| $22,500 to $24,999 | 14 (16.7%) | 5 (5.1%) |
| $25,000 to $29,999 | 4 (4.8%) | 7 (7.2%) |
| $30,000 to $34,999 | 4 (4.8%) | 6 (6.2%) |
| $35,000 to $39,999 | 3 (3.6%) | 6 (6.2%) |
| $40,000 to $44,999 | 11 (13.1%) | 0 (0.0%) |
| $45,000 to $49,999 | 5 (5.9%) | 5 (5.1%) |
| $50,000 to $54,999 | 5 (5.9%) | 5 (5.1%) |
| $55,000 to $64,999 | 13 (15.5%) | 9 (9.3%) |
| $65,000 to $74,999 | 3 (3.6%) | 4 (4.1%) |
| $75,000 to $99,999 | 0 (0.0%) | 2 (2.1%) |
| $100,000+ | 3 (3.6%) | 10 (10.3%) |
| Total | 84 (100.0%) | 97 (100.0%) |
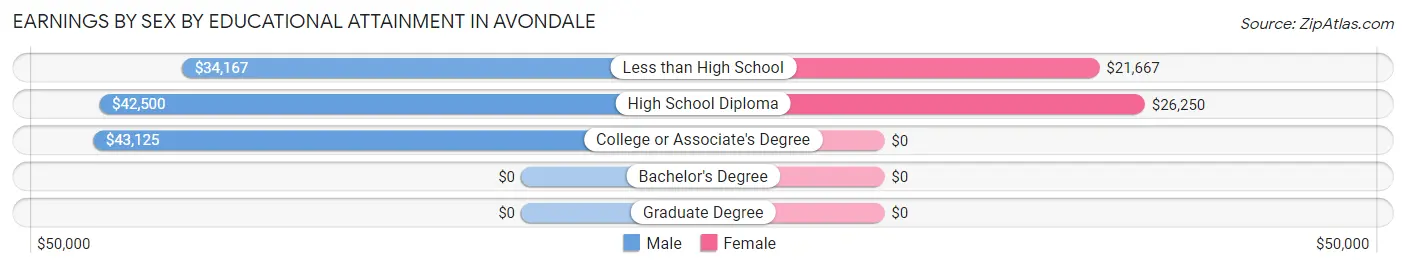
Earnings by Sex by Educational Attainment in Avondale
Average earnings in Avondale are $36,667 for men and $28,125 for women, a difference of 23.3%. Men with an educational attainment of college or associate's degree enjoy the highest average annual earnings of $43,125, while those with less than high school education earn the least with $34,167. Women with an educational attainment of high school diploma earn the most with the average annual earnings of $26,250, while those with less than high school education have the smallest earnings of $21,667.
| Educational Attainment | Male Income | Female Income |
| Less than High School | $34,167 | $21,667 |
| High School Diploma | $42,500 | $26,250 |
| College or Associate's Degree | $43,125 | $0 |
| Bachelor's Degree | - | - |
| Graduate Degree | - | - |
| Total | $36,667 | $28,125 |
Family Income in Avondale
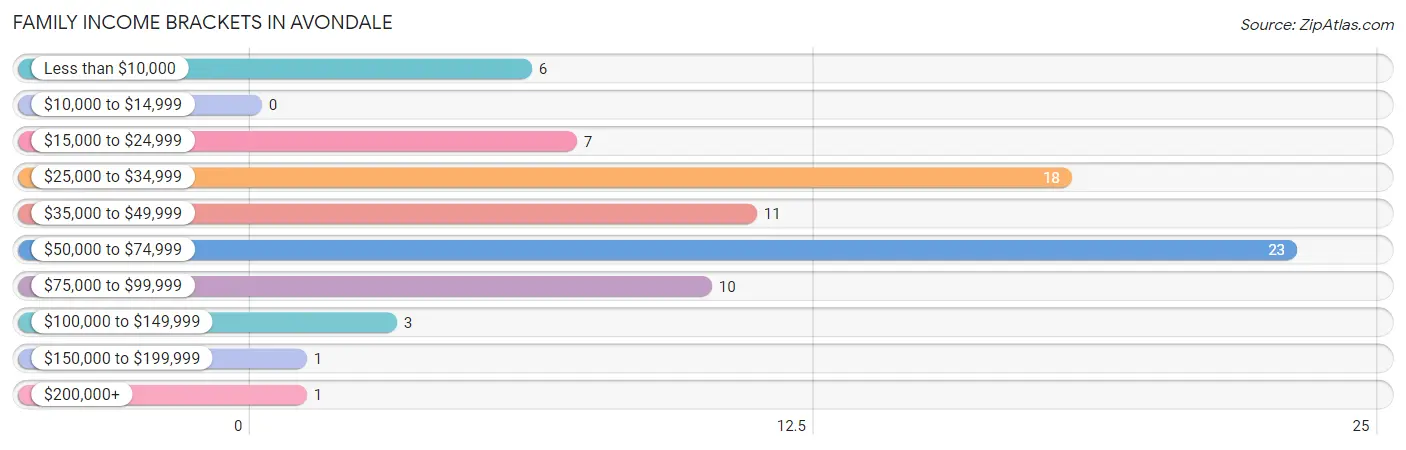
Family Income Brackets in Avondale
According to the Avondale family income data, there are 23 families falling into the $50,000 to $74,999 income range, which is the most common income bracket and makes up 28.7% of all families.
| Income Bracket | # Families | % Families |
| Less than $10,000 | 6 | 7.5% |
| $10,000 to $14,999 | 0 | 0.0% |
| $15,000 to $24,999 | 7 | 8.8% |
| $25,000 to $34,999 | 18 | 22.5% |
| $35,000 to $49,999 | 11 | 13.8% |
| $50,000 to $74,999 | 23 | 28.8% |
| $75,000 to $99,999 | 10 | 12.5% |
| $100,000 to $149,999 | 3 | 3.8% |
| $150,000 to $199,999 | 1 | 1.3% |
| $200,000+ | 1 | 1.3% |
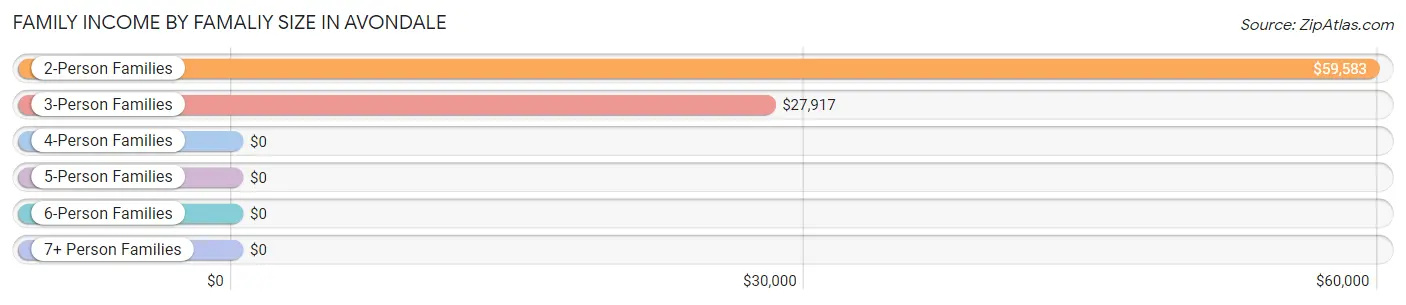
Family Income by Famaliy Size in Avondale
2-person families (49 | 61.3%) account for the highest median family income in Avondale with $59,583 per family, while 2-person families (49 | 61.3%) have the highest median income of $29,792 per family member.
| Income Bracket | # Families | Median Income |
| 2-Person Families | 49 (61.3%) | $59,583 |
| 3-Person Families | 25 (31.2%) | $27,917 |
| 4-Person Families | 1 (1.3%) | $0 |
| 5-Person Families | 2 (2.5%) | $0 |
| 6-Person Families | 2 (2.5%) | $0 |
| 7+ Person Families | 1 (1.3%) | $0 |
| Total | 80 (100.0%) | $46,250 |
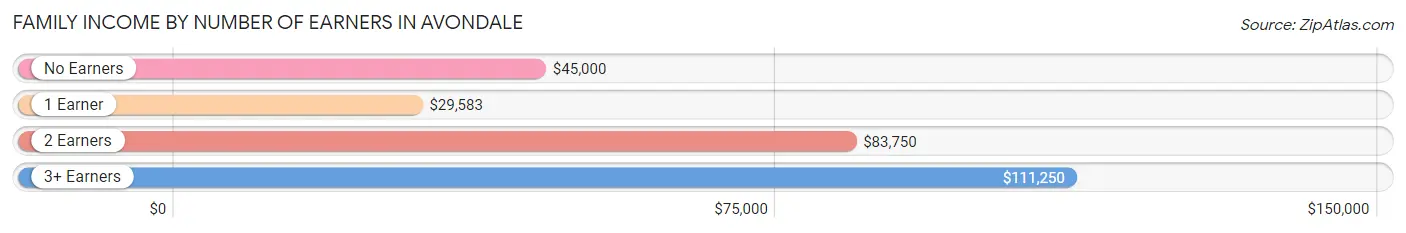
Family Income by Number of Earners in Avondale
The median family income in Avondale is $46,250, with families comprising 3+ earners (3) having the highest median family income of $111,250, while families with 1 earner (49) have the lowest median family income of $29,583, accounting for 3.7% and 61.3% of families, respectively.
| Number of Earners | # Families | Median Income |
| No Earners | 10 (12.5%) | $45,000 |
| 1 Earner | 49 (61.3%) | $29,583 |
| 2 Earners | 18 (22.5%) | $83,750 |
| 3+ Earners | 3 (3.7%) | $111,250 |
| Total | 80 (100.0%) | $46,250 |
Household Income in Avondale
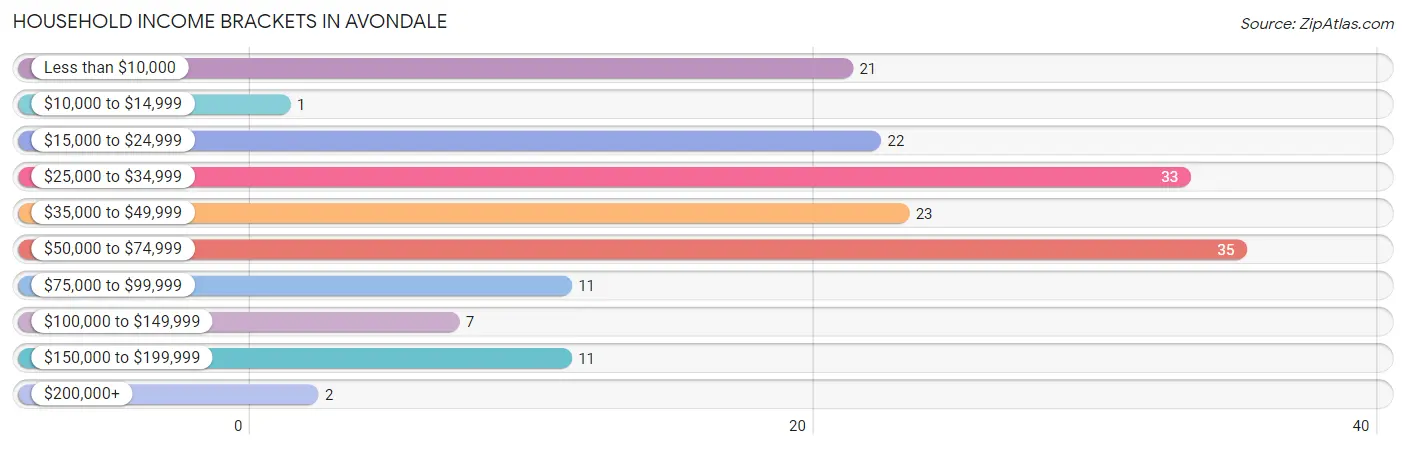
Household Income Brackets in Avondale
With 35 households falling in the category, the $50,000 to $74,999 income range is the most frequent in Avondale, accounting for 21.1% of all households. In contrast, only 1 households (0.6%) fall into the $10,000 to $14,999 income bracket, making it the least populous group.
| Income Bracket | # Households | % Households |
| Less than $10,000 | 21 | 12.7% |
| $10,000 to $14,999 | 1 | 0.6% |
| $15,000 to $24,999 | 22 | 13.3% |
| $25,000 to $34,999 | 33 | 19.9% |
| $35,000 to $49,999 | 23 | 13.9% |
| $50,000 to $74,999 | 35 | 21.1% |
| $75,000 to $99,999 | 11 | 6.6% |
| $100,000 to $149,999 | 7 | 4.2% |
| $150,000 to $199,999 | 11 | 6.6% |
| $200,000+ | 2 | 1.2% |
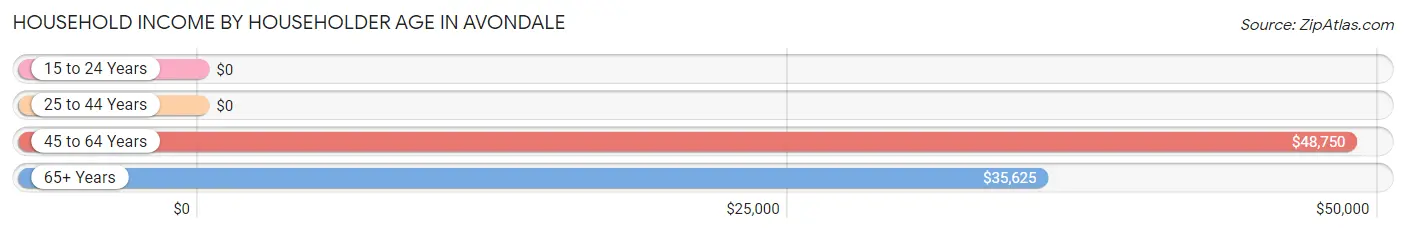
Household Income by Householder Age in Avondale
The median household income in Avondale is $40,000, with the highest median household income of $48,750 found in the 45 to 64 years age bracket for the primary householder. A total of 64 households (38.6%) fall into this category. Meanwhile, the 15 to 24 years age bracket for the primary householder has the lowest median household income of $0, with 1 households (0.6%) in this group.
| Income Bracket | # Households | Median Income |
| 15 to 24 Years | 1 (0.6%) | $0 |
| 25 to 44 Years | 66 (39.8%) | $0 |
| 45 to 64 Years | 64 (38.6%) | $48,750 |
| 65+ Years | 35 (21.1%) | $35,625 |
| Total | 166 (100.0%) | $40,000 |
Poverty in Avondale
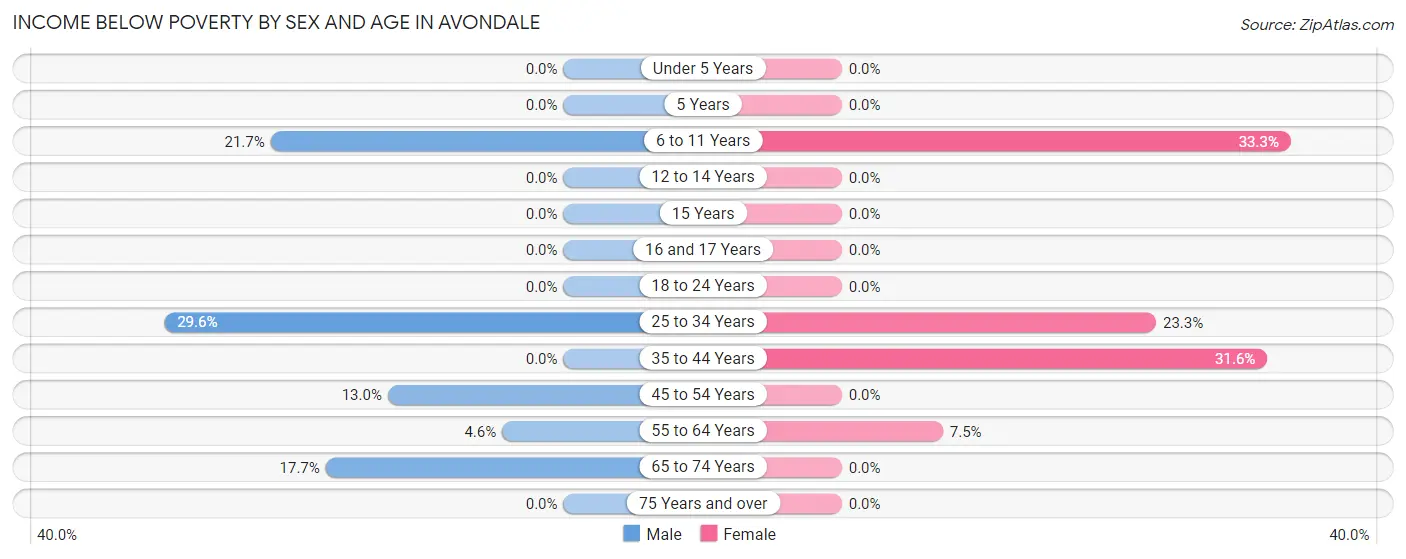
Income Below Poverty by Sex and Age in Avondale
With 12.5% poverty level for males and 14.2% for females among the residents of Avondale, 25 to 34 year old males and 6 to 11 year old females are the most vulnerable to poverty, with 8 males (29.6%) and 4 females (33.3%) in their respective age groups living below the poverty level.
| Age Bracket | Male | Female |
| Under 5 Years | 0 (0.0%) | 0 (0.0%) |
| 5 Years | 0 (0.0%) | 0 (0.0%) |
| 6 to 11 Years | 5 (21.7%) | 4 (33.3%) |
| 12 to 14 Years | 0 (0.0%) | 0 (0.0%) |
| 15 Years | 0 (0.0%) | 0 (0.0%) |
| 16 and 17 Years | 0 (0.0%) | 0 (0.0%) |
| 18 to 24 Years | 0 (0.0%) | 0 (0.0%) |
| 25 to 34 Years | 8 (29.6%) | 7 (23.3%) |
| 35 to 44 Years | 0 (0.0%) | 12 (31.6%) |
| 45 to 54 Years | 3 (13.0%) | 0 (0.0%) |
| 55 to 64 Years | 1 (4.5%) | 3 (7.5%) |
| 65 to 74 Years | 3 (17.6%) | 0 (0.0%) |
| 75 Years and over | 0 (0.0%) | 0 (0.0%) |
| Total | 20 (12.5%) | 26 (14.2%) |
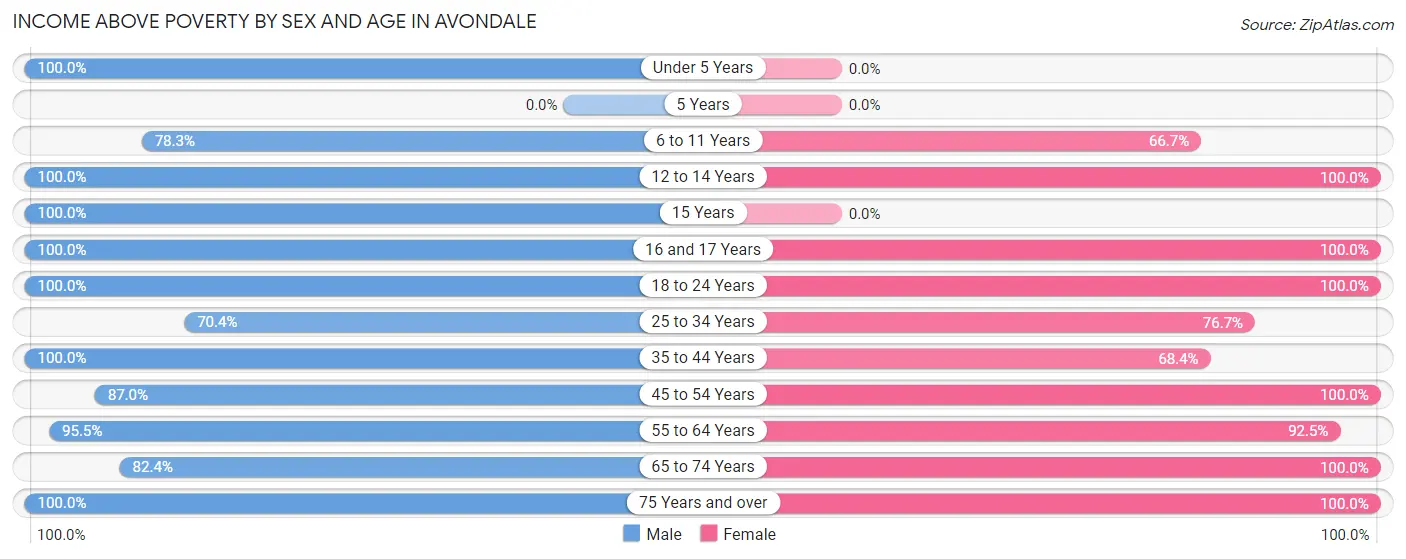
Income Above Poverty by Sex and Age in Avondale
According to the poverty statistics in Avondale, males aged under 5 years and females aged 12 to 14 years are the age groups that are most secure financially, with 100.0% of males and 100.0% of females in these age groups living above the poverty line.
| Age Bracket | Male | Female |
| Under 5 Years | 11 (100.0%) | 0 (0.0%) |
| 5 Years | 0 (0.0%) | 0 (0.0%) |
| 6 to 11 Years | 18 (78.3%) | 8 (66.7%) |
| 12 to 14 Years | 5 (100.0%) | 7 (100.0%) |
| 15 Years | 2 (100.0%) | 0 (0.0%) |
| 16 and 17 Years | 1 (100.0%) | 2 (100.0%) |
| 18 to 24 Years | 6 (100.0%) | 2 (100.0%) |
| 25 to 34 Years | 19 (70.4%) | 23 (76.7%) |
| 35 to 44 Years | 19 (100.0%) | 26 (68.4%) |
| 45 to 54 Years | 20 (87.0%) | 21 (100.0%) |
| 55 to 64 Years | 21 (95.5%) | 37 (92.5%) |
| 65 to 74 Years | 14 (82.4%) | 22 (100.0%) |
| 75 Years and over | 4 (100.0%) | 9 (100.0%) |
| Total | 140 (87.5%) | 157 (85.8%) |
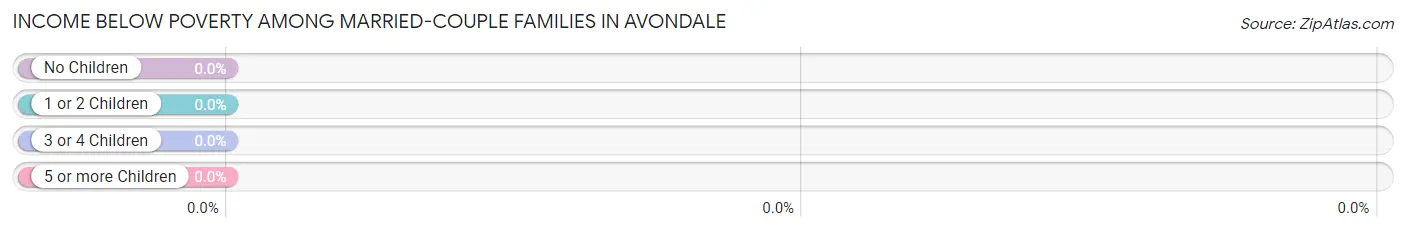
Income Below Poverty Among Married-Couple Families in Avondale
| Children | Above Poverty | Below Poverty |
| No Children | 31 (100.0%) | 0 (0.0%) |
| 1 or 2 Children | 7 (100.0%) | 0 (0.0%) |
| 3 or 4 Children | 0 (0.0%) | 0 (0.0%) |
| 5 or more Children | 0 (0.0%) | 0 (0.0%) |
| Total | 38 (100.0%) | 0 (0.0%) |
Income Below Poverty Among Single-Parent Households in Avondale
According to the poverty data in Avondale, 16.7% or 2 single-father households and 13.3% or 4 single-mother households are living below the poverty line. Among single-father households, those with 1 or 2 children have the highest poverty rate, with 2 households (18.2%) experiencing poverty. Likewise, among single-mother households, those with 1 or 2 children have the highest poverty rate, with 4 households (26.7%) falling below the poverty line.
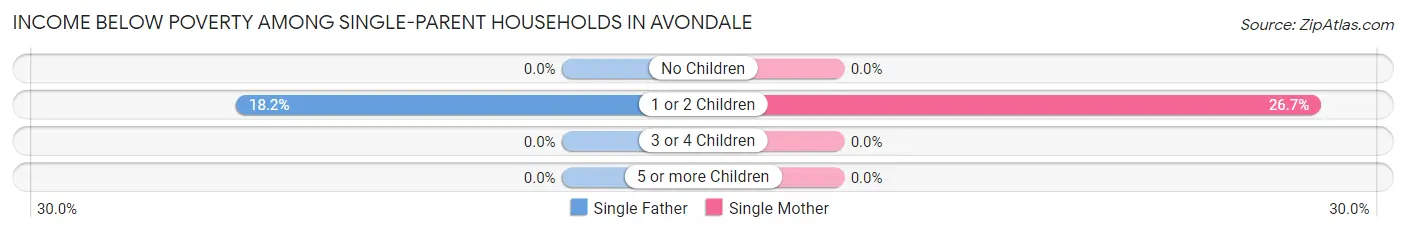
| Children | Single Father | Single Mother |
| No Children | 0 (0.0%) | 0 (0.0%) |
| 1 or 2 Children | 2 (18.2%) | 4 (26.7%) |
| 3 or 4 Children | 0 (0.0%) | 0 (0.0%) |
| 5 or more Children | 0 (0.0%) | 0 (0.0%) |
| Total | 2 (16.7%) | 4 (13.3%) |
Income Below Poverty Among Married-Couple vs Single-Parent Households in Avondale
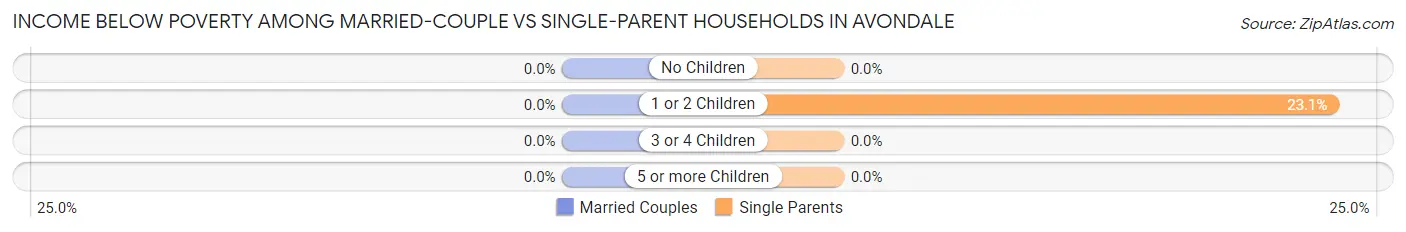
| Children | Married-Couple Families | Single-Parent Households |
| No Children | 0 (0.0%) | 0 (0.0%) |
| 1 or 2 Children | 0 (0.0%) | 6 (23.1%) |
| 3 or 4 Children | 0 (0.0%) | 0 (0.0%) |
| 5 or more Children | 0 (0.0%) | 0 (0.0%) |
| Total | 0 (0.0%) | 6 (14.3%) |
Race in Avondale
The most populous races in Avondale are White / Caucasian (320 | 93.3%), Two or more Races (16 | 4.7%), and Hispanic or Latino (12 | 3.5%).
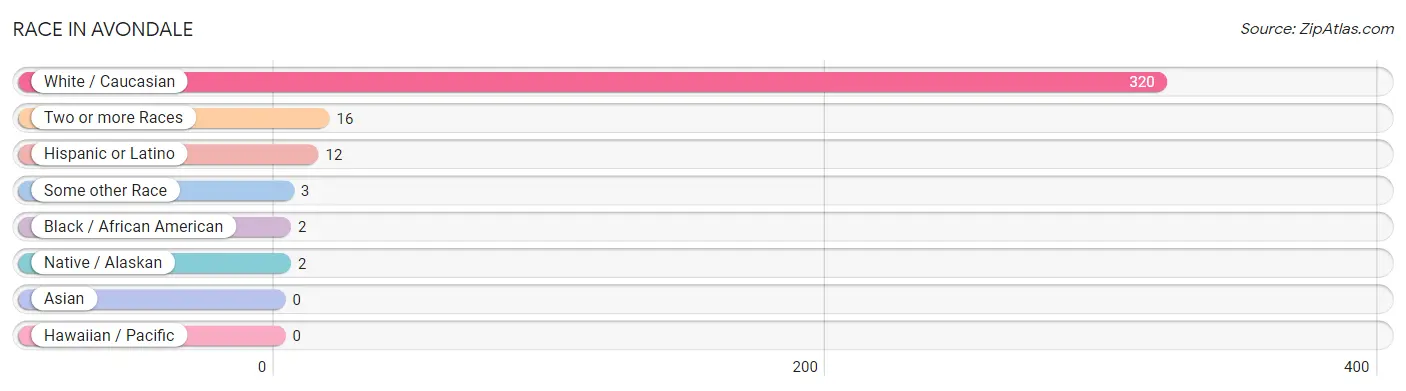
| Race | # Population | % Population |
| Asian | 0 | 0.0% |
| Black / African American | 2 | 0.6% |
| Hawaiian / Pacific | 0 | 0.0% |
| Hispanic or Latino | 12 | 3.5% |
| Native / Alaskan | 2 | 0.6% |
| White / Caucasian | 320 | 93.3% |
| Two or more Races | 16 | 4.7% |
| Some other Race | 3 | 0.9% |
| Total | 343 | 100.0% |
Ancestry in Avondale
The most populous ancestries reported in Avondale are English (69 | 20.1%), Irish (62 | 18.1%), German (52 | 15.2%), American (30 | 8.7%), and French (29 | 8.5%), together accounting for 70.6% of all Avondale residents.
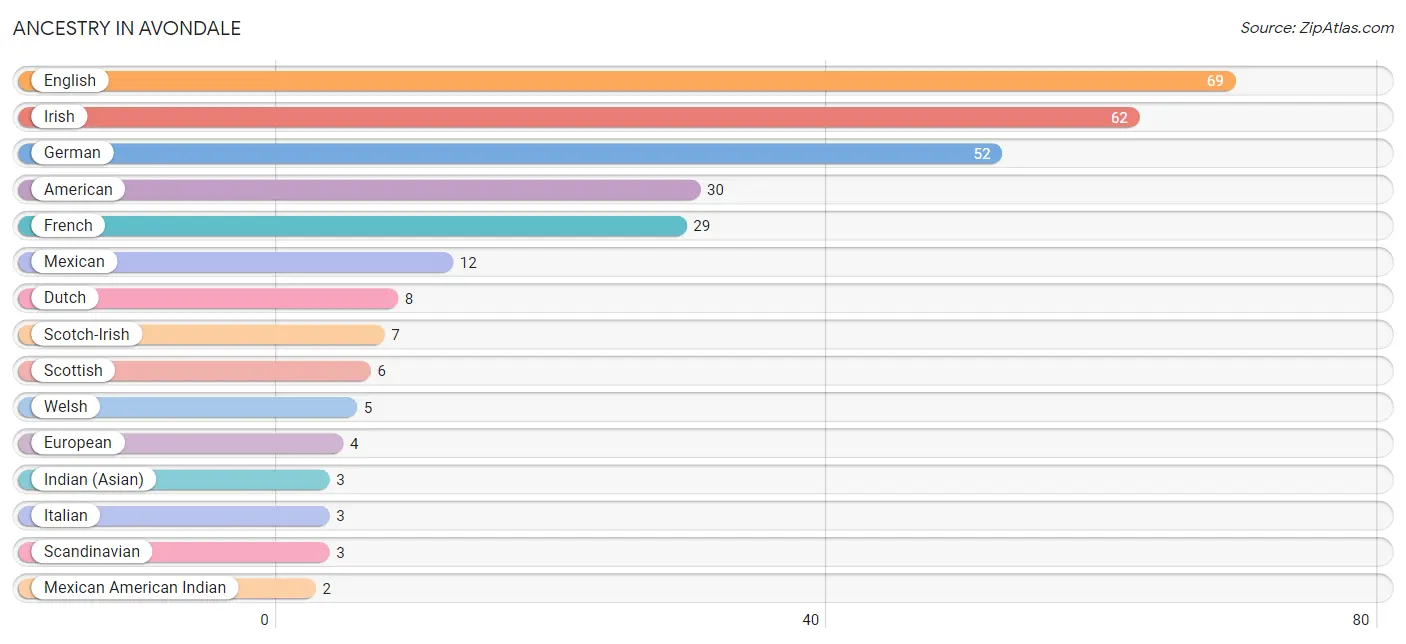
| Ancestry | # Population | % Population |
| American | 30 | 8.7% |
| Arab | 1 | 0.3% |
| Cherokee | 1 | 0.3% |
| Czech | 1 | 0.3% |
| Dutch | 8 | 2.3% |
| English | 69 | 20.1% |
| European | 4 | 1.2% |
| French | 29 | 8.5% |
| German | 52 | 15.2% |
| Greek | 1 | 0.3% |
| Indian (Asian) | 3 | 0.9% |
| Irish | 62 | 18.1% |
| Italian | 3 | 0.9% |
| Mexican | 12 | 3.5% |
| Mexican American Indian | 2 | 0.6% |
| Northern European | 2 | 0.6% |
| Norwegian | 2 | 0.6% |
| Pennsylvania German | 1 | 0.3% |
| Polish | 2 | 0.6% |
| Russian | 2 | 0.6% |
| Scandinavian | 3 | 0.9% |
| Scotch-Irish | 7 | 2.0% |
| Scottish | 6 | 1.8% |
| Welsh | 5 | 1.5% | View All 24 Rows |
Immigrants in Avondale
The most numerous immigrant groups reported in Avondale came from Eastern Europe (2 | 0.6%), Europe (2 | 0.6%), Russia (2 | 0.6%), Central America (1 | 0.3%), and Latin America (1 | 0.3%), together accounting for 2.3% of all Avondale residents.
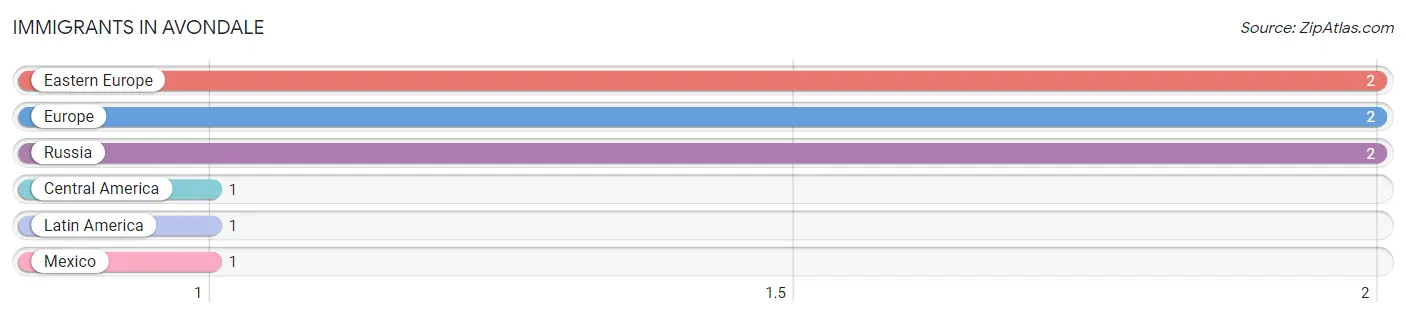
| Immigration Origin | # Population | % Population |
| Central America | 1 | 0.3% |
| Eastern Europe | 2 | 0.6% |
| Europe | 2 | 0.6% |
| Latin America | 1 | 0.3% |
| Mexico | 1 | 0.3% |
| Russia | 2 | 0.6% | View All 6 Rows |
Sex and Age in Avondale
Sex and Age in Avondale
The most populous age groups in Avondale are 10 to 14 Years (20 | 12.5%) for men and 40 to 44 Years (23 | 12.6%) for women.
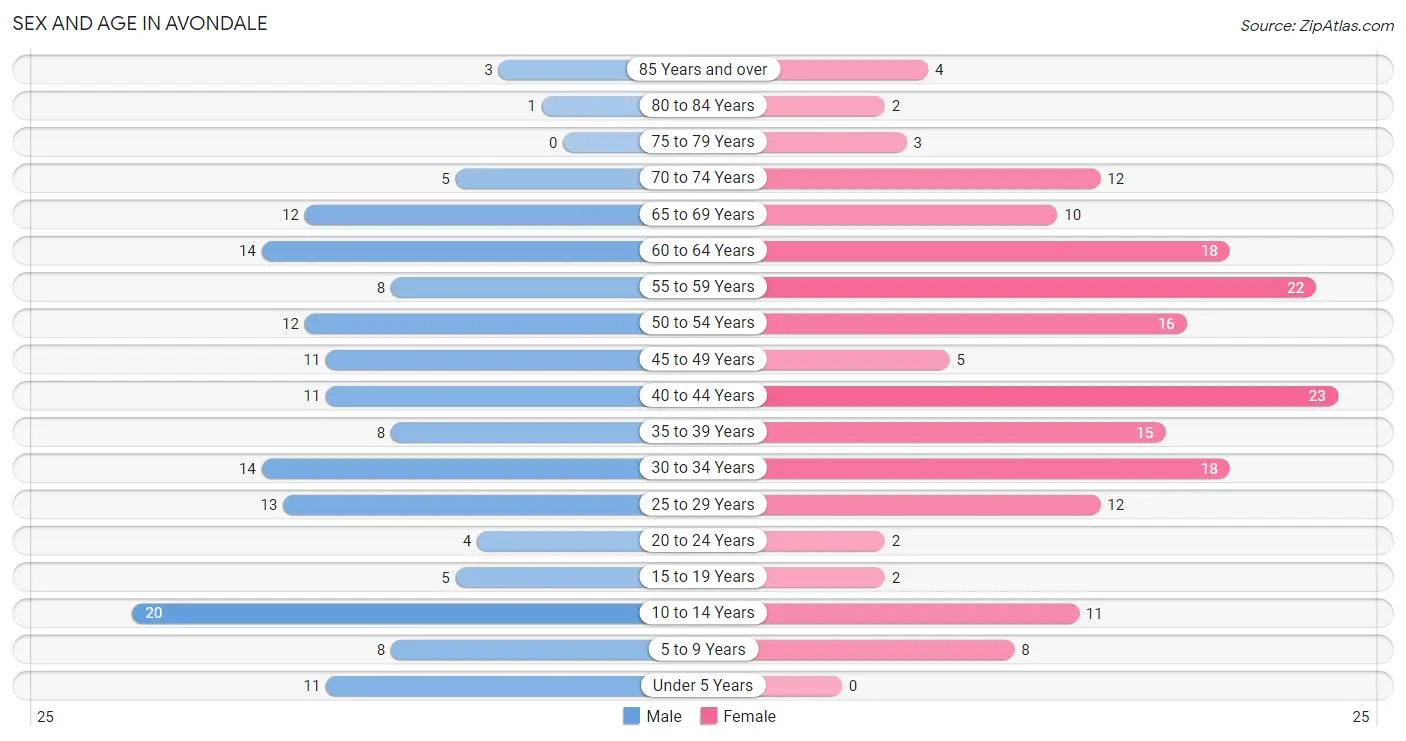
| Age Bracket | Male | Female |
| Under 5 Years | 11 (6.9%) | 0 (0.0%) |
| 5 to 9 Years | 8 (5.0%) | 8 (4.4%) |
| 10 to 14 Years | 20 (12.5%) | 11 (6.0%) |
| 15 to 19 Years | 5 (3.1%) | 2 (1.1%) |
| 20 to 24 Years | 4 (2.5%) | 2 (1.1%) |
| 25 to 29 Years | 13 (8.1%) | 12 (6.6%) |
| 30 to 34 Years | 14 (8.7%) | 18 (9.8%) |
| 35 to 39 Years | 8 (5.0%) | 15 (8.2%) |
| 40 to 44 Years | 11 (6.9%) | 23 (12.6%) |
| 45 to 49 Years | 11 (6.9%) | 5 (2.7%) |
| 50 to 54 Years | 12 (7.5%) | 16 (8.7%) |
| 55 to 59 Years | 8 (5.0%) | 22 (12.0%) |
| 60 to 64 Years | 14 (8.7%) | 18 (9.8%) |
| 65 to 69 Years | 12 (7.5%) | 10 (5.5%) |
| 70 to 74 Years | 5 (3.1%) | 12 (6.6%) |
| 75 to 79 Years | 0 (0.0%) | 3 (1.6%) |
| 80 to 84 Years | 1 (0.6%) | 2 (1.1%) |
| 85 Years and over | 3 (1.9%) | 4 (2.2%) |
| Total | 160 (100.0%) | 183 (100.0%) |
Families and Households in Avondale
Median Family Size in Avondale
The median family size in Avondale is 2.80 persons per family, with single female/mother families (30 | 37.5%) accounting for the largest median family size of 3.03 persons per family. On the other hand, married-couple families (38 | 47.5%) represent the smallest median family size with 2.66 persons per family.
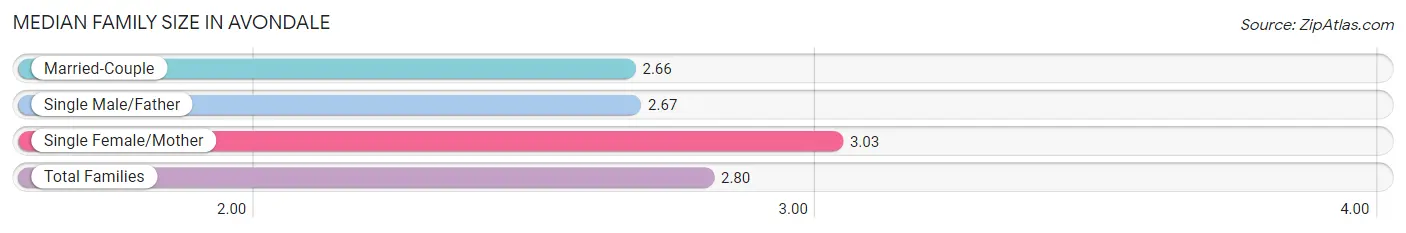
| Family Type | # Families | Family Size |
| Married-Couple | 38 (47.5%) | 2.66 |
| Single Male/Father | 12 (15.0%) | 2.67 |
| Single Female/Mother | 30 (37.5%) | 3.03 |
| Total Families | 80 (100.0%) | 2.80 |
Median Household Size in Avondale
The median household size in Avondale is 2.07 persons per household, with single male/father households (12 | 7.2%) accounting for the largest median household size of 3.25 persons per household. non-family households (86 | 51.8%) represent the smallest median household size with 1.27 persons per household.
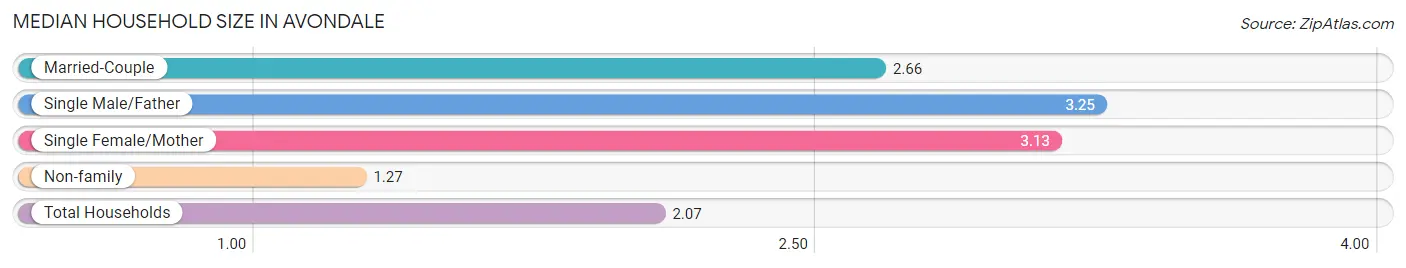
| Household Type | # Households | Household Size |
| Married-Couple | 38 (22.9%) | 2.66 |
| Single Male/Father | 12 (7.2%) | 3.25 |
| Single Female/Mother | 30 (18.1%) | 3.13 |
| Non-family | 86 (51.8%) | 1.27 |
| Total Households | 166 (100.0%) | 2.07 |
Household Size by Marriage Status in Avondale
Out of a total of 166 households in Avondale, 80 (48.2%) are family households, while 86 (51.8%) are nonfamily households. The most numerous type of family households are 2-person households, comprising 37, and the most common type of nonfamily households are 1-person households, comprising 59.
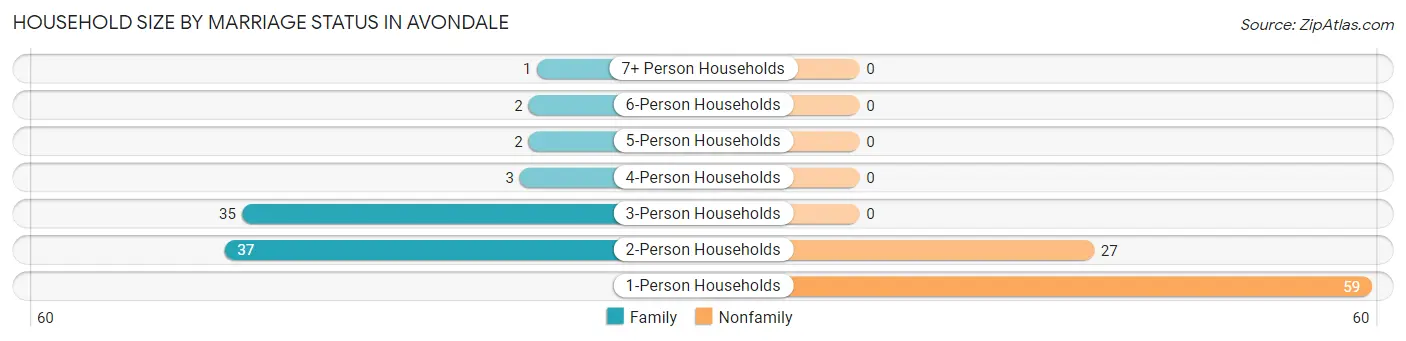
| Household Size | Family Households | Nonfamily Households |
| 1-Person Households | - | 59 (35.5%) |
| 2-Person Households | 37 (22.3%) | 27 (16.3%) |
| 3-Person Households | 35 (21.1%) | 0 (0.0%) |
| 4-Person Households | 3 (1.8%) | 0 (0.0%) |
| 5-Person Households | 2 (1.2%) | 0 (0.0%) |
| 6-Person Households | 2 (1.2%) | 0 (0.0%) |
| 7+ Person Households | 1 (0.6%) | 0 (0.0%) |
| Total | 80 (48.2%) | 86 (51.8%) |
Female Fertility in Avondale
Fertility by Age in Avondale
| Age Bracket | Women with Births | Births / 1,000 Women |
| 15 to 19 years | 0 (0.0%) | 0.0 |
| 20 to 34 years | 0 (0.0%) | 0.0 |
| 35 to 50 years | 0 (0.0%) | 0.0 |
| Total | 0 (0.0%) | 0.0 |
Fertility by Age by Marriage Status in Avondale
| Age Bracket | Married | Unmarried |
| 15 to 19 years | 0 (0.0%) | 0 (0.0%) |
| 20 to 34 years | 0 (0.0%) | 0 (0.0%) |
| 35 to 50 years | 0 (0.0%) | 0 (0.0%) |
| Total | 0 (0.0%) | 0 (0.0%) |
Fertility by Education in Avondale
| Educational Attainment | Women with Births | Births / 1,000 Women |
| Less than High School | 0 (0.0%) | 0.0 |
| High School Diploma | 0 (0.0%) | 0.0 |
| College or Associate's Degree | 0 (0.0%) | 0.0 |
| Bachelor's Degree | 0 (0.0%) | 0.0 |
| Graduate Degree | 0 (0.0%) | 0.0 |
| Total | 0 (0.0%) | 0.0 |
Fertility by Education by Marriage Status in Avondale
| Educational Attainment | Married | Unmarried |
| Less than High School | 0 (0.0%) | 0 (0.0%) |
| High School Diploma | 0 (0.0%) | 0 (0.0%) |
| College or Associate's Degree | 0 (0.0%) | 0 (0.0%) |
| Bachelor's Degree | 0 (0.0%) | 0 (0.0%) |
| Graduate Degree | 0 (0.0%) | 0 (0.0%) |
| Total | 0 (0.0%) | 0 (0.0%) |
Employment Characteristics in Avondale
Employment by Class of Employer in Avondale
Among the 173 employed individuals in Avondale, private company employees (121 | 69.9%), not-for-profit organizations (12 | 6.9%), and unpaid family workers (12 | 6.9%) make up the most common classes of employment.
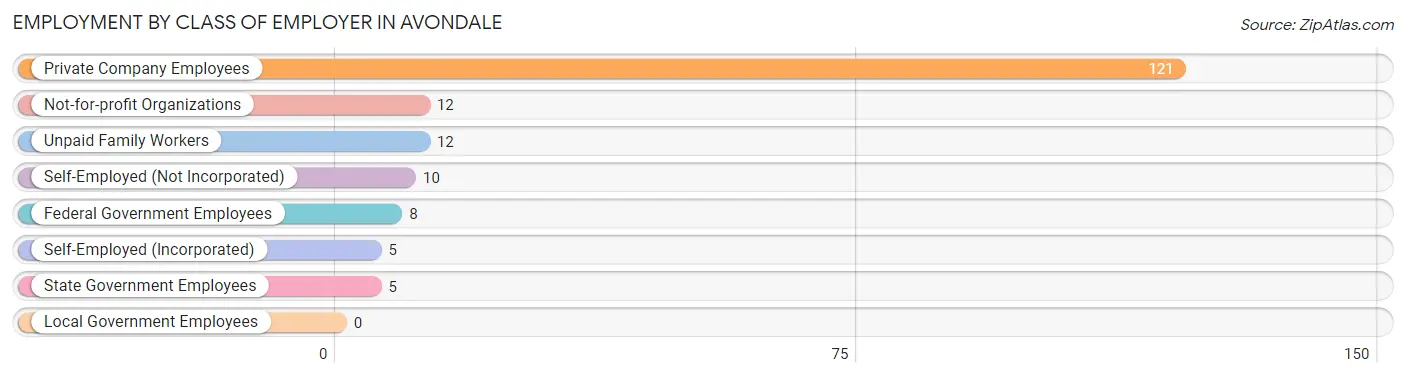
| Employer Class | # Employees | % Employees |
| Private Company Employees | 121 | 69.9% |
| Self-Employed (Incorporated) | 5 | 2.9% |
| Self-Employed (Not Incorporated) | 10 | 5.8% |
| Not-for-profit Organizations | 12 | 6.9% |
| Local Government Employees | 0 | 0.0% |
| State Government Employees | 5 | 2.9% |
| Federal Government Employees | 8 | 4.6% |
| Unpaid Family Workers | 12 | 6.9% |
| Total | 173 | 100.0% |
Employment Status by Age in Avondale
According to the labor force statistics for Avondale, out of the total population over 16 years of age (283), 65.0% or 184 individuals are in the labor force, with 4.9% or 9 of them unemployed. The age group with the highest labor force participation rate is 20 to 24 years, with 100.0% or 6 individuals in the labor force. Within the labor force, the 25 to 29 years age range has the highest percentage of unemployed individuals, with 28.0% or 7 of them being unemployed.
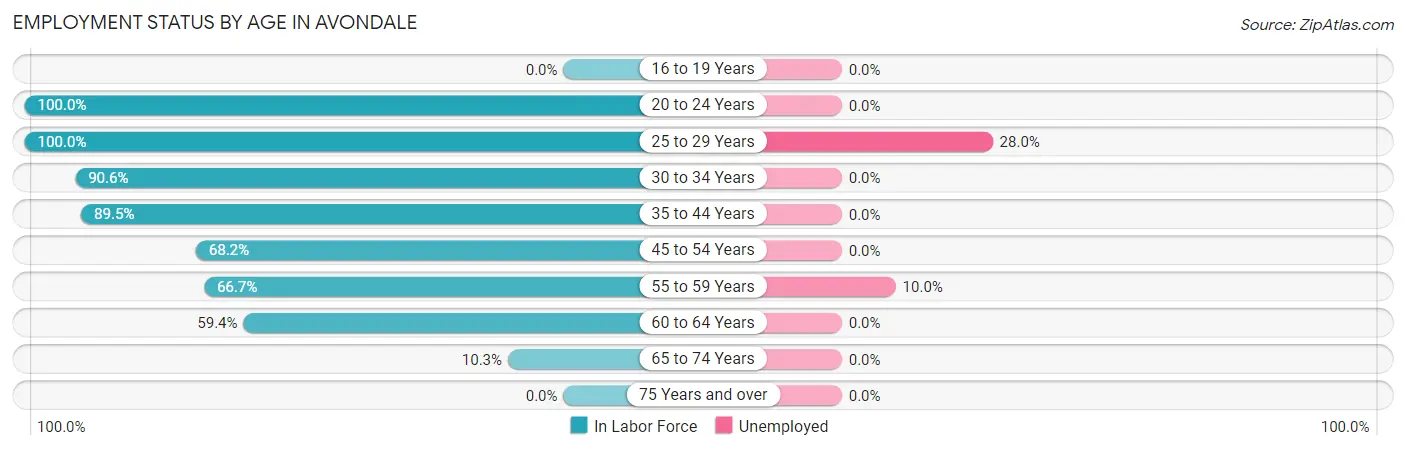
| Age Bracket | In Labor Force | Unemployed |
| 16 to 19 Years | 0 (0.0%) | 0 (0.0%) |
| 20 to 24 Years | 6 (100.0%) | 0 (0.0%) |
| 25 to 29 Years | 25 (100.0%) | 7 (28.0%) |
| 30 to 34 Years | 29 (90.6%) | 0 (0.0%) |
| 35 to 44 Years | 51 (89.5%) | 0 (0.0%) |
| 45 to 54 Years | 30 (68.2%) | 0 (0.0%) |
| 55 to 59 Years | 20 (66.7%) | 2 (10.0%) |
| 60 to 64 Years | 19 (59.4%) | 0 (0.0%) |
| 65 to 74 Years | 4 (10.3%) | 0 (0.0%) |
| 75 Years and over | 0 (0.0%) | 0 (0.0%) |
| Total | 184 (65.0%) | 9 (4.9%) |
Employment Status by Educational Attainment in Avondale
According to labor force statistics for Avondale, 79.1% of individuals (174) out of the total population between 25 and 64 years of age (220) are in the labor force, with 5.2% or 9 of them being unemployed. The group with the highest labor force participation rate are those with the educational attainment of college / associate degree, with 89.9% or 89 individuals in the labor force. Within the labor force, individuals with college / associate degree education have the highest percentage of unemployment, with 7.9% or 7 of them being unemployed.
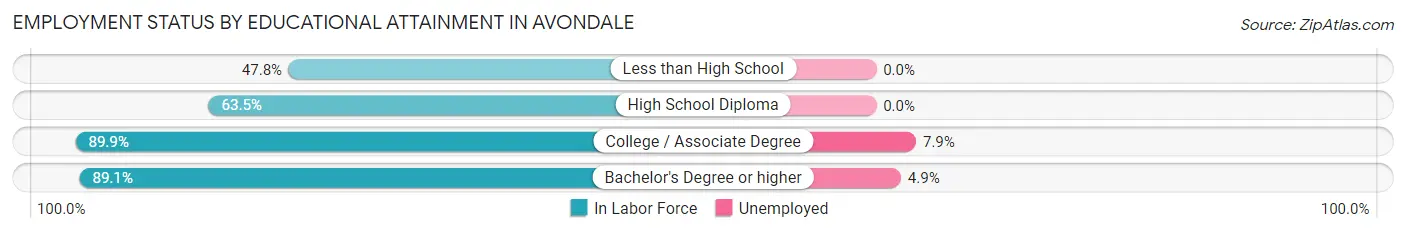
| Educational Attainment | In Labor Force | Unemployed |
| Less than High School | 11 (47.8%) | 0 (0.0%) |
| High School Diploma | 33 (63.5%) | 0 (0.0%) |
| College / Associate Degree | 89 (89.9%) | 8 (7.9%) |
| Bachelor's Degree or higher | 41 (89.1%) | 2 (4.9%) |
| Total | 174 (79.1%) | 11 (5.2%) |
Employment Occupations by Sex in Avondale
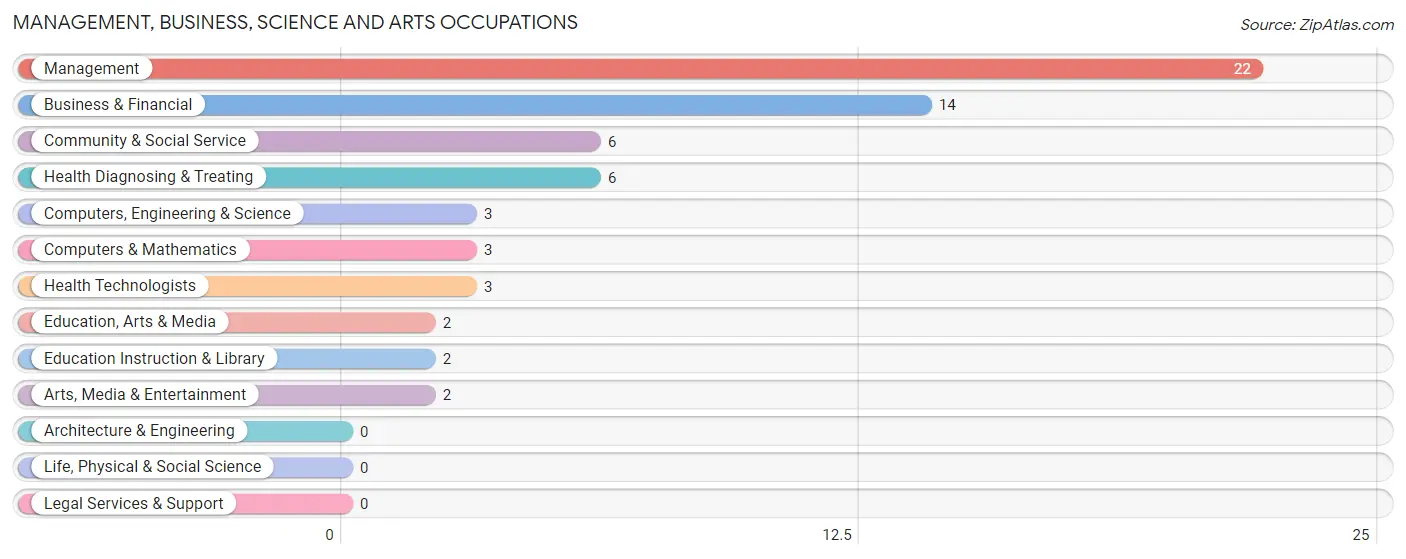
Management, Business, Science and Arts Occupations
The most common Management, Business, Science and Arts occupations in Avondale are Management (22 | 12.6%), Business & Financial (14 | 8.0%), Community & Social Service (6 | 3.4%), Health Diagnosing & Treating (6 | 3.4%), and Computers, Engineering & Science (3 | 1.7%).
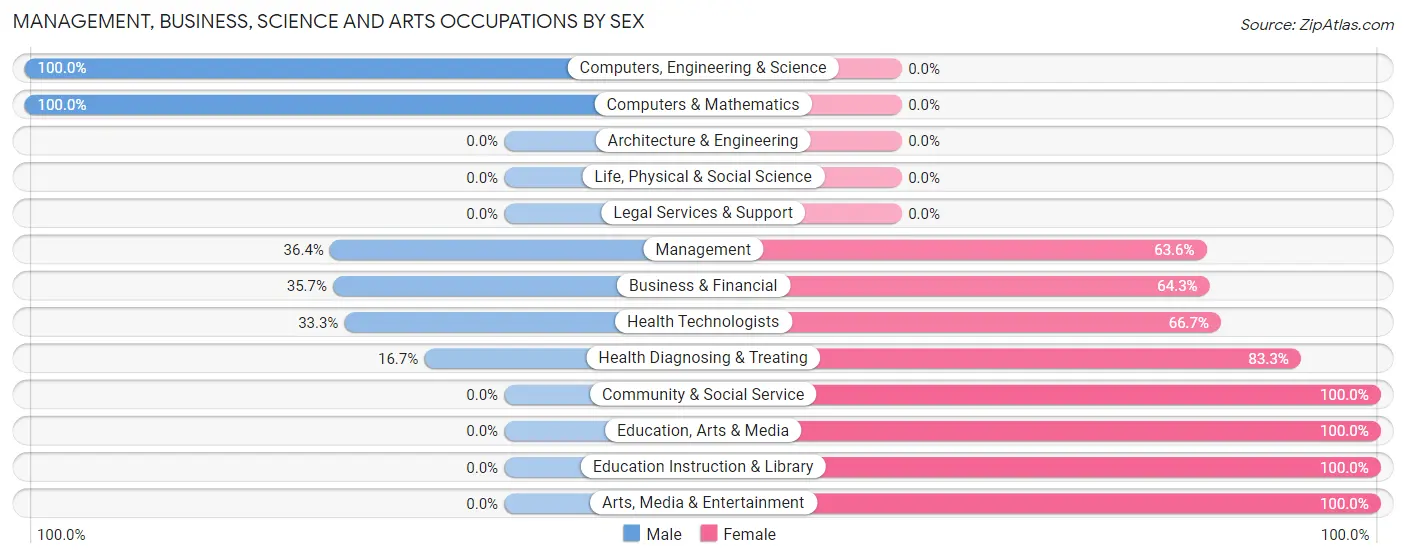
Management, Business, Science and Arts Occupations by Sex
Within the Management, Business, Science and Arts occupations in Avondale, the most male-oriented occupations are Computers, Engineering & Science (100.0%), Computers & Mathematics (100.0%), and Management (36.4%), while the most female-oriented occupations are Community & Social Service (100.0%), Education, Arts & Media (100.0%), and Education Instruction & Library (100.0%).
| Occupation | Male | Female |
| Management | 8 (36.4%) | 14 (63.6%) |
| Business & Financial | 5 (35.7%) | 9 (64.3%) |
| Computers, Engineering & Science | 3 (100.0%) | 0 (0.0%) |
| Computers & Mathematics | 3 (100.0%) | 0 (0.0%) |
| Architecture & Engineering | 0 (0.0%) | 0 (0.0%) |
| Life, Physical & Social Science | 0 (0.0%) | 0 (0.0%) |
| Community & Social Service | 0 (0.0%) | 6 (100.0%) |
| Education, Arts & Media | 0 (0.0%) | 2 (100.0%) |
| Legal Services & Support | 0 (0.0%) | 0 (0.0%) |
| Education Instruction & Library | 0 (0.0%) | 2 (100.0%) |
| Arts, Media & Entertainment | 0 (0.0%) | 2 (100.0%) |
| Health Diagnosing & Treating | 1 (16.7%) | 5 (83.3%) |
| Health Technologists | 1 (33.3%) | 2 (66.7%) |
| Total (Category) | 17 (33.3%) | 34 (66.7%) |
| Total (Overall) | 80 (45.7%) | 95 (54.3%) |
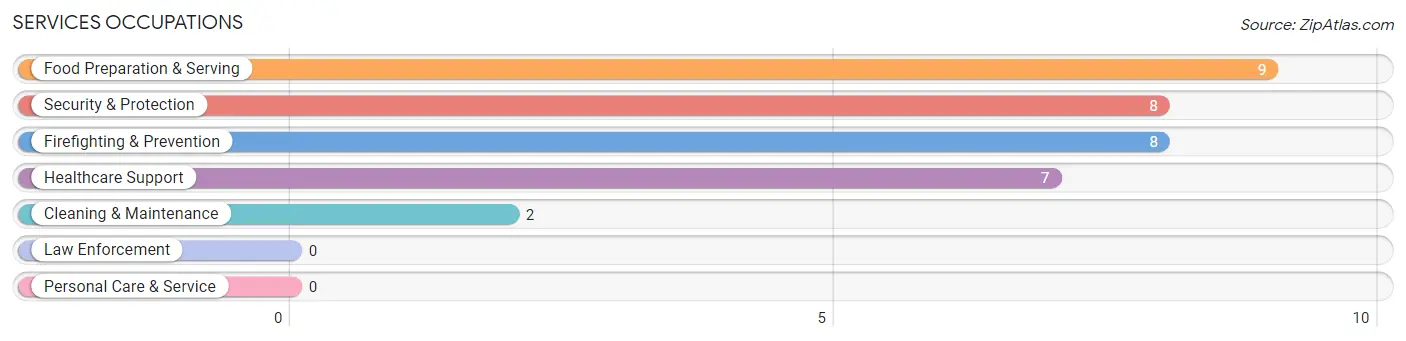
Services Occupations
The most common Services occupations in Avondale are Food Preparation & Serving (9 | 5.1%), Security & Protection (8 | 4.6%), Firefighting & Prevention (8 | 4.6%), Healthcare Support (7 | 4.0%), and Cleaning & Maintenance (2 | 1.1%).
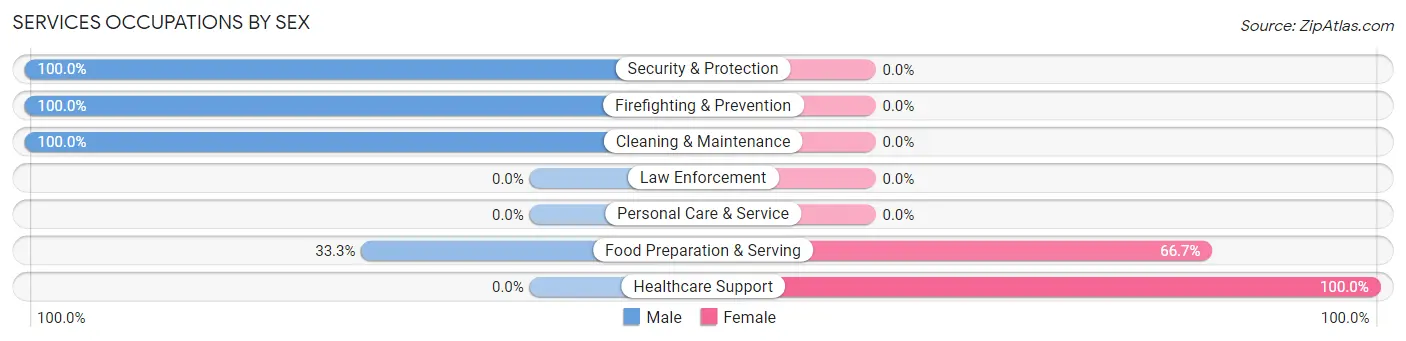
Services Occupations by Sex
Within the Services occupations in Avondale, the most male-oriented occupations are Security & Protection (100.0%), Firefighting & Prevention (100.0%), and Cleaning & Maintenance (100.0%), while the most female-oriented occupations are Healthcare Support (100.0%), and Food Preparation & Serving (66.7%).
| Occupation | Male | Female |
| Healthcare Support | 0 (0.0%) | 7 (100.0%) |
| Security & Protection | 8 (100.0%) | 0 (0.0%) |
| Firefighting & Prevention | 8 (100.0%) | 0 (0.0%) |
| Law Enforcement | 0 (0.0%) | 0 (0.0%) |
| Food Preparation & Serving | 3 (33.3%) | 6 (66.7%) |
| Cleaning & Maintenance | 2 (100.0%) | 0 (0.0%) |
| Personal Care & Service | 0 (0.0%) | 0 (0.0%) |
| Total (Category) | 13 (50.0%) | 13 (50.0%) |
| Total (Overall) | 80 (45.7%) | 95 (54.3%) |
Sales and Office Occupations
The most common Sales and Office occupations in Avondale are Office & Administration (29 | 16.6%), and Sales & Related (20 | 11.4%).
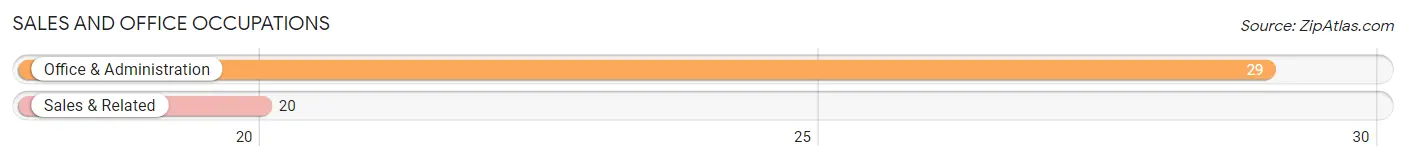
Sales and Office Occupations by Sex
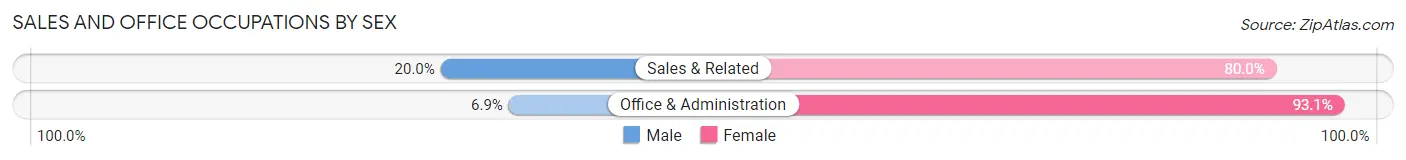
| Occupation | Male | Female |
| Sales & Related | 4 (20.0%) | 16 (80.0%) |
| Office & Administration | 2 (6.9%) | 27 (93.1%) |
| Total (Category) | 6 (12.2%) | 43 (87.8%) |
| Total (Overall) | 80 (45.7%) | 95 (54.3%) |
Natural Resources, Construction and Maintenance Occupations
The most common Natural Resources, Construction and Maintenance occupations in Avondale are Construction & Extraction (21 | 12.0%), and Installation, Maintenance & Repair (6 | 3.4%).
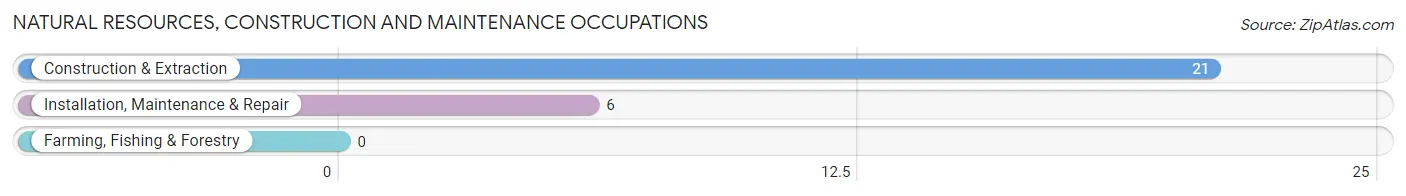
Natural Resources, Construction and Maintenance Occupations by Sex
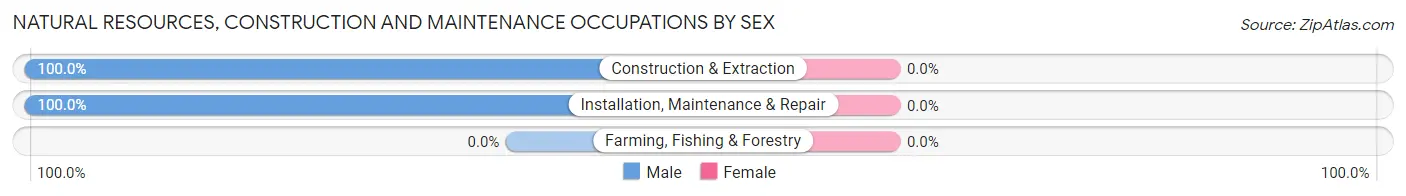
| Occupation | Male | Female |
| Farming, Fishing & Forestry | 0 (0.0%) | 0 (0.0%) |
| Construction & Extraction | 21 (100.0%) | 0 (0.0%) |
| Installation, Maintenance & Repair | 6 (100.0%) | 0 (0.0%) |
| Total (Category) | 27 (100.0%) | 0 (0.0%) |
| Total (Overall) | 80 (45.7%) | 95 (54.3%) |
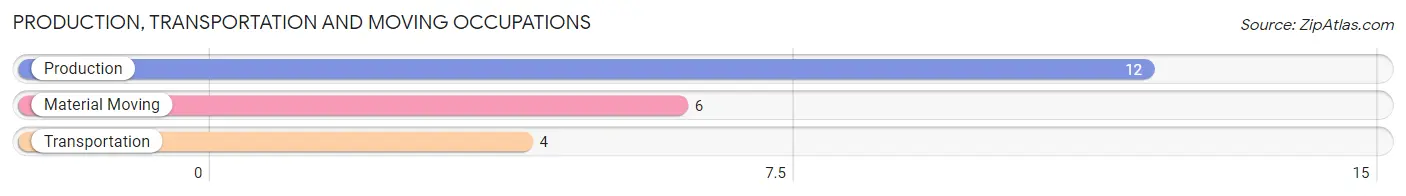
Production, Transportation and Moving Occupations
The most common Production, Transportation and Moving occupations in Avondale are Production (12 | 6.9%), Material Moving (6 | 3.4%), and Transportation (4 | 2.3%).
Production, Transportation and Moving Occupations by Sex
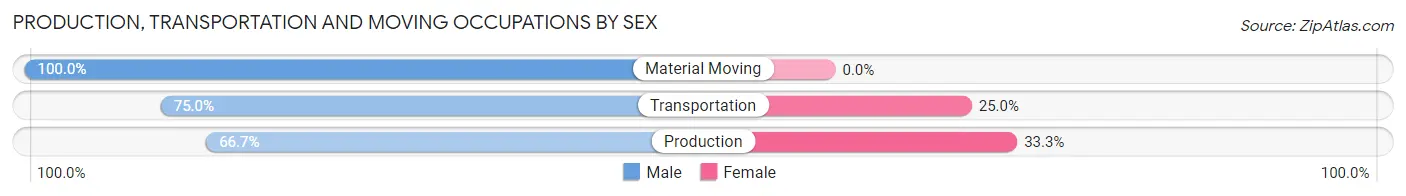
| Occupation | Male | Female |
| Production | 8 (66.7%) | 4 (33.3%) |
| Transportation | 3 (75.0%) | 1 (25.0%) |
| Material Moving | 6 (100.0%) | 0 (0.0%) |
| Total (Category) | 17 (77.3%) | 5 (22.7%) |
| Total (Overall) | 80 (45.7%) | 95 (54.3%) |
Employment Industries by Sex in Avondale
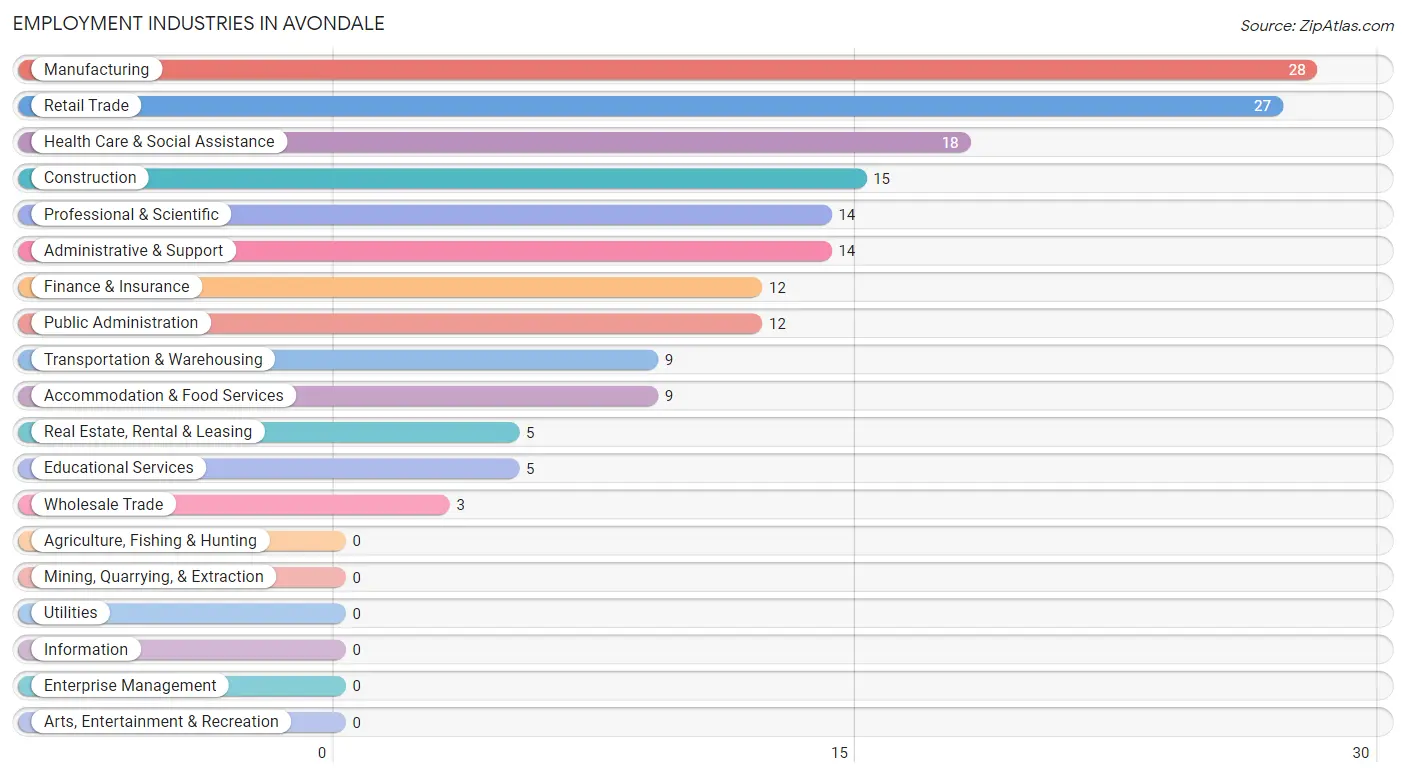
Employment Industries in Avondale
The major employment industries in Avondale include Manufacturing (28 | 16.0%), Retail Trade (27 | 15.4%), Health Care & Social Assistance (18 | 10.3%), Construction (15 | 8.6%), and Professional & Scientific (14 | 8.0%).
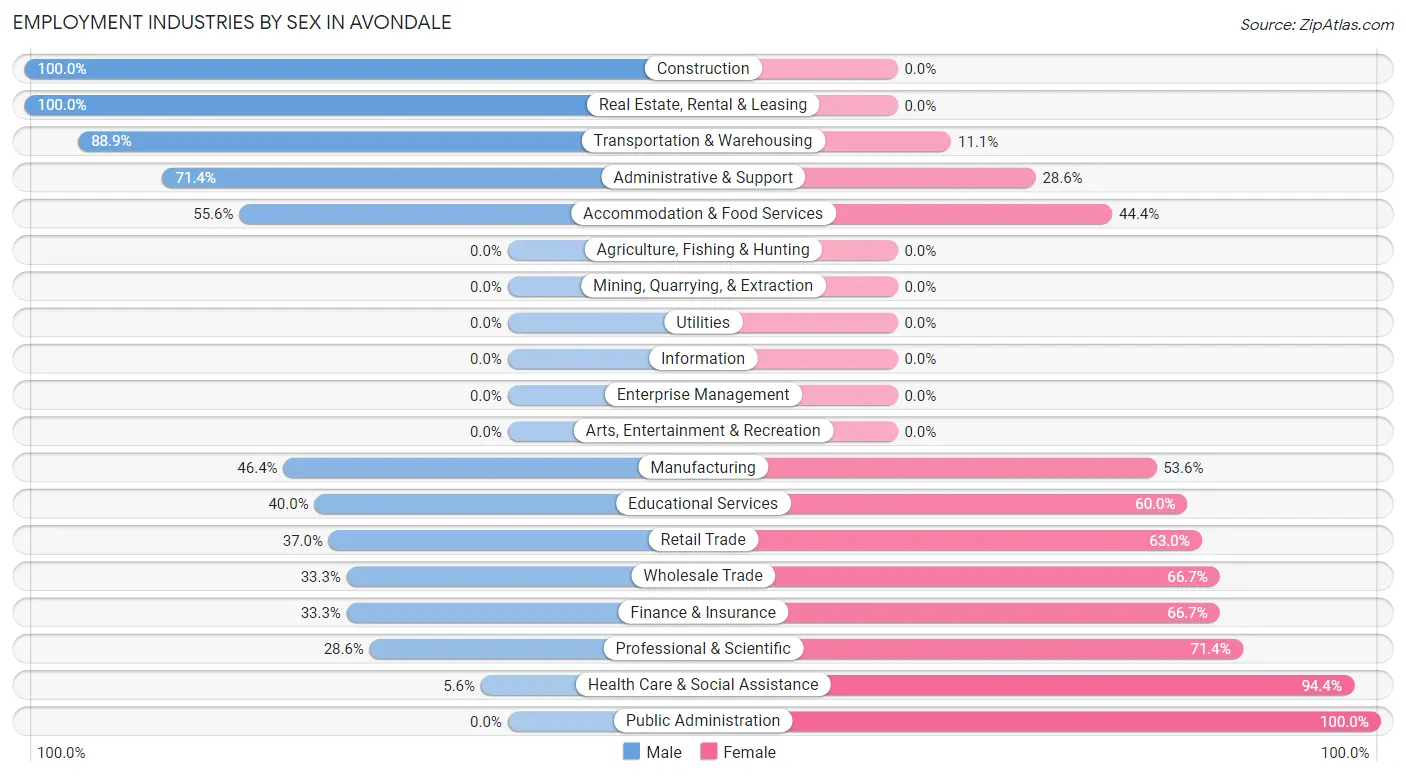
Employment Industries by Sex in Avondale
The Avondale industries that see more men than women are Construction (100.0%), Real Estate, Rental & Leasing (100.0%), and Transportation & Warehousing (88.9%), whereas the industries that tend to have a higher number of women are Public Administration (100.0%), Health Care & Social Assistance (94.4%), and Professional & Scientific (71.4%).
| Industry | Male | Female |
| Agriculture, Fishing & Hunting | 0 (0.0%) | 0 (0.0%) |
| Mining, Quarrying, & Extraction | 0 (0.0%) | 0 (0.0%) |
| Construction | 15 (100.0%) | 0 (0.0%) |
| Manufacturing | 13 (46.4%) | 15 (53.6%) |
| Wholesale Trade | 1 (33.3%) | 2 (66.7%) |
| Retail Trade | 10 (37.0%) | 17 (63.0%) |
| Transportation & Warehousing | 8 (88.9%) | 1 (11.1%) |
| Utilities | 0 (0.0%) | 0 (0.0%) |
| Information | 0 (0.0%) | 0 (0.0%) |
| Finance & Insurance | 4 (33.3%) | 8 (66.7%) |
| Real Estate, Rental & Leasing | 5 (100.0%) | 0 (0.0%) |
| Professional & Scientific | 4 (28.6%) | 10 (71.4%) |
| Enterprise Management | 0 (0.0%) | 0 (0.0%) |
| Administrative & Support | 10 (71.4%) | 4 (28.6%) |
| Educational Services | 2 (40.0%) | 3 (60.0%) |
| Health Care & Social Assistance | 1 (5.6%) | 17 (94.4%) |
| Arts, Entertainment & Recreation | 0 (0.0%) | 0 (0.0%) |
| Accommodation & Food Services | 5 (55.6%) | 4 (44.4%) |
| Public Administration | 0 (0.0%) | 12 (100.0%) |
| Total | 80 (45.7%) | 95 (54.3%) |
Education in Avondale
School Enrollment in Avondale
The most common levels of schooling among the 56 students in Avondale are middle school (29 | 51.8%), elementary school (18 | 32.1%), and high school (7 | 12.5%).
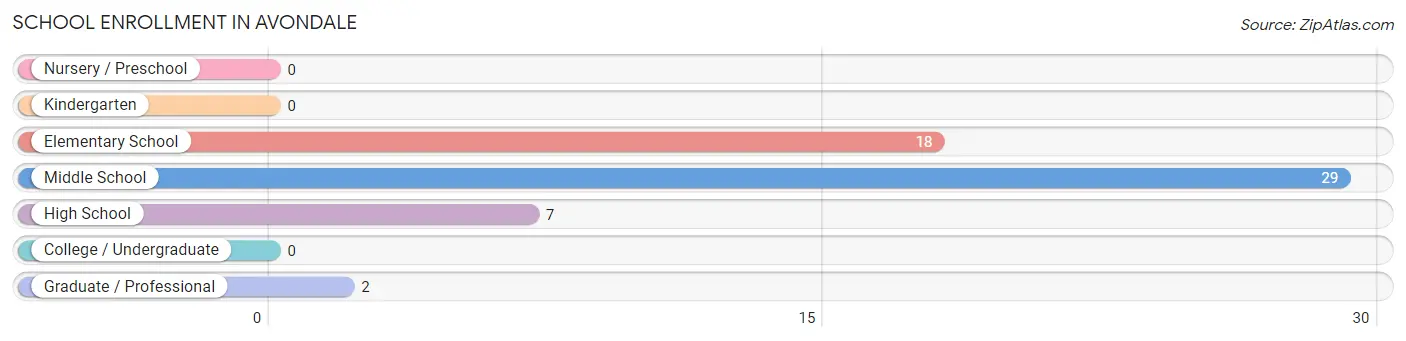
| School Level | # Students | % Students |
| Nursery / Preschool | 0 | 0.0% |
| Kindergarten | 0 | 0.0% |
| Elementary School | 18 | 32.1% |
| Middle School | 29 | 51.8% |
| High School | 7 | 12.5% |
| College / Undergraduate | 0 | 0.0% |
| Graduate / Professional | 2 | 3.6% |
| Total | 56 | 100.0% |
School Enrollment by Age by Funding Source in Avondale
Out of a total of 56 students who are enrolled in schools in Avondale, 3 (5.4%) attend a private institution, while the remaining 53 (94.6%) are enrolled in public schools. The age group of 18 to 19 year olds has the highest likelihood of being enrolled in private schools, with 2 (100.0% in the age bracket) enrolled. Conversely, the age group of 5 to 9 year old has the lowest likelihood of being enrolled in a private school, with 16 (100.0% in the age bracket) attending a public institution.
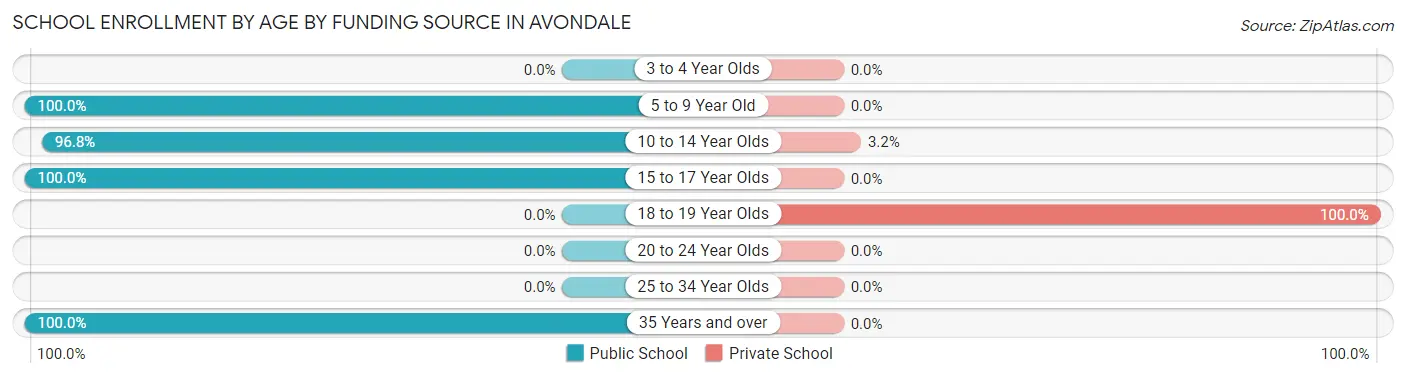
| Age Bracket | Public School | Private School |
| 3 to 4 Year Olds | 0 (0.0%) | 0 (0.0%) |
| 5 to 9 Year Old | 16 (100.0%) | 0 (0.0%) |
| 10 to 14 Year Olds | 30 (96.8%) | 1 (3.2%) |
| 15 to 17 Year Olds | 5 (100.0%) | 0 (0.0%) |
| 18 to 19 Year Olds | 0 (0.0%) | 2 (100.0%) |
| 20 to 24 Year Olds | 0 (0.0%) | 0 (0.0%) |
| 25 to 34 Year Olds | 0 (0.0%) | 0 (0.0%) |
| 35 Years and over | 2 (100.0%) | 0 (0.0%) |
| Total | 53 (94.6%) | 3 (5.4%) |
Educational Attainment by Field of Study in Avondale
Arts & humanities (15 | 26.8%), bio, nature & agricultural (10 | 17.9%), business (8 | 14.3%), education (5 | 8.9%), and psychology (4 | 7.1%) are the most common fields of study among 56 individuals in Avondale who have obtained a bachelor's degree or higher.
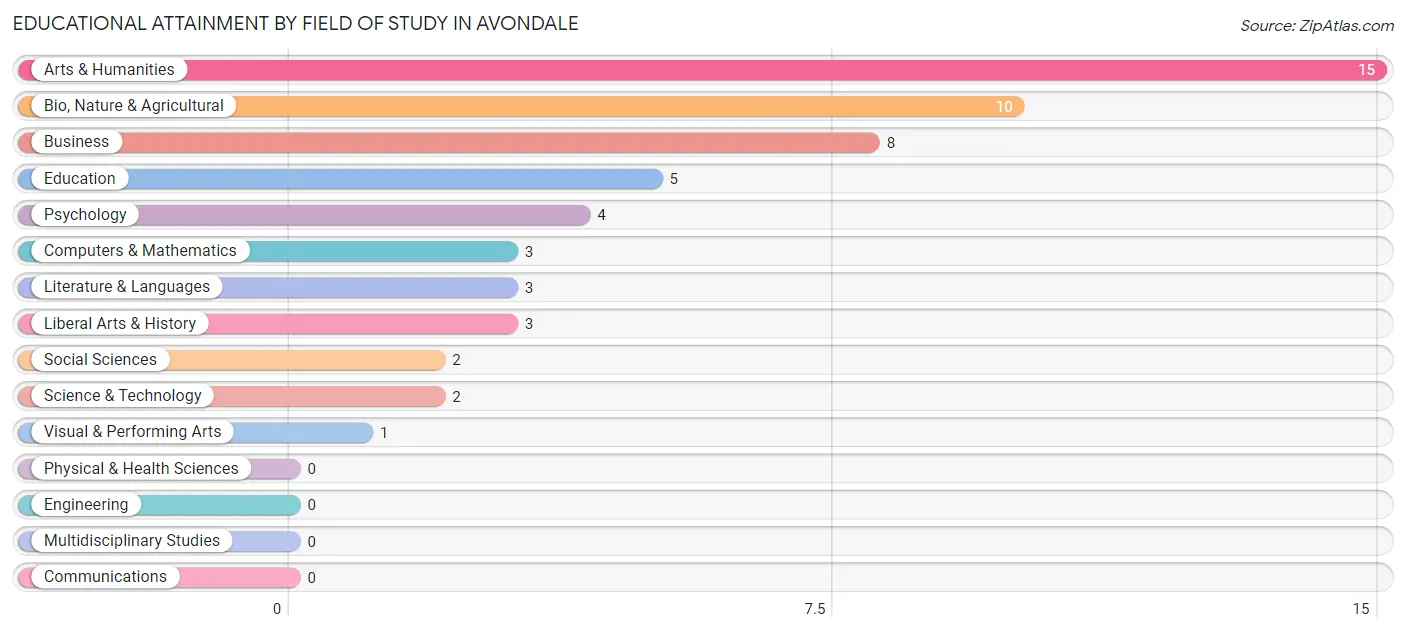
| Field of Study | # Graduates | % Graduates |
| Computers & Mathematics | 3 | 5.4% |
| Bio, Nature & Agricultural | 10 | 17.9% |
| Physical & Health Sciences | 0 | 0.0% |
| Psychology | 4 | 7.1% |
| Social Sciences | 2 | 3.6% |
| Engineering | 0 | 0.0% |
| Multidisciplinary Studies | 0 | 0.0% |
| Science & Technology | 2 | 3.6% |
| Business | 8 | 14.3% |
| Education | 5 | 8.9% |
| Literature & Languages | 3 | 5.4% |
| Liberal Arts & History | 3 | 5.4% |
| Visual & Performing Arts | 1 | 1.8% |
| Communications | 0 | 0.0% |
| Arts & Humanities | 15 | 26.8% |
| Total | 56 | 100.0% |
Transportation & Commute in Avondale
Vehicle Availability by Sex in Avondale
The most prevalent vehicle ownership categories in Avondale are males with 2 vehicles (42, accounting for 53.8%) and females with 2 vehicles (40, making up 44.2%).
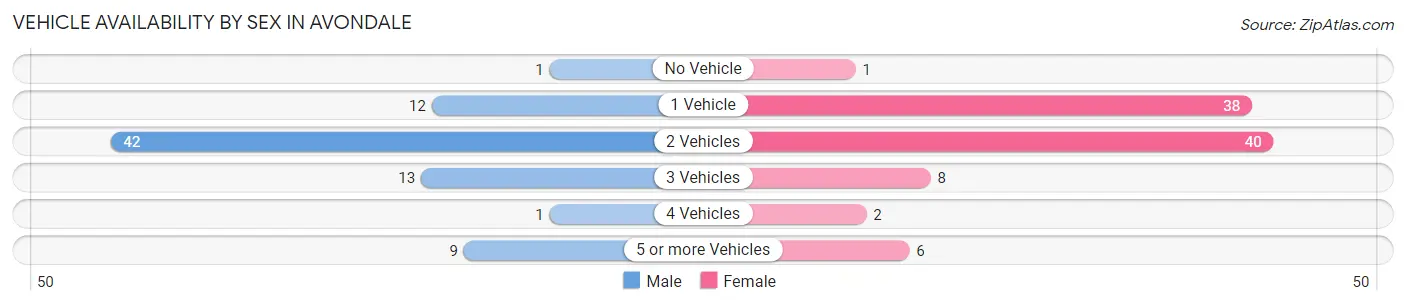
| Vehicles Available | Male | Female |
| No Vehicle | 1 (1.3%) | 1 (1.1%) |
| 1 Vehicle | 12 (15.4%) | 38 (40.0%) |
| 2 Vehicles | 42 (53.8%) | 40 (42.1%) |
| 3 Vehicles | 13 (16.7%) | 8 (8.4%) |
| 4 Vehicles | 1 (1.3%) | 2 (2.1%) |
| 5 or more Vehicles | 9 (11.5%) | 6 (6.3%) |
| Total | 78 (100.0%) | 95 (100.0%) |
Commute Time in Avondale
The most frequently occuring commute durations in Avondale are 15 to 19 minutes (39 commuters, 29.5%), 20 to 24 minutes (26 commuters, 19.7%), and 30 to 34 minutes (24 commuters, 18.2%).
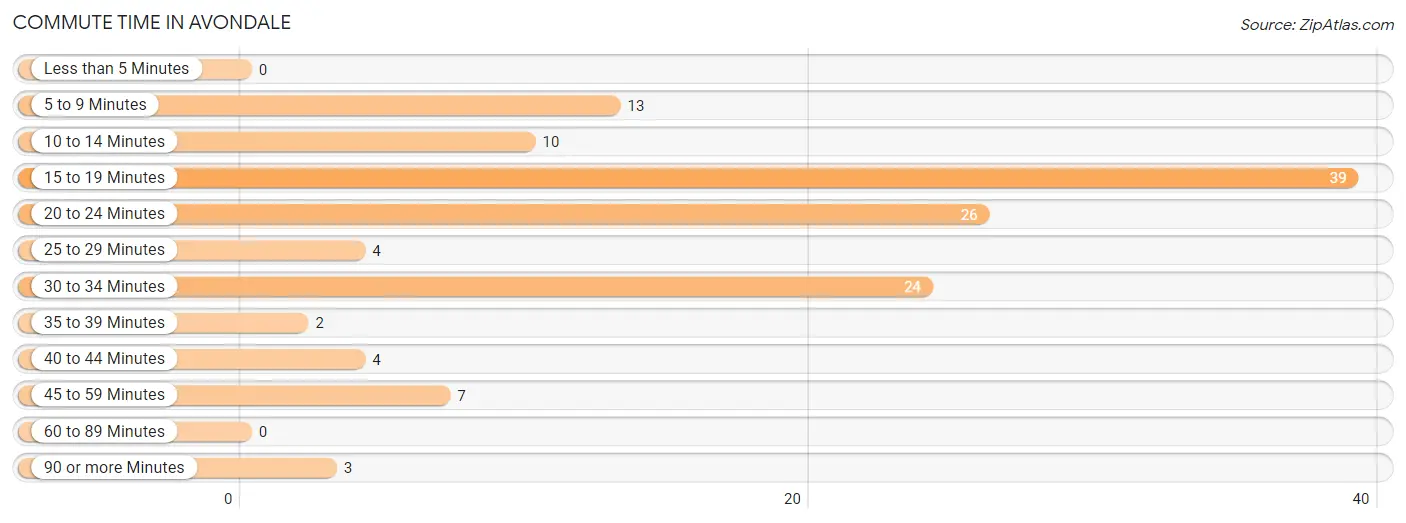
| Commute Time | # Commuters | % Commuters |
| Less than 5 Minutes | 0 | 0.0% |
| 5 to 9 Minutes | 13 | 9.9% |
| 10 to 14 Minutes | 10 | 7.6% |
| 15 to 19 Minutes | 39 | 29.5% |
| 20 to 24 Minutes | 26 | 19.7% |
| 25 to 29 Minutes | 4 | 3.0% |
| 30 to 34 Minutes | 24 | 18.2% |
| 35 to 39 Minutes | 2 | 1.5% |
| 40 to 44 Minutes | 4 | 3.0% |
| 45 to 59 Minutes | 7 | 5.3% |
| 60 to 89 Minutes | 0 | 0.0% |
| 90 or more Minutes | 3 | 2.3% |
Commute Time by Sex in Avondale
The most common commute times in Avondale are 20 to 24 minutes (21 commuters, 31.8%) for males and 15 to 19 minutes (22 commuters, 33.3%) for females.
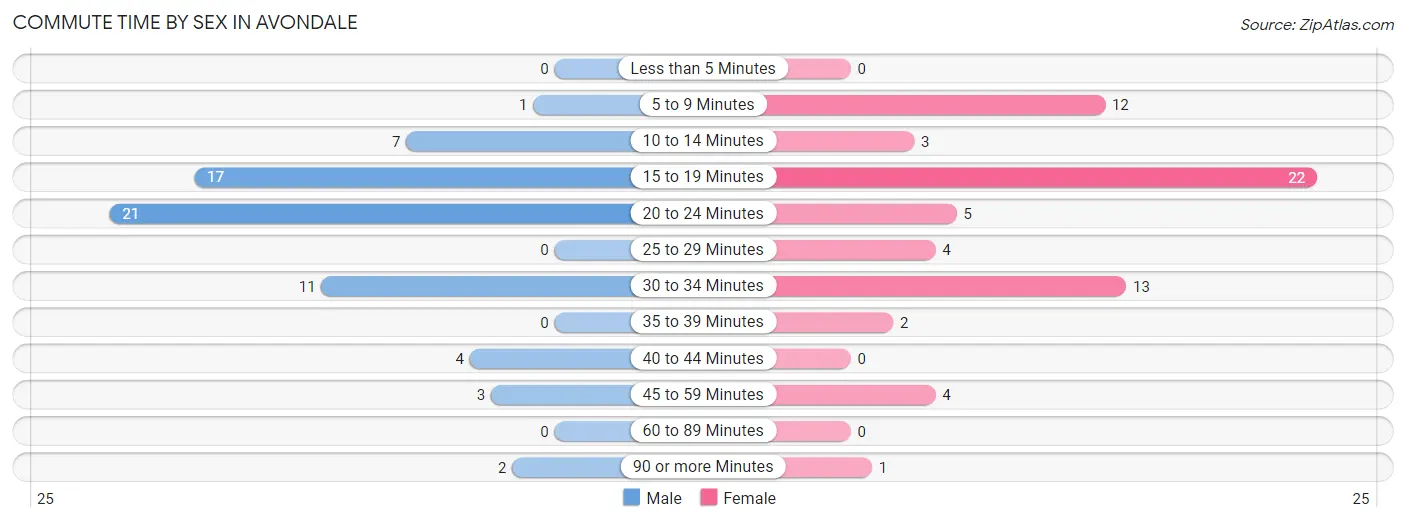
| Commute Time | Male | Female |
| Less than 5 Minutes | 0 (0.0%) | 0 (0.0%) |
| 5 to 9 Minutes | 1 (1.5%) | 12 (18.2%) |
| 10 to 14 Minutes | 7 (10.6%) | 3 (4.5%) |
| 15 to 19 Minutes | 17 (25.8%) | 22 (33.3%) |
| 20 to 24 Minutes | 21 (31.8%) | 5 (7.6%) |
| 25 to 29 Minutes | 0 (0.0%) | 4 (6.1%) |
| 30 to 34 Minutes | 11 (16.7%) | 13 (19.7%) |
| 35 to 39 Minutes | 0 (0.0%) | 2 (3.0%) |
| 40 to 44 Minutes | 4 (6.1%) | 0 (0.0%) |
| 45 to 59 Minutes | 3 (4.5%) | 4 (6.1%) |
| 60 to 89 Minutes | 0 (0.0%) | 0 (0.0%) |
| 90 or more Minutes | 2 (3.0%) | 1 (1.5%) |
Time of Departure to Work by Sex in Avondale
The most frequent times of departure to work in Avondale are 5:30 AM to 5:59 AM (11, 16.7%) for males and 7:00 AM to 7:29 AM (12, 18.2%) for females.
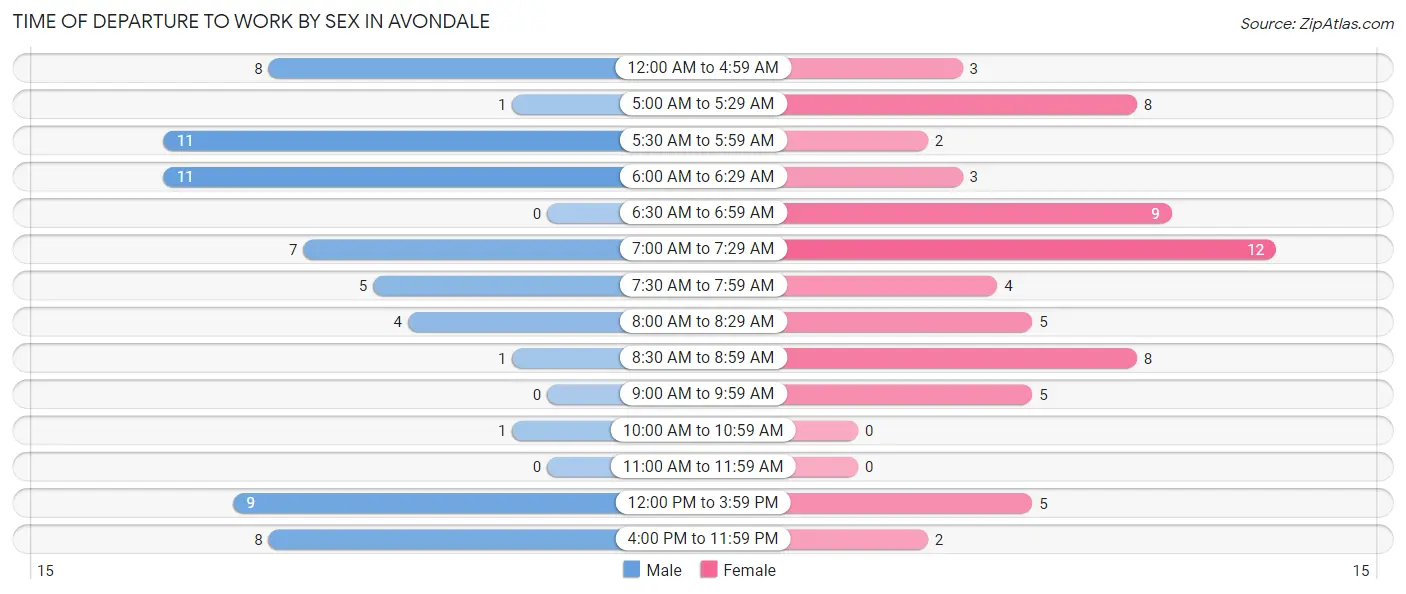
| Time of Departure | Male | Female |
| 12:00 AM to 4:59 AM | 8 (12.1%) | 3 (4.5%) |
| 5:00 AM to 5:29 AM | 1 (1.5%) | 8 (12.1%) |
| 5:30 AM to 5:59 AM | 11 (16.7%) | 2 (3.0%) |
| 6:00 AM to 6:29 AM | 11 (16.7%) | 3 (4.5%) |
| 6:30 AM to 6:59 AM | 0 (0.0%) | 9 (13.6%) |
| 7:00 AM to 7:29 AM | 7 (10.6%) | 12 (18.2%) |
| 7:30 AM to 7:59 AM | 5 (7.6%) | 4 (6.1%) |
| 8:00 AM to 8:29 AM | 4 (6.1%) | 5 (7.6%) |
| 8:30 AM to 8:59 AM | 1 (1.5%) | 8 (12.1%) |
| 9:00 AM to 9:59 AM | 0 (0.0%) | 5 (7.6%) |
| 10:00 AM to 10:59 AM | 1 (1.5%) | 0 (0.0%) |
| 11:00 AM to 11:59 AM | 0 (0.0%) | 0 (0.0%) |
| 12:00 PM to 3:59 PM | 9 (13.6%) | 5 (7.6%) |
| 4:00 PM to 11:59 PM | 8 (12.1%) | 2 (3.0%) |
| Total | 66 (100.0%) | 66 (100.0%) |
Housing Occupancy in Avondale
Occupancy by Ownership in Avondale
Of the total 166 dwellings in Avondale, owner-occupied units account for 96 (57.8%), while renter-occupied units make up 70 (42.2%).
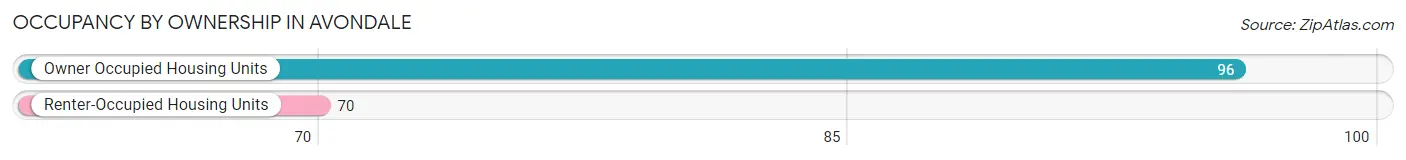
| Occupancy | # Housing Units | % Housing Units |
| Owner Occupied Housing Units | 96 | 57.8% |
| Renter-Occupied Housing Units | 70 | 42.2% |
| Total Occupied Housing Units | 166 | 100.0% |
Occupancy by Household Size in Avondale
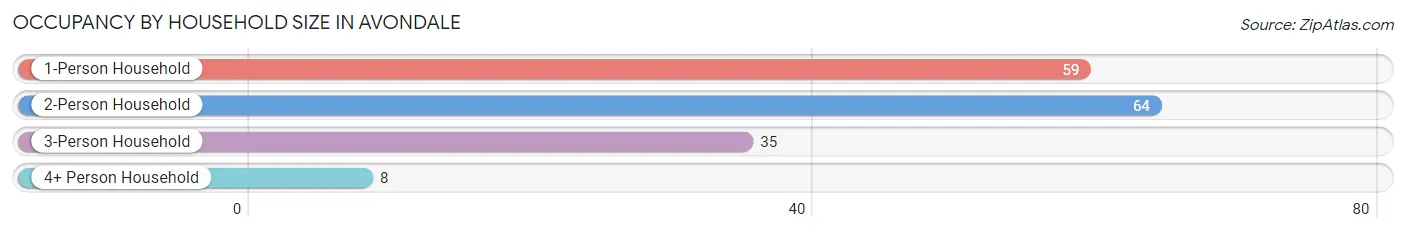
| Household Size | # Housing Units | % Housing Units |
| 1-Person Household | 59 | 35.5% |
| 2-Person Household | 64 | 38.6% |
| 3-Person Household | 35 | 21.1% |
| 4+ Person Household | 8 | 4.8% |
| Total Housing Units | 166 | 100.0% |
Occupancy by Ownership by Household Size in Avondale
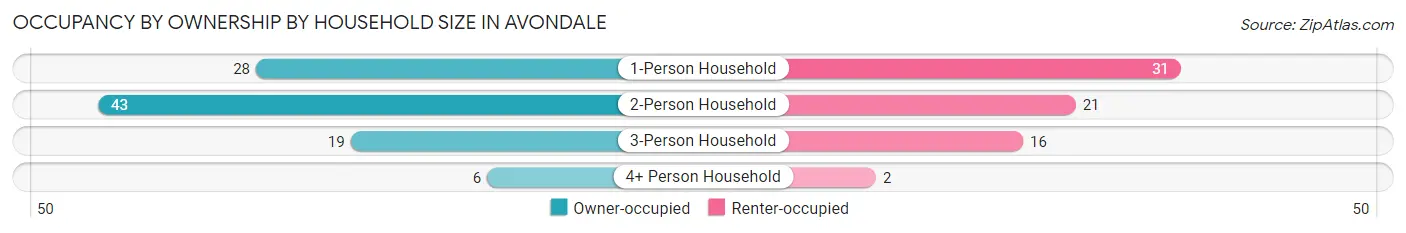
| Household Size | Owner-occupied | Renter-occupied |
| 1-Person Household | 28 (47.5%) | 31 (52.5%) |
| 2-Person Household | 43 (67.2%) | 21 (32.8%) |
| 3-Person Household | 19 (54.3%) | 16 (45.7%) |
| 4+ Person Household | 6 (75.0%) | 2 (25.0%) |
| Total Housing Units | 96 (57.8%) | 70 (42.2%) |
Occupancy by Educational Attainment in Avondale
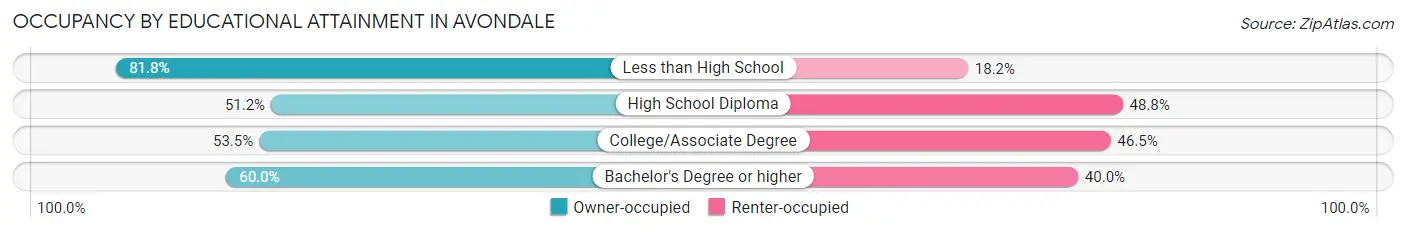
| Household Size | Owner-occupied | Renter-occupied |
| Less than High School | 18 (81.8%) | 4 (18.2%) |
| High School Diploma | 22 (51.2%) | 21 (48.8%) |
| College/Associate Degree | 38 (53.5%) | 33 (46.5%) |
| Bachelor's Degree or higher | 18 (60.0%) | 12 (40.0%) |
Occupancy by Age of Householder in Avondale
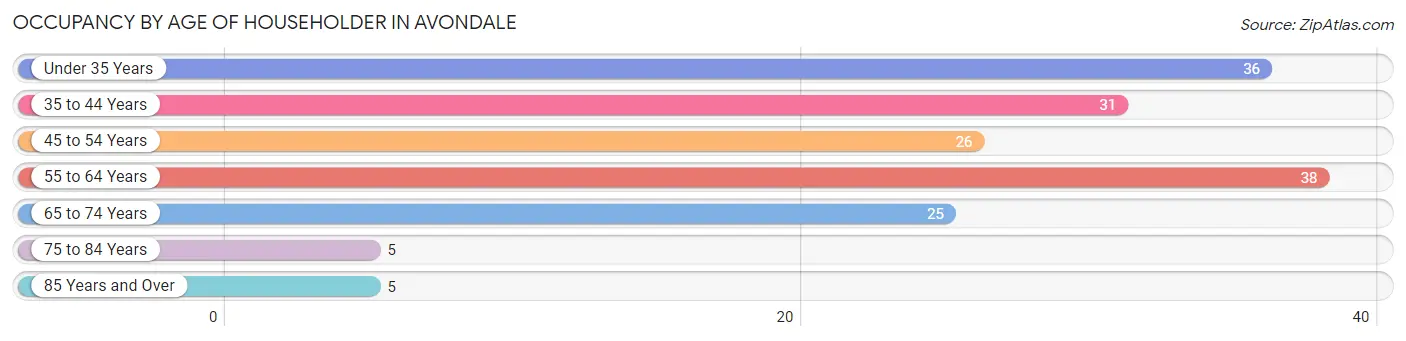
| Age Bracket | # Households | % Households |
| Under 35 Years | 36 | 21.7% |
| 35 to 44 Years | 31 | 18.7% |
| 45 to 54 Years | 26 | 15.7% |
| 55 to 64 Years | 38 | 22.9% |
| 65 to 74 Years | 25 | 15.1% |
| 75 to 84 Years | 5 | 3.0% |
| 85 Years and Over | 5 | 3.0% |
| Total | 166 | 100.0% |
Housing Finances in Avondale
Median Income by Occupancy in Avondale
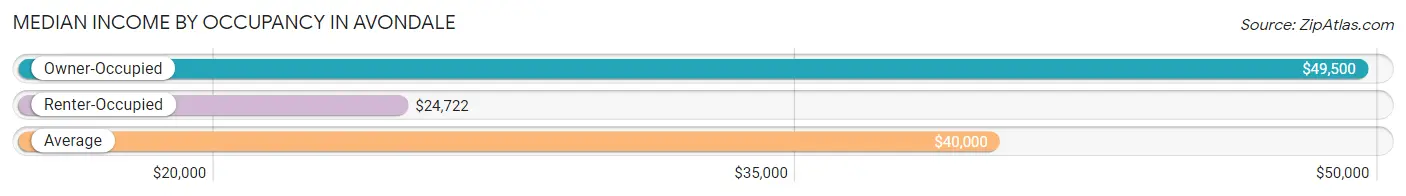
| Occupancy Type | # Households | Median Income |
| Owner-Occupied | 96 (57.8%) | $49,500 |
| Renter-Occupied | 70 (42.2%) | $24,722 |
| Average | 166 (100.0%) | $40,000 |
Occupancy by Householder Income Bracket in Avondale
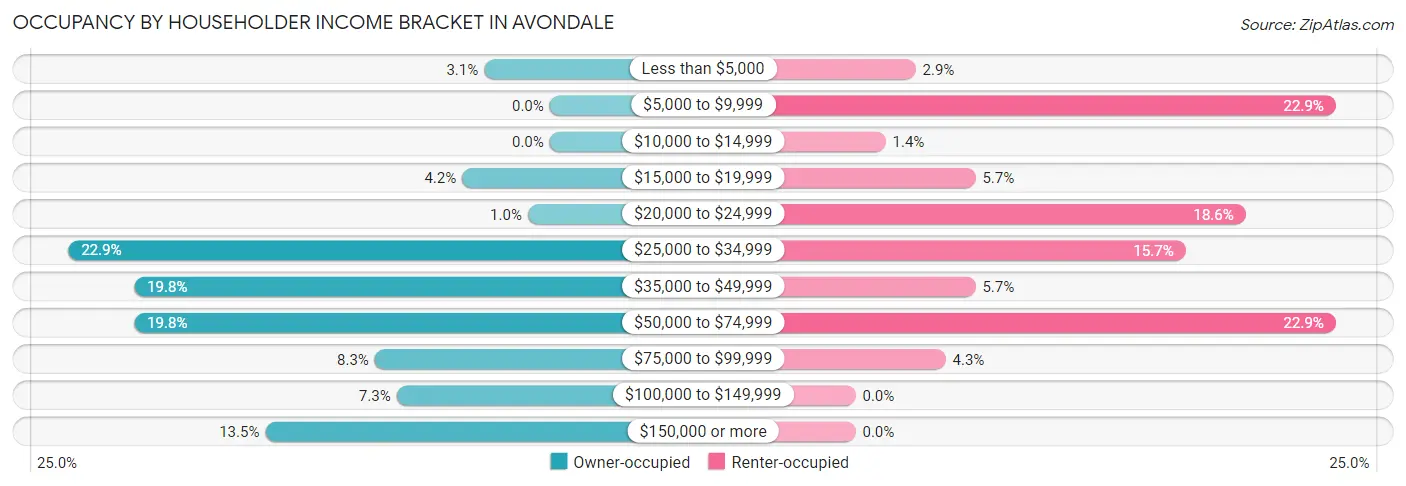
| Income Bracket | Owner-occupied | Renter-occupied |
| Less than $5,000 | 3 (3.1%) | 2 (2.9%) |
| $5,000 to $9,999 | 0 (0.0%) | 16 (22.9%) |
| $10,000 to $14,999 | 0 (0.0%) | 1 (1.4%) |
| $15,000 to $19,999 | 4 (4.2%) | 4 (5.7%) |
| $20,000 to $24,999 | 1 (1.0%) | 13 (18.6%) |
| $25,000 to $34,999 | 22 (22.9%) | 11 (15.7%) |
| $35,000 to $49,999 | 19 (19.8%) | 4 (5.7%) |
| $50,000 to $74,999 | 19 (19.8%) | 16 (22.9%) |
| $75,000 to $99,999 | 8 (8.3%) | 3 (4.3%) |
| $100,000 to $149,999 | 7 (7.3%) | 0 (0.0%) |
| $150,000 or more | 13 (13.5%) | 0 (0.0%) |
| Total | 96 (100.0%) | 70 (100.0%) |
Monthly Housing Cost Tiers in Avondale
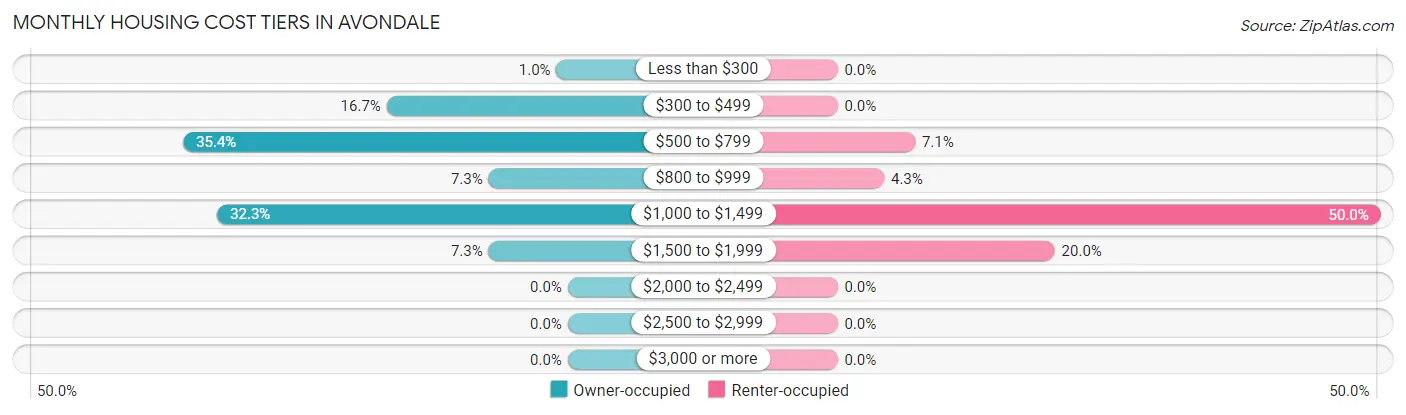
| Monthly Cost | Owner-occupied | Renter-occupied |
| Less than $300 | 1 (1.0%) | 0 (0.0%) |
| $300 to $499 | 16 (16.7%) | 0 (0.0%) |
| $500 to $799 | 34 (35.4%) | 5 (7.1%) |
| $800 to $999 | 7 (7.3%) | 3 (4.3%) |
| $1,000 to $1,499 | 31 (32.3%) | 35 (50.0%) |
| $1,500 to $1,999 | 7 (7.3%) | 14 (20.0%) |
| $2,000 to $2,499 | 0 (0.0%) | 0 (0.0%) |
| $2,500 to $2,999 | 0 (0.0%) | 0 (0.0%) |
| $3,000 or more | 0 (0.0%) | 0 (0.0%) |
| Total | 96 (100.0%) | 70 (100.0%) |
Physical Housing Characteristics in Avondale
Housing Structures in Avondale
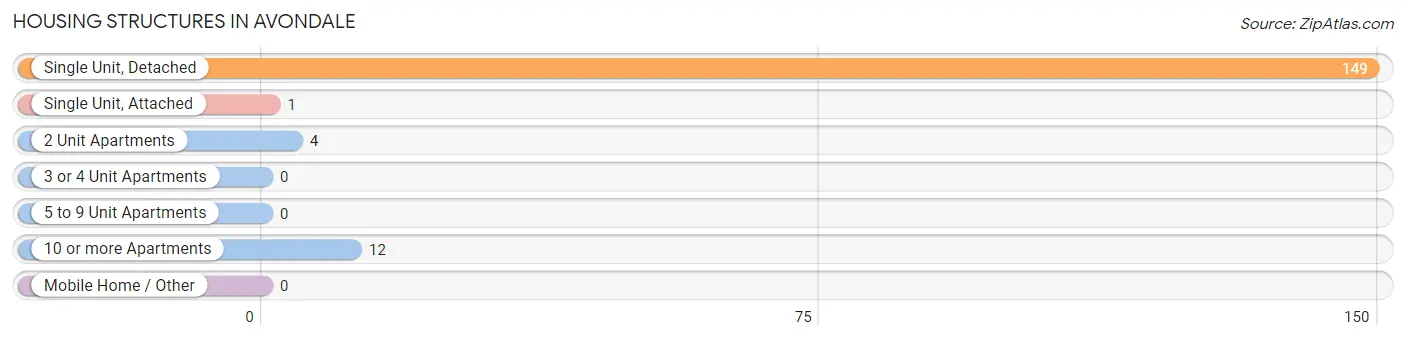
| Structure Type | # Housing Units | % Housing Units |
| Single Unit, Detached | 149 | 89.8% |
| Single Unit, Attached | 1 | 0.6% |
| 2 Unit Apartments | 4 | 2.4% |
| 3 or 4 Unit Apartments | 0 | 0.0% |
| 5 to 9 Unit Apartments | 0 | 0.0% |
| 10 or more Apartments | 12 | 7.2% |
| Mobile Home / Other | 0 | 0.0% |
| Total | 166 | 100.0% |
Housing Structures by Occupancy in Avondale
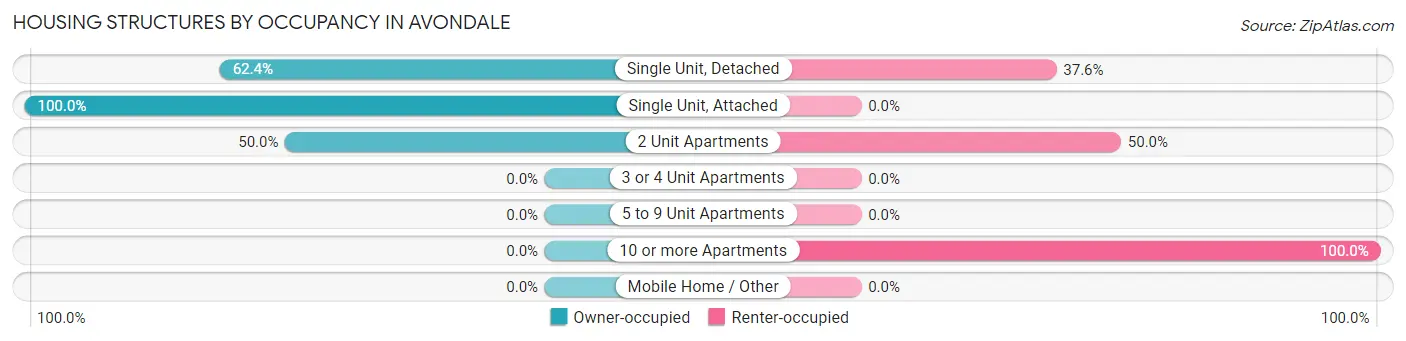
| Structure Type | Owner-occupied | Renter-occupied |
| Single Unit, Detached | 93 (62.4%) | 56 (37.6%) |
| Single Unit, Attached | 1 (100.0%) | 0 (0.0%) |
| 2 Unit Apartments | 2 (50.0%) | 2 (50.0%) |
| 3 or 4 Unit Apartments | 0 (0.0%) | 0 (0.0%) |
| 5 to 9 Unit Apartments | 0 (0.0%) | 0 (0.0%) |
| 10 or more Apartments | 0 (0.0%) | 12 (100.0%) |
| Mobile Home / Other | 0 (0.0%) | 0 (0.0%) |
| Total | 96 (57.8%) | 70 (42.2%) |
Housing Structures by Number of Rooms in Avondale
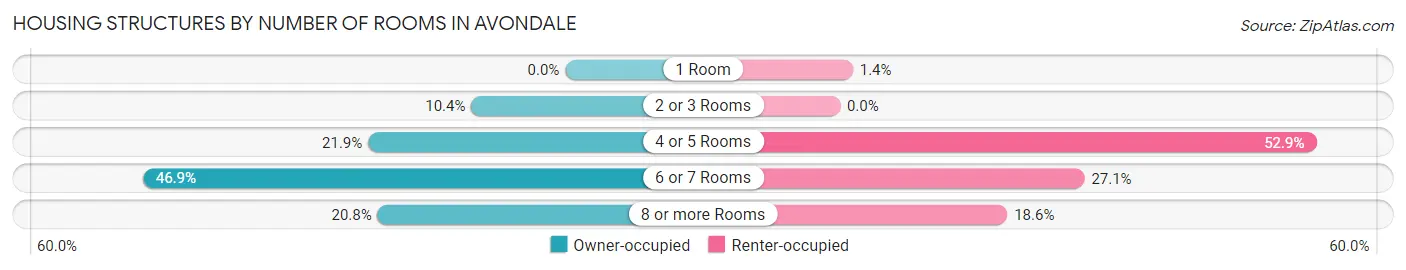
| Number of Rooms | Owner-occupied | Renter-occupied |
| 1 Room | 0 (0.0%) | 1 (1.4%) |
| 2 or 3 Rooms | 10 (10.4%) | 0 (0.0%) |
| 4 or 5 Rooms | 21 (21.9%) | 37 (52.9%) |
| 6 or 7 Rooms | 45 (46.9%) | 19 (27.1%) |
| 8 or more Rooms | 20 (20.8%) | 13 (18.6%) |
| Total | 96 (100.0%) | 70 (100.0%) |
Housing Structure by Heating Type in Avondale
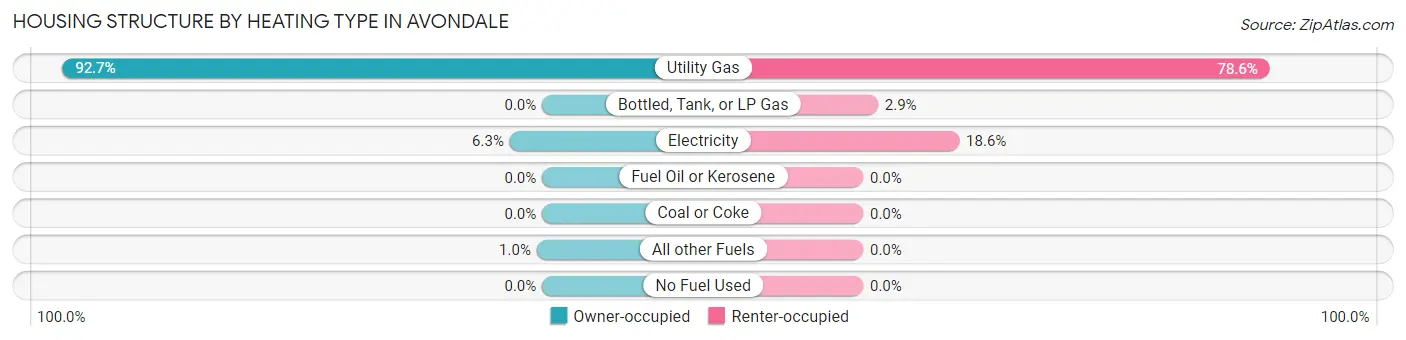
| Heating Type | Owner-occupied | Renter-occupied |
| Utility Gas | 89 (92.7%) | 55 (78.6%) |
| Bottled, Tank, or LP Gas | 0 (0.0%) | 2 (2.9%) |
| Electricity | 6 (6.2%) | 13 (18.6%) |
| Fuel Oil or Kerosene | 0 (0.0%) | 0 (0.0%) |
| Coal or Coke | 0 (0.0%) | 0 (0.0%) |
| All other Fuels | 1 (1.0%) | 0 (0.0%) |
| No Fuel Used | 0 (0.0%) | 0 (0.0%) |
| Total | 96 (100.0%) | 70 (100.0%) |
Household Vehicle Usage in Avondale
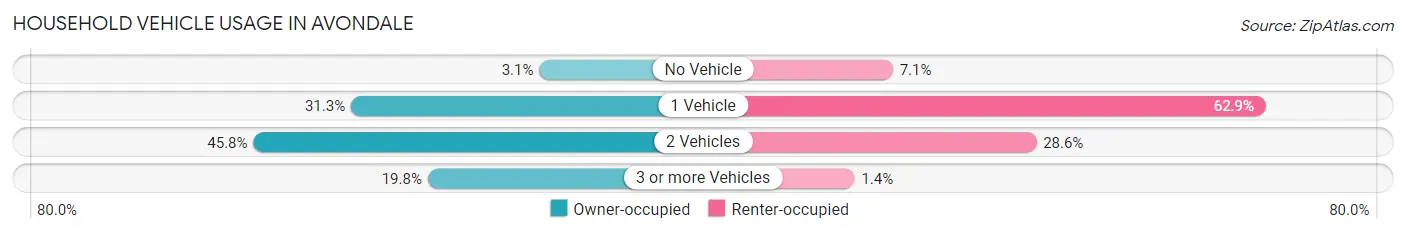
| Vehicles per Household | Owner-occupied | Renter-occupied |
| No Vehicle | 3 (3.1%) | 5 (7.1%) |
| 1 Vehicle | 30 (31.2%) | 44 (62.9%) |
| 2 Vehicles | 44 (45.8%) | 20 (28.6%) |
| 3 or more Vehicles | 19 (19.8%) | 1 (1.4%) |
| Total | 96 (100.0%) | 70 (100.0%) |
Real Estate & Mortgages in Avondale
Real Estate and Mortgage Overview in Avondale
| Characteristic | Without Mortgage | With Mortgage |
| Housing Units | 36 | 60 |
| Median Property Value | $108,300 | $139,800 |
| Median Household Income | $48,333 | $13 |
| Monthly Housing Costs | $513 | $0 |
| Real Estate Taxes | $1,500 | $1 |
Property Value by Mortgage Status in Avondale
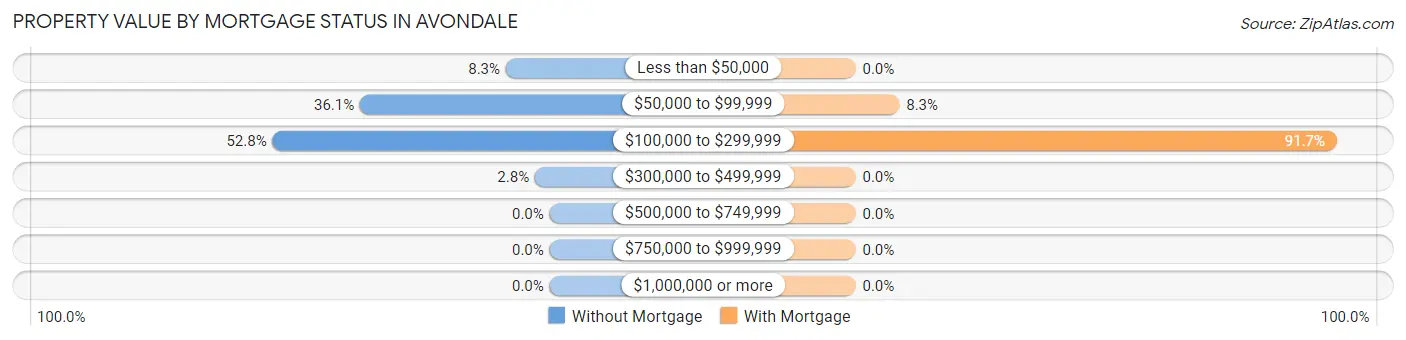
| Property Value | Without Mortgage | With Mortgage |
| Less than $50,000 | 3 (8.3%) | 0 (0.0%) |
| $50,000 to $99,999 | 13 (36.1%) | 5 (8.3%) |
| $100,000 to $299,999 | 19 (52.8%) | 55 (91.7%) |
| $300,000 to $499,999 | 1 (2.8%) | 0 (0.0%) |
| $500,000 to $749,999 | 0 (0.0%) | 0 (0.0%) |
| $750,000 to $999,999 | 0 (0.0%) | 0 (0.0%) |
| $1,000,000 or more | 0 (0.0%) | 0 (0.0%) |
| Total | 36 (100.0%) | 60 (100.0%) |
Household Income by Mortgage Status in Avondale
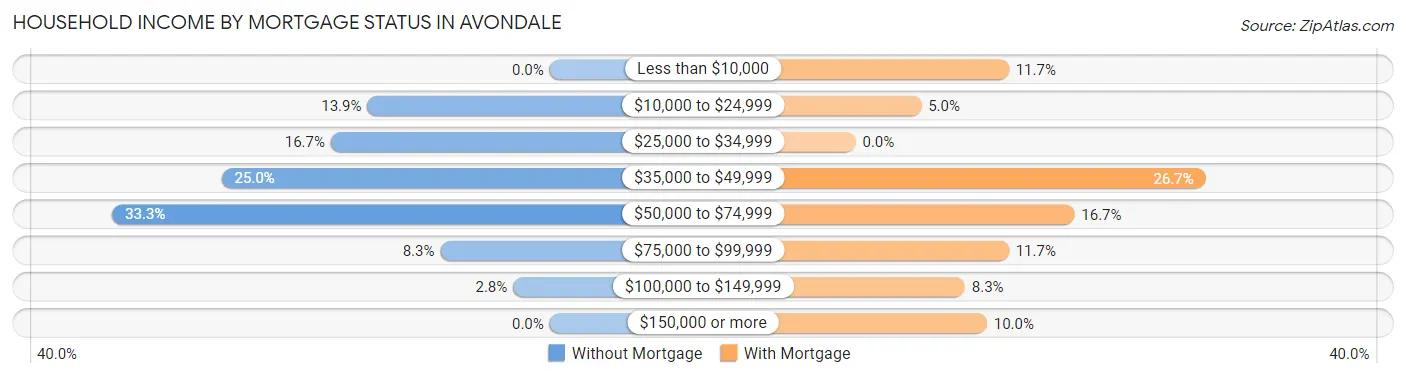
| Household Income | Without Mortgage | With Mortgage |
| Less than $10,000 | 0 (0.0%) | 7 (11.7%) |
| $10,000 to $24,999 | 5 (13.9%) | 3 (5.0%) |
| $25,000 to $34,999 | 6 (16.7%) | 0 (0.0%) |
| $35,000 to $49,999 | 9 (25.0%) | 16 (26.7%) |
| $50,000 to $74,999 | 12 (33.3%) | 10 (16.7%) |
| $75,000 to $99,999 | 3 (8.3%) | 7 (11.7%) |
| $100,000 to $149,999 | 1 (2.8%) | 5 (8.3%) |
| $150,000 or more | 0 (0.0%) | 6 (10.0%) |
| Total | 36 (100.0%) | 60 (100.0%) |
Property Value to Household Income Ratio in Avondale
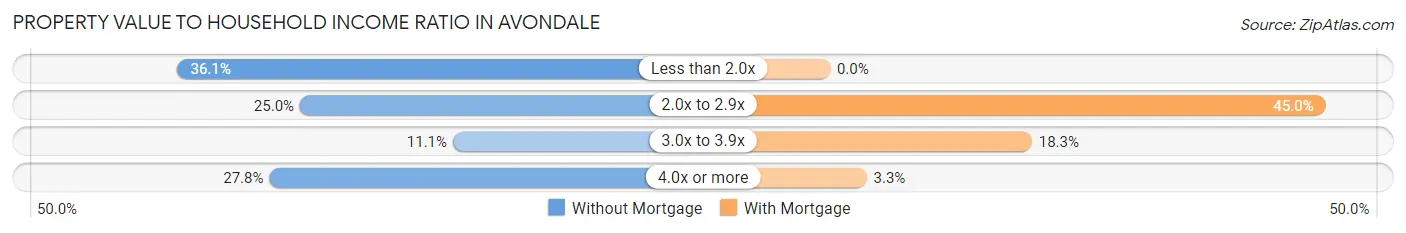
| Value-to-Income Ratio | Without Mortgage | With Mortgage |
| Less than 2.0x | 13 (36.1%) | 0 (0.0%) |
| 2.0x to 2.9x | 9 (25.0%) | 27 (45.0%) |
| 3.0x to 3.9x | 4 (11.1%) | 11 (18.3%) |
| 4.0x or more | 10 (27.8%) | 2 (3.3%) |
| Total | 36 (100.0%) | 60 (100.0%) |
Real Estate Taxes by Mortgage Status in Avondale
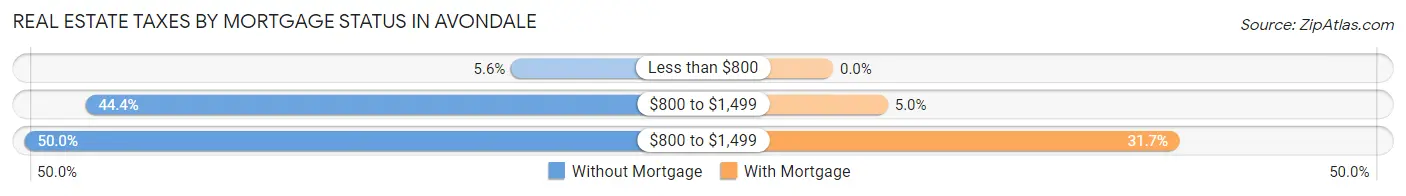
| Property Taxes | Without Mortgage | With Mortgage |
| Less than $800 | 2 (5.6%) | 0 (0.0%) |
| $800 to $1,499 | 16 (44.4%) | 3 (5.0%) |
| $800 to $1,499 | 18 (50.0%) | 19 (31.7%) |
| Total | 36 (100.0%) | 60 (100.0%) |
Health & Disability in Avondale
Health Insurance Coverage by Age in Avondale
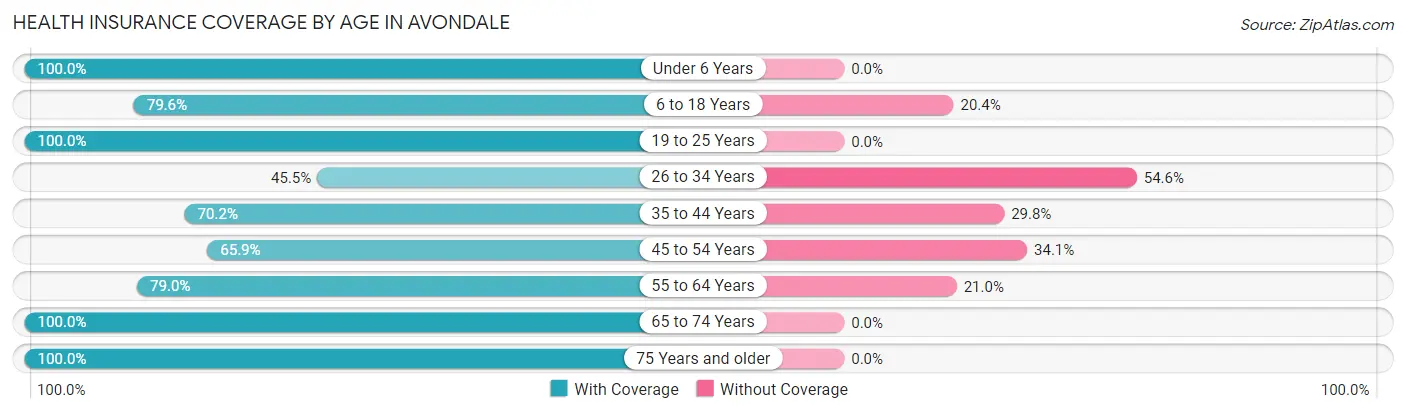
| Age Bracket | With Coverage | Without Coverage |
| Under 6 Years | 11 (100.0%) | 0 (0.0%) |
| 6 to 18 Years | 43 (79.6%) | 11 (20.4%) |
| 19 to 25 Years | 8 (100.0%) | 0 (0.0%) |
| 26 to 34 Years | 25 (45.5%) | 30 (54.5%) |
| 35 to 44 Years | 40 (70.2%) | 17 (29.8%) |
| 45 to 54 Years | 29 (65.9%) | 15 (34.1%) |
| 55 to 64 Years | 49 (79.0%) | 13 (21.0%) |
| 65 to 74 Years | 39 (100.0%) | 0 (0.0%) |
| 75 Years and older | 13 (100.0%) | 0 (0.0%) |
| Total | 257 (74.9%) | 86 (25.1%) |
Health Insurance Coverage by Citizenship Status in Avondale
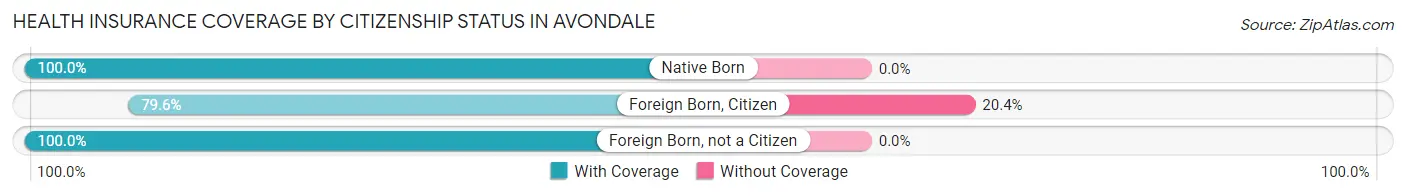
| Citizenship Status | With Coverage | Without Coverage |
| Native Born | 11 (100.0%) | 0 (0.0%) |
| Foreign Born, Citizen | 43 (79.6%) | 11 (20.4%) |
| Foreign Born, not a Citizen | 8 (100.0%) | 0 (0.0%) |
Health Insurance Coverage by Household Income in Avondale
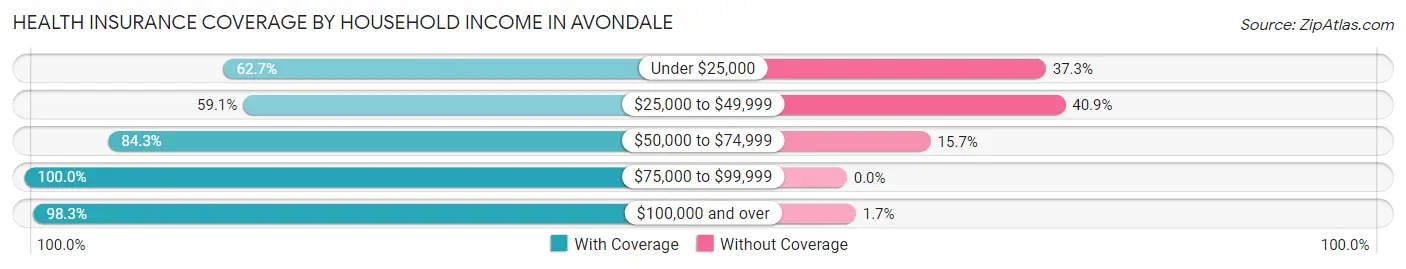
| Household Income | With Coverage | Without Coverage |
| Under $25,000 | 37 (62.7%) | 22 (37.3%) |
| $25,000 to $49,999 | 75 (59.1%) | 52 (40.9%) |
| $50,000 to $74,999 | 59 (84.3%) | 11 (15.7%) |
| $75,000 to $99,999 | 28 (100.0%) | 0 (0.0%) |
| $100,000 and over | 58 (98.3%) | 1 (1.7%) |
Public vs Private Health Insurance Coverage by Age in Avondale
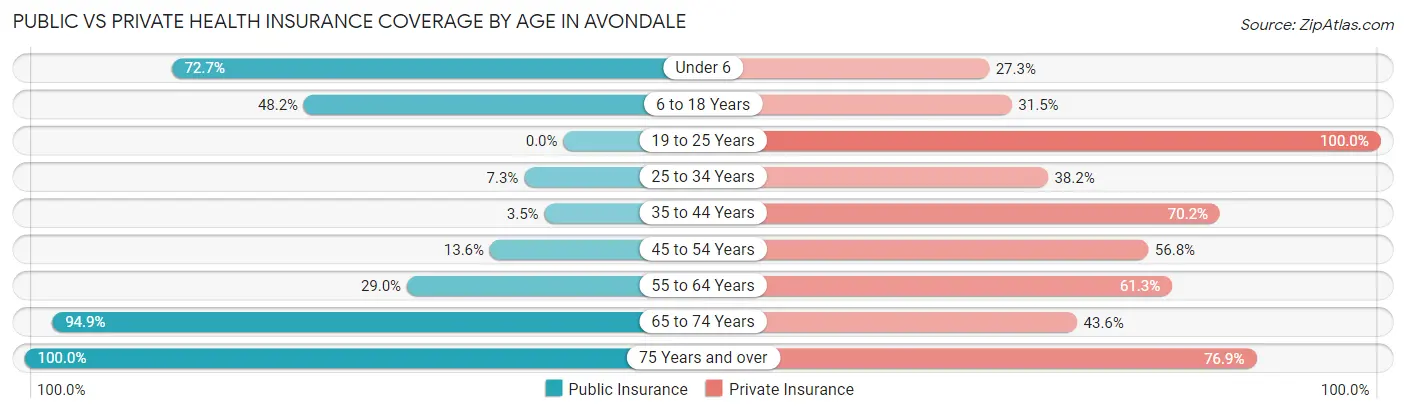
| Age Bracket | Public Insurance | Private Insurance |
| Under 6 | 8 (72.7%) | 3 (27.3%) |
| 6 to 18 Years | 26 (48.1%) | 17 (31.5%) |
| 19 to 25 Years | 0 (0.0%) | 8 (100.0%) |
| 25 to 34 Years | 4 (7.3%) | 21 (38.2%) |
| 35 to 44 Years | 2 (3.5%) | 40 (70.2%) |
| 45 to 54 Years | 6 (13.6%) | 25 (56.8%) |
| 55 to 64 Years | 18 (29.0%) | 38 (61.3%) |
| 65 to 74 Years | 37 (94.9%) | 17 (43.6%) |
| 75 Years and over | 13 (100.0%) | 10 (76.9%) |
| Total | 114 (33.2%) | 179 (52.2%) |
Disability Status by Sex by Age in Avondale
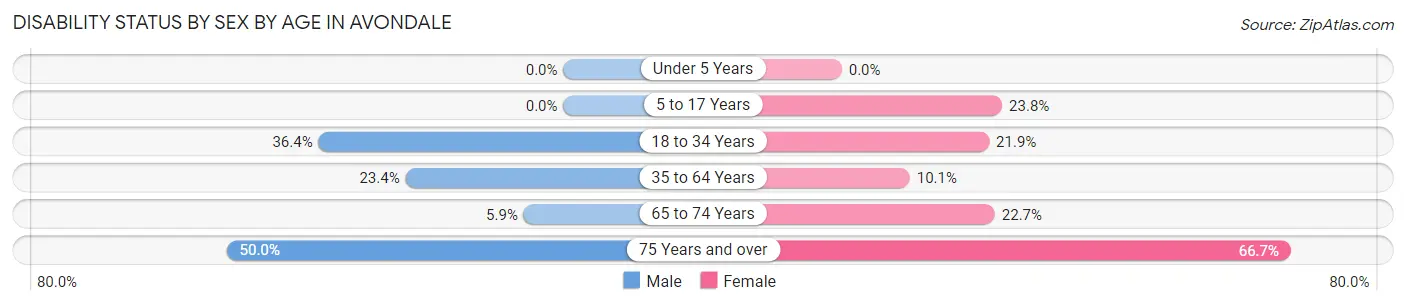
| Age Bracket | Male | Female |
| Under 5 Years | 0 (0.0%) | 0 (0.0%) |
| 5 to 17 Years | 0 (0.0%) | 5 (23.8%) |
| 18 to 34 Years | 12 (36.4%) | 7 (21.9%) |
| 35 to 64 Years | 15 (23.4%) | 10 (10.1%) |
| 65 to 74 Years | 1 (5.9%) | 5 (22.7%) |
| 75 Years and over | 2 (50.0%) | 6 (66.7%) |
Disability Class by Sex by Age in Avondale
Disability Class: Hearing Difficulty
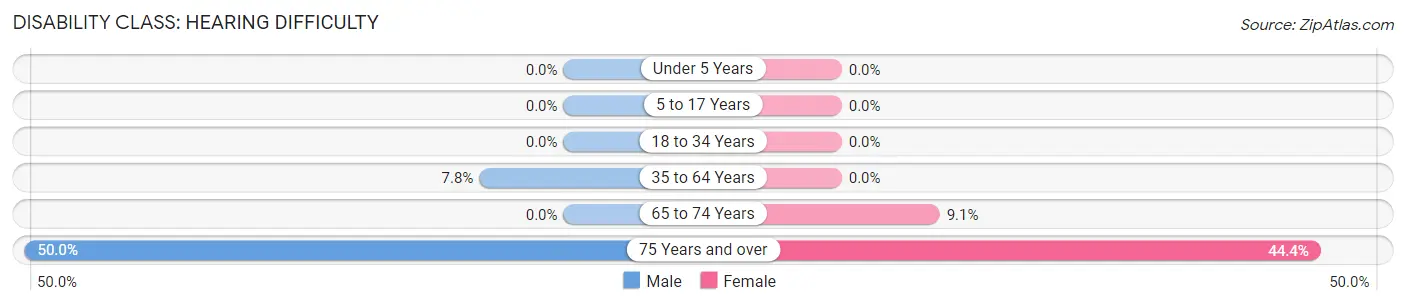
| Age Bracket | Male | Female |
| Under 5 Years | 0 (0.0%) | 0 (0.0%) |
| 5 to 17 Years | 0 (0.0%) | 0 (0.0%) |
| 18 to 34 Years | 0 (0.0%) | 0 (0.0%) |
| 35 to 64 Years | 5 (7.8%) | 0 (0.0%) |
| 65 to 74 Years | 0 (0.0%) | 2 (9.1%) |
| 75 Years and over | 2 (50.0%) | 4 (44.4%) |
Disability Class: Vision Difficulty
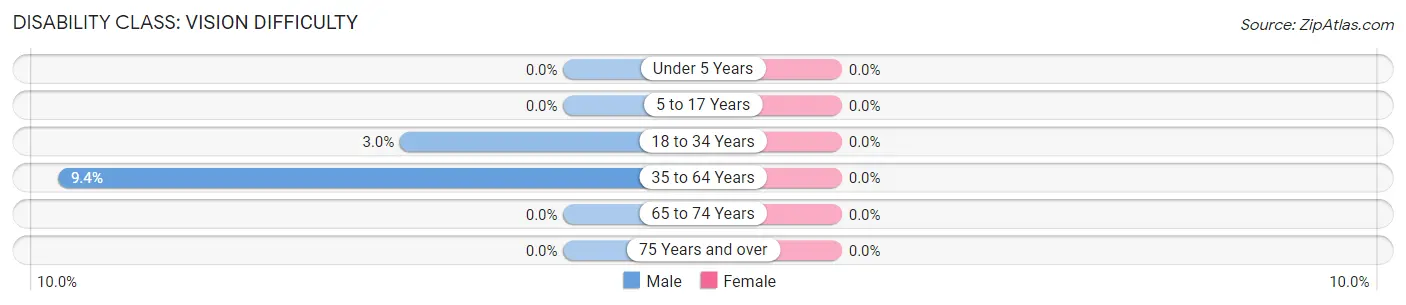
| Age Bracket | Male | Female |
| Under 5 Years | 0 (0.0%) | 0 (0.0%) |
| 5 to 17 Years | 0 (0.0%) | 0 (0.0%) |
| 18 to 34 Years | 1 (3.0%) | 0 (0.0%) |
| 35 to 64 Years | 6 (9.4%) | 0 (0.0%) |
| 65 to 74 Years | 0 (0.0%) | 0 (0.0%) |
| 75 Years and over | 0 (0.0%) | 0 (0.0%) |
Disability Class: Cognitive Difficulty
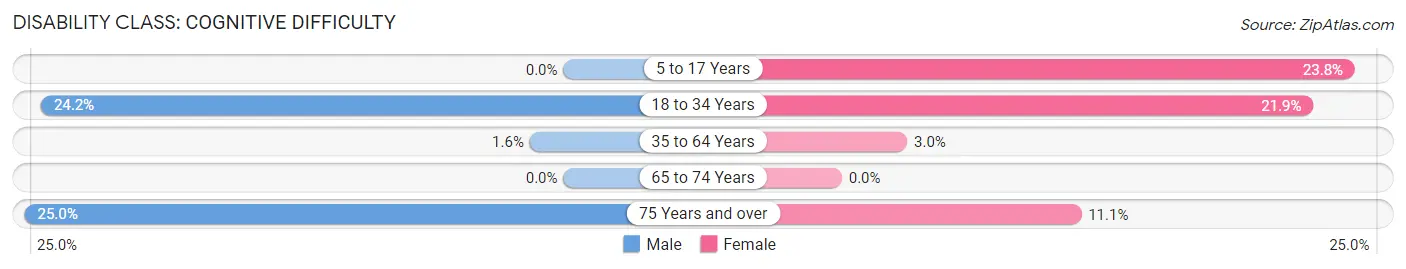
| Age Bracket | Male | Female |
| 5 to 17 Years | 0 (0.0%) | 5 (23.8%) |
| 18 to 34 Years | 8 (24.2%) | 7 (21.9%) |
| 35 to 64 Years | 1 (1.6%) | 3 (3.0%) |
| 65 to 74 Years | 0 (0.0%) | 0 (0.0%) |
| 75 Years and over | 1 (25.0%) | 1 (11.1%) |
Disability Class: Ambulatory Difficulty
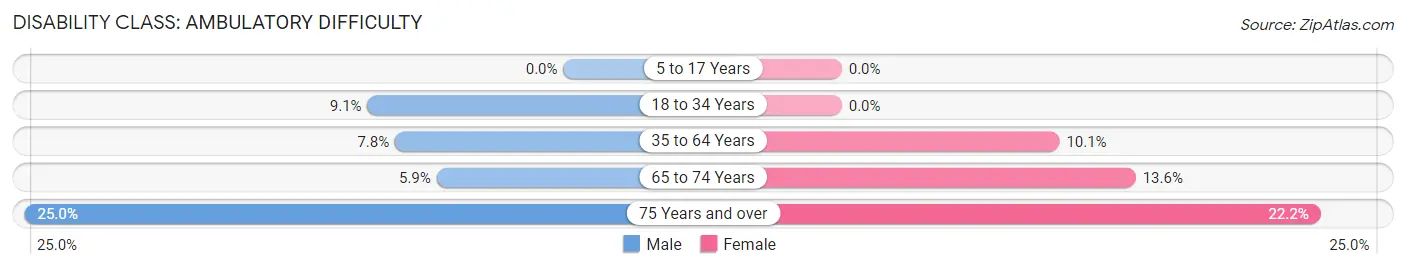
| Age Bracket | Male | Female |
| 5 to 17 Years | 0 (0.0%) | 0 (0.0%) |
| 18 to 34 Years | 3 (9.1%) | 0 (0.0%) |
| 35 to 64 Years | 5 (7.8%) | 10 (10.1%) |
| 65 to 74 Years | 1 (5.9%) | 3 (13.6%) |
| 75 Years and over | 1 (25.0%) | 2 (22.2%) |
Disability Class: Self-Care Difficulty
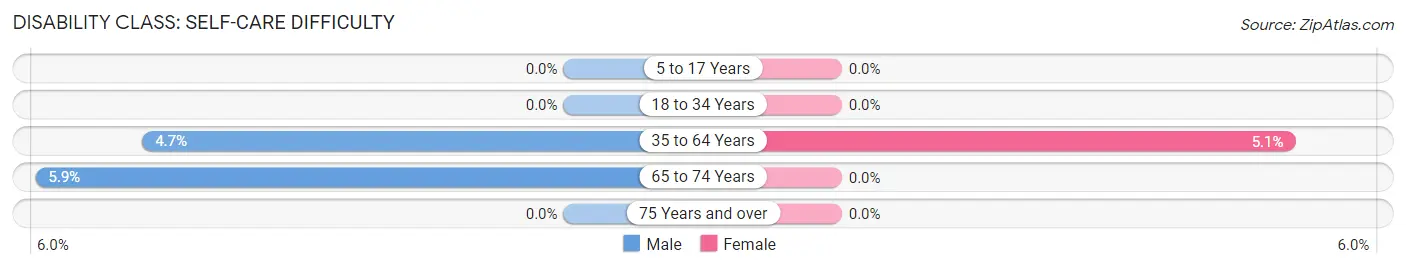
| Age Bracket | Male | Female |
| 5 to 17 Years | 0 (0.0%) | 0 (0.0%) |
| 18 to 34 Years | 0 (0.0%) | 0 (0.0%) |
| 35 to 64 Years | 3 (4.7%) | 5 (5.1%) |
| 65 to 74 Years | 1 (5.9%) | 0 (0.0%) |
| 75 Years and over | 0 (0.0%) | 0 (0.0%) |
Technology Access in Avondale
Computing Device Access in Avondale
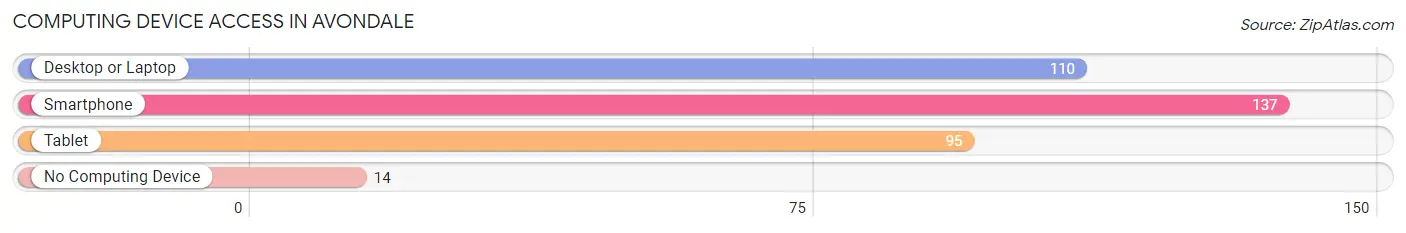
| Device Type | # Households | % Households |
| Desktop or Laptop | 110 | 66.3% |
| Smartphone | 137 | 82.5% |
| Tablet | 95 | 57.2% |
| No Computing Device | 14 | 8.4% |
| Total | 166 | 100.0% |
Internet Access in Avondale
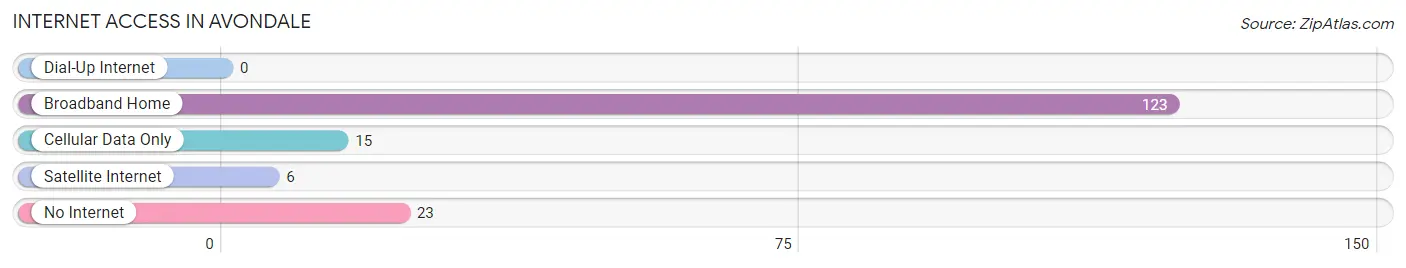
| Internet Type | # Households | % Households |
| Dial-Up Internet | 0 | 0.0% |
| Broadband Home | 123 | 74.1% |
| Cellular Data Only | 15 | 9.0% |
| Satellite Internet | 6 | 3.6% |
| No Internet | 23 | 13.9% |
| Total | 166 | 100.0% |
Avondale Summary
Avondale, Missouri is a small town located in St. Louis County, Missouri. It is situated on the banks of the Missouri River, just north of the city of St. Louis. The town was founded in 1837 and has a population of approximately 1,000 people.
History
Avondale was founded in 1837 by a group of settlers from Kentucky. The town was named after the nearby Avondale Plantation, which was owned by the prominent Chouteau family. The town was originally a farming community, but it soon became a popular destination for travelers and tourists. In the late 19th century, the town was home to a number of resorts and hotels, as well as a popular amusement park.
In the early 20th century, Avondale began to decline as the popularity of the resorts and hotels began to wane. The town was also affected by the Great Depression, and many of the businesses in the area closed. In the 1950s, the town began to experience a resurgence as new businesses began to open and the population began to grow.
Geography
Avondale is located in St. Louis County, Missouri, on the banks of the Missouri River. The town is situated on the western edge of the county, just north of the city of St. Louis. The town is bordered by the towns of Bellefontaine Neighbors, Ferguson, and Florissant. The town is located in a predominantly rural area, with the nearest major city being St. Louis.
The town has a total area of 0.7 square miles, all of which is land. The town is located at an elevation of approximately 500 feet above sea level. The climate in Avondale is classified as humid continental, with hot, humid summers and cold, snowy winters.
Economy
Avondale’s economy is largely based on agriculture and tourism. The town is home to a number of farms, which produce a variety of crops, including corn, soybeans, and wheat. The town is also home to a number of small businesses, including restaurants, shops, and other services.
The town is also a popular destination for tourists, as it is located close to the city of St. Louis. The town is home to a number of historic sites, including the Avondale Plantation, which was once owned by the Chouteau family. The town is also home to a number of parks and recreational areas, including the Avondale Park and the Avondale Nature Center.
Demographics
As of the 2010 census, Avondale had a population of 1,000 people. The racial makeup of the town was 94.2% White, 2.2% African American, 0.2% Native American, 0.2% Asian, 0.2% from other races, and 2.2% from two or more races. Hispanic or Latino of any race were 1.2% of the population.
The median income for a household in Avondale was $45,000, and the median income for a family was $50,000. The per capita income for the town was $20,000. About 8.2% of families and 10.2% of the population were below the poverty line, including 14.2% of those under the age of 18 and none of those 65 and older.
Common Questions
What is Per Capita Income in Avondale?
Per Capita income in Avondale is $26,708.
What is the Median Family Income in Avondale?
Median Family Income in Avondale is $46,250.
What is the Median Household income in Avondale?
Median Household Income in Avondale is $40,000.
What is Income or Wage Gap in Avondale?
Income or Wage Gap in Avondale is 21.5%.
Women in Avondale earn 78.5 cents for every dollar earned by a man.
What is Inequality or Gini Index in Avondale?
Inequality or Gini Index in Avondale is 0.45.
What is the Total Population of Avondale?
Total Population of Avondale is 343.
What is the Total Male Population of Avondale?
Total Male Population of Avondale is 160.
What is the Total Female Population of Avondale?
Total Female Population of Avondale is 183.
What is the Ratio of Males per 100 Females in Avondale?
There are 87.43 Males per 100 Females in Avondale.
What is the Ratio of Females per 100 Males in Avondale?
There are 114.38 Females per 100 Males in Avondale.
What is the Median Population Age in Avondale?
Median Population Age in Avondale is 42.9 Years.
What is the Average Family Size in Avondale
Average Family Size in Avondale is 2.8 People.
What is the Average Household Size in Avondale
Average Household Size in Avondale is 2.1 People.
How Large is the Labor Force in Avondale?
There are 184 People in the Labor Forcein in Avondale.
What is the Percentage of People in the Labor Force in Avondale?
65.0% of People are in the Labor Force in Avondale.
What is the Unemployment Rate in Avondale?
Unemployment Rate in Avondale is 4.9%.