Weaubleau, MO Map & Demographics
Weaubleau Map
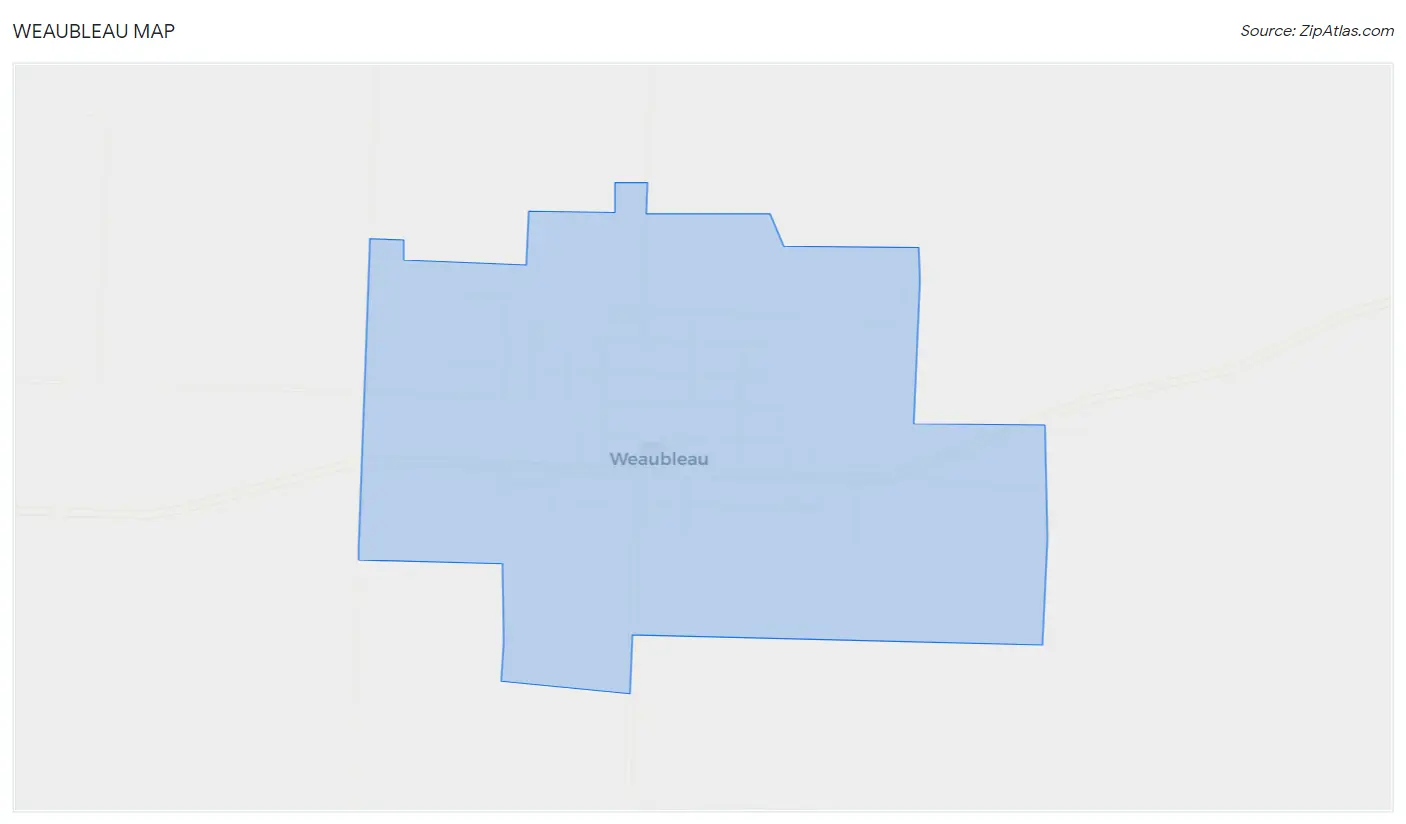
Weaubleau Overview
$20,011
PER CAPITA INCOME
$44,375
AVG FAMILY INCOME
$28,402
AVG HOUSEHOLD INCOME
0.53
INEQUALITY / GINI INDEX
528
TOTAL POPULATION
193
MALE POPULATION
335
FEMALE POPULATION
57.61
MALES / 100 FEMALES
173.58
FEMALES / 100 MALES
50.5
MEDIAN AGE
4.0
AVG FAMILY SIZE
2.2
AVG HOUSEHOLD SIZE
197
LABOR FORCE [ PEOPLE ]
50.0%
PERCENT IN LABOR FORCE
1.0%
UNEMPLOYMENT RATE
Weaubleau Zip Codes
Weaubleau Area Codes
Income in Weaubleau
Income Overview in Weaubleau
Per Capita Income in Weaubleau is $20,011, while median incomes of families and households are $44,375 and $28,402 respectively.
| Characteristic | Number | Measure |
| Per Capita Income | 528 | $20,011 |
| Median Family Income | 89 | $44,375 |
| Mean Family Income | 89 | $64,110 |
| Median Household Income | 242 | $28,402 |
| Mean Household Income | 242 | $39,293 |
| Income Deficit | 89 | $0 |
| Wage / Income Gap (%) | 528 | 0.00% |
| Wage / Income Gap ($) | 528 | 100.00¢ per $1 |
| Gini / Inequality Index | 528 | 0.53 |
Earnings by Sex in Weaubleau
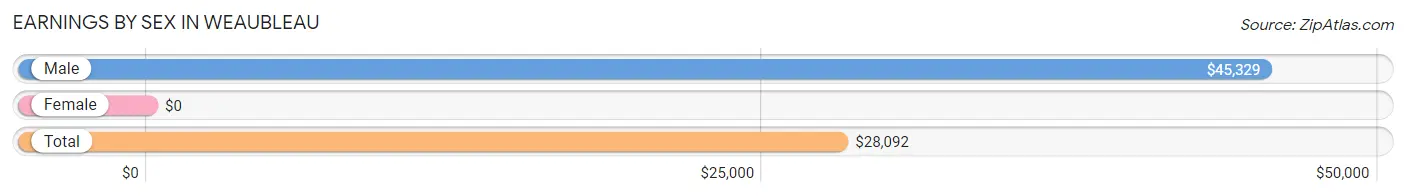
| Sex | Number | Average Earnings |
| Male | 55 (26.6%) | $45,329 |
| Female | 152 (73.4%) | $0 |
| Total | 207 (100.0%) | $28,092 |
Earnings by Sex by Income Bracket in Weaubleau
The most common earnings brackets in Weaubleau are $45,000 to $49,999 for men (19 | 34.5%) and $25,000 to $29,999 for women (64 | 42.1%).
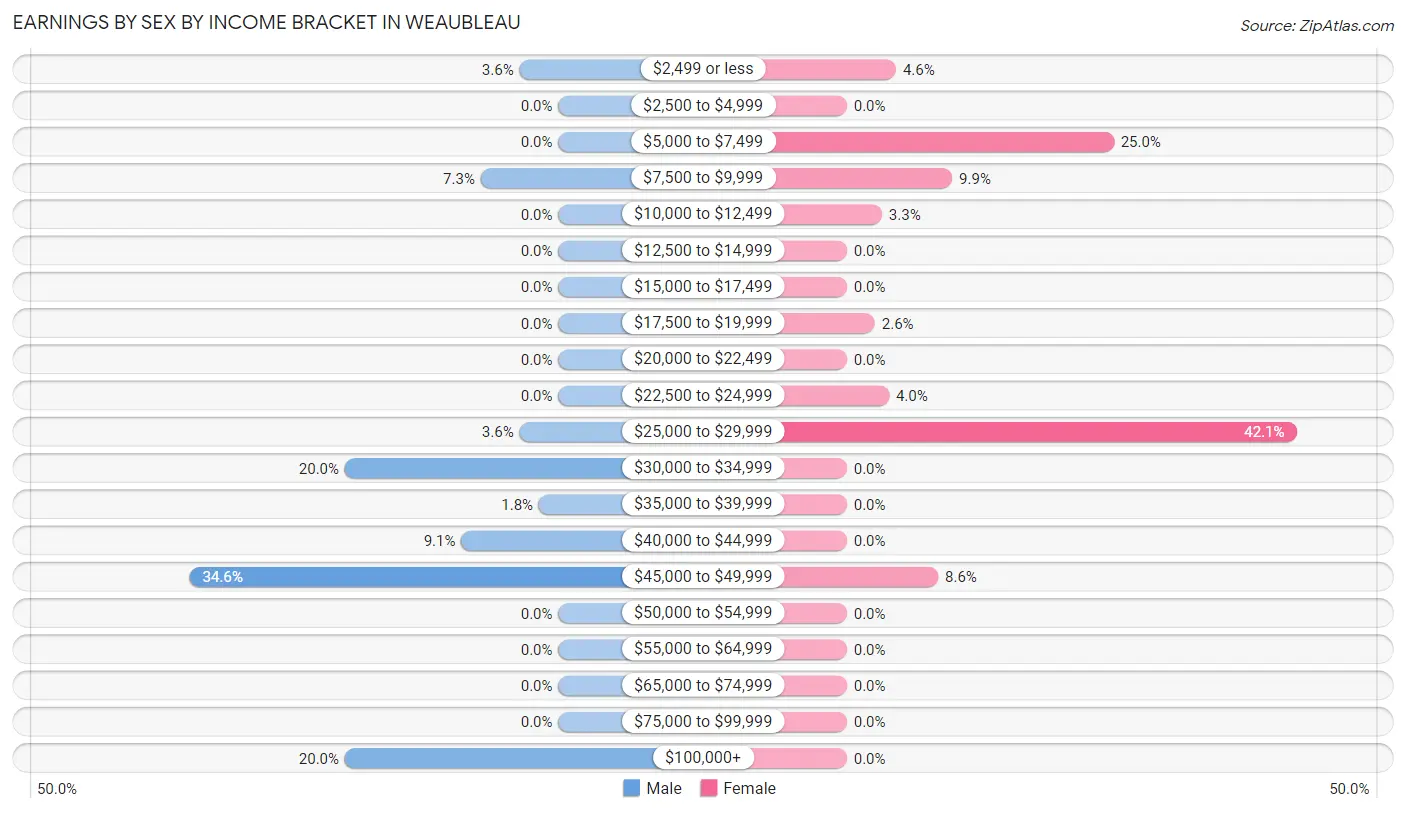
| Income | Male | Female |
| $2,499 or less | 2 (3.6%) | 7 (4.6%) |
| $2,500 to $4,999 | 0 (0.0%) | 0 (0.0%) |
| $5,000 to $7,499 | 0 (0.0%) | 38 (25.0%) |
| $7,500 to $9,999 | 4 (7.3%) | 15 (9.9%) |
| $10,000 to $12,499 | 0 (0.0%) | 5 (3.3%) |
| $12,500 to $14,999 | 0 (0.0%) | 0 (0.0%) |
| $15,000 to $17,499 | 0 (0.0%) | 0 (0.0%) |
| $17,500 to $19,999 | 0 (0.0%) | 4 (2.6%) |
| $20,000 to $22,499 | 0 (0.0%) | 0 (0.0%) |
| $22,500 to $24,999 | 0 (0.0%) | 6 (4.0%) |
| $25,000 to $29,999 | 2 (3.6%) | 64 (42.1%) |
| $30,000 to $34,999 | 11 (20.0%) | 0 (0.0%) |
| $35,000 to $39,999 | 1 (1.8%) | 0 (0.0%) |
| $40,000 to $44,999 | 5 (9.1%) | 0 (0.0%) |
| $45,000 to $49,999 | 19 (34.5%) | 13 (8.6%) |
| $50,000 to $54,999 | 0 (0.0%) | 0 (0.0%) |
| $55,000 to $64,999 | 0 (0.0%) | 0 (0.0%) |
| $65,000 to $74,999 | 0 (0.0%) | 0 (0.0%) |
| $75,000 to $99,999 | 0 (0.0%) | 0 (0.0%) |
| $100,000+ | 11 (20.0%) | 0 (0.0%) |
| Total | 55 (100.0%) | 152 (100.0%) |
Earnings by Sex by Educational Attainment in Weaubleau
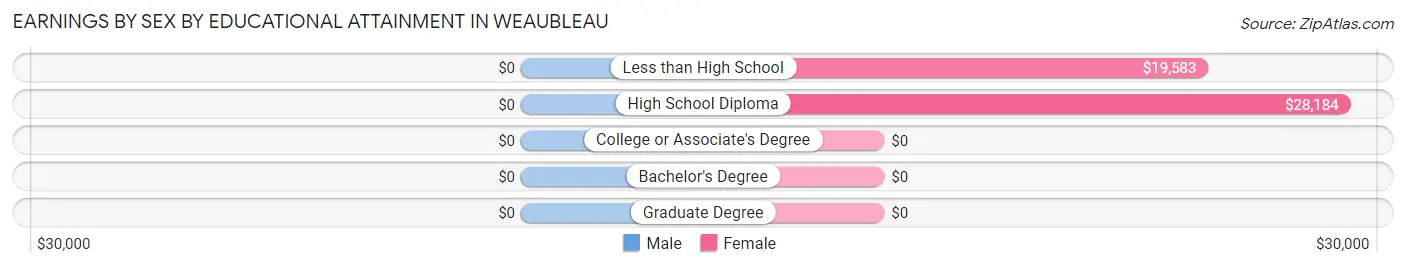
| Educational Attainment | Male Income | Female Income |
| Less than High School | - | - |
| High School Diploma | - | - |
| College or Associate's Degree | - | - |
| Bachelor's Degree | - | - |
| Graduate Degree | - | - |
| Total | $45,724 | $27,682 |
Family Income in Weaubleau
Family Income Brackets in Weaubleau
According to the Weaubleau family income data, there are 25 families falling into the $35,000 to $49,999 income range, which is the most common income bracket and makes up 28.1% of all families.
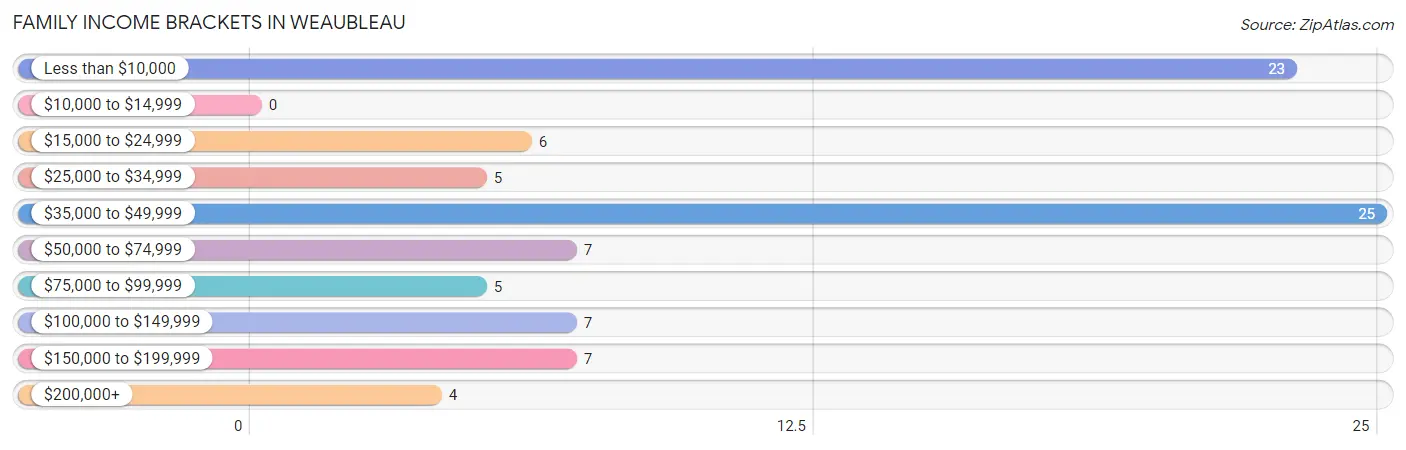
| Income Bracket | # Families | % Families |
| Less than $10,000 | 23 | 25.8% |
| $10,000 to $14,999 | 0 | 0.0% |
| $15,000 to $24,999 | 6 | 6.7% |
| $25,000 to $34,999 | 5 | 5.6% |
| $35,000 to $49,999 | 25 | 28.1% |
| $50,000 to $74,999 | 7 | 7.9% |
| $75,000 to $99,999 | 5 | 5.6% |
| $100,000 to $149,999 | 7 | 7.9% |
| $150,000 to $199,999 | 7 | 7.9% |
| $200,000+ | 4 | 4.5% |
Family Income by Famaliy Size in Weaubleau
2-person families (56 | 62.9%) account for the highest median family income in Weaubleau with $35,833 per family, while 2-person families (56 | 62.9%) have the highest median income of $17,916 per family member.
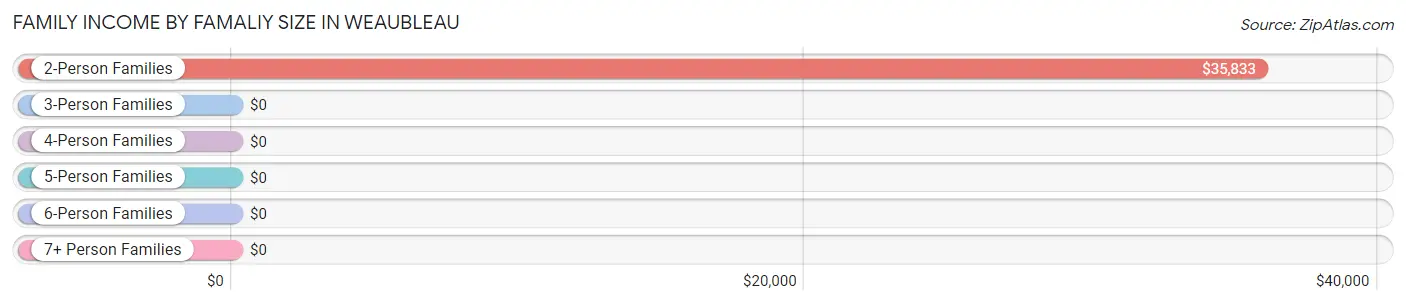
| Income Bracket | # Families | Median Income |
| 2-Person Families | 56 (62.9%) | $35,833 |
| 3-Person Families | 4 (4.5%) | $0 |
| 4-Person Families | 18 (20.2%) | $0 |
| 5-Person Families | 7 (7.9%) | $0 |
| 6-Person Families | 0 (0.0%) | $0 |
| 7+ Person Families | 4 (4.5%) | $0 |
| Total | 89 (100.0%) | $44,375 |
Family Income by Number of Earners in Weaubleau
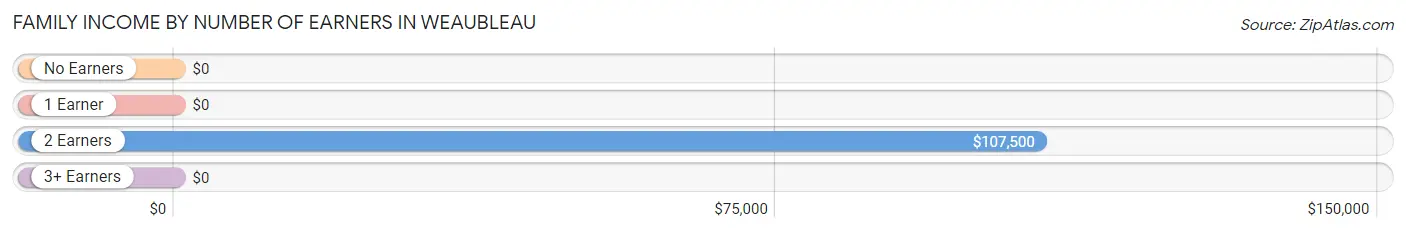
| Number of Earners | # Families | Median Income |
| No Earners | 45 (50.6%) | $0 |
| 1 Earner | 16 (18.0%) | $0 |
| 2 Earners | 24 (27.0%) | $107,500 |
| 3+ Earners | 4 (4.5%) | $0 |
| Total | 89 (100.0%) | $44,375 |
Household Income in Weaubleau
Household Income Brackets in Weaubleau
With 74 households falling in the category, the $25,000 to $34,999 income range is the most frequent in Weaubleau, accounting for 30.6% of all households. In contrast, only 3 households (1.2%) fall into the $75,000 to $99,999 income bracket, making it the least populous group.
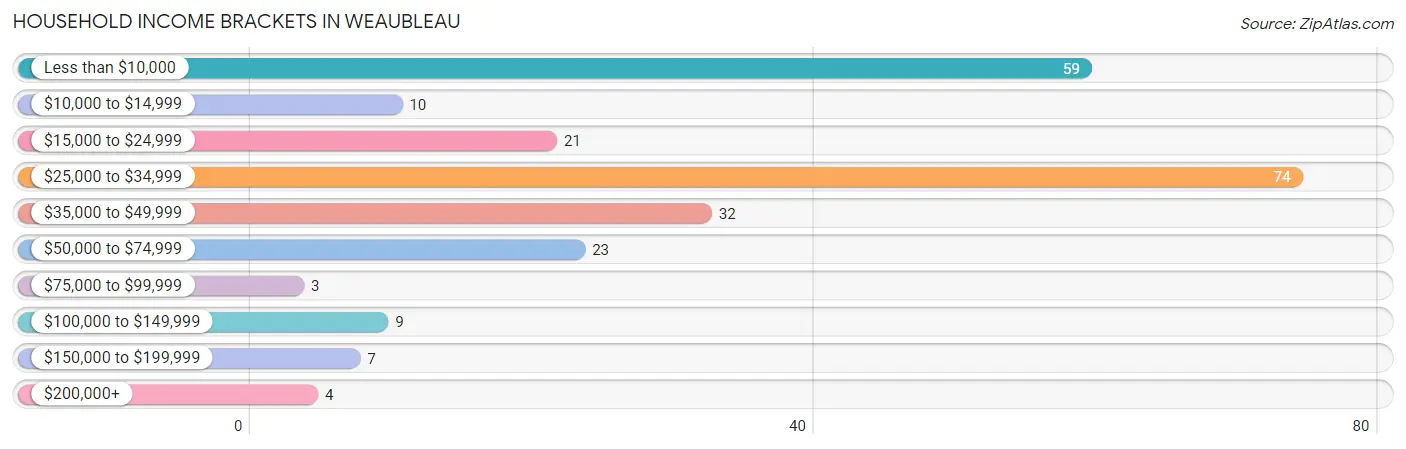
| Income Bracket | # Households | % Households |
| Less than $10,000 | 59 | 24.4% |
| $10,000 to $14,999 | 10 | 4.1% |
| $15,000 to $24,999 | 21 | 8.7% |
| $25,000 to $34,999 | 74 | 30.6% |
| $35,000 to $49,999 | 32 | 13.2% |
| $50,000 to $74,999 | 23 | 9.5% |
| $75,000 to $99,999 | 3 | 1.2% |
| $100,000 to $149,999 | 9 | 3.7% |
| $150,000 to $199,999 | 7 | 2.9% |
| $200,000+ | 4 | 1.7% |
Household Income by Householder Age in Weaubleau
The median household income in Weaubleau is $28,402, with the highest median household income of $43,542 found in the 65+ years age bracket for the primary householder. A total of 81 households (33.5%) fall into this category. Meanwhile, the 15 to 24 years age bracket for the primary householder has the lowest median household income of $0, with 1 households (0.4%) in this group.
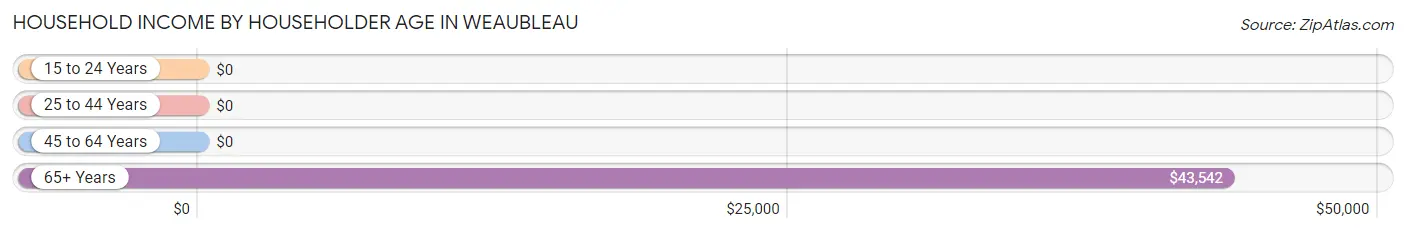
| Income Bracket | # Households | Median Income |
| 15 to 24 Years | 1 (0.4%) | $0 |
| 25 to 44 Years | 21 (8.7%) | $0 |
| 45 to 64 Years | 139 (57.4%) | $0 |
| 65+ Years | 81 (33.5%) | $43,542 |
| Total | 242 (100.0%) | $28,402 |
Poverty in Weaubleau
Income Below Poverty by Sex and Age in Weaubleau
With 35.2% poverty level for males and 30.7% for females among the residents of Weaubleau, 15 year old males and 18 to 24 year old females are the most vulnerable to poverty, with 14 males (100.0%) and 11 females (55.0%) in their respective age groups living below the poverty level.
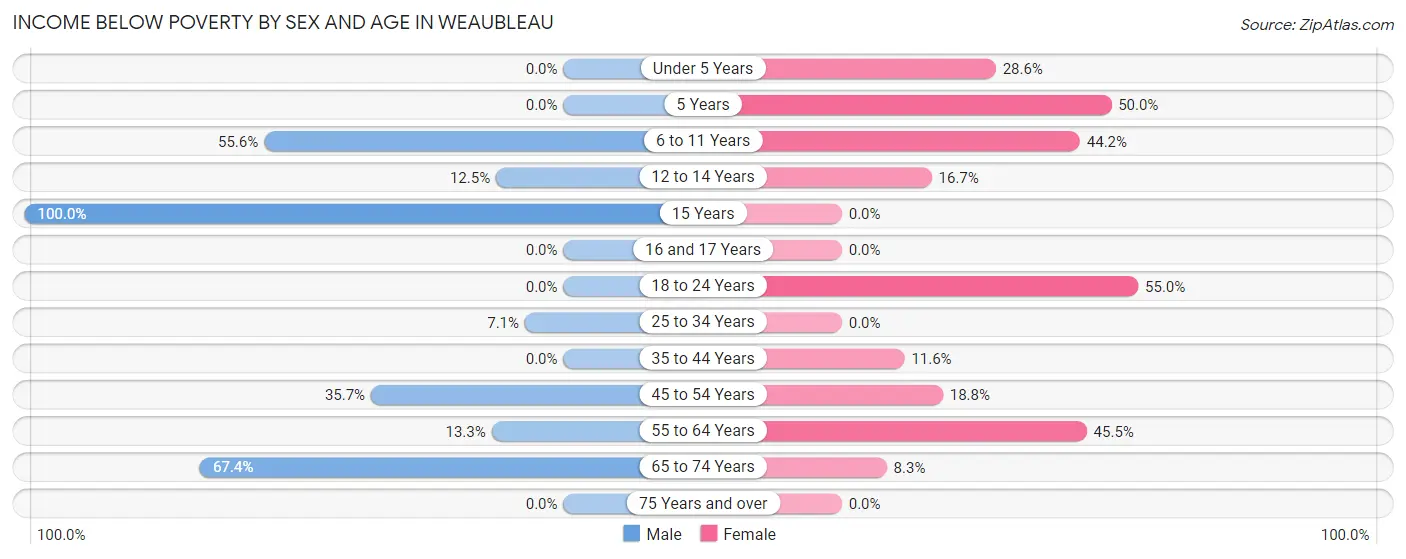
| Age Bracket | Male | Female |
| Under 5 Years | 0 (0.0%) | 2 (28.6%) |
| 5 Years | 0 (0.0%) | 3 (50.0%) |
| 6 to 11 Years | 15 (55.6%) | 19 (44.2%) |
| 12 to 14 Years | 2 (12.5%) | 2 (16.7%) |
| 15 Years | 14 (100.0%) | 0 (0.0%) |
| 16 and 17 Years | 0 (0.0%) | 0 (0.0%) |
| 18 to 24 Years | 0 (0.0%) | 11 (55.0%) |
| 25 to 34 Years | 1 (7.1%) | 0 (0.0%) |
| 35 to 44 Years | 0 (0.0%) | 5 (11.6%) |
| 45 to 54 Years | 5 (35.7%) | 3 (18.8%) |
| 55 to 64 Years | 2 (13.3%) | 55 (45.5%) |
| 65 to 74 Years | 29 (67.4%) | 3 (8.3%) |
| 75 Years and over | 0 (0.0%) | 0 (0.0%) |
| Total | 68 (35.2%) | 103 (30.7%) |
Income Above Poverty by Sex and Age in Weaubleau
According to the poverty statistics in Weaubleau, males aged under 5 years and females aged 15 years are the age groups that are most secure financially, with 100.0% of males and 100.0% of females in these age groups living above the poverty line.
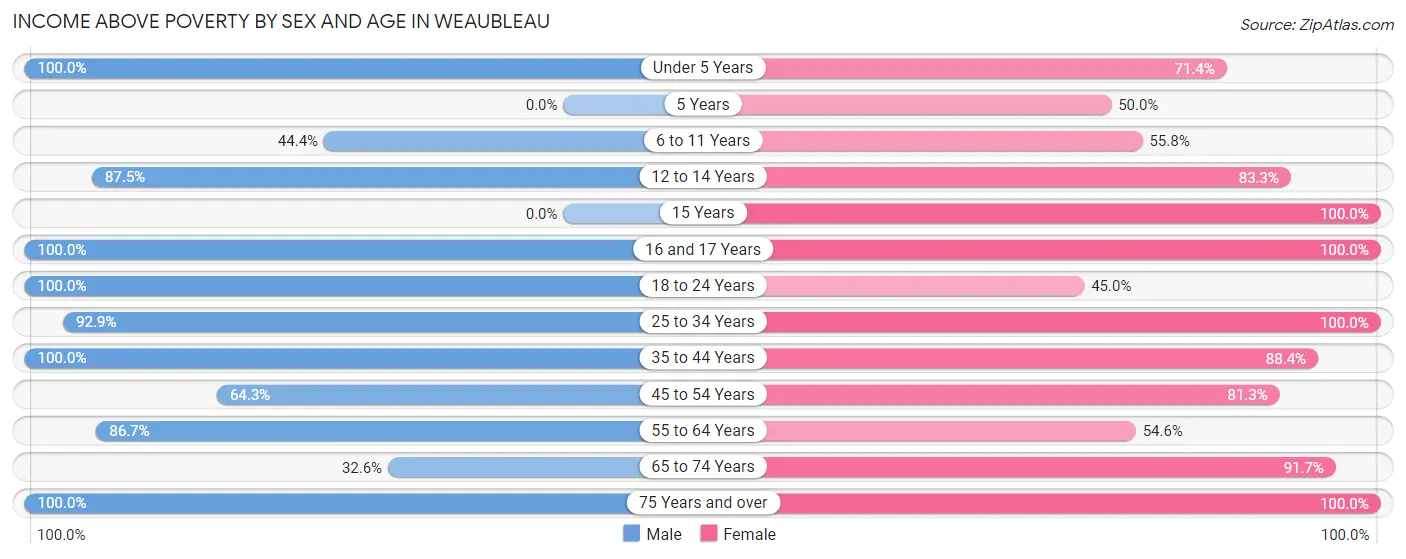
| Age Bracket | Male | Female |
| Under 5 Years | 7 (100.0%) | 5 (71.4%) |
| 5 Years | 0 (0.0%) | 3 (50.0%) |
| 6 to 11 Years | 12 (44.4%) | 24 (55.8%) |
| 12 to 14 Years | 14 (87.5%) | 10 (83.3%) |
| 15 Years | 0 (0.0%) | 2 (100.0%) |
| 16 and 17 Years | 2 (100.0%) | 4 (100.0%) |
| 18 to 24 Years | 6 (100.0%) | 9 (45.0%) |
| 25 to 34 Years | 13 (92.9%) | 9 (100.0%) |
| 35 to 44 Years | 8 (100.0%) | 38 (88.4%) |
| 45 to 54 Years | 9 (64.3%) | 13 (81.2%) |
| 55 to 64 Years | 13 (86.7%) | 66 (54.5%) |
| 65 to 74 Years | 14 (32.6%) | 33 (91.7%) |
| 75 Years and over | 27 (100.0%) | 16 (100.0%) |
| Total | 125 (64.8%) | 232 (69.3%) |
Income Below Poverty Among Married-Couple Families in Weaubleau
The poverty statistics for married-couple families in Weaubleau show that 32.1% or 18 of the total 56 families live below the poverty line. Families with no children have the highest poverty rate of 46.2%, comprising of 18 families. On the other hand, families with 1 or 2 children have the lowest poverty rate of 0.0%, which includes 0 families.
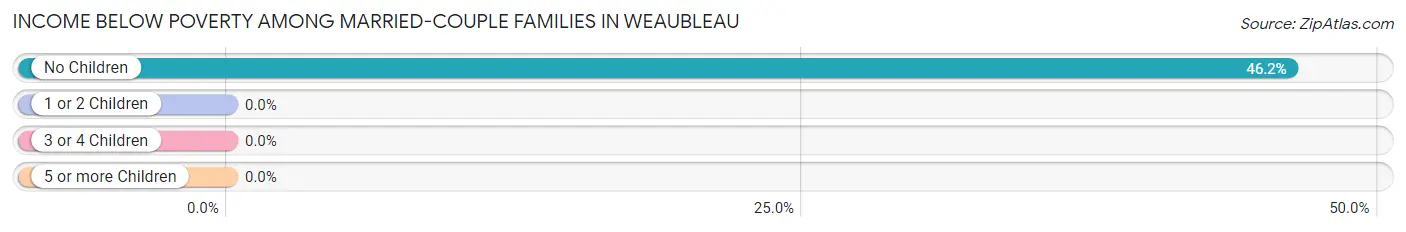
| Children | Above Poverty | Below Poverty |
| No Children | 21 (53.8%) | 18 (46.2%) |
| 1 or 2 Children | 9 (100.0%) | 0 (0.0%) |
| 3 or 4 Children | 5 (100.0%) | 0 (0.0%) |
| 5 or more Children | 3 (100.0%) | 0 (0.0%) |
| Total | 38 (67.9%) | 18 (32.1%) |
Income Below Poverty Among Single-Parent Households in Weaubleau
According to the poverty data in Weaubleau, 100.0% or 1 single-father households and 25.0% or 8 single-mother households are living below the poverty line. Among single-father households, those with 5 or more children have the highest poverty rate, with 1 households (100.0%) experiencing poverty. Likewise, among single-mother households, those with 3 or 4 children have the highest poverty rate, with 5 households (100.0%) falling below the poverty line.
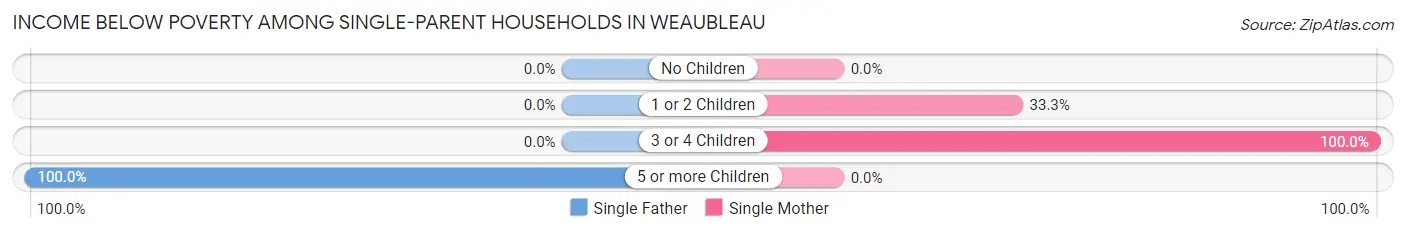
| Children | Single Father | Single Mother |
| No Children | 0 (0.0%) | 0 (0.0%) |
| 1 or 2 Children | 0 (0.0%) | 3 (33.3%) |
| 3 or 4 Children | 0 (0.0%) | 5 (100.0%) |
| 5 or more Children | 1 (100.0%) | 0 (0.0%) |
| Total | 1 (100.0%) | 8 (25.0%) |
Income Below Poverty Among Married-Couple vs Single-Parent Households in Weaubleau
The poverty data for Weaubleau shows that 18 of the married-couple family households (32.1%) and 9 of the single-parent households (27.3%) are living below the poverty level. Within the married-couple family households, those with no children have the highest poverty rate, with 18 households (46.2%) falling below the poverty line. Among the single-parent households, those with 3 or 4 children have the highest poverty rate, with 5 household (100.0%) living below poverty.
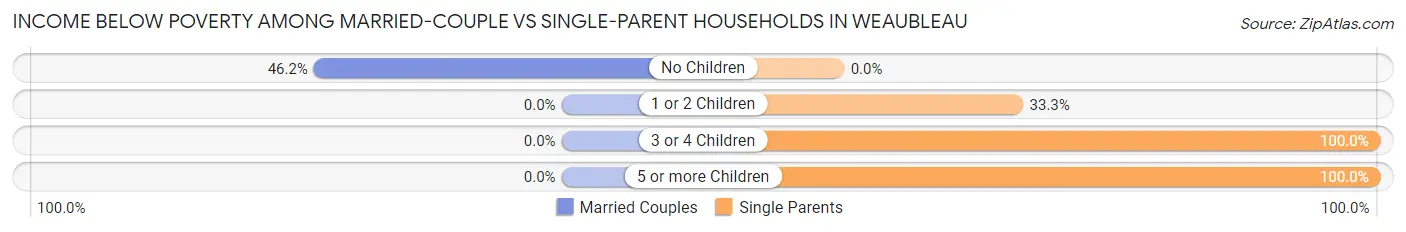
| Children | Married-Couple Families | Single-Parent Households |
| No Children | 18 (46.2%) | 0 (0.0%) |
| 1 or 2 Children | 0 (0.0%) | 3 (33.3%) |
| 3 or 4 Children | 0 (0.0%) | 5 (100.0%) |
| 5 or more Children | 0 (0.0%) | 1 (100.0%) |
| Total | 18 (32.1%) | 9 (27.3%) |
Race in Weaubleau
The most populous races in Weaubleau are White / Caucasian (459 | 86.9%), Two or more Races (69 | 13.1%), and Hispanic or Latino (14 | 2.6%).
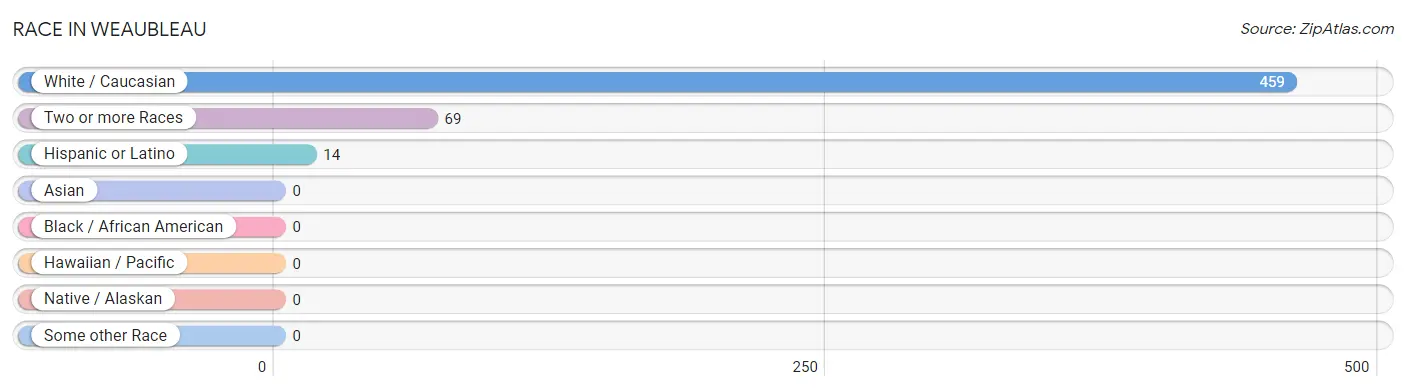
| Race | # Population | % Population |
| Asian | 0 | 0.0% |
| Black / African American | 0 | 0.0% |
| Hawaiian / Pacific | 0 | 0.0% |
| Hispanic or Latino | 14 | 2.6% |
| Native / Alaskan | 0 | 0.0% |
| White / Caucasian | 459 | 86.9% |
| Two or more Races | 69 | 13.1% |
| Some other Race | 0 | 0.0% |
| Total | 528 | 100.0% |
Ancestry in Weaubleau
The most populous ancestries reported in Weaubleau are Irish (79 | 15.0%), English (71 | 13.5%), Scottish (50 | 9.5%), German (43 | 8.1%), and American (34 | 6.4%), together accounting for 52.5% of all Weaubleau residents.
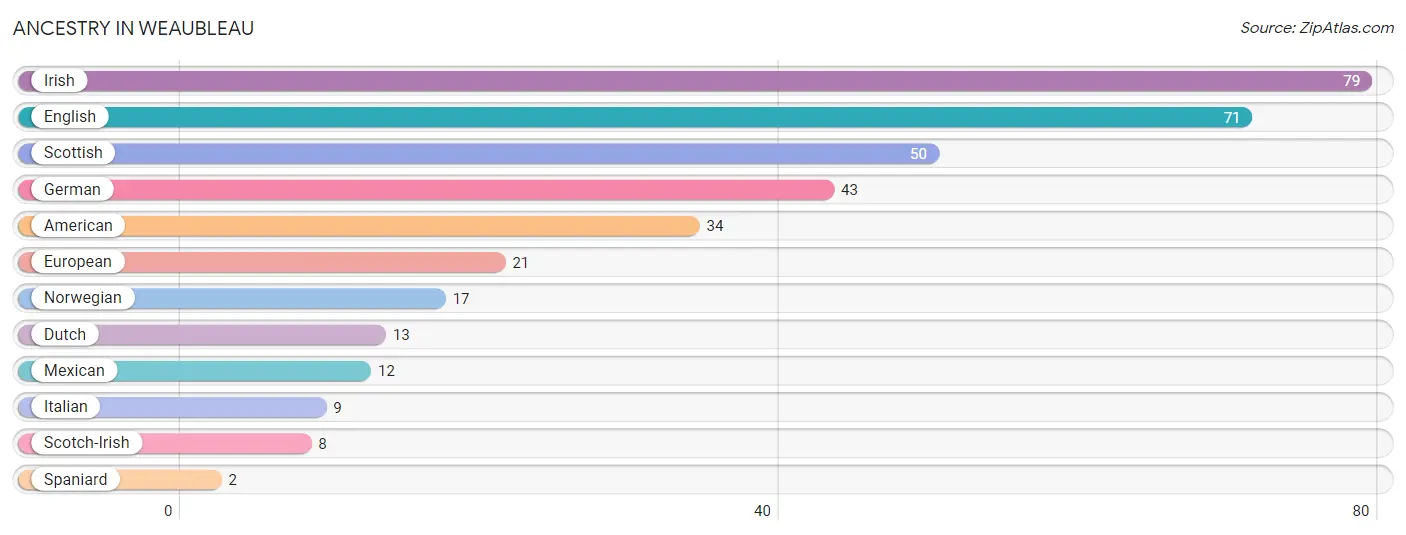
| Ancestry | # Population | % Population |
| American | 34 | 6.4% |
| Dutch | 13 | 2.5% |
| English | 71 | 13.5% |
| European | 21 | 4.0% |
| German | 43 | 8.1% |
| Irish | 79 | 15.0% |
| Italian | 9 | 1.7% |
| Mexican | 12 | 2.3% |
| Norwegian | 17 | 3.2% |
| Scotch-Irish | 8 | 1.5% |
| Scottish | 50 | 9.5% |
| Spaniard | 2 | 0.4% | View All 12 Rows |
Immigrants in Weaubleau

| Immigration Origin | # Population | % Population | View All 0 Rows |
Sex and Age in Weaubleau
Sex and Age in Weaubleau
The most populous age groups in Weaubleau are 65 to 69 Years (42 | 21.8%) for men and 60 to 64 Years (94 | 28.1%) for women.
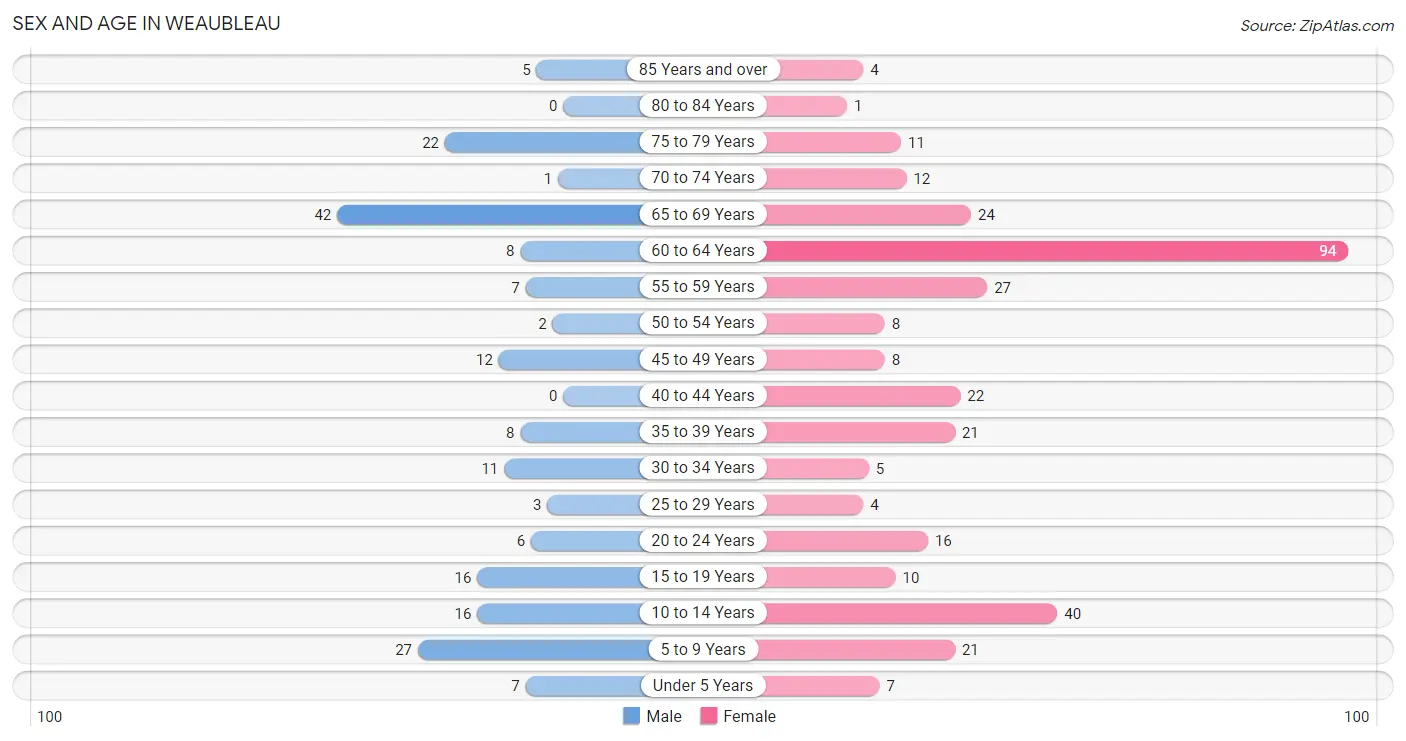
| Age Bracket | Male | Female |
| Under 5 Years | 7 (3.6%) | 7 (2.1%) |
| 5 to 9 Years | 27 (14.0%) | 21 (6.3%) |
| 10 to 14 Years | 16 (8.3%) | 40 (11.9%) |
| 15 to 19 Years | 16 (8.3%) | 10 (3.0%) |
| 20 to 24 Years | 6 (3.1%) | 16 (4.8%) |
| 25 to 29 Years | 3 (1.5%) | 4 (1.2%) |
| 30 to 34 Years | 11 (5.7%) | 5 (1.5%) |
| 35 to 39 Years | 8 (4.2%) | 21 (6.3%) |
| 40 to 44 Years | 0 (0.0%) | 22 (6.6%) |
| 45 to 49 Years | 12 (6.2%) | 8 (2.4%) |
| 50 to 54 Years | 2 (1.0%) | 8 (2.4%) |
| 55 to 59 Years | 7 (3.6%) | 27 (8.1%) |
| 60 to 64 Years | 8 (4.2%) | 94 (28.1%) |
| 65 to 69 Years | 42 (21.8%) | 24 (7.2%) |
| 70 to 74 Years | 1 (0.5%) | 12 (3.6%) |
| 75 to 79 Years | 22 (11.4%) | 11 (3.3%) |
| 80 to 84 Years | 0 (0.0%) | 1 (0.3%) |
| 85 Years and over | 5 (2.6%) | 4 (1.2%) |
| Total | 193 (100.0%) | 335 (100.0%) |
Families and Households in Weaubleau
Median Family Size in Weaubleau
The median family size in Weaubleau is 4.01 persons per family, with single male/father families (1 | 1.1%) accounting for the largest median family size of 12 persons per family. On the other hand, married-couple families (56 | 62.9%) represent the smallest median family size with 3.57 persons per family.
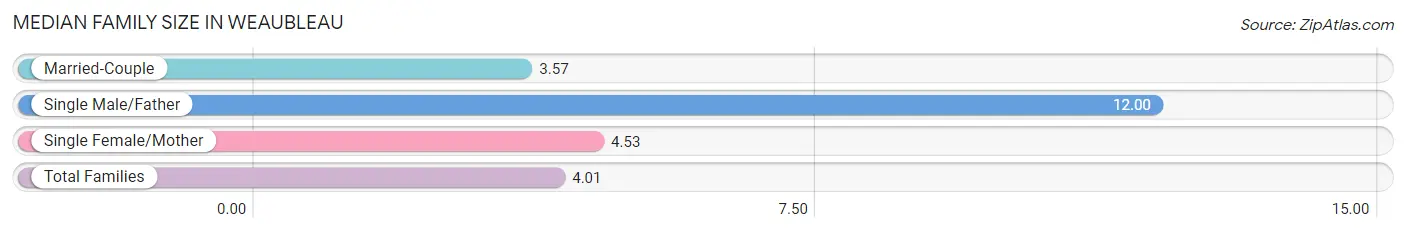
| Family Type | # Families | Family Size |
| Married-Couple | 56 (62.9%) | 3.57 |
| Single Male/Father | 1 (1.1%) | 12.00 |
| Single Female/Mother | 32 (36.0%) | 4.53 |
| Total Families | 89 (100.0%) | 4.01 |
Median Household Size in Weaubleau
The median household size in Weaubleau is 2.18 persons per household, with single male/father households (1 | 0.4%) accounting for the largest median household size of 12 persons per household. non-family households (153 | 63.2%) represent the smallest median household size with 1.08 persons per household.
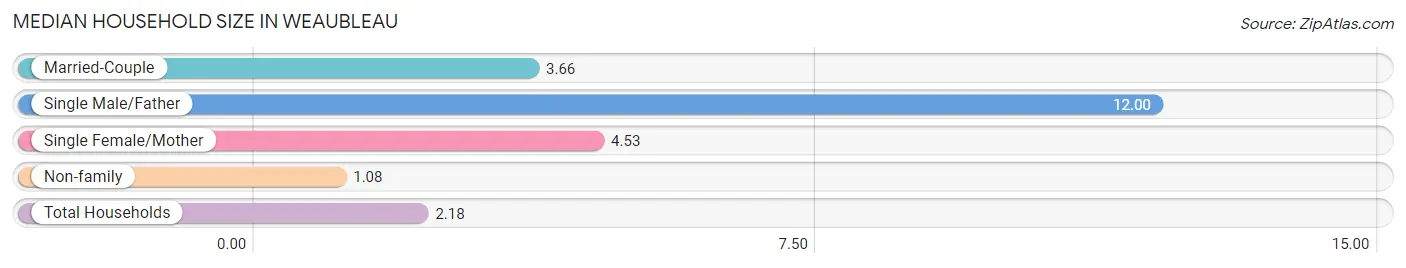
| Household Type | # Households | Household Size |
| Married-Couple | 56 (23.1%) | 3.66 |
| Single Male/Father | 1 (0.4%) | 12.00 |
| Single Female/Mother | 32 (13.2%) | 4.53 |
| Non-family | 153 (63.2%) | 1.08 |
| Total Households | 242 (100.0%) | 2.18 |
Household Size by Marriage Status in Weaubleau
Out of a total of 242 households in Weaubleau, 89 (36.8%) are family households, while 153 (63.2%) are nonfamily households. The most numerous type of family households are 2-person households, comprising 56, and the most common type of nonfamily households are 1-person households, comprising 142.
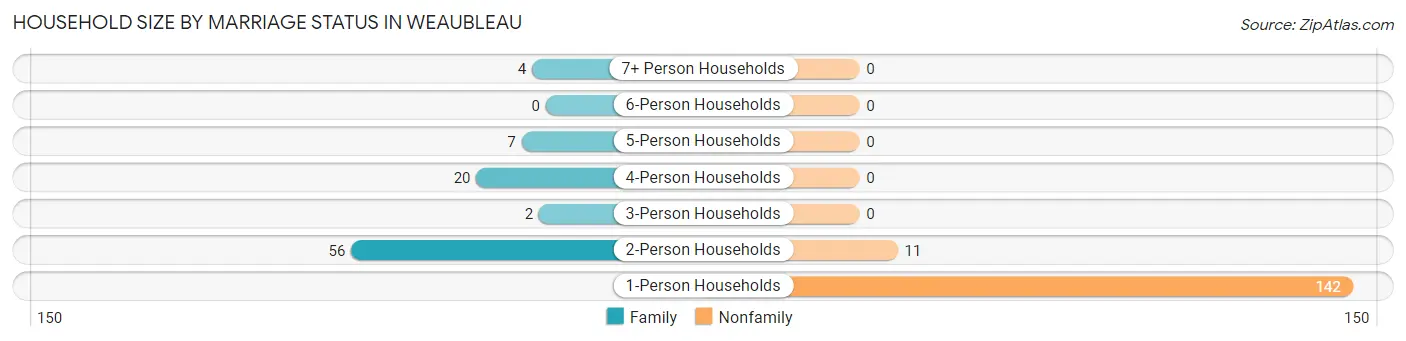
| Household Size | Family Households | Nonfamily Households |
| 1-Person Households | - | 142 (58.7%) |
| 2-Person Households | 56 (23.1%) | 11 (4.5%) |
| 3-Person Households | 2 (0.8%) | 0 (0.0%) |
| 4-Person Households | 20 (8.3%) | 0 (0.0%) |
| 5-Person Households | 7 (2.9%) | 0 (0.0%) |
| 6-Person Households | 0 (0.0%) | 0 (0.0%) |
| 7+ Person Households | 4 (1.7%) | 0 (0.0%) |
| Total | 89 (36.8%) | 153 (63.2%) |
Female Fertility in Weaubleau
Fertility by Age in Weaubleau
| Age Bracket | Women with Births | Births / 1,000 Women |
| 15 to 19 years | 0 (0.0%) | 0.0 |
| 20 to 34 years | 0 (0.0%) | 0.0 |
| 35 to 50 years | 0 (0.0%) | 0.0 |
| Total | 0 (0.0%) | 0.0 |
Fertility by Age by Marriage Status in Weaubleau
| Age Bracket | Married | Unmarried |
| 15 to 19 years | 0 (0.0%) | 0 (0.0%) |
| 20 to 34 years | 0 (0.0%) | 0 (0.0%) |
| 35 to 50 years | 0 (0.0%) | 0 (0.0%) |
| Total | 0 (0.0%) | 0 (0.0%) |
Fertility by Education in Weaubleau
| Educational Attainment | Women with Births | Births / 1,000 Women |
| Less than High School | 0 (0.0%) | 0.0 |
| High School Diploma | 0 (0.0%) | 0.0 |
| College or Associate's Degree | 0 (0.0%) | 0.0 |
| Bachelor's Degree | 0 (0.0%) | 0.0 |
| Graduate Degree | 0 (0.0%) | 0.0 |
| Total | 0 (0.0%) | 0.0 |
Fertility by Education by Marriage Status in Weaubleau
| Educational Attainment | Married | Unmarried |
| Less than High School | 0 (0.0%) | 0 (0.0%) |
| High School Diploma | 0 (0.0%) | 0 (0.0%) |
| College or Associate's Degree | 0 (0.0%) | 0 (0.0%) |
| Bachelor's Degree | 0 (0.0%) | 0 (0.0%) |
| Graduate Degree | 0 (0.0%) | 0 (0.0%) |
| Total | 0 (0.0%) | 0 (0.0%) |
Employment Characteristics in Weaubleau
Employment by Class of Employer in Weaubleau
Among the 195 employed individuals in Weaubleau, private company employees (99 | 50.8%), federal government employees (58 | 29.7%), and not-for-profit organizations (28 | 14.4%) make up the most common classes of employment.
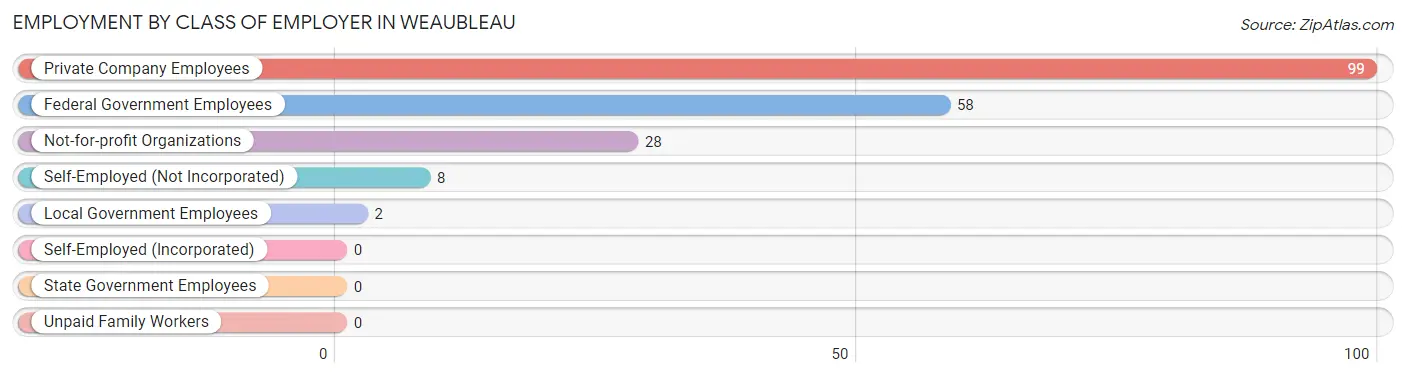
| Employer Class | # Employees | % Employees |
| Private Company Employees | 99 | 50.8% |
| Self-Employed (Incorporated) | 0 | 0.0% |
| Self-Employed (Not Incorporated) | 8 | 4.1% |
| Not-for-profit Organizations | 28 | 14.4% |
| Local Government Employees | 2 | 1.0% |
| State Government Employees | 0 | 0.0% |
| Federal Government Employees | 58 | 29.7% |
| Unpaid Family Workers | 0 | 0.0% |
| Total | 195 | 100.0% |
Employment Status by Age in Weaubleau
According to the labor force statistics for Weaubleau, out of the total population over 16 years of age (394), 50.0% or 197 individuals are in the labor force, with 1.0% or 2 of them unemployed. The age group with the highest labor force participation rate is 20 to 24 years, with 100.0% or 22 individuals in the labor force. Within the labor force, the 45 to 54 years age range has the highest percentage of unemployed individuals, with 10.0% or 2 of them being unemployed.
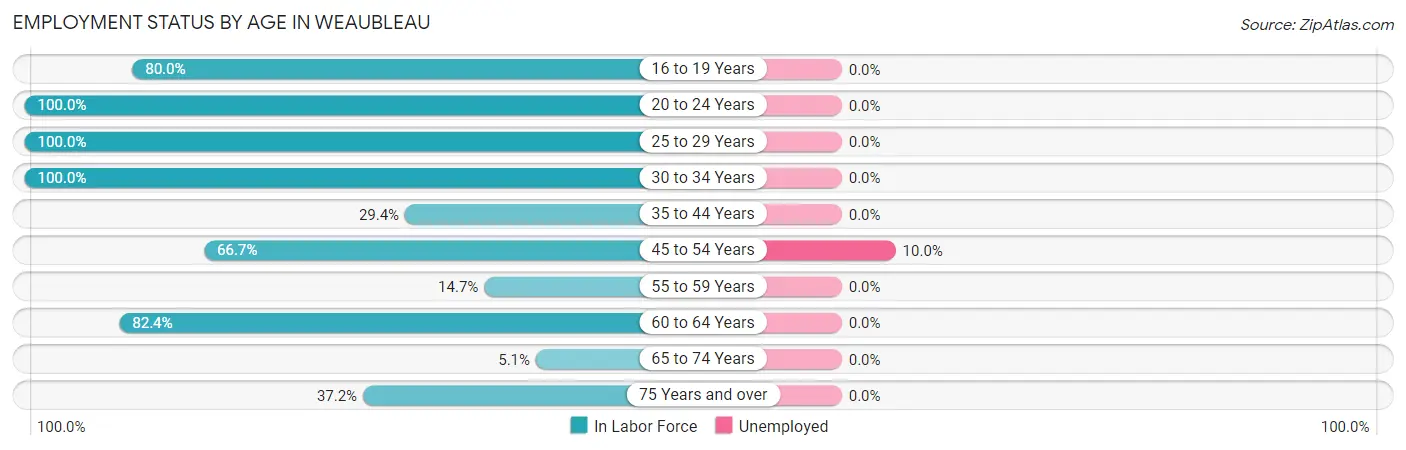
| Age Bracket | In Labor Force | Unemployed |
| 16 to 19 Years | 8 (80.0%) | 0 (0.0%) |
| 20 to 24 Years | 22 (100.0%) | 0 (0.0%) |
| 25 to 29 Years | 7 (100.0%) | 0 (0.0%) |
| 30 to 34 Years | 16 (100.0%) | 0 (0.0%) |
| 35 to 44 Years | 15 (29.4%) | 0 (0.0%) |
| 45 to 54 Years | 20 (66.7%) | 2 (10.0%) |
| 55 to 59 Years | 5 (14.7%) | 0 (0.0%) |
| 60 to 64 Years | 84 (82.4%) | 0 (0.0%) |
| 65 to 74 Years | 4 (5.1%) | 0 (0.0%) |
| 75 Years and over | 16 (37.2%) | 0 (0.0%) |
| Total | 197 (50.0%) | 2 (1.0%) |
Employment Status by Educational Attainment in Weaubleau
According to labor force statistics for Weaubleau, 61.3% of individuals (147) out of the total population between 25 and 64 years of age (240) are in the labor force, with 1.4% or 2 of them being unemployed. The group with the highest labor force participation rate are those with the educational attainment of high school diploma, with 83.9% or 99 individuals in the labor force. Within the labor force, individuals with less than high school education have the highest percentage of unemployment, with 12.5% or 2 of them being unemployed.
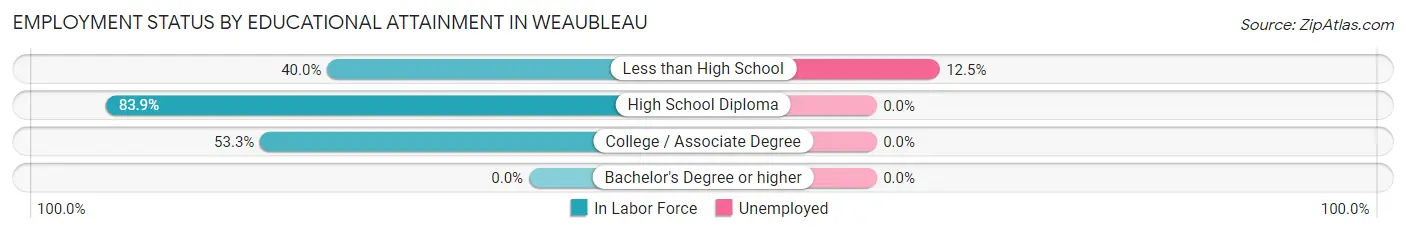
| Educational Attainment | In Labor Force | Unemployed |
| Less than High School | 16 (40.0%) | 5 (12.5%) |
| High School Diploma | 99 (83.9%) | 0 (0.0%) |
| College / Associate Degree | 32 (53.3%) | 0 (0.0%) |
| Bachelor's Degree or higher | 0 (0.0%) | 0 (0.0%) |
| Total | 147 (61.3%) | 3 (1.4%) |
Employment Occupations by Sex in Weaubleau
Management, Business, Science and Arts Occupations
The most common Management, Business, Science and Arts occupations in Weaubleau are Community & Social Service (16 | 8.2%), Education, Arts & Media (16 | 8.2%), Computers, Engineering & Science (2 | 1.0%), and Architecture & Engineering (2 | 1.0%).
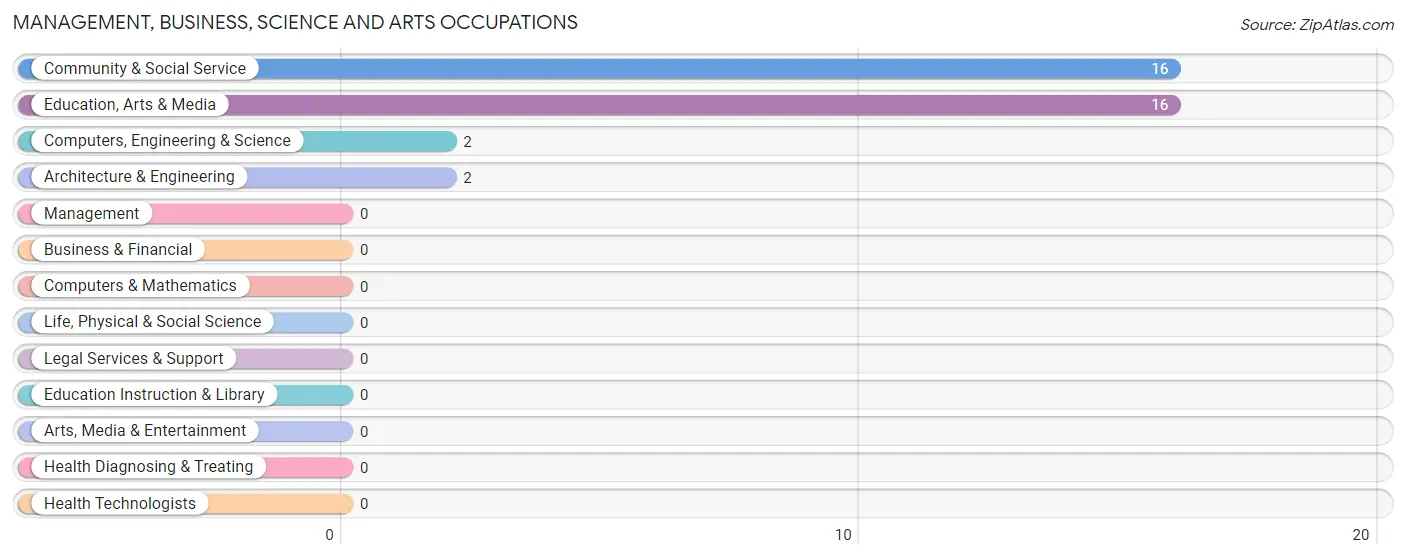
Management, Business, Science and Arts Occupations by Sex
Within the Management, Business, Science and Arts occupations in Weaubleau, the most male-oriented occupations are Community & Social Service (100.0%), and Education, Arts & Media (100.0%), while the most female-oriented occupations are Computers, Engineering & Science (100.0%), and Architecture & Engineering (100.0%).
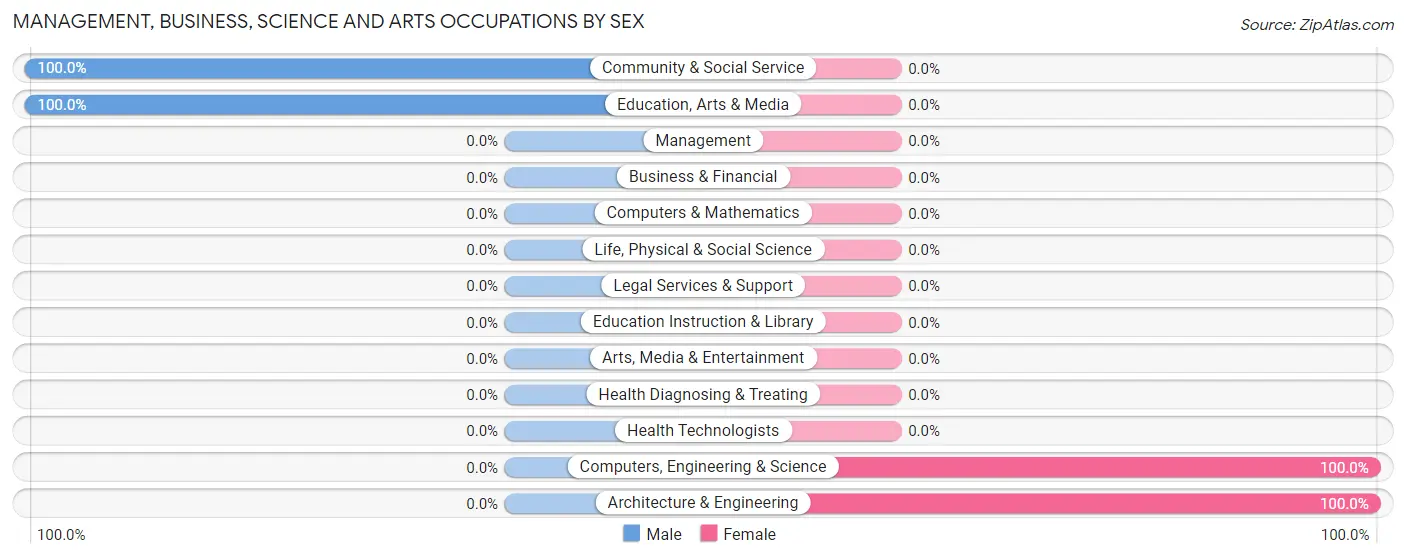
| Occupation | Male | Female |
| Management | 0 (0.0%) | 0 (0.0%) |
| Business & Financial | 0 (0.0%) | 0 (0.0%) |
| Computers, Engineering & Science | 0 (0.0%) | 2 (100.0%) |
| Computers & Mathematics | 0 (0.0%) | 0 (0.0%) |
| Architecture & Engineering | 0 (0.0%) | 2 (100.0%) |
| Life, Physical & Social Science | 0 (0.0%) | 0 (0.0%) |
| Community & Social Service | 16 (100.0%) | 0 (0.0%) |
| Education, Arts & Media | 16 (100.0%) | 0 (0.0%) |
| Legal Services & Support | 0 (0.0%) | 0 (0.0%) |
| Education Instruction & Library | 0 (0.0%) | 0 (0.0%) |
| Arts, Media & Entertainment | 0 (0.0%) | 0 (0.0%) |
| Health Diagnosing & Treating | 0 (0.0%) | 0 (0.0%) |
| Health Technologists | 0 (0.0%) | 0 (0.0%) |
| Total (Category) | 16 (88.9%) | 2 (11.1%) |
| Total (Overall) | 51 (26.2%) | 144 (73.9%) |
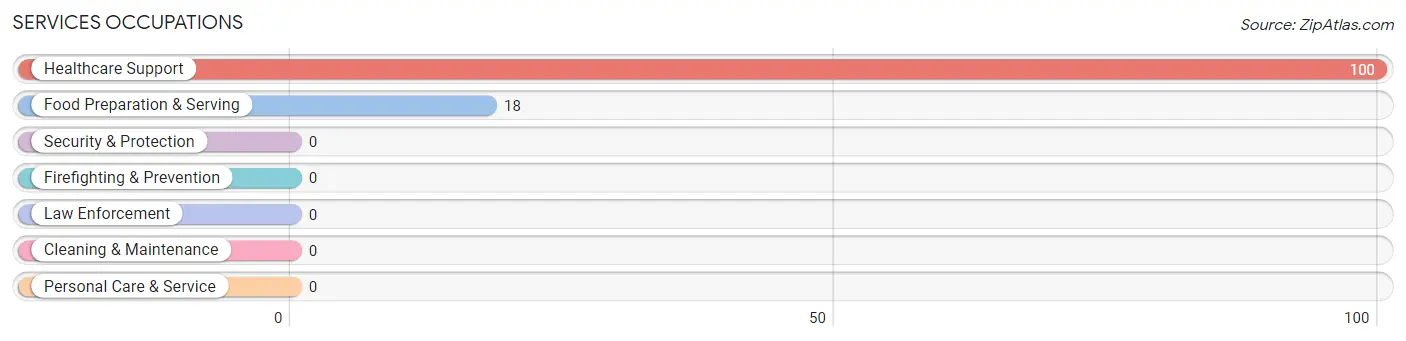
Services Occupations
The most common Services occupations in Weaubleau are Healthcare Support (100 | 51.3%), and Food Preparation & Serving (18 | 9.2%).
Services Occupations by Sex
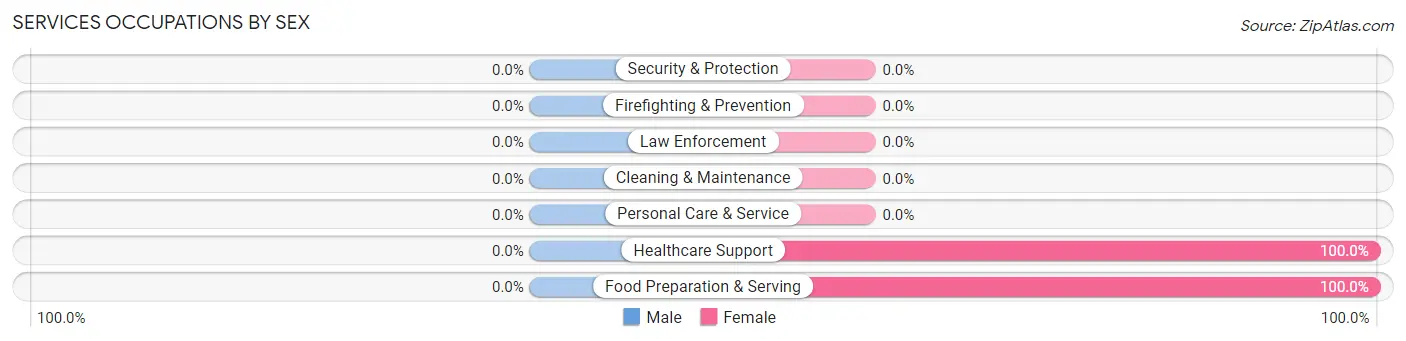
| Occupation | Male | Female |
| Healthcare Support | 0 (0.0%) | 100 (100.0%) |
| Security & Protection | 0 (0.0%) | 0 (0.0%) |
| Firefighting & Prevention | 0 (0.0%) | 0 (0.0%) |
| Law Enforcement | 0 (0.0%) | 0 (0.0%) |
| Food Preparation & Serving | 0 (0.0%) | 18 (100.0%) |
| Cleaning & Maintenance | 0 (0.0%) | 0 (0.0%) |
| Personal Care & Service | 0 (0.0%) | 0 (0.0%) |
| Total (Category) | 0 (0.0%) | 118 (100.0%) |
| Total (Overall) | 51 (26.2%) | 144 (73.9%) |
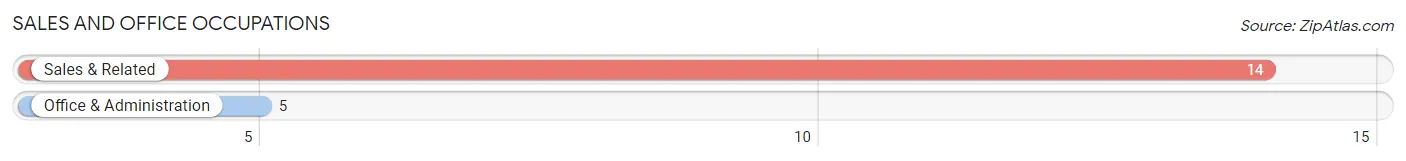
Sales and Office Occupations
The most common Sales and Office occupations in Weaubleau are Sales & Related (14 | 7.2%), and Office & Administration (5 | 2.6%).
Sales and Office Occupations by Sex
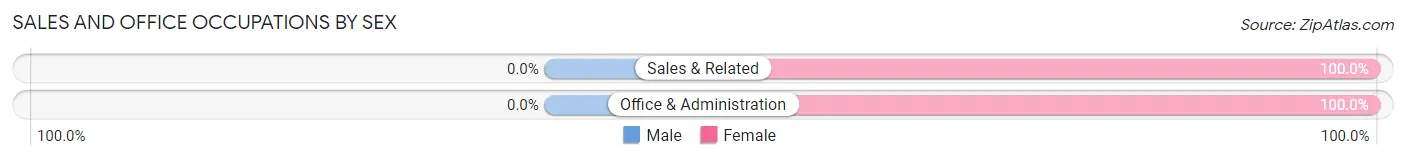
| Occupation | Male | Female |
| Sales & Related | 0 (0.0%) | 14 (100.0%) |
| Office & Administration | 0 (0.0%) | 5 (100.0%) |
| Total (Category) | 0 (0.0%) | 19 (100.0%) |
| Total (Overall) | 51 (26.2%) | 144 (73.9%) |
Natural Resources, Construction and Maintenance Occupations
The most common Natural Resources, Construction and Maintenance occupations in Weaubleau are Installation, Maintenance & Repair (9 | 4.6%), and Farming, Fishing & Forestry (5 | 2.6%).
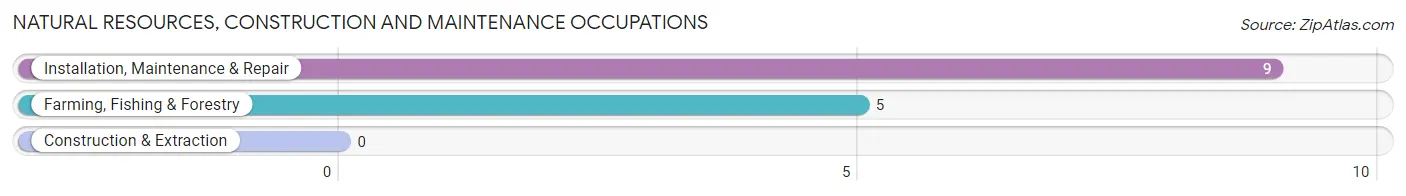
Natural Resources, Construction and Maintenance Occupations by Sex
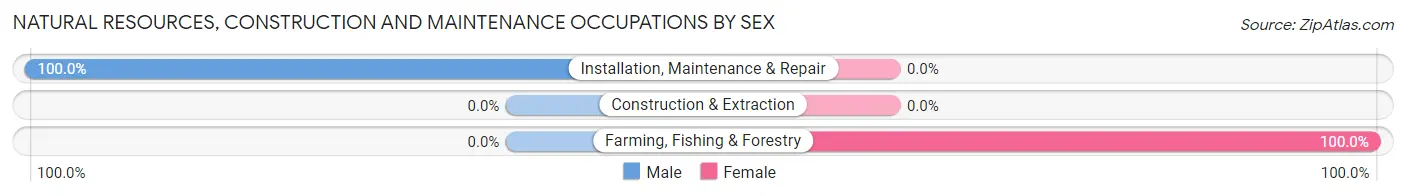
| Occupation | Male | Female |
| Farming, Fishing & Forestry | 0 (0.0%) | 5 (100.0%) |
| Construction & Extraction | 0 (0.0%) | 0 (0.0%) |
| Installation, Maintenance & Repair | 9 (100.0%) | 0 (0.0%) |
| Total (Category) | 9 (64.3%) | 5 (35.7%) |
| Total (Overall) | 51 (26.2%) | 144 (73.9%) |
Production, Transportation and Moving Occupations
The most common Production, Transportation and Moving occupations in Weaubleau are Transportation (12 | 6.1%), Production (8 | 4.1%), and Material Moving (6 | 3.1%).
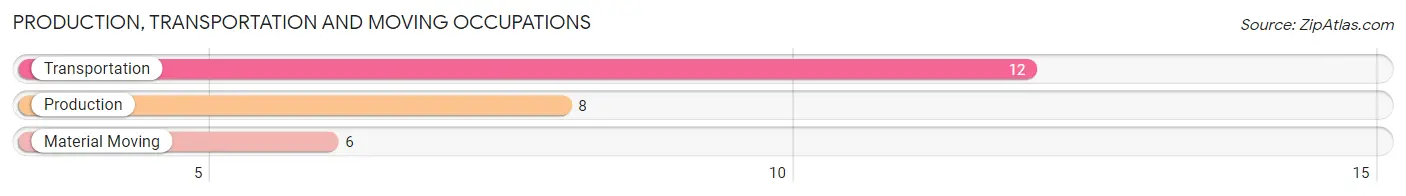
Production, Transportation and Moving Occupations by Sex
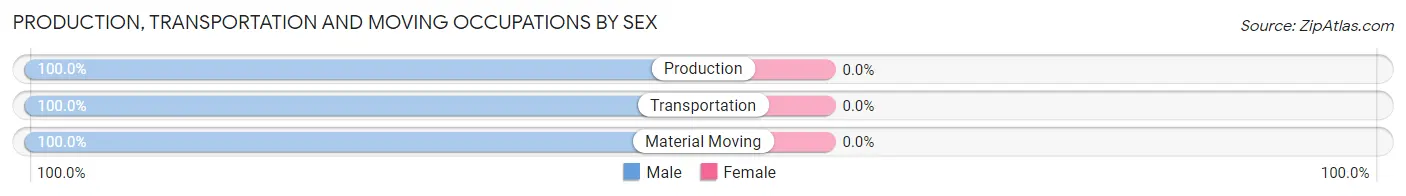
| Occupation | Male | Female |
| Production | 8 (100.0%) | 0 (0.0%) |
| Transportation | 12 (100.0%) | 0 (0.0%) |
| Material Moving | 6 (100.0%) | 0 (0.0%) |
| Total (Category) | 26 (100.0%) | 0 (0.0%) |
| Total (Overall) | 51 (26.2%) | 144 (73.9%) |
Employment Industries by Sex in Weaubleau
Employment Industries in Weaubleau
The major employment industries in Weaubleau include Health Care & Social Assistance (60 | 30.8%), Public Administration (55 | 28.2%), Retail Trade (20 | 10.3%), Construction (11 | 5.6%), and Transportation & Warehousing (11 | 5.6%).
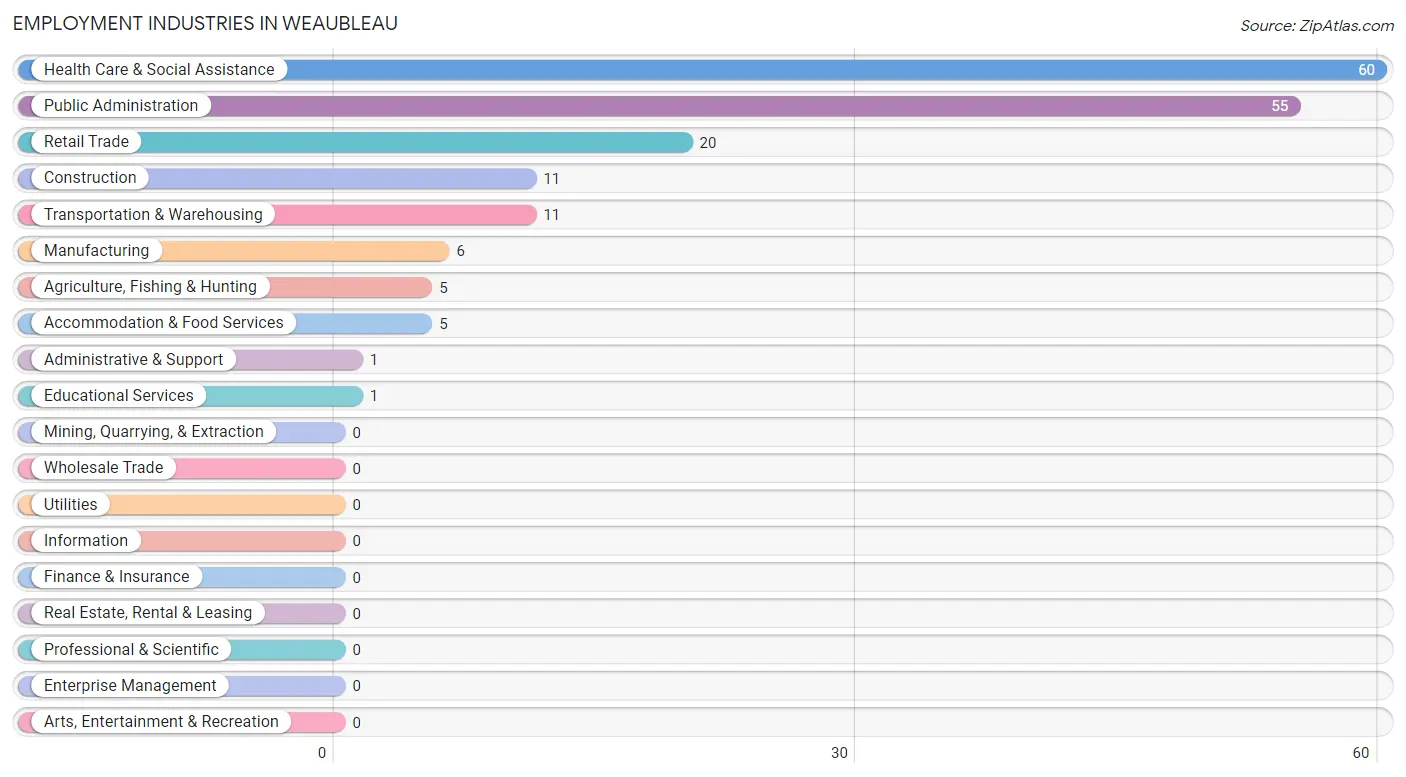
Employment Industries by Sex in Weaubleau
The Weaubleau industries that see more men than women are Construction (100.0%), Manufacturing (100.0%), and Transportation & Warehousing (100.0%), whereas the industries that tend to have a higher number of women are Agriculture, Fishing & Hunting (100.0%), Educational Services (100.0%), and Health Care & Social Assistance (100.0%).
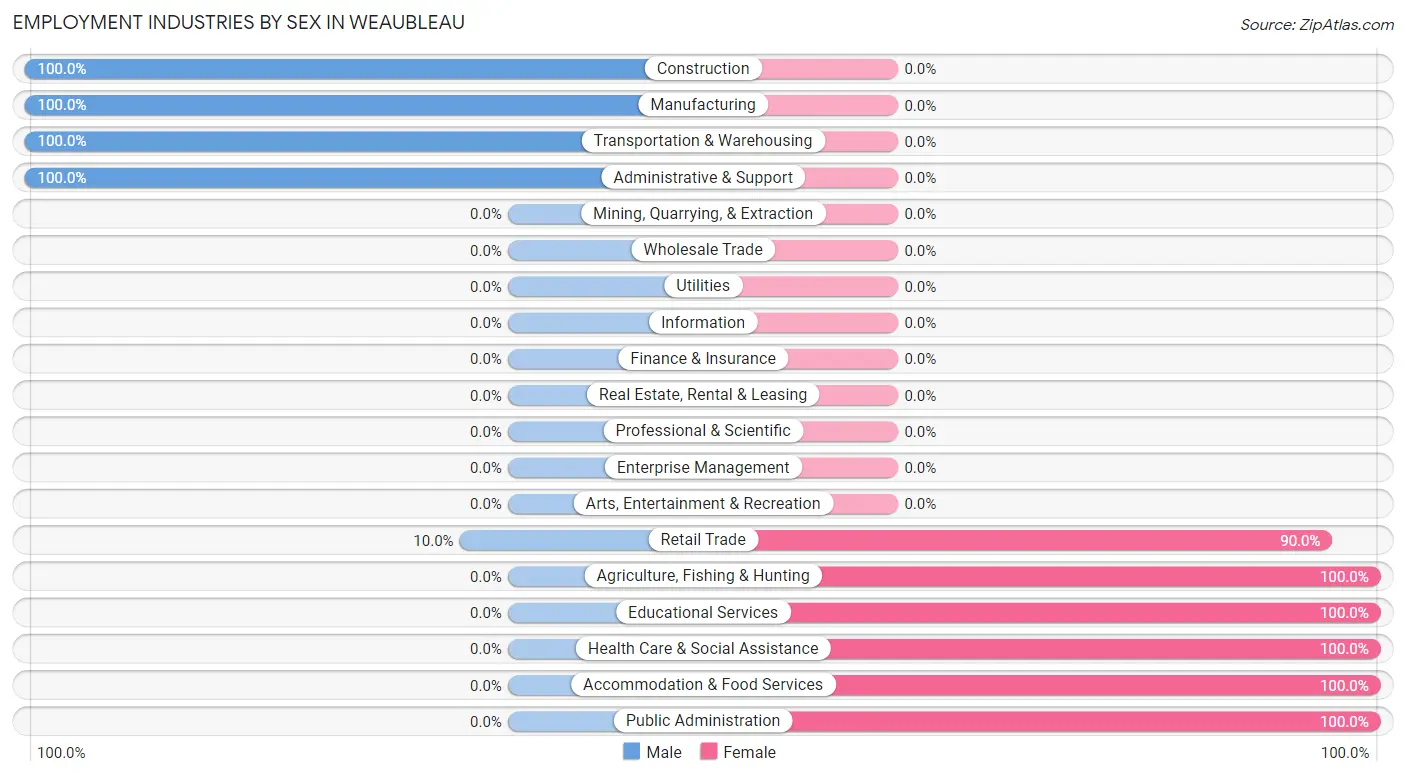
| Industry | Male | Female |
| Agriculture, Fishing & Hunting | 0 (0.0%) | 5 (100.0%) |
| Mining, Quarrying, & Extraction | 0 (0.0%) | 0 (0.0%) |
| Construction | 11 (100.0%) | 0 (0.0%) |
| Manufacturing | 6 (100.0%) | 0 (0.0%) |
| Wholesale Trade | 0 (0.0%) | 0 (0.0%) |
| Retail Trade | 2 (10.0%) | 18 (90.0%) |
| Transportation & Warehousing | 11 (100.0%) | 0 (0.0%) |
| Utilities | 0 (0.0%) | 0 (0.0%) |
| Information | 0 (0.0%) | 0 (0.0%) |
| Finance & Insurance | 0 (0.0%) | 0 (0.0%) |
| Real Estate, Rental & Leasing | 0 (0.0%) | 0 (0.0%) |
| Professional & Scientific | 0 (0.0%) | 0 (0.0%) |
| Enterprise Management | 0 (0.0%) | 0 (0.0%) |
| Administrative & Support | 1 (100.0%) | 0 (0.0%) |
| Educational Services | 0 (0.0%) | 1 (100.0%) |
| Health Care & Social Assistance | 0 (0.0%) | 60 (100.0%) |
| Arts, Entertainment & Recreation | 0 (0.0%) | 0 (0.0%) |
| Accommodation & Food Services | 0 (0.0%) | 5 (100.0%) |
| Public Administration | 0 (0.0%) | 55 (100.0%) |
| Total | 51 (26.2%) | 144 (73.9%) |
Education in Weaubleau
School Enrollment in Weaubleau
The most common levels of schooling among the 132 students in Weaubleau are middle school (56 | 42.4%), elementary school (37 | 28.0%), and high school (27 | 20.4%).
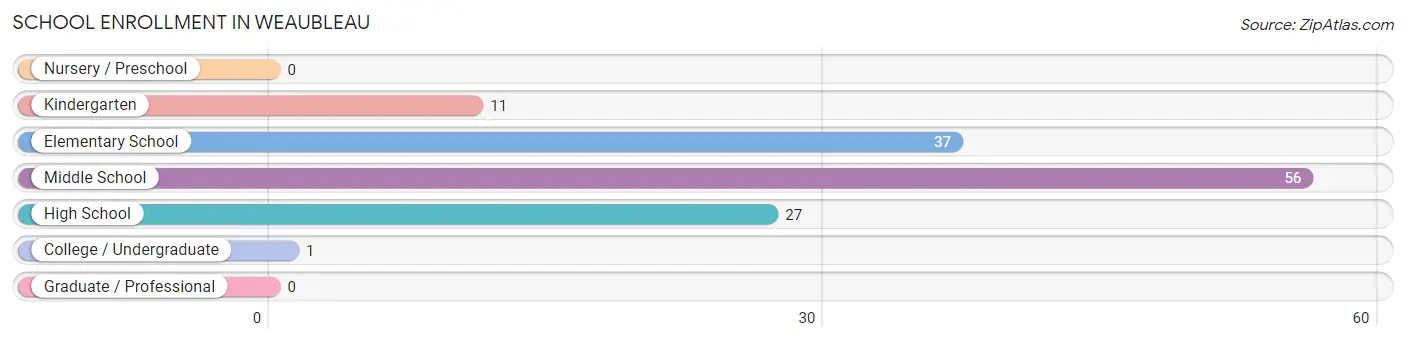
| School Level | # Students | % Students |
| Nursery / Preschool | 0 | 0.0% |
| Kindergarten | 11 | 8.3% |
| Elementary School | 37 | 28.0% |
| Middle School | 56 | 42.4% |
| High School | 27 | 20.4% |
| College / Undergraduate | 1 | 0.8% |
| Graduate / Professional | 0 | 0.0% |
| Total | 132 | 100.0% |
School Enrollment by Age by Funding Source in Weaubleau
Out of a total of 132 students who are enrolled in schools in Weaubleau, 16 (12.1%) attend a private institution, while the remaining 116 (87.9%) are enrolled in public schools. The age group of 35 years and over has the highest likelihood of being enrolled in private schools, with 1 (50.0% in the age bracket) enrolled. Conversely, the age group of 18 to 19 year olds has the lowest likelihood of being enrolled in a private school, with 4 (100.0% in the age bracket) attending a public institution.
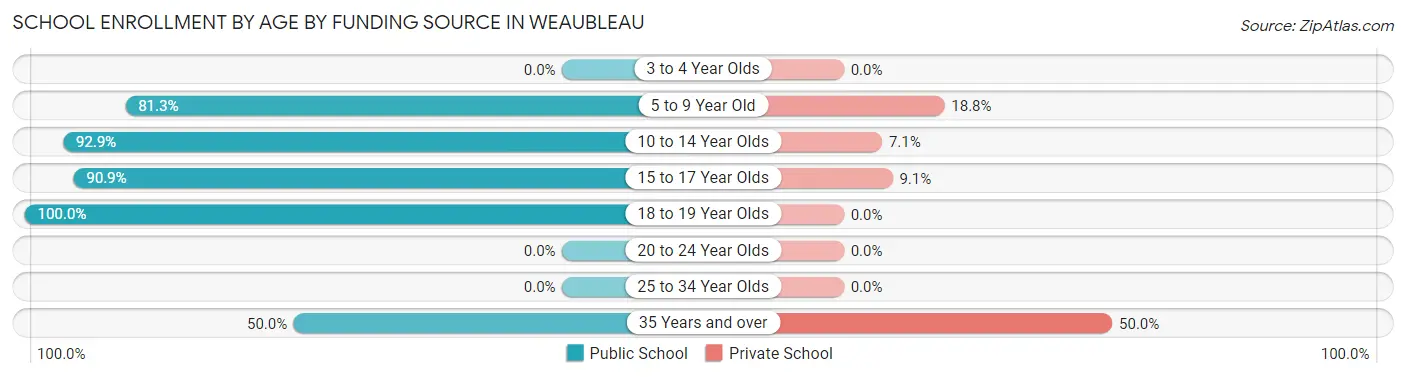
| Age Bracket | Public School | Private School |
| 3 to 4 Year Olds | 0 (0.0%) | 0 (0.0%) |
| 5 to 9 Year Old | 39 (81.2%) | 9 (18.8%) |
| 10 to 14 Year Olds | 52 (92.9%) | 4 (7.1%) |
| 15 to 17 Year Olds | 20 (90.9%) | 2 (9.1%) |
| 18 to 19 Year Olds | 4 (100.0%) | 0 (0.0%) |
| 20 to 24 Year Olds | 0 (0.0%) | 0 (0.0%) |
| 25 to 34 Year Olds | 0 (0.0%) | 0 (0.0%) |
| 35 Years and over | 1 (50.0%) | 1 (50.0%) |
| Total | 116 (87.9%) | 16 (12.1%) |
Educational Attainment by Field of Study in Weaubleau
Psychology (22 | 36.1%), social sciences (22 | 36.1%), education (16 | 26.2%), and business (1 | 1.6%) are the most common fields of study among 61 individuals in Weaubleau who have obtained a bachelor's degree or higher.
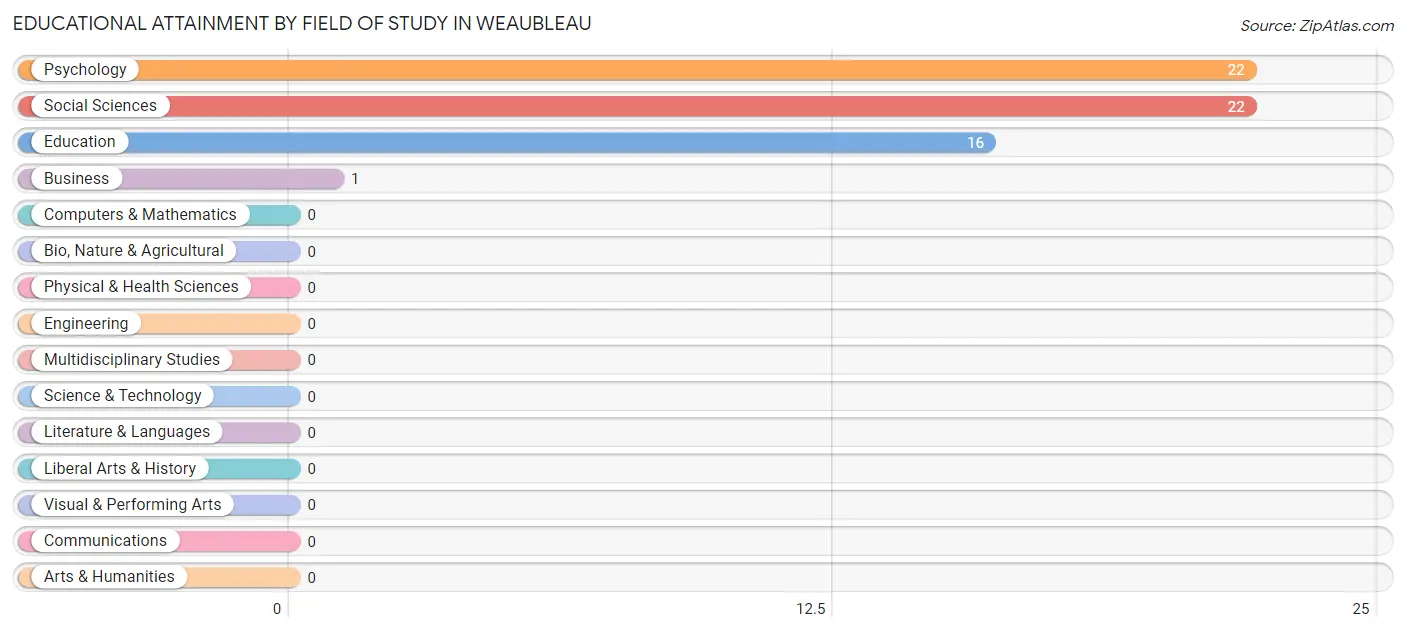
| Field of Study | # Graduates | % Graduates |
| Computers & Mathematics | 0 | 0.0% |
| Bio, Nature & Agricultural | 0 | 0.0% |
| Physical & Health Sciences | 0 | 0.0% |
| Psychology | 22 | 36.1% |
| Social Sciences | 22 | 36.1% |
| Engineering | 0 | 0.0% |
| Multidisciplinary Studies | 0 | 0.0% |
| Science & Technology | 0 | 0.0% |
| Business | 1 | 1.6% |
| Education | 16 | 26.2% |
| Literature & Languages | 0 | 0.0% |
| Liberal Arts & History | 0 | 0.0% |
| Visual & Performing Arts | 0 | 0.0% |
| Communications | 0 | 0.0% |
| Arts & Humanities | 0 | 0.0% |
| Total | 61 | 100.0% |
Transportation & Commute in Weaubleau
Vehicle Availability by Sex in Weaubleau
The most prevalent vehicle ownership categories in Weaubleau are males with 2 vehicles (33, accounting for 64.7%) and females with 2 vehicles (81, making up 22.9%).
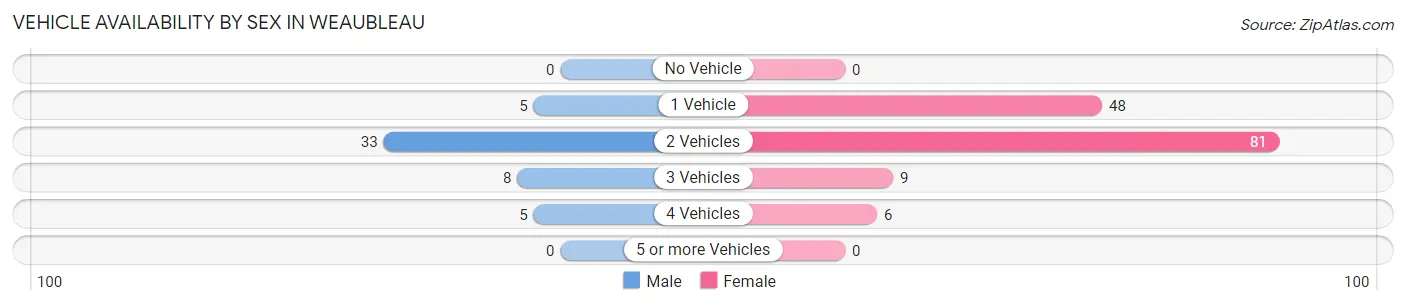
| Vehicles Available | Male | Female |
| No Vehicle | 0 (0.0%) | 0 (0.0%) |
| 1 Vehicle | 5 (9.8%) | 48 (33.3%) |
| 2 Vehicles | 33 (64.7%) | 81 (56.2%) |
| 3 Vehicles | 8 (15.7%) | 9 (6.2%) |
| 4 Vehicles | 5 (9.8%) | 6 (4.2%) |
| 5 or more Vehicles | 0 (0.0%) | 0 (0.0%) |
| Total | 51 (100.0%) | 144 (100.0%) |
Commute Time in Weaubleau
The most frequently occuring commute durations in Weaubleau are 10 to 14 minutes (84 commuters, 43.1%), less than 5 minutes (24 commuters, 12.3%), and 15 to 19 minutes (23 commuters, 11.8%).
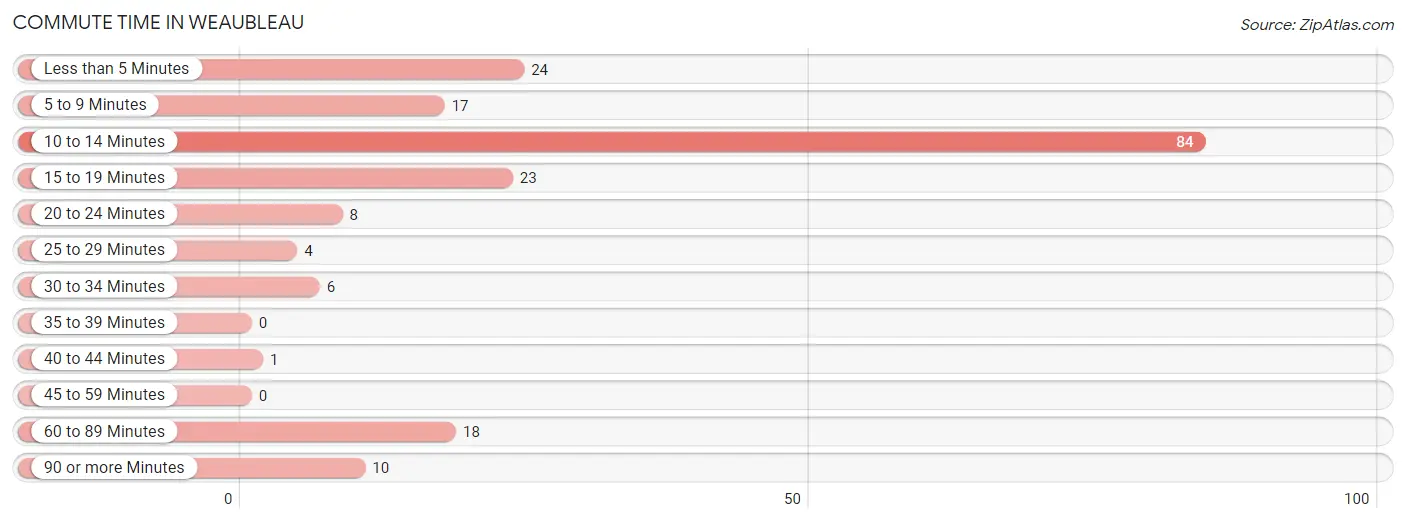
| Commute Time | # Commuters | % Commuters |
| Less than 5 Minutes | 24 | 12.3% |
| 5 to 9 Minutes | 17 | 8.7% |
| 10 to 14 Minutes | 84 | 43.1% |
| 15 to 19 Minutes | 23 | 11.8% |
| 20 to 24 Minutes | 8 | 4.1% |
| 25 to 29 Minutes | 4 | 2.1% |
| 30 to 34 Minutes | 6 | 3.1% |
| 35 to 39 Minutes | 0 | 0.0% |
| 40 to 44 Minutes | 1 | 0.5% |
| 45 to 59 Minutes | 0 | 0.0% |
| 60 to 89 Minutes | 18 | 9.2% |
| 90 or more Minutes | 10 | 5.1% |
Commute Time by Sex in Weaubleau
The most common commute times in Weaubleau are 60 to 89 minutes (18 commuters, 35.3%) for males and 10 to 14 minutes (84 commuters, 58.3%) for females.
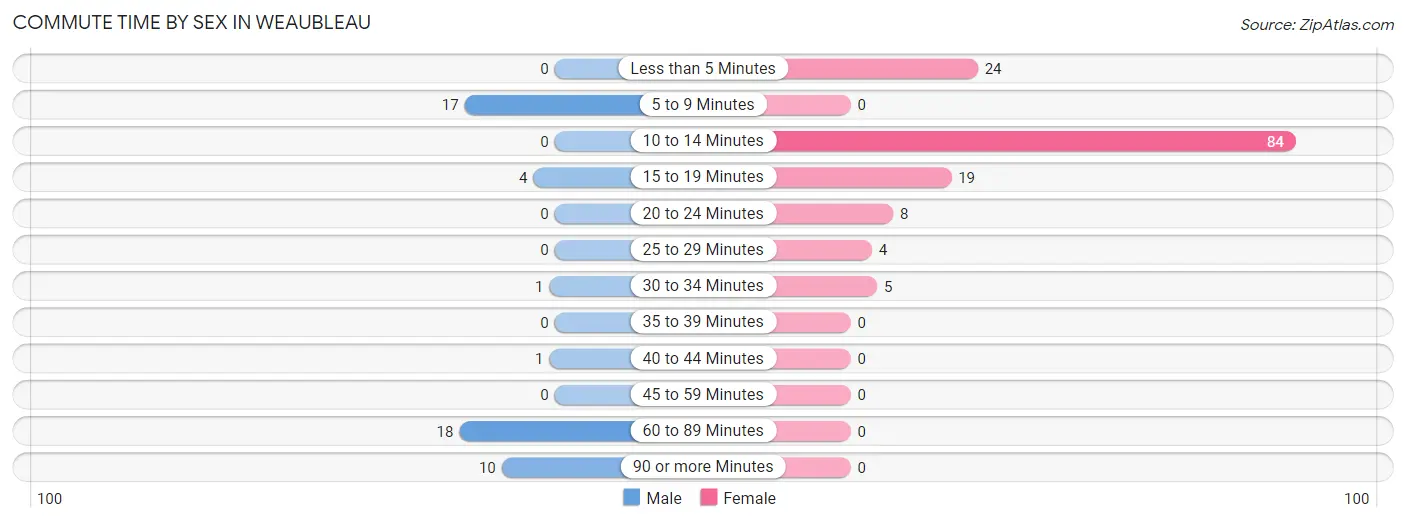
| Commute Time | Male | Female |
| Less than 5 Minutes | 0 (0.0%) | 24 (16.7%) |
| 5 to 9 Minutes | 17 (33.3%) | 0 (0.0%) |
| 10 to 14 Minutes | 0 (0.0%) | 84 (58.3%) |
| 15 to 19 Minutes | 4 (7.8%) | 19 (13.2%) |
| 20 to 24 Minutes | 0 (0.0%) | 8 (5.6%) |
| 25 to 29 Minutes | 0 (0.0%) | 4 (2.8%) |
| 30 to 34 Minutes | 1 (2.0%) | 5 (3.5%) |
| 35 to 39 Minutes | 0 (0.0%) | 0 (0.0%) |
| 40 to 44 Minutes | 1 (2.0%) | 0 (0.0%) |
| 45 to 59 Minutes | 0 (0.0%) | 0 (0.0%) |
| 60 to 89 Minutes | 18 (35.3%) | 0 (0.0%) |
| 90 or more Minutes | 10 (19.6%) | 0 (0.0%) |
Time of Departure to Work by Sex in Weaubleau
The most frequent times of departure to work in Weaubleau are 10:00 AM to 10:59 AM (16, 31.4%) for males and 11:00 AM to 11:59 AM (83, 57.6%) for females.
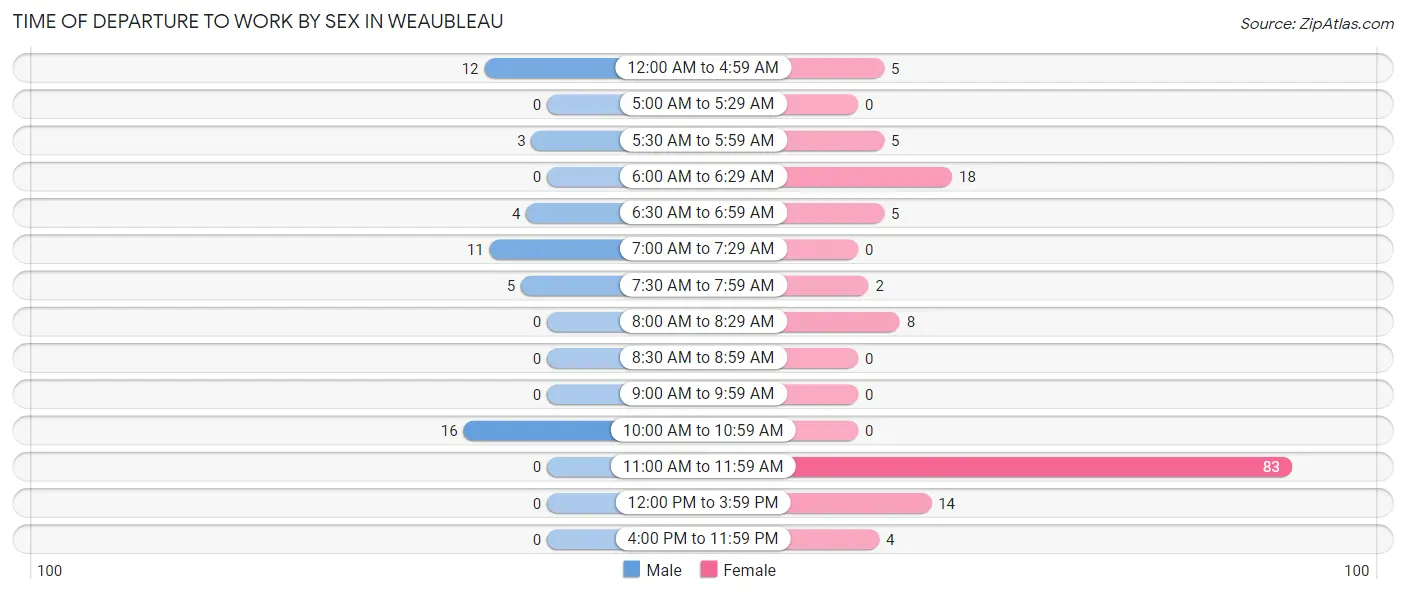
| Time of Departure | Male | Female |
| 12:00 AM to 4:59 AM | 12 (23.5%) | 5 (3.5%) |
| 5:00 AM to 5:29 AM | 0 (0.0%) | 0 (0.0%) |
| 5:30 AM to 5:59 AM | 3 (5.9%) | 5 (3.5%) |
| 6:00 AM to 6:29 AM | 0 (0.0%) | 18 (12.5%) |
| 6:30 AM to 6:59 AM | 4 (7.8%) | 5 (3.5%) |
| 7:00 AM to 7:29 AM | 11 (21.6%) | 0 (0.0%) |
| 7:30 AM to 7:59 AM | 5 (9.8%) | 2 (1.4%) |
| 8:00 AM to 8:29 AM | 0 (0.0%) | 8 (5.6%) |
| 8:30 AM to 8:59 AM | 0 (0.0%) | 0 (0.0%) |
| 9:00 AM to 9:59 AM | 0 (0.0%) | 0 (0.0%) |
| 10:00 AM to 10:59 AM | 16 (31.4%) | 0 (0.0%) |
| 11:00 AM to 11:59 AM | 0 (0.0%) | 83 (57.6%) |
| 12:00 PM to 3:59 PM | 0 (0.0%) | 14 (9.7%) |
| 4:00 PM to 11:59 PM | 0 (0.0%) | 4 (2.8%) |
| Total | 51 (100.0%) | 144 (100.0%) |
Housing Occupancy in Weaubleau
Occupancy by Ownership in Weaubleau
Of the total 242 dwellings in Weaubleau, owner-occupied units account for 176 (72.7%), while renter-occupied units make up 66 (27.3%).
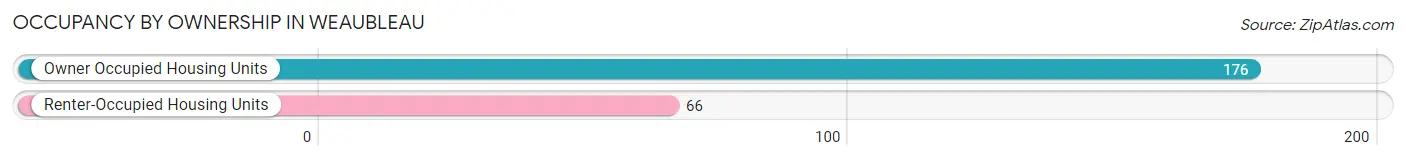
| Occupancy | # Housing Units | % Housing Units |
| Owner Occupied Housing Units | 176 | 72.7% |
| Renter-Occupied Housing Units | 66 | 27.3% |
| Total Occupied Housing Units | 242 | 100.0% |
Occupancy by Household Size in Weaubleau
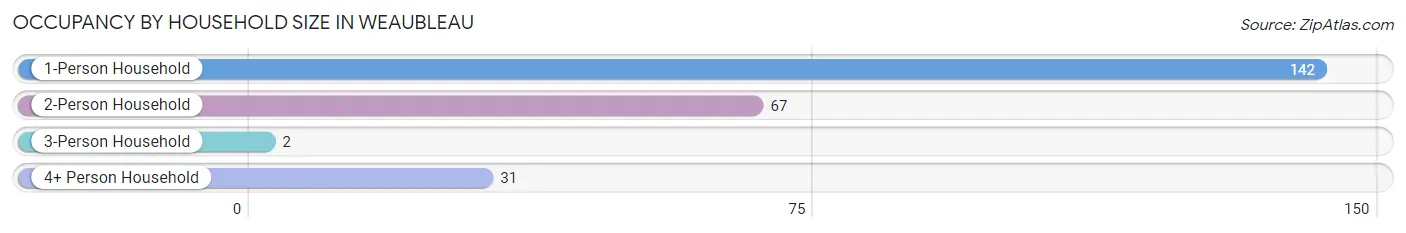
| Household Size | # Housing Units | % Housing Units |
| 1-Person Household | 142 | 58.7% |
| 2-Person Household | 67 | 27.7% |
| 3-Person Household | 2 | 0.8% |
| 4+ Person Household | 31 | 12.8% |
| Total Housing Units | 242 | 100.0% |
Occupancy by Ownership by Household Size in Weaubleau
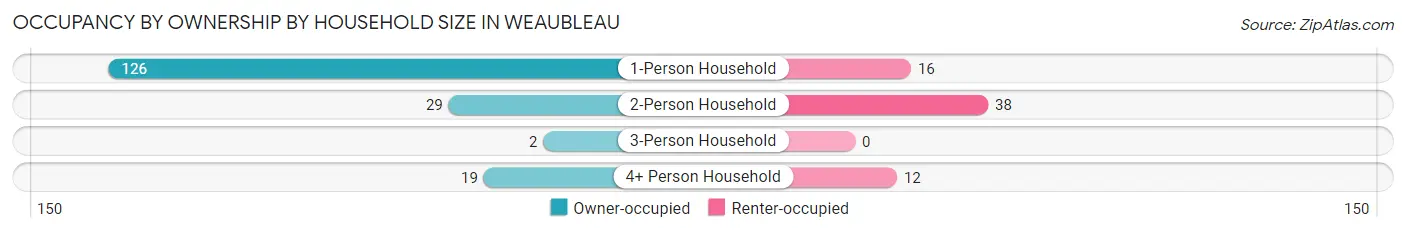
| Household Size | Owner-occupied | Renter-occupied |
| 1-Person Household | 126 (88.7%) | 16 (11.3%) |
| 2-Person Household | 29 (43.3%) | 38 (56.7%) |
| 3-Person Household | 2 (100.0%) | 0 (0.0%) |
| 4+ Person Household | 19 (61.3%) | 12 (38.7%) |
| Total Housing Units | 176 (72.7%) | 66 (27.3%) |
Occupancy by Educational Attainment in Weaubleau
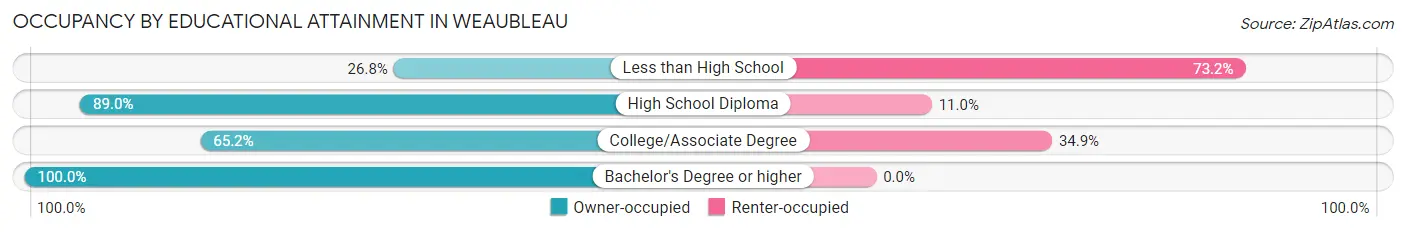
| Household Size | Owner-occupied | Renter-occupied |
| Less than High School | 11 (26.8%) | 30 (73.2%) |
| High School Diploma | 105 (89.0%) | 13 (11.0%) |
| College/Associate Degree | 43 (65.1%) | 23 (34.8%) |
| Bachelor's Degree or higher | 17 (100.0%) | 0 (0.0%) |
Occupancy by Age of Householder in Weaubleau
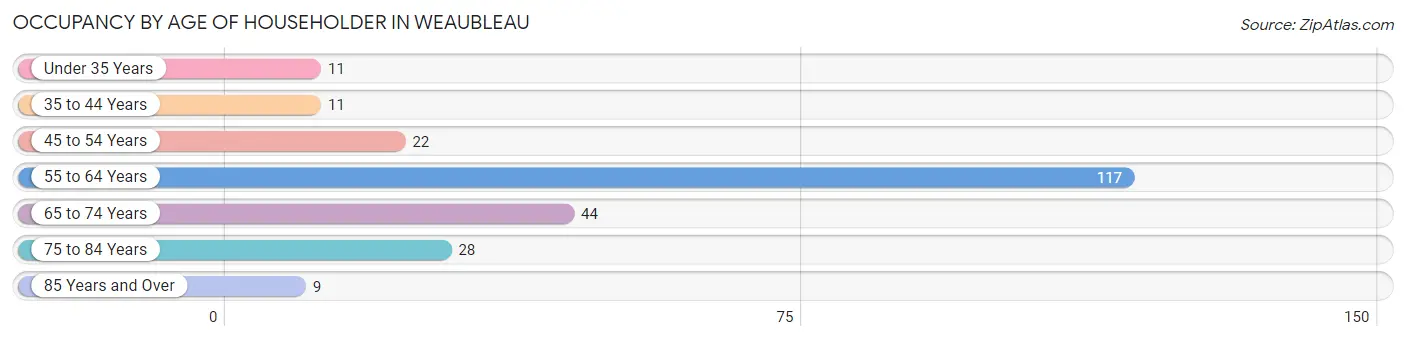
| Age Bracket | # Households | % Households |
| Under 35 Years | 11 | 4.5% |
| 35 to 44 Years | 11 | 4.5% |
| 45 to 54 Years | 22 | 9.1% |
| 55 to 64 Years | 117 | 48.3% |
| 65 to 74 Years | 44 | 18.2% |
| 75 to 84 Years | 28 | 11.6% |
| 85 Years and Over | 9 | 3.7% |
| Total | 242 | 100.0% |
Housing Finances in Weaubleau
Median Income by Occupancy in Weaubleau
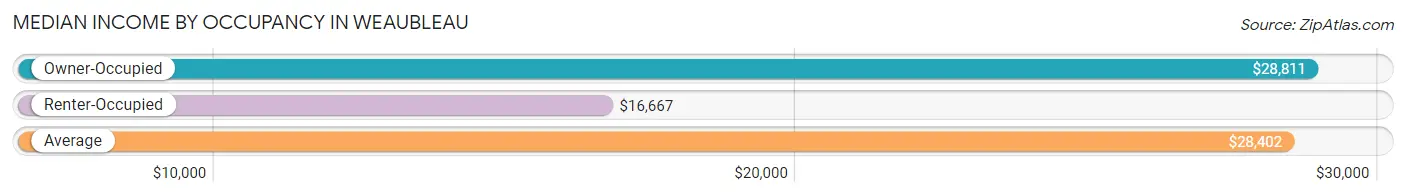
| Occupancy Type | # Households | Median Income |
| Owner-Occupied | 176 (72.7%) | $28,811 |
| Renter-Occupied | 66 (27.3%) | $16,667 |
| Average | 242 (100.0%) | $28,402 |
Occupancy by Householder Income Bracket in Weaubleau
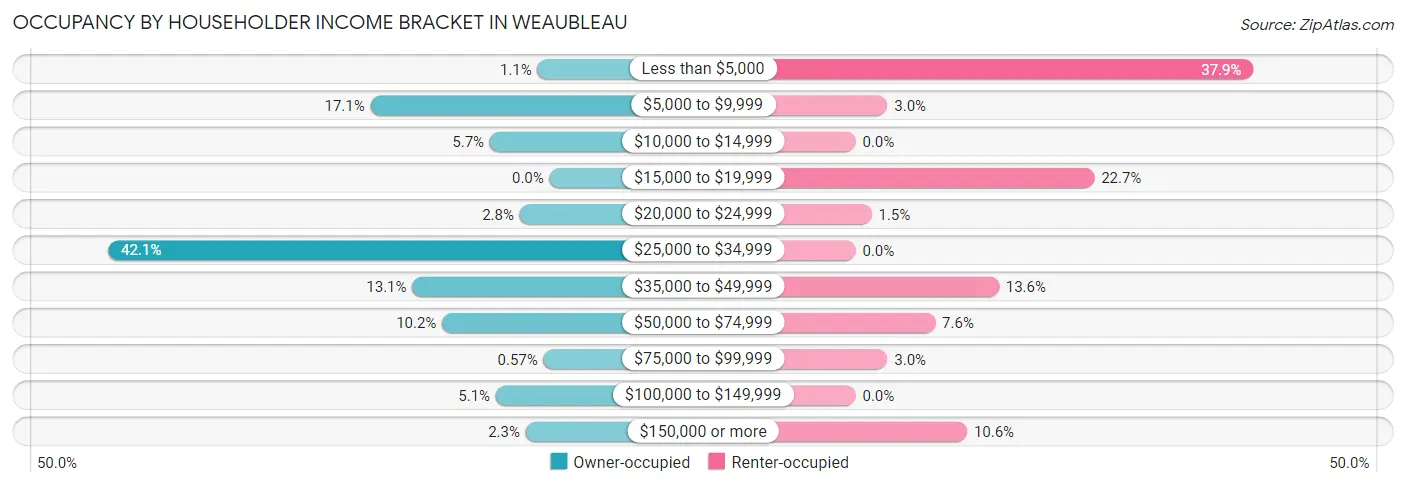
| Income Bracket | Owner-occupied | Renter-occupied |
| Less than $5,000 | 2 (1.1%) | 25 (37.9%) |
| $5,000 to $9,999 | 30 (17.1%) | 2 (3.0%) |
| $10,000 to $14,999 | 10 (5.7%) | 0 (0.0%) |
| $15,000 to $19,999 | 0 (0.0%) | 15 (22.7%) |
| $20,000 to $24,999 | 5 (2.8%) | 1 (1.5%) |
| $25,000 to $34,999 | 74 (42.0%) | 0 (0.0%) |
| $35,000 to $49,999 | 23 (13.1%) | 9 (13.6%) |
| $50,000 to $74,999 | 18 (10.2%) | 5 (7.6%) |
| $75,000 to $99,999 | 1 (0.6%) | 2 (3.0%) |
| $100,000 to $149,999 | 9 (5.1%) | 0 (0.0%) |
| $150,000 or more | 4 (2.3%) | 7 (10.6%) |
| Total | 176 (100.0%) | 66 (100.0%) |
Monthly Housing Cost Tiers in Weaubleau
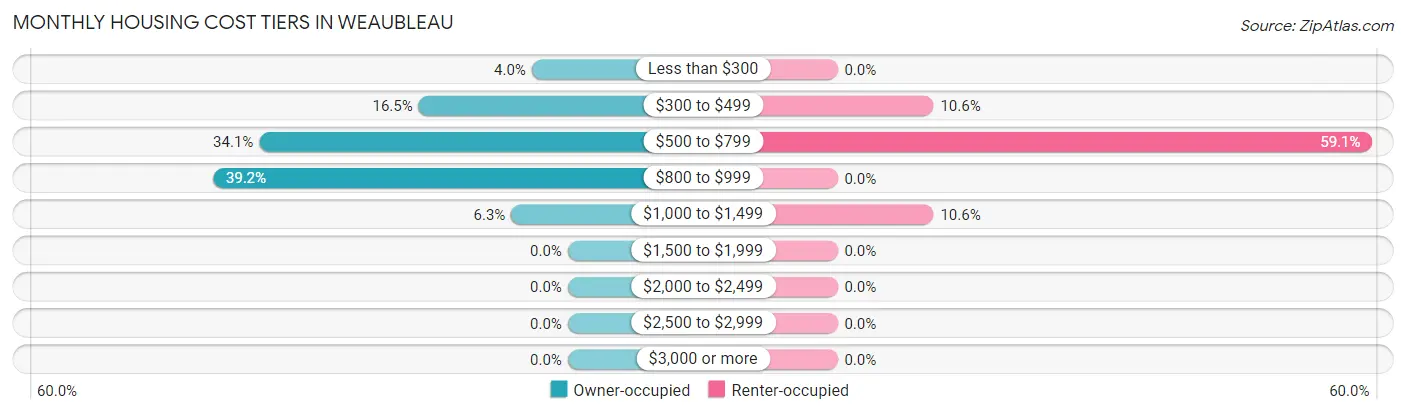
| Monthly Cost | Owner-occupied | Renter-occupied |
| Less than $300 | 7 (4.0%) | 0 (0.0%) |
| $300 to $499 | 29 (16.5%) | 7 (10.6%) |
| $500 to $799 | 60 (34.1%) | 39 (59.1%) |
| $800 to $999 | 69 (39.2%) | 0 (0.0%) |
| $1,000 to $1,499 | 11 (6.2%) | 7 (10.6%) |
| $1,500 to $1,999 | 0 (0.0%) | 0 (0.0%) |
| $2,000 to $2,499 | 0 (0.0%) | 0 (0.0%) |
| $2,500 to $2,999 | 0 (0.0%) | 0 (0.0%) |
| $3,000 or more | 0 (0.0%) | 0 (0.0%) |
| Total | 176 (100.0%) | 66 (100.0%) |
Physical Housing Characteristics in Weaubleau
Housing Structures in Weaubleau
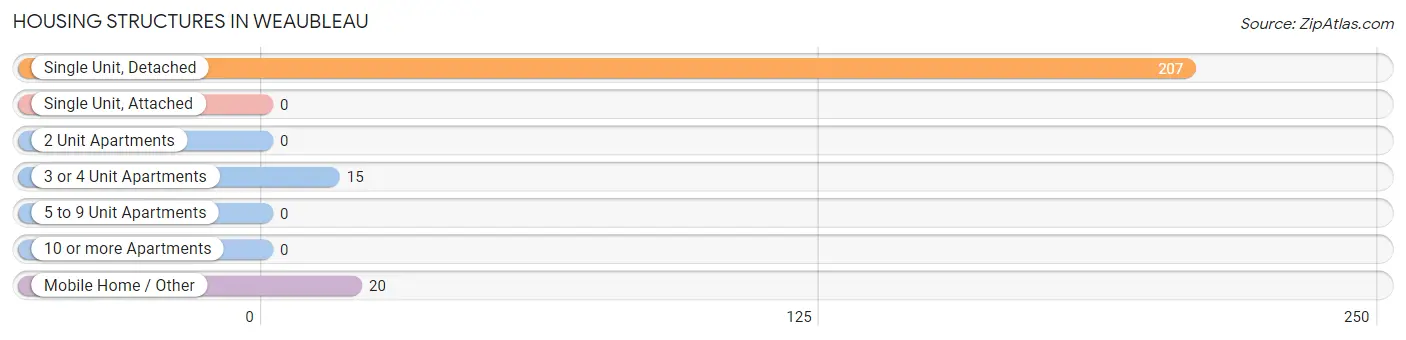
| Structure Type | # Housing Units | % Housing Units |
| Single Unit, Detached | 207 | 85.5% |
| Single Unit, Attached | 0 | 0.0% |
| 2 Unit Apartments | 0 | 0.0% |
| 3 or 4 Unit Apartments | 15 | 6.2% |
| 5 to 9 Unit Apartments | 0 | 0.0% |
| 10 or more Apartments | 0 | 0.0% |
| Mobile Home / Other | 20 | 8.3% |
| Total | 242 | 100.0% |
Housing Structures by Occupancy in Weaubleau
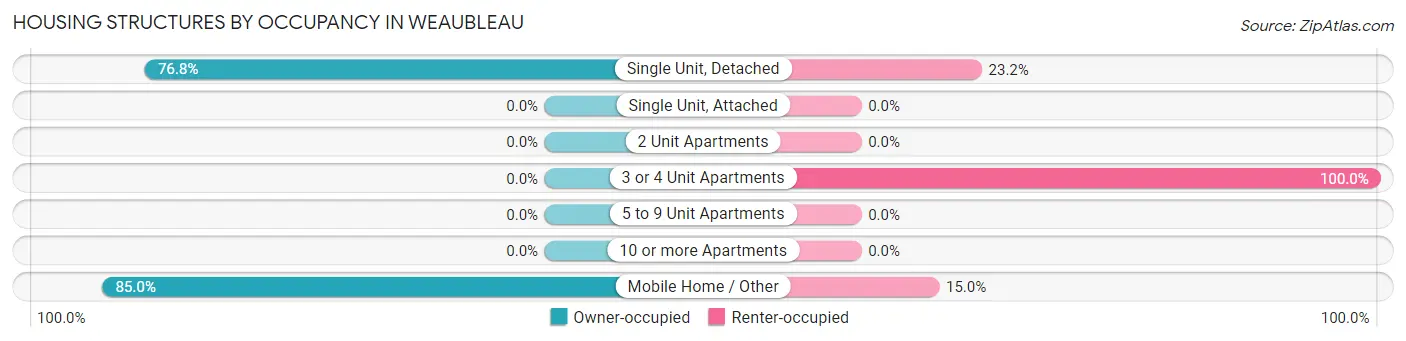
| Structure Type | Owner-occupied | Renter-occupied |
| Single Unit, Detached | 159 (76.8%) | 48 (23.2%) |
| Single Unit, Attached | 0 (0.0%) | 0 (0.0%) |
| 2 Unit Apartments | 0 (0.0%) | 0 (0.0%) |
| 3 or 4 Unit Apartments | 0 (0.0%) | 15 (100.0%) |
| 5 to 9 Unit Apartments | 0 (0.0%) | 0 (0.0%) |
| 10 or more Apartments | 0 (0.0%) | 0 (0.0%) |
| Mobile Home / Other | 17 (85.0%) | 3 (15.0%) |
| Total | 176 (72.7%) | 66 (27.3%) |
Housing Structures by Number of Rooms in Weaubleau
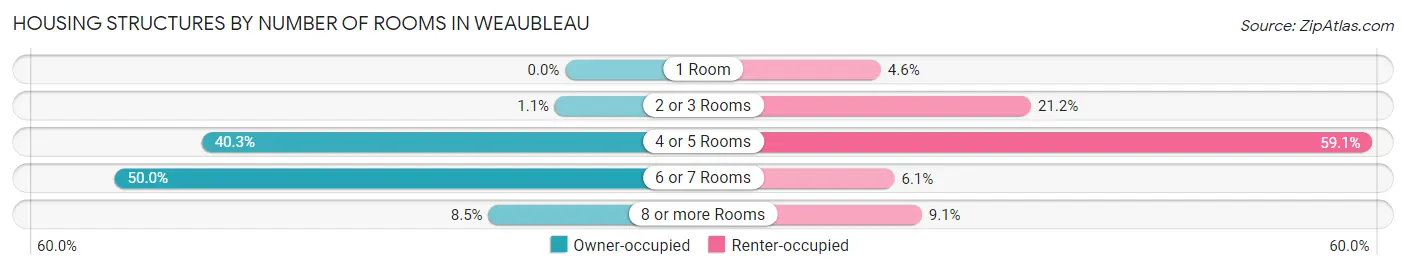
| Number of Rooms | Owner-occupied | Renter-occupied |
| 1 Room | 0 (0.0%) | 3 (4.5%) |
| 2 or 3 Rooms | 2 (1.1%) | 14 (21.2%) |
| 4 or 5 Rooms | 71 (40.3%) | 39 (59.1%) |
| 6 or 7 Rooms | 88 (50.0%) | 4 (6.1%) |
| 8 or more Rooms | 15 (8.5%) | 6 (9.1%) |
| Total | 176 (100.0%) | 66 (100.0%) |
Housing Structure by Heating Type in Weaubleau
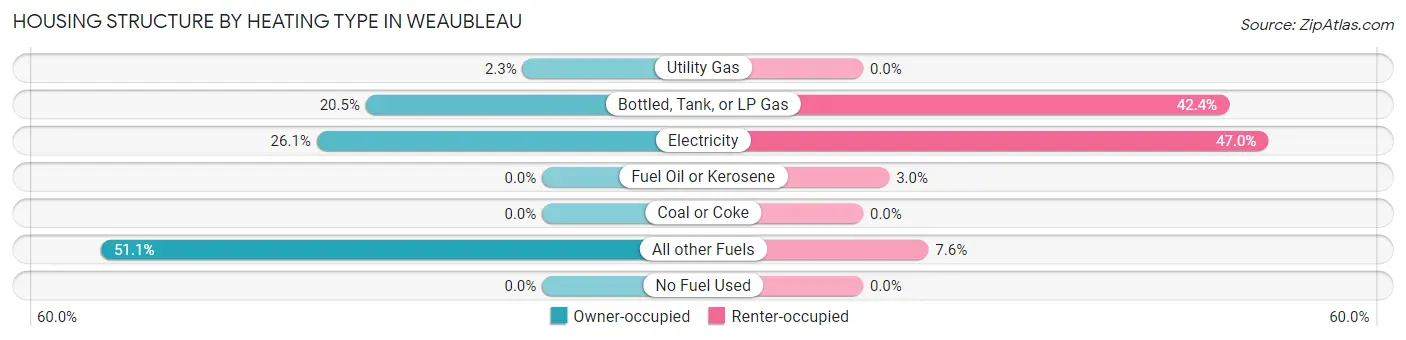
| Heating Type | Owner-occupied | Renter-occupied |
| Utility Gas | 4 (2.3%) | 0 (0.0%) |
| Bottled, Tank, or LP Gas | 36 (20.4%) | 28 (42.4%) |
| Electricity | 46 (26.1%) | 31 (47.0%) |
| Fuel Oil or Kerosene | 0 (0.0%) | 2 (3.0%) |
| Coal or Coke | 0 (0.0%) | 0 (0.0%) |
| All other Fuels | 90 (51.1%) | 5 (7.6%) |
| No Fuel Used | 0 (0.0%) | 0 (0.0%) |
| Total | 176 (100.0%) | 66 (100.0%) |
Household Vehicle Usage in Weaubleau
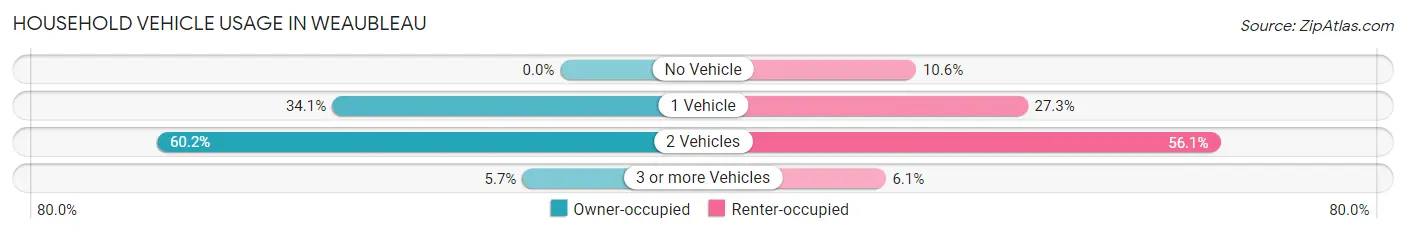
| Vehicles per Household | Owner-occupied | Renter-occupied |
| No Vehicle | 0 (0.0%) | 7 (10.6%) |
| 1 Vehicle | 60 (34.1%) | 18 (27.3%) |
| 2 Vehicles | 106 (60.2%) | 37 (56.1%) |
| 3 or more Vehicles | 10 (5.7%) | 4 (6.1%) |
| Total | 176 (100.0%) | 66 (100.0%) |
Real Estate & Mortgages in Weaubleau
Real Estate and Mortgage Overview in Weaubleau
| Characteristic | Without Mortgage | With Mortgage |
| Housing Units | 53 | 123 |
| Median Property Value | - | - |
| Median Household Income | $46,354 | $4 |
| Monthly Housing Costs | $462 | $0 |
| Real Estate Taxes | $379 | $0 |
Property Value by Mortgage Status in Weaubleau
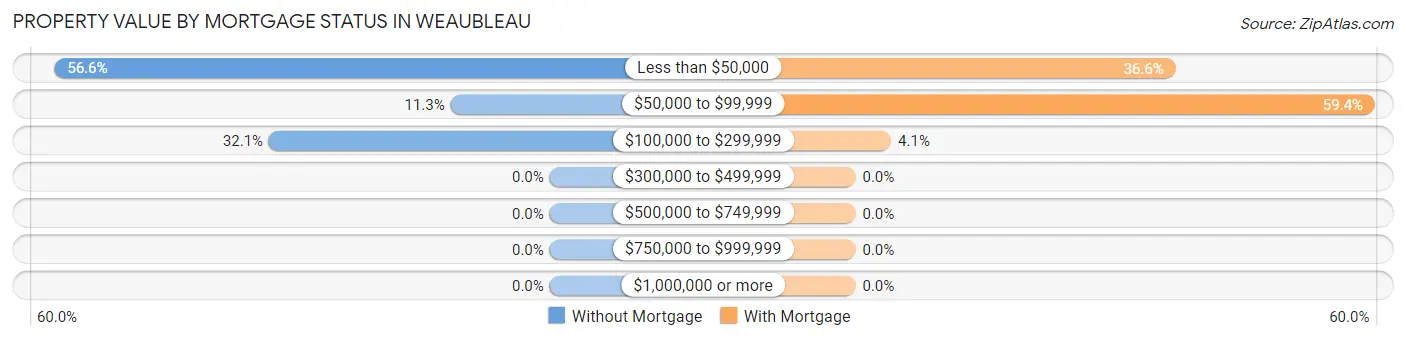
| Property Value | Without Mortgage | With Mortgage |
| Less than $50,000 | 30 (56.6%) | 45 (36.6%) |
| $50,000 to $99,999 | 6 (11.3%) | 73 (59.4%) |
| $100,000 to $299,999 | 17 (32.1%) | 5 (4.1%) |
| $300,000 to $499,999 | 0 (0.0%) | 0 (0.0%) |
| $500,000 to $749,999 | 0 (0.0%) | 0 (0.0%) |
| $750,000 to $999,999 | 0 (0.0%) | 0 (0.0%) |
| $1,000,000 or more | 0 (0.0%) | 0 (0.0%) |
| Total | 53 (100.0%) | 123 (100.0%) |
Household Income by Mortgage Status in Weaubleau
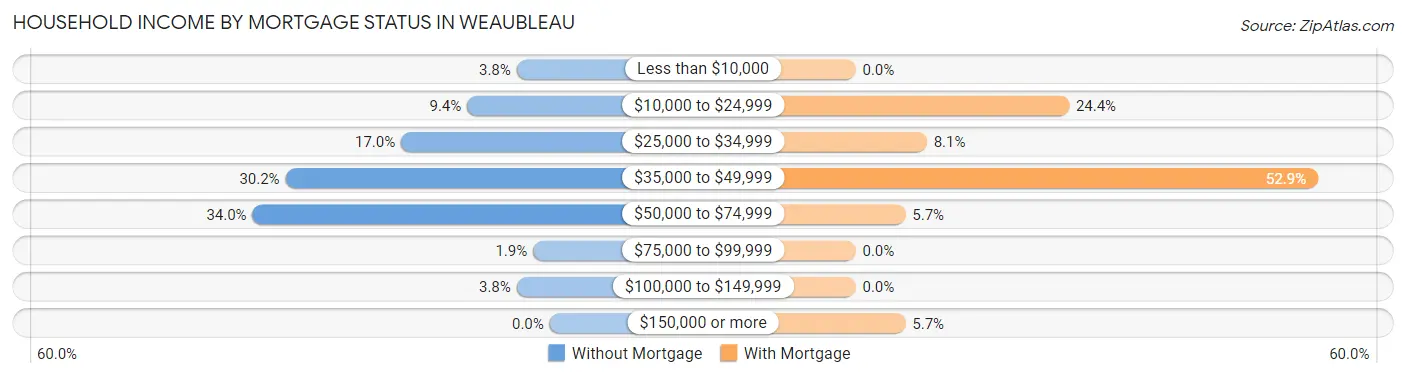
| Household Income | Without Mortgage | With Mortgage |
| Less than $10,000 | 2 (3.8%) | 0 (0.0%) |
| $10,000 to $24,999 | 5 (9.4%) | 30 (24.4%) |
| $25,000 to $34,999 | 9 (17.0%) | 10 (8.1%) |
| $35,000 to $49,999 | 16 (30.2%) | 65 (52.8%) |
| $50,000 to $74,999 | 18 (34.0%) | 7 (5.7%) |
| $75,000 to $99,999 | 1 (1.9%) | 0 (0.0%) |
| $100,000 to $149,999 | 2 (3.8%) | 0 (0.0%) |
| $150,000 or more | 0 (0.0%) | 7 (5.7%) |
| Total | 53 (100.0%) | 123 (100.0%) |
Property Value to Household Income Ratio in Weaubleau
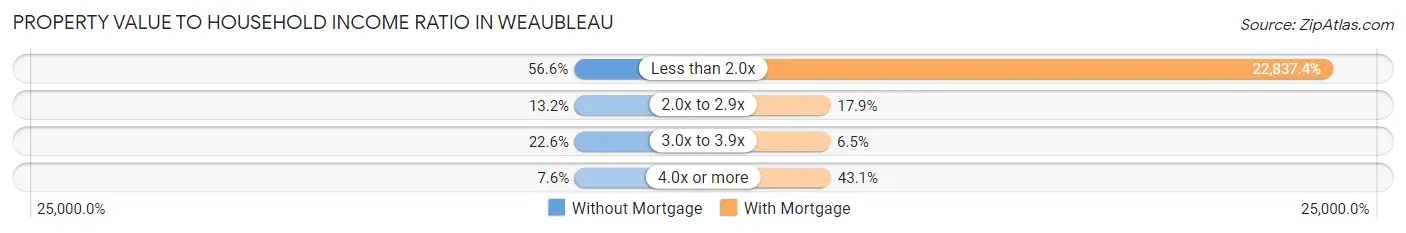
| Value-to-Income Ratio | Without Mortgage | With Mortgage |
| Less than 2.0x | 30 (56.6%) | 28,090 (22,837.4%) |
| 2.0x to 2.9x | 7 (13.2%) | 22 (17.9%) |
| 3.0x to 3.9x | 12 (22.6%) | 8 (6.5%) |
| 4.0x or more | 4 (7.5%) | 53 (43.1%) |
| Total | 53 (100.0%) | 123 (100.0%) |
Real Estate Taxes by Mortgage Status in Weaubleau
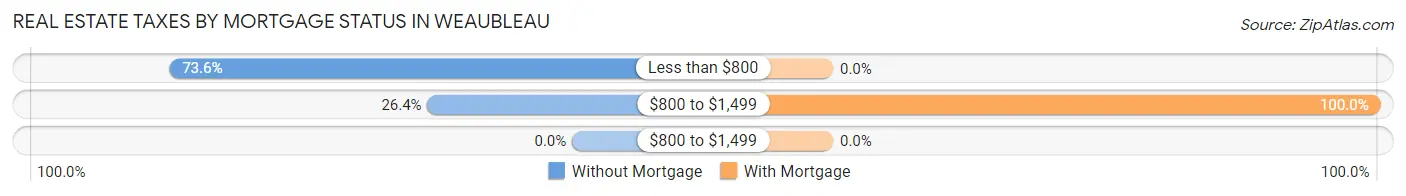
| Property Taxes | Without Mortgage | With Mortgage |
| Less than $800 | 39 (73.6%) | 0 (0.0%) |
| $800 to $1,499 | 14 (26.4%) | 123 (100.0%) |
| $800 to $1,499 | 0 (0.0%) | 0 (0.0%) |
| Total | 53 (100.0%) | 123 (100.0%) |
Health & Disability in Weaubleau
Health Insurance Coverage by Age in Weaubleau
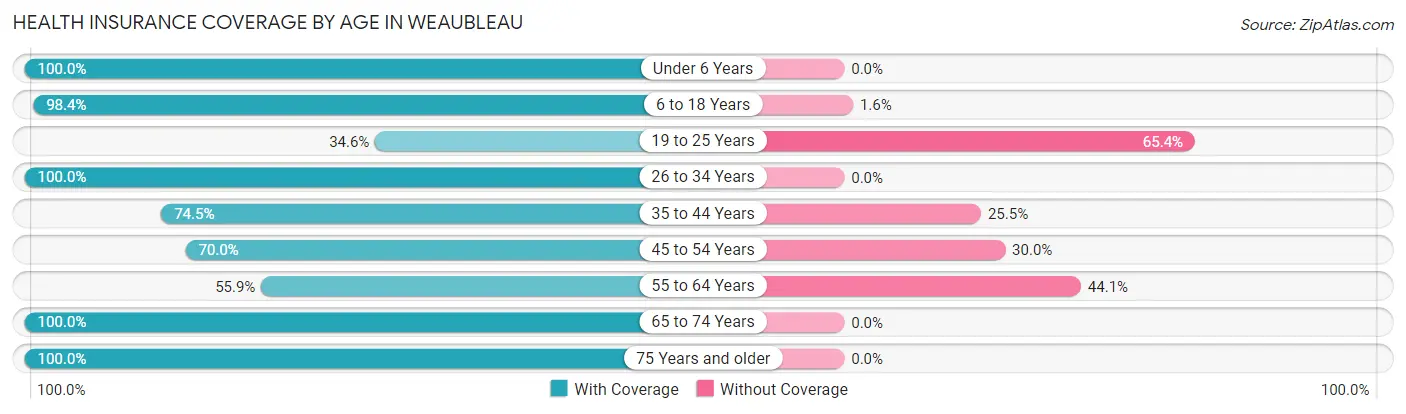
| Age Bracket | With Coverage | Without Coverage |
| Under 6 Years | 20 (100.0%) | 0 (0.0%) |
| 6 to 18 Years | 122 (98.4%) | 2 (1.6%) |
| 19 to 25 Years | 9 (34.6%) | 17 (65.4%) |
| 26 to 34 Years | 19 (100.0%) | 0 (0.0%) |
| 35 to 44 Years | 38 (74.5%) | 13 (25.5%) |
| 45 to 54 Years | 21 (70.0%) | 9 (30.0%) |
| 55 to 64 Years | 76 (55.9%) | 60 (44.1%) |
| 65 to 74 Years | 79 (100.0%) | 0 (0.0%) |
| 75 Years and older | 43 (100.0%) | 0 (0.0%) |
| Total | 427 (80.9%) | 101 (19.1%) |
Health Insurance Coverage by Citizenship Status in Weaubleau
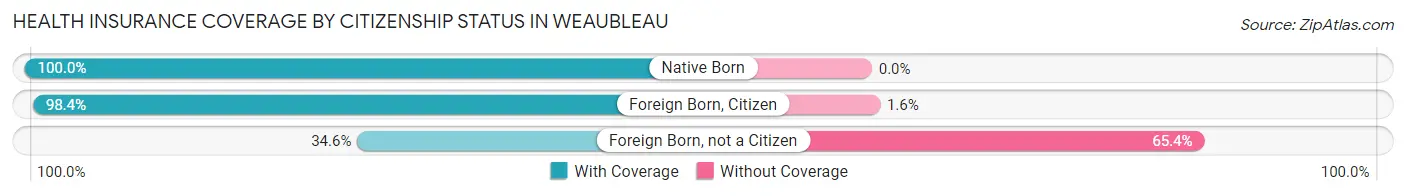
| Citizenship Status | With Coverage | Without Coverage |
| Native Born | 20 (100.0%) | 0 (0.0%) |
| Foreign Born, Citizen | 122 (98.4%) | 2 (1.6%) |
| Foreign Born, not a Citizen | 9 (34.6%) | 17 (65.4%) |
Health Insurance Coverage by Household Income in Weaubleau
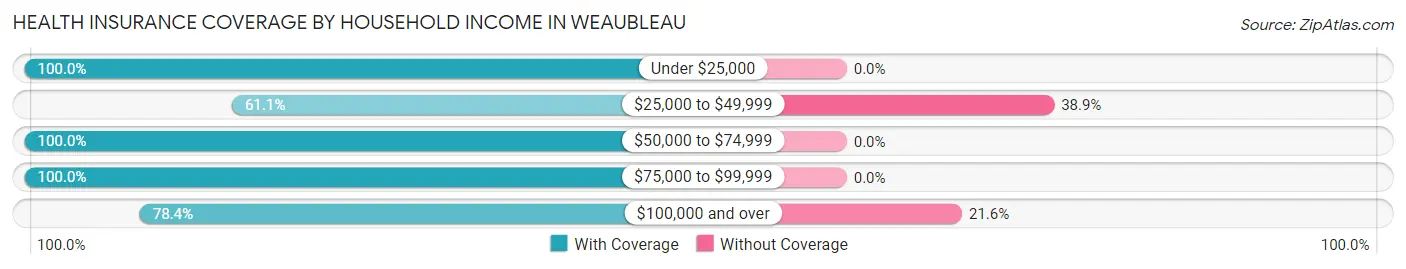
| Household Income | With Coverage | Without Coverage |
| Under $25,000 | 168 (100.0%) | 0 (0.0%) |
| $25,000 to $49,999 | 129 (61.1%) | 82 (38.9%) |
| $50,000 to $74,999 | 51 (100.0%) | 0 (0.0%) |
| $75,000 to $99,999 | 10 (100.0%) | 0 (0.0%) |
| $100,000 and over | 69 (78.4%) | 19 (21.6%) |
Public vs Private Health Insurance Coverage by Age in Weaubleau
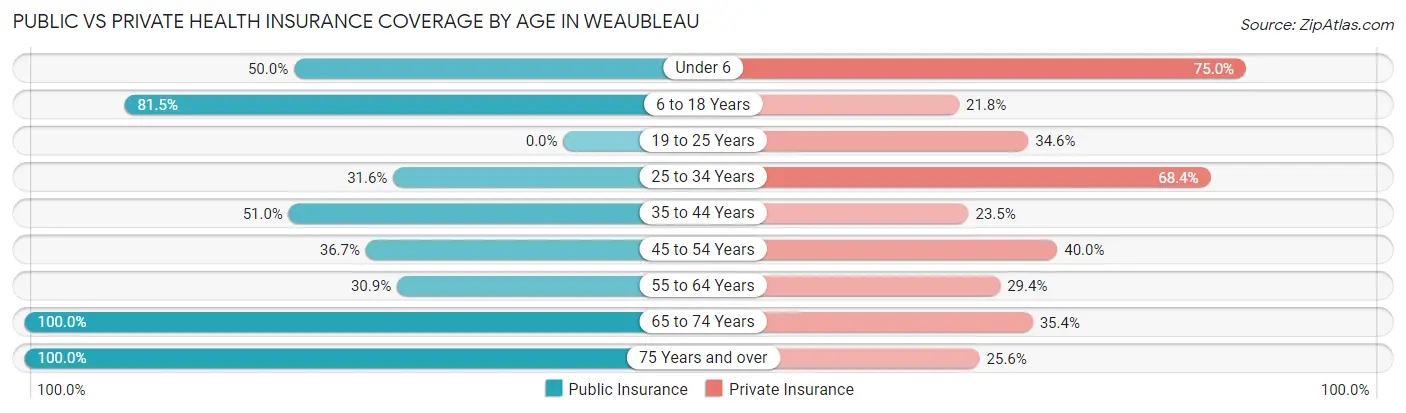
| Age Bracket | Public Insurance | Private Insurance |
| Under 6 | 10 (50.0%) | 15 (75.0%) |
| 6 to 18 Years | 101 (81.5%) | 27 (21.8%) |
| 19 to 25 Years | 0 (0.0%) | 9 (34.6%) |
| 25 to 34 Years | 6 (31.6%) | 13 (68.4%) |
| 35 to 44 Years | 26 (51.0%) | 12 (23.5%) |
| 45 to 54 Years | 11 (36.7%) | 12 (40.0%) |
| 55 to 64 Years | 42 (30.9%) | 40 (29.4%) |
| 65 to 74 Years | 79 (100.0%) | 28 (35.4%) |
| 75 Years and over | 43 (100.0%) | 11 (25.6%) |
| Total | 318 (60.2%) | 167 (31.6%) |
Disability Status by Sex by Age in Weaubleau
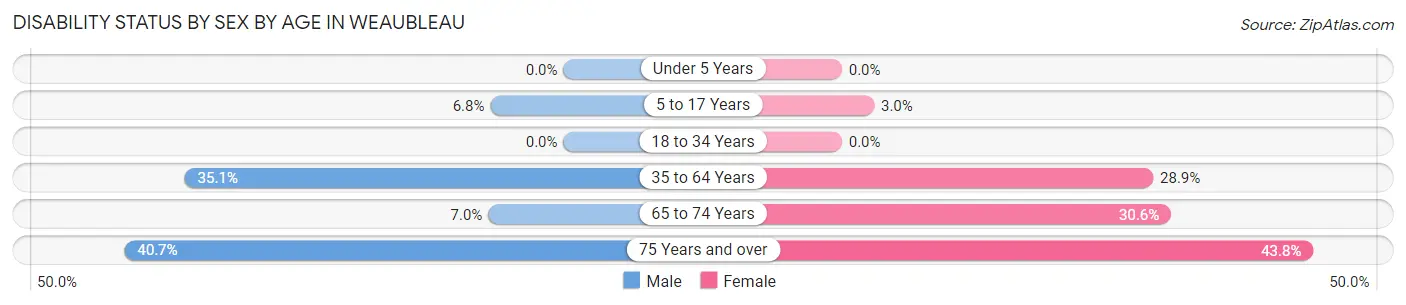
| Age Bracket | Male | Female |
| Under 5 Years | 0 (0.0%) | 0 (0.0%) |
| 5 to 17 Years | 4 (6.8%) | 2 (3.0%) |
| 18 to 34 Years | 0 (0.0%) | 0 (0.0%) |
| 35 to 64 Years | 13 (35.1%) | 52 (28.9%) |
| 65 to 74 Years | 3 (7.0%) | 11 (30.6%) |
| 75 Years and over | 11 (40.7%) | 7 (43.8%) |
Disability Class by Sex by Age in Weaubleau
Disability Class: Hearing Difficulty
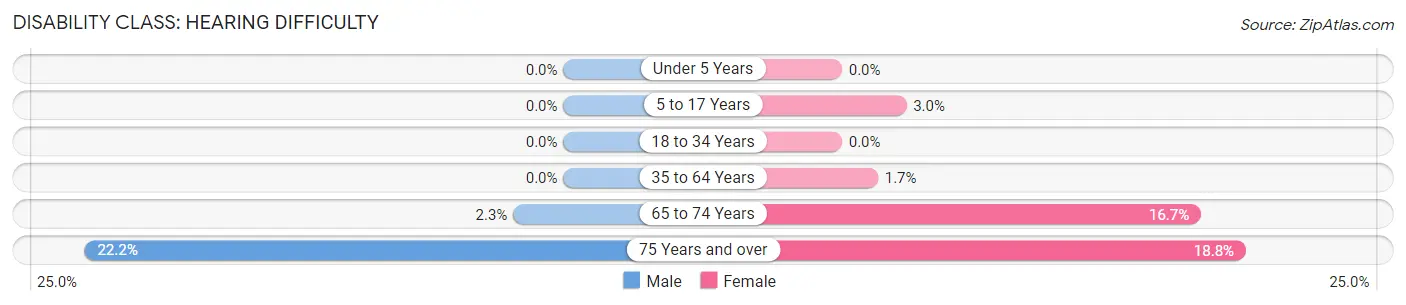
| Age Bracket | Male | Female |
| Under 5 Years | 0 (0.0%) | 0 (0.0%) |
| 5 to 17 Years | 0 (0.0%) | 2 (3.0%) |
| 18 to 34 Years | 0 (0.0%) | 0 (0.0%) |
| 35 to 64 Years | 0 (0.0%) | 3 (1.7%) |
| 65 to 74 Years | 1 (2.3%) | 6 (16.7%) |
| 75 Years and over | 6 (22.2%) | 3 (18.8%) |
Disability Class: Vision Difficulty
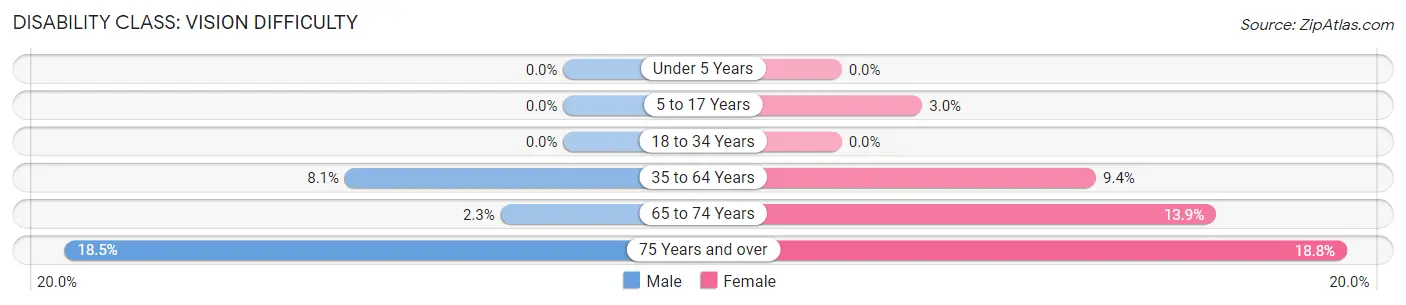
| Age Bracket | Male | Female |
| Under 5 Years | 0 (0.0%) | 0 (0.0%) |
| 5 to 17 Years | 0 (0.0%) | 2 (3.0%) |
| 18 to 34 Years | 0 (0.0%) | 0 (0.0%) |
| 35 to 64 Years | 3 (8.1%) | 17 (9.4%) |
| 65 to 74 Years | 1 (2.3%) | 5 (13.9%) |
| 75 Years and over | 5 (18.5%) | 3 (18.8%) |
Disability Class: Cognitive Difficulty
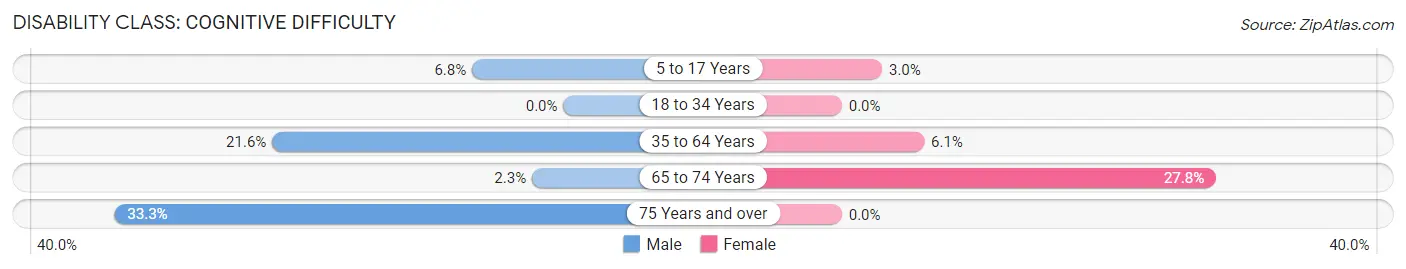
| Age Bracket | Male | Female |
| 5 to 17 Years | 4 (6.8%) | 2 (3.0%) |
| 18 to 34 Years | 0 (0.0%) | 0 (0.0%) |
| 35 to 64 Years | 8 (21.6%) | 11 (6.1%) |
| 65 to 74 Years | 1 (2.3%) | 10 (27.8%) |
| 75 Years and over | 9 (33.3%) | 0 (0.0%) |
Disability Class: Ambulatory Difficulty
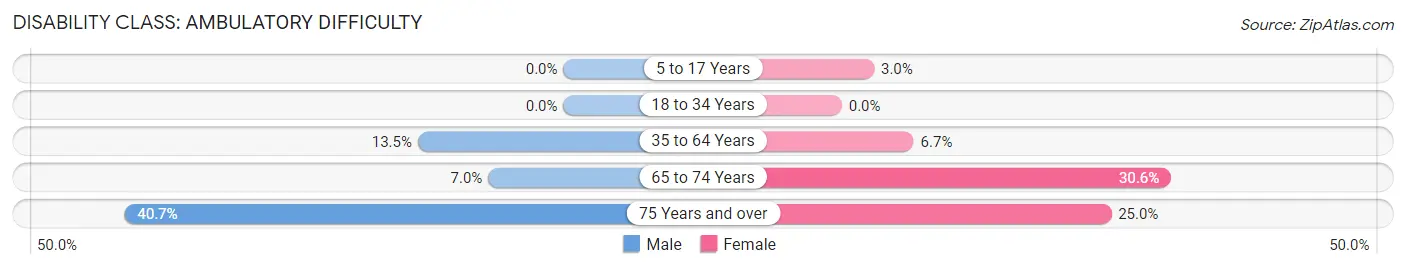
| Age Bracket | Male | Female |
| 5 to 17 Years | 0 (0.0%) | 2 (3.0%) |
| 18 to 34 Years | 0 (0.0%) | 0 (0.0%) |
| 35 to 64 Years | 5 (13.5%) | 12 (6.7%) |
| 65 to 74 Years | 3 (7.0%) | 11 (30.6%) |
| 75 Years and over | 11 (40.7%) | 4 (25.0%) |
Disability Class: Self-Care Difficulty
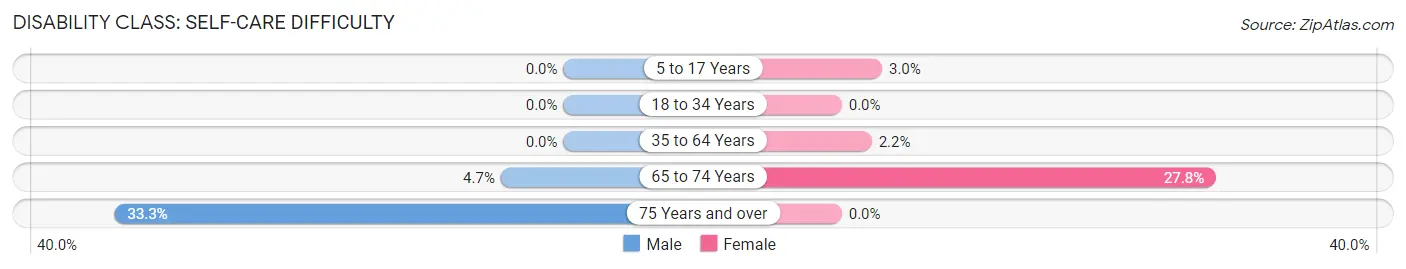
| Age Bracket | Male | Female |
| 5 to 17 Years | 0 (0.0%) | 2 (3.0%) |
| 18 to 34 Years | 0 (0.0%) | 0 (0.0%) |
| 35 to 64 Years | 0 (0.0%) | 4 (2.2%) |
| 65 to 74 Years | 2 (4.6%) | 10 (27.8%) |
| 75 Years and over | 9 (33.3%) | 0 (0.0%) |
Technology Access in Weaubleau
Computing Device Access in Weaubleau
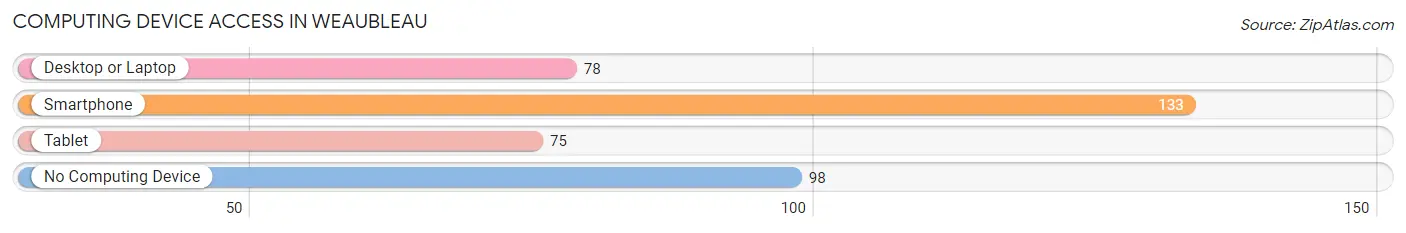
| Device Type | # Households | % Households |
| Desktop or Laptop | 78 | 32.2% |
| Smartphone | 133 | 55.0% |
| Tablet | 75 | 31.0% |
| No Computing Device | 98 | 40.5% |
| Total | 242 | 100.0% |
Internet Access in Weaubleau
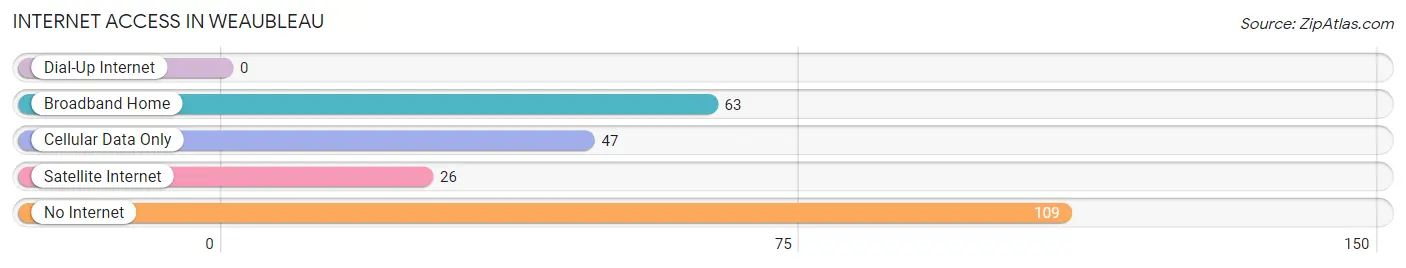
| Internet Type | # Households | % Households |
| Dial-Up Internet | 0 | 0.0% |
| Broadband Home | 63 | 26.0% |
| Cellular Data Only | 47 | 19.4% |
| Satellite Internet | 26 | 10.7% |
| No Internet | 109 | 45.0% |
| Total | 242 | 100.0% |
Weaubleau Summary
Weaubleau, Missouri is a small town located in Hickory County, Missouri. It is situated in the Ozark Plateau region of the state and is part of the Springfield Metropolitan Statistical Area. The town has a population of approximately 500 people and is located about 50 miles south of Springfield.
History
Weaubleau was founded in 1871 by a group of settlers from the nearby town of Stockton. The town was named after a nearby creek, which was named after a Native American chief. The town was originally a farming community, but it soon became a center for the timber industry. The town was incorporated in 1887 and the first post office was established in 1888.
In the early 1900s, Weaubleau was a thriving community with a population of over 1,000 people. The town had several stores, a bank, a hotel, a school, and a newspaper. The town was also home to a number of churches, including the First Baptist Church, which was founded in 1891.
In the 1920s, the timber industry began to decline and the population of Weaubleau began to decline as well. The Great Depression further exacerbated the decline and by the 1940s, the population had dropped to just over 500 people.
Geography
Weaubleau is located in the Ozark Plateau region of Missouri. The town is situated in the foothills of the Ozark Mountains and is surrounded by rolling hills and forests. The town is located about 50 miles south of Springfield and is situated along Highway 54.
The climate in Weaubleau is humid subtropical, with hot, humid summers and mild winters. The average annual temperature is around 60 degrees Fahrenheit and the average annual precipitation is around 40 inches.
Economy
The economy of Weaubleau is largely based on agriculture and tourism. The town is home to several farms, which produce a variety of crops, including corn, soybeans, wheat, and hay. The town is also home to several tourist attractions, including the Weaubleau Wildlife Refuge, which is a popular destination for birdwatchers.
The town is also home to several small businesses, including a grocery store, a hardware store, and a few restaurants. The town is also home to a number of churches, which provide a variety of services to the community.
Demographics
As of the 2010 census, the population of Weaubleau was 498 people. The racial makeup of the town was 97.2% White, 0.2% African American, 0.2% Native American, 0.2% Asian, 0.2% from other races, and 1.8% from two or more races. Hispanic or Latino of any race were 0.8% of the population.
The median household income in Weaubleau was $35,625 and the median family income was $41,250. The per capita income was $17,945. About 16.2% of the population was below the poverty line.
Conclusion
Weaubleau, Missouri is a small town located in Hickory County, Missouri. It is situated in the Ozark Plateau region of the state and is part of the Springfield Metropolitan Statistical Area. The town has a population of approximately 500 people and is located about 50 miles south of Springfield. The economy of Weaubleau is largely based on agriculture and tourism. The town is home to several farms, which produce a variety of crops, and is also home to several tourist attractions. The racial makeup of the town is 97.2% White, 0.2% African American, 0.2% Native American, 0.2% Asian, 0.2% from other races, and 1.8% from two or more races. The median household income in Weaubleau was $35,625 and the median family income was $41,250. The per capita income was $17,945. About 16.2% of the population was below the poverty line.
Common Questions
What is Per Capita Income in Weaubleau?
Per Capita income in Weaubleau is $20,011.
What is the Median Family Income in Weaubleau?
Median Family Income in Weaubleau is $44,375.
What is the Median Household income in Weaubleau?
Median Household Income in Weaubleau is $28,402.
What is Inequality or Gini Index in Weaubleau?
Inequality or Gini Index in Weaubleau is 0.53.
What is the Total Population of Weaubleau?
Total Population of Weaubleau is 528.
What is the Total Male Population of Weaubleau?
Total Male Population of Weaubleau is 193.
What is the Total Female Population of Weaubleau?
Total Female Population of Weaubleau is 335.
What is the Ratio of Males per 100 Females in Weaubleau?
There are 57.61 Males per 100 Females in Weaubleau.
What is the Ratio of Females per 100 Males in Weaubleau?
There are 173.58 Females per 100 Males in Weaubleau.
What is the Median Population Age in Weaubleau?
Median Population Age in Weaubleau is 50.5 Years.
What is the Average Family Size in Weaubleau
Average Family Size in Weaubleau is 4.0 People.
What is the Average Household Size in Weaubleau
Average Household Size in Weaubleau is 2.2 People.
How Large is the Labor Force in Weaubleau?
There are 197 People in the Labor Forcein in Weaubleau.
What is the Percentage of People in the Labor Force in Weaubleau?
50.0% of People are in the Labor Force in Weaubleau.
What is the Unemployment Rate in Weaubleau?
Unemployment Rate in Weaubleau is 1.0%.